NexGen Energy Ltd. › _resources › ... · with next generation reactor buildouts in sensitive...
33
NexGen Energy Ltd. Corporate Presentation May 2020 PROUD PARTNER
Transcript of NexGen Energy Ltd. › _resources › ... · with next generation reactor buildouts in sensitive...

NexGen Energy Ltd.Corporate PresentationMay 2020
PROUD PARTNERPROUD PARTNER

Forward Looking Statements
2
Information Contained in this Presentation
This presentation is a summary description of NexGen Energy Ltd. (“NexGen” or the “Company”) and its business and does not purport to be complete. This presentation is not, and in nocircumstances is to be construed as a prospectus, advertisement or a public offering of securities. No securities regulatory authority or similar authority has reviewed or in any way passed upon thedocument or the merits of the Company’s securities and any representation to the contrary is an offence.
Except where otherwise indicated, the information contained in this presentation has been prepared by NexGen and there is no representation or warranty by NexGen or any other person as tothe accuracy or completeness of the information set forth herein. This presentation includes information on adjacent properties that was obtained from various publicly available sources referredto herein and the accuracy and completeness of such information has not been verified by NexGen. Except as otherwise stated, information included in this presentation is given as of the datehereof. The delivery of this presentation shall not imply that the information herein is correct as of any date after the date hereof.
Forward-Looking Information
The information contained herein contains “forward-looking statements” within the meaning of the United States Private Securities Litigation Reform Act of 1995 and “forward-lookinginformation” within the meaning of applicable Canadian securities legislation. “Forward-looking information” includes, but is not limited to, statements with respect to the activities, events ordevelopments that the Company expects or anticipates will or may occur in the future, including, without limitation, the completion of the technical report in support of the PEA. Generally, but notalways, forward-looking information and statements can be identified by the use of words such as “plans”, “expects”, “is expected”, “budget”, “scheduled”, “estimates”, “forecasts”, “intends”,“anticipates”, or “believes” or the negative connotation thereof or variations of such words and phrases or state that certain actions, events or results “may”, “could”, “would”, “might” or “will betaken”, “occur” or “be achieved” or the negative connotation thereof.
Forward-looking information and statements are based on the then current expectations, beliefs, assumptions, estimates and forecasts about NexGen’s business and the industry and markets inwhich it operates. Forward-looking information and statements are made based upon numerous assumptions, including among others, the results of planned exploration activities are asanticipated, the price of uranium, the cost of planned exploration activities, that financing will be available if and when needed and on reasonable terms, that third party contractors, equipment,supplies and governmental and other approvals required to conduct NexGen’s planned exploration activities will be available on reasonable terms and in a timely manner and that general businessand economic conditions will not change in a material adverse manner. Although the assumptions made by the Company in providing forward-looking information or making forward-lookingstatements are considered reasonable by management at the time, there can be no assurance that such assumptions will prove to be accurate.
Forward-looking information and statements also involve known and unknown risks and uncertainties and other factors, which may cause actual results, performances and achievements ofNexGen to differ materially from any projections of results, performances and achievements of NexGen expressed or implied by such forward-looking information or statements, including, amongothers, negative operating cash flow and dependence on third party financing, uncertainty of the availability of additional financing, the risk that pending assay results will not confirm previouslyannounced preliminary results, imprecision of mineral resource estimates, the appeal of alternate sources of energy and sustained low uranium prices, aboriginal title and consultation issues,exploration risks, reliance upon key management and other personnel, deficiencies in the Company’s title to its properties, uninsurable risks, failure to manage conflicts of interest, failure to obtainor maintain required permits and licenses, changes in laws, regulations and policy, competition for resources and financing, or other approvals, and other factors discussed or referred to in theCompany’s Annual Information Form dated March 11, 2020 under “Risk Factors”.
Although the Company has attempted to identify important factors that could cause actual results to differ materially from those contained in the forward-looking information or implied byforward-looking information, there may be other factors that cause results not to be as anticipated, estimated or intended.
There can be no assurance that forward-looking information and statements will prove to be accurate, as actual results and future events could differ materially from those anticipated, estimatedor intended. Accordingly, readers should not place undue reliance on forward-looking statements or information. The Company undertakes no obligation to update or reissue forward-lookinginformation as a result of new information or events except as required by applicable securities laws.
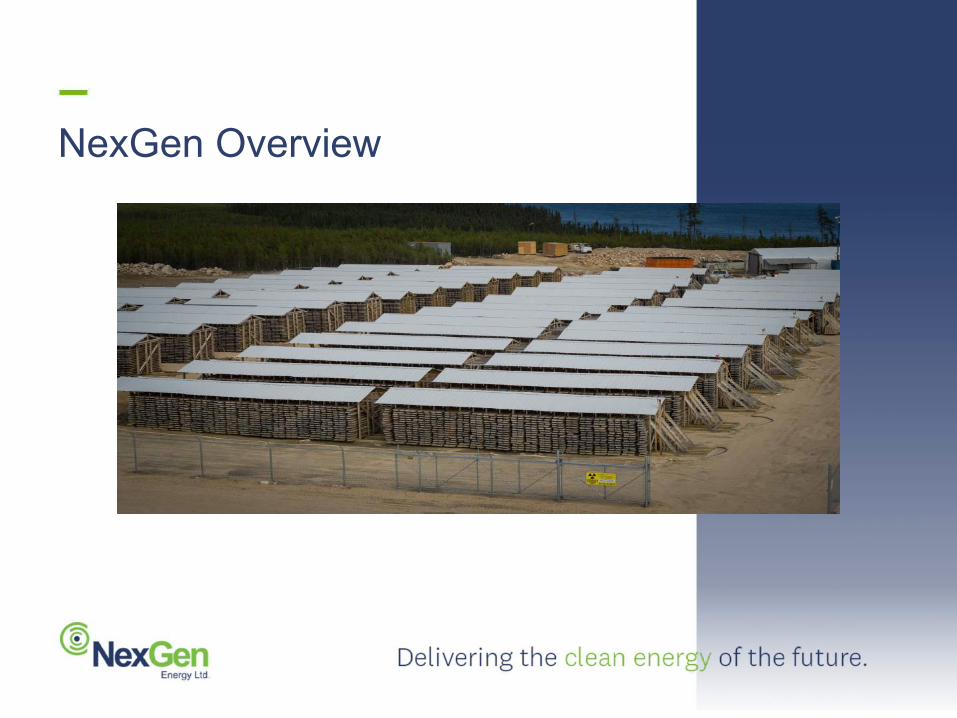
NexGen Overview

Arrow: A Disruptive Mineral Asset
4
25.4
15.3
13.7
7.8
5.2
5.2
4.7
4.7
4.4
4.3
4.3
– 10.0 20.0 30.0
Arrow
Cigar Lake
McArthur River
Tortkuduk & Myunkum
Olympic Dam
Budenovskoye 2
Inkai
SOMAIR
South Inkai
Ranger
Budenovskoye 1, 3 & 4
Production (mmlbs U3O8)
-
$10
$20
$30
$40
$50
- 20 40 60 80 100 120 140
Cash
Cos
t (U
S$/l
b)
2020 U3O8 Production (mmlbs)
Long LifeLow Cost(1) Large (2,3)
Arrow at the bottom of industry cost curve
Arrow will be the World's largest mine with low technical risk
Permit application for 24-year operating life
Shaft #1 (Production,
Access)
Surface
Overburden
Bedrock
Shaft #2 (Exhaust Air)
Inferred Resources
Inferred Resources
Inferred Resources
Inferred ResourcesInferred
Resources
Inferred Resources
PFS Mine Plan
Source: SNL, World Nuclear Association and company disclosure(1) Represents 2020 uranium cost curve, adjusted for the inclusion of Arrow. Arrow data based on LOM average annual production of 25.4mmlbs
and operating costs of C$5.81/lb converted to USD at 0.75 FX rate, as disclosed in November 2018 PFS(2) Represents Arrow LOM average production as disclosed in November 2018 PFS(3) Production shown on a 100% basis

Summary
5
Arrow Deposit• Rook I is located in northwest Saskatchewan, approximately 155 km
north of the town of La Loche, and 640 km northwest of Saskatoon.
• Rook I is the 100%-NexGen owned flagship property which currently hosts 5 uranium discoveries over a 10 km strike length.
• Arrow is a 100% land-based, basement-hosted and high-grade uranium deposit located within the Rook I Project discovered in February 2014.
• Arrow is the largest to be developed high grade uranium deposit in the World where NexGen is permitting a dedicated mine and mill complex.
NexGen Energy Ltd.• Corporate office in Vancouver with primary operations head office in
Saskatoon.
• Founded in 2011 with objective of discovering and developing the World’s next generation uranium mine to fuel global clean energy initiatives.
• Secured global financing from pre-eminent investor base while maintaining complete operational and supply autonomy.
• Community focused programs to effect generational positive change.
• Focused on becoming the long-term and dependable partner to global utilities.

NexGen History
6
• NexGen Energy Ltd, founded by acquiring dominant land package in the Southwestern Athabasca Basin, Saskatchewan.
• February 14, 2014 discovery of Arrow Deposit, on Rook I Property with first drill hole.
• NexGen expanded drill campaign and published largest Maiden Mineral Resource Estimate in the Basin’s history with the Arrow Deposit.
• NexGen closed US$60M strategic investment by CEF Holdings (Li Ka-Shing), includes voting rights.
• NexGen announced filing of 3rd updated Mineral Resource Estimate, the Pre-Feasibility Study on the Arrow Deposit, Rook I Project.
2011 2014 2016 2017 2018
• NexGen announced filing of 2nd updated Mineral Resource Estimate, The Pre-Economic Assessment on the Arrow Deposit, Rook I Project.
• NexGen announced additional US$110M financing with CEF Holdings (Li Ka-Shing), includes voting rights.

2019 Milestones
7
JAN. 2019
• Commenced Feasibility Stage Drilling Program and Technical Studies at Arrow.
MAR. 2019
• Appointed former Premier of Saskatchewan, Brad Wall, to Board of Directors.
APR. 2019
• Commenced Environmental Assessment for Rook 1 Project, home of Arrow by successful acceptance of Project Description.
AUG. 2019
• Completed Feasibility Stage Drilling.
DEC. 2019
• Signed Four Study Agreements with all Local Communities.

Capital Structure
8
5% 360M
397M
C$40M
Insider Ownership
36M
48M
Options
CEF Conversion
• CEF Holdings (Li Ka-Shing
• Mega Uranium• Kopernik Global• Segra Capital
Management LLC• CQS Management Ltd.
Shareholders
Shares Issued
Fully Diluted
Cash
Cash & Share Structure as at May 1, 2020
Institutional: 74%
Retail: 26%
2016 Conversion Price: US $2.332017 Conversion Price: US $2.69

Sustainability
Winner of PDAC 2018 Bill Dennis Award For a Canadian Discovery
Winner of PDAC 2019 Environmental & Social Responsibility Award

Responsible Tailings Management
10
• All processed waste streams to be stored in an Underground Tailings Management Facility (“UGTMF”). The UGTMF will significantly reduce the surface footprint of the Rook I project and represents continued and ongoing reclamation during operations, allowing for industry leading environmental sensitivity;
• PFS test work confirmed paste fill strength meet or exceed all requirements set in the original design for a potential Paste-Backfill to be used for underground stope stability;
• Ultimately will create a mine with ZERO risk of surface tailings failures, entirely mitigating one of the largest risks in existing and development-stage mining projects;
• Will set new standard globally in environmental mine management.
BEST-IN-CLASS

Arrow Social Benefits
11
• Education• Summer student program which has seen 29 students attend
since inception in 2016;
• Students provided opportunity to learn a variety of mining related and non-mining related vocations;
• NexGen provides bursary opportunities for post-secondary students that show exemplary efforts for education and community – 6 have been provided bursaries into Geology, Human Resources and Environmental Sciences programs.
• Heath & Wellness• Breakfast Club program employs 8 local staff to feed 1,150
students in all 3 schools in La Loche and CRDN breakfast every school day;
• All food and supplies sourced locally;• Youth sports is a focus as well with sponsorship of local girls’
volleyball teams including trips to National Championships as well as initiation of a local youth hockey team to play in tournaments in the southern part of Saskatchewan for the first time;
• 7 full time local jobs created to facilitate athletic infrastructure utilization and programing.
From Left to Right: Premier Scott Moe, Mayor Robert St. Pierre, MP Georgina Jolibois, NexGen CEO Leigh Curyer

Arrow Economic Benefits
12
• Economic Capacity Building• Driller Training Program was initiated in 2018 to facilitate
on job and technical training for drillers in the mining industry with 8 completing the program;
• Supply chain management is key to developing local businesses to support the Project in this stage and also in preparation for future development;
• Working with Provincial government to expand training programs in the North for the project;
• Current camp capacity is 120 persons with 10 drill rigs (the largest drill program in Saskatchewan);
• On job training occurring as well as summer student and post-secondary student work a priority for Residents of Saskatchewan’s North;
• Life of mine average new jobs created would be 1,700 in Canada with 4,400 at peak during development;
• Expected to contribute C$10 billion to Canada’s GDP (92% to Saskatchewan) and support C$18.9 billion in total economic output;
• Expected to contribute C$1.4 billion in total labour income to the Canadian economy.
From Left to Right: NexGen CEO Leigh Curyer, Prime Minister Justin Trudeau

Uranium Market Overview
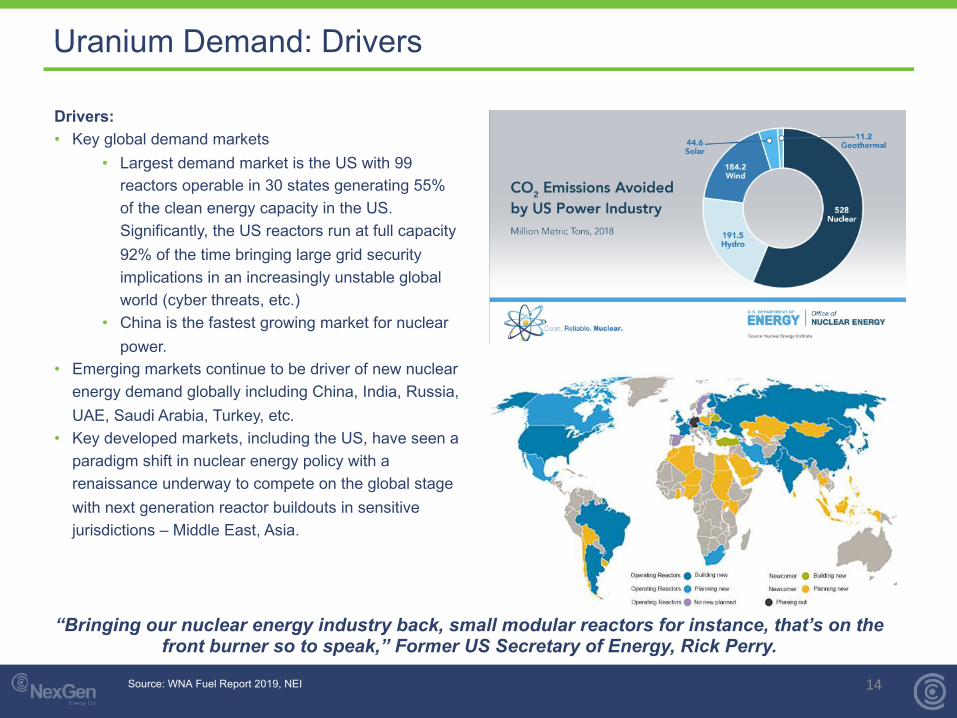
Uranium Demand: Drivers
14
Drivers:• Key global demand markets
• Largest demand market is the US with 99 reactors operable in 30 states generating 55% of the clean energy capacity in the US. Significantly, the US reactors run at full capacity 92% of the time bringing large grid security implications in an increasingly unstable global world (cyber threats, etc.)
• China is the fastest growing market for nuclear power.
• Emerging markets continue to be driver of new nuclear energy demand globally including China, India, Russia, UAE, Saudi Arabia, Turkey, etc.
• Key developed markets, including the US, have seen a paradigm shift in nuclear energy policy with a renaissance underway to compete on the global stage with next generation reactor buildouts in sensitive jurisdictions – Middle East, Asia.
“Bringing our nuclear energy industry back, small modular reactors for instance, that’s on the front burner so to speak,” Former US Secretary of Energy, Rick Perry.
Source: WNA Fuel Report 2019, NEI

Uranium Demand: Stats
15
Nuclear Energy: 2016-2020:
• 47 new reactors brought online globally (15% increase in reactor generation);
• Based on 20 different reactor designs (9 of the 20 designs are being built for the first time;
• Built in 11 countries;
• 2 are newcomer countries (UAE and Belarus);
• 5 reactors are reaching 50 years of age for the first time (Switzerland, India and USA);
• 10 GW/year added in each of 2018 and 2019;
• Global nuclear demand now exceeds 5-year average peak pre-Fukishima levels – the industry is now out of the demand hole created by the accident in March 2011;
• World Nuclear Association demand now positive in all scenarios.
Source: WNA Fuel Report 2019, WNA 2019

Uranium Demand: Long-Term Contracting Market
16
• 90% of global uranium demand is contracted under long-term negotiated offtake arrangements between miner and nuclear utility.
• 10% of the market is transacted on the spot market which has, since 2011, become a carry market dominated by traders and financial interests.
• No major contracting cycle has occurred since Fukishima but given the amount of supply that has come offline, the market is significantly tighter than it has been in recent years thus setting up the opportunity for utilities to re-enter the long-term contracting market.
• The average unadjusted contracted value last cycle was US$60-US$70/lb U3O8 in a time when mines were younger and lower cost.
Source: TD Securities

Primary Supply Impacts
• Significant mine shutdowns as a result of low prices has resulted in over 30% of global annual mined supply being removed from the market since 2016.
• Significantly, a majority of the shutdowns have come from commercial companies in Western countries resulting in even furtherjurisdictional concentration.
• There are more shutdowns expected from depleted mines over the next 3-7 years.
• NexGen is uniquely positioned at a time when a significant new source of primary production in the Western world is required to maintain energy security in some of the most influential economies in the world.
Focusing on Primary Supply
17Source: TradeTech

Supply-Demand: Cycle Resolution
18
• 2018 Demand was ~195Mlbs U3O8 and Primary Supply was just ~135Mlbs U3O8 – the market is in a significant primary deficit which creates large inventory reductions and reliance on short-term secondary sources. This is an unstable market.
• Typical year exhibits over contracting, yet current contracting levels remain near half of normal (~100Mlbs per annum).
• The amount of uncommitted uranium requirements is at record highs along with record high uranium demand.
• We are coming out of the bottom in uranium being led by spot bottoming in 2016, conversion and SWU in 2019 with term pricing to follow.
Source: TD Securities

Arrow Project

Arrow Project Overview
20Source: Company filingsNote: Free cash flow (FCF) is calculated by subtracting capital expenditures from operating cash flow (OCF).Based on US$50/lb U3O8.
Overview Pre-Feasibility Study(1) (November 2018)• Largest to be developed high grade uranium deposit in the World
• Largest and lowest cost uranium mine.
• Conventional mine and mill enabling a new elite standard in environmental mine management and social participation.
• All processed waste streams can be stored in an Underground Tailings Management Facility which will significantly reduce the surface footprint of the project.
Free Cash Flow Profile (C$ MM)
($178)
($550) ($519)
$1,296
$1,656 $1,659 $1,670 $1,684 $1,675 $1,554
$1,032
$239
Year -3 Year -2 Year -1 Year 1 Year 2 Year 3 Year 4 Year 5 Year 6 Year 7 Year 8 Year 9
OCF Capex FCF
Mine Life (years) 9LOM Avg. Throughput (tpd) 1,039LOM Avg. Uranium Grade (%) 3.09%LOM Avg. Uranium Recovery (%) 98%LOM Avg. Uranium Production (mm lbs U3O8) 25.4
Mining (C$/lb U3O8) $2.35Processing (C$/lb U3O8) $2.46G&A (C$/lb U3O8) $1.00LOM Avg. Cash Cost (C$/lb U3O8) $11.17LOM Avg. By-Product AISC (C$/lb U3O8) $12.11
Development Capex (C$ mm) $1,247Sustaining Capex (C$ mm) $214
Uranium price (C$/lb | US$/lb) $66.7 | $50.0Discount Rate (%) 8.0%Exchange Rate (US$/C$) 0.75xAfter-Tax NPV (C$ mm) $3,661After-Tax IRR (%) 57%After-Tax Payback Period (years) 1.2
Operations
Operating Costs
Capital Expenditures
Economics

Arrow: A Resilient Project
21
-
$40
$80
$120
$160
$200
1968 1973 1978 1983 1988 1993 1998 2003 2008 2013 2018
Nominal $ Real $
Uranium Price (US$/lb U3O8)
Arrow Break-Even Cost
• Arrow has robust economics and is uniquely able to sustain throughout the long-term uranium cycles.• Additionally, due to unique technical setting, Arrow is a flexible asset from a production volume and timing perspective.• All in break-even price per pound including initial capital and reclamation costs is US$12/lb U3O8 highlighting that
Arrow’s economic cost of production is below the long-term nominal and inflation adjusted uranium spot price.• At US$25/lb U3O8 Arrow returns 27% after-tax.

The Arrow Advantage
22

Dominant Land Position in the Basin
23
["
["
["
["
["["
["
[" ["["["["
!!
!!
!!
!!
!!!!!!
!!
!!
Alb
erta
ROOK I PROJECT
tu905
Shea Creek
Cluff Lake
Patterson Lake
South
Spitfire
Centennial
Dufferin Lake
Millennium Phoenix
Maverick
Key Lake
McArthur River
Cigar Lake
Roughrider
Midwest Lake
Natona Bay
THORBURN LAKE2Z LAKE
MADISON
RADIOMcClean Lake
Eagle Point
Collins Bay
Rabbit Lake
NORTHWEST ATHABASCA
Gunnar
Lorado
NORTH THORBURN
CARLSON CK.
BOW, ARROW,
SOUTH ARROW,
& HARPOON
DISCOVERIES
tu955
!!
!!
Legend
[" Discovery / Mineral Deposit
!! Active or Depleted Uranium Mine
NexGen Mineral Tenure
IsoEnergy Mineral Tenure
Other Mineral Tenure
Athabasca Basin Margin0 25 50
Km
³
Athabasca Basin ProjectsSaskatchewan, Canada
• NexGen holds over 209,000 hectares of prospective exploration ground in the southwest Athabasca Basin.
• Rook I will remain focus and, specifically, the Patterson Corridor which currently hosts 9 uranium discoveries over a 14 km strike length.

Conventional Underground Mining
24
• The geometry of the Arrow Deposit enables decoupled production areas in both the A2 and A3, enabling flexibility of mine sequencing.
• The ability to mine transverse longhole stopes through the A2 High Grade, will support significant scheduling flexibility enabling NexGen to correlate supply quickly and inexpensively to market conditions.
• Geotechnical studies support the conventional longhole stoping mining method including the use of longitudinal and transverse stopes, 30 m level spacing, and the nominal stope strike length of 15 metres to 30 metres which represents an excellent stope stability range for underground mining in highly competent conditions.

Team

Executive Team
26
Name Experience
Leigh CuryerChief Executive Officer, President & Director
• Founder of NexGen Energy and charter accountant with over 18 years of experience in the uranium mining sector having raised over $500M in equity
• Former CFO of Southern Cross Resources where he led the permitting and feasibility study work on the Honeymoon ISL uranium project in South Australia
• Former Corporate Development at Accord Nuclear Resource Management assessing global uranium projects for First Reserve Corporation
Travis McPhersonVice President, Corporate Development
• Joined NexGen Energy in 2014 from a TSX-listed junior gold producer where he was led Corporate Development across a variety of mandates including M&A, equity, project financing packages, budgeting, permitting and investor relations
• Former investment banking analyst at Haywood Securities Inc – a Canadian natural resources boutique.
Gillian McCombieVice President, Human Resources
• Strategic HR Professional with +24 years of experience in mining industry• International experience in talent management, strategic recruiting,
policies and procedures and international service.• Former VP of HR with Capstone Mining
NexGen Executive team spans the entire mining cycle including experience in permitting, project financing, construction and operations.

Advisory Board
27
Name Experience
Charles ScorerSpecial Advisor Uranium Marketing
• Served as the Chief Executive Officer of Accord Nuclear Resources in partnership with First Reserve Corporation.
• 25+ years of commercial and operation experience in uranium and global nuclear fuel market.
• Former Chief Executive Officer of London based nuclear fuel trading company, Nufcor International Limited.
Andrew BrowneTechnical Advisor
• Former Geologist with over 3+ years of experience in exploration and mining geology globally.
• Former operator of a private geoscientific consultancy practice –specializing in global uranium projects.
Craig ParryTechnical Advisor
• Chief Executive Officer and President of IsoEnergy Ltd.• Founding shareholder of EMR Capital and former senior advisor to the
Fund.• Exploration and business development geologist.

Appendix

Resource Estimate Table
29
March 2017 Arrow Mineral Resource Estimate 2018 Arrow Mineral Resource Estimate Diff. Between Arrow 2018 & 2017 Mineral Resource Estimate
Structure Tonnage (Tonnes)
Grade (U3O8%)
Metal U3O8 (U3O8 lb)
Tonnage (Tonnes)
Grade (U3O8%)
Metal U3O8 (U3O8 lb)
Tonnage (Tonnes)
Grade (U3O8%)
Metal U3O8 (U3O8 lb)
Indicated Mineral Resources
A2 790,000 0.84 14,500,000 1,240,000 0.79 21,700,000 450,000 (0.05) 7,200,000
A2 HG 400,000 18.87 164,900,000 460,000 17.85 181,000,000 60,000 (1.02) 16,100,000
A3 No Indicated in 2017 1,010,000 0.70 15,500,000 1,010,000 0.70 15,500,000
A3 HG No Indicated in 2017 180,000 9.68 38,400,000 180,000 9.68 38,400,000
Total: 1,180,000 6.88 179,500,000 2,890,000 4.03 256,600,000 1,700,000 (2.85) 77,200,000 Inferred Mineral Resources
A1 860,000 0.75 14,300,000 1,510,000 0.72 23,900,000 650,000 (0.04) 9,600,000
A2 1,100,000 0.76 18,500,000 1,290,000 0.70 19,900,000 190,000 (0.06) 1,400,000
A2 HG 30,000 13.00 8,600,000 5,000 12.70 1,400,000 (25,000) (0.30) (7,200,000)
A3 1,460,000 1.16 37,300,000 1,230,000 1.11 30,000,000 (230,000) (0.05) (7,300,000)
A3 HG 150,000 8.53 28,200,000 1,000 9.07 200,000 (149,000) 0.54 (28,000,000)
A4 550,000 1.06 12,900,000 800,000 0.92 16,300,000 250,000 (0.14) 3,400,000
180 110,000 0.95 2,300,000 Combined into A3 & A4 (110,000) (0.95) (2,300,000)
Total: 4,260,000 1.30 122,100,000 4,840,000 0.86 91,700,000 580,000 (0.44) (30,400,000)
Notes: 1. CIM Definition Standards were followed for Mineral Resources. 2. Mineral Resources are reported at a cut-off grade of 0.25% U3O8 based on a long-term price of US$50 per lb U3O8 and estimated costs. 3. A minimum mining width of 1.0 m was used. 4. Numbers may not add due to rounding.

Arrow Project Economics Sensitivity Table
30
Uranium Price ($ USD/lbU3O8)
After-Tax NPV8(CAD $ Billions)
After-Tax IRR(%)
After-Tax Cash PayBack(Years)
$80/lb U3O8 $6.62 80.4 0.8
$60/lb U3O8 $4.65 65.5 1.0
$50/lb U3O8 $3.66 56.8 1.2
$40/lb U3O8 $2.67 46.9 1.5
$30/lb U3O8 $1.69 35.6 1.9
$25/lb U3O8 $1.19 28.9 2.3

Low All in Sustaining Costs
31
All-in Sustaining Cost PFS $ CAD/lb U308
Operating Cost 5.81
Revenue Royalties 4.81
Reclamation Cost 0.21
Sustaining Capital 0.94
All-in Sustaining CashCost
11.77
• Given the unique technical setting of the Arrow deposit combined with an innovative design regarding the mining and milling at Arrow, creates industry leading low AISC.
• Even when initial capital expenditure is included, the All-in Cost is C$17.23/lb U3O8.

Low Operating Costs
32
OPEX PerTonne
PFS $ CAD/t
U308
PEA$ CAD/t
U308
Variance
Mining 157.31 131.87 19%
MineralProcessing
164.65 110.91 48%
GeneralandAdministration
67.11 63.20 6%
TotalOperatingCosts
389.07 305.98 27%
OPEX PerPound
PFS $ CAD/lb
U308
PEA$ CAD/lb
U308
Variance
Mining 2.35 3.61 (35%)
MineralProcessing
2.46 3.03 (19%)
GeneralandAdministration
1.00 1.73 (42%)
TotalOperatingCosts
5.81 8.37 (31%)
• 31% reduction in average annual operating cost to CAD $5.81 (from CAD $8.37) despite the PFS recategorizing the underground tailings to operating cost instead of sustaining capital as per the PEA in order to reflect a more wholesome ‘operating cost’ figure. These costs account for 21% of operating costs.

Government Revenues Chart
33
Yr 1 Yr 2 Yr 3 Yr 4 Yr 5 Yr 6 Yr 7 Yr 8 Yr 9
Cum
ulat
ive
Reve
nue
Reve
nue
by Y
ear
Arrow Deposit PFS - Government Revenue
Gross Revenue Royalties Profit Royalties
Federal Corporate Income Tax Provincial Corporate Income Tax
Cumulative Total Value to Government
• Potential of CAD $5.4 Billion in total Government Revenue over the life of asset.
• Potential of CAD $3.9 Billion in Saskatchewan Government revenue over the life of asset.
• Average annual gross revenue royalties (based on 4.25% net) are CAD $122 Million (versus CAD $80 Million in PEA).