News Release - Bunzl/media/Files/B/Bunzl-PLC/reports-and-presentations/...Strong track record of ......
25
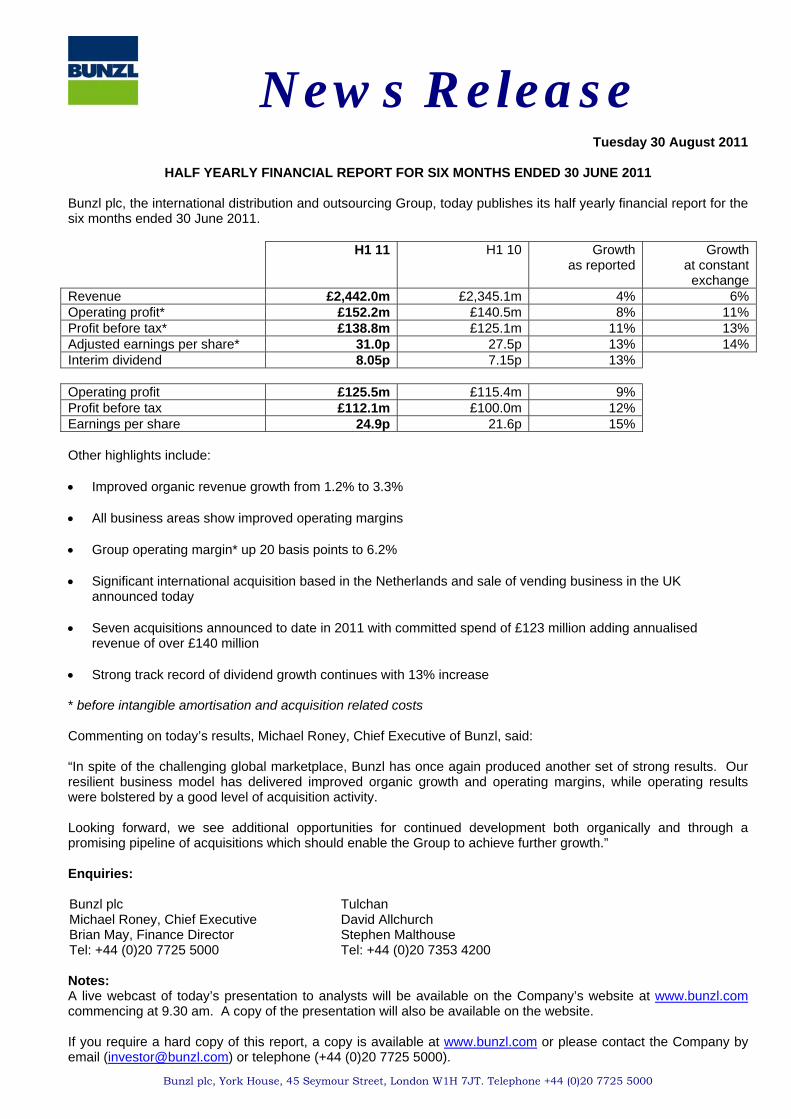
News Release Bunzl plc, York House, 45 Seymour Street, London W1H 7JT. Telephone +44 (0)20 7725 5000 Tuesday 30 August 2011 HALF YEARLY FINANCIAL REPORT FOR SIX MONTHS ENDED 30 JUNE 2011 Bunzl plc, the international distribution and outsourcing Group, today publishes its half yearly financial report for the six months ended 30 June 2011. H1 11 H1 10 Growth as reported Growth at constant exchange Revenue £2,442.0m £2,345.1m 4% 6% Operating profit* £152.2m £140.5m 8% 11% Profit before tax* £138.8m £125.1m 11% 13% Adjusted earnings per share* 31.0p 27.5p 13% 14% Interim dividend 8.05p 7.15p 13% Operating profit £125.5m £115.4m 9% Profit before tax £112.1m £100.0m 12% Earnings per share 24.9p 21.6p 15% Other highlights include: Improved organic revenue growth from 1.2% to 3.3% All business areas show improved operating margins Group operating margin* up 20 basis points to 6.2% Significant international acquisition based in the Netherlands and sale of vending business in the UK announced today Seven acquisitions announced to date in 2011 with committed spend of £123 million adding annualised revenue of over £140 million Strong track record of dividend growth continues with 13% increase * before intangible amortisation and acquisition related costs Commenting on today’s results, Michael Roney, Chief Executive of Bunzl, said: “In spite of the challenging global marketplace, Bunzl has once again produced another set of strong results. Our resilient business model has delivered improved organic growth and operating margins, while operating results were bolstered by a good level of acquisition activity. Looking forward, we see additional opportunities for continued development both organically and through a promising pipeline of acquisitions which should enable the Group to achieve further growth.” Enquiries: Bunzl plc Michael Roney, Chief Executive Brian May, Finance Director Tel: +44 (0)20 7725 5000 Tulchan David Allchurch Stephen Malthouse Tel: +44 (0)20 7353 4200 Notes: A live webcast of today’s presentation to analysts will be available on the Company’s website at www.bunzl.com commencing at 9.30 am. A copy of the presentation will also be available on the website. If you require a hard copy of this report, a copy is available at www.bunzl.com or please contact the Company by email ([email protected] ) or telephone (+44 (0)20 7725 5000).
Transcript of News Release - Bunzl/media/Files/B/Bunzl-PLC/reports-and-presentations/...Strong track record of ......
News Release
Bunzl plc, York House, 45 Seymour Street, London W1H 7JT. Telephone +44 (0)20 7725 5000
Tuesday 30 August 2011
HALF YEARLY FINANCIAL REPORT FOR SIX MONTHS ENDED 30 JUNE 2011
Bunzl plc, the international distribution and outsourcing Group, today publishes its half yearly financial report for the six months ended 30 June 2011. H1 11 H1 10 Growth
as reported Growth
at constant exchange
Revenue £2,442.0m £2,345.1m 4% 6%Operating profit* £152.2m £140.5m 8% 11%Profit before tax* £138.8m £125.1m 11% 13%Adjusted earnings per share* 31.0p 27.5p 13% 14%Interim dividend 8.05p 7.15p 13% Operating profit £125.5m £115.4m 9% Profit before tax £112.1m £100.0m 12% Earnings per share 24.9p 21.6p 15% Other highlights include: Improved organic revenue growth from 1.2% to 3.3% All business areas show improved operating margins Group operating margin* up 20 basis points to 6.2% Significant international acquisition based in the Netherlands and sale of vending business in the UK
announced today Seven acquisitions announced to date in 2011 with committed spend of £123 million adding annualised
revenue of over £140 million Strong track record of dividend growth continues with 13% increase * before intangible amortisation and acquisition related costs Commenting on today’s results, Michael Roney, Chief Executive of Bunzl, said: “In spite of the challenging global marketplace, Bunzl has once again produced another set of strong results. Our resilient business model has delivered improved organic growth and operating margins, while operating results were bolstered by a good level of acquisition activity. Looking forward, we see additional opportunities for continued development both organically and through a promising pipeline of acquisitions which should enable the Group to achieve further growth.” Enquiries: Bunzl plc Michael Roney, Chief Executive Brian May, Finance Director Tel: +44 (0)20 7725 5000
Tulchan David Allchurch Stephen Malthouse Tel: +44 (0)20 7353 4200
Notes: A live webcast of today’s presentation to analysts will be available on the Company’s website at www.bunzl.com commencing at 9.30 am. A copy of the presentation will also be available on the website. If you require a hard copy of this report, a copy is available at www.bunzl.com or please contact the Company by email ([email protected]) or telephone (+44 (0)20 7725 5000).

-2-
CHAIRMAN’S STATEMENT Despite the difficult macroeconomic conditions which have prevailed throughout the first half of 2011, most
noticeably in the UK but also across the international markets in which we operate, I am pleased to report that
Bunzl has once again produced another strong set of results.
Group revenue rose to £2,442.0 million (2010: £2,345.1 million), an increase of 6% at constant exchange rates,
which was driven by strong organic growth in North America, Continental Europe and the Rest of the World
together with the effect of recent acquisitions, partly offset by lower sales in UK & Ireland.
Operating profit before intangible amortisation and acquisition related costs was £152.2 million (2010:
£140.5 million), up 11% at constant exchange rates, as margins improved in all of the business areas. Profit before
tax, intangible amortisation and acquisition related costs was £138.8 million (2010: £125.1 million), an increase of
13% at constant exchange rates, and adjusted earnings per share on a similar basis were 31.0p (2010: 27.5p), a
14% increase at constant exchange rates. Earnings per share were 24.9p (2010: 21.6p), up 17% at constant
exchange rates. Adverse currency translation movements, especially the US dollar, reduced Group growth rates by
between 1% and 3%.
Dividend
The Board has decided to increase the interim dividend by 13% to 8.05p. Shareholders will again be able to
participate in the dividend reinvestment plan which we reintroduced earlier this year to replace the scrip dividend
scheme.
Strategy
We continue to pursue our long established strategy of developing the business through organic growth,
consolidating the markets in which we compete through focused acquisitions in both existing and new geographies
and continuously improving the efficiency of our operations. Acquisition activity, which picked up in 2010 as the
economic environment began to stabilise, has continued strongly into 2011 with committed spend so far this year
of £123 million.
Vending Disposal
The Board recently decided that it would be an appropriate time to divest the Company’s vending business in the
UK. Bunzl entered the vending sector, which is both more capital intensive and less resilient than other Bunzl
businesses, in 1999 with the purchase of Provend Group. At the time Provend Group also included a large
foodservice distribution business that expanded Bunzl’s existing catering supplies operations. Since then, although
the Company has further developed the vending business, it is restricted to operations solely in the UK. In addition,
over recent years the vending market has changed significantly. Although partly due to the growth of high street
coffee shops which has led to reductions in vend volumes, particularly in large city centres, the principal change in
the marketplace is the consolidation which has taken place with two groups, Autobar and Selecta, emerging as the
clear European market leaders.
Since the Group’s strategy is to focus its resources on areas where it has or can develop real competitive
advantage, the Board therefore concluded that the vending business was no longer a strategic fit within the portfolio
of the Group’s businesses and decided that the funds which would be generated from a disposal would be better
invested in the Group’s core, higher return and higher growth businesses.

-3-
We are therefore announcing today the sale of the vending business to Autobar who have over recent years
become a market leader in this sector with vending businesses in 11 countries and annual revenue in excess of
£600 million. This transaction will generate a net cash inflow of approximately £30 million. Although the disposal is
expected to give rise to a loss of approximately £55 million, which will be recorded in the financial statements for
the year ending 31 December 2011, the Board believes that the sale is in the best interests of shareholders.
Credit facilities
The Group remains highly cash generative and we continue to have access to diverse sources of funding to be
used to achieve our strategic objectives. Our undrawn committed facilities’ headroom at the end of June was
£579.2 million.
Board
Charles Banks, who served as a non-executive director for almost nine years, latterly as Chairman of the
Remuneration Committee, retired from the Board after our Annual General Meeting in April. His independent
advice and significant contribution to our success were greatly appreciated and we wish him well for the future.
Peter Johnson, who has been a non-executive director since 2006 and the Senior Independent Director since 2010,
has been appointed as Chairman of the Remuneration Committee. Eugenia Ulasewicz was appointed as a non-
executive director in April. Currently President of Burberry, Americas, she has a wealth of experience in the retail
sector and has overseen the recent growth and successful development of Burberry’s businesses in North and
South America which includes both wholesale and retail businesses and an extensive distribution network. We
welcome her to the Board.
The Board notes the publication of the Davies Review on Women on Boards in February 2011 and the subsequent
consultation being undertaken by the Financial Reporting Council in relation to potential changes to the UK
Corporate Governance Code. Bunzl recognises the importance of gender diversity throughout the Group, as
demonstrated by the composition of its Executive Committee of which 40% of members are women. Currently one
of our eight Board members is female. The Board aims to have a broad range of skills, backgrounds and
experience. While we will continue to follow a policy of ensuring that we appoint the best people for the relevant
roles, we recognise the benefits of greater diversity and will continue to take account of this when considering any
particular appointment.
Philip Rogerson
Chairman
CHIEF EXECUTIVE’S REVIEW Operating performance
The translation effects of the weaker US dollar and overall currency movements have reduced the reported growth
rates of revenue and operating profit. The operations, including the relevant growth rates, are therefore reviewed
below at constant exchange rates to remove the distorting impact of these currency movements. Changes in the
level of revenue and profits at constant exchange rates have been calculated by retranslating the results for the first
half of 2010 at the average rates used for 2011. Unless otherwise stated, all references in this review to operating
profit are to operating profit before intangible amortisation and acquisition related costs.

-4-
Revenue increased 6% to £2,442.0 million (2010: £2,345.1 million) and operating profit was £152.2 million (2010:
£140.5 million), an increase of 11%. The percentage growth in operating profit was greater than that of revenue
due to the improvement in operating margins in all of the business areas which has resulted in a 20 basis point
improvement in Group operating margin to 6.2%.
In North America revenue rose 7% due to strong organic growth and the impact of Cool-Pak, acquired in August
2010, while operating profit increased 8%. In the UK & Ireland revenue decreased by 2% primarily due to the
persisting difficult economic conditions and weakness in some businesses. However operating profit rose 1% due
to the positive impact of earlier cost reduction initiatives. Revenue in Continental Europe rose 14% as a result of
good organic growth and the impact of acquisitions completed in 2010 and during the first half of this year and
operating profit was up 19%. In the Rest of the World revenue increased 8% and operating profit was up 12% due
to both revenue growth and some margin improvement.
Cash flow remained strong, with cash generated from operations of £141.6 million which was partly used to finance
a cash outflow for acquisitions of £56.0 million. Net debt at the end of June was £726.5 million compared to
£716.8 million at the year end. Our net debt to EBITDA ratio reduced to 2.0 times compared to 2.1 times at
December 2010.
Acquisitions
So far this year we have announced seven acquisitions.
We expanded our business supplying catering equipment and disposables in Australia through the acquisition of
Omega Hospitality in March and Hospitality Depot in May. Together these businesses have annualised revenue of
approximately A$27 million and have allowed us to penetrate further in this sector in New South Wales and
Queensland.
At the end of March we acquired from OCS Group the business of Cannon Consumables which is principally
engaged in the supply of cleaning and hygiene consumable products to OCS as well as to a number of other
customers throughout the UK. Revenue for the year ended 31 March 2011 was £16 million.
During May we purchased King Espana which is a leading distributor of foodservice disposables and cleaning and
hygiene supplies to the catering and cleaning sectors throughout Spain and has established a presence for Bunzl in
Madrid and Valencia as well as reinforcing our business in Barcelona. Revenue was €29 million in 2010.
In May we also completed the acquisition of the SIG Safety and Workwear business, a leading distributor of
personal protection equipment and workwear to a variety of market sectors in the UK with revenue in 2010 of
£22 million. The business complements and extends our existing business in the UK serving these markets.
Today we are announcing two further acquisitions. Majestic Products and its associated businesses, which had
revenue of €62 million in 2010, will extend our operations in the Netherlands into the personal protection equipment
and safety sectors and expand our safety supplies business in the US while at the same time provide a platform to
develop the business further in Belgium and Germany. Completion of the acquisition is subject to clearance from
the competition authority in the Netherlands.

-5-
Netpak, with revenue of C$12 million in the year ended 30 June 2011, was acquired in July. Based in Vancouver,
Canada, the business specialises in the supply of packaging supplies and equipment for both food and non-food
products to a number of different sectors, including fruit and vegetable growers, and will complement the business
of Cool-Pak which was acquired in the US during the second half of last year.
Disposal
We are also announcing today the sale of the vending business in the UK which was no longer considered to be a
strategic fit within the Group. Revenue in 2010 was £68 million. We believe that the funds generated from the
disposal will be more usefully employed in our core, higher return and higher growth businesses.
North America
In North America revenue rose 7% to £1,286.7 million despite a sluggish US economy which has hindered the
growth of many of our customers across all of the sectors in which we operate. Several customers have however
performed well compared to 2010, contributing to our sales growth. The North American market continues to
demonstrate a need for the value-added solutions that we provide which contribute to lower working capital,
increased cash flow and a more efficient and cost-effective supply chain for the businesses we serve. As a result of
tight cost control, operating profit increased 8% to £78.2 million.
Our organic growth was strong due to a combination of product price increases, following rises in raw material
costs, and additional volume as a result of both new customers and increased account penetration, especially in
our grocery, foodservice redistribution and food processor businesses. In particular, our mid to large foodservice
accounts have themselves experienced increased sales to their customers during this period. Our extensive
distribution platform, combined with our financial strength, has enabled us to continue to meet the needs of our
existing customers as well as attract new business. The expansion of our importing activities and the ability to
provide our own quality assurance and control services, combined with audit capability for overseas suppliers, has
made our import programme attractive to many of our customers and has also contributed to our increase in sales.
Cool-Pak, acquired in August last year, has contributed to good growth in our processor supplies business.
The current market conditions are continuing to exert pressure on gross margins. However, expanding the range of
our imported products, increasing the number of private label lines we offer and reviewing alternative supply
sources have all helped to offset these pressures. We are actively working with customers to identify ways to
reduce costs within their supply chains to drive increased productivity. During the period we have undertaken an
initiative to analyse customer profitability more accurately in all sectors, allowing managers to evaluate more
effectively the resources required to service each customer.
Operating costs have continued to reduce as a percentage of sales compared to last year. This improvement has
been driven by consolidating several distribution facilities and relocating others to new, more functional buildings
that provide a more efficient product flow within the warehouse and other improvements in productivity. Additionally
we have installed our first computer-driven carousel picking system in R3 Safety during the first half of this year.
This system provides greater accuracy and increased productivity, especially for smaller and individual picks.
Plans to install this operational model in other locations are under consideration and we are investigating other
equipment picking systems that will enhance and improve our efficiencies. We have continued to invest in
additional safety training for all warehouse workers and drivers which has resulted in lower insurance costs and a
reduction in accidents and lost time.

-6-
We have also continued to develop our sales training programmes and have recently completed the development
of a new sales effectiveness training module which will be initiated in the second half of this year. This will focus on
selling our value-added programmes and services to both existing and new customers with an emphasis on
improving customer profitability. This programme will also encompass additional product training related to private
label and import items. For all remaining areas of our business, including customer service, purchasing and
warehousing, we also provide training in best practices to maintain our high levels of productivity.
Our customers have continued to benefit from the solutions we provide in relation to import programmes and
environmental issues. Our expanded logistics and quality control department in China allows us to provide services
that our customers can rely on and utilise in other areas of their business. Our investment in Asia allows us to offer
an import programme that is attractive to all of our customers including those who are already importing products.
Through our access to products in Asia and other parts of the world and our strategic alliances with domestic
preferred suppliers, we are also able to provide the products that meet the environmental needs of many of our
customers and the communities they serve.
UK & Ireland
Our businesses in UK & Ireland have continued to consolidate their position, concentrating on margins and
operating costs while also working to take advantage of profitable opportunities as they arise in the marketplace.
They have however continued to face a challenging trading environment due to sluggish economic conditions,
which in turn have affected our customers’ spending. The resulting pressure on sales has led to a 2% decline in
revenue to £485.6 million. Despite this, with an improvement in operating margin, operating profit increased 1% to
£25.8 million.
The cost pressures resulting from wage inflation in China, coupled with commodity price movements, have resulted
in many product price increases. We have worked hard to pass these increases on to our customers in a difficult
market in order to minimise the impact on gross margins. We continue to examine and rationalise our operating
platform. As leases have come to an end, we have been able to reduce the footprint further.
Our cleaning and safety business has been developed further by two acquisitions during the first half of the year.
Acquired at the end of March, Cannon Consumables is a good fit with our existing cleaning and hygiene business
and brings with it a substantial new customer supply contract. SIG Safety and Workwear, which we purchased in
May, complements our personal protection equipment and workwear business and has enhanced our route to
market, particularly through direct mail and web selling, and has also increased our business with key account
customers. The integration of both of these acquisitions is going well. Although the construction and government
markets continue to be constrained, our facilities management customers are developing well in the current market.
During the period we have closed two facilities west of London and consolidated them into a far more efficient unit
near Heathrow airport.
While volumes in our hospitality businesses have been under pressure, our operations in this sector have been
strengthened by the continuing development of our range of own brand products. This helped support our margins
and increase our competitiveness. We have successfully grown sales of catering equipment where demand has
been more robust.

-7-
We have continued to show good growth in our food and non-food retail business through successfully winning a
number of new customers. This is a particularly pleasing result given the tough trading environment which the retail
sector on the high street is currently facing.
Volumes in our healthcare businesses have continued to be adversely affected by restrictions on spending by
hospitals which has led to a reduction in profits. We are working to expand our range of own label branded
products that have an established reputation for quality in the medical and surgical consumables market.
Our business in Ireland has performed better in what has proved once again to be a testing environment. The
economic conditions there are still making it difficult to grow, particularly in the convenience retail market and hotel
sector, but efforts to streamline the business and reduce the cost base are now paying off with profits slightly ahead
of last year.
Continental Europe
A combination of good organic revenue growth together with the impact of a number of acquisitions made in 2010
and the recent acquisition of King Espana has resulted in a strong performance for Continental Europe during the
first half of the year. Although higher raw material prices and the resulting increases in product prices have put
pressure on margins, this has been offset by continued tight management of operating costs. Overall the business
area saw revenue increase 14% to £526.1 million and operating profit rise 19% to £44.8 million.
In France, the cleaning and hygiene business saw a return to modest sales growth after a challenging 2010. It also
benefitted from lower operating costs following the cost reduction measures taken, particularly in the second half of
last year, such that profits grew significantly. Our personal protection equipment business achieved strong sales
growth due to both improvements in the economy and to new business wins.
In the Netherlands, both the food and non-food retail businesses delivered strong sales growth. Good sales growth
was also achieved in the healthcare sector but cost cutting measures within the customer base continue to impact
margins. Van’t Veer Verpakkingen, acquired in October 2010, has integrated well into our existing healthcare
business. The horeca business saw a slight reduction in revenue as conditions in the restaurant and catering
sectors continue to be difficult, negating stronger growth in the hotel sector.
In Belgium, Global Net has integrated well into the Group since acquisition in July 2010 and is trading ahead of
expectations, delivering significant synergies. However margin pressure has affected our existing cleaning and
hygiene business with larger customers resisting product price increases. Our retail business achieved good sales
growth although operating margins also remained under pressure.
In Germany, sales have grown robustly and this, combined with the impact of cost efficiencies, particularly relating
to transport costs, resulted in significant profit growth.
In Switzerland, the Weita business acquired in March 2010 has performed well ahead of expectations with both
good sales growth, in particular in the retail and cleaning and hygiene sectors, and improved operating margins,
assisted by the strength of the Swiss franc.

-8-
In Denmark, sales progressed well in all sectors of activity. The Clean Care and Hamo acquisitions, made in
January and February 2010 respectively, have integrated well. Cost efficiencies, including the consolidation of one
of the cleaning and hygiene warehouses into the newer facility in Sorø, have led to improvements in operating
margins.
In Spain, the cleaning and hygiene business achieved modest sales growth against the backdrop of continuing
challenging economic conditions. The acquisition of King Espana in May 2011 reinforces our existing business in
Barcelona and establishes a presence in Madrid and Valencia and should generate significant synergies. Our
personal protection equipment businesses also recorded some sales growth. Margins have improved although
trading remains difficult. Juba, acquired in May 2010, has delivered results ahead of expectations.
In central Europe, sales remained flat in our cleaning and hygiene business and declined in the continually
challenging retail market, although operating margins improved in this sector leading to increased profits.
In Israel, the acquisition of Silco in April 2010 has integrated well and has delivered good results following a number
of customer wins.
Rest of the World
In the Rest of the World revenue increased 8% to £143.6 million. Good organic growth in both Australasia and
Brazil and an improvement in operating margins in Australasia resulted in a 12% improvement in operating profit to
£12.2 million.
In Australasia our results continued to improve, which is particularly pleasing given the disruptions from natural
disasters experienced across the region in the first quarter. Although the strong Australian dollar helped in part to
offset rising product and freight costs, it continues to impact both exports and tourism adversely. Our largest
business, Outsourcing Services, which supplies the healthcare, cleaning and catering sectors, continued to perform
strongly. The business has successfully expanded into the resource support sector and also developed its
business with healthcare and cleaning customers. Our food processor supplies business has also shown some
improvement in profitability over last year despite the continued downturn being experienced by some of our major
customers. To help offset this, we have continued to control costs and have also introduced new product
categories to gain market share with our existing customers while focusing on growth with other, non-meat food
processors. Our catering equipment business has also seen improved sales, benefiting from some good gains with
both existing and new quick service restaurant customers. In addition, we have introduced a range of our own
brand products which we will continue to develop as we increase our sourcing capabilities through our
consolidation facilities in Asia. In March we acquired Omega Hospitality and purchased the business of Hospitality
Depot in May. These acquisitions, which both form part of our catering equipment business, have increased our
presence on the east coast of Australia. Their additional scale should create improved buying opportunities and
other synergies that will benefit our business in this sector.
In Brazil we continue to show good growth in both revenue and operating profit despite the distortions in the
economic environment as a result of a very strong real. Our most recent acquisition, AM Supply, which was
completed in August 2010, has integrated well into our existing business and should grow in line with the significant
investments being made in offshore oil exploration.

-9-
Prospects
We believe that our resilient business model and strong competitive position will provide additional opportunities for
the further development of the Group in the international markets in which we operate. In North America the
organic growth should continue to be strong while the difficult macroeconomic conditions in UK & Ireland, especially
for businesses selling to the public sector and the construction market, will continue to hold back growth. In
Continental Europe continued good organic growth and the positive impact from acquisitions will enhance the
overall results. The Rest of the World should develop positively from a combination of good organic growth and the
positive impact from the 2011 acquisitions in Australasia.
Acquisitions remain an important part of our strategy to grow and develop the business, the pipeline is promising
and we expect to complete more transactions this year.
Although there remain a number of uncertainties in the economies of the countries in which we compete, the Board
believes that our market leading positions and our strong cash flow and balance sheet should enable the Group to
grow further.
Michael Roney
Chief Executive
FINANCIAL REVIEW Group performance
Revenue increased by 6% at constant exchange rates (4% at actual exchange rates) to £2,442.0 million reflecting
good organic growth and the benefit of acquisitions. Operating profit before intangible amortisation and acquisition
related costs increased by 11% at constant exchange rates (8% at actual exchange rates) to £152.2 million as a
result of both the revenue growth and an improvement in the operating profit margin from 6.0% to 6.2%.
Intangible amortisation and acquisition related costs of £26.7 million were up £1.6 million at constant and actual
exchange rates due to a £1.0 million increase in intangible amortisation and a £0.6m increase in acquisition related
costs.
The net interest charge decreased by £2.0 million to £13.4 million, with interest cover improving to 11.4 times
compared to 9.1 times in the first half of 2010.
Profit before income tax, intangible amortisation and acquisition related costs was £138.8 million, up 13% at constant
exchange rates (11% at actual exchange rates) due to the growth in operating profit before intangible amortisation and
acquisition related costs and the benefit from the lower interest charge.
Tax
A tax charge at a rate of 27.7% (2010: 29.0%) has been provided on the profit before tax, intangible amortisation and
acquisition related costs. Including the impact of intangible amortisation of £22.6 million, acquisition related costs of
£4.1 million and the associated deferred and current tax of £6.9 million, the overall tax rate is 28.1% (2010: 30.4%).
The tax rate of 27.7% is higher than the nominal UK rate of 26.0% for 2011 principally because many of the Group’s
operations are in countries with higher tax rates.

-10-
Profit for the year
Profit after tax increased 18% at constant exchange rates (16% at actual exchange rates) to £80.6 million.
Earnings
The weighted average number of shares increased to 323.8 million from 322.7 million due to shares issued for the
scrip dividend and employee option exercises, partially offset by shares purchased into the Company’s employee
benefit trust. Earnings per share were 24.9p, up 17% at constant exchange rates (15% at actual exchange rates).
After adjusting for intangible amortisation, acquisition related costs and the respective associated tax, earnings per
share increased 14% at constant exchange rates (13% at actual exchange rates) to 31.0p. The intangible
amortisation and associated tax are non-cash charges which are not taken into account by management when
assessing the underlying performance of the business. Similarly, the acquisition related costs and associated tax do
not relate to the underlying performance of the entity acquired as they are a non-operational expense.
Dividends
The interim dividend has increased 13% to 8.05p from 7.15p in 2010.
Acquisitions
The principal acquisitions made in 2011 were Omega Hospitality, Cannon Consumables, Hospitality Depot, King
Espana and SIG Safety and Workwear. Annualised revenue and operating profit before intangible amortisation
and acquisition related costs of the businesses acquired were £84.5 million and £5.8 million respectively. A
summary of the effect of acquisitions is as follows:
£mFair value of assets acquired 34.9Goodwill 14.2Consideration 49.1Satisfied by: cash consideration deferred consideration
45.4 3.7
49.1Contingent payments to former owners 2.3Net bank overdrafts acquired 0.6Transaction costs and expenses 2.2Total expected spend in respect of current year acquisitions 54.2 The net cash outflow in the period in respect of acquisitions comprised: Cash consideration 45.4Net bank overdrafts acquired 0.6Deferred consideration in respect of prior year acquisitions 6.2Net cash outflow in respect of acquisitions 52.2Acquisition related costs 3.8Total cash outflow in respect of acquisitions 56.0

-11-
Cash flow
Cash generated from operations was £141.6 million, a £2.3 million decrease from 2010, primarily due to a working
capital outflow in 2011 of £19.6 million, compared to £7.5 million in 2010, partly offset by the increase in profit before
tax, intangible amortisation and acquisition related costs of £11.7 million. The Group’s free cash flow of £87.4 million
was up £10.3 million due to lower capital expenditure and lower interest and tax payments. After payment of the
2010 interim dividend of £16.6 million, an acquisition cash outflow of £56.0 million and a £24.4 million outflow on
employee share schemes, the net cash outflow of £9.6 million increased net debt to £726.5 million. The summary
cash flow for the period was as follows:
Six months to 30.6.11
£m
Six months to 30.6.10
£mCash generated from operations 141.6 143.9Net capital expenditure (11.0) (12.2)Operating cash flow 130.6 131.7 Operating cash flow to operating profit* 86% 94% Net interest (14.1) (17.4)Tax (29.1) (37.2)Free cash flow 87.4 77.1Dividends (16.6) (20.0)Acquisitions (56.0) (76.7)Employee share schemes (24.4) 4.6Net cash outflow (9.6) (15.0)
*Before intangible amortisation and acquisition related costs
Balance sheet
Return on average operating capital employed before intangible amortisation and acquisition related costs has
increased to 54.8% from 54.4% at December 2010. Intangible assets have increased by £47.1 million since
31 December 2010 to £1,291.7 million, reflecting goodwill and customer relationships arising on acquisitions in
the period of £41.2 million and a positive exchange impact of £28.5 million offset by an amortisation charge of
£22.6 million. The Group’s pension deficit of £52.1 million at 30 June 2011 was at a similar level to 31 December
2010.
The movements in shareholders’ equity and net debt during the period were as follows:
Shareholders’ equity £mAt 1 January 2011 796.4Profit for the year 80.6Dividends (68.9)Share issuance (23.4)Currency 31.4Other 1.0At 30 June 2011 817.1
Net debt £mAt 1 January 2011 (716.8)Net cash outflow (9.6)Currency (0.1)At 30 June 2011 (726.5)
Net debt to EBITDA (times) 2.0

-12-
The Group continually monitors net debt and forecast cash flows to ensure that sufficient facilities are in place to meet
the Group’s requirements in the short, medium and long term and, in order to do so, arranges borrowings from a
variety of sources. Additionally, the Group monitors compliance with its debt covenants, principally net debt to EBITDA
of no more than 3.5 times and interest cover of no less than 3.0 times. For the six months ended 30 June 2011 all
covenants have been complied with.
The Group has substantial committed borrowing facilities available to it comprising multi-currency credit facilities from
the Group’s banks and US dollar and sterling bonds. As at 30 June 2011 the Group had undrawn committed facilities
of £579.2 million. During the next 12 months £196.1 million of the committed facilities mature and thereafter the
facilities mature at various times over the period up to April 2023.
Based on the expected future profit generation, cash conversion and facilities’ headroom over the next 12 months,
the condensed set of financial statements for the six months ended 30 June 2011 has been prepared on the going
concern basis.
Risks and uncertainties
The principal risks and uncertainties affecting the business activities of the Group for the remaining six months of
the financial year remain those detailed in the section entitled ‘Principal risks and uncertainties’ on pages 24 and 25
of the Annual Report for the year ended 31 December 2010. These include the impact of general economic
conditions and the ongoing competitive pressures in the countries in which we operate, the impact of product price
changes, the translation and transaction impacts of movements in exchange rates on the Group’s results, the ability
of the Group to complete and successfully integrate acquisitions and the availability of funding to enable the Group
to meet its financial obligations as they fall due. A copy of the 2010 Annual Report is available on the Company’s
website at www.bunzl.com. Set out in the Chief Executive’s Review is a commentary on the prospects for the
Group for the remaining six months of the financial year.

-13-
Consolidated income statement
Growth Six months to Six months to Actual Constant Year to 30.6.11 30.6.10 exchange exchange 31.12.10 Notes £m £m rates rates £mRevenue 2 2,442.0 2,345.1 4% 6% 4,829.6 Operating profit before intangible amortisation and acquisition related costs 152.2
140.5 8% 11% 306.7 Intangible amortisation and acquisition related costs
2 (26.7) (25.1) (51.0)
Operating profit 2 125.5 115.4 9% 11% 255.7Finance income 3 10.9 10.4 20.3Finance cost 3 (24.3) (25.8) (50.8)Profit before income tax 112.1 100.0 12% 15% 225.2 Profit before income tax, intangible amortisation and acquisition related costs 138.8
125.1 11% 13% 276.2 UK income tax 3.1 (0.2) 1.6Overseas income tax (34.6) (30.2) (67.8)Total income tax 4 (31.5) (30.4) (66.2)Profit for the period attributable to the Company’s equity holders 80.6
69.6 16% 18%
159.0
Earnings per share attributable to the Company’s equity holders Basic 6 24.9p 21.6p 15% 17% 49.1pDiluted 6 24.8p 21.5p 15% 17% 48.8p Consolidated statement of comprehensive income Six months to Six months to Year to 30.6.11 30.6.10 31.12.10 £m £m £mProfit for the period 80.6 69.6 159.0 Other comprehensive income Actuarial loss on pension schemes (3.8) (19.5) (2.5)Foreign currency translation differences for foreign operations 40.6 (35.1) 1.1(Loss)/gain taken to equity as a result of designated effective net investment hedges
(9.2)
6.2
2.3
Gain recognised in cash flow hedge reserve 0.5 1.1 0.4Movement from cash flow hedge reserve to income statement (0.6) 1.5 1.4Income tax credit on other comprehensive income 1.8 7.5 2.0Other comprehensive income/(expense) for the period 29.3 (38.3) 4.7Total comprehensive income attributable to the Company’s equity holders
109.9
31.3
163.7

-14-
Consolidated balance sheet 30.6.11 30.6.10 31.12.10 Notes £m £m £mAssets Property, plant and equipment 120.6 119.7 118.1Intangible assets 7 1,291.7 1,209.7 1,244.6Investment in associates 0.5 0.5 0.5Derivative assets 22.1 30.0 25.1Deferred tax assets 10.5 10.1 5.9Total non-current assets 1,445.4 1,370.0 1,394.2 Inventories 478.9 439.4 482.0Income tax receivable 10.1 5.7 6.2Trade and other receivables 744.0 682.2 690.8Derivative assets - 2.1 1.3Cash and deposits 8 91.2 63.7 83.9Total current assets 1,324.2 1,193.1 1,264.2Total assets 2,769.6 2,563.1 2,658.4 Equity Share capital 113.7 113.1 113.3Share premium 134.9 133.2 133.9Translation reserve 89.7 25.8 57.5Other reserves 9.7 10.3 9.8Retained earnings 469.1 365.2 481.9Total equity attributable to the Company’s equity holders 817.1 647.6 796.4 Liabilities Interest bearing loans and borrowings 8 771.1 715.2 691.5Retirement benefit obligations 52.1 78.8 52.3Other payables 11.7 9.6 7.9Derivative liabilities 1.4 2.2 2.2Provisions 31.7 40.8 35.5Deferred tax liabilities 121.8 104.6 115.4Total non-current liabilities 989.8 951.2 904.8 Bank overdrafts 8 24.6 11.5 9.0Interest bearing loans and borrowings 8 43.5 112.9 126.2Income tax payable 55.7 60.7 46.4Trade and other payables 827.4 769.3 766.3Derivative liabilities 0.5 0.3 0.7Provisions 11.0 9.6 8.6Total current liabilities 962.7 964.3 957.2Total liabilities 1,952.5 1,915.5 1,862.0Total equity and liabilities 2,769.6 2,563.1 2,658.4

-15-
Consolidated statement of changes in equity
Share capital
£m
Share premium
£m
Translation reserve
£m
Other reserves*
£m
Retained earnings
£m
Total equity
£mAt 1 January 2011 113.3 133.9 57.5 9.8 481.9 796.4Profit for the period 80.6 80.6Actuarial loss on pension schemes (3.8) (3.8)Foreign currency translation differences for foreign operations 40.6
40.6
Loss taken to equity as a result of designated effective net investment hedges (9.2)
(9.2)
Gain recognised in cash flow hedge reserve 0.5 0.5Movement from cash flow hedge reserve to income statement
(0.6) (0.6)
Income tax credit on other comprehensive income 0.8
1.0 1.8
Total comprehensive income/(expense) 32.2 (0.1) 77.8 109.92010 interim dividend (16.6) (16.6)2010 final dividend (52.3) (52.3)Issue of share capital 0.4 1.0 1.4Employee trust shares (24.8) (24.8)Share based payments 3.1 3.1At 30 June 2011 113.7 134.9 89.7 9.7 469.1 817.1 At 1 January 2010 113.0 131.7 52.7 8.5 368.2 674.1Profit for the period 69.6 69.6Actuarial loss on pension schemes (19.5) (19.5)Foreign currency translation differences for foreign operations (35.1)
(35.1)
Gain taken to equity as a result of designated effective net investment hedges 6.2
6.2
Gain recognised in cash flow hedge reserve 1.1 1.1Movement from cash flow hedge reserve to income statement
1.5 1.5
Income tax credit/(charge) on other comprehensive income 2.0
(0.8) 6.3 7.5
Total comprehensive (expense)/income (26.9) 1.8 56.4 31.32009 interim dividend (21.4) (21.4)2009 final dividend (48.2) (48.2)Issue of share capital 0.1 1.5 1.6Employee trust shares 4.5 4.5Share based payments 2.2 2.2Scrip dividend 3.5 3.5At 30 June 2010 113.1 133.2 25.8 10.3 365.2 647.6
-16-
Consolidated statement of changes in equity (continued)
Share capital
£m
Share premium
£m
Translation reserve
£m
Other reserves*
£m
Retainedearnings
£m
Total equity
£mAt 1 January 2010 113.0 131.7 52.7 8.5 368.2 674.1Profit for the year 159.0 159.0Actuarial loss on pension schemes (2.5) (2.5)Foreign currency translation differences for foreign operations 1.1
1.1
Gain taken to equity as a result of designated effective net investment hedges 2.3
2.3
Gain recognised in cash flow hedge reserve 0.4 0.4Movement from cash flow hedge reserve to income statement
1.4
1.4
Income tax credit/(charge) on other comprehensive income 1.4
(0.5) 1.1 2.0
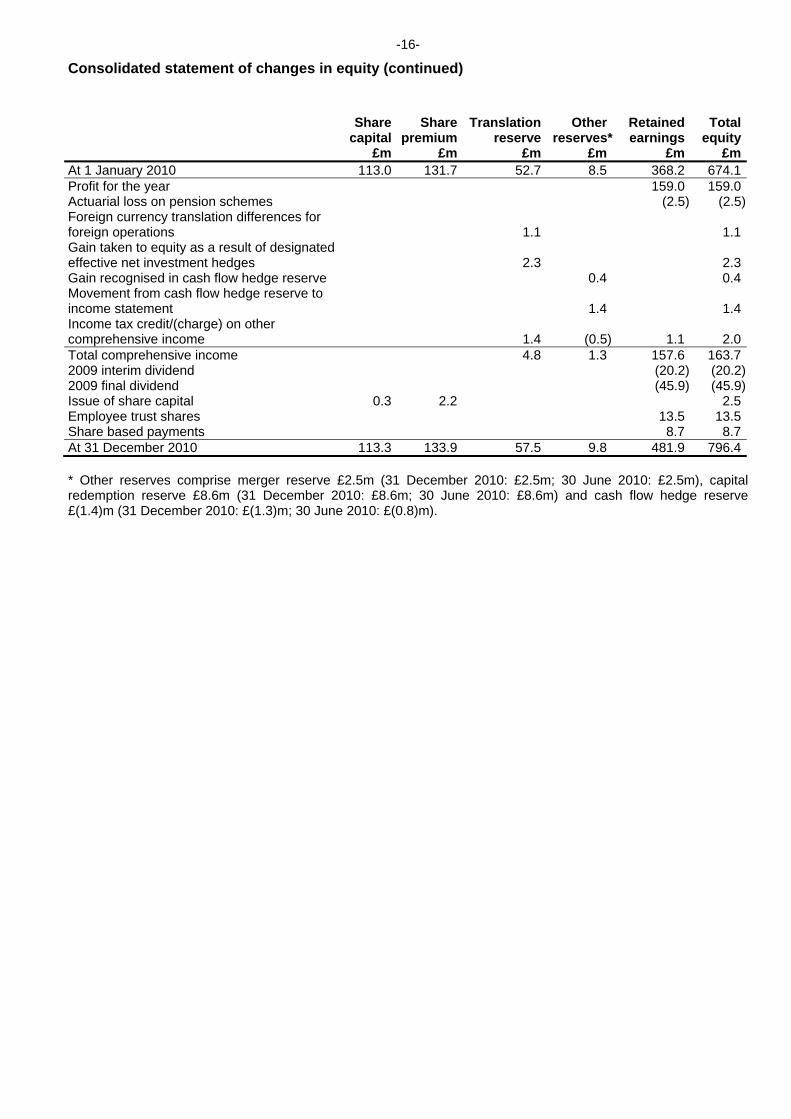
Total comprehensive income 4.8 1.3 157.6 163.72009 interim dividend (20.2) (20.2)2009 final dividend (45.9) (45.9)Issue of share capital 0.3 2.2 2.5Employee trust shares 13.5 13.5Share based payments 8.7 8.7At 31 December 2010 113.3 133.9 57.5 9.8 481.9 796.4 * Other reserves comprise merger reserve £2.5m (31 December 2010: £2.5m; 30 June 2010: £2.5m), capital redemption reserve £8.6m (31 December 2010: £8.6m; 30 June 2010: £8.6m) and cash flow hedge reserve £(1.4)m (31 December 2010: £(1.3)m; 30 June 2010: £(0.8)m).

-17-
Consolidated cash flow statement Six months to Six months to Year to 30.6.11 30.6.10 31.12.10 Notes £m £m £mCash flow from operating activities Profit before income tax 112.1 100.0 225.2Adjustments:
depreciation 13.2 12.1 25.5intangible amortisation and acquisition related costs
26.7
25.1
51.0
share based payments 2.2 3.0 4.7Working capital movement (19.6) (7.5) (12.7)Finance income (10.9) (10.4) (20.3)Finance cost 24.3 25.8 50.8Provisions and pensions (6.6) (4.4) (19.1)Other 0.2 0.2 2.5Cash generated from operations 141.6 143.9 307.6Cash outflow from acquisition related costs 9 (3.8) (5.8) (5.6)Income tax paid (29.1) (37.2) (79.7)Cash inflow from operating activities 108.7 100.9 222.3 Cash flow from investing activities Interest received 1.6 0.5 2.6Purchase of property, plant and equipment (11.9) (12.6) (23.4)Sale of property, plant and equipment 0.9 0.4 1.3Purchase of businesses 9 (52.2) (70.9) (105.0)Cash outflow from investing activities (61.6) (82.6) (124.5) Cash flow from financing activities Interest paid (15.7) (17.9) (33.8)Dividends paid (16.6) (20.0) (66.1)Increase in loans 12.3 7.6 15.1Realised (losses)/gains on foreign exchange contracts (13.1) 17.1 5.3Net proceeds from employee shares 4.8 4.6 11.8Purchase of own shares into trust (29.2) - -Cash outflow from financing activities (57.5) (8.6) (67.7) Exchange gain/(loss) on cash and cash equivalents 2.1 (0.5) 1.8 (Decrease)/increase in cash and cash equivalents (8.3) 9.2 31.9 Cash and cash equivalents at start of the period 74.9 43.0 43.0(Decrease)/increase in cash and cash equivalents (8.3) 9.2 31.9Cash and cash equivalents at end of the period 8 66.6 52.2 74.9

-18-
Notes 1. Basis of preparation The condensed set of financial statements for the six months to 30 June 2011, with comparative figures for the six months to 30 June 2010, is unaudited and does not constitute statutory accounts. However the auditors have carried out a review of the condensed set of financial statements and their report in respect of the six months to 30 June 2011 is set out in the Independent review report. The comparative figures for the year to 31 December 2010 do not constitute the Company’s statutory accounts for the year. Those accounts have been reported on by the Company’s auditors and delivered to the Registrar of Companies. The report of the auditors was unqualified, did not include a reference to any matters to which the auditors drew attention by way of emphasis without qualifying their report and did not contain statements under Section 498(2)(3) of the Companies Act 2006. The directors continue to believe that the Group has adequate resources to continue in operational existence for the foreseeable future and, therefore, that it is appropriate to continue to adopt the going concern basis in the preparation of the condensed set of financial statements. The condensed set of financial statements has been prepared on the basis of the accounting policies set out in the Group’s 2010 statutory accounts which were prepared in accordance with International Financial Reporting Standards as adopted by the EU (‘IFRS’), International Accounting Standard (‘IAS’) 34 ‘Interim Financial Reporting’ as adopted by the EU and the Disclosure and Transparency Rules of the UK’s Financial Services Authority. 2. Segment analysis Revenue Operating profit Six months to Six months to Year to Six months to Six months to Year to 30.6.11 30.6.10 31.12.10 30.6.11 30.6.10 31.12.10 £m £m £m £m £m £mNorth America 1,286.7 1,269.8 2,621.0 78.2 75.9 160.2UK & Ireland 485.6 493.7 1,007.1 25.8 25.6 59.5Continental Europe 526.1 459.1 936.4 44.8 37.4 79.9Rest of the World 143.6 122.5 265.1 12.2 10.2 23.8 2,442.0 2,345.1 4,829.6 161.0 149.1 323.4Corporate (8.8) (8.6) (16.7)Intangible amortisation and acquisition related costs
(26.7) (25.1) (51.0) 2,442.0 2,345.1 4,829.6 125.5 115.4 255.7 The amounts of intangible amortisation and acquisition related costs were as follows: Intangible amortisation Acquisition related costs Six months to Six months to Year to Six months to Six months to Year to 30.6.11 30.6.10 31.12.10 30.6.11 30.6.10 31.12.10 £m £m £m £m £m £mNorth America 3.4 3.8 7.5 0.4 - 1.0 UK & Ireland 4.0 3.9 7.8 0.7 - - Continental Europe 13.0 12.0 24.2 2.5 3.5 6.2 Rest of the World 2.2 1.9 4.0 0.5 - 0.3 22.6 21.6 43.5 4.1 3.5 7.5
Acquisition related costs for the six months to 30 June 2011 include transaction costs and expenses of £2.2m (31 December 2010: £5.5m; 30 June 2010: £3.0m) and deferred consideration payments which are contingent on the continued employment of former owners of businesses acquired of £1.9m (31 December 2010: £2.0m; 30 June 2010: £0.5m). The Group’s financial results have not historically been subject to significant seasonal trends.
-19-
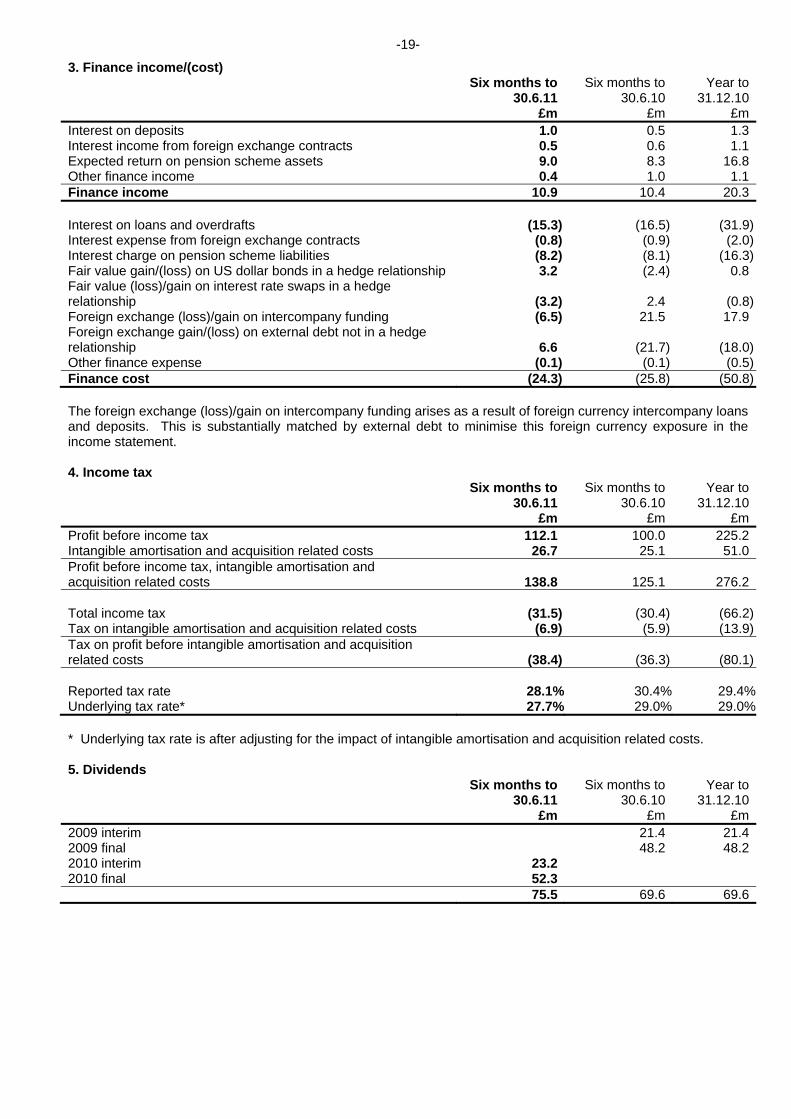
3. Finance income/(cost) Six months to Six months to Year to 30.6.11 30.6.10 31.12.10 £m £m £mInterest on deposits 1.0 0.5 1.3Interest income from foreign exchange contracts 0.5 0.6 1.1Expected return on pension scheme assets 9.0 8.3 16.8Other finance income 0.4 1.0 1.1Finance income 10.9 10.4 20.3 Interest on loans and overdrafts (15.3) (16.5) (31.9)Interest expense from foreign exchange contracts (0.8) (0.9) (2.0)Interest charge on pension scheme liabilities (8.2) (8.1) (16.3)Fair value gain/(loss) on US dollar bonds in a hedge relationship 3.2 (2.4) 0.8Fair value (loss)/gain on interest rate swaps in a hedge relationship
(3.2)
2.4 (0.8)
Foreign exchange (loss)/gain on intercompany funding (6.5) 21.5 17.9Foreign exchange gain/(loss) on external debt not in a hedge relationship 6.6 (21.7) (18.0)Other finance expense (0.1) (0.1) (0.5)Finance cost (24.3) (25.8) (50.8) The foreign exchange (loss)/gain on intercompany funding arises as a result of foreign currency intercompany loans and deposits. This is substantially matched by external debt to minimise this foreign currency exposure in the income statement. 4. Income tax Six months to Six months to Year to 30.6.11 30.6.10 31.12.10 £m £m £mProfit before income tax 112.1 100.0 225.2Intangible amortisation and acquisition related costs 26.7 25.1 51.0Profit before income tax, intangible amortisation and acquisition related costs 138.8
125.1
276.2
Total income tax (31.5) (30.4) (66.2)Tax on intangible amortisation and acquisition related costs (6.9) (5.9) (13.9)Tax on profit before intangible amortisation and acquisition related costs
(38.4) (36.3) (80.1)
Reported tax rate 28.1% 30.4% 29.4%Underlying tax rate* 27.7% 29.0% 29.0% * Underlying tax rate is after adjusting for the impact of intangible amortisation and acquisition related costs. 5. Dividends Six months to Six months to Year to 30.6.11 30.6.10 31.12.10 £m £m £m2009 interim 21.4 21.42009 final 48.2 48.22010 interim 23.22010 final 52.3 75.5 69.6 69.6

-20-
5. Dividends (continued) Total dividends per share for the period to which they relate are: Per share Six months to Six months to Year to 30.6.11 30.6.10 31.12.102010 interim 7.15p 7.15p2010 final 16.20p2011 interim 8.05p 8.05p 7.15p 23.35p The 2011 interim dividend of 8.05p will be paid on 3 January 2012 to shareholders on the register on 11 November 2011. 6. Earnings per share Six months to Six months to Year to 30.6.11 30.6.10 31.12.10 £m £m £mProfit for the period 80.6 69.6 159.0Adjustment 19.8 19.2 37.1Adjusted profit* 100.4 88.8 196.1 Basic weighted average ordinary shares in issue (million) 323.8 322.7 323.7Dilutive effect of employee share plans (million) 1.3 0.7 2.2Diluted weighted average ordinary shares (million) 325.1 323.4 325.9 Basic earnings per share 24.9p 21.6p 49.1pAdjustment 6.1p 5.9p 11.5pAdjusted basic earnings per share* 31.0p 27.5p 60.6p Diluted earnings per share 24.8p 21.5p 48.8pAdjustment 6.1p 5.9p 11.4pAdjusted diluted earnings per share* 30.9p 27.4p 60.2p * Adjusted profit, adjusted basic earnings per share and adjusted diluted earnings per share exclude the charge for intangible amortisation, acquisition related costs and the respective associated tax. The intangible amortisation and associated tax are non-cash charges which are not taken into account by management when assessing the underlying performance of the business. Similarly, the acquisition related costs and associated tax do not relate to the underlying performance of the entity acquired as they are a non-operational expense. Accordingly, such charges are removed in calculating the adjusted earnings per share on which management assess the performance of the Group.

-21-
7. Intangible assets Six months to Six months to Year to 30.6.11 30.6.10 31.12.10Goodwill £m £m £mBeginning of the period 789.0 749.4 749.4 Acquisitions 14.2 21.4 34.5 Currency translation 14.1 (5.0) 5.1 End of the period 817.3 765.8 789.0 Six months to Six months to Year to 30.6.11 30.6.10 31.12.10Customer relationships £m £m £mCost Beginning of the period 661.0 610.9 610.9Acquisitions 27.0 31.7 51.5Currency translation 21.5 (20.6) (1.4)End of the period 709.5 622.0 661.0Amortisation Beginning of the period 205.4 163.7 163.7Charge in the period 22.6 21.6 43.5Currency translation 7.1 (7.2) (1.8)End of the period 235.1 178.1 205.4 Net book value at end of the period 474.4 443.9 455.6 Total net book value of intangible assets at end of the period 1,291.7
1,209.7
1,244.6
Both goodwill and customer relationships have been acquired as part of business combinations. Customer relationships are amortised over their estimated useful lives which range from 10 to 19 years. Further details of acquisitions made in the period are set out in Note 9. 8. Cash and cash equivalents and net debt 30.6.11 30.6.10 31.12.10 £m £m £mCash at bank and in hand 71.5 49.7 57.4Short term deposits repayable in less than three months 19.7 14.0 26.5Cash and deposits 91.2 63.7 83.9Bank overdrafts (24.6) (11.5) (9.0)Cash and cash equivalents 66.6 52.2 74.9 Current liabilities (43.5) (112.9) (126.2)Non-current liabilities (771.1) (715.2) (691.5)Derivative assets – fair value of interest rate swaps on fixed interest rate borrowings 21.5
30.7
26.0
Interest bearing loans and borrowings (793.1) (797.4) (791.7)Net debt (726.5) (745.2) (716.8) Six months to Six months to Year to 30.6.11 30.6.10 31.12.10Movement in net debt £m £m £mBeginning of the period (716.8) (716.8) (716.8)Net cash (outflow)/inflow (9.6) (15.0) 9.7Realised (losses)/gains on foreign exchange contracts (13.1) 17.1 5.3Currency translation 13.0 (30.5) (15.0)End of the period (726.5) (745.2) (716.8)

-22-
9. Acquisitions 2011 The principal acquisitions made in the six months ended 30 June 2011 were Omega Hospitality, Cannon Consumables, Hospitality Depot, King Espana and SIG Safety and Workwear. Omega Hospitality, a business principally engaged in the supply of catering equipment and disposables to contract caterers, hotels and other foodservice customers in New South Wales, Australia, was acquired on 4 March 2011. Cannon Consumables, which is principally engaged in the supply of cleaning and hygiene consumable products to OCS Group UK Limited, as well as to a number of other customers throughout the UK, was acquired on 31 March 2011. Hospitality Depot, a business principally engaged in the distribution of catering equipment and supplies to hotels, restaurants and caterers as well as to aged care facilities and education establishments in New South Wales, Australia, was acquired on 6 May 2011. King Espana, a leading distributor of foodservice disposables and cleaning and hygiene supplies to the catering and cleaning sectors in Spain, was acquired on 26 May 2011. SIG Safety and Workwear, a leading distributor of personal protection equipment and workwear to a variety of market sectors throughout the UK, was acquired on 31 May 2011. Acquisitions have been accounted for under the purchase method of accounting, involving the purchase of 100% of the acquiree’s share capital or, as the case may be, all of the relevant assets of the businesses acquired. Part of the Group’s strategy is to grow through acquisition. The Group has developed a process to assist with the identification of the fair values of the assets acquired and liabilities assumed, including the separate identification of intangible assets in accordance with IFRS 3 ‘Business Combinations’. This formal process is applied to each acquisition and involves an assessment of the assets acquired and liabilities assumed with assistance provided by external valuation specialists where appropriate. Until this assessment is complete, the allocation period remains open up to a maximum of 12 months from the relevant acquisition date. As at 30 June 2011, the allocation period for all acquisitions completed since 1 January 2011 remained open and accordingly the fair values presented are provisional. Adjustments are made to the assets acquired and liabilities assumed during the allocation period to the extent that further information and knowledge come to light that more accurately reflect conditions at the acquisition date. To date the adjustments made have impacted assets acquired to reflect more accurately the estimated realisable or settlement value. Similarly adjustments are made to acquired liabilities to record onerous commitments or other commitments existing at the acquisition date but not recognised by the acquiree. Adjustments are also made to reflect the associated tax effects. The consideration paid or payable in respect of acquisitions comprises amounts paid on completion, deferred consideration and payments which are contingent on the continued employment of former owners of businesses acquired. IFRS 3 requires that any such payments that are contingent on future employment are charged to the income statement. All other consideration has been allocated against the identified net assets, with the balance recorded as goodwill. Transaction costs and expenses such as professional fees are charged to the income statement. The acquisitions provide opportunities for further development of the Group’s activities and create enhanced returns. Such opportunities and the workforces inherent in each of the acquired businesses do not translate to separately identifiable intangible assets but do represent much of the assessed value that supports the recognised goodwill.

-23-
9. Acquisitions (continued) A summary of the effect of acquisitions is detailed below:
Book value at acquisition
£m
Provisional fairvalue adjustments
£m
Fair valueof assetsacquired
£mIntangible assets 27.0 27.0Property, plant and equipment 2.2 (0.2) 2.0Inventories 9.6 (1.0) 8.6Trade and other receivables 15.1 - 15.1Trade and other payables (11.2) (0.5) (11.7)Net bank overdrafts (0.6) (0.6)Provisions for liabilities and charges - (1.0) (1.0)Tax and deferred tax 0.2 (4.7) (4.5) 15.3 19.6 34.9Goodwill 14.2Consideration 49.1Satisfied by: cash consideration 45.4 deferred consideration 3.7 49.1Contingent payments to former owners 2.3Net bank overdrafts acquired 0.6Transaction costs and expenses 2.2Total expected spend in respect of current year acquisitions 54.2 The net cash outflow in the period in respect of acquisitions comprised: Cash consideration 45.4Net bank overdrafts acquired 0.6Deferred consideration in respect of prior year acquisitions 6.2Net cash outflow in respect of acquisitions 52.2Acquisition related costs 3.8Total cash outflow in respect of acquisitions 56.0 Acquisitions made during the six months to 30 June 2011 contributed £12.8m to the Group’s revenue and £0.7m to the Group’s operating profit before intangible amortisation and acquisition related costs. The estimated contributions of acquired businesses to the results of the Group, as if the acquisitions had been made at the beginning of the year, are as follows: £mRevenue 42.3Operating profit before intangible amortisation and acquisition related costs 2.9 2010 The principal acquisitions made in the year to 31 December 2010 were Clean Care, Hamo, Weita, Silco, Juba, Global Net, A.M. Supply, Cool-Pak and Van’t Veer Verpakkingen. Clean Care, a business principally engaged in the supply of cleaning and hygiene consumable products in Denmark, was acquired on 15 January 2010. Hamo, a distributor of catering disposables and light catering equipment to customers in both the public and private sectors, was acquired on 12 February 2010. Weita, a supplier of cleaning and hygiene, foodservice, retail, healthcare and safety consumables products to both end users and redistributors in Switzerland, was acquired on 12 March 2010. Silco, a supplier of foodservice disposables in Israel, was acquired on 21 April 2010. Juba, a supplier of personal protection equipment to redistributors throughout Spain, was acquired on 27 May 2010. Global Net, which sells cleaning and hygiene consumables and equipment to contract cleaners, local authorities and other industrial customers throughout the Walloon region of Belgium, was acquired on 1 July 2010. A.M. Supply, which supplies personal protection equipment to the oil and petrochemical sector in the state of Rio de Janeiro in Brazil, was acquired on 26 August 2010. Cool-Pak, a leading distributor of plastic and pulp packaging to fruit and vegetable growers in the US, was acquired on 30 August 2010. Van’t Veer Verpakkingen, a business supplying cleaning and hygiene and catering disposable products in the Netherlands predominantly to the healthcare sector, was acquired on 1 October 2010.

-24-
10. Events after the balance sheet date Netpak, which is principally engaged in the supply of packaging supplies and equipment to a variety of sectors throughout Canada, was acquired on 26 July 2011. On 25 August 2011 the Company entered into an agreement to acquire Majestic Products which is principally engaged in the supply of personal protection equipment and safety products to customers in the Benelux and the US. Completion of the acquisition is subject to clearance from the competition authority in the Netherlands. The Company disposed of its UK vending business on 26 August 2011 which will generate a net cash inflow of approximately £30 million. Revenue of the business was £33.2 million in the six months to 30 June 2011 and in the same period the operating profit before intangible amortisation was £nil. Based on the estimated net assets disposed of, a loss of approximately £55 million is expected to arise which will be recorded in the financial statements for the year ending 31 December 2011. 11. Related party transactions As disclosed in the Annual Report for the year to 31 December 2010, the Group has identified the directors of the Company, its key management and the Group pension schemes as related parties for the purpose of IAS 24 ‘Related Party Disclosure’. There have been no significant changes in those related parties identified at the year end and there have been no transactions with those related parties during the six months to 30 June 2011 that have materially affected or are expected to materially affect the financial position or performance of the Group during this period. Details of the relevant relationships with those related parties will be disclosed in the Annual Report for the year ending 31 December 2011. All transactions with subsidiaries are eliminated on consolidation. Responsibility statement of the directors in respect of the half yearly financial report We confirm that to the best of our knowledge: the condensed set of financial statements has been prepared in accordance with IAS 34 ‘Interim Financial
Reporting’ as adopted by the EU; the half yearly financial report includes a fair review of the important events during the first six months of the
year, and their impact on the condensed set of financial statements, and a description of principal risks and uncertainties for the remaining six months of the year as required by Disclosure and Transparency Rule (‘DTR’) 4.2.7R; and
the half yearly financial report includes a fair review of the disclosure of related party transactions and changes therein as required by DTR 4.2.8R.
For and on behalf of the Board Michael Roney Chief Executive
Brian May Finance Director
30 August 2011

-25-
Independent review report by KPMG Audit Plc to Bunzl plc Introduction We have been engaged by the Company to review the condensed set of financial statements in the half yearly financial report for the six months to 30 June 2011 which comprises the consolidated income statement, the consolidated statement of comprehensive income, the consolidated balance sheet, the consolidated statement of changes in equity, the consolidated cash flow statement and the related explanatory notes. We have read the other information contained in the half yearly financial report and considered whether it contains any apparent misstatements or material inconsistencies with the information in the condensed set of financial statements. This report is made solely to the Company in accordance with the terms of our engagement to assist the Company in meeting the requirements of the Disclosure and Transparency Rules (‘the DTR’) of the UK's Financial Services Authority (‘the UK FSA’). Our review has been undertaken so that we might state to the Company those matters we are required to state to it in this report and for no other purpose. To the fullest extent permitted by law, we do not accept or assume responsibility to anyone other than the Company for our review work, for this report or for the conclusions we have reached. Directors' responsibilities The half yearly financial report is the responsibility of, and has been approved by, the directors. The directors are responsible for preparing the half yearly financial report in accordance with the DTR of the UK FSA. As disclosed in Note 1, the annual financial statements of the Group are prepared in accordance with International Financial Reporting Standards as adopted by the EU. The condensed set of financial statements included in this half yearly financial report has been prepared in accordance with International Accounting Standard (‘IAS’) 34 ‘Interim Financial Reporting’ as adopted by the EU. Our responsibility Our responsibility is to express to the Company a conclusion on the condensed set of financial statements in the half yearly financial report based on our review. Scope of review We conducted our review in accordance with International Standard on Review Engagements (UK and Ireland) 2410 ‘Review of Interim Financial Information Performed by the Independent Auditor of the Entity’ issued by the Auditing Practices Board for use in the UK. A review of half yearly financial information consists of making enquiries, primarily of persons responsible for financial and accounting matters, and applying analytical and other review procedures. A review is substantially less in scope than an audit conducted in accordance with International Standards on Auditing (UK and Ireland) and consequently does not enable us to obtain assurance that we would become aware of all significant matters that might be identified in an audit. Accordingly, we do not express an audit opinion. Conclusion Based on our review, nothing has come to our attention that causes us to believe that the condensed set of financial statements in the half yearly financial report for the six months to 30 June 2011 is not prepared, in all material respects, in accordance with IAS 34 as adopted by the EU and the DTR of the UK FSA.
M V Maloney for and on behalf of KPMG Audit Plc Chartered Accountants 15 Canada Square London E14 5GL 30 August 2011