News Consumption in the UK: 2018 · The most popular types of news content children are most...
151
1 PROMOTING CHOICE • SECURING STANDARDS • PREVENTING HARM News Consumption in the UK: 2018 Produced by: Jigsaw Research Fieldwork dates: November/December 2017 and March/April 2018
Transcript of News Consumption in the UK: 2018 · The most popular types of news content children are most...

1PROMOTING CHOICE • SECURING STANDARDS • PREVENTING HARM
News Consumption in the UK: 2018
Produced by: Jigsaw Research
Fieldwork dates: November/December 2017 and March/April 2018

2
2
Key findings from the reportTV is the most-used platform for news nowadays by UK adults (79%), followed by the internet (64%), radio
(44%) and newspapers (40%). However, the internet is the most popular platform among 16-24s (82%) and ethnic minority groups (EMGs) (73%).
BBC One is the most-used news source, used by 62% of UK adults, followed by ITV (41%) and Facebook (33%). BBC One also had the highest proportion of respondents claiming it was their most important news source (27% of users).
Social media is the most popular type of online news, used by 44% of UK adults. However, while lots of people are able to recall the social media site they consumed the news on, some struggle to remember the original source of the news story.
TV is the most popular platform for accessing international and local news. In the Nations, BBC One is the most-used source for news in Wales, Scotland and England, but UTV is the most popular in Northern Ireland.
Six in ten (63%) UK adults thought that it was important for ‘society overall’ that broadcasters provide current affairs programming. This was more than those who felt it was important to them personally (51%).
When scored by their users on measures of quality, accuracy, trustworthiness and impartiality (among other things) magazines perform better than any other news platform. Scores were lower among users of social media
Overall, six in ten children aged 12-15 claim to be interested in news. This means that four in ten are not interested in news, with the main reason being that it is ‘too boring’ and that it is ‘not relevant for people my age’.
Similar to adults, TV is the most popular platform for news consumption and BBC One is the most popular source. The most popular types of news content children are most interested in are sports/sports personalities
(19%) and music news/singers/musicians (18%).

3
News Consumption Survey: how to use this data
Because of the changes we have made to the 2018 News Consumption Survey, it is not possible to make direct comparisons to previous data. We are not able to identify whether differences between 2018 and historic data are a result of methodological changes or actual changes in the way people consume or feel about news.
While we regret the loss of trend data, the changes we have made will result in more robust data overall. We will be able to compare this year’s data with that collected in future years.
Changes to the 2018 news survey have included:
1) An increased questionnaire length which has allowed us to ask additional questions relating to social media and current affairs.
2) A larger sample allowing analysis of sub-groups such as some faith groups and ethnic minorities.
3) A new methodology using both online and face-to-face interviews, therefore representing heavy online news consumers better.
4) An extended sampling period minimising the effect of seasonality as well as mitigating the possibility of major news events during fieldwork effecting the results.
5) Changes to existing questions meaning that the survey is now more relevant and future-proofed.
Further detail on how and why we changed the methodology can be found on slide 143.
4
Introduction
• This report provides the findings of Ofcom’s 2017/18 research into news consumption across television, radio, print, social media, other internet sources and magazines. It is published as part of our range of market research reports examining the consumption of content, and attitudes towards that content, across different platforms.
• The aim of this slide pack report is to inform understanding of news consumption across the UK and within each UK nation. This includes sources and platforms used, the perceived importance of different outlets for news, attitudes to individual news sources, international and local news use, and news consumption in the nations.
• This slide pack also provides an understanding of current affairs consumption among adults and news consumption among 12-15 year olds.
• The primary source is Ofcom’s News Consumption Survey. The report also contains information from a range of industry currencies including:– BARB for television viewing– TouchPoints for newspaper readership and statements about online news– ABC for newspaper circulation– comScore for online consumption
• In addition to the findings detailed in this report, we also recently published the findings from two qualitative research reports. The first report ‘The Changing World of News’ looked at why people choose the news sources they use, what they are looking for from news sources and how expectations vary, as well as whether they are fatigued or depressed by the news. The second report ‘Scrolling news: The changing face of online news consumption’ explored in more detail how people navigate online news including how people get to their online news sources, what they mean when they say they use social media for news and whether they actively seek out news on social media. Both reports can be accessed here: https://www.ofcom.org.uk/research-and-data/tv-radio-and-on-demand/news-media/navigating-news-online
5
• BARB (Broadcasters’ Audience Research Board) is the official industry currency for TV consumption. It uses a continuous panel of approximately 5,100 UK homes and tracks television viewing among all people aged 4+ in these homes using meters attached to every working television set in the home.
• TouchPoints 2017 is an annual survey commissioned by the Institute of Practitioners in Advertising (IPA). With a sample of c.6,000 adults 15+ across Great Britain it uses a seven-day diary to capture media consumption and other daily activities every half hour. In addition, it also uses a self-completion questionnaire which includes attitudinal statements and other behavioural questions
• ABC (Audit Bureau of Circulation) publishes verified newspaper circulation figures, based on sales information provided by publishers.
• comScore is an organisation that provides online audience measurement. It is endorsed by UKOM, the body that sets and governs the UK standard for the online industry. comScore uses a hybrid measurement approach to online audience measurement which consists of both panel and census data.
Industry currencies used in the report

6PROMOTING CHOICE • SECURING STANDARDS • PREVENTING HARM
Contents
Slide Section
7 1. Overall summary of findings
12 2. Platforms used for news nowadays
19 3. Cross-platform news consumption
25 4. News consumption via television
34 5. News consumption via radio
38 6. News consumption via newspapers
45 7. News consumption via social media
59 8. News consumption via other internet sources
70 9. News consumption via magazines
74 10. Multi-sourcing
79 11. Share of reference
84 12. Importance of sources and attitudes towards news
100 13. International news
102 14. Local news
105 15. News consumption in the nations
117 16. Current affairs
122 17. How children aged 12-15 consume news
142 18. Appendix – methodology and respondent profile

7PROMOTING CHOICE • SECURING STANDARDS • PREVENTING HARM
Section 1Overall summary of findings

8
TV is the most-used platform for news nowadays (79%), followed by the internet (64%), radio (44%) and newspapers (40%). However, for those aged 16-24 and for ethnic minority groups (EMG), the internet is the most-used platform. Eight in ten (82%) of those aged 16-24 use the internet for news nowadays, compared to just six in ten (57%) that use TV, while for EMGs, 73% use the internet for news and 69% use TV. Those aged 65+ are more likely than 16-24s to use all platforms for news, except for the internet, and TV news use among this age group is almost ubiquitous (94%). ABC1s are more likely than C2DEs to use the internet, radio and newspapers for news nowadays.
BBC One is the most important news source, used by 62% of UK adults, followed by ITV and Facebook. When looking across all platforms, UK adults say they use an average of 6.7 individual sources for news nowadays. The most popular source is BBC One which is used by 62% of all UK adults, followed by ITV (41%) then Facebook (33%). As the most-used platform for news nowadays, television clearly remains central to people’s news consumption, with seven TV sources appearing in the top 20 most-used source list, more than any other platform (four social media sites, four newspaper titles, three radio stations and two websites/apps also appeared in the top 20 most-used source list). When these sources are grouped into wholesale categories, the BBC has the highest audience reach (81%), followed by ITN/ITV (53%/45%), Sky (27%), DMGT (25%) and News Corp (20%).
BBC One also had the highest proportion of respondents claiming it was their most important news source (27%). This was followed by ITV (10%), Facebook (8%) and the BBC website/app (6%). At a platform level, measures of quality, accuracy, trustworthiness and impartiality (among other things) are strongest among readers of magazines and weakest among users of social media. Four in ten (39%) users of social media for news said they thought it was impartial, compared to 77% among users of magazines, 63% for TV users and 59% for radio users. Similarly, 39% of users found social media a trustworthy source of news, compared to 80% of magazines users and 70% and 66% of users who trust TV and radio respectively. This could be linked to findings in the qualitative research that suggest many people are aware of, and concerned about, fake news, which they were particularly likely to associate with social media. However, few in the qualitative research were able to articulate what fake news is or what it looks like in practice.
Overall summary – Adults (1)

9
Overall 64% of UK adults say they use the internet for news. However, qualitative research suggests that the frequency with which people consume online news could be under-reported. Many people most readily associate the term ‘news’ with traditional sources, such as those in newspapers and on TV, as opposed to online. People are also not always fully aware of how much time they spend consuming news online as much of this is processed unconsciously, when people are exposed to news stories without realising it. Also, Smartphones and social media typically mix news with other types of content, which can sometimes lead to people not being aware they are consuming news. These factors can lead to people under-estimating their online news consumption.
Social media is the most popular type of online news, used by 44% of UK adults, compared to 37% that use any other type of internet source. Social media is now used by 44% of people to access news. However, while lots of people can recall the social media site they consumed the news on (e.g. 76% of respondents said they used Facebook for news nowadays), some struggle to remember the original source of the news story. For instance, 43% of those who used Facebook for news said they only knew the original source of news stories posted by other people they follow on Facebook ‘some of the time’. Qualitative research suggests that this may be partly because social media sites display news content from a wide range of different sources and alongside other types of content, making it harder to distinguish news from other kinds of content and to identify the original source.
TV is the most popular platform for accessing international and local news. TV is the most popular platform for accessing international news, used by 62% of UK adults, followed by radio (25%) or printed newspapers (24%). Four in five users of those platforms said they are satisfied with the quality of the news provided through these platforms. One in five (18%) said they use social media for international news, however only two thirds (65%) of these respondents said they are satisfied with the quality of the news provided. TV is also the most popular platform for accessing local news. Half of all adults say they watch regional and local broadcasts on BBC TV (48%) and one third, ITV (32%). More than four in five of these viewers are satisfied with the quality of news that these channels provide.
Overall summary – Adults (2)

10
In the Nations, BBC One is the most used source for news in Wales, Scotland and England, while UTV is most popular in Northern Ireland. Facebook is the third most popular source across all Nations. Welsh respondents are most likely to say they’re interested in news about their Nation (55% vs. 49% in Scotland, 37% in NI and 32% in England).
Six in ten thought it was important for ‘society overall’ that broadcasters provide current affairs programmingSixty-three per cent of UK adults feel that it is important ‘to society overall’ that broadcasters provide current affairs programmes, more than say it is important to them personally (51%). Two thirds claim to watch current affairs programmes on TV, with one in five listening to current affairs programmes on the radio. Three quarters (72%) of those watching on TV do so on BBC One. Two fifths (40%) of those listening on the radio do so on BBC Radio 4.
Overall summary – Adults (3)

11
Overall, six in ten children aged 12-15 claim to be either ‘very’ or ‘quite’ interested in news, which means that four in ten said they were either ‘not very’ or ‘not at all’ interested. Children engage with news to understand what is happening in the world around them (53% said they follow the news because ‘it’s important to know what’s going on’). Three-quarters of 12-15s said they consume news on a weekly basis and three-fifths said they are actively looking for news. Among those who said they were not interested in the news, the main reason was because it ‘is too boring’ (41%). A further quarter (23%) of children who were not interested in news said it was not relevant for people their age and 13% said it was too upsetting. This was a running themethat was also observed among adults in the qualitative research, with people noting that they felt miserable after consuming news as they felt it always focused on negative events. Parents also told us that, in some instances, they would shield theirchildren from the news when a story was broadcast that they felt was inappropriate for their child to hear e.g. the reporting of a rape case on the lunchtime radio bulletin.
As with adults, TV is the most popular platform for news consumption and BBC One, the most popular source. The most popular type of news content that children are most interested in is sports/sports personalities (19%) and music news/singers/musicians (18%). When asked which platform they use most often for news, TV was the most popular (29%), followed by social media (22%) and talking to family (15%). Social media was used most often for celebrity, music and fashion news, while TV wasused most often for all other types of news content. The most popular news source across platforms is BBC One/Two (45%), followed by Facebook (34%), then ITV (30%) and YouTube (27%). 12-15 year olds are most likely to find out about TV sources / theBBC website/app from parent(s), and find out about social media sources from friends.
Family, radio and TV are perceived to be the most truthful sources. Eighty-two per cent of 12-15s said that the news they heard from family was either ‘always’ or ‘mostly’ true, compared to 77% for radio and 73% for TV. Only one in three (34%) think news stories on social media are reported truthfully. Similar numbers (36%) say they normally think about whether a news story they see on social media is true. Three quarters (78%) claim to have heard about ‘fake news’ and say they’re aware of its meaning (74%). Two in five (43%) claim to have seen a ‘fake news’ story.
Overall summary – 12-15 year olds

12PROMOTING CHOICE • SECURING STANDARDS • PREVENTING HARM
Section 2Platforms used for news nowadays

13
• TV is the most-used platform for news nowadays (79%), followed by the internet (64%). Radio (44%) and newspapers (40%) are next most used.– A greater proportion of adults claim to use social media for news nowadays (44%)
than all ‘other’ internet sources (37%). • There are a number of differences in platforms used for news by demographic group:
– Almost all (94%) of those aged 65+ say they use the TV for news nowadays compared to around six in ten (57%) 16-24s. Those aged 65+ are also more likely to be using newspapers and radio for news than those aged 16-24, while the younger age group are more likely to use the internet.
– The ABC1 socio-economic group are more likely to use internet, radio and newspapers for news than C2DEs, but are just as likely to use TV.
– EMGs (ethnic minority groups) are more likely to use the internet for news than non-EMGs, but are less likely to use TV and radio.
• One in seven adults (14%) use all four main platforms for news (i.e. TV, radio, newspapers and the internet). One in ten uses only TV (10%) or only the internet (10%) for news.
• With the exception of celebrity news, TV is used most often for all types of news content.
Summary – platforms used for news nowadays
14
14
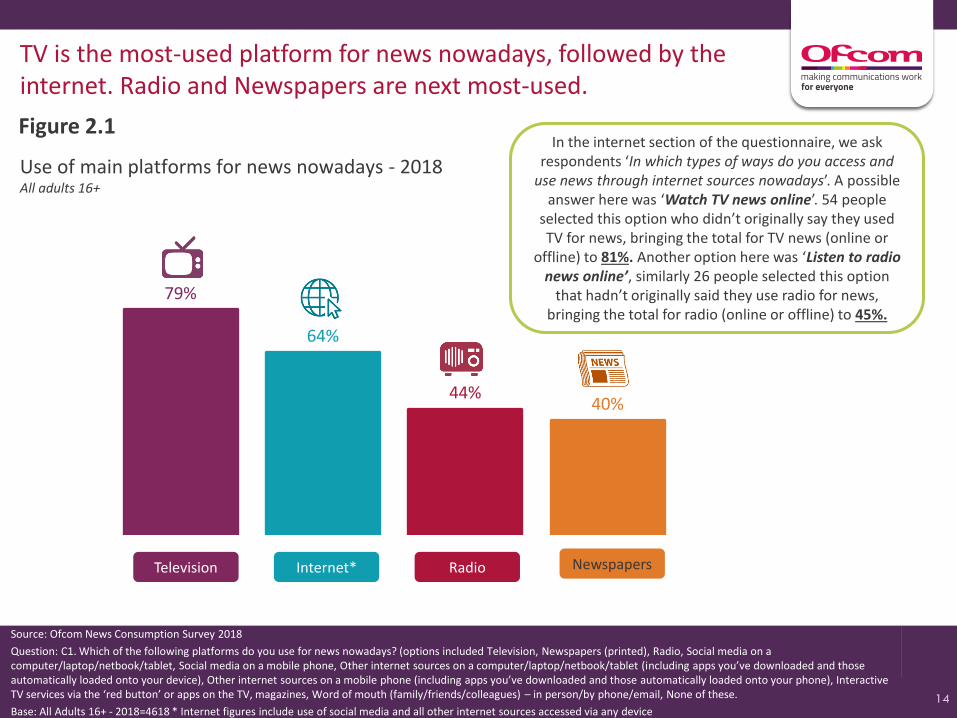
TV is the most-used platform for news nowadays, followed by the internet. Radio and Newspapers are next most-used.
Use of main platforms for news nowadays - 2018All adults 16+
79%
64%
44%40%
Source: Ofcom News Consumption Survey 2018
Question: C1. Which of the following platforms do you use for news nowadays? (options included Television, Newspapers (printed), Radio, Social media on a computer/laptop/netbook/tablet, Social media on a mobile phone, Other internet sources on a computer/laptop/netbook/tablet (including apps you’ve downloaded and those automatically loaded onto your device), Other internet sources on a mobile phone (including apps you’ve downloaded and those automatically loaded onto your phone), Interactive TV services via the ‘red button’ or apps on the TV, magazines, Word of mouth (family/friends/colleagues) – in person/by phone/email, None of these.
Base: All Adults 16+ - 2018=4618 * Internet figures include use of social media and all other internet sources accessed via any device
NewspapersRadioInternet*Television
Figure 2.1In the internet section of the questionnaire, we ask
respondents ‘In which types of ways do you access and use news through internet sources nowadays’. A possible
answer here was ‘Watch TV news online’. 54 people selected this option who didn’t originally say they used TV for news, bringing the total for TV news (online or
offline) to 81%. Another option here was ‘Listen to radio news online’, similarly 26 people selected this option
that hadn’t originally said they use radio for news, bringing the total for radio (online or offline) to 45%.

15
15
Use of main platforms for news nowadays 2018 - by demographic groupAll adults 16+
Source: Ofcom News Consumption Survey 2018
Question: C1. Which of the following platforms do you use for news nowadays?
Base: All Adults 16+ 2018 - Total=4618, Male=2194, Female=2417, 16-24=631, 65+=990, ABC1=2502, C2DE=2110, EMG=722, Non-EMG=3880
Green shading indicates significant differences between groups * Internet figures include use of social media and all other internet sources accessed via any device
Total Male Female 16-24 65+ ABC1 C2DE EMG Non-EMG
Television 79% 79% 80% 57% 94% 79% 80% 69% 81%
Internet (any device)* 64% 64% 64% 82% 38% 68% 59% 73% 62%
Radio 44% 45% 43% 24% 54% 47% 40% 35% 46%
Newspapers (printed) 40% 41% 38% 21% 60% 43% 36% 40% 40%
While those aged 65+ are more likely to use TV, radio and newspapers for news nowadays, 16-24s are more likely to use the internet. ABC1s are more likely to use all main platforms, with the exception of TV.
Figure 2.2

16
16
Cross-over use of four main platforms for news nowadays - 2018All adults 16+
Source: Ofcom News Consumption Survey 2018
Question: C1. Which of the following platforms do you use for news nowadays?
Base: All Adults 16+ 2018 - Total=4618
* Internet figures include use of social media and all other internet sources accessed via any device
One in seven adults claim to use all four of the main platforms for news, while one in ten use only the TV or only the internet for news.
Television79%
Radio44%
Internet*
64%
Newspapers40%
None of these = 3%
10%
16%
10%
1%
6%
1%
1%
2%
11%
3%
1%
14%
8%
6%
8%
Figure 2.3

17
17
A greater proportion of adults claim to use social media for news nowadays than other internet sources. Use of social media for news is equally common on a mobile vs other devices.
79%
64%
44%
37%
44%
40%
30%
11%
9%
2%
Television
Any internet
… social media
… other internet
Radio
Newspapers (printed)
Word of mouth
Magazines (printed)
Interactive TV services
None of these
All platforms used for news nowadays – 2018All adults 16+
34% 31%
20% 28%
Access viamobile
Access via desktop/ laptop/ tablet
Figure 2.4
Cross-over use of Social Media and Other internet
Social Media(44% of UK adults in total said they use
social media for news nowadays)
Other internet(37% of UK adults in
total said they use any other type of internet
sources for news nowadays)
27% 17% 20%
Just social media Just other internetBoth
Source: Ofcom News Consumption Survey 2018
Question: C1. Which of the following platforms do you use for news nowadays? (options included Television, Newspapers (printed), Radio, Social media on a computer/laptop/netbook/tablet, Social media on a mobile phone, Other internet sources on a computer/laptop/netbook/tablet (including apps you’ve downloaded and those automatically loaded onto your device), Other internet sources on a mobile phone (including apps you’ve downloaded and those automatically loaded onto your phone), Interactive TV services via the ‘red button’ or apps on the TV, magazines, Word of mouth (family/friends/colleagues) – in person/by phone/email, None of these.
Base: All Adults 16+ - 2018=4618

18
18
Platforms used most often for different types of news content – 2018All adults 16+ who follow news
52%45% 45%
38%45%
40%31% 29%
17%
14%
17% 20%
14%
11%
10%
9% 10%
18%
15%18%
18%
11%
15%
12%
14%10%
8%
8% 7%8%
10%4%
6%
4%
4%
2%
7% 8%2%
14% 7%
9%
11%
7%
5%
4%
1%2%
3% 4% 4% 7%15%
22%28%
38%47%
UKnews
Headlinenews
Breakingnews
Localnews
Foreign/international
news
Politicalnews
In-depthanalysis
Sports Celebritynews
Not interested in this type of news
Interactive TV services
Magazines (printed)
Word of mouth
Newspapers (printed)
Radio
Other internet
Social media
Television
TV is used most often for all types of news content (with the exception of celebrity). Social media is more likely to be used for breaking, celebrity and headline news.
Source: Ofcom News Consumption Survey 2018
Question: D1. Where do you tend to go most often for each of the following types of news content?
Base: All adults 16+ who follow news 2018 – Total=4523
Figure 2.5
19PROMOTING CHOICE • SECURING STANDARDS • PREVENTING HARM
Section 3Cross-platform news consumption

20
• The most popular news source across platforms is BBC One (62%), followed by ITV (41%) then Facebook (33%). The BBC News Channel (26%), Sky News Channel (24%) and BBC website/app (23%) are the next most popular sources.
• There are seven TV sources in the top 20, the most of all platforms.• There are considerable differences by demographic group, For example
– Those aged 65+ are twice as likely as 16-24s to say they use BBC One for news (82% vs. 39%), and ITV (53% vs. 27%), while 16-24s are much more likely to use Facebook (52% vs. 12%) and Twitter (30% vs. 2%) and the other social media platforms.
– Those in the ABC1 and EMG groups are more likely to use more news sources for news than are C2DEs and non-EMGs.
• The BBC has the highest cross-platform audience reach (81%), followed by ITN/ITV (53%/45%), Sky (27%), DMGT (25%) and News Corp (20%).
Summary – cross-platform news consumption

21
21
2018
BBC One 62%
ITV/ITV WALES/UTV/STV 41%
Facebook 33%
BBC News Channel 26%
Sky News Channel 24%
BBC website/app 23%
Channel 4 18%
Google (search engine) 17%
Twitter 14%
BBC Two 14%
Daily Mail 12%
BBC Radio 2 12%
Channel 5 10%
BBC Radio 4 10%
WhatsApp 10%
Instagram 9%
The Metro 9%
BBC Radio 1 9%
The Sun 8%
Mail on Sunday 8%
Top 20 news sources - 2018% of all adults 16+ using each source for news nowadays
Source: Ofcom News Consumption Survey 2018
Question: D2a-8a. Thinking specifically about <platform>, which of the following do you use for news nowadays?
Base: All adults 16+ –2018=4618
The most popular news source across platforms is BBC One, followed by ITV, Facebook, then the BBC News and Sky News Channels.
Social media
Radio station
Newspaper
TV Channel
Website/app
Figure 3.1

22
22
Top 20 news sources 2018 - by demographic group% of all adults 16+ using each source for news nowadays
Source: Ofcom News Consumption Survey 2018
Question: D2a-8a. Thinking specifically about <platform>, which of the following do you use for news nowadays?
Base: All adults 16+ 2018 - Total=4618, Male=2194, Female=2417, 16-24=631, 65+=990, ABC1=2502, C2DE=2110, EMG=722, Non-EMG=3880
Green shading indicates significant differences between groups
Total Male Female 16-24 65+ ABC1 C2DE EMG Non-EMG
BBC One 62% 62% 62% 39% 82% 64% 61% 49% 65%
ITV/ITV WALES/UTV/STV 41% 38% 45% 27% 53% 35% 49% 28% 44%
Facebook 33% 30% 36% 52% 12% 32% 34% 34% 33%
BBC News Channel 26% 29% 24% 15% 32% 29% 24% 31% 25%
Sky News Channel 24% 27% 21% 16% 20% 25% 23% 30% 23%
BBC website/app 23% 28% 19% 21% 17% 29% 17% 23% 24%
Channel 4 18% 17% 18% 14% 17% 18% 18% 24% 16%
Google (search engine) 17% 19% 16% 17% 10% 20% 14% 20% 17%
Twitter 14% 15% 13% 30% 2% 15% 12% 20% 13%
BBC Two 14% 15% 12% 9% 19% 14% 13% 16% 13%
Daily Mail 12% 12% 12% 5% 22% 13% 11% 13% 12%
BBC Radio 2 12% 11% 12% 4% 17% 13% 10% 5% 13%
Channel 5 10% 10% 10% 7% 11% 9% 12% 17% 9%
BBC Radio 4 10% 11% 9% 1% 20% 13% 6% 5% 11%
WhatsApp 10% 10% 10% 16% 2% 11% 9% 22% 7%
Instagram 9% 8% 10% 26% 1% 9% 9% 20% 7%
The Metro 9% 9% 9% 5% 9% 10% 7% 17% 7%
BBC Radio 1 9% 9% 9% 12% 4% 9% 8% 10% 8%
The Sun 8% 9% 8% 6% 8% 6% 11% 9% 8%
Mail on Sunday 8% 8% 8% 2% 16% 9% 7% 6% 8%
Those aged 65+ are twice as likely as 16-24s to use BBC One and ITV, while 16-24s are more likely to use social media platforms. ABC1s and EMGs are more likely to use the majority of news sources than are C2DEs and non-EMGs.Figure 3.2

23
23
At a wholesale level, the BBC has the highest cross-platform audience reach, followed by ITN, then Sky and DMGT.
81%
53%
27% 25%20% 18%
11% 10% 9% 8% 8% 7%4% 2%
34%
21%
14% 12%
WHOLESALE
Intermediaries
Cross-platform wholesale providers used for news nowadays - 2018All adults 16+ using TV/Newspapers/Radio/Internet/Magazines for news
Source: Ofcom News Consumption Survey 2018Question: D2a-8a. Thinking specifically about <platform>, which of the following do you use for news nowadays?Base: All adults 16+ using TV/Newspapers/Radio/Internet/Magazines for news – 2018=4479NOTE: ‘Google’= Google News + Google + YouTube. ‘Other intermediary’ includes MSN, Yahoo, AOL, Flipboard, NewsNow. We distinguish between retail news provision (the individual title or brand of each news source that provides content to the user e.g. ITV News) and wholesale news provision (the supply and production of the news for a retail news source e.g. ITN).
Figure 3.3
*In some circumstances, ITV is also a wholesale provider and is included in ITN

24
24
At a retail level, the BBC also has the highest cross-platform audience reach, followed by ITV, then Sky and DMGT.
81%
45%
27% 25%20% 19% 18%
11% 11% 10% 9% 8% 8% 7%4% 2%
34%
21%
14% 12%
RETAIL
Intermediaries
Cross-platform retail providers used for news nowadays - 2018All adults 16+ using TV/Newspapers/Radio/Internet/Magazines for news
Source: Ofcom News Consumption Survey 2018Question: D2a-8a. Thinking specifically about <platform>, which of the following do you use for news nowadays?Base: All adults 16+ using TV/Newspapers/Radio/Internet/Magazines for news – 2018=4479NOTE: ‘Google’= Google News + Google + YouTube. ‘Other intermediary’ includes MSN, Yahoo, AOL, Flipboard, NewsNow. We distinguish between retail news provision (the individual title or brand of each news source that provides content to the user e.g. ITV News) and wholesale news provision (the supply and production of the news for a retail news source e.g. ITN).
Figure 3.4

25PROMOTING CHOICE • SECURING STANDARDS • PREVENTING HARM
Section 4News consumption via television

26
• BARB data shows that the majority of news viewing on the TV is through BBC channels and that their share of viewing has increased since 2010.
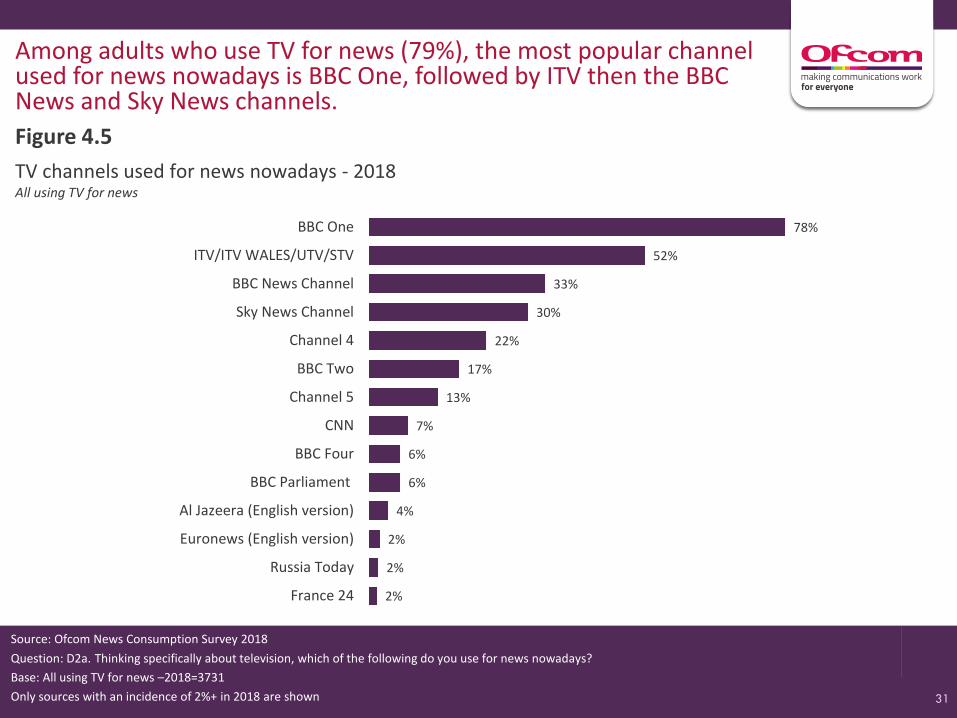
• The news consumption survey shows that among adults who use TV for news nowadays, the most popular channel used for news viewing is BBC One (78%), followed by ITV (52%) then the BBC News Channel (33%) and Sky News Channel (30%).
• There are a number of differences by demographic group: – ABC1 groups are more likely than C2DEs to watch the BBC TV channels and CNN,
while C2DEs are more likely to watch ITV and Channel 5.– EMGs are more likely than non-EMGs to watch most TV channels for news.
However, non-EMGs are more likely than EMGs to watch BBC One and ITV.– Those aged 65+ are more likely than 16-24s to view BBC One, ITV, BBC News
Channel and BBC Two, but 16-24s are more likely to watch Sky News, Channel 4 and CNN.
• News is consumed most frequently on BBC One, followed by ITV and then the BBC News and Sky News channels.
Summary – news consumption via television

27
27
Proportion of national/international news viewing hours by channel group – 2010 to 2017All adults 16+
Source: BARB, Network. Network programming based on 4+ area filter. Genre = national/international news.
Channels include their HD and +1 variants. Others = all other channels that showed national/international news that are not any of the listed channels above.
58% 58% 60% 62% 65% 65% 66% 67%
16% 14% 14% 13%13% 12% 13% 13%
3% 3% 3% 3%3% 3% 3% 3%
12% 14% 13% 12% 11% 10% 8% 8%
7% 8% 7% 7% 6% 7% 8% 7%
2010 2011 2012 2013 2014 2015 2016 2017
Others
Sky News
Other BBC
BBC News
Channel 5
Channel 4
ITV
BBC Two
BBC One
BARB data shows that the majority of news viewing on TV is through the BBC channels, and this has increased since 2010. Overall, adults watch an average of 110 hours of news a decrease of 11 hours since 2010.
Hours per individual/yr121 123 117 117 109 112 111 110
Figure 4.1

28
28
Proportion of national/international news viewing hours by channel group – 2010 to 2017 among adults aged 16-24All adults aged 16-24
Source: BARB, Network. Network programming based on 4+ area filter. Genre = national/international news.
Channels include their HD and +1 variants. Others = all other channels that showed national/international news that are not any of the listed channels above.
49% 46%53% 54% 57% 56% 58% 59%
20%18%
18% 19%18% 17%
18% 18%
7%
6%
6% 6%6%
6%6% 5%
11%16%
11% 10%9%
8% 7% 7%
7% 9% 6% 7% 5% 8% 7% 9%
2010 2011 2012 2013 2014 2015 2016 2017
Others
Sky News
Other BBC
BBC News
Channel 5
Channel 4
ITV
BBC Two
BBC One
BBC One accounts for the majority of news viewing among 16-24s. This age group watches an average of 23 hours of news, a decline of 11 hours since 2010 and is 87 hours less than all adults in 2017.
Hours per individual/yr34 32 29 28 26 26 23 23
Figure 4.2

29
29
Proportion of national/international news viewing hours by channel group – 2010 to 2017 among adults aged 65+All adults aged 65+
Source: BARB, Network. Network programming based on 4+ area filter. Genre = national/international news.
Channels include their HD and +1 variants. Others = all other channels that showed national/international news that are not any of the listed channels above.
62% 63% 64% 65% 67% 69% 70% 71%
16% 14% 14% 13% 13% 12% 12% 12%3% 3% 3% 2% 2% 2% 2% 2%
11% 12% 13% 13% 11% 10% 8% 7%
4% 4% 4% 4% 3% 4% 5% 5%
2010 2011 2012 2013 2014 2015 2016 2017
Others
Sky News
Other BBC
BBC News
Channel 5
Channel 4
ITV
BBC Two
BBC One
The proportion of news viewing across different TV channels by those aged 65+ is in line with the UK average. The total number of hours viewed by those aged 65+ is 216 hours, compared to 110 for all UK.
Hours per individual/yr218 224 219 224 215 219 218 216
Figure 4.3

30
30
Six in ten adults in the UK watched news on BBC One each week in 2017, the highest reach of all channels. However, this represents a seven percentage point decrease since 2010.
Average weekly reach of national/international news by channel - 2010 to 2017All adults 16+
Source: BARB, Network. Network programming based on 4+ area filter. Genre = national/international news.
Channels include their HD and +1 variants. Reach criteria = 3 consecutive minutes. Full weeks used for the correct calculation of weekly averages
Channel 4
BBC News
ITV
BBC One
Sky News
Channel 5
BBC Two
65% 65% 63% 63% 61% 60% 59%58%
43%40%
39% 38%36% 34% 35% 33%
18% 20%18% 18%
16% 15% 14% 13%
11%11% 11% 10% 10% 7% 8%
9%
15%
6%
2% 3% 4%2% 2% 2% 2% 3%
2010 2011 2012 2013 2014 2015 2016 2017
Figure 4.4
31
31
Among adults who use TV for news (79%), the most popular channel used for news nowadays is BBC One, followed by ITV then the BBC News and Sky News channels.
78%
52%
33%
30%
22%
17%
13%
7%
6%
6%
4%
2%
2%
2%
BBC One
ITV/ITV WALES/UTV/STV
BBC News Channel
Sky News Channel
Channel 4
BBC Two
Channel 5
CNN
BBC Four
BBC Parliament
Al Jazeera (English version)
Euronews (English version)
Russia Today
France 24
TV channels used for news nowadays - 2018All using TV for news
Source: Ofcom News Consumption Survey 2018
Question: D2a. Thinking specifically about television, which of the following do you use for news nowadays?
Base: All using TV for news –2018=3731
Only sources with an incidence of 2%+ in 2018 are shown
Figure 4.5
32
32
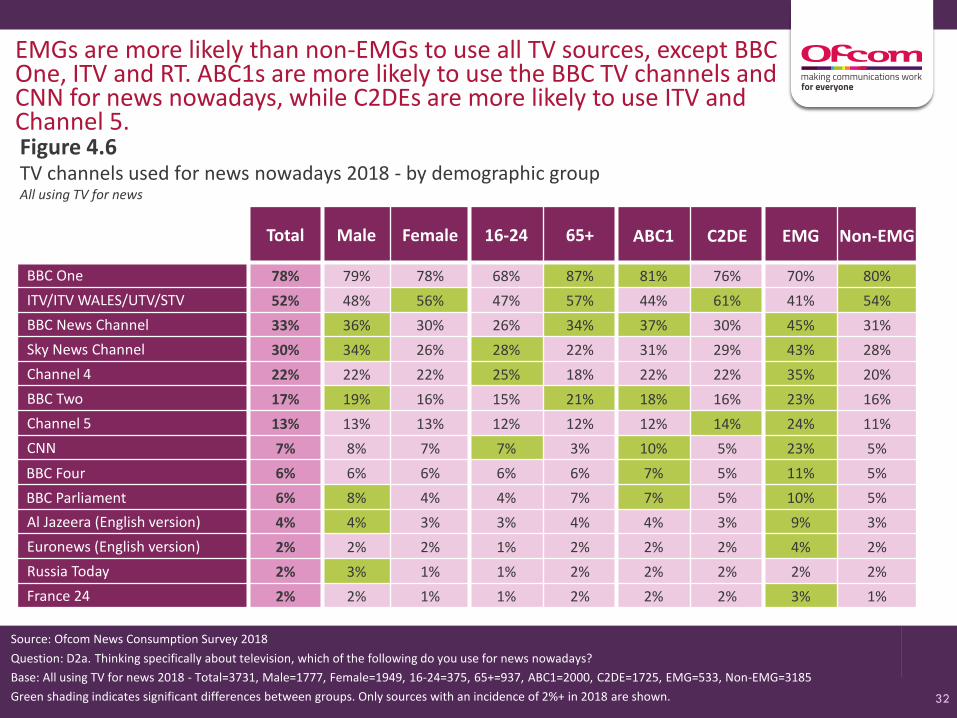
TV channels used for news nowadays 2018 - by demographic groupAll using TV for news
Source: Ofcom News Consumption Survey 2018
Question: D2a. Thinking specifically about television, which of the following do you use for news nowadays?
Base: All using TV for news 2018 - Total=3731, Male=1777, Female=1949, 16-24=375, 65+=937, ABC1=2000, C2DE=1725, EMG=533, Non-EMG=3185
Green shading indicates significant differences between groups. Only sources with an incidence of 2%+ in 2018 are shown.
Total Male Female 16-24 65+ ABC1 C2DE EMG Non-EMG
BBC One 78% 79% 78% 68% 87% 81% 76% 70% 80%
ITV/ITV WALES/UTV/STV 52% 48% 56% 47% 57% 44% 61% 41% 54%
BBC News Channel 33% 36% 30% 26% 34% 37% 30% 45% 31%
Sky News Channel 30% 34% 26% 28% 22% 31% 29% 43% 28%
Channel 4 22% 22% 22% 25% 18% 22% 22% 35% 20%
BBC Two 17% 19% 16% 15% 21% 18% 16% 23% 16%
Channel 5 13% 13% 13% 12% 12% 12% 14% 24% 11%
CNN 7% 8% 7% 7% 3% 10% 5% 23% 5%
BBC Four 6% 6% 6% 6% 6% 7% 5% 11% 5%
BBC Parliament 6% 8% 4% 4% 7% 7% 5% 10% 5%
Al Jazeera (English version) 4% 4% 3% 3% 4% 4% 3% 9% 3%
Euronews (English version) 2% 2% 2% 1% 2% 2% 2% 4% 2%
Russia Today 2% 3% 1% 1% 2% 2% 2% 2% 2%
France 24 2% 2% 1% 1% 2% 2% 2% 3% 1%
EMGs are more likely than non-EMGs to use all TV sources, except BBC One, ITV and RT. ABC1s are more likely to use the BBC TV channels and CNN for news nowadays, while C2DEs are more likely to use ITV and Channel 5.Figure 4.6

33
33
Frequency of consumption for main TV channels - 2018 All using each source for news
Source: Ofcom News Consumption Survey 2018
Question: D2b. And typically how often do you watch the news on...
Base: All who use each source for news 2018 (bases shown above, only sources used by 100+ respondents included)
31%20%
28% 28%
10% 14% 12%20% 19%
10% 15%
35%
35% 22% 20%
25%24%
22%18% 18%
15%
27%
16%
18%17% 18%
16%19%
19%24%
18%
12%
11%
11%
15%
15% 14%
23%22%
21%
17%
16%
16%
17%
4%7%
12% 11%14% 10%
12%10%
12%
26%
11%
3% 5% 7% 8% 12% 12% 15% 12% 17% 20% 19%
BBCOne
ITV/ITV WALES/UTV/STV
BBCNews
Channel
SkyNews
Channel
Channel4
BBCTwo
Channel5
CNN BBCFour
BBCParliament
AlJazeera
(English)
Less than once a wk/DK
Once a week
2-3 times a week
Most days
Once a day
More than once a day
BBC One is used most frequently for news consumption, with two thirds (66%) of those who use TV for news using the channel at least once a day.
78% 52% 33% 30% 22% 17% 13% 7% 6% 6% 4% % who use channel for news
2897 2074 1187 1141 839 630 495 308 227 217 149
Figure 4.7
Base size

34PROMOTING CHOICE • SECURING STANDARDS • PREVENTING HARM
Section 5News consumption via radio

35
• More than two fifths (44%) of adults claim to consume news through the radio. Of these, three quarters (74%) claim to use any BBC station for news and half (55%) use any commercial radio station for news. – Two fifths (42%) only use BBC radio for news, compared to one quarter (24%) that
only use commercial radio. • A quarter use BBC Radio 2 (26%) and BBC Radio 4 (23%), while one in five say they
use BBC Radio 1 (19%) and Heart FM (18%).– Those aged 65+ are more likely to listen to BBC Radio 2, 4, BBC local radio
and BBC 5 live. 16-24s are more likely to listen to BBC Radio 1, Capital, Heart FM, Kiss, Magic and Absolute Radio.
– ABC1s are more likely than C2DEs to listen to BBC Radio 4, whereas C2DEs are more likely than ABC1s to listen to Heart FM, Capital and other commercial radio stations.
Summary – news consumption via radio

36
36
Among those that use radio for news (44%), three-quarters claim to use any BBC station, with BBC Radio 2 being the most popular.
Radio stations used for news nowadays - 2018All using radio for news
Source: Ofcom News Consumption Survey 2018
Question: D6a. Thinking specifically about radio stations, which of the following do you use for news nowadays?
Base: All using radio for news –2018=2096
Only sources with an incidence of 4%+ in 2018 are shown
26%
23%
19%
18%
13%
13%
12%
8%
8%
8%
7%
7%
7%
6%
6%
5%
4%
BBC Radio 2
BBC Radio 4
BBC Radio 1
Heart FM
Capital
BBC Radio 5 Live
BBC local radio in England
Other local commercial stations
Classic FM
Smooth Radio
talkSPORT
Magic
Kiss
LBC
Absolute Radio
BBC Radio Scotland/Wales/Ulster
BBC World Service
2018
Any BBC Radio 74%
UK-wide BBC Radio 65%
Commercial radio 55%
BBC Radio only 42%
Commercial radio only 24%
Both BBC and Commercial 32%
Figure 5.1

37
37
Source: Ofcom News Consumption Survey 2018
Question: D6a. Thinking specifically about radio stations, which of the following do you use for news nowadays?
Base: All using radio for news 2018 - Total=2096, Male=1034, Female=1060, 16-24=176, 65+=512, ABC1=1216, C2DE=876, EMG=276, Non-EMG=1809
Green shading indicates significant differences between groups. Only sources with an incidence of 4%+ in 2018 are shown.
Total Male Female 16-24 65+ ABC1 C2DE EMG Non-EMG
BBC Radio 2 26% 25% 27% 18% 31% 28% 24% 14% 28%
BBC Radio 4 23% 24% 21% 6% 37% 28% 15% 15% 24%
BBC Radio 1 19% 19% 20% 49% 7% 19% 20% 28% 18%
Heart FM 18% 13% 22% 32% 5% 15% 20% 25% 16%
Capital 13% 11% 15% 33% 2% 12% 15% 26% 11%
BBC Radio 5 Live 13% 19% 7% 5% 12% 14% 12% 15% 13%
BBC local radio in England 12% 12% 13% 1% 24% 11% 14% 4% 14%
Other local commercial stations 8% 7% 9% 6% 6% 6% 11% 3% 9%
Classic FM 8% 8% 8% 7% 10% 7% 8% 10% 7%
Smooth Radio 8% 7% 8% 8% 6% 7% 9% 12% 7%
talkSPORT 7% 12% 2% 3% 3% 7% 7% 9% 7%
Magic 7% 7% 7% 9% 3% 7% 7% 11% 6%
Kiss 7% 6% 7% 20% 0% 5% 8% 13% 5%
LBC 6% 7% 5% 3% 4% 7% 6% 21% 4%
Absolute Radio 6% 6% 5% 5% 1% 5% 6% 7% 5%
BBC Radio Scotland/Wales/Ulster 5% 5% 4% 5% 5% 5% 5% 1% 5%
BBC World Service 4% 4% 3% 3% 5% 5% 3% 5% 4%
Those aged 65+ are more likely to listen to BBC Radio 2, 4, local radio and 5 live for news nowadays. 16-24s are more likely to listen to BBC Radio 1, Capital, Heart FM, Kiss, Magic and Absolute Radio.
Radio stations used for news nowadays 2018 - by demographic groupAll using radio for news
Figure 5.2

38PROMOTING CHOICE • SECURING STANDARDS • PREVENTING HARM
Section 6News consumption via newspapers

39
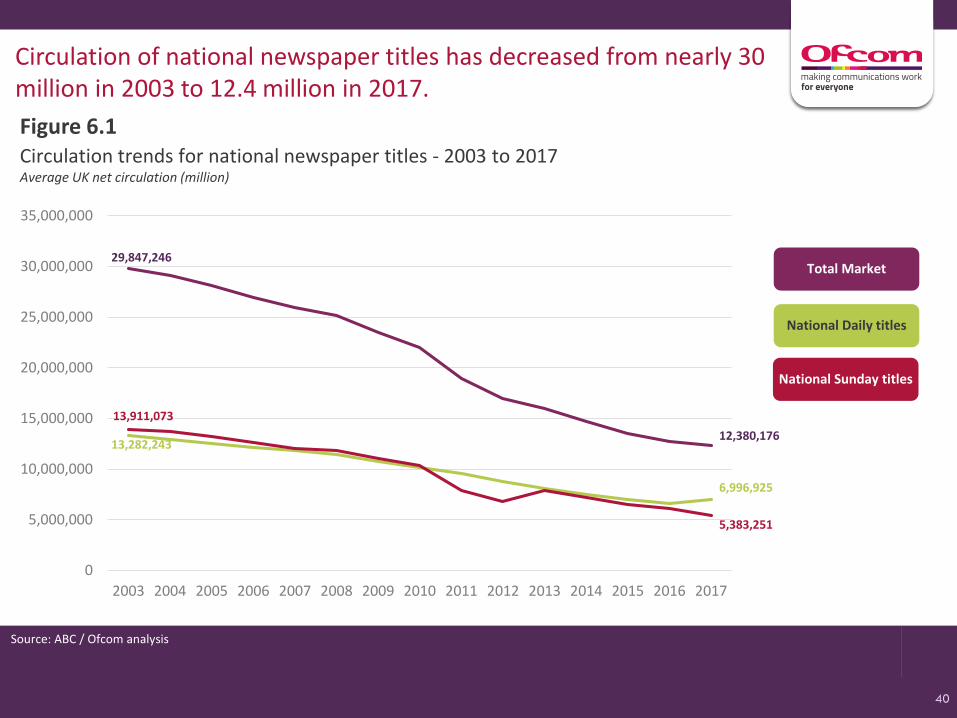
• Circulation of national newspaper titles has decreased from almost 30 million in 2003 to 12.4 million in 2017.– National Sunday titles have gone from 13.9 to 5.4 million and national daily titles
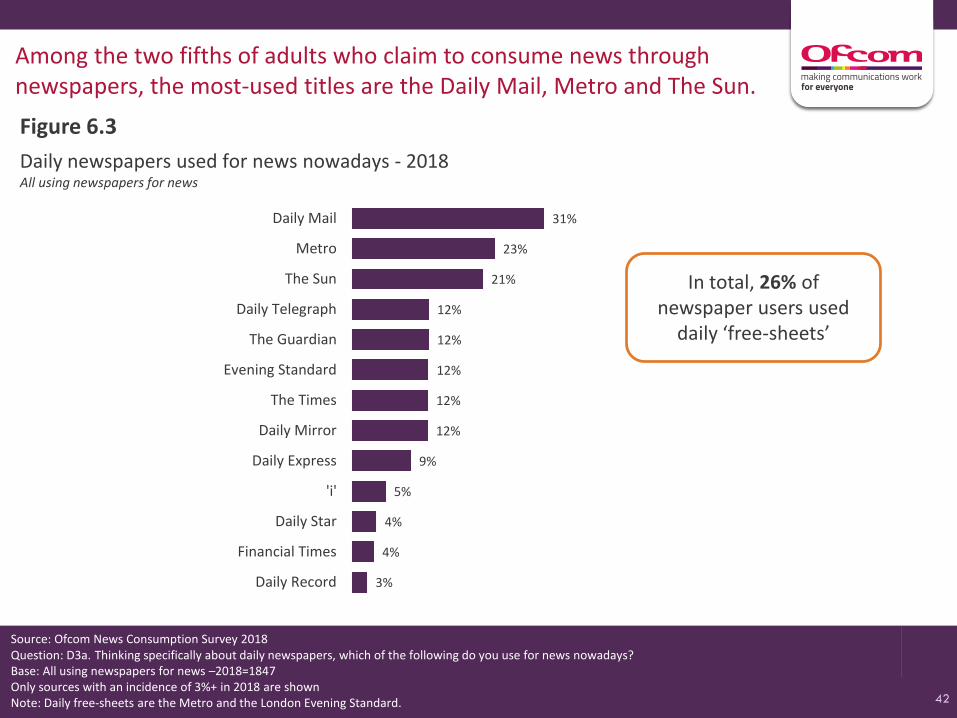
from 13.3 to 7 million.• Among the two fifths of adults who claim to consume news through newspapers, the
most-used titles are the Daily Mail (31%), Metro (23%), The Sun (21%) and The Mail on Sunday (20%).
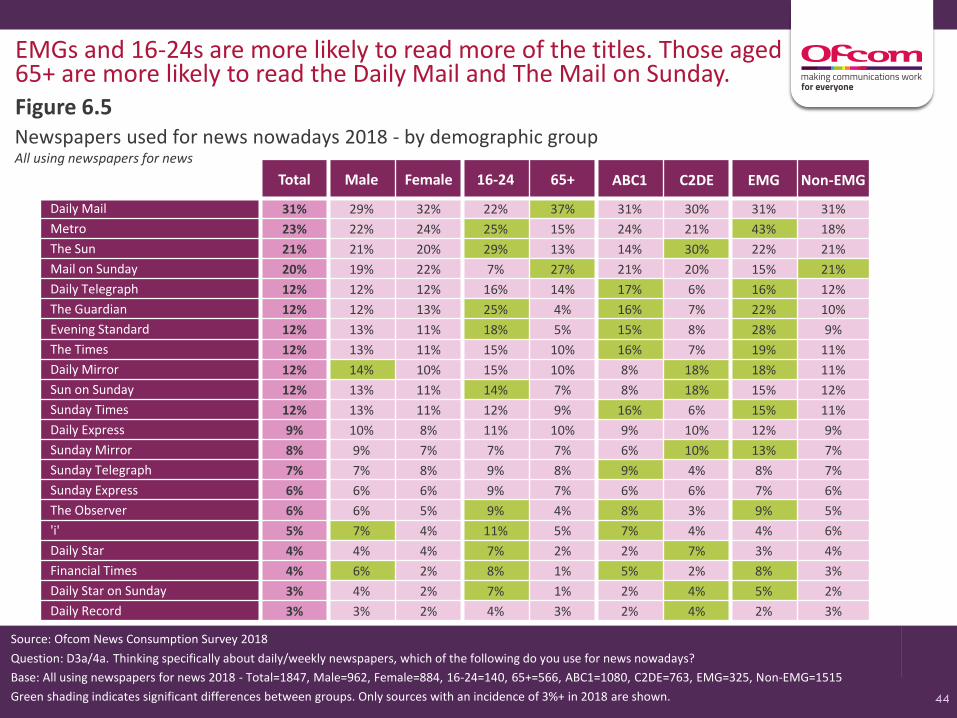
• 16-24s are more likely than those aged 65+ to read more of the titles. Those aged 65+ are more likely than 16-24s to read the Daily Mail and The Mail on Sunday.
• EMGs are more likely than non-EMGs to read more of the titles. Non-EMGs are more likely to read The Mail on Sunday.
Summary – news consumption via newspapers
40
40
Circulation of national newspaper titles has decreased from nearly 30 million in 2003 to 12.4 million in 2017.
Circulation trends for national newspaper titles - 2003 to 2017Average UK net circulation (million)
Source: ABC / Ofcom analysis
Total Market
National Daily titles
13,282,243
6,996,925
13,911,073
5,383,251
29,847,246
12,380,176
0
5,000,000
10,000,000
15,000,000
20,000,000
25,000,000
30,000,000
35,000,000
2003 2004 2005 2006 2007 2008 2009 2010 2011 2012 2013 2014 2015 2016 2017
National Sunday titles
Figure 6.1

41
41
Source: TouchPoints 2017
TouchPoints data shows that with print and online combined, the Daily Mail is the most widely-read news title in the UK. The Guardian is the most widely-read digital newspaper and the Metro the most read print newspaper.
Print vs. online newspaper readership by title – 2017 Weekly readership (000s)
4,435
1,382
5,713
4,063
1,894
2725
2,972
2,840
1,729
1,702
966
362
3,974
5,358
1,024
1,031
2,712
1602
1,145
494
630
464
403
823
946
1,270
648
516
477
334
407
313
223
212
70
193
Daily Mail
Guardian
Metro
The Sun
Daily Telegraph
Daily Mirror
The Times
London Evening…
Daily Express
i
Daily Star
Financial Times
Print solus Digital solus Print and digital combined
9,356
8,010
5,083
7,386
4,661
4,525
3,647
5,610
2,582
2,378
1,438
Any readership
1,377
Figure 6.2
42
42
Among the two fifths of adults who claim to consume news through newspapers, the most-used titles are the Daily Mail, Metro and The Sun.
Daily newspapers used for news nowadays - 2018All using newspapers for news
Source: Ofcom News Consumption Survey 2018Question: D3a. Thinking specifically about daily newspapers, which of the following do you use for news nowadays?Base: All using newspapers for news –2018=1847Only sources with an incidence of 3%+ in 2018 are shownNote: Daily free-sheets are the Metro and the London Evening Standard.
31%
23%
21%
12%
12%
12%
12%
12%
9%
5%
4%
4%
3%
Daily Mail
Metro
The Sun
Daily Telegraph
The Guardian
Evening Standard
The Times
Daily Mirror
Daily Express
'i'
Daily Star
Financial Times
Daily Record
Figure 6.3
In total, 26% of newspaper users used
daily ‘free-sheets’

43
43
The most read Sunday title is The Mail on Sunday, followed by The Sun on Sunday, The Sunday Times and The Sunday Mirror.
Sunday newspapers used for news nowadays - 2018All using newspapers for news
Source: Ofcom News Consumption Survey 2018Question: D4a. Thinking specifically about weekly newspapers, which of the following do you use for news nowadays?Base: All using newspapers for news –2018=1847Only sources with an incidence of 3%+ in 2018 are shown
20%
12%
12%
8%
7%
6%
6%
3%
The Mail on Sunday
The Sun on Sunday
The Sunday Times
The Sunday Mirror
The Sunday Telegraph
The Sunday Express
The Observer
The Daily Star on Sunday
Figure 6.4
In total, 6% of newspaper users used free local weekly newspapers
44
44
Total Male Female 16-24 65+ ABC1 C2DE EMG Non-EMG
Daily Mail 31% 29% 32% 22% 37% 31% 30% 31% 31%
Metro 23% 22% 24% 25% 15% 24% 21% 43% 18%
The Sun 21% 21% 20% 29% 13% 14% 30% 22% 21%
Mail on Sunday 20% 19% 22% 7% 27% 21% 20% 15% 21%
Daily Telegraph 12% 12% 12% 16% 14% 17% 6% 16% 12%
The Guardian 12% 12% 13% 25% 4% 16% 7% 22% 10%
Evening Standard 12% 13% 11% 18% 5% 15% 8% 28% 9%
The Times 12% 13% 11% 15% 10% 16% 7% 19% 11%
Daily Mirror 12% 14% 10% 15% 10% 8% 18% 18% 11%
Sun on Sunday 12% 13% 11% 14% 7% 8% 18% 15% 12%
Sunday Times 12% 13% 11% 12% 9% 16% 6% 15% 11%
Daily Express 9% 10% 8% 11% 10% 9% 10% 12% 9%
Sunday Mirror 8% 9% 7% 7% 7% 6% 10% 13% 7%
Sunday Telegraph 7% 7% 8% 9% 8% 9% 4% 8% 7%
Sunday Express 6% 6% 6% 9% 7% 6% 6% 7% 6%
The Observer 6% 6% 5% 9% 4% 8% 3% 9% 5%
'i' 5% 7% 4% 11% 5% 7% 4% 4% 6%
Daily Star 4% 4% 4% 7% 2% 2% 7% 3% 4%
Financial Times 4% 6% 2% 8% 1% 5% 2% 8% 3%
Daily Star on Sunday 3% 4% 2% 7% 1% 2% 4% 5% 2%
Daily Record 3% 3% 2% 4% 3% 2% 4% 2% 3%
Newspapers used for news nowadays 2018 - by demographic groupAll using newspapers for news
Source: Ofcom News Consumption Survey 2018
Question: D3a/4a. Thinking specifically about daily/weekly newspapers, which of the following do you use for news nowadays?
Base: All using newspapers for news 2018 - Total=1847, Male=962, Female=884, 16-24=140, 65+=566, ABC1=1080, C2DE=763, EMG=325, Non-EMG=1515
Green shading indicates significant differences between groups. Only sources with an incidence of 3%+ in 2018 are shown.
EMGs and 16-24s are more likely to read more of the titles. Those aged 65+ are more likely to read the Daily Mail and The Mail on Sunday. Figure 6.5

45PROMOTING CHOICE • SECURING STANDARDS • PREVENTING HARM
Section 7News consumption via social media

46
• More than two fifths (44%) of adults claim to consume news via social media. • Of these, three quarters (76%) claim to use Facebook for news nowadays, followed by
Twitter (32%), then WhatsApp (22%) and Instagram (21%).– 16-24s are more likely than those aged 65+ to use most social media channels for
news.• 16-24s are also more likely to claim to mostly get their news from ‘social media posts’
rather than ‘directly from news organisations’.• Across the social media sites, news is most likely to be accessed via ‘stories that are
trending’, followed by ‘seeing comments from friends/people I follow’ and ‘links to stories’.
• BBC is the most commonly followed news organisation across all the social media platforms (32-37%).
• The majority of social media news users say they know the source of their news stories ‘some’ or ‘most’ of the time.
Summary – news consumption via social media

47
47
More than two fifths of adults claim to consume news via social media. Of these, three quarters claim to use Facebook for news nowadays.
Social media used for news nowadays - 2018All using social media for news
Source: Ofcom News Consumption Survey 2018
Question: D7a. Thinking specifically about social media (on any device), which of the following do you use for news nowadays?
Base: All using social media for news – 2018=2058
76%
32%
22%
21%
16%
14%
8%
4%
3%
2%
2%
Google+
Snapchat
Tumblr
Viber
Other social media platform
Figure 7.1

48
48
Social media used for news nowadays 2018 - by demographic groupAll using social media for news
Source: Ofcom News Consumption Survey 2018
Question: D7a. Thinking specifically about social media (on any device), which of the following do you use for news nowadays?
Base: All using social media for news – Total=2058, Male=884, Female=1171, 16-24=447, 65+=165, ABC1=1181, C2DE=871, EMG=435, Non-EMG=1616
Green shading indicates significant differences between groups. *NB: WE THINK SOME OF THE 65+ RESPONDENTS WILL HAVE MISINTERPRETED WHAT GOOGLE+ IS
Total Male Female 16-24 65+ ABC1 C2DE EMG Non-EMG
Facebook 76% 73% 78% 75% 63% 73% 79% 66% 78%
Twitter 32% 37% 27% 43% 9% 34% 29% 38% 30%
WhatsApp 22% 23% 21% 23% 9% 24% 20% 43% 17%
Instagram 21% 20% 22% 37% 3% 21% 21% 38% 17%
Google+ * 16% 17% 15% 9% 17% 14% 18% 17% 15%
Snapchat 14% 11% 16% 32% 0% 14% 13% 25% 11%
LinkedIn 8% 11% 6% 6% 2% 11% 5% 15% 7%
Reddit 4% 6% 3% 9% 0% 5% 3% 5% 4%
Tumblr 3% 4% 2% 8% 0% 3% 4% 4% 3%
Viber 2% 3% 2% 2% 1% 3% 2% 6% 1%
Other social media platform 2% 2% 2% 1% 3% 2% 1% 2% 2%
16-24s (and EMGs to a lesser extent) are more likely to use most ofthe social media sites for news nowadays.
Figure 7.2

49
49
Source: Ofcom News Consumption Survey 2018
Question: D15. And if you had to choose, which one of the following would you say is closest to the way you find out about news when you’re online?
Base: All using social media for news - 2018=2058
40% 21% 32% 7%2018
Mostly get news from social media posts
Get news equally from social media posts and from newsorganisations' websites/apps
Mostly get news directlyfrom news organisations' websites/app
DK
Those consuming news via social media claim to be slightly more likely to get their news from ‘posts’ rather than ‘directly from news organisations’ websites or apps’.
Use of social media versus news organisations’ websites/apps - 2018All using social media for news
Figure 7.3

50
50
Use of social media versus news organisations’ websites/apps 2018 - by demographic groupAll using social media for news
Source: Ofcom News Consumption Survey 2018
Question: D15. And if you had to choose, which ONE of the following would you say is closest to the way you find out about news when you’re online?
Base: All using social media for news – Total=2058, Male=884, Female=1171, 16-24=447, 65+=165, ABC1=1181, C2DE=871, EMG=435, Non-EMG=1616
Green shading indicates significant differences between groups
Total Male Female 16-24 65+ ABC1 C2DE EMG Non-EMG
Mostly get news from social media posts 40% 36% 44% 51% 23% 36% 45% 45% 39%
Get news equally from social media posts and from newsorganisations' websites/apps
21% 20% 22% 16% 20% 23% 19% 15% 22%
Mostly get news directlyfrom news organisations' websites/app
32% 37% 28% 24% 42% 36% 27% 34% 31%
Don’t know 7% 8% 7% 9% 15% 6% 9% 6% 8%
16-24s, females, C2DEs and EMGs are more likely to get their news fromsocial media posts, whereas those aged 65+, males and ABC1 are morelikely to get news directly from news organisations websites/apps.
Figure 7.4

51
51
Across social media sites, news is most likely to be accessed via ‘stories that are trending’, or by ‘seeing comments’ and ‘links to stories’.
How news is accessed via social media - 2018All using each type of social media for news
Source: Ofcom News Consumption Survey 2018
Question: D9. Earlier you mentioned that you get news from xxxx. Which of the following do you do nowadays?
Base: All using each site for news 2018 – Facebook=1609, Twitter=689, Instagram=444, Snapchat=298
55%
49%
47%
17%
10%
9%
39%
39%
34%
26%
13%
13%
45%
35%
35%
23%
19%
47%
30%
27%
16%
19%
11%
7%
See news stories that are trending
See comments from friends/people I follow about news stories
See links to news stories posted by friends/people I follow
Actively follow traditional news organisations
Actively follow online-only news organisations
Actively follow journalists/public figures
Actively follow intermediary news sites
Actively follow specific news programmes
Figure 7.5

52
52
Proportion of news on social media accessed from each type of source - 2018All using each type of social media for news
52%58% 54%
60%
30% 18% 27%24%
18%24% 19% 16% Other people you follow
Friends and family
News organisations
Across all social media sites, users are more likely to say they source news stories from news organisations than from friends and family or other people they follow.
Source: Ofcom News Consumption Survey 2018
Question: D10. Approximately what proportion of the news you get from xxxx nowadays is from news organisations, friends and other people you follow?
Base: All using each site for news 2018 – Facebook=1609, Twitter=689, Instagram=444, Snapchat=298
Figure 7.6

53
53
Actions normally taken when accessing news on - 2018All accessing news from each source on Facebook
47% 52% 46% 40%
33%35%
37%36%
23%27%
21%23%
14%9%
14%10%
13% 7% 22%
14%
Newsorganisations
Trendingnews
News stories fromfriends and family
News stories fromother people you follow
Make comments
Share / retweet
Look at a news post or video but don’t click on it
Look at comments about the news
Click on a news article or video
Facebook users are more likely to ‘click on a news article/video’ or ‘look at comments about the news’ across each type of news post asked about.
Source: Ofcom News Consumption Survey 2018
Question: D11. Which, if any, of the following do you tend to do when you see posts from the following on Facebook?
Base: All accessing news from each source via Facebook – News organisations=782, Trending news=889, News stories from friends/family=1108, News stories from other people you follow=1162Note: Columns do not sum to 100% (this was a multi-code question)
Figure 7.7

54
54
Actions normally taken when accessing news on - 2018All accessing news from each source on Twitter
42% 46% 40% 41%
36% 33%33% 36%
24% 23%26%
24%
19% 18% 19% 18%
10%6% 14% 13%
Newsorganisations
Trendingnews
News stories fromfriends and family
News stories fromother people you follow
Make comments
Share / retweet
Look at a news post or video but don’t click on it
Look at comments about the news
Click on a news article or video
Similar behaviours are observed among Twitter users, however this group are slightly more likely to share/re-tweet news stories.
Source: Ofcom News Consumption Survey 2018
Question: D11. Which, if any, of the following do you tend to do when you see posts from the following on Twitter?
Base: All accessing news from each source via Twitter – News organisations=401, Trending news=346, News stories from friends/family=397, News stories from other people you follow=468Note: Columns do not sum to 100% (this was a multi-code question)
Figure 7.8

55
55
Actions normally taken when accessing news on - 2018All accessing news from each source on Instagram
36% 42% 35% 31%
30%
45%
37%38%
30%
26%
25% 25%
9%
7%
14%9%
13%
9%17%
15%
Newsorganisations
Trendingnews
News stories fromfriends and family
News stories fromother people you follow
Make comments
Share / retweet
Look at a news post or video but don’t click on it
Look at comments about the news
Click on a news article or video
Compared to other platforms, Instagram users are slightly more likely to ‘look at comments about the news’ – especially on trending news.
Source: Ofcom News Consumption Survey 2018
Question: D11. Which, if any, of the following do you tend to do when you see posts from the following on Instagram?
Base: All accessing news from each source via Instagram – News organisations=231, Trending news=201, News stories from friends/family=250, News stories from other people you follow=288Note: Columns do not sum to 100% (this was a multi-code question)
Figure 7.9

56
56
Actions normally taken when accessing news on – 2018All accessing news from each source on Snapchat
42%
64%47% 44%
18%
15%
24%22%
29%
25%
17% 21%
6%
4%
8% 8%
11%
6%19%
11%
Newsorganisations
Trendingnews
News stories fromfriends and family
News stories fromother people you follow
Make comments
Share / retweet
Look at a news post or video but don’t click on it
Look at comments about the news
Click on a news article or video
Snapchat users are more likely to ‘click on a news article/video’ than all other types of actions - especially on trending news.
Source: Ofcom News Consumption Survey 2018
Question: D11. Which, if any, of the following do you tend to do when you see posts from the following on Snapchat?
Base: All accessing news from each source via Snapchat – News organisations=140, Trending news=141, News stories from friends/family=136, News stories from other people you follow=157Note: Columns do not sum to 100% (this was a multi-code question)
Figure 7.10

57
57
News organisations followed on social media - 2018All accessing news organisations via each type of social media
BBC is the most commonly followed news organisation across all social media platforms asked about, followed by ITV and Sky News on Facebook, Twitter and Instagram; and Buzzfeed and the Daily Mail on SnapChat.
Source: Ofcom News Consumption Survey 2018
Question: D12a. Which, if any, of the following news sources do you follow on xxxx?
Base: All accessing news organisations via each type of social media - Facebook=782, Twitter=401, Instagram=231, Snapchat=140
Only sources with an incidence of 6%+ on each type of social media are shown
BBC 37% BBC 36% BBC 32% BBC 33%
ITV/ITV Wales/STV/UTV 21% Sky News 19% Sky News 17% BuzzFeed 25%
Sky News 19% ITV/ITV Wales/STV/UTV 14% ITV/ITV Wales/STV/UTV 13% The Daily Mail 17%
LADbible 12% The Guardian/Observer 9% BuzzFeed 11% ITV/ITV Wales/STV/UTV 16%
YouTube 11% Channel 4 8% Channel 4 10% Sky News 15%
BuzzFeed 11% CNN 8% LADbible 9% Channel 4 12%
Channel 4 9% YouTube 7% CNN 7% The Sun 10%
Huffington Post 8% LADbible 6% YouTube 7% CNN 10%
The Daily Mail 7% Huffington Post 6% The Telegraph 9%
Local newspaper 7% BuzzFeed 6% LADbible 9%
The Sun 7% The Daily Mail 6% YouTube 7%
CNN 7% NBC News 7%
The Guardian/Observer 7% The Financial Times 6%
The Evening Standard 6%
Figure 7.11

58
58
Awareness of the source of news stories posted on social media - 2018All accessing news stories posted by friends/family or by other people via each type of social media
13% 16% 17%26%
10% 13% 11% 15%
43%44% 38%
35%
36%
47%
36%40%
36% 30% 34% 26%
43%
33%
41% 30%
4% 5% 4% 9% 6%4%
5% 9%
4% 5% 6% 5% 6% 3% 6% 6% Don’t know
Never
Some of the time
Most of the time
All of the time
The majority of social media news users say they know the source of their news stories ‘most’ or ‘some’ of the time.
Source: Ofcom News Consumption Survey 2018
Question: D12b. Do you typically know the source of the news stories posted by your friends & family/by other people you follow?
Base: All accessing news stories posted by - Family/friends on Facebook=1108, Twitter=397, Instagram=250, Snapchat=136 ; Other people on Facebook=1162, Twitter=468, Instagram=288, Snapchat=157
News stories posted by friends/ family on...
News stories posted by other people you follow on...
Figure 7.12
59PROMOTING CHOICE • SECURING STANDARDS • PREVENTING HARM
Section 8News consumption via other internet sources

60
• Around four in ten (37%) of UK adults said they consume news via other internet sources (i.e. not including social media).
• Broadcaster websites/apps are used by a quarter (23%) of all adults for news, followed by newspaper sites/apps and search engines (both 18%).– Males, 16-24s, ABC1s and EMG groups tend to use a wider variety of online news
sources. • When asked about specific news sources, almost two thirds of other internet news
users claim to use the BBC website/app (63%), with half using Google search (46%). One in seven (17%) use The Guardian, Sky and Daily Mail websites/apps. – The BBC website/app is more likely to be used by Males, 65+, ABC1 and Non-
EMGs.
Summary – news consumption via internet

61
61
When looking at online news other than social media, reading news stories online is the most popular way to access news, followed by using a search engine and watching clips or TV news.
Ways to access news through the internet – 2018*All using other internet for news
Source: Ofcom News Consumption Survey 2018
Question: D13. In which types of ways do you access and use news through internet sources nowadays?
Base: All using other internet for news - 2018=1661
*This question was not asked to those that said they used social media for news but not any other type of internet
66%
35%
28%
25%
16%
12%
11%
7%
7%
6%
5%
4%
3%
Read news stories online
Use a search engine to find out about a particular news story
Watch news related video clips
Watch TV news online
Receive email alerts or notifications of news
Look at a gallery of pictures about news
Listen to radio news online
Share existing news related video clips
Listen to news podcasts
Watch news podcasts
Subscribe to personalised news information via RSS/news feeds
Use a ‘news ticker’ or rolling news across your screen
Post your own news related video clips
Figure 8.1

62
62
Broadcaster websites/apps are used by a quarter of all adults for news, followed by newspaper sites/apps and search engines.
Types of websites/apps used for news nowadays - 2018All adults 16+
Source: Ofcom News Consumption Survey 2018
Question: C2. Which of the following do you use to get news?
Base: All adults 16+ –2018=4618
23%
18%
18%
12%
11%
5%
3%
Websites/apps of TV and radio companies
Websites/apps of newspapers
Search engines
Websites/apps of news aggregation sites (e.g. Google News, MSN, Yahoo)
Websites/apps of online news organizations (e.g. Buzzfeed, Huffington Post, Vice)
Websites/apps of news magazines
Blogs
Figure 8.2

63
63
Types of websites/apps used for news nowadays 2018 - by demographic groupAll adults 16+
Source: Ofcom News Consumption Survey 2018
Question: C2. Which of the following do you use to get news?
Base: All adults 16+ 2018 - Total=4618, Male=2194, Female=2417, 16-24=631, 65+=990, ABC1=2502, C2DE=2110, EMG=722, Non-EMG=3880
Green shading indicates significant differences between groups
Total Male Female 16-24 65+ ABC1 C2DE EMG Non-EMG
Websites/apps of TV and radio companies 23% 26% 20% 20% 17% 28% 17% 24% 23%
Websites/apps of newspapers 18% 20% 17% 16% 13% 22% 14% 22% 18%
Search engines 18% 20% 16% 17% 12% 21% 14% 23% 17%
Websites/apps of news aggregation sites 12% 13% 10% 11% 7% 14% 9% 19% 10%
Websites/apps of online news organizations 11% 12% 10% 13% 4% 14% 8% 15% 10%
Websites/apps of news magazines 5% 6% 4% 7% 2% 6% 4% 9% 4%
Blogs 3% 3% 2% 4% 1% 3% 3% 4% 2%
In particular, males, 16-24, ABC1 and EMG groups tend to use a wider variety of online news sources nowadays.
Figure 8.3

64
64
Websites/apps used for news nowadays - 2018All using other internet for news
Source: Ofcom News Consumption Survey 2018Question: D8a. Thinking specifically about the internet, which of the following do you use for news nowadays?Base: All using other internet for news* - 2018=1661*NOTE: Base definition changed in 2018 (this data will exclude respondents who only use social media for news) Only sources with an incidence of 5%+ in 2018 are shown. **ITV/ITN – only includes mentions of ITV/ITN specifically, does not include mentions of STV or UTV.
2018*
BBC website/app 63%
Google (search engine) 46%
Guardian/Observer website/app 17%
Sky News website/app 17%
The Daily Mail website/app 17%
YouTube website/app 13%
Huffington Post website/app 12%
Google News 11%
MSN News website/app 11%
Yahoo News website/app 11%
Any local newspaper website/app 11%
ITV/ITN** website/app 10%
The Telegraph website/app 9%
The Independent website/app 8%
BuzzFeed website/app 8%
CNN website/app 7%
The Sun website/app 6%
Pre-loaded Apple news app 6%
Times/Sunday Times website/app 5%
The Daily Mirror website/app 5%
The Metro website/app 5%
LADbible website/app 5%
Channel 4 website/app 5%
Almost two-thirds of online news users claim to use the BBC website/app and half use Google search.
2018*
Broadcaster websites/apps 74%
Newspaper websites/apps 53%
Intermediaries 42%
Figure 8.4

65
65
Websites/apps used for news nowadays 2018 - by demographic groupAll using other internet for news
Source: Ofcom News Consumption Survey 2018Question: D8a. Thinking specifically about the internet, which of the following do you use for news nowadays?Base: All using other internet for news 2018 - Total=1661, Male=868, Female=789, 16-24=234, 65+=242, ABC1=1082, C2DE=577, EMG=322, Non-EMG=1334Green shading indicates significant differences between groups. Only sources with an incidence of 5%+ in 2018 are shown. **ITV/ITN – only includes mentions of ITV/ITN specifically, does not include mentions of STV or UTV
Total Male Female 16-24 65+ ABC1 C2DE EMG Non-EMG
BBC website/app 63% 68% 57% 55% 66% 66% 57% 54% 65%
Google (search engine) 46% 45% 47% 44% 39% 46% 46% 46% 46%
Guardian/Observer website/app 17% 17% 17% 20% 13% 19% 13% 21% 16%
Sky News website/app 17% 18% 16% 13% 10% 17% 17% 20% 16%
The Daily Mail website/app 17% 14% 20% 13% 18% 16% 19% 18% 16%
YouTube website/app 13% 15% 12% 28% 5% 12% 16% 22% 11%
Huffington Post website/app 12% 11% 13% 8% 10% 12% 10% 13% 11%
Google News 11% 12% 11% 14% 9% 12% 11% 16% 10%
MSN News website/app 11% 12% 9% 9% 12% 9% 14% 14% 10%
Yahoo News website/app 11% 12% 10% 10% 9% 10% 12% 19% 9%
Any local newspaper website/app 11% 10% 11% 5% 11% 9% 13% 4% 12%
ITV/ITN** website/app 10% 9% 11% 10% 7% 9% 11% 11% 9%
The Telegraph website/app 9% 10% 8% 8% 9% 10% 8% 11% 8%
The Independent website/app 8% 9% 7% 10% 4% 9% 5% 12% 7%
BuzzFeed website/app 8% 5% 11% 19% 2% 7% 8% 14% 6%
CNN website/app 7% 8% 5% 8% 3% 7% 6% 16% 5%
The Sun website/app 6% 6% 6% 6% 1% 5% 6% 10% 5%
Pre-loaded Apple news app 6% 5% 6% 11% 1% 6% 4% 8% 5%
Times/Sunday Times website/app 5% 6% 5% 5% 4% 7% 3% 8% 5%
The Daily Mirror website/app 5% 5% 5% 4% 3% 5% 7% 8% 5%
The Metro website/app 5% 5% 5% 4% 3% 4% 6% 8% 4%
LADbible website/app 5% 6% 4% 13% 1% 5% 5% 6% 5%
Channel 4 website/app 5% 5% 4% 6% 5% 4% 6% 4% 5%
BBC website/app is most commonly used by Males, 65+, ABC1 and non-EMG groups. Figure 8.5

66
66
Reach of Top 10 news websites – April 2018Adults aged 18+ - 000s & Percentage of total digital audience
Source: comScore MMX Multi-Platform. April 2018
Base: Adults 18+
Includes desktop and mobile use of comScore “News/Information” category. Note: Telegraph Media Group smartphone and tablet data is the only entity charted which is supported by panel only data and not through a unification of panel and census like other entities.
News content on BBC websites has the highest unique audience of news websites in the UK.
Figure 8.6
31,20329,961
24,67823,422
21,07919,459
15,798 15,54814,150 14,110
BBC News The Sun Online
Daily Mail The Guardian Telegraph Independent Mirror Sky News Mail Online -News
Metro
74% 71% 58% 55% 50% 46% 37% 37% 33% 33%
% of total digital
audience

67
67
Source: Ofcom News Consumption Survey 2018
Question: D14. How often, if at all, you do each of the following when you want to get news?
Base: All using other internet for news* - 2018=1661
*NOTE: Base definition changed in 2018 (this data will exclude respondents who only use social media for news)
7%
10%
28%
8%
19%
21%
25%
38%
23%
25%
21%
16%
35%
12%
10%
Go directly to a website/app of anews provider
Go to a search engine and searchfor a news story
Go directly to a website/app thatbrings together news fromdifferent news providers
DK Never Rarely Sometimes Often Most times
Online news users are most likely to go directly to the websites/apps of a news provider.
Gateways to online news, and frequency of use - 2018All using other internet for news
2018*
60%
33%
26%
% Often/Most times
Figure 8.7

68
68
Gateways to online news, and frequency of use 2018 - by demographic groupAll using other internet for news
Source: Ofcom News Consumption Survey 2018
Question: D14. How often, if at all, you do each of the following when you want to get news?
Base: All using other internet for news - Total=1661, Male=868, Female=789, 16-24=234, 65+=242, ABC1=1082, C2DE=577, EMG=322, Non-EMG=1334
Green shading indicates significant differences between groups
% Using often/most times Total Male Female 16-24 65+ ABC1 C2DE EMG Non-EMG
Go directly to a website/app of a news provider 60% 61% 59% 50% 58% 62% 57% 59% 60%
Go to a search engine and search for a news story 33% 34% 31% 37% 26% 32% 34% 39% 31%
Go directly to a website/app that brings together news from different news providers
26% 28% 24% 33% 10% 25% 28% 36% 24%
ABC1s are more likely to go directly to the website/app of a news provider compared to C2DEs. 16-24s and EMGs are more likely to a search engine or a news aggregator compared to 65+ and non-EMGs.
Figure 8.8

69
69
TouchPoints data shows that those aged 15-24 are more likely to agree with all statements relating to online news than all adults 15+.
9%
12%
20%
22%
31%
33%
39%
53%
52%
63%
60%
69%
6%
7%
11%
17%
20%
27%
31%
35%
37%
45%
46%
56%
I Sometimes Choose To Click on Adverts That Appear When I'm Reading an OnlineNewspaper
I Follow My Favourite Journalists/Columnists on Social Media
I Include Newspaper Websites in My Online Newsfeeds
I Like To Check the News Headlines Online Just Before I go to Bed
I Sometime Share Articles I Have Read in Online Newspapers
I Like To Check the News Headlines Online As Soon As I Get Up
I Should Not Have To Pay For a Subscription To View Newspaper Content Online
I Like the Convenience of Getting My Newspaper Online
I Often Look At News on My Smartphone or Tablet To Pass the Time
I Feel Informed These Days Because of the Convenience of Online News
I Like Having Immediate Access To the News As It Happens
I Find the Internet a Really Useful Source of News
Adults 15+ Age 15-24
Figure 8.9
Statements made about online news – Adults 15+ vs. 15-24sAll GB adults 15+
Source: TouchPoints 2017

70PROMOTING CHOICE • SECURING STANDARDS • PREVENTING HARM
Section 9News consumption via magazines

71
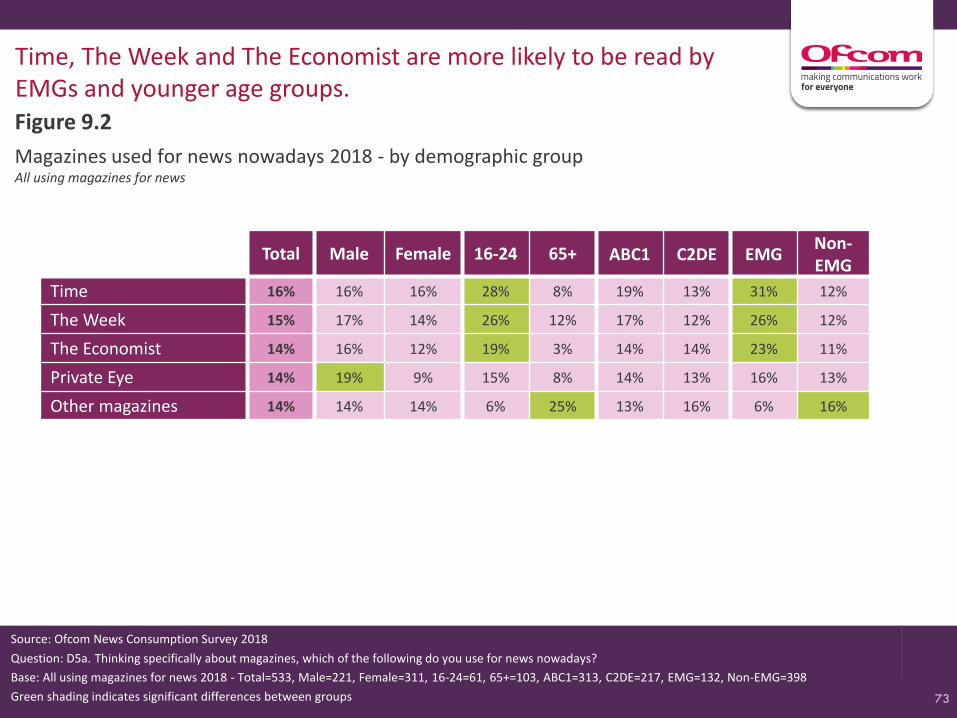
• One in ten (11%) adults claim to consume news via magazines. • Of these around one in six claim to read Time, The Week, The Economist and Private
Eye. These titles are more likely to be read by EMGs and younger age groups.
Summary – news consumption via magazines

72
72
One in ten adults claim to consume news via magazines. Of these, around one in six claim to read Time, The Week, The Economist and Private Eye.
Magazines used for news nowadays - 2018All using magazines for news
Source: Ofcom News Consumption Survey 2018
Question: D5a. Thinking specifically about magazines, which of the following do you use for news nowadays?
Base: All using magazines for news –2018=533
16%
15%
14%
14%
14%
Time
The Week
The Economist
Private Eye
Other magazines
Figure 9.1
73
73
Magazines used for news nowadays 2018 - by demographic groupAll using magazines for news
Source: Ofcom News Consumption Survey 2018
Question: D5a. Thinking specifically about magazines, which of the following do you use for news nowadays?
Base: All using magazines for news 2018 - Total=533, Male=221, Female=311, 16-24=61, 65+=103, ABC1=313, C2DE=217, EMG=132, Non-EMG=398
Green shading indicates significant differences between groups
Total Male Female 16-24 65+ ABC1 C2DE EMGNon-EMG
Time 16% 16% 16% 28% 8% 19% 13% 31% 12%
The Week 15% 17% 14% 26% 12% 17% 12% 26% 12%
The Economist 14% 16% 12% 19% 3% 14% 14% 23% 11%
Private Eye 14% 19% 9% 15% 8% 14% 13% 16% 13%
Other magazines 14% 14% 14% 6% 25% 13% 16% 6% 16%
Time, The Week and The Economist are more likely to be read by EMGs and younger age groups.Figure 9.2

74PROMOTING CHOICE • SECURING STANDARDS • PREVENTING HARM
Section 10Multi-sourcing

75
• Across all platforms, an average of 6.7 individual sources are used for news
– On average, users of internet for news say they use the most individual news sources via this platform (3.4), followed by TV/newspapers (both 2.8) and Radio (2.0)
– Among users of social media, the average number of sources used via this platform was 2.0, while for other internet users, the average was 3.6.
– EMG, male, ABC1 and younger groups tend to have a greater number of individual news sources than non-EMG, female, 65+ and C2DE groups
Summary – multi-sourcing

76
76
Average number of individual news sources used nowadays by platform - 2014 to 2018All using each platform for news
Source: Ofcom News Consumption Survey 2018
Question: D2a-8a. Thinking specifically about <platform>, which of the following do you use for news nowadays?
Base: All using each platform for news – 2018 (All=4479, TV=3731, Newspapers=1847, Radio=2096, Social media=2058, Other internet=1661)
Across all platforms, an average of 6.7 individual sources are used for news.
NewspapersTVAny internetAcross all platforms
6.7
3.42.8 2.8
2.0
Radio
Figure 10.1
For social media users (44% of UK adults) the average number of sources used via this platform
was 2.0, for other internet users (37% of UK adults), the average for this platform was 3.6.

77
77
2018
Total 6.7
Male 7.2
Female 6.3
16-34 6.9
35-54 7.1
55+ 6.2
ABC1 7.2
C2DE 6.2
EMG 8.6
Non-EMG 6.4
England 7.0
Scotland 5.3
Wales 5.7
Northern Ireland 5.2
Average number of individual sources used across all platforms – 2018 by demographic groupAll adults 16+ using TV/Newspapers/Radio/Internet/Magazines for news
Source: Ofcom News Consumption Survey 2018
Question: D2a-8a. Thinking specifically about <platform>, which of the following do you use for news nowadays?
Base: All adults 16+ using TV/Newspapers/Radio/Internet/Magazines for news – 2014=2580, 2015=2626, 2016=2659, 2018=4479
Green shading indicates significant differences between groups in the 2018 data
EMG, Male, ABC1 and 16-54 age groups tend to have a greater number of individual news sources.Figure 10.2

78
78
Number of individual sources used 2018 - by platform All using each platform for news
9%
25%20%
43%
26%
41%
19%12%
31%35%
29%
19%
25%
21%13%
16% 17%
14%
15%
14%
17%
66%
27% 25%
12%
35%
14%
39%
Across all platforms
TV Newspapers Radio All internet Socialmedia
OtherInternet
4+ sources
3 sources
2 sources
1 source
Internet news users have the most individual news sources, followed by TV/newspapers and then Radio/social media.
6.7 2.8 2.8 2.0 3.4 2.0 3.6 Mean no.
Source: Ofcom News Consumption Survey 2018
Question: D2a-8a. Thinking specifically about <platform>, which of the following do you use for news nowadays?
Base: All using each platform for news 2018 – All platforms=4479, TV=3731, Newspapers=1847, Radio=2096, Social media=2058, Other internet=1661, All internet (Any users of Social media and/or Other Internet) = 2873
Note: Columns do not sum to 100% as some respondents did not name specific sources within a platform (zero sources)
Figure 10.3
79PROMOTING CHOICE • SECURING STANDARDS • PREVENTING HARM
Section 11Share of reference
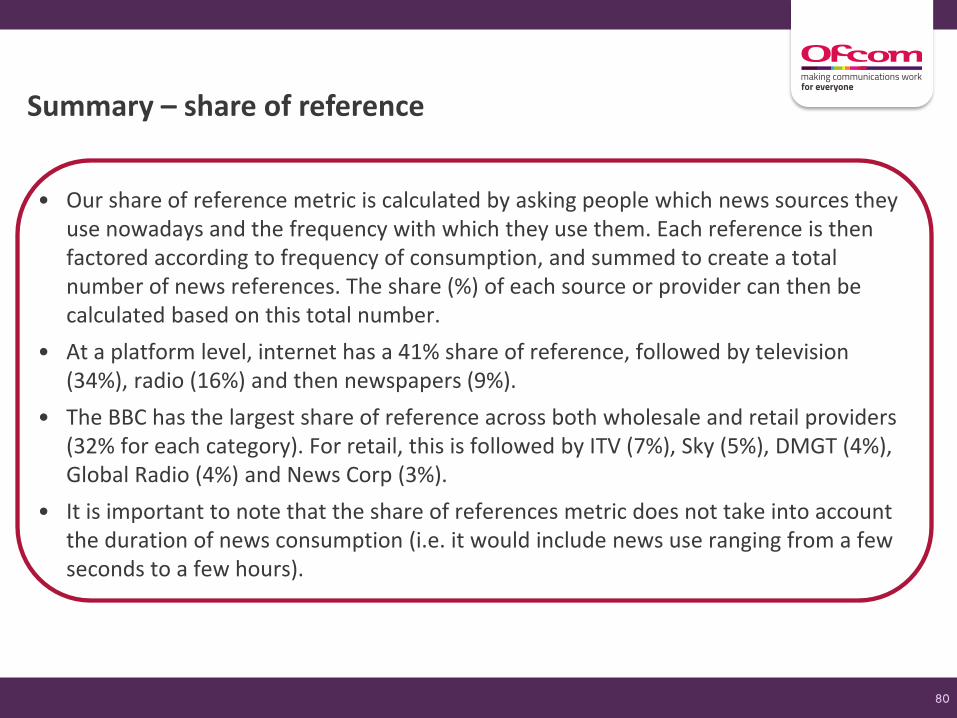
80
• Our share of reference metric is calculated by asking people which news sources they use nowadays and the frequency with which they use them. Each reference is then factored according to frequency of consumption, and summed to create a total number of news references. The share (%) of each source or provider can then be calculated based on this total number.
• At a platform level, internet has a 41% share of reference, followed by television (34%), radio (16%) and then newspapers (9%).
• The BBC has the largest share of reference across both wholesale and retail providers (32% for each category). For retail, this is followed by ITV (7%), Sky (5%), DMGT (4%), Global Radio (4%) and News Corp (3%).
• It is important to note that the share of references metric does not take into account the duration of news consumption (i.e. it would include news use ranging from a few seconds to a few hours).
Summary – share of reference
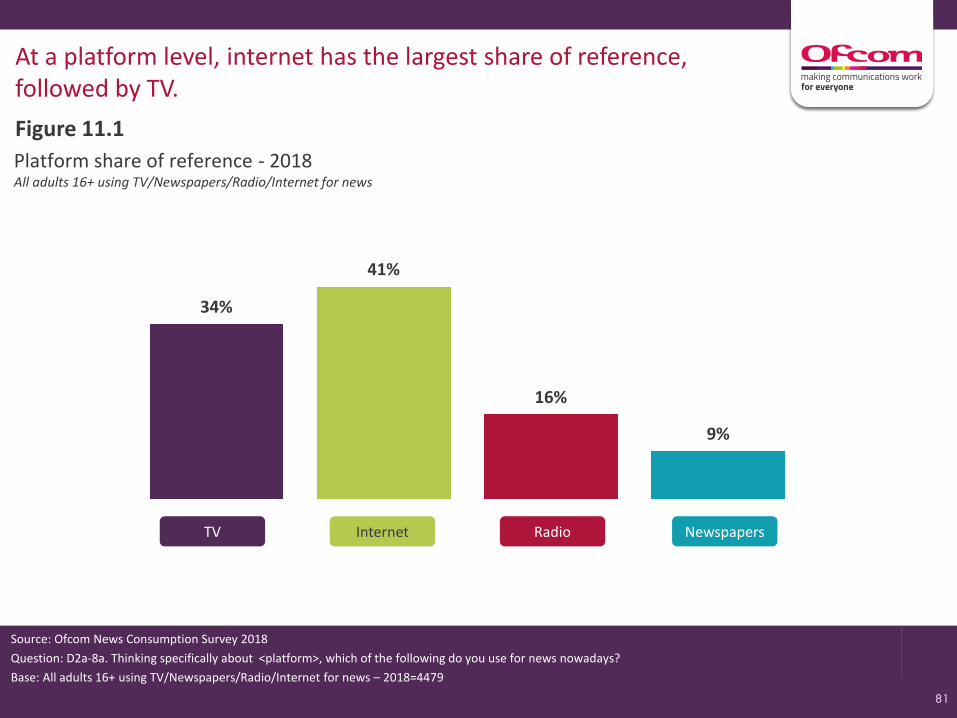
81
81
Platform share of reference - 2018All adults 16+ using TV/Newspapers/Radio/Internet for news
34%
41%
16%
9%
At a platform level, internet has the largest share of reference, followed by TV.
Source: Ofcom News Consumption Survey 2018
Question: D2a-8a. Thinking specifically about <platform>, which of the following do you use for news nowadays?
Base: All adults 16+ using TV/Newspapers/Radio/Internet for news – 2018=4479
Figure 11.1
NewspapersTV Internet Radio
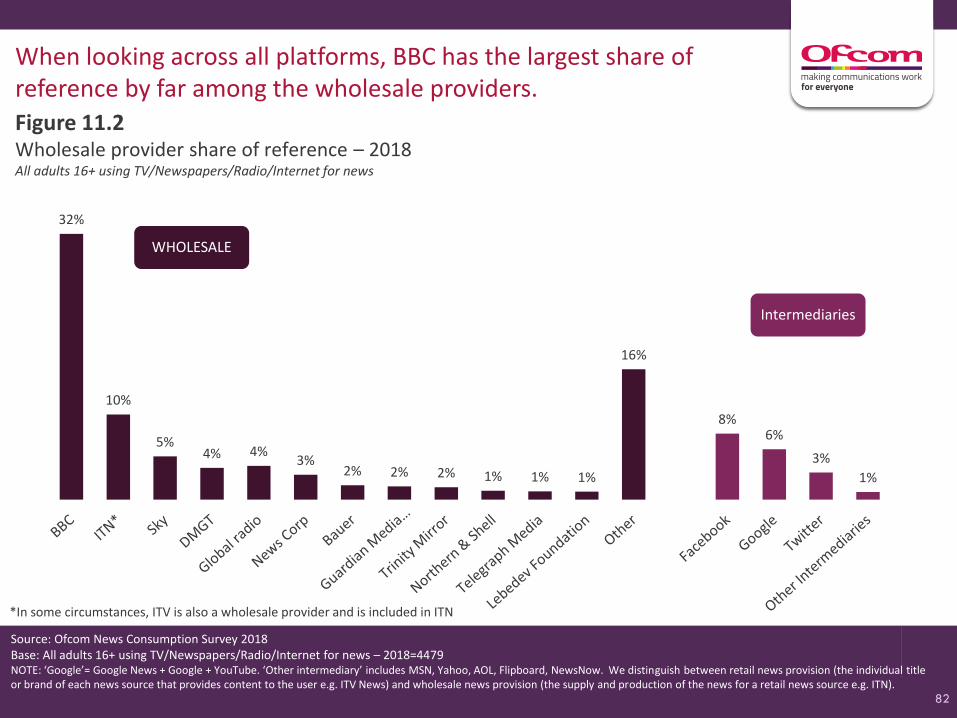
82
82
When looking across all platforms, BBC has the largest share of reference by far among the wholesale providers.
32%
10%
5%4% 4%
3%2% 2% 2% 1% 1% 1%
16%
8%6%
3%
1%
WHOLESALE
Intermediaries
Wholesale provider share of reference – 2018All adults 16+ using TV/Newspapers/Radio/Internet for news
Source: Ofcom News Consumption Survey 2018Base: All adults 16+ using TV/Newspapers/Radio/Internet for news – 2018=4479NOTE: ‘Google’= Google News + Google + YouTube. ‘Other intermediary’ includes MSN, Yahoo, AOL, Flipboard, NewsNow. We distinguish between retail news provision (the individual title or brand of each news source that provides content to the user e.g. ITV News) and wholesale news provision (the supply and production of the news for a retail news source e.g. ITN).
Figure 11.2
*In some circumstances, ITV is also a wholesale provider and is included in ITN

83
83
BBC also has the largest share of reference across the retail providers.
32%
7%5%
4% 4%3% 2% 2% 2% 2% 1% 1% 1% 1%
15%
8%6%
3%2%
RETAIL
Intermediaries
Retail provider share of reference - 2018All adults 16+ using TV/Newspapers/Radio/Internet for news
Source: Ofcom News Consumption Survey 2018Base: All adults 16+ using TV/Newspapers/Radio/Internet for news – 2018=4479NOTE: ‘Google’= Google News + Google + YouTube. ‘Other intermediary’ includes MSN, Yahoo, AOL, Flipboard, NewsNow. We distinguish between retail news provision (the individual title or brand of each news source that provides content to the user e.g. ITV News) and wholesale news provision (the supply and production of the news for a retail news source e.g. ITN).
Figure 11.3

84PROMOTING CHOICE • SECURING STANDARDS • PREVENTING HARM
Section 12Importance of sources and attitudes to news

85
• More than a quarter (27%) of news users nominate BBC One as their single most important source. One in ten nominate ITV (10%) and one in twelve Facebook (8%).
– BBC website/app (6%), BBC News Channel (5%) and Sky News Channel (4%) are the next most important sources.
• Those aged 65+ are much more likely to prefer TV (63%), and BBC One (43%) in particular; 16-24s are more likely to prefer social media (37%), and Facebook (18%) in particular.
• Measures of quality, accuracy, trustworthiness and impartiality (among other things) are strongest amongst readers of magazines and weakest amongst social media users.
– Similar scores are recorded across the BBC TV, ITV and Sky News channels.
– LBC and BBC radio listeners are more likely to rate these stations highly.
– BBC and Sky News website/app users are more likely to rate these highly.
– All social media platforms score relatively poorly across the various attributes.
Summary – importance of and attitudes towards news

86
86
More than a quarter of news users nominate BBC One as their single most important source, while one in ten nominate ITV.
27%
10%
8%
6%
5%
4%
2%
2%
2%
BBC One
ITV/ITV WALES/UTV/STV
BBC website/app
BBC News Channel
Sky News Channel
BBC Radio 4
Daily Mail
Single most important news source – 2018All adults 16+ using TV/Newspapers/Radio/Internet/Magazine for news
Source: Ofcom News Consumption Survey 2018
Question: E1a. Looking at all the sources of news you have just said that you use, which one is most important to you?
Base: All adults 16+ specifying at least one source for news – 2018=4463
Only sources with an incidence of 2%+ in 2018 are shown.
Figure 12.1
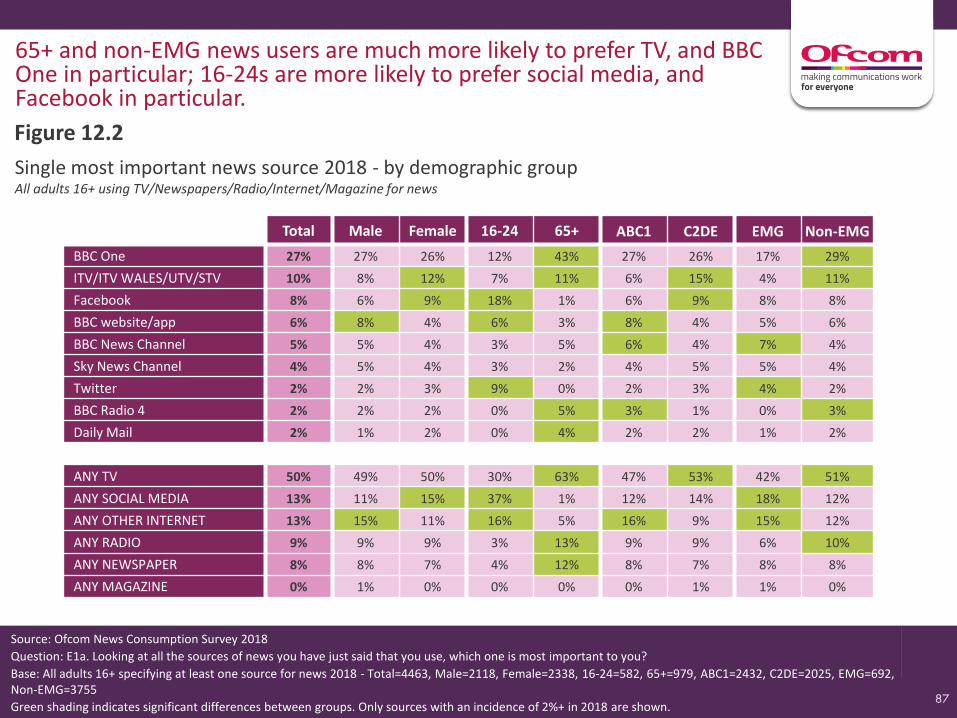
87
87
Single most important news source 2018 - by demographic groupAll adults 16+ using TV/Newspapers/Radio/Internet/Magazine for news
Source: Ofcom News Consumption Survey 2018
Question: E1a. Looking at all the sources of news you have just said that you use, which one is most important to you?
Base: All adults 16+ specifying at least one source for news 2018 - Total=4463, Male=2118, Female=2338, 16-24=582, 65+=979, ABC1=2432, C2DE=2025, EMG=692, Non-EMG=3755
Green shading indicates significant differences between groups. Only sources with an incidence of 2%+ in 2018 are shown.
Total Male Female 16-24 65+ ABC1 C2DE EMG Non-EMG
BBC One 27% 27% 26% 12% 43% 27% 26% 17% 29%
ITV/ITV WALES/UTV/STV 10% 8% 12% 7% 11% 6% 15% 4% 11%
Facebook 8% 6% 9% 18% 1% 6% 9% 8% 8%
BBC website/app 6% 8% 4% 6% 3% 8% 4% 5% 6%
BBC News Channel 5% 5% 4% 3% 5% 6% 4% 7% 4%
Sky News Channel 4% 5% 4% 3% 2% 4% 5% 5% 4%
Twitter 2% 2% 3% 9% 0% 2% 3% 4% 2%
BBC Radio 4 2% 2% 2% 0% 5% 3% 1% 0% 3%
Daily Mail 2% 1% 2% 0% 4% 2% 2% 1% 2%
ANY TV 50% 49% 50% 30% 63% 47% 53% 42% 51%
ANY SOCIAL MEDIA 13% 11% 15% 37% 1% 12% 14% 18% 12%
ANY OTHER INTERNET 13% 15% 11% 16% 5% 16% 9% 15% 12%
ANY RADIO 9% 9% 9% 3% 13% 9% 9% 6% 10%
ANY NEWSPAPER 8% 8% 7% 4% 12% 8% 7% 8% 8%
ANY MAGAZINE 0% 1% 0% 0% 0% 0% 1% 1% 0%
65+ and non-EMG news users are much more likely to prefer TV, and BBC One in particular; 16-24s are more likely to prefer social media, and Facebook in particular.
Figure 12.2

88
88
Respondents claim to follow the news in order to know what’s going on across the UK, the world, their region/nation and their local area.
56%
54%
54%
54%
47%
36%
34%
33%
30%
24%
16%
15%
13%
4%
3%
To know what’s going on across the UK
To know what’s going on around the world
To know what’s going on in Region/Nation
To know what’s going on in my local area
It’s important to keep informed about certain issues
For information about daily life, e.g. travel, health, taxes, education
It allows me to form opinions on the important issues
To get different perspectives on what’s happening
Out of habit - it’s part of my routine
It gives me something to talk about with others
To be knowledgeable for my job/work/studies
To pass the time when I’m waiting/travelling/commuting/bored
It provides some fun and entertainment
It’s everywhere I look
I don't follow news
Reasons for following news – 2018All adults 16+
Source: Ofcom News Consumption Survey 2018
Question: G1. Thinking about some of the reasons people might have for following news, which of these reasons apply to you?
Base: All adults 16+ - 2018=4618
Figure 12.3

89
89
Readers of magazines give the strongest ratings, followed by users of TV.
Attributes of news platforms - 2018% of ratings from regular users who rated source highly (7-10)
Source: Ofcom News Consumption Survey 2018
Question: E2. How important is <BRAND> as a source of news to you personally? E3. And to what extent do you think the following statements apply to <BRAND> as a news source? Answer using a scale of 1 to 10
Base: All ratings by those using each platform for news at least weekly (or every 2-3 weeks for weekly newspapers and magazines) 2018 – TV=8010, Newspapers=3786, Radio=2821 , Social media=2869, Other internet=3919, Magazines=239
Is important to me personally
Is high quality
Is accurate
Is trustworthy
Is impartial
Offers a range of opinions
Helps me make up my mind
Helps me understand what's going on in the world today
Has a depth of analysis and content not available elsewhere
72%
75%
71%
70%
63%
67%
60%
74%
63%
66%
64%
63%
63%
56%
61%
58%
64%
58%
63%
67%
66%
66%
59%
59%
54%
63%
54%
59%
41%
39%
39%
39%
56%
41%
50%
41%
66%
66%
64%
62%
57%
62%
57%
68%
60%
78%
82%
83%
80%
77%
79%
80%
84%
84%
TV Newspapers RadioSocialmedia
Otherinternet Magazines
Figure 12.4

90
90
The results are relatively similar among users of the BBC, ITV and Sky News TV channels.
Attributes of TV sources (1) - 2018% of regular users rating each source highly (7-10)
Source: Ofcom News Consumption Survey 2018
Question: E2. How important is <BRAND> as a source of news to you personally? E3. And to what extent do you think the following statements apply to <BRAND> as a news source? Answer using a scale of 1 to 10
Base: All using each source for news at least weekly 2018 – BBC TV=3112, ITV=1977, Sky News Channel=1052, Channel 4=742, Channel 5=423
Is important to me personally
Is high quality
Is accurate
Is trustworthy
Is impartial
Offers a range of opinions
Helps me make up my mind
Helps me understand what's going on in the world today
Has a depth of analysis and content not available elsewhere
77%
79%
74%
73%
61%
65%
58%
79%
63%
70%
75%
72%
73%
68%
69%
63%
72%
63%
72%
76%
72%
69%
64%
70%
61%
74%
68%
62%
66%
66%
63%
59%
65%
56%
69%
60%
55%
59%
58%
57%
57%
59%
53%
57%
52%
BBC TV ITV Sky News Channel
Channel 4 Channel 5
Figure 12.5

91
91
CNN scores strongly on ‘high quality’ and CNN and Al Jazeera score strongly on ‘helps me understand what's going on in the world today’.
Source: Ofcom News Consumption Survey 2018
Question: E2. How important is <BRAND> as a source of news to you personally? E3. And to what extent do you think the following statements apply to <BRAND> as a news source? Answer using a scale of 1 to 10
Base: All using each source for news at least weekly 2018 – bases shown above
NOTE: colour differences in the table are to show different ranges of scores. The results have not been tested for statistical significance.
80%+
60-79%
40-59%
<40%B
BC
TV
ITV
Sky
New
s C
han
nel
Ch
ann
el 4
Ch
ann
el 5
CN
N
Al J
aze
era
Euro
new
s
3112 1977 1052 742 423 268 143 106
Is important to me personally 77% 70% 72% 62% 55% 78% 64% 54%
Is high quality 79% 75% 76% 66% 59% 82% 74% 61%
Is accurate 74% 72% 72% 66% 58% 78% 69% 64%
Is trustworthy 73% 73% 69% 63% 57% 78% 67% 61%
Is impartial 61% 68% 64% 59% 57% 71% 62% 53%
Offers a range of opinions 65% 69% 70% 65% 59% 79% 68% 64%
Helps me make up my mind 58% 63% 61% 56% 53% 74% 71% 57%
Helps me understand what's going on in the world today 79% 72% 74% 69% 57% 80% 82% 68%
Has a depth of analysis and content not available elsewhere 63% 63% 68% 60% 52% 78% 76% 60%
Figure 12.6Attributes of TV sources (1) – 2018*% of regular users rating each source highly (7-10)

92
92
Results are similar among users of the BBC, ITV and Sky News.
Attributes of TV sources (2) - 2018% of regular users rating each source highly (7-10)
Source: Ofcom News Consumption Survey 2018
Question: E2. How important is <BRAND> as a source of news to you personally? E3. And to what extent do you think the following statements apply to <BRAND> as a news source? Answer using a scale of 1 to 10
Base: All using each source for news at least weekly 2018 – BBC TV=3112, ITV=1977, Sky News Channel=1052, Channel 4=742, Channel 5=423
Good for international news
Good for national news
Good for regional/local news
Good for understanding what's going on in other parts of the UK
Has high calibre journalists/ presenters
Helps me engage/ understand political process
78%
83%
74%
77%
78%
67%
74%
78%
79%
75%
73%
64%
79%
76%
51%
70%
76%
67%
67%
69%
46%
62%
66%
64%
56%
62%
47%
54%
57%
53%
BBC TV ITV Sky News Channel
Channel 4 Channel 5
Figure 12.7

93
93
BBC scores strongly on being ‘Good for national news’.
Attributes of TV sources (2) - 2018% of regular users rating each source highly (7-10)
Source: Ofcom News Consumption Survey 2018
Question: E2. How important is <BRAND> as a source of news to you personally? E3. And to what extent do you think the following statements apply to <BRAND> as a news source? Answer using a scale of 1 to 10
Base: All using each source for news at least weekly 2018 – bases shown above
NOTE: colour differences in the table are to show different ranges of scores. The results have not been tested for statistical significance.
BB
C T
V
ITV
Sky
New
s C
han
nel
Ch
ann
el 4
Ch
ann
el 5
3112 1977 1052 742 423
Good for international news 78% 74% 79% 67% 56%
Good for national news 83% 78% 76% 69% 62%
Good for regional/local news 74% 79% 51% 46% 47%
Good for understanding what's going on in other parts of the UK 77% 75% 70% 62% 54%
Has high calibre journalists/ presenters 78% 73% 76% 66% 57%
Helps me engage/ understand political process 67% 64% 67% 64% 53%
80%+
60-79%
40-59%
<40%
Figure 12.8

94
94
Readers of The Times, Mirror and The Guardian are more likely to score these newspapers highly for ‘is high quality’
Attributes of Newspaper sources - 2018% of regular users rating each source highly (7-10)
Source: Ofcom News Consumption Survey 2018
Question: E2. How important is <BRAND> as a source of news to you personally? E3. And to what extent do you think the following statements apply to <BRAND> as a news source? Answer using a scale of 1 to 10
Base: All using each source for news at least weekly (or every 2-3 weeks for weekly newspapers) 2018 – bases shown above
NOTE: colour differences in the table are to show different ranges of scores. The results have not been tested for statistical significance.
Dai
ly M
ail/
Mai
l on
Su
nd
ay
The
Sun
/Su
n o
n S
un
day
The
Met
ro
The
Tim
es/
Sun
day
Tim
es
Dai
ly/S
un
day
Mir
ror
The
Gu
ard
ian
/O
bse
rve
r
Dai
ly/S
un
day
Tele
grap
h
Loca
l dai
ly
new
spap
er
Dai
ly/S
un
day
Exp
ress
Even
ing
Stan
dar
d
Dai
ly/S
un
day
St
ar
614 430 365 310 272 251 233 206 202 193 107
Is important to me personally 69% 63% 59% 72% 65% 75% 72% 71% 64% 56% 62%
Is high quality 70% 55% 51% 80% 62% 82% 81% 54% 63% 45% 55%
Is accurate 63% 56% 59% 76% 58% 79% 67% 56% 65% 49% 49%
Is trustworthy 64% 53% 59% 72% 59% 78% 70% 60% 62% 48% 52%
Is impartial 53% 49% 56% 67% 50% 71% 53% 50% 56% 42% 54%
Offers a range of opinions 66% 54% 54% 73% 59% 75% 62% 46% 60% 47% 57%
Helps me make up my mind 62% 52% 50% 66% 57% 78% 60% 47% 56% 48% 52%
Helps me understand what's going on in the world today 71% 59% 60% 79% 64% 82% 71% 40% 64% 54% 57%
Has a depth of analysis and content not available elsewhere 63% 50% 47% 75% 57% 77% 69% 44% 59% 48% 49%
80%+
60-79%
40-59%
<40%
Figure 12.9
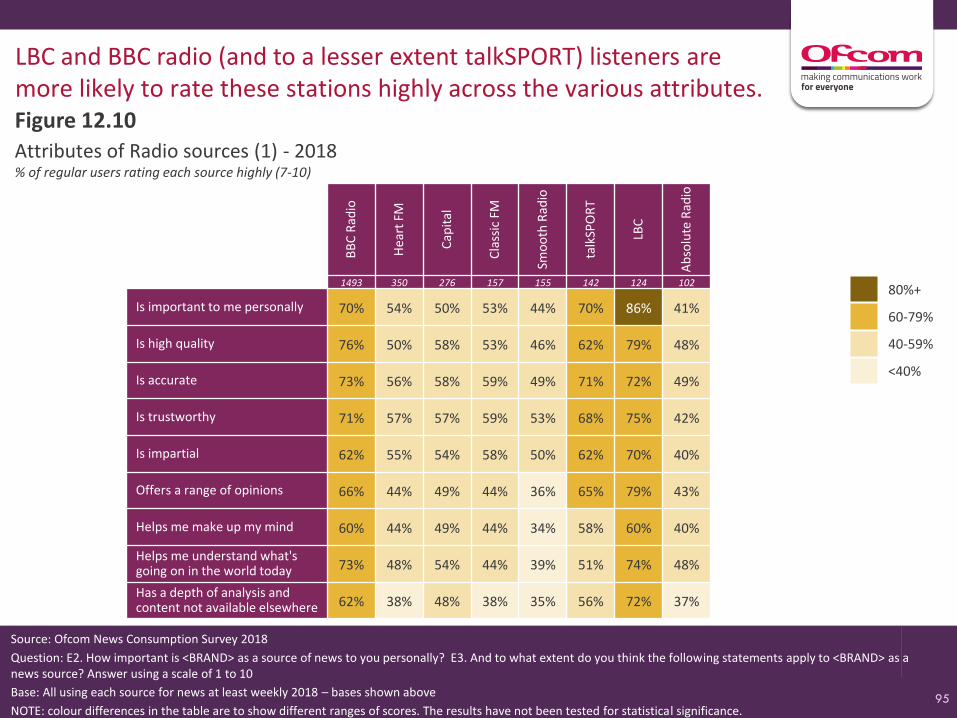
95
95
LBC and BBC radio (and to a lesser extent talkSPORT) listeners are more likely to rate these stations highly across the various attributes.
Attributes of Radio sources (1) - 2018% of regular users rating each source highly (7-10)
Source: Ofcom News Consumption Survey 2018
Question: E2. How important is <BRAND> as a source of news to you personally? E3. And to what extent do you think the following statements apply to <BRAND> as a news source? Answer using a scale of 1 to 10
Base: All using each source for news at least weekly 2018 – bases shown above
NOTE: colour differences in the table are to show different ranges of scores. The results have not been tested for statistical significance.
BB
C R
adio
He
art
FM
Cap
ital
Cla
ssic
FM
Smo
oth
Rad
io
talk
SPO
RT
LBC
Ab
solu
te R
adio
1493 350 276 157 155 142 124 102
Is important to me personally 70% 54% 50% 53% 44% 70% 86% 41%
Is high quality 76% 50% 58% 53% 46% 62% 79% 48%
Is accurate 73% 56% 58% 59% 49% 71% 72% 49%
Is trustworthy 71% 57% 57% 59% 53% 68% 75% 42%
Is impartial 62% 55% 54% 58% 50% 62% 70% 40%
Offers a range of opinions 66% 44% 49% 44% 36% 65% 79% 43%
Helps me make up my mind 60% 44% 49% 44% 34% 58% 60% 40%
Helps me understand what's going on in the world today 73% 48% 54% 44% 39% 51% 74% 48%
Has a depth of analysis and content not available elsewhere 62% 38% 48% 38% 35% 56% 72% 37%
80%+
60-79%
40-59%
<40%
Figure 12.10

96
96
LBC scores strongly on ‘Helps me engage with/understand the political process’, but performs less well on ‘Good for regional/local news’.
Attributes of Radio sources (2) - 2018% of regular users rating each source highly (7-10)
Source: Ofcom News Consumption Survey 2018
Question: E2. How important is <BRAND> as a source of news to you personally? E3. And to what extent do you think the following statements apply to <BRAND> as a news source? Answer using a scale of 1 to 10
Base: All using each source for news at least weekly 2018 – BBC Radio=1493, LBC=124
70%
76%
62%
72%
74%
66%
67%
78%
56%
76%
72%
81%
BBC Radio LBC
Good for international news
Good for national news
Good for regional/local news
Good for understanding what's going on in other parts of the UK
Has high calibre journalists/ presenters
Helps me engage/ understand political process
Figure 12.11

97
97
Social media platforms score relatively poorly across all attributes. They perform most strongly on ‘important to me’ and ‘offers a range of opinions’.
Attributes of Social Media - 2018% of regular users rating each source highly (7-10)
Source: Ofcom News Consumption Survey 2018
Question: E2. How important is <BRAND> as a source of news to you personally? E3. And to what extent do you think the following statements apply to <BRAND> as a news source? Answer using a scale of 1 to 10
Base: All using each source for news at least weekly 2018 – Facebook=1551, Twitter=649, Instagram=402, Snapchat=267
57%
39%
36%
35%
37%
56%
38%
50%
38%
63%
48%
43%
45%
43%
66%
47%
55%
48%
57%
41%
42%
41%
41%
49%
40%
45%
39%
59%
43%
40%
40%
41%
45%
43%
44%
41%
Facebook Twitter SnapchatInstagram
Is important to me personally
Is high quality
Is accurate
Is trustworthy
Is impartial
Offers a range of opinions
Helps me make up my mind
Helps me understand what's going on in the world today
Has a depth of analysis and content not available elsewhere
Figure 12.12

98
98
BBC and Sky News users are more likely to rate these websites/apps highly across the various attributes – especially on ‘high quality’ and ‘Helps me understand what's going on in the world today’.
Attributes of Other Internet sources - 2018% of regular users rating each source highly (7-10)
Source: Ofcom News Consumption Survey 2018Question: E2. How important is <BRAND> as a source of news to you personally? E3. And to what extent do you think the following statements apply to <BRAND> as a news source? Answer using a scale of 1 to 10Base: All using each source for news at least weekly 2018 – bases shown above*ITV/ITN website/app – only includes ratings of ITV/ITN specifically, does not include ratings of STV or UTV website/appNOTE: colour differences in the table are to show different ranges of scores. The results have not been tested for statistical significance.
BB
C
web
site
/ap
p
Sky
New
sw
ebsi
te/a
pp
Dai
ly M
ail
web
site
/ap
p
Gu
ard
ian
/ O
bse
rve
r
You
Tub
e
Go
ogl
e N
ew
s
MSN
Ne
ws
Yah
oo
Ne
ws
Hu
ffin
gto
n
Po
st
ITV
/ITN
*w
ebsi
te/a
pp
Tele
grap
h
web
site
/ap
p
Ind
epen
den
t w
ebsi
te/a
pp
989 290 286 253 224 187 180 175 170 154 117 113
Is important to me personally 77% 74% 56% 68% 62% 76% 60% 54% 50% 63% 47% 59%
Is high quality 81% 80% 51% 74% 53% 65% 50% 44% 47% 67% 64% 64%
Is accurate 78% 74% 52% 68% 43% 61% 50% 43% 50% 70% 59% 69%
Is trustworthy 76% 73% 48% 72% 41% 60% 49% 46% 48% 66% 55% 59%
Is impartial 68% 74% 40% 52% 44% 61% 49% 42% 49% 62% 46% 54%
Offers a range of opinions 69% 74% 48% 60% 67% 66% 50% 48% 54% 66% 57% 60%
Helps me make up my mind 66% 68% 47% 63% 50% 59% 44% 37% 43% 63% 53% 58%
Helps me understand what's going on in the world today 80% 82% 58% 76% 56% 74% 53% 51% 58% 67% 62% 68%
Has a depth of analysis and content not available elsewhere 66% 75% 47% 73% 57% 59% 45% 35% 50% 65% 63% 62%
80%+
60-79%
40-59%
<40%
Figure 12.13

99PROMOTING CHOICE • SECURING STANDARDS • PREVENTING HARM
Section 13International news

100
• Among news users, TV is the most popular platform for accessing international news (62%), followed by radio (25%) or printed newspapers (24%) . – Four in five users of these platforms for international news say they are satisfied
with the quality of the news provided through these platforms.
• One in five news users (18%) say they use social media for international news, however only two thirds of users of this platform for international news (65%) are satisfied with the quality of the news provided here.
Summary – international news

101
101
Source: Ofcom News Consumption Survey 2018
Question: F1. From which of the following sources do you get international news nowadays? Base: All adults 16+ who follow news – 2018=4523
F2. How satisfied are you with the quality of international news available from xxxx? Base: All adults 16+ using each source – 2018=130 to 2851
62%
25%
24%
5%
15%
17%
13%
10%
8%
7%
18%
3%
16%
7%
Television news (on TV)
Radio
Newspapers (printed)
Magazines (printed)
Search engines
Websites/apps of newspapers
Websites/apps of TV and radio companies
Websites/apps of news intermediaries
Websites/apps of online news organisations
Websites/apps of news magazines
Social media
Blogs
Word of mouth
Don't follow international news
As with news in general, TV is the most popular platform for accessing international news. Four in five who use TV for international news are satisfied with the quality of that news.
Platforms used to access international news - 2018All adults 16+ who follow news
82%
78%
82%
70%
75%
78%
76%
71%
73%
68%
65%
60%
68%
Websites/apps
Traditional media
Social media
Other
% of users that are satisfied with the quality of
international news provided
Figure 13.1

102PROMOTING CHOICE • SECURING STANDARDS • PREVENTING HARM
Section 14Local news

103
• TV is also the most popular platform for accessing local news among news users.
• Half of news users say they watch regional and local broadcasts on BBC TV (48%) and one third ITV (32%).
– More than four in five of these are satisfied with the quality of news these channels provide.
• Almost one in four (23%) news users use printed local or regional newspapers and one in six (16%) say they use social media for local news.
Summary – local news

104
104
Source: Ofcom News Consumption Survey 2018
Question: F8: Thinking particularly about local news, which of the following do you use? Base: All adults 16+ who follow news – 2016=2710, 2018=4523
F9. How satisfied are you with the quality of the local news available from xxxx? Base: All using each source – 2018=132 to 2110 *sample size <100
48%
32%
13%
10%
23%
6%
8%
9%
5%
3%
16%
2%
21%
3%
Regional/local broadcasts on BBC TV
Regional/local broadcasts on ITV/ITV Wales/STV/UTV
News bulletins on local/nations BBC radio station
Radio news on local commercial
Printed local or regional newspapers
Printed local or regional magazines
Websites/apps of TV and radio companies
Websites/apps of local or regional newspapers
Websites/apps of local or regional news magazines
Websites/apps of other news outlets
Social media
Blogs
Word of mouth
Don't follow local news
TV is the most popular platform for accessing local news - half of news users watch BBC TV and one third ITV. More than four in five of these are satisfied with the quality of news these channels provide.
Platforms used to access local news - 2018All adults 16+ who follow news
Websites/apps
Newspapers/ Magazines
Radio
TV
Social media
Other
84%
86%
84%
83%
79%
74%
82%
73%
76%
69%
72%
*
74%
% of users that are satisfied with the quality of local
news provided
Figure 14.1

105PROMOTING CHOICE • SECURING STANDARDS • PREVENTING HARM
Section 15News consumption in the nations

106
• Among all adults, BBC One is the most used source for news in Wales (68%), Scotland (64%) and England (62%). ITV/STV/UTV is the most popular source in Northern Ireland (63%)
– ITV/STV is second-most used in Scotland (54%), Wales (45%) and England (39%). BBC One is second-most used in Northern Ireland (52%)
• Facebook is the third most popular source across all nations, being used by one in three.
• Adults in Wales are the most likely of all UK nations to say they’re very interested in news about their nation (55% very interested vs. 35% across UK as a whole).
Summary – news consumption in the Nations

107
107
Compared to other nations, Scottish respondents are more likely to use TV for news, while English and Welsh respondents are more likely to use the internet.
Platforms used for news in general nowadays 2018 – by nationAll adults 16+
Source: Ofcom News Consumption Survey 2018
Question: C1. Which of the following platforms do you use for news nowadays?
Base: All adults 16+ 2018 – England=3206, Scotland=540, Wales=458, Northern Ireland=414
79%
66%
44%
39%
45%
41%
31%
12%
10%
2%
84%
55%
43%
23%
37%
38%
28%
7%
6%
1%
80%
59%
42%
33%
47%
30%
28%
5%
6%
2%
78%
51%
41%
24%
40%
25%
28%
5%
5%
6%
Television
Any internet
Social media
Other internet
Radio
Newspapers (printed)
Word of mouth
Magazines (printed)
Interactive TV services
Don't follow the news
England
Scotland
Wales
Northern Ireland
Figure 15.1
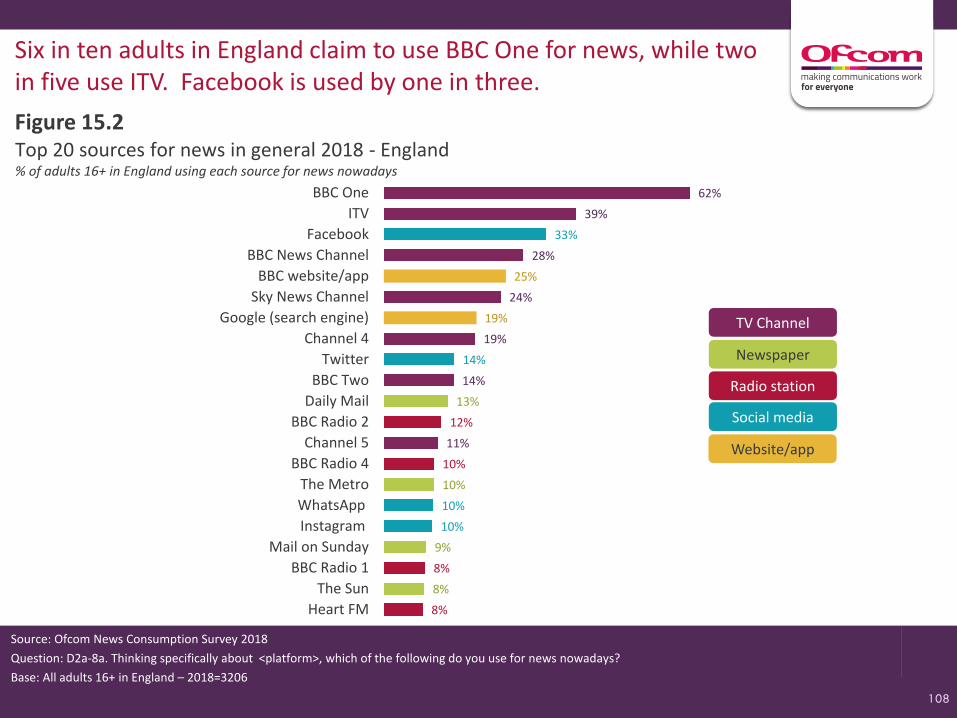
108
108
Top 20 sources for news in general 2018 - England% of adults 16+ in England using each source for news nowadays
Source: Ofcom News Consumption Survey 2018
Question: D2a-8a. Thinking specifically about <platform>, which of the following do you use for news nowadays?
Base: All adults 16+ in England – 2018=3206
Six in ten adults in England claim to use BBC One for news, while two in five use ITV. Facebook is used by one in three.
Social media
Radio station
Newspaper
TV Channel
Website/app
62%
39%
28%
24%
19%
14%
11%
13%
10%
9%
8%
12%
10%
8%
8%
33%
14%
10%
10%
25%
19%
BBC One
ITV
BBC News Channel
BBC website/app
Sky News Channel
Google (search engine)
Channel 4
BBC Two
Daily Mail
BBC Radio 2
Channel 5
BBC Radio 4
The Metro
Mail on Sunday
BBC Radio 1
The Sun
Heart FM
Figure 15.2

109
109
Top 20 sources for news in general 2018 – Scotland% of adults 16+ in Scotland using each source for news nowadays
Source: Ofcom News Consumption Survey 2018
Question: D2a-8a. Thinking specifically about <platform>, which of the following do you use for news nowadays?
Base: All adults 16+ in Scotland – 2018=540
Almost two thirds of adults in Scotland use BBC One for news, whilst half use STV. Again, Facebook is used by one in three.
Social media
Radio station
Newspaper
TV Channel
Website/app
64%
54%
24%
17%
13%
10%
8%
10%
9%
10%
9%
8%
8%
8%
33%
11%
7%
7%
14%
7%
BBC One
STV
Sky News Channel
BBC News Channel
BBC website/app
Channel 4
BBC Radio 2
The Daily Record
BBC Two
The Sun
BBC Radio 1
BBC Radio Scotland
BBC Radio 4
Local commercial radio
Channel 5
Google (search engine)
Google +
Figure 15.3

110
110
Top 20 sources for news in general 2018 – Wales % of adults 16+ in Wales using each source for news nowadays
Source: Ofcom News Consumption Survey 2018
Question: D2a-8a. Thinking specifically about <platform>, which of the following do you use for news nowadays?
Base: All adults 16+ in Wales – 2018=458
More than two thirds of adults in Wales use BBC One for news, while almost half use ITV. Facebook is again used by one in three.
Social media
Radio station
Newspaper
TV Channel
Website/app
68%
45%
26%
19%
13%
12%
7%
10%
8%
7%
14%
14%
11%
10%
8%
35%
13%
7%
22%
10%
BBC One
ITV WALES
Sky News Channel
BBC website/app
BBC News Channel
BBC Radio 2
BBC Radio 4
BBC Two
Channel 4
Heart FM
Daily Mail
Google (search engine)
BBC Radio Wales/Cymru
Mail on Sunday
BBC Radio 1
Local daily newspaper
Channel 5
Figure 15.4

111
111
Top 20 sources for news in general 2018 – Northern Ireland% of adults 16+ in Northern Ireland using each source for news nowadays
Source: Ofcom News Consumption Survey 2018
Question: D2a-8a. Thinking specifically about <platform>, which of the following do you use for news nowadays?
Base: All adults 16+ in Northern Ireland – 2018=414
Six in ten of adults in Northern Ireland use UTV, while almost half use BBC One. Facebook is used by one in three.
Social media
Radio station
Newspaper
TV Channel
Website/app
63%
52%
21%
12%
11%
8%
5%
5%
11%
9%
7%
6%
22%
18%
12%
35%
11%
9%
6%
15%
10%
UTV
BBC One
BBC Radio Ulster
Sky News Channel
Cool FM
BBC website/app
BBC Radio 1
Channel 4
The Belfast Telegraph
BBC News Channel
Google (search engine)
The Sun
RTE Channels / TV3 / TG4
Daily Mail
Sunday Life
Channel 5
BBC Two
Figure 15.5

112
112
BBC One is the most important news source in Scotland, Wales and England, whereas UTV is the most important source in Northern Ireland.
26%
9%
7%
6%
5%
4%
2%
3%
2%
32%
18%
9%
5%
3%
5%
3%
1%
1%
31%
9%
9%
6%
3%
6%
1%
3%
2%
19%
32%
13%
3%
0%
1%
2%
0%
0%
BBC One
ITV/ITV WALES/UTV/STV
BBC website/app
BBC News Channel
Sky News Channel
BBC Radio 4
Daily Mail
England
Scotland
Wales
Northern Ireland
Single most important source for news in general – by NationAll adults 16+ in each Nation using TV/Newspapers/Radio/Internet/Magazine for news
Source: Ofcom News Consumption Survey 2018
Question: E1a. Looking at all the sources of news you have just said that you use, which one is most important to you?
Base: All adults 16+ using TV/Newspapers/Radio/Internet/Magazine for news – England=3114, Scotland=524, Wales=448, Northern Ireland=377
Only sources with an incidence of 2%+ in 2018 for the Total sample are shown.
Figure 15.6

113
113
Level of interest in news about own nation 2018 – by NationAll adults 16+ who follow news
35% 32%
49%55%
37%
46% 47%
42% 31%
42%
13% 14%
6%10%
11%
5% 5%3% 3%
9%2% 2% 1% 2%
TotalUK
England Scotland Wales NorthernIreland
Not at all interested
Not very interested
Neither/nor
Quite interested
Very interested
Adults in Wales are the most likely to say they’re very interested in news about their nation.
Source: Ofcom News Consumption Survey 2018
Question: F3. How interested are you in news about <NATION>?
Base: All adults 16+ who follow news 2018 - Total=4523, England=3151, Scotland=532, Wales=451, Northern Ireland=389
Figure 15.7

114
114
Source: Ofcom News Consumption Survey 2018
Question: F4. Thinking particularly about your source of news for what is going on in NATION, which of the following do you use?Base: All adults 16+ who follow news in Scotland/Wales/N Ireland – 2016=1032, 2018=1371
F5. How satisfied are you with the quality of the news about NATION available from xxxx? Base: All using each source – 2018=109 to 970 *sample size <100
69%
23%
22%
2%
9%
8%
6%
6%
5%
2%
21%
1%
26%
3%
Television news (on TV)
Radio
Newspapers (printed)
Magazines (printed)
Search engines
Websites/apps of newspapers
Websites/apps of TV and radio companies
Websites/apps of news intermediaries
Websites/apps of news magazines
Websites/apps of online news organisations
Social media
Blogs
Word of mouth
Don't follow news about Nation
TV is the most popular platform for accessing news about their own nation. Nine in ten users are satisfied with the quality of news about their nation provided on TV.
Platforms used to access news about own nation - 2018All in Scotland/Wales/N Ireland who follow news
89%
87%
87%
*
74%
82%
*
*
*
*
81%
*
80%
Websites/apps
Traditional media
Social media
Other
% of users that are satisfied with the quality of news about Nation provided
Figure 15.8

115
115
Source: Ofcom News Consumption Survey 2018
Question: F4. Thinking particularly about your source of news for what is going on in NATION, which of the following do you use?
Base: All adults 16+ who follow news – Scotland=532, Wales=450 , N Ireland=389
69%
21%
25%
1%
10%
8%
6%
7%
4%
2%
20%
0%
26%
2%
Television news (on TV)
Radio
Newspapers (printed)
Magazines (printed)
Search engines
Websites/apps of newspapers
Websites/apps of TV and radio companies
Websites/apps of news intermediaries
Websites/apps of news magazines
Websites/apps of online news organisations
Social media
Blogs
Word of mouth
Don't follow news about Nation
Similar trends are noted across Scotland, Wales and N Ireland. However, newspapers are more prominent in Scotland; radio in N Ireland.
Platforms used to access news about own nation 2018 – by NationAll in Scotland/Wales/N Ireland who follow news
Websites/apps
Traditional media
Social media
Other
Scotland Wales Northern Ireland
69%
25%
21%
3%
7%
10%
6%
3%
5%
2%
20%
1%
26%
4%
68%
29%
15%
1%
10%
6%
7%
7%
5%
1%
24%
0%
30%
4%
Figure 15.9

116
116
Sources used to access news about own nation - 2018All adults 16+ using TV/Newspapers/Radio/Internet/Magazine for news
The most popular news source across all platforms is BBC One in England, Scotland and Wales and UTV in Northern Ireland. Facebook is the third most popular channel in each nation.
Source: Ofcom News Consumption Survey 2018
Question: F6. From which of the following sources do you get news about what is going on in your NATION nowadays?
Base: All adults 16+ using TV/Newspapers/Radio/Internet/Magazine for news - England=3115, Scotland=524, Wales=448, Northern Ireland=377
Only sources with an incidence of 3%+ in each Nation are shown
BBC One 43% BBC One 47% BBC One 53% UTV 57%
ITV 23% STV 44% ITV WALES 34% BBC One 40%
Facebook 13% Facebook 15% Facebook 16% Facebook 20%
BBC website/app 7% The Daily Record 9% BBC website/app 9% BBC Radio Ulster 12%
BBC local/regional radio station 6% BBC website/app 6% BBC Radio Wales/Cymru 8% Cool FM 10%
BBC News Channel 5% Local commercial radio station 6% Local daily newspaper 6% The Belfast Telegraph 6%
Local daily newspaper 4% BBC Radio Scotland 6% Heart FM 5% BBC website/app 6%
Twitter 3% Sky News Channel 6% Any Wales based news site/app 4% RTE Channels/TV3/TG4 6%
Google (search engine) 3% The Sun 5% S4C 4% Twitter 5%
Local newspaper websites/app 3% Twitter 4% Twitter 3% BBC Radio 1 4%
Sky News Channel 3% Channel 4 4% Capital radio 3% BBC News Channel 4%
The Sunday Mail 3% The Western Mail 3% Sky News Channel 4%
BBC News Channel 3% Sky News Channel 3% WhatsApp 3%
The Sunday Herald 3% Local paid weekly newspaper 3% The Irish News 3%
BBC Radio 1 3% Local newspaper websites/app 3% Google (search engine) 3%
The Press and Journal 3% Instagram 3%
Don’t follow Nation news 11% Don’t follow Nation news 2% Don’t follow Nation news 3% Don’t follow Nation news 2%
England Scotland Wales Northern Ireland
Figure 15.10

117PROMOTING CHOICE • SECURING STANDARDS • PREVENTING HARM
Section 16Current affairs

118
• UK adults are more likely to feel it is important ‘to society overall’ that broadcasters provide current affairs programmes – Two thirds of adults (63%) feel it is important ‘to society overall’ – Half (51%) feel it is important ‘to them personally’
• Two thirds of adults (66%) claim to watch current affairs programmes on TV, with one in five (18%) listening to current affairs programmes on the radio – Three quarters (72%) of those watching do so on BBC One– Two fifths (40%) of those listening do so on BBC Radio 4
Summary – current affairs

119
119
Attitudes to current affairs programmes - 2018All adults 16+
8%
14%
6%
6%
6%
6%
6%
7%
7%
6%
9%
4%
4%
4%
4%
4%
5%
4%
24%
26%
21%
19%
20%
21%
20%
20%
22%
36%
30%
31%
38%
37%
37%
38%
38%
38%
27%
21%
38%
33%
33%
32%
31%
31%
29%
To society overall
To respondent personally
Are impartial
Help me understand what’s goingon in the world today
Provide high quality commentary and interpretation of the events/issues
Provide a good depth of analysis
Offer a range of opinions
Provide investigative journalism
Cover international topics
Not at all important(1-2)
Not veryimportant(3-4)
Neither/nor(5-6)
Quiteimportant(7-8)
Veryimportant(9-10)
Two thirds of UK adults feel it is important ‘to society overall’ that broadcasters provide current affairs programmes, whereas only half feel it is important ‘to them personally’.
Source: Ofcom News Consumption Survey 2018
Question: H1/H2. On a scale of 1 -10 where 1 means not at all important and 10 means extremely important, how important for [you personally / society overall] is it that broadcasters provide current affairs programmes? H3. How important for you personally is it that current affairs programmes…
Base: All adults 16+ - 2018=4618
Importance of broadcasters providing current affairs programmes
Importance to respondent that current affairs programmes…
63%
51%
69%
71%
70%
69%
70%
69%
67%
% Quite/very
important
Figure 16.1

120
120
Source: Ofcom News Consumption Survey 2018
Question: H4. Which of the following do you use to watch or listen to current affairs programmes nowadays? Base: All adults 16+ - 2018=4618
H5. Thinking specifically about television, which of the following do you use to watch current affairs programmes nowadays? Base: All watching current affairs programmes on TV=3028 H6. Thinking specifically about radio stations, which of the following do you use to listen to current affairs programmes nowadays? Base: All listening to current affairs programmes on radio=817
72%
35%
27%
22%
21%
15%
11%
7%
6%
3%
1%
1%
BBC One
ITV/ITV WALES/UTV/STV
BBC Two
Channel 4
BBC News Channel
Sky News Channel
Channel 5
BBC Four
CNN
BBC Three (via iPlayer)
BBC Alba
CNBC
Two thirds of adults watch current affairs programmes on TV, with three quarters of these doing so on BBC One.
Platforms/sources used to access current affairs programmes - 2018All adults 16+
66% of adults watch current affairs programmes on TV, via…
40%
20%
19%
18%
13%
12%
7%
6%
4%
BBC Radio 4
BBC local/Nations radio station
BBC Radio 2
BBC Radio 5 Live
BBC World Service
LBC
Talk Radio
talkSPORT
BBC Asian Network
18% of adults listen to current affairs programmes on the radio, via…
29% of adults don’t watch or listen to current affairs programmes
Figure 16.2

121
121
With the exception of channel 5, all sources score relatively well across the various attributes.
Attributes of sources used for current affairs programmes - 2018% of users rating each source highly (7-10)
Source: Ofcom News Consumption Survey 2018
Question: H7. To what extent do you think the following statements apply to <BRAND> as a current affairs source? Answer using a scale of 1 to 10
Base: All using each source for current affairs programmes 2018 – BBC TV=2540, ITV=1156, Channel 4=674, Sky=449, Channel 5=319, BBC Radio=646, LBC=99
NOTE: colour differences in the table are to show different ranges of scores. The results have not been tested for statistical significance.
BBC TV
ITVChannel
4Sky
Channel5
BBC Radio
LBC
Covers international topics 85% 84% 86% 87% 76% 84% 84%
Provides high quality commentary and interpretation of the events/issues
84% 83% 85% 86% 79% 83% 85%
Helps me understand what’s going onin the world today
84% 83% 85% 85% 79% 85% 89%
Provides a good depth of analysis 83% 82% 86% 85% 74% 84% 84%
Provides investigative journalism 83% 83% 87% 85% 81% 80% 80%
Offers a range of opinions 78% 81% 83% 79% 76% 82% 87%
Is impartial 72% 76% 80% 77% 78% 74% 75%
80%+
70-79%
60-69%
Figure 16.3

122PROMOTING CHOICE • SECURING STANDARDS • PREVENTING HARM
Section 17 How children aged 12-15 consume news

123
Summary – how 12-15s consume news
• Three in five 12-15 year olds claim to be interested in the news.• Three quarters (77%) claim to consume news on a weekly basis, with three fifths (62%) actively
looking for news. • TV is the most popular platform for following the news (68%), followed by talking to family (64%),
then social media and talking to friends (both 56%).– Social media is used most often for celebrity, music and fashion news. – TV is used most often for all other types of news content.
• The most popular news source across platforms is BBC One/Two (45%), followed by Facebook (34%), then ITV (30%) and YouTube (27%).
• Across all platforms, an average of 3.7 individual sources are used for news. – On average, social media news users say they have the most individual sources (2.6).
• More than half claim to access news via social media. – They are most likely to access news via comments, links to news and trending news.
• 12-15 year olds are most likely to find out about TV sources and the BBC website/app from parent(s), and find out about social media sources from friends
• Family, radio and TV are perceived to be the most truthful sources.– Only one in three think news stories on social media are reported truthfully (34%)– Just over one in three normally think about whether a news story on social media is actually
true (36%). • Three quarters claim to have heard about ‘fake news’ (78%) and say they’re aware of its meaning
(74%). Two in five claim to have seen a ‘fake news’ story.

124
124
Three in five 12-15s claim to be interested in the news. The main reason for a lack of interest is that it is ‘boring’.
Overall interest in following the newsAll kids aged 12-15
Source: Ofcom Kids News Consumption Survey 2018
Question: B1. How interested are you in reading, watching, listening to or following news? Base: All kids aged 12-15 – 2018=1001
Question: B2. Why are you not interested in reading, watching, listening to or following news? Base: All not interested in following news – 2018=395
Not at all interested
11%
Not very interested
28%Quite
interested46%
Very interested
14%
Interest in reading, listening toor following news
39% are not interested in following the news, because it’s…
41%
23%
13%
11%
7%
Too boring
Not relevant for people my age
Too upsetting
All sounds the same
I don’t understand it
Figure 17.1

125
125
Main reasons for being interested in the news are ‘it’s important to know what’s going on’, followed by ‘it helps me learn about new things’.
53%
47%
41%
32%
30%
17%
14%
14%
9%
It’s important to know what’s going on
It helps me to learn about or find out new things
It makes me think
It gives me something to talk about with family
It gives me something to talk about with friends
It shocks or scares me
It makes me laugh
It inspires me to try something new or different
I don’t follow the news
Reasons for following the newsAll kids aged 12-15
Source: Ofcom Kids News Consumption Survey 2018
Question: F1. Here are some reasons that young people might have for reading, watching, listening to or following news. Which of these apply to you?
Base: All kids aged 12-15 – 2018=1001
Figure 17.2

126
126
In particular, 12-15 year olds are interested in music and celebrity news. One in five are most interested in sport/sports personalities.
Interest in different types of news contentAll kids aged 12-15
Source: Ofcom Kids News Consumption Survey 2018
Question: B3. Here are some different types of news. Which, if any, of these are you interested in? B4. Which of these types of news are you most interested in?
Base: All kids aged 12-15 – 2018=1001
58%
47%
43%
40%
39%
39%
39%
37%
37%
34%
16%
4%
43%
32%
24%
21%
29%
24%
22%
21%
13%
18%
7%
18%
11%
8%
7%
19%
7%
9%
7%
2%
3%
3%
Music news/ singers/ musicians
Celebrities/ famous people/ actors
Animals or the environment
Local news or events
Sports/ sports personalities
Serious things going on in the UK
Science and technology
Fashion and beauty
Weather
Serious things going on in other countries
Politics or current affairs
Don’t follow news about any of these
Content most In the Have someinterested in top 3 interest in
Figure 17.3

127
127
Frequency of following the newsAll kids aged 12-15
Source: Ofcom Kids News Consumption Survey 2018Question: B5. How often do you read, watch, listen to or follow the news? Base: All kids aged 12-15 – 2018=1001B6. Sometimes people find out about the news because others are watching, listening to or talking about it. On other occasions they may see a news story online, when they’re lookling for something else. How often, if at all, do you come across the news like this?B7. Sometimes people actively look for news. For example, they decide to watch it on TV, listen to it on the radio or read it in the paper. On other occasions, they may go online to look for news, sign up to news alerts or read news updates on social media. How often, if at all do, you actively read, watch, listen to or follow the news like this?
17% 13% 11%
38% 42%
27%
21% 27%
24%
17%15%
27%
6% 3%11%
Read/ watch/ listen/ follow the news
See news inadvertently- find out news from other people or see news while looking for something
else
Actively look for news - decide to read/ watch/ listen/
follow the news
Never
Less often
Weekly
Most days in a week
Every day
Three quarters claim to consume news on a weekly basis. An additional 5% say they don’t consume news, but are inadvertently exposed to it. Three fifths look for news.
77% 82% 62% % at least oncea week
Figure 17.4

128
128
TV is the most popular way to follow the news, followed by talking to family, then social media and talking to friends.
Source: Ofcom Kids News Consumption Survey 2018
Question: C1. Here is a list of different ways you can find out about or get updates on news stories. Which of these ways do you ever use?
C2. And which of these ways do you use the most to get updates on news stories?
Base: All kids aged 12-15 – 2018=1001
68%
64%
56%
56%
31%
27%
20%
19%
14%
3%
57%
49%
44%
35%
20%
13%
12%
11%
6%
29%
15%
22%
10%
7%
3%
5%
2%
2%
TV
Talking with family
Social media
Talking with friends
Radio
Search engines
Other online sources
Newspapers (printed)
Magazines (printed)
None of these
Used In the Evermost often top 3 use
All platforms used for news nowadays All kids aged 12-15
Figure 17.5

129
129
Platforms/method used most often for different types of news content All kids aged 12-15 who follow each type of news content
20% 23%
35%27%
36%46%
35%
16%
47% 48% 46%
39%42% 21%
11%
20%9%
17%
39%
10% 9% 9%
3%
5%
9%
3%
5%3% 13% 5%
8% 5%2%
3%
3%6%
4%
5% 10%
10%
3%6% 9%
9%
4%
5% 10%
25%
8%13%
7%
5%
13% 12%15%
17%
14% 8%
10%9%
5%8%
19%
5% 4% 7%8%
3%3%
10% 3%9% 3%
3%6% 9% 5%
5% 7% 9%3% 3%
3%3% 6%4% 3% 6%
Musicnews/singers
Celebrities/famouspeople
Animals/environ-
ment
Localnews orevents
Sports/person-alities
Seriousissues inthe UK
Science/tech-nology
Fashion/beauty
Weather Inter-national
news
Politics/currentaffairs
Magazines (printed)
Newspapers (printed)
Radio
Talking with friends
Talking with family
Other online sources
Search engines
Social media
TV
Social media is used most often for celebrity, music and fashion news.TV is used most often for all other types of news content.
Source: Ofcom Kids News Consumption Survey 2018
Question: C3. Where do you tend to go most often for the following types of news stories?
Base: All kids aged 12-15 who follow each type of news content (bases shown above)
583 470 434 404 391 391 390 367 369 339 162
58% 47% 43% 40% 39% 39% 39% 37% 37% 34% 16%% who follow each type of news content
Figure 17.6

130
130
Top 20 news sourcesAll kids aged 12-15
Source: Ofcom Kids News Consumption Survey 2018
Question: D1. Which, if any, of the following do you use to read, watch, listen to or follow news stories?
E1a. Here is a list of all the news sources that you say you use. Which ONE of these is the most important news source to you?
Base: All kids aged 12-15 – 2018=1001
The most popular news source across all platforms is BBC One/Two, followed by Facebook, then ITV and YouTube.
45%
34%
30%
27%
23%
21%
17%
14%
14%
12%
10%
9%
9%
7%
6%
6%
6%
5%
5%
5%
20%
10%
7%
4%
4%
3%
3%
3%
3%
BBC One/BBC Two
Facebook (incl Messenger)
ITV/CITV/ITV WALES/UTV/STV
YouTube
Snapchat
Channel 4
CBBC (Newsround)
BBC/CBBC websites/apps
BBC Radio 1/Newsbeat
Capital
Heart FM
The Sun/Sun on Sunday
BBC Radio 2
The Metro
Newspaper websites/apps
Google+ (incl Hangouts)
The Daily Mail/Mail on Sunday
Most important Used to followsource news stories
Other internet
Radio station
Social media
TV Channel
Newspaper
Figure 17.7

131
131
TV: BBC One/Two are the most used channels. Social media: Facebook is most commonly used, followed by YouTube, Instagram and Snapchat.
TV and social media sources used for news nowadays All kids aged 12-15
Source: Ofcom Kids News Consumption Survey 2018
Question: C1. Here is a list of different ways you can find out about or get updates on news stories. Which of these ways do you ever use?Base: All kids aged 12-15 – 2018=1001
Question: D1. Which, if any, of the following do you use to read, watch, listen to or follow news stories? Base: All kids aged 12-15 using each platform – TV=682, Social media=556
65%
44%
20%
18%
BBC One/BBC Two
ITV/CITV/ITV WALES/UTV/STV
Channel 4
CBBC (Newsround)
68% follow news on TV. Of these, themain channels watched are…
61%
44%
41%
39%
31%
26%
9%
6%
3%
3%
Facebook (incl Messenger)
YouTube
Snapchat
Google+ (incl Hangouts)
Tumblr
Viber
56% follow news via social media.Of these, the main sites used are…
Figure 17.8
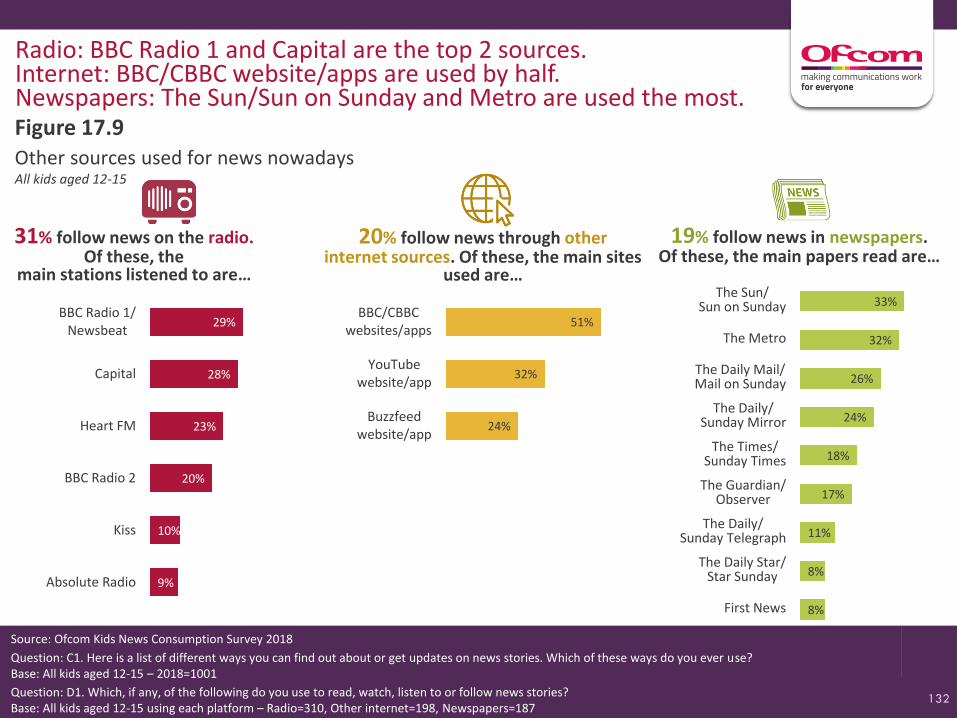
132
132
Radio: BBC Radio 1 and Capital are the top 2 sources.Internet: BBC/CBBC website/apps are used by half.Newspapers: The Sun/Sun on Sunday and Metro are used the most.
Other sources used for news nowadays All kids aged 12-15
Source: Ofcom Kids News Consumption Survey 2018
Question: C1. Here is a list of different ways you can find out about or get updates on news stories. Which of these ways do you ever use?Base: All kids aged 12-15 – 2018=1001
Question: D1. Which, if any, of the following do you use to read, watch, listen to or follow news stories? Base: All kids aged 12-15 using each platform – Radio=310, Other internet=198, Newspapers=187
29%
28%
23%
20%
10%
9%
BBC Radio 1/Newsbeat
Capital
Heart FM
BBC Radio 2
Kiss
Absolute Radio
31% follow news on the radio.Of these, the
main stations listened to are…
51%
32%
24%
BBC/CBBCwebsites/apps
YouTubewebsite/app
Buzzfeedwebsite/app
20% follow news through other internet sources. Of these, the main sites
used are…
33%
32%
26%
24%
18%
17%
11%
8%
8%
The Sun/Sun on Sunday
The Metro
The Daily Mail/Mail on Sunday
The Daily/Sunday Mirror
The Times/Sunday Times
The Guardian/Observer
The Daily/Sunday Telegraph
The Daily Star/Star Sunday
First News
19% follow news in newspapers.Of these, the main papers read are…
Figure 17.9

133
133
Number of individual sources named - by platform All kids aged 12-15 using each platform for news
16% 13%6%
11%18%
9% 7%
17%
43%
26%
52% 39%47%
25%
13%
27%
22%
25%
24% 21%
21%
13%
12%
19%
6%
9% 12%
16%
41%
5%
27%
5%11% 12%
31%
Across all platforms
TV Socialmedia
Radio OtherInternet
Newspapers All internet
4+ sources
3 sources
2 sources
1 source
0 sources
Across all platforms, an average of 3.7 individual sources are used for news. On average, social media news users have the most individual sources (2.6).
3.7 1.5 2.6 1.5 1.7 1.8 2.9 Mean no.
Source: Ofcom Kids News Consumption Survey 2018
Question: D1. Which, if any, of the following do you use to read, watch, listen to or follow news stories?
Base: All using each platform for news 2018 – All platforms=1001, TV=682, Social media=556, Radio=310, Other internet=198, Newspapers=187, All internet (Any users of Social media and/or Other Internet) = 613
Note: Some respondents did not name specific sources within a platform so appear as having zero sources
Figure 17.10

134
134
62% 66%54%
51% 48%
46%
30%38%
43%
18%15%
17%
23% 16%16%
News stories from friends/ family/
other people you follow
Trendingnews
News storiesfrom news
organisations
Comment on a news story
Share the news story
Look at a story or video but don’t click on it
Look at comments about a news story
Click on a news story or video
More than half claim to access news via social media. They are most likely to access news via comments, links to news stories and trending news. The most popular actions include clicking on stories and looking at comments.
Source: Ofcom Kids News Consumption Survey 2018Question: C7. Which, if any, of the following do you read or see on the social media sites or apps you use most often? Base: All using social media to follow news – 2018=556C8. Which, if any, of the following do you do when you read or see XXXX on social media sites or apps?Base: All accessing news from each source via social media – News stories from friends/family/other people=409, Trending news=281, News organisations=274Note: Columns do not sum to 100% (this was a multi-code question)
52%
52%
51%
37%
30%
Comments from friends/family/other people I
follow about news stories
Links to news stories posted by friends/ family/ other people I
follow
News stories that are trending
Links to news stories posted by news organisations
Comments from news organisations
How news is accessed via social mediaAll kids aged 12-15 using any social media to follow news
Actions normally taken when accessing news on SMAll accessing news from each source on social media
Figure 17.11
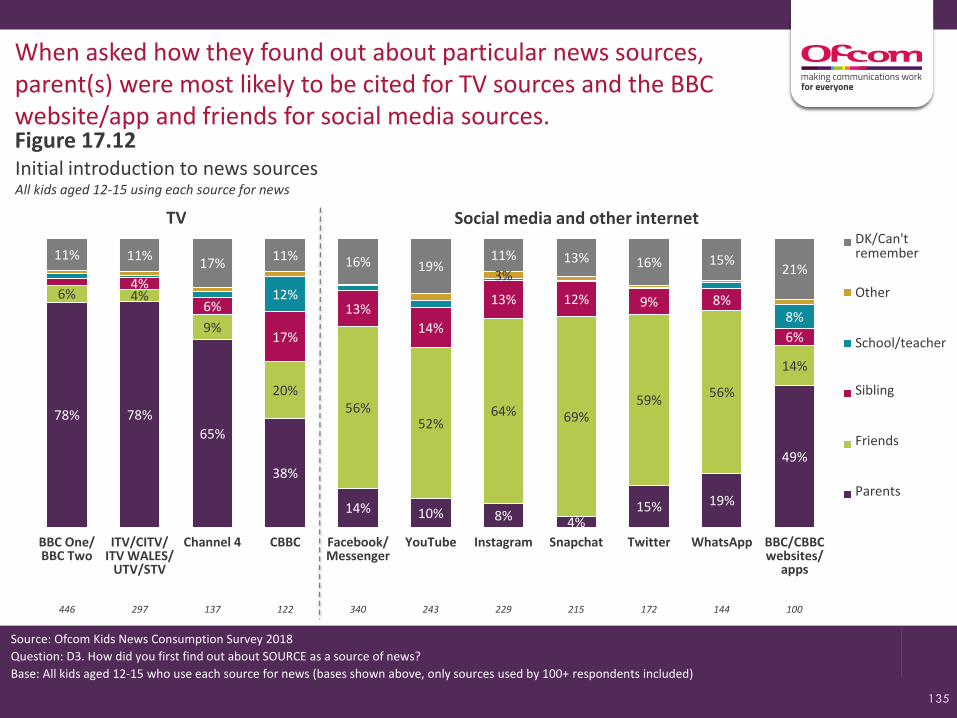
135
135
Initial introduction to news sourcesAll kids aged 12-15 using each source for news
78% 78%
65%
38%
14% 10% 8% 4%15% 19%
49%
6% 4%
9%
20%56%
52%64% 69%
59%56%
14%
4%
6%
17%
13%
14%
13% 12% 9% 8%
6%
12%
8%
3%
11% 11%17%
11% 16% 19%11% 13% 16% 15%
21%
BBC One/ BBC Two
ITV/CITV/ ITV WALES/
UTV/STV
Channel 4 CBBC Facebook/ Messenger
YouTube Instagram Snapchat Twitter WhatsApp BBC/CBBC websites/
apps
DK/Can't remember
Other
School/teacher
Sibling
Friends
Parents
When asked how they found out about particular news sources, parent(s) were most likely to be cited for TV sources and the BBC website/app and friends for social media sources.
Source: Ofcom Kids News Consumption Survey 2018
Question: D3. How did you first find out about SOURCE as a source of news?
Base: All kids aged 12-15 who use each source for news (bases shown above, only sources used by 100+ respondents included)
446 297 137 122 340 243 229 215 172 144 100
TV Social media and other internet
Figure 17.12

136
136
Users of TV give the strongest ratings across all of the attributes asked about. Social media users give relatively poor scores.
Attributes of news platforms % of ratings from kids aged 12-15 using each platform for news, who rate it highly
Source: Ofcom Kids News Consumption Survey 2018
Question: E2. You will now see all of the other news sources that you use. I would like you to tell me how important each one is to you.
E3. You will now see a list of statements. I would like you to tell me how often each of these statement applies to each of the different news sources
Base: All ratings by kids aged 12-15 who use each platform for news – TV=1042, Newspapers=341, Radio=454 , Social media=1463, Other internet=330
% Most/Very/Quite important
Important to me as a news source
% Attribute applies all/most of the time
Provides accurate news stories
Provides trustworthy news stories
Helps me to understand what's going on in the world
Offers a range of opinions
83%
86%
85%
80%
71%
78%
77%
77%
76%
70%
70%
83%
81%
71%
59%
69%
45%
41%
45%
50%
78%
68%
65%
70%
63%
TV Newspapers RadioSocialmedia
Otherinternet
Figure 17.13

137
137
BBC One/Two, ITV, CBBC (Newsround) viewers and the BBC/CBBC website/app users tend to give the best scores.
Attributes of news sources% of kids aged 12-15 using each source for news, who rate it highly
Source: Ofcom Kids News Consumption Survey 2018
Question: E2. You will now see all of the other news sources that you use. I would like you to tell me how important each one is to you
E3. You will now see a list of statements. I would like you to tell me how often each of these statement applies to each of the different news sources
Base: All kids aged 12-15 who use each source for news (bases shown above, only sources used by 100+ respondents included)
NOTE: colour differences in the table are to show different ranges of scores. The results have not been tested for statistical significance.
80%+
60-79%
40-59%
<40%
BB
C O
ne/
BB
C T
wo
ITV
/CIT
V/
ITV
W
ALE
S/ U
TV/S
TV
Ch
ann
el 4
CB
BC
(N
ewsr
ou
nd
)
Face
bo
ok/
M
esse
nge
r
You
Tub
e
Inst
agra
m
Snap
chat
Twit
ter
Wh
atsA
pp
BB
C/C
BB
Cw
eb
site
s/ a
pp
s
446 297 137 122 340 307 229 215 172 144 100
% Most/Very/Quite important
Important to me as a news source 87% 80% 77% 81% 76% 71% 69% 62% 73% 58% 86%
% Attribute applies all/most of the time
Provides accurate news stories 88% 86% 85% 83% 46% 47% 45% 37% 54% 38% 90%
Provides trustworthy news stories 87% 85% 79% 85% 38% 41% 43% 33% 56% 37% 90%
Helps me to understand what's going on in the world
83% 79% 78% 78% 46% 47% 45% 37% 58% 37% 88%
Offers a range of opinions 72% 69% 69% 71% 53% 55% 48% 40% 60% 44% 77%
TV Social media and other internet
Figure 17.14
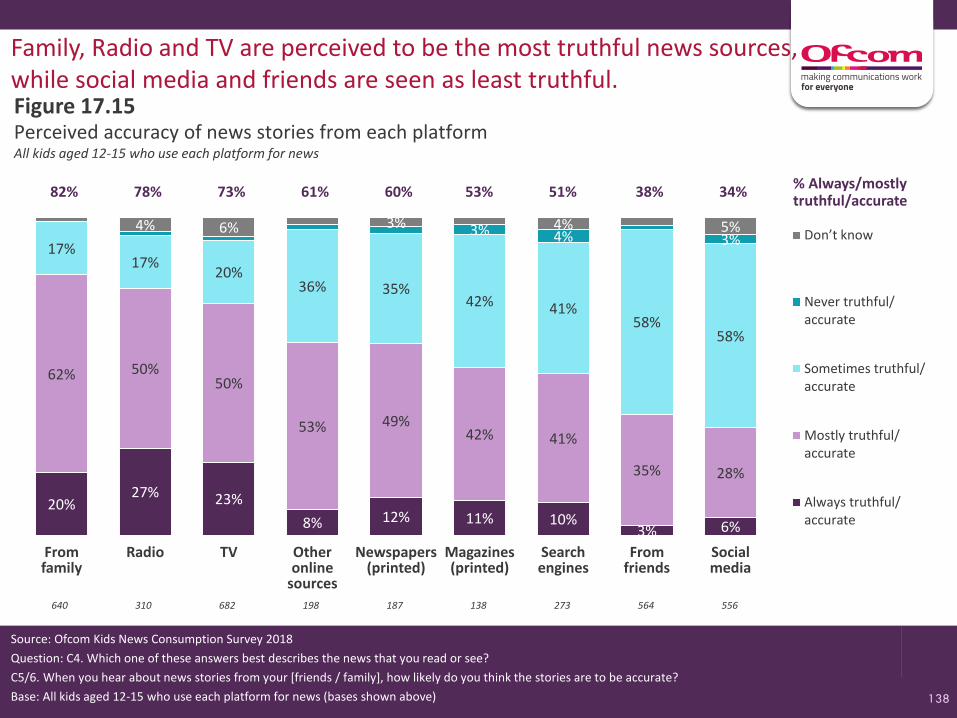
138
138
Perceived accuracy of news stories from each platformAll kids aged 12-15 who use each platform for news
20%27% 23%
8% 12% 11% 10%3% 6%
62% 50%50%
53% 49%42% 41%
35% 28%
17%17%
20%36% 35%
42% 41%58%
58%
3% 4% 3%4% 6% 3% 4% 5%
Fromfamily
Radio TV Other online
sources
Newspapers (printed)
Magazines (printed)
Search engines
From friends
Socialmedia
Don’t know
Never truthful/accurate
Sometimes truthful/accurate
Mostly truthful/accurate
Always truthful/accurate
Family, Radio and TV are perceived to be the most truthful news sources, while social media and friends are seen as least truthful.
Source: Ofcom Kids News Consumption Survey 2018
Question: C4. Which one of these answers best describes the news that you read or see?
C5/6. When you hear about news stories from your [friends / family], how likely do you think the stories are to be accurate?
Base: All kids aged 12-15 who use each platform for news (bases shown above)
640 310 682 198 187 138 273 564 556
82% 78% 73% 61% 60% 53% 51% 38% 34%% Always/mostly truthful/accurate
Figure 17.15
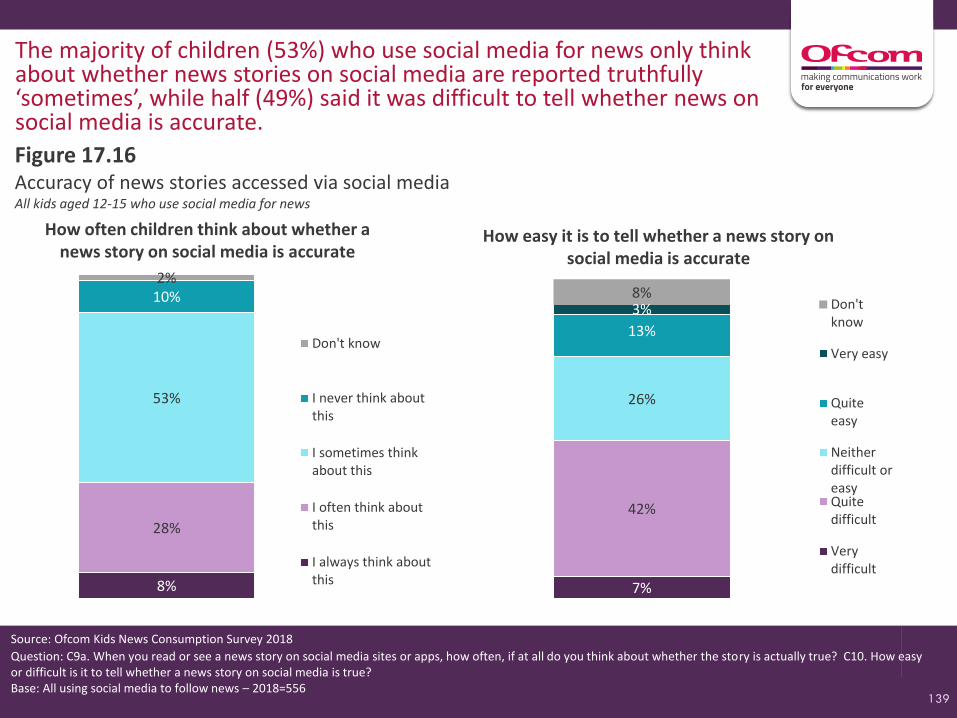
139
139
Accuracy of news stories accessed via social mediaAll kids aged 12-15 who use social media for news
The majority of children (53%) who use social media for news only think about whether news stories on social media are reported truthfully ‘sometimes’, while half (49%) said it was difficult to tell whether news on social media is accurate.
Source: Ofcom Kids News Consumption Survey 2018
Question: C9a. When you read or see a news story on social media sites or apps, how often, if at all do you think about whether the story is actually true? C10. How easy or difficult is it to tell whether a news story on social media is true? Base: All using social media to follow news – 2018=556
Figure 17.16
7%
42%
26%
13%
3%8%
Don'tknow
Very easy
Quiteeasy
Neitherdifficult oreasyQuitedifficult
Verydifficult
8%
28%
53%
10%2%
Don't know
I never think aboutthis
I sometimes thinkabout this
I often think aboutthis
I always think aboutthis
How easy it is to tell whether a news story on social media is accurate
How often children think about whether a news story on social media is accurate

140
140
Accuracy of news stories accessed via social mediaAll kids aged 12-15 who use social media for news
Social media news users aged 12-15 were asked what they would do if they wanted to check a news story they had seen on social media. The most popular action was the check whether the same story appears anywhere else.
Source: Ofcom Kids News Consumption Survey 2018
Question: C4. Which one of these answers best describes the news that you read or see? C9a. When you read or see a news story on social media sites or apps, how often, if at all do you think about whether the story is actually true? C10. How easy or difficult is it to tell whether a news story on social media is true? C11. When you read or see a news story on social media sites or apps which if any of these things would you ever do if you wanted to check the story?
Base: All using social media to follow news – 2018=556
34% think that news stories on social media are reported truthfully most or all of the time
36% will normally think about whether a news story they see on social media is actually true
16% find it easy to tell whether a news story on social media is true
45%
39%
35%
28%
28%
23%
22%
22%
11%
Check if the same story appears anywhere else
Look at the comments about the story
Think about the story content to see how likely it is to be true
Think about whether I trust the person who shared it
Check if it was by an organisation I thought was trustworthy
Look at how professional the story looks (spelling mistakes etc)
Check if was by an organisation I had heard of
Check to see if it is by someone who was there
Wouldn’t make any of these checks
Perceptions of news stories on social media Actions might take to check authenticity of an SM news story
Figure 17.16

141
141
Three quarters claim to have heard about ‘fake news’ and say they’re aware of its meaning. Two in five claim to have seen a ‘fake news’ story.
Source: Ofcom Kids News Consumption Survey 2018
Question: C12. Have you ever heard of ‘”fake news”’? C13. Fake news stories are those that are false or made up that can appear on websites or on social media as well as on TV, radio or in newspapers. They are written deliberately to mislead people. Is this what you thought “fake news”’ was? C14. Have you ever seen anything online or on social media that you thought was a “fake news” story? Base: All kids aged 12-15 – 2018=1001
C15. If you did see a story on social media or online that you thought was “fake news” what, if anything would you do about it? Base: All aware of ‘fake news’ =785
78% have ever heard of ‘fake news’ (22% had not heard of fake news)
74% are aware of its meaning as ‘false/made up news stories written deliberately to mislead people’ (26% were not aware)
43% have seen a news story online or on social media that they thought was ‘fake news’ (57% had not seen fake news)
32%
23%
18%
13%
13%
10%
40%
Tell parents or other family member
Tell a friend
Leave a comment saying it was fake news
Report it to the social media website
Share it with people and tell them it’s not true
Tell a teacher
Probably wouldn't do anything/ just ignore it
Awareness of ‘fake news’All kids aged 12-15
Actions might take if saw a ‘fake news’ story onlineAll kids aged 12-15 aware of ‘fake news’
Figure 17.17
142PROMOTING CHOICE • SECURING STANDARDS • PREVENTING HARM
Appendix – methodology and respondent profile

143
News Consumption Survey methodological note
Change made to the 2018 News Consumption Survey
Reason
A change to the methodology from a face-to-face omnibus to a standalone survey using a mix of face-to-face and online interviews.
To increase the questionnaire length and the sample size in a cost-effective way. A larger sample will mean that the data will therefore be more robust and allow more detailed analysis of sub-groups. A longer questionnaire has allowed us to include further news-related questions. In particular, we can now conduct a more detailed exploration of online news consumption through the addition of questions around people’s use of social media for news. A mixed methodology can also cancel out some of the biases potentially found in pure methodologies.
A change in the sampling periods from one wave of research carried out in the Autumn to two waves of research in November & December and March & April.
This helps reduce the effect of seasonality on results as well as the potential impact from any major news story at the time of fieldwork.
Additional questions. As mentioned above, we added in questions relating to people’s use of social media. Other changes included added in questions about current affairs and extending the list of attitudinal statements asked for each source. We made these additions in order to ensure that the News Survey remains fit-for-purpose and reflects changes in the news market. Questions were also added with regards to the BBC news purpose, given Ofcom’s additional BBC duties.
Revisions to existing questions. We have also reviewed all current questions to ensure they remain relevant, fit for purpose and reflect changes in the news market. One of the main changes has been including ‘social media’ as a separate option when we ask respondents which platforms they use for news nowadays. We also made changes to source lists used nowadays for news to better reflect the most popular news sources used.
Because of the changes we have made to the 2018 News Consumption Survey, it is not possible to make direct comparisons to previous data. Any differences between 2018 and historic data could be a result of a combination of the changes listed below, as well as actual changes in the way people consume or feel about news. The table below provides further detail on the changes to the 2018 news survey and the reasons why they were made. We feel that the changes we have made will result in more robust data overall.

144
• During 2017/18, Ofcom decided to move from a 100% face-to-face omnibus approach to include online interviews.
• The face-to-face respondents were approached to participate by door-to-door interviewers; they then completed the survey using a tablet (CAPI). Online respondents, recruited from an online panel, were invited to complete the same survey separately via email.
• In total, 2,188 face-to-face and 2,430 online interviews were carried out. Nations were over-represented during fieldwork to produce robust sample sizes for analysis.
• Interviews were conducted over two waves (November & December 2017 and March & April 2018) in order to achieve a robust and representative view of UK adults. – Please note that the combined 2017/2018 data has been reported as ‘2018’ within this report.
• The data has been weighted to correct for the over-representation of the Nations, with weights applied to age, gender and SEG within Nation to match known population profiles. A final weight step was taken to calibrate between the face-to-face and online methodologies.
• The questionnaire was updated during 2017/18, with new sections on International News and Current Affairs. It also included separate questions on ‘social media’ and ‘other internet’ news sources. NB: In previous years, the questionnaire only had one question covering ‘internet/apps’.
• As a result of the changes to the methodology and question wording, it is not possible to make direct comparisons to previous data (see methodology (3) for further information on the changes made to the survey).
• Findings by different demographic groups are shown on the slides, where possible. Statistically significant differences are shown at a 95% confidence level.
News Consumption Survey methodology (1)

145
• The survey has approximately 150 codes for different potential sources for news, as well as the option to allow respondents to nominate their own sources which yields a further 700 or so, including regional sources. This gives us a bottom-up measure of what people consider they use for news (about their Nation, the UK, and internationally) and will not necessarily include every possible outlet. The survey therefore provides a granular range of news sources. These individual news sources are then aggregated into various groups or “nets” relating to their owner or publisher.
• This is a recall-based survey. As such, it is likely to provide somewhat different results to other types of measurement. In particular, it may underestimate some online news consumption activity. It is likely to be harder for respondents to recall ad-hoc online news consumption compared to, say, the purchase of a newspaper or the watching of an evening television bulletin. On the other hand, respondents show through such surveys which news sources are resonant to them.
• The news consumption research amongst 12-15 year olds was carried out online. • In total, 500 interviews from November & December 2017 have been combined with 501 interviews
from March & April 2018. Quotas were set on age, gender, SEG and nation to ensure the sample was representative of the UK.
• Each wave of fieldwork was undertaken in three stages:• Stage 1: We targeted parents of 12-15 year olds, using an online panel. • Stage 2: Parents were screened to ensure they had a 12-15 year old.• Stage 3: The parent asked their (qualifying) child to complete the rest of the questionnaire.
News Consumption Survey methodology (2)

146
146
Source: Ofcom News Consumption Survey 2018
Question: A1, A2, A4, I1, I2, I3, I11
Base: All adults 16+ - 2018=4618
Respondent profileAll adults 16+
Age
15%
15%
17%
18%
13%
12%
10%
16 - 24
25 - 34
35 - 44
45 - 54
55 - 64
65 - 74
75+
49%
Gender
51% 27%have kids
<16 yrs in HH
2.4 adults
(16 yrs+)
Household composition
Working status
39%
16%
5%
9%
6%
24%
Full-time paid work
Part-time paid work
Unemployed(seeking work)
Not working(not seeking work)
In full time education
Retired
AB24%
C130%
C221%
DE26%
21%
22%
25%
25%
9%
<£13.5k
£13.5k - <£25k
£25k - <£40k
£40k+
Refused
Annual household income
Social grade

147
147
Source: Ofcom News Consumption Survey 2018
Question: A6, A7, A8, A9
Base: All adults 16+ - 2018=4618
Respondent profileAll adults 16+
BBC TV region Ethnic origin
83%
10%
4%
2%
White
Asian
Black
Mixed
33%
11%
7%
3%
2%
2%
2%
1%
1%
35%
Church of England/ Scotland/Ireland
Catholic
Other Christian
Muslim
Jewish
Hindu
Sikh
Buddhist
Other religion
No religion
Religion
16-20%
11-15%
6-10%
1-5%
Urban/Rural
12%
rural88%urban

148
148
Source: Ofcom News Consumption Survey 2018
Question: B1. We would first of all like to know about some of your interests. Which of the following are you interested in?
Base: All adults 16+ - 2018=4618
Interests and technologyAll adults 16+
62%
56%
55%
49%
49%
46%
42%
29%
27%
26%
18%
Music
Holidays/travel
Film and Cinema
Books
News and Current affairs
Cooking
Sport
Fashion
Politics
Cars/motoring
Business
Topics of interest

149
149
Source: Ofcom News Consumption Survey 2018
Question: B2. Which of the following do you ever use, if at all? B3. Through which of the following ways, if any, do you receive television in your household?
Base: All adults 16+ - 2018=4618
94%
53%
40%
37%
4%
In home
While travelling
At work / place of study
In a public place(e.g. café, library)
Don’t access the internet
Locations where internet is accessed
Interests and technologyAll adults 16+
37%
24%
20%
17%
7%
6%
5%
4%
3%
2%
1%
2%
2%
Sky satellite TV
Freeview - TV aerial and set-top box
Freeview - built in to TV
Virgin Media
Free-Sat
BT TV
NOW TV
Talk Talk TV
Other satellite TV (non-Sky)
YouView
EE TV
Other service
No TVs in household
TV services in household

150
150
Source: Ofcom News Consumption Survey 2018
Question: B4. Do you personally own any of the following devices? B5. Do you personally use a Smartphone?
Base: All adults 16+ - 2018=4618
91%
69%
52%
24%
21%
21%
14%
7%
2%
Mobile phone
Laptop/netbook computer
Tablet
Static gaming device
E-book reader
MP3 player
Mobile gaming device
Personal assistant
None of these
Devices owned personally
Interests and technologyAll adults 16+
76%have a
smartphone
14%have a basic
mobile

151
151
Source: Ofcom Kids News Consumption Survey 2018
Question: A1, A2, A3, A5, A6, A7, A8
Base: All kids aged 12-15 – 2018=1001
51%
Child’s age and gender
49%
1225%
1325%
1425%
1525%
12%
21%
30%
37%
<£13.5k
£13.5k - <£25k
£25k - <£40k
£40k+
Annual household income
Parents’ social grade
Children’s profileAll kids aged 12-15
AB30%
C129%
C219%
DE21%
Child’s ethnic origin
88%
6%
2%
4%
White
Asian
Black
Mixed
BBC TV region
16-20%
11-15%
6-10%
1-5%
Urban/Rural
12%
rural88%urban