Newport News
114
-
Upload
virginia-institute-of-marine-science -
Category
Documents
-
view
217 -
download
0
description
Â
Transcript of Newport News


PUBLIC BEACH ASSESSMENT REPORT
Huntington Park, Anderson Park, and King-Lincoln ParkCity of Newport News, Virginia
by
Donna A. MilliganC. Scott Hardaway, Jr.
George R. Thomas
Virginia Institute of Marine ScienceCollege of William and Mary
Gloucester Point, Virginia 23062
A Technical Report Obtained UnderContract with
The Virginia Department ofConservation and Recreation
via theToint Commonwealth Programs Addressing
Shore Erosion in Virginia
September 1995
--

EXECUTIVE SUMMARY
The City of Newport News has three public beaches within its limits:Huntington Park beach, Anderson Park beach, and King-Lincoln Park beach. Eachbeach and its associated park has undergone or is undergoing improvements. Thepurpose of this report is to assess the rates and patterns of beach change at thesethree public beaches. Field survey data, aerial photos, wave hindcasting data, andcomputer modelling were utilized for this report. The computer model used wasRCPWAVE, a wave hydrodynamic model developed by the Corps of Engineers.
Huntington Park is located along the James River immediately to thenorthwest of the James River Bridge. The beach enhancement and facilities upgrade,which began in 1986, as completed included a riprap revetment along the northwestsection of the park in front of the eroding bluffs, a riprapped boat basin and ramp,and the placement of approximately 13,000 cy (10,200 m3) of sand on the beach. InMarch 1992, an additional 1,500 cy (1,150 m3) was placed on the beach.
Beach profiles, sediment data, and volume calcu.lations indicate that since thefall of 1993, the beach at Huntington Park has been relatively stable. Shoremorphology and profile analysis suggest that this is a pocket beach which respondsto changes in the wave direction by altering its orientation and curvature. The wide,shallow nearshore region as well as the sheltering by the James River Bridgeabutment tends to limit the wave energy along the shoreline. Volume calculationsshow that sediment is not generally lost to the system but appears to move back andforth along the beach with profile line 3 as a nodal point. Between October 1993 andApril 1995, only 830 cy (635 m3) of material was lost, but aerial photography indicatesthat eolian transport most likely deposited this sand in the grassy area behind thebaseline and the parking lots behind the beach.
Anderson Park is located on the northwest shoreline of Hampton Roads. It isbounded on the north by Salters Creek and extends approximately 3,000 ft (914 m) tothe southwest where Christopher Shores, a private subdivision begins. Between 1937and 1953, the entrance to Salters Creek was stabilized with stone jetties, the channeldredged, and the sand placed over the marsh headlands at Anderson Park. In theearly 1940's, a large steel groin was placed at the end of what is now the ChristopherShores subdivision. By 1963, sand eroded from the Anderson Park beach and bankwas stacked up against the groin filling it to capacity. Due to the severe bankerosion, a riprap revetment constructed in the 1970's along the first 1,500 ft (457 m)from Salters Creek. In the early 1980's, erosion at Anderson Park along the non-protected shoreline continued as the supply of sand was reduced by the Salters Creekchannel jetties and riprap revetment up drift. In 1985, Four 180 ft (55 m) long woodgroins were installed 300 (91 m) apart. In addition, 16,000 cy (12,200 m3) of sand wasplaced on the beach. To reduce downdrift impacts, two spurs and about 400 cy (306m3) of sand were installed in February 1988.
The strong net southwestward component of littoral transport can be welldocumented along the Hampton Roads shoreline south of Salters Creek. The
-- - ---

direction of wave approach as well as tidal currents tend to move sediment to thesouthwest. While local episodes of erosion and accretion have occurred at AndersonPark, overall, only a small amount of net erosion has taken place. Erosion downdriftof the project was initially severe as the Christopher Shores shoreline becameembayed and began to adjust to the wave climate. However, the rate of erosion inthis region appears to decreased with little net change taking place between 1992 and1993.
King-Lincoln Park is located on Hampton Roads at the southern portion of thePeninsula. Since 1937, a small sandy beach has existed in there. Erosion has beenminimal along this shoreline betv\'een 1937 and 1963 except for the western section ofthe beach. In January 1995, approximately 50,000 cy (38,200 m3) of sand was placedalong the shoreline and plans have been made to construct vegetated dunes from thereplenishment sand along the backshore/upland interface.
Overall, little natural change has occurred at King-LIncoln since 1993. Prior tothe fill, what sand was lost during the winter was generally regained or nearlyregained over the summer. Profile 5 has been accreting since 1993 demonstrating thesouthwestward component of littoral transport. No other trends describing the localpatterns and rates of change could be derived from the data due to the placement ofthe fill.
II
-- - - --

TABLE OF CONTENTS
EXECUTIVESUMMARY. . . . . . . . . . . . . . . . . . . . . . . . . . . . . . . . . . . . . . . . . . . . . . i
LIST OF FIGURES . . . . . . . . . . . . . . . . . . . . . . . . . . . . . . . . . . . . . . . . . . . . . . . . .. v
LIST OF TABLES. . . . . . . . . . . . . . . . . . . . . . . . . . . . . . . . . . . . . . . . . . . . . . . . . . viii
I. Introduction. . . . . . . . . . . . . . . . . . . . . . . . . . . . . . . . . . . . . . . . . . . . . . . .. 1
A. Background and Purpose 1B. Limits of the Study Area 3C. Approach and Methodology 4
II. Huntington Park . . . . . . . . . . . . . . . . . . . . . . . . . . . . . . . . . . . . . . . . . . . . .. 9
A. Coastal Setting 9
1. Hydrodynamic Processes. . . . . . . . . . . . . . . . . . . . . . . . . . . . . . .. 9
a. Wave Climate .. . . . . . . . . . .. 9b. Tides ... . . . . . . . . . . . . . . . .. .. . 9c. Storm Surge . .. ... . . .. 9
2. Physical Setting 9
a. Sedin1ents 9b. Shore Morphology . . . . . . . . . . . . . . . . . . . . . . . . . . . . . .. 11c. Sediment Transport 12
B. RCPWAVE 12
C. Beach Characteristics . . . . . . . . . . . . . . . . . . . . . . . . . . . . . . . . . . . . . .. 16
1. Beach Profiles and their Variability 16
2. Variability in shoreline position . . . . . . . . . . . . . . . . . . . . . . . . .. 22
3. Beach and Nearshore Volume Changes 22
III
-

III. Hampton Roads Reach - Anderson Park and King-Lincoln Park. . . . . . . " 25
A. Coastal Setting 25
1. Hydrodynamic Processes. . . . . . . . . . . . . . . . . . . . . . . . . . . . . .. 25
a. Wave Climate .. .. . . . . .. .. . . . . .. 25b. Tides .. . . . .. . . . . . . . . . . . . . . . . .. 26c. Storm Surge . . . . . . 26
2. Physical Setting :. 26
a. Sediments 26b. Shore Morphology . . . . . . . . . . . . . . . . . . . . . . . . . . . . . .. 27c. Sediment Transport 34
B. RCPWAVE 35
C. Anderson Park Beach Characteristics . . . . . . . . . . . . . . . . . . . . . . . . . .. 40
1. Beach Profiles and their Variability 40
2. Variability in Shoreline Position . . . . . . . . . . . . . . . . . . . . . . . . .. 43
3. Beach and Nearshore Volume Changes 43
D. King-Lincoln Park Beach Characteristics 51
1. Beach Profiles and their Variability 51
2. Variability in Shoreline Position . . . . . . . . . . . . . . . . . . . . . . . . .. 51
3. Beach and Nearshore Volume Changes 51
IV. Summary and Conclusions 57
V. Recommendations. . . . . . . . . . . . . . . . . . . . . . . . . . . . . . . . . . . . . . . . . . .. 58
VI. References.. . . . . . . . . . . . . . . . . . . . . . . . . . . . . . . . . . . . . . . . . . . . . . . .. 59
Appendix I. Additional References about Littoral Processes andHydrodynamic modeling
Appendix II. Anderson Park Beach Profiles
Appendix III. Huntington Park and King-Lincoln Park Sediment Data
lV
----

LIST OF FIGURES
Figure 1. Study site locations and location of Thimble Shoals wave gage 2
Figure 2. Basemap of Huntington Park Beach with profile locations 5
Figure 3. Basemap of Anderson Park Beach with profile locations . . . . . . . . . .. 6
Figure 4. Basemap of King-Lincoln Park Beach with profile locations 7
Figure 5. Beachprofiledemonstrating terminologyused in report. . . . . . . . . .. 8
Figure 6. Wave refraction patterns in a static equilibrium bay (Silvester and Ho,1972). . . . . . . . . . . . . . . . . . . . . . . . . . . . . . . . . . . . . . . . . . . . . . . .. 13
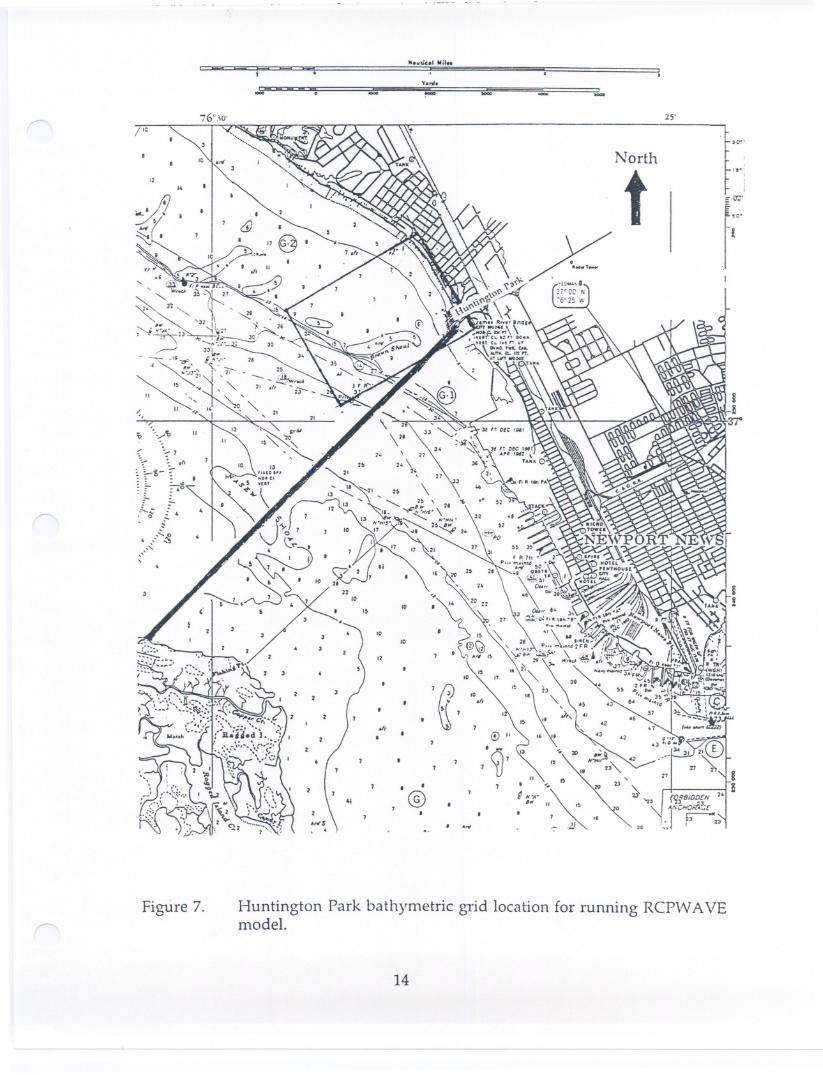
Figure 7. Huntington Park bathymetric grid location for running RCPW AVEmodel . . . . ... . . . . . . . . . . . . . . . . . . . . . . . . . . . . . . . . . . . . . . . . .. 14
Figure 8A. Huntington Park wave vector plots for m!=,dalconditions at MLW .. 17
Figure 8B. Huntington Park wave vector plots for modal conditions atapproximately SHW . . . . . . . . . . . . . . . . . . . . . . . . . . . . . . . .. 17
Figure 9. Wave vector plot from RCPWAVE for storm conditions across theHuntington Park grid .. . . . . . . . . . . . . . . . . . . . . . . . . . . . . . . . . .. 18
Figure 10. Huntington Park plots depicting change at profiles 1 and 2 19
Figure 11. Huntington Park plots depicting change at profiles 3 and 4 20
Figure 12. Huntington Park plot depicting change at profile 5 21
Figure 13. Huntington Park distance of MHW from the survey baseline . . . . .. 23
Figure 14A. Huntington Park subaerial beach volume calculationsby cell. . . . .. 24
Figure 14B. Huntington Park nearshore beach volume calculations by cell 24
Figure 15. Aerial photos showing Anderson Park and Christopher Shoresmorphology in 1937, 1953, 1963, and 1985 29
Figure 16. Aerial photos showing King-Lincoln Park morphology in 1937, 1953,and 1963 . . . . . . . . . . . . . . . . . . . . . . . . . . . . . . . . . . . . . . . . . . . . .. 31
Figure 17. Photo mosaic of latest shoreline photos, June 1995 32
Figure 18. Historical shoreline positions indicating change 33
v

Figure 19. Hampton Roads bathymetric grid (KLA grid), including AndersonPark and King-Lincoln Park, for running the RCPW AVE model. . .. 36
Figure 20A. KLA grid wave vector plots for southeast modal condition 37
Figure 20B. KLA grid wave vector plots for the south modal condition 37
Figure 20C. KLA grid ,,,,ravevector plots for the northeast modal condition . . . .. 37
Figure 21A. KLA grid wave vector plots for average 1988 northeast stormcondition 38
Figure 21B. KLA grid wave vector plots for average 1989 northeast stormcondition 38
Figure 21C. KLA grid ,,,rave vector plots for average 1985 east storm condition.. 38
Figure 22. Anderson Park plots depicting change at profiles 13 and 14 . . . . . .. 41
Figure 23. Anderson Park plots depicting change at profiles 15 and 16 . . . . . .. 42
Figure 24. Anderson Park distance of MHW from the survey baseline 44
Figure 25A. Volume change behveen pre- and post-fill Oun 1984 and Apr 1985). 45
Figure 25B. Volume change betv,reen post-fill (Apr 1985) and Jun 1986 45
Figure 26A. Volume change between Jun 1986 and May 1987 46
Figure 26B. Volume change behveen May 1987 and Apr 1988 . . . . . . . . . . . . . .. 46
Figure 27A. Volume change between Apr 1988 and Jul1989 47
Figure 27B. Volume change between Jul1989 and Sep 1990 47
Figure 28A. Volume change between Sep 1990 and Nov 1992 48
Figure 28B. Volume change between Nov 1992 and Oct 1993 48
Figure 29. Net subaerial volume change between post-fill (Apr 1985) and Nov1992 49
Figure 30. King-Lincoln Park plots depicting change at profiles 1 and 2 52
Figure 31. King-Lincoln Park plots depicting change at profiles 3 and 4 53
Figure 32. King-Lincoln Park plot depicting change at profile 5 54
VI

Figure 33. King-Lincoln Park distance of MHW from the survey baseline. . . .. 55
Figure 34A. King-Lincoln Park subaerial beach volume calculations by cell. . . .. 56
Figure 34B. King-Lincoln Park nearshore beach volume calculations by cell 56
Vll

Table 1.
Table 2.
Table 3.
Table 4.
Table 5.
Table 6.
LIST OF TABLES
Percent sand and gravel, in relation to the whole sample, at selectedmorphologic points along profile 3 at Huntington Park beach 11
Percent sand and gravel at midbeach on 11 April 1995 for all five profilelines at Huntington Park beach . . . . . . . . . . . . . . . . . . . . . . . . . . . .. 11
Percent sand and gravel at selected morphologic points along profile 3at King-Lincoln Park beach. . . . . . . . . . . . . . . . . . . . . . . . . . . . . . .. 28
Percent sand and gravel at midbeach on all file profile lines at King-Lincoln Park beach .. . . . . . . . . . . . . . . . . . . . . . . . . . . . . . . . . . . .. 28
Anderson Park groin sand fillet orientations. . . . . . . . . . . . . . . . . .. 34
KLAgrid summary input wave data conditions. . . . . . . . . . . . . . .. 35
Vlll

I. INTRODUCTION
A. Background and Purpose
The City of Newport News has three public beaches within its limits. Sincethe early 1980's, interest in preserving and revitalizing these beaches has beengrowing. These beaches are Huntington Park, Anderson Park, and King-Lincoln Park(Figure 1).
1. Huntington Park
Huntington Park Beach is located along the James River immediately to thenorthwest of the James River Bridge. Presently, the beach is bounded to thesoutheast by the James River fishing pier and extends northwest approximately 750 ft(230 m) to the boat ramp. In July 1986, the City of Newport News in cooperationwith the Public Beach Board undertook a comprehensive project to upgrade not onlythe beach at Huntington but also the other facilities as well. The entire projectincluded an enhanced beach, a boat ramp facility, and protection of the large bluffsoverlooking the James River in the northwest section of the park. Hobbs et al. (1974)found that these 25 ft (8 m) bluffs were eroding at about 2 ft/yr (0.6 m/yr).
By August 1989, the boat basin as well as the rip rap revetment along thenorthwest section of the park in front of the bluffs were already installed. In 1990,about 13,300 cubic yards (cy) (10,200 cubic meters(m3» of sand were placed atHuntington to create a beach 100 to 125 feet (31 to 38 m) wide and 9.7 ft (3 m) abovemean sea level (MSL) high. In March 1992, an additional 1,500 cy (1,150 m3) wasplaced on the beach.
2. Anderson Park
Anderson Park Beach is a city-owned recreational area located on thenorthwest shoreline of Hampton Roads and is three-fourths of a mile southwest ofthe Newport News/Hampton city line. The park consists of approximately 18 acres,is bounded on the north by Salters Creek, and extends approximately 3,000 ft (914 m)to the southwest where Christopher Shores, a private subdivision, begins. To thewest, the park is adjacent to and backed by Stuart Gardens Apartments. Theshoreline along the first 1,500ft (457 m) from Salters Creek is a riprapped revetment.Presently, the sandy beach and groinfield south of the riprap is approximately 1500feet (457 m) long.
Since 1854, the unprotected shoreline along Anderson Park has been eroding atrate of 2 ft/yr (0.6 m/yr)(Hobbs et ai., 1974). In the early 1940's, a large steel groinabout 400 ft (122 m) long was constructed at what is now the present southwestwardboundary of Christopher Shores. Over the next twenty years, the fastland bank nearSalters Creek experienced significant erosion. Due to the bank erosion, the first 1000ft (300 m) from Salters Creek was part of the U.S. Army Corps of Engineers ErosionControl Project which installed riprap along the shore in the mid 1970's. Additional
1

8"'InC"L 811..(I~ = =:!.. 6 . I)
Figure 1. Study site locations and location of Thimble Shoals wave gage.
2
I
... ." "..
., . .-...............--. ...--0." .'_"
:)...
'<:t
Q:)
""
'<:t
""
Q...
.,. ,.:.:.. . _.V. '1;7 !"---::t"\I')
"

riprap was added in 1978 to extend the revetment to 1,500 ft (457 m) long and 25 ft(7.6 m) high (US Army CaE, 1994).
In the early 1980's, erosion at Anderson Park along the non-protected shorecontinued as the supply of sand was reduced by the Salters Creek channel jetties andriprap revetment up drift. The Anderson Park Erosion Control Project, partiallyfunded by the Public Beach Board, called for the installation of four 180 ft (55 m)long groins about 300 ft (91 m) apart. In addition, approximately 16,000cy (12,234m3) of sand was placed on the beach, and the upland bank was graded. The systemof beach fill and groins was designed for shore protection as well as to provide arecreational area. The project was completed in March 1985. To reduce downdriftimpacts to Christopher Shores, two spurs were installed in February 1988. One spurwas placed on the south side of the storm drainage pipe in the northern section ofthe beach. The other spur was placed on the south side of the southernmost groin atAnderson Park. In order to abate erosion in the scour area of the groin,approximately 400 cy (306 m3)of sand was placed on the beach.
3. King-Lincoln Park
King-Lincoln Park is located on Hampton Roads at the southern portion of thePeninsula. It is approximately 1000 feet in length and historically, has had amoderate erosion rate of between 1 and 3 feet per year (Hobbs et al., 1974). Recently,it has been the focus of a planned rehabilitation project which includes shorelinerestoration and facility upgrades. In January 1995, approximately 50,000 cy (38,200m3) of sand was dredged from the boat basin and placed at King-Lincoln in order toreduce the impacts of shoreline erosion. In addition, plans have been made toconstruct vegetated dunes from the replenishment sand along the backshore/ uplandinterface.
The purpose of this report is to assess the rates and patterns of beach changeat the three public beaches within the City of Newport News. In addition, thosechanges will be related to the hydrodynamic forces and littoral processes operating inthe study areas. Recommendations for further actions in any of the shoreline reacheswill be provided based on the analyses contained in this report.
B. Limits of the Study Area
The analyses for this report have two distinct areas of study (Figure 1). ForHuntington Park, which is located on southern side of the Peninsula, a reach ofshoreline extending from the James River Bridge northwest for approximately 5000 ft(1500 m) was analyzed. In order to ascertain the littoral processes affecting AndersonPark and King-Lincoln Park, the entire shoreline reach from the Small Boat Harbor toSalters Creek adjacent to Hampton Roads was evaluated.
3

C. Approach and Methodology
Field survey data, aerial photos, and computer modelling were used to addressthe aforementioned report objectives. Data analyzed for this report include beachprofiles surveyed by the Virginia Institute of Marine Science (VIMS)as well as by theCity of Newport News. The vertical and horizontal controls are based on sitebenchmarks established by the City. The vertical datum is mean sea level (MSL) forAnderson Park Beach and mean low water (MLW) for both Huntington and King-Lincoln Park beaches. Historic and recent aerial images were evaluated to mapchanges in shoreline position.
VIMS established a baseline for profiling Huntington Park beach in October1993. Five profile lines were established between the fishing pier and the constructedboat basin (Figure 2). The Anderson Park beach (Figure 3) has been profiled by theCity since 1983. In 1985,additional profile lines were surveyed along the ChristopherShores beach to monitor shoreline changes next to the project. The King-Lincoln Parkbeach baseline, with a total of five profiles between the Virginia Department ofTransportation building and the pier, was established in December 1993 (Figure 4).
Figure 5 gives a pictorial definition of the profile terminology used in thisreport. The nearshore data were calculated by taking into account all the sand belowMLW to the end of each profile. The subaerial beach occurs above MLWand isdivided into beach face and backshore regions.
For this report, the hydrodynamic forces acting along the Newport Newsbeaches were evaluated using RCPWAVE, a computer model developed by the V.SArmy Corps of Engineers (Ebersole et al., 1986). RCPWAVE is a linear wavepropagation model designed for engineering applications. This model computeschanges in wave characteristics that result naturally from refraction, shoaling, anddiffraction over complex shoreface topography. To this fundamental linear theorybased model, VIMS has added routines which employ recently developedunderstandings of wave bottom boundary layers to estimate wave energy dissipationdue to bottom friction (Wright et al., 1987).
4

II .
..I ..llie
.....
....
..
.
..
...
..'0 ,J
....
.....
..
J
I
r ·
-
Figure 2.
~ --
o, 50-&...FT
I
.. I
..100
I
.
;.
'i
.o~
. ..
£ t \f' ; i
l
....
,
.,,
aIII, II
~.
II IIIa
\
\
\
\\
Basemap of Huntington Park Beach with profile locations.
5
'..
..'"
..

~~
~"
<
"" ",'I ..'- --- ~ ~
~-~~
..c=~ :'-cr
9oL
200..L.
FT400.I
13 J U N 95
-15 ~
17 II~ ,"
IJ'.~'J 1f" l',
Ii.
j!~ 19
21 . ,23
Figure 3.Basemap of Anderson Park Beach with profile locations.
6

o, 100...L..FT
200,
Figure4.
,
\
\
\
\
\\
\\
\
a
\ '\, ~
,v:' ...
.
~.;o:'
..
.~.. :
.
:.
~.
..
,
.
.
~
. \. ~.. ~ ,."~,, ,.....!' . y: p;_ ,,~~ _ Tl..
'h.~ , i~~.:1-I.""I \, ..\~
ti: '... ': \r~"'.~~~,
~"""
" ",
,\
.
1
t: <:...
.
.~
.
..)'* ~'
.
.
.
. . 1-' .~- -1 ~
· . " "i> ...,'
. . , ."",.
. , .. r~. '\:Al ".~
Basemap of King-Lincoln Park Beach with profile locations.
7

NEARSHORE ZONE
COASTI
UPLANDBEACH OR SHORE
BACKSHORE INSHORE OFFSHORE
co
-FORESHORE
MHW BREAKERS
Figure 5. Beach profile demonstrating terminology used in report.

II. HUNTINGTON PARK
A. Coastal Setting
1. Hydrodynamic Processes
a. Wave Climate
The wave climate at Huntington Park beach is affected by local waves andcurrents as well as nearshore bathymetry and tidal currents. The nearshore region atHuntington is characterized by a gentle slope to the southeast for approximately4,900 ft (1,500 m) where the bottom drops abruptly from 12 ft (4 m) to 35 ft (11 m).Byrne et al. (1987) found that the average near-surface, non-tidal currents wereapproximately 0.02 knots (1 cm/ sec) in the downstream direction. Wind-inducedwaves from northwest, west and southwest impact Huntington Park the greatest.However, the James River Bridge abutment shelters Huntington Park Beach fromwaves traveling from the Bay up the James River. Wave induced erosion of thebluffs occurs when high northwest or southwest winds pile up water on the NewportNews side of the river and attack the toe of the fastland (Hobbs et al., 1974).
b. Tides
The mean tidal range at Huntington Park Beach is 2.6 ft (79.2 cm) with aspring range of 3.1 ft (94.5 cm).
c. Storm Surge
Boon et al. (1978)statistically determined storm surge frequency for bothextra tropical and tropical storm events. In the Hampton Roads area, the storm surgelevels for 10 year, 25 year, 50 year and 100 year events are 4.5 ft (1.4 m), 4.8 ft (1.5m), 5.5 ft (1.7 m), and 6.1 ft (1.9 m), respectively. These surge levels are heightsabove MSL. There is little difference between the surge levels at Huntington Parkand Hampton Roads.
2. Physical Setting
a. Sediments
In general, the sediments at Huntington Park beach consist of sand and gravelin varying proportions. The percent of silt and clay in the samples taken are lessthan five percent and will be disregarded in this analysis. Additional sediment datais available in Appendix III.
Samples were taken on three different dates along beach profile line 3 atcertain morphologic points. The backshore sample represents the area of the beachthat is influenced by eolian transport and run-up from occasional storm events.Sediments were also taken at last high tide (LHT), midbeach, step, toe, and offshore.
9
- ---- -- --

The step is an ephemeral morphologic feature that results from wave action on the~ shoreline and shifts up and down the beach as the tide rises and falls. The toe of the
beach is located at the break in slope between the beach face and the nearshoreregion. It is also evidenced by a distinct change in sediment type; at Huntington, thesand becomes finer and the gravel is not in such a high proportion.
The grain size distribution of beach sand generally varies across shore and, toa lesser degree, alongshore as a function of the mode of deposition. The coarsestsand particles are usually found where the backwash meets the incoming swash in azone of maximum turbulence at the base of the subaerial beach; here the sand isabruptly deposited creating a step or toe. Just offshore, the sand becomes somewhatfiner. Another area of coarse particle distribution is the berm crest where runupdeposits all grain sizes as the swash momentarily stops before the backwash starts.The dune or backshore generally contains the finest particles because deposition hereis limited to the wind's ability to entrain and move sand (Bascom, 1959; Stauble et a1.,1993).
Huntington Park beach does not follow this general grain size distributionpattern (Table 1). The backshore region contains relatively coarse material whichprobably is a lag deposit of the original fill material. However, since May 1994, thebackshore has been accumulating sand, thus reducing the proportion of gravel. Theedge of vegetation in the backshore area has been receding landward, probably dueto use, allowing more sand mobility. LHT is finer than midbeach, which has beenincreasing in coarseness since May 1994. The step has also been increasing itspercent of gravel. Some pieces of gravel were retained on the -3 phi (8.0 mm) sieve.
Table 2 lists the percent of sand and gravel, in relation to the whole sedimentsample, at midbeach on all five profiles at Huntington. These samples were taken on11 April 1995. Midbeach at profile 3 has by far the greatest amount of gravel in thealongshore direction.
10
- -- -- -

Table 1. Percent sand and gravel, in relation to the whole sample, at selectedmorphologic points along profile 3.
Table 2. Percent sand and gravel at midbeachon 11 April 1995 for all five profile lines.
b. Shore Morphology
The shore morphology is determined by long-term impact of the impingingwave climate after the waves have been altered by the nearshore bathymetry andtidal currents. The overall shape of Huntington Park beach is that of a pocket beachwhich is described as the embayment between two headlands. The planform of theheadland-bay beaches is dependant on the predominant direction of wave attack(Yasso, 1965;Silvester 1974). Headland-bay beaches are often referred to as crenulate,pocket, or log-spiral bay beaches. The "headlands" that mark the boundaries of the
11
BACK SHO LHT MID BCH
Date %Grv %Snd Dso %Grv %Snd Dso %Grv %Snd Dso(mm) (mm) (mm)
May94 12.8 85.4 0.2909 0.0 99.4 0.3559 9.2 80.0 0.5147
Oct94 15.1 82.1 0.2616 0.6 98.8 0.4031 23.3 76.4 0.7143
Apr95 9.4 87.0 0.3096 3.6 95.5 0.4667 36.9 62.4 0.9370
STEP TOE OFF SHO
Date %Grv %Snd Dso %Grv %Snd Dso %Grv %Snd Dso(mm) (mm) (mm)
May94 6.4 92.9 0.4638 41.2 58.0 0.6183 35.4 63.2 0.3066
Oct94 17.1 82.1 0.8048 26.1 72.9 0.4654 3.3 95.0 0.3622
Apr95 30.0 68.9 0.9696 42.0 56.7 0.4179 26.1 71.2 0.3683
Profile % Gravel % SandNumber
1 19.5 76.8
2 16.0 83.9
3 36.9 62.4
4 18.8 80.4
5 11.1 88.2

embayment at Huntington are the riprapped boat basin and the James River Bridgeabutment. The fairly straight shoreline between these two headlands indicates awave climate that is affected by the shallow nearshore region which tends to refractthe waves to a direct onshore approach.
The tangential section of the shoreline in a pocket beach can be measured todetermine the long-term wave climate (Figure 6) since the tangential beach alignsitself parallel to the direction of approach of wave crests. Measurements of theorientation of the tangential section of shoreline on the eastern side of the beach nearthe Bridge indicates a long-term wave impact from the west. Approaching waves arerefracted around the boat basin to a nearly onshore approach but travel unrefractedto the abutment shoreline in a direct onshore approach.
c. Sediment Transport
When a pocket beach is in static equilibrium, the wave crests approach thetangential section of the beach in a direct onshore approach. The incoming wavecrests will refract and diffract in the bay such that their approach is also parallel tothe shoreline. A stable beach planform is achieved when either the sediment supplyis depleted or the shoreline has eroded to a condition where littoral drift is reducedto zero (Silvester and Hsu, 1993). This lack of littoral drift implies that the wavesare approaching normal to the shoreline and that there is no longshore gradient inbreaking wave energy for sediment transport. However, small changes can occur inthe beach planform on a seasonal basis as the wave climate varies.
Huntington Park beach has a stable beach planform and is in staticequilibrium. Some seasonal changes have occurred along the shoreline, but theseindicate that the sediment is not being lost to the system, but probably is beingtransported back and forth along the beach between the "headlands" depending onthe direction of wave approach. Eolian transport also is responsible for some loss ofsand from the backshore region. High winds blow sediment into the grassy area andparking lots behind the beach.
B. RCPWAVE
A detailed discussion of wave processes, sediment transport, and numericalmodelling is beyond the scope of this report; the interested reader can refer toAppendix II for a listing of pertinent references. In order to determine the waveclimate at Huntington Park beach, RCPWAVE was employed. The use of RCPWAVEto model the hydrodynamics at Huntington Park assumes that only the offshorebathymetry affects wave transformation; the application does not include the effectsof tidal currents. A grid (Figure 7) of the study region was digitized from abathymetric map. The waves impinging the shoreline were predicted by thefollowing process, developed and used during a previous projects (Hardaway et al.,1991; Hardaway et al., 1993):
12
----

RAY No.123"567 B 9 10
Figure 6. Wave refraction patterns in a static equilibrium bay (Silvester and Ho,1972).
13
--- - --- - -
F"'r......-
~ (~
\.. \'",~'8-f
r ;3: ~ : 4
. 0 ~....
.-'-.f!4 ...~.,..',
25'
'0'"
'4
North
t>,.
12I
l;
Figtire 7. Huntington Park bathymetric grid location for running RCPW AVEmodel.
14

,,-1. Determine effective fetch for three directions. This was accomplished
using procedures outlined in the U.S. Army Corps of Engineers Shore ProtectionManual (1977)for northwest and south directions from the midpoint of the riverwardextent of the grid. This also involves measuring a bathymetric transect across theriver in both the directions.
2. Use the above data as input into 5MB program which provides waveheight, period and length for a suite of wind speeds. In this case, wind speeds of 5to 19 m/sec (11 to 43 mph) were used at 2 m/sec increments. The results of this stepare used to create a data file of wind speeds with associated wave heights andperiods for both subject directions.
3. Wind data for 10 years, 1980-1990,along with the data file from step 2,are the input requirements for running the program WINDOW (Suh, 1990).WINDOW takes the data file as input parameters from step 2 and matches them withwind speed and direction from each of the subject directions for each year to produceanother data file of wave heights, periods and directions through a series of vector-averaging steps. The limiting criterion is that the wind must be blowing from withinthe assigned directional window for at least nine hours. In other words, windsrecorded at the Norfolk Airport must be blowing from, for example, 1810and 3010true for nine or more hours to qualify for this analysis.
4. The result of step 3 is a file for each year giving date, hour beginning,wave height, wave period, local wave direction, and duration of each qualifyingevent. These data then are mean weighted to provide a weighted mean for waveheight, period and direction with duration as the independent variable for each year.
5. The results of step 4 were mean-averaged for each year to produceaverage wave parameters for the directional window. These results were used asinput into RCPWAVE for annual modal conditions.
6. Four significant events were identified during the extent of the windanalysis: 26 October 1982, 4 November 1985, 13 April 1988, and 8-9 March 1989. Onand around these dates, an event was recorded in the wind data. The wind speedsand directions for each event were pulled from the data and averaged. The averageswere compared manually to the data file created in step 2 rather than using theWINDOW program described in step 3. The wave parameters obtained for eachevent were used as storm input to RCPW AVE.
RCPW AVE takes an incident wave condition at the seaward boundary of thegrid and allows it to propagate shoreward across the nearshore bathymetry.Frictional dissipation due to bottom roughness is accounted for in this analysis and isrelative in part to the mean sand size. Waves also tend to become smaller overshallower bathymetry and remain larger over deeper bathymetry. In general, wavesbreak when the ratio of wave height to water depth equals 0.78 (Komar, 1976).
15

Upon entering shallow water, waves are subject to refraction, in which the,,-- direction of wave travel changes with decreasing depth of water in such a way that
wave crests tend to parallel the depth contours. Irregular bottom topography cancause waves to be refracted in a complex way and produce variations in the waveheight and energy along the coast (Komar, 1976).
Figure 8A and B are plots of wave vectors across the Huntington Park grid forthe modal (decadal average) wave conditions at MLW and approximately SpringHigh Water (SHW):
Wave Height (H) =0.33mWave Period (T) =2.2secWave Bearing(A) = 90°True North (TN)
The average wave condition within the Huntington Park grid was a wave travelingfrom west to east or approximately downriver. At MLW the waves do not break, butrather diminish in height until they reach the shoreline. At MLW and modalconditions, the waves are refracted as they cross the shallow nearshore such that theyimpact the beach shore normal. However, at higher water, the waves are reduced inheight but only refracted slightly as they travel across the nearshore zone.
Figure 9 shows wave vectors under conditions experienced during theNovember 1985 storm (H=1.46 m, T=2.5 sec, A=45°) assuming a water level atapproximately SHW. The storm average of wave conditions within the Huntingtongrid was a wave generated by southwest winds traveling towards the northeast.Waves can be reduced by up to 85% in height across the shallow nearshore and arerefracted to a nearly shore normal approach. Because of this, storms do not seem toaffect the general stability of the beach planform at Huntington Park beach.
C. Beach Characteristics
1. Beach Profiles and their Variability
Five profile lines were established in October 1993 to document changes atHuntington Park beach. Distances between profile lines vary along the shoreline.Profile lines 1 through 4 begin in the backshore area of the beach and extend somedistance out into the James River onto the gently sloping nearshore area. However,in order to keep a straight baseline, profile 5 begins in the parking lot approximately102 ft (31 m) from the sand level on the beach and ends abruptly offshore where itcrosses the dredged boat channel.
Figures 10, 11 and 12 are plots of the profiles at Huntington. Profile numbers,survey numbers and dates are found in the figure legends. Little change hasoccurred at Huntington beach since 1993. Profile line 2 indicates slight erosion.Profile line 3 showed no change at all while profiles I, 4, and 5 had varying episodesof erosion and accretion. In the fall months when the beach was surveyed (surveynumbers 100 and 102), a small storm berm had developed at profile 5.
16

'(
(k m)
Ho =0.330 m,
Wave VectorsT = 2.2 5, RNGLE (deg) = 90
0.330 m A
INorth
oI
y
(k m)
oo (k m) 2.60X
"Wave vector scales vary.
Figure 8. Huntington Park wave vector plots for modal conditions at A.) MLWand 8.) approximately SHW.
17
-- --
00 X (k m) 2.59
Ho =0.330 m, T = 2.2 S. RNGLE(deg) = 90Wave Vectors - 0.330 m B1.84

1 . 84
INorth
Huntington Park
y(k m)
o
Ho =1.460 m,
Wave Vectors
T = 2.5 S,- RNGLE (degJ1 .460 m
45
o(k m) 2.59x
Figure9. Wave vector plot from RCP'''' AVE for storm conditions across theHuntington Park grid.
18

Huntington Park Beacn
30L1ne Survey
100101102103
Date
6 OCT 936 MAY 9413 OCT 9411 AP~ 95
---------- --..-..-..
-10o 100 200 300 400 500 600 700 BOO
Distance. FT
-10o 100 200 300 400 500
Distance. FT
600 700 BOO
Figure 10. Huntington Park plots depicting change at profiles 1 and 2.
19
20
I-1.1..
C0 10-'to>c:>-w
0
Huntington Park Beacn
30Une Survey Date
2 100 6 OCT 932 101 6 MAY 942 102 13 OCT 94
20 '2 103 11 APR 95
I-"-
C0
10.......
to>CI).....w I '
\
01 \ HLW

-10o 100 200 300 400 500
Distance. FT
600 700 800
-10o 100 200 300 400 500
Distance. FT
600 700 800
Figure 11. Huntington Park plots depicting change at profiles 3 and 4.
20

-10o 100 200 300 400 500 600 700 BOO
D1stance. FT
Figure 12.. Huntington Park plot depicting change at profile 5.
21
Huntington Park Beach
30 .Line Survey Date
5 100 6 OCT 935 101 6 AY 545 102 13 OCT 54
20 .5 103 11 APR 95
t-I.J...
C0 10--'rt1>QJ-w
01n \..'

2. Variability in shoreline position
The position of MHW can be used to demonstrate changes in the beach shapeover time. Since Huntington Park beach began being surveyed in 1993, little changehas occurred along the embayed shoreline (Figure 13). The beach appears stable withonly slight episodes of erosion or deposition. In addition, profile line 3 has notchanged at all in the past two years indicating that it may be a nodal point for thebeach with sediment shifting up and down the shore between the James RiverFishing Pier and the riprap enclosed boat launch area at Huntington Park. Komar(1976) found that a pocket beach responds to changes in the wave direction byaltering its curvature and orientation. The shoreline then "wobbles" between the twoheadlands because of changes in the wave direction. Typically, our data show thatwhile profiles 1 and 2 eroded, profiles 4 and 5 accreted and vice versa. However, theamount of change at the beach is small, and the patterns may be insignificant.
3. Beach and Nearshore Volume CIumges
The amount of material either lost or gained along the shore zone can bemeasured by changes in area and converted to volumes along a profile line or in ashore cell. Subaerial beach volume calculations extend from the baseline to MLWwhereas nearshore calculations extend riverward from MLW. Shore cells are definedby profile lines. Cell 1 is between profiles 1 and 2, cell 2 occurs between profiles 2and 3, and so on.
Volume calculations at Huntington show a continuation of the trend of littlechange. A combined total of 14,800 cy (11,300 m3) of sand from the two nourishmentprojects in 1990 and 1992 was placed on the beach. Between October 1993 and April1995, the entire subaerial beach (Figure 14A) lost only 830 cy (635 m3) of materialmost of which was probably deposited in the parking lot by eolian transport. Overthat same time period, the nearshore region (Figure 14B) gained about 77 cy (59 m3).
22
-- --

----.--........-----.......--------.------------------------------------.....--.-..-.--------------------------------
-----------
---------------------------------------------------------------------------------------------------------------------
---------------------------------------------------------------------------------------------------------------------
------------------------------.--------------------------------------------------------------------------------------
-------.-..----------------------------------------------------------------------------------------------------------
---------------------------------------------------------------------------------------------------------------------
---------------------------------------------------------------------------------------------------------------------
1 2 3Profile Number
4 5
1---OCT93-2r MAY94",,*- OCT94 -)(- APR95
Figure 13. Huntington Park distance of MHW from the survey baseline.
23
200
180
1
1
e-.......3::r:
.9100Q)uc:ro 80-(/)
15
60
40
20
0

Net Subaerial Beach Volume Change (cy) Qct93-May94 =-327
N~_~!!~.~{I?1_~QI.4'm_~~.lCY).MiI~_=::~?~~ u u ......
Net Subaerial Beach Volume Change (cy) Oct94.Apr95 =.227
..O'....
O'
A
.....................
....................................................................-............................................
.....................................---............
..............-......-...-...........................-................---...--............--..--......-...........-..................-.................................-..............--
.,2 3 4
Cell Number
1-- 0c:I9J.Ma)94~ May94.0a94"* Qcl9<.Apr95
Net Nearshore Bead! Volume Change (cy) Oct93.May94 = '32
et-Nearshore Beach >.10111,.,,&Ghange-{cy) May94-0as.;.~ leGNet Nearshore Beach Volume Chance lev) Oct94.ADr95 = .235
o.o.o.o.o.o.o.o.o o.o o-.o__.o o...o.o...o.o.o.o..o.o.o...o.o..............
o.o...o.o o.o.o.o.o.o.o.o o..o o o o o...o...o.o...o o o.....
CI)C)
~UCI)E::I
:gI!!o.r:.~CI)Z
..o.o.o.o o.o.o..o o.o.o...o..o.o.o.o.o o o o.o.o.o.o...o.o.o.o.o.o o...o.o..o.o...o.o.o.o o.o.o.o.o...o..o.. _. o...o.o.o o.o.o.o...o o...o..o.o...._
B. ...o o.o.o o o o o o o o...o o o
.o o.o o...o.o...o .o o o o o.o.o... o o. o.o o.o.o o.o......
o.o o o...o o..o.. o...o .o o o o... o.o.o o o..o...o.o...o.o...o
o o.o.o...o o _.o o...o.o.o o o.o o o..o.o.o...o.o o o.o.o..............
-,2 3 4
Cell Number
I-- 0c:I9J.Ma)94 ~ May94-Ocl94"* 0cI94-ApI95
Figure 14. Huntington Park beach volume calculations by cell for the A.) subaerialbeach and B.) nearshore region.
24

III. HAMPTON ROADS REACHANDERSON PARK AND KING-LINCOLN PARK
A. Coastal Setting
1. Hydrodynamic Processes
a. Wave Climate
The wave climate within the lower Chesapeake Bay has been the focus ofrecent study (Boon et al., 1990;Boon et al., 1993). VIMS has deployed a bottom-mounted wave gage in the Thimble Shoals area of the lower Chesapeake Bay since1988 (Figure 1). While the wave and current data sensed at the gage cannot bedirectly translated to conditions experienced at Anderson and King-Lincoln, thegeneral types of conditions are relevant.
One of the features. reported in the Thimble Shoals wave data set is thebimodal distribution of wave directions reflecting dual energy sources which impactthe area. Boon et al. (1990)found that 40 to 60% of all waves measured each monthwere between 0.67 feet (0.20 m) and 1.97 feet (0.60 m) in height. During late springand summer months, about 80% of the measured waves were traveling towards thewest-northwest, thus generated outside the Bay. During fall and winter months, only
--- slightly more than half of the 0.67 (0.20 m) to 1.97 feet (0.60 m) waves were generatedoutside the Bay. Bay-external waves result from swell and ocean shelf-originatedwind waves.
Of the fall and winter waves with heights greater than 1.97 it (0.60 m), almostall were directed south, thus generated within the Bay. These fall and winter wavesresult from northeasters (extratropical storms) and northwesters, which producestrong north winds along the maximum fetch of the Bay. As the James River islocated at the southernmost end of the Chesapeake Bay, it iseffected by waves generated over the whole north-to-south fetch of the Bay (over 100miles, 160 km). The passage of extra tropical, low pressure storms also produceselevated water levels which further increases the reach of wave energy. Thus, thehigher wave energy in winter generally causes beach erosion while calmer conditionsin summer tend to cause beach accretion.
Hampton Roads is exposed to waves from the lower Bay, which includes thosegenerated both inside and outside the Bay, through the mouth of the James River.Hobbs et al. (1974) describe maximum fetch in Hampton Roads to the south and eastof 3 to 4 nautical miles (nm) whereas the effective fetch to the northeast wascalculated at approximately 7 nm. The US Army COE (1994)found that theprevailing winds in Hampton Roads were from the northeast and north during Feb.,Mar., Aug., Sep., and Oct. while the rest of the year, the prevailing winds were fromthe southwest or south. The annual average wind speed was 11 mph (5 m/ s) atNorfolk International Airport.
25

The wave climate at Anderson and King-Lincoln is greatly influenced byseveral nearshore features. Hampton Flats, located on the western side of HamptonRoads, is a relatively shallow shoal of approximately 4,500 acres with depthsgenerally less than 12 ft (3.7 m) (Byrne et al., 1987). Newport News Bar is anelongate shoal on the southwestern end of Hampton Flats. It parallels the lower endof the Newport News Peninsula near King-Lincoln Park and ranges between 6 to 12ft (2 to 4 m) in depth. Landward of Newport News Bar, accelerated flood currentshave scoured and maintained a subsidiary channel, which has maximum depths of 19ft (6 m), parallel to the shoreline (Byrne et al., 1979).
b. Tides
The mean tide range at Anderson Park and King-Lincoln Park is 2.5 feet (76.2cm) with a spring range of 2.9 feet (88.4 cm). Tidal currents near Newport NewsCreek are approximately 46 cm/ s during flood and 67 cm/ s during ebb (US ArmyCaE, 1994). However, tidal speeds along the Hampton Roads reach can vary due tothe position of Newport News Bar and Hampton Flats. During flood stage, watermoving across Hampton Flats is diverted around both sides of the shoal creating twodistinct flows, one inshore and one offshore. The inshore flow forms first and canreach speeds greater than 50 cm/ s at the surface (Byrne et al., 1987). Byrne et al.(1987) found that the flood transport around Newport News Bar is greater inshorethan offshore with a net flooding of water over the tidal cycle inshore and a netebbing offshore. During ebb, the flow of water coming down the James River has tomake a 90° turn around Newport News Point. As it does, an eddy begins to developon Hampton Flats. As ebb stage is ending, the eddy has fully developed into acounterclockwise circulation pattern. This circulation not only advances the floodstage of the tide but also enhances the strength of the flood current in the early stageof flood (Byrne et al., 1987).
c. Storm Surge
Boon et al. (1978)determined statistically storm surge frequency for bothextratropical and tropical storm events. In the Hampton Roads area, the storm surgelevels for 10 year, 25 year, 50 year and 100 year events are 4.5 ft (1.4 m), 4.8 ft (1.5m), 5.5 ft (1.7 m), and 6.1 ft (1.9 m), respectively. These surge levels are heightsabove MSL.
2. PhysicalSetting
a. Sediments
Beach and nearshore sediment samples were not taken at Anderson Parkbeach, but analyses were performed on samples taken at King-Lincoln. See AppendixIII for more sediment data.
Samples were taken at the base of dune (BOD), storm berm or backshoreregion, midbeach, toe, and offshore. Prior to the beach fill project, the sediments
26
- -- --

sampled at King-Lincoln Park generally followed the cross-shore pattern establishedby Bascom (1959)and Stauble et al. (1993)(See section II,A,2,a of this report). Withmidbeach as the reference sample (Table 3), LHT would be slightly coarser but wasnot sampled. The storm berm and BOD do become finer as they are generallyinfluenced only by eolian transport. In the offshore direction of midbeach, samples atthe toe are the coarsest, with the offshore samples becoming much finer. The sandthat was placed during the fill project was relatively uniform across and along thebeach (Table 4).
The nearshore samples taken at King-Lincoln contained more than 5 percentsilt and clay (mud). In June 1994, 6.3% of the whole sample was mud. Although nosample was taken, December 1994 probably would have shown a similar percentage.In April 1995, the nearshore region had two distinct layers. The mud content of theoriginal bottom was significantly increased and overlain by a blanket of the fillmaterial. In order to determine the characteristics of each individual layer, twoseparate samples were taken at the same location. The top sandy layer is listed inTable 3 and contained only 3.5% mud. The muddy layer underneath was 0% gravel,30.8% sand, 37.7% silt, and 31.5% clay. As the sand was placed on the beach, thefiner sediments were winnowed out of the subaerial beach and deposited in thenearshore region. This was covered by a thin layer of sand either placed in thenearshore or washed out from the subaerial beach.
Byrne et al. (1987) found that the sources for sediment to Hampton Flats areshore erosion and suspended solids advected over the Flats by tidal currents. Thesurface sediments of the Flats are fine to medium sand with the mud fraction varyingbetween 3 and 25 percent. The innermost and northeastern sections of HamptonFlats tend to have a higher mud content whereas the western end tends to be coarser(Byrne et al., 1987). The 60 ft (18 m) contour appears to be the limiting depth forsediment samples to contain at least 75 percent sand (Boon and Thomas, 1975).Deeper than this, mud are larger portions of the bottom sample. Byrne (1972) foundthat sediment in the Salters Creek entrance was silt and clay with a large organiccontent.
b. Shore Morphology
The morphology of a shoreline represents the long-term impact of theimpinging wave climate after the waves have been altered by the nearshorebathymetry, tidal currents, and coastal structures. The overall shape of the shorelinefronting Hampton Roads is evidence of a strong northeast to southwest movement oflittoral material.
Figure 15 shows the shoreline morphology in 1937, 1953, 1963, and 1985 of theAnderson Park shoreline. In 1937, what is now Anderson Park Beach was marsh.Sometime between 1937 and 1953, the entrance to Salters Creek was stabilized withstone jetties, the channel was dredged, and the sand placed on Anderson Park beach.After the installation of the large steel groin at Christopher Shores in the 1940's, sanderoded from Anderson Park began stacking up against it. The area just south of the
27
---

T dandG lected hol . ,fil
N00
Sand and 'dbeach 111' ,filer
. . . -. --... -- . - -. - ... . - n.__ ____O - _.-.- --
BOD BERM MIDBEACH TOE OFFSHOREDATE %GRV % SAN D50(mm) %GRV % SAN D50(mm) %GRV % SAN D50(mm) %GRV % SAN D50(mm) %GRV % SAN D50(mm)
17JUN 1994 0.1 99.2 0.2945 7.4 91.8 0.2472 27.8 71.3 0.4088 80.7 18.8 0.8473 0.0 93.8 0.112912DEC1994 0.0 99.7 0.3160 0.1 99.1 0.2550 52.6 46.8 0.4310 94.3 4.8 0.6330 NA NA NA11APR 1995 1.9 95.6 0.2398 0.0 99.0 0.2559 1.8 96.6 0.2702 0.0 97.6 0.1638 0.0 96.4 0.1418
- - - -. - - --- . . . _.. n __. _n_ .._ . .n ___.
PROFILE 8 DEC1993 17JUN 1994 12 DEC 1994 11 APR 1995# % GRVL % SAND % GRVL % SAND % GRVL % SAND % GRVL % SAND1 3.9 95.0 24.9 74.3 1.5 97.5 3.7 94.92 0.0 99.3 27.4 71.8 1.6 97.2 0.5 97.93 8.1 91.4 27.8 71.3 . 52.6 46.8 1.8 96.64 0.0 98.7 8.1 90.7 5.7 93.5 1.4 97.05 0.5 98.1 8.3 91.0 1.5 96.9 0.7 97.9

- - -- - --
".' 11937~I
Ii-- - --- -- -
1953Anderson Park Christopher Shores
1985
Figure 15. Aerial photos showing Anderson Park and Christopher Shoresmorphology in 1937, 1953, 1963, and 1985.
29
-- ----

- - - --- - - -- - - - . . - _... - .- . .. .
steel groin was bulkheaded before 1937 and dredged immediately following the groininstallation. However, between 1953 and 1963,sand eroded from Anderson Parkbeach and bank and stacked up against the groin at what is now the ChristopherShores boundary filling it to capacity. The 1985 photo shows the characteristic "sawtooth" appearance of the groins installed at Anderson during the 1980's as sand filletsstack on the southern side of the groin compartments.
Between 1854 and 1918,the shoreline at King-Lincoln Park underwentdramatic erosion which locally averaged 6 ft/yr (1.8 m/yr) (Byrne, 1972). However,Byrne (1972)found that little change has occurred between 1918 and 1966 with onlythe western section of the King-Lincoln shoreline eroding at 2 ft/yr (0.6 m/yr).Figure 16, showing the King-Lincoln shoreline in 1937, 1953 and 1963, demonstratesthat little change has occurred there over time. Since 1937 at least, a small sandybeach has existed there. Byrne (1972)found that the beach was 30 ft (9.1 m) widewith a backshore bank increasing in height to about 6 ft (1.8 m) and had been aboutthe same width since 1937. Presently (Figure 17), the beach is greatly expanded dueto the latest beach nourishment project.
Figure 17 shows the Hampton Roads shoreline on 21 June 1995. Most notableis the fill at King-Lincoln. The sand in the four groin compartments at Anderson hasstacked up along the southern side of each compartment indicating that they arealigned with an impinging wave climate from the northeast with a net alongshorecomponent of littoral transport to the southwest. Between the last groin and spur ofthe Anderson Park project and the large steel groin that marks the end of ChristopherShores, an spiral embayment has formed. These groins are the "headlands" thatdenote the boundaries of the embayment. In addition, Figure 17 also shows thatsand is being transported along the shoreline since the sections of shoreline facing thenortheast are filled with sand.
According to Byrne (1972),in 1918, the entrance of Salters Creek was about1,000 ft (305 m) to the southwest of its present position exiting to Hampton Roadswhere today, the riprap revetment is at Anderson Park. Figure 18 is a summary ofthe shoreline change between 1937and 1963. The extent of the Salters Creek marsh isevidenced by the numerous marsh headlands along the shore. By 1953, Salters Creekwas stabilized, the dredged sand used as fill over the marsh along Anderson Park,and the steel groin installed at the southwest boundary of Christopher Shores.However, very little changed along the rest of the shoreline reach. By 1963, theshoreline at Anderson Park was receding. Sand had stacked up against the steelgroin and filled it to capacity. Other areas of the Hampton Roads shoreline reach,including King-Lincoln, varied between erosion and accretion between 1953 and 1963.
Measurements of the orientation of the sand fillets were performed on theaerial imagery available for t~e four groin compartments created with the 1980'sinstallation (Table 5). The orientation of the tangential section of each groin wasmeasured. Net-sand-fillet orientations for the tangential sections are east southeast.The groin compartments are actually shoreline embayments and the tangential
30
- --

1/-..,.. : '
,0.. .-~1' r- .-
.. ., .l<ing-Lincoln.Park
- --
1953
-- - ---.......
i
t11963
-- Figure 16. Aerial photos showing King-Lincoln Park morphology in 1937, 1953,and 1963.
31
----

\ ,
N
t
JU N 95
o, 500......FT
1000&
Figure 17. Photo mosaic of latest shoreline photos, June 1995.-
32
-

HAMPTON ROADS
/5,,1---1t 1~/,-.t
~~~..'f..
..~I ,CJJCJJ
,I
I,
o "DO 2~DOI I I
mr
,q1.1.' ,
, .. I,,~(,~
t1tP~
'(.).~'\-~"Ill<I
Figure 18. Historical shoreline positions indicating change.

sections tend to orient themselves into the direction of wave approach. Compartment1 is not a true groin compartment since its northernmost side is anchored by theriprapped section of the beach. Therefore it was not used in the calculation of theaverage long-term wave approach at Anderson Park. The average orientation for1985, 1990, 1994,and 1995in compartments 2, 3, and 4 was 1100representing a waveheading to 2900or about west northwest.
Table 5. Anderson Park Sand Fillet Orientations by Compartment number in degreesTrue North.
c. Sediment Transport
The strong net southwestward component of littoral transport can be welldocumented along the Hampton Roads shoreline. The development of sand filletsalong the southern side of the groin compartments demonstrates sand movement. Acomponent also probably goes offshore. Also noticeable in Figure 15 are thenearshore sand waves nearly perpendicular to the shoreline that are indicative of anactive littoral system and possibly transport to the southwest. Byrne (1972)foundthat the eastern jetty of Salters Creek was trapping some sand but was not full solittle sand was by-passing the Creek entrance. However, between 1953 and 1963, thesteel groin at the end of Christopher Shores filled to capacity (Figure 15). Thedredged area just south of the steel groin is obvious in the 1963 photo, but by 1985,sand had by-passed the groin and begun to fill in the dredged shore.
The mechanisms for sediment transport is related to both wave and tidalenergy. Waves from the Chesapeake Bay enter Hampton Roads through thenortheast facing mouth of the James River. During both flood and ebb tide stages,tidal mechanisms tend to move water and energy southwestward along the shoreline.The counterclockwise circulation of the ebb eddy also probably moves sedimentoffshore to Hampton Flats.
34
Date Com 1 Com 2 Com 3 Com 4 Avg of Com2,3,4
22 August 1985 101 108 110 109 109
25 May 1990 94 100 103 110 104
29 October 1990 100 119 111 111 114
20 July 1994 105 115 115 115 115
27 February 1995 100 105 109 111 108
21 June 1995 94 107 106 110 108
Average 99 109 109 111 110

B. RCPWAVE
Using wind speeds and directions, wive hindcasting was performed by theprocess described in section lIB of this report to produce a significant wave heightand period for three fetch exposures northeast, southeast and south of the Andersonand King-Lincoln RCPWAVE grid (Figure 19). Evident on the grid is Hampton Flats,Newport News Bar, the subsidiary channel scoured by tidal currents just offshoreand parallel to King-Lincoln Park, and the dredged Newport News shipping channel.The modal conditions (Table 6) were run at about MLW while the storm conditionsassumed a 5.2 ft MLW (1.6 m) storm surge which is approximately the 5 year stormsurge level (Boon et al., 1978). The storm situations that were run were 1988 and1989 northeasters as well as a 1985storm whose winds generally blew from the eastand generated waves traveling approximately west.
Table 6. KLA grid summary input wave conditions.
Only waves from the southeast, traveling approximately northwest, approachnormal to the shoreline (Figure 20A) and show little refraction or alteration in thewave patterns due to Hampton Flats. In the south and northeast average conditions(Figure 20B&C), the waves begin to be refracted and diminished in height when theyreach the 6 ft (1.8 m) contour just offshore. Their approach to the shoreline issomewhat more shore normal, but they still are at a slight angle when they break.
Figures 21A, B, and C are wave vector plots for the 1988 northeast storm, 1989northeast storm, and 1985 east storm, respectively. During northeast stormconditions, the waves reduce in height over Hampton Flats, but are not refracted sothat the wave crests are parallel to the shore. The waves that diminish over NewportNews bar offshore from King-Lincoln Park can reform over the subsidiary channel.Waves traveling the eastern edge of Hampton Flats are reduced by about one-third asthey travel over the shallowest portion of Newport News bar. As this same wavemoves from Newport News bar over the subsidiary channel it can increase in size upto 43% greater than it was over the bar. The approach of waves from the east during
35
General Fetch Height. Period Wave AverageExposure or Bearing Duration
Storm
(m) (see) eTN) (hours)
South 0.31 2.12 008 14.9
Northeast 0.36 2.27 250 16.7
Southeast 0.27 1.96 311 12.3
1988 Storm 1.25 4.2 252
1989 Storm 1.04 3.8 252
1985 Storm 1.33 4.4 280

~.:.;--.:.;'~.....
.'=:';~;:;,: ===~._- ~:~"'::"~-:'.I . .. ..U'__... ..-_.-.,.....
~"i~~..=-~=-;..
VJ0'\
.,
..~...
. '., ~,~~~;'''1./:.;. ",..
~:'.. ~..,."\.,- ., ~
,., I: It' ~. .. i..
Figure 19. Hampton Roads bathymetric grid (KLAgrid), including Anderson Parkand King-Lincoln Park, for running the RCPWAVE model
North
t

II. = 0.36 111,T = 2.3 see. A ng = 250"
Wave Vec lors _ 0.360m3. 72
riI
Salters Creek S.C S.c.
W'-J
'(
Ik m) ,I:)II,iI
III
.i
iII
AN II AN
'0'"or
King~lncolnKL
o
X (k m)
A
2.73 0 X Ik m)
B 8'V:eVl'vl'clnr sct1h's \'ary. c
Figure 20. KLA grid wave vector plots for modal conditions for the A.) southeast,B.) south, and C.) northeast fetch exposure.

3. 72
Salters Creek
Amlerson Puk
'(
(k m)VJCO
Klng-Uncoln
NorthH. =1.25 m. T =4.2 sec. Ang = 252. ,Wave Vec tors _ J.250 m
H. =1.04 III, T =3.8 sec. Ang =252"
Wave Vec tors _ J.040 rn
oX (k m)
AX (k m)
B .Wave vector scales vary.
X (k m)
C
Figure 21.
II. = 1.33 III, T = 4.4 sec, Ang = 280.
Wave Vedors _ 1.330m
S.c.
AN
KL
o 2.73
KLA grid wave vector plots for average conditions during the A.) 1988northeast storm, 13.)1989 northeast storm, C.) 1985east storm.

a storm (Figure 20C) are reduced in wave height by Hampton flats, but the waves arerefracted only slightly and still approach the shoreline at an angle. However, at thesouthwestern portion of the grid near King-Lincoln Park the waves are nearly shorenormal. The angle of wave vector approach to the Hampton Roads shoreline for themodelled storm conditions indicate that net alongshore component of littoral driftwill drive sediment towards the southwest down to Newport News Point.
39
C. Anderson Park Beach Characteristics
1. Beach Profiles and their Variability
Presently, 29 profiles lines have been set up along the shoreline at AndersonPark beach and Christopher Shores. Profile number 16 is the southern limit of thepublic beach area, and numbers 17-29extend through Christopher Shores. While notall the profiles are surveyed regularly, some portion of the beach was surveyedannually.
Figures 22 and 23 are plots of five significant survey dates (pre-project=1983;post-project=1985; intermediate dates=1987 and 1989; present shoreline=1992 or 1993)taken along profiles 13, 14, 15 and 16 at Anderson Park beach. Profiles 13, 14, and 15are located in groin compartment 4, and profile 16 is at the end of Anderson Parkbeach where the spur was placed in 1988. Additional profile lines and survey datesare located in Appendix II.
Profiles 6, 9, 12, and 15 are located on the right side (looking riverward) of thegroin compartments. These profiles have undergone some episodes of erosion andaccretion but presently their shoreline is in approximately the same position as thepost-fill survey (April 1985)or has accreted slightly riverward. Profiles 8, 11, and 14are located in the center of their groin compartments. Overall, these profiles havechanged very little since the groin installation and fill project. Profiles 7, 10, 13, and16 are located on the left side of the groin compartment (looking riverward). In 1987,these profiles showed severe erosion of the shoreline probably due in part to thepassage of Hurricane Gloria in fall of 1985,but in Feb 1988, the spur was added atprofile 16 and approximately 400 cy (306 m3)of sand was placed on that profile.Between 1988 and 1989,profiles 7, 10, and 13 accreted. This probably was due totransport over the groin in the backshore and on the beach face. Presently, thesethree profiles are eroding, but due to the sand transported across the groins, theseprofiles have not eroded back to their pre-project shoreline.
This pattern of groin compartment development tends to develop where thenet alongshore component of littoral transport is to the southwest or from left to rightof the groin compartment. In addition, the groin compartments adjust their shape tothe wave field.
Profiles 17 through 29 are located along Christopher Shores. As a result of theproject at Anderson Park and the passage of Hurricane Gloria, profile 17 initially lostapproximately 45 ft (14 m) MSL of shoreline, but since 1987,it has had only slightepisodes of erosion and accretion. Profiles 18 and 19 show the same general trend --between 1985 and 1987,a significant amount of sand was lost from the backshore andon the beach face such that the shoreline receded about 57 ft (17 m) or at an averagerate of 27 ft/yr (8 m/yr). From 1987to 1989, there was not much change in shorelineposition at profiles 18 and 19, but between 1989 and 1992 approximately 22.9 ft (7 m)was lost at an average rate of 6.7 ft/yr (2.0 m/yr). Between 1992 and 1993, there waslittle change on these profile lines.
40

-5
-10o 200 400 600
Distance. FT
800 1000 1200
15
20
-10o 200 400 600 800 1000 1200
DIstance. FT
Figure 22. Anderson Park plots depicting change at profiles 13 and 1441
City of NewportNews. Anderson Park 8each
20 .Line Survey Date
13 100 13 JUL 8313 U5 30 APR 85
15+ --. 13 125 27 MAY 8713 135 3 JUL 8913 146 19 OCT 93
I10
.....LI..
C0 5...rc>QJ-uJ
01 '?.:2I_ HSL
City of Newport News. Anderson Park 8each
Llne Survey Date
14 100 13 JUL 8314 115 30 APR 8514 125 27 MAY 8714 135 3 JUL 8914 146 19 OCT 93
10.....LI..
C
MSL
05.
...ro>QJ-uJ
0
-5

-5
-10o 200 400 600
DIstance. FT
BOO 1000 1200
15
20
10
co.~oj<tI>QJ-UJ
:-1SL
-5
-10o 200 400 600 BOO 1000 1200
Figure 23.Djstance. FT
Anderson Park plots depicting change at profiles 15 and 1642
-- - --
Cjty of Newport News. Anderson Park BeaCh
20llne Survey Date
15 100 13 JUL B315 115 30 APR B5
15+ 15 125 27 MAY B715 135 3 JUL B915 146 19 OCT 93
I10
lJ...
C0
5oj<tI>QJ-UJ
o I '\ '1\...... :SL
CIty of Newport News. Anderson Park Beach
llne Survey Date
16 115 30 APR B516 125 27 MAY B716 135 3 JUL B916 146 19 OCT 93
- - -- - -- -. - - - .- -- . - -. . -. - - - . - - - -- - - - -- . .._ __._ _______ ___. ____ _n+ ._ _. ______
Profiles 20 to 22 show the same trend but the amount of erosion changes downthe shoreline to the southwest. Progressively alongshore, less erosion took placebetween 1985 and 1987 at profile 22 than at profile 18. Between 1989 and 1992,progressively more erosion took place at profile 22 than at profile 18. This could bedue to the development of a spiral bay feature (Figure 6) in the scour area of the lastgroin at Anderson Park as the last groin and spur act as a natural headland. As themore northern portion of the shoreline obtains a dynamic equilibrium, erosion isshifted down the shore. In dynamic equilibrium, there is a continual supply ofsediment from upcoast or within the embayment passing through the bay (Silvesterand Hsu, 1993). The tangential portion of the Christopher Shores beach willeventually align with the impinging wave climate. However, since profiles 23through 28 were only established in 1992, long-term trends could not be discernedalong what is probably the tangential section of shoreline; little change has occurredbetween 1992 and 1993 along this shoreline.
2. Variability. in shoreline position
The change of lateral position of MHW depicts movement of the shoreline.Figure 24 shows the changes of Anderson Park and Christopher Shores over timefrom 1983 to 1993. July 1983is the pre-project shoreline; April 1985 is the post-project shoreline. The jagged shape of the shoreline after 1985 is the result of thegroin installation.
In 1983, the average distance to MHW from the baseline was 76 ft (23 m).After the groin installation and sand placement, the average distance to MHWincreased approximately 40 ft (12 m). Also evident in the 1985 survey was the widebeach at Christopher Shores that developed after the 1940's installation of the groin atprofile number 29. During the next two years, the shoreline eroded somewhat acrossthe entire Anderson Park shore, but severe erosion occurred at profiles 7, 10, 13, and16 prompted the placement of spur and fill material obvious on the 1989 shoreline atprofile 16. The erosion just south of the last groin at Anderson Park created anembayed shoreline between two "headlands" along the Christopher Shores shoreline.Profiles 16, 17, and 18 lost an average of 54 ft (17 m) MHW.
Profile 16 increased about 53 ft (16 m) from the spur and fill project completedin Feb 1988 and shown in the July 1989 survey. Profiles 7, 10, and 13, which areimmediately down drift of the groins, accreted an average of 31 ft (9 m). 1992 and1993 show the present state of the beach. Erosion rates have decreased such thatlittle change has occurred at MHW between those two surveys.
3. Beachand Nearshore Volume Changes
Since survey data along the profile lines is sporadic, total volume calculationsalong the Anderson Park shoreline could not be computed. However, shorelinetrends and events are shown in the volume calculations based on available data(Figures 25 to 29). Subaerial beach calculations extend from the baseline to MLW,but nearshore calculations extend from MLW to varying distances into the nearshore.
43
-----

1-------------------------------------------
4_____ ----------------------------------------
4______________________________________________________
o1 2 3 456 7 8 9 10 11 12 13 14 15 16 17 18 19 20 21 22 23 24 25 26 27 28 29
Profile Number
Figure 24.
1--- JUL83-%S-APRB5 "*" MAY87 I* JULB9 -a- N0V92'" NOV93
Anderson Park distance of MHW from the survey baseline
44
200
180
160
140
g120
I::;:E
.9100Q)ucCtS 80-C/)(5
60
40
20

Volume change between pre and post fill A3'
*Net Subaerial Beach volume change (cy) =13,940*Net Nearshore Beach volume change (cy) = 150
.--.......
2 .... ...J Anderson Park Beac!'l I JChristoPher Shores l. .............
.~ ...-..
-..O' --..
-1 i i i i I I I _1 2 3 4 5 6 7 8 9 10 11 12 13 14 15 16 17 18 19 20 21 22 23 24 25 26 27
Cell Number
I.BaSed on available profile datal
I-&- subaerial * nearshore I
Volume change betweenPost-fill(85) ana June 1986 B
3
.Net Subaerial Beach volume change (cy) " .3.509"Net Nearshore Beach volume change (cy) " .70
2 -.-.......................
---. --------------- -.o. _..o.
~Q)C)
ffi.s::.UQ)
E:J
~
I Ande<son Park Beach I IChristoPher Shores I. o o."'.."' ...............
... o. o.o.o.o... o o .........
o o o o o o ...
o
-11 2 3 4 5 6 7 8 9 10 11 12 13 14 15 16 17 18 19 20 21 22 23 24 25 26 27
Cell Number
1--- subaerial * nearshore II.Basedonavailableprofiledatal
Figure 25. Volume change between A.) pre- and post-fill Gun 1984and Apr 1985)and B.) post-fill (Apr 1985) and Jun 1986.
45

Volume change betweenJune 1986 and May 1987 A
3*Net Subaerial Beach volume change (cy) =.3,478
*Net Nearshore Beach volume change (cy) =-63-- ---
-- O'.. ___..O' ___ O'.. __.............._..
J AndersonPari<Beach I... ... ... ... 1. .IChristoPher Shores l ........
-- -- -- ---.......................-......
-- --- -.. -- -.......
o
.500 .. . . ~ ~.
., ,1234567
I I I I I I I , I I I I i I I8 9 10 l' 12 13 14 15 16 17 18 19 20 21 22 23 24 25 26 27
Cell Number
1-liI- subaerial * nearshore II"BaSed on available profile datal
Volume change betweenMay 1987 and April 1988 B
3
"Net Subaerial Beach volume change (cy) = 381
"Net Nearshore Beach volume change (cy) =46.-..-.....
........
...1..~~~~.~~ ~~. .I ... 1 .l~~.~~~~~.~~~~~~~~l ............
-. -.--......
....----
o
.5~..."".." " "." "'.".".." "" "...".". .........
.11 2 3 4 5 6 7 8 9 10 11 12 13 14 15 16 17 18 19 20 21 22 23 24 25 26 27
Cell Number
Figure 26.I subaerial* nearshore I
Volume change between A.) Jun 1986 and May 1987 and B.) May 1987and Apr 1988.
46
I"Based on ava~able profile datal
- --- - -- -

Volume change betweenApr 1988 ana Jul1989 A
3
*Net Subaerial Beach volume change (cy) =644
-Net Nearshore Beach volume change (cy) = 186-....................................
...... .. ...... .. "'.-" .. .. .. .. ........
. ___________ ..I AndersonParkBeach I.. __ 1. .JChristoPher Shores I -..-.....
...-..... ... -.............
500 ...... .. .............. .... .. I- ................ .. .... .. ..................
o
-500 ..........................................................................................................................................................
-10 I I 1 -T-- I I I I
1 2 3 4 5 6 7 8 9 10 11 12 13 14 15 16 17 18 19 20 21 22 23 24 25 26 27Cell Number
I-Based on ava~able profile datalI subaerial "* nearshore 1
Volume change betweenJul1989 ana Sep 1990 B
3-Net Subaerial Beach volume change (cy) = -750
.Net Nearshore Beach volume change (cy) =-777
~ ,,,00-1 ..J Anderson Park Beach I _..... ._ 1 -'ChristoPherShoresI.....................Q)C)c113
~ , rvv't"+.. oI... ...............................(,)Q)
E.;! rw~.. ",.. ...........
~
o o..oo..oo.o o o.o.o..o o..o o.o o...o..o...o.o...- o _o.o o.o..o.. o o _o. o o o.....
... o o o.o...o o...o... __.o o o __ oo o ......._.
o
-5 o.o o o _o o o - - _. - _.....................
.10
1 2 3 4 5 6 7 8 9 10 11 12 13 14 15 16 17 18 19 20 21 22 23 24 25 26 27Cell Number
1--- subaerial "* nearshore II-Based on available profile datal
Figure 27.Volume change between A.) Apr 1988 and Ju11989 and B.) Ju11989 andSep 1990.
47

Volumechange betweenSep 1990 and Nov 1992 A
3"Net Subaerial Seach volume change (cy) =378"Net Nearshore Seach volume change (cy) =238
~Q)0>
ffi.s::()Q)E:J(5>
-1 _.....
-.. ............................
m 1 AndersonPat\<BeaCh I. .1. ... J ChristopherShores L m m
--- ......................................................................... ......--........
........... O'__.......................
o
-500 w OoOoOo.OoOo.Oo.. Oo.. OoOo ..............
.11 2 3 4 5 6 7 8 9 10 11 12 13 14 15 16 17 18 19 20 21 22 23 24 25 26 27
Cell Number
l"saSed on available profile datalI subaerial * nearshore I
Volumechange betweenNov1992and Oct 1993 B
3"Net SubaerialSeach volume change (cy) = 47
"Net Nearshore Beach volume change (cy) =50
~ 1"rvl J AndersalPat\<BeaCh t L .--'ChristoPherShoresl.................Q)0>Cro
.J::. 1~ OoOoOoOoOoOoOoOo.OoOo Oo ...............................
()Q)E~ h~ Oo ...._........
~
.. --. Oo Oo .........
Oo.Oo .......
o
.5 Oo _. _.........................
.11 2 3 4 5 6 7 8 9 10 11 12 13 14 15 16 17 18 19 20 21 22 23 24 25 26 27
Cell Number
I"sased on availableprofiledatalI subaerial * nearshore I
Figure 28. Volume change between A.) Sep 1990 and Nov 1992 and B.) Nov 199:and Oct 1993.
48

VolumechangebetweenPost-fill(85)and Nov 92
*Anderson Park Net Subaerial Beach volume change (cy) =-416*Christopher Shores Net Subaerial Beach volume change (cy) = -6,254~-----------------------------------------------
~-----------------------------------------------
IAnderson Park Beach I I Christopher Shores I
% 500-Q)C)c:
jg 0()Q)
E::J<5 -5>
~-----------------------------------------------
-10
"------------------------------------------------
-15.v~ ~..............._-_._..-...-.-.__.....--------...
-201 2 3 4 5 6 7 8 9 10 11 12 13 14 15 16 17 18 19 20 21 22 23 24 25 26 27
Cell Number I . .*Based on available profile data
Figure 29. Net subaerial volume change between post-fill CApr 1985) and Nov1992.
49
- -----

- -- -- -- - - - - -- - - -- --- - . _ _._ _. _. _. _ __ __ _ _ _ __. __n
The distance used in the calculations is determined by the length of the shortestprofile being compared. Approximately yearly net volume change was calculated forboth the subaerial and nearshore portions of the beach. Net volume change is thetotal amount lost and/ or gained by the beach over a given period of time. Since thefigures are based on available data, the numbers can only be used to indicate trendsalong the beach rather than actual changes.
The subaerial and nearshore regions were synchronized in episodes of neterosion and accretion. When one eroded, so did the other and vice versa. Figure25A is the volume change between pre- and post-fill. Not all the fill material appearsin the available data, but approximately 16,000 cy (12,234 m3) was placed on thebeach. Following the 1985 project (Figure 25B), shoreline adjustment was erraticalong the Anderson Park shoreline, but a scour area had developed down drift of thelast Anderson Park groin. Cell 16, itself, lost approximately 700 cy (535 m3) of sandin the year following the project installation. Between 1986 and 1987 (Figure 26A),the erosion was shifting along the shoreline such that cell 19 showed the greatest lossof volume, almost 600 cy (460 m3). Also during this time, cells 7, 10 and 13 each lostan average of 220 cy (170 m3). Figure 26B shows the volume change between 1987and 1988. It includes the second project at Anderson Park which included theinstallation of spurs and the placement of about 400 cy (306 m3) of sand at profile 16.However, cells 15 and 16 showed a combined accretion of approximately 860 cy (660m3).
Figure 27A shows accretion at cells 7, 10, and 13 of 584 cy (447 m3). However,these same cells lost about 630 cy (480 m3) the following year (Figure 27B). Since1990 (Figures 28A&B), the net change between the subaerial and nearshore portionsof the beach are approximately the same in volume, and the total amount of netchange is decreasing. Also, some nearshore data could not be calculated for figure28B. Figure 29 is the net subaerial beach change that has occurred between post-fill(Apr 1985) and Nov 1992. Erosion and deposition both occurred along the AndersonPark shoreline; however, Christopher Shores only eroded, particularly the scour areadowndrlft of the last groin. Again, this graph is based on available data and doesnot accurately represent the true amount of volume change at Anderson andChristopher Shores, only trends. In addition, an additional fill of 400 cy (m3) wasadded in 1988.
50
------

D. King-Lincoln Park Beach Characteristics
1. Beach Profiles and their V Q1'iability
Five profile lines were established perpendicular to the shoreline in December1993. The distance between successive profile lines varies between 207 and 217 feet.
Figures 30, 31 and 32 are the plots of each profile for the four survey datesavailable. Profile numbers, survey numbers, and dates are found in the figurelegends. Small episodes of accretion and erosion are seen in the 1993 and 1994surveys of the beach, but overall, there was little change along the profile lines.However, Survey 103, which was made in April 1995, indicates the placement of thebeach fill. Little fill was placed along the northernmost portion of the beach near thepier on profile 1 while profiles 2 and 3 received a significant amount of sand on thebeach. Placement along profiles 4 and 5 was both on the beach and in the nearshoreregion.
The current shape of the beach varies significantly from previous surveys sincebeach fill was placed along the southern portion of King-Lincoln Beach. However,plans are underway to redistribute the sand across the beach and into dunes.
2. Variability in Shoreline Position
The lateral movement of the active beach through time can be depicted byplotting the position of MHW. Figure 33 shows the distance of MHW from thebaseline for each profile date.
Over the winter of 1993and the spring of 1994, the beach at King-Lincolnaccreted an average of 8 ft (2.5 m) along the beach. From June 1994to December1994, profiles 1 through 4 lost an average of 2.4 ft (0.7 m); however, during that sameperiod, the southernmost profile (5) gained approximately 19 ft (5.8 m). In April1995, the position of MHW increased greatly from north to south along the beachreflecting the placement of the fill material. To show the difference in distribution ofsand along the beach, profile 1 gained 2.8 ft (0.9 m) while profile 5 gained 192 ft (58.5m) in the distance to MHW.
3. Beach and Nearshore Volume Changes
Overall, little natural change has occurred at King-Lincoln Park beach since theinception of VIMS's surveying. The subaerial portion of the beach betweenDecember 1993 and December 1994had a net accretion of 12 cy (Figure 34A) whilethe nearshore region had a net erosion of 290 cy (Figure 34B). In general, what waslost over the winter and spring was regained or nearly regained over the summerand fall. The large volume of sand on the beach in April 1995was the result of thebeach fill project. Of the total amount of sand within our survey area approximately62% was placed on the"subaerial beach, the rest in the nearshore region.
51
-- -----

-10o 100 200 300 400 500
Distance. FT
600 700 800
-10o 100 200 300 400 500
D1stance. FT
600 700 BOO
Figure 30. King-Lincoln Park plots depicting change at profiles 1 and 2.
52
- - -
KING-LINCOLN PARKPUBLIC BEACH
30Line Survey Date
2 100 8 DEC 932 101 17 JUN 942 102 12 DEC 94
20--L 2 103 11 APR 95
l-LL
e0
10.-....It!>QJ
I \-.......,.."w
"\"
01 ,'\. ,!fLY.
-.'-..-..-.-- "-..-
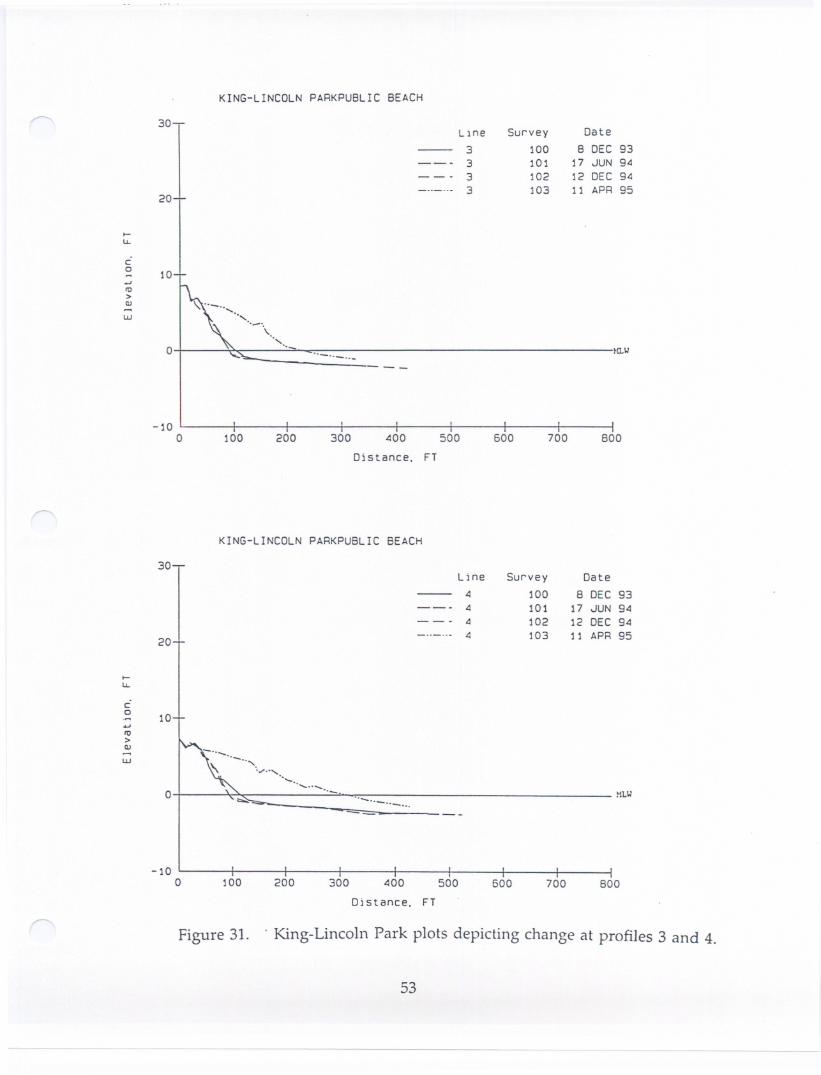
-10o 100 200 300 400 500 600 700 800
Distance. FT
-10o 100 200 300 400 500
Distance. FT
600 700 800
Figure 31. . King-Lincoln Park plots depicting change at profiles 3 and 4.
53
KING-LINCOLN PARKPU8LIC 8EACH
30 _
Llne Survey Date
3 100 8 DEC 933 101 17 JUN 943 102 12 DEC 94
203 103 11 APR 95
t-lJ..
C0
10-.w10>III
I -\\---,.."-w
.-.,
01"--
--...-..-...-tlLlI'-
KING-LINCOLN PARKPUBLIC BEACH
30Line Survey Date
4 100 8 DEC 934 101 17 JUN 944 102 12 DEC 94
20 '4 103 11 APR 95
t-lJ..
C0
10.-.w10>III
I ,..-. ........--....,w
..........,
01" .............................- MLII,
...........-..-...

- --
30
KING-LINCOLN PARKPUBLIC BEACH
.;;: '."""" .........-....................
-10o 100
Figure 32.
- _.~.~-...-...-..-..
200 300 400 500
DIstance. FT
MLII
500 700 BOO
King-Lincoln Park plot depicting change at profile 5.
54
----
20
I-IJ..
C0
10......It)>cu-w
0
Une Survey Date
5 100 B DEC 935 101 17 JUN 90d5 102 12 DEC 90d5 103 11 APR 95

400
350 1
3 .--.--....-----...--..--.....---..........--.------------------------------------------------------------------------
--------------------------------------------------------------------------------.----------------
------------------------------------------------------------------------------------
150 ------------------------------------------ --------------------------------------.-----------------------------.-
100 ---------- -----------------.------------------------------------------------------.-------------------..----------
50
I
!
1I
I!o I
51 3Profile Number
I ill- DEC93-£ JUN94 "* DEC94* APR95 I
2 4
Figure 33. King-Lincoln Park distance of MHW from the survey baseline.
55
---
g 250
J:
o 200-Q)u
ffi1i5
0

Q)0)cCt!
.£:oQ)
E:J
""6>
>:~Q)0)cCt!
.£: 3000oQ)
E:J
""6>
7000Net Subaerial Beach Volume Change (cy) Dec93.Jun94 =.62 I ANet Subaerial Beach Volume Change (cy) Jun94-Dec94 =74
..~!~.~~~~.~.~~..~.~=.~u~~!~_~_~_~_~_~,,_~~_Jc:YL~_c:~~~~P._~~"~"~'§':~'~~'''''''''''_h'''''''''''_''''''''''''''''''''''''''''''''_...................................6000
5000 ..-.................................................................................................................
4000 ................................................................................................
3000..................................-.....-.............-....... .................................................................................................
2000.................................. ...............................................................................-......................
1000 ..................._.....................................................-.........................
o
-10002 3 4
Cell Number
-8- Dec93-Jun94~ Jun94-Dec94 ""*- Dec94-Apr9S
7000Net Nearshore Beach Volume Change (c}') Dec93.Jun94 = .1.098
Net Nearshore Beach Volume Change (cy) Jun94.Dec94 =808
..~.~.~.~.~.!'.~~.~~.~.!..~.~.!'.~.~..Y.~.~~.~.!..~.~.o.".~.e. ..(.c:.¥.)..!:)~.c. ~.~:.":p'.r~~..~. .'. ~.~~9!... ........................................................................................
B6000
5000-................................................................................ ................................ ........................................................................................
4000 ....... . ........................................................................................................
....................................-...................
1000....-..........-..-..--.---..--...--..................................................................-.........................-....-..-................................-.-..-..................................-..
if I:
o ..
-10002 3 4
Cell Number
1-8- Dec93-Jun94 ~ Jun94-Dec94 ""*- Dec94-Apr9S
Figure 34. King-Lincoln Park volume calculations by cell for the A.) subaerialbeach and B.) nearshore region.
56

IV. SUMMARY AND CONCLUSIONS
With the upgrades to the public beaches and associated recreation areas, theCity of Newport News has created usable parks and stable beaches. HuntingtonPark beach has changed very little during the time period of this analysis and isjudged to be a stable beach. It's limited fetch exposure and the shelter provided bythe bridge abutment in conjunction with the wide shallow nearshore region reducesthe wave energy impact. Since it is an embayed shoreline, sediment is not generallylost to the system, but rather the shoreline "wobbles" back and forth between the"headlands" in response to differing wave conditions. Some sand is lost througheolian transport into the area behind the beach.
The Hampton Roads shoreline reach has a net alongshore component of littoraldrift to the southwest towards Newport News Point. Historical and present dayaerial photos show the effect of projects on the shoreline. The Anderson Parkshoreline was originally amarsh area, but the stabilization of Salters Creek entranceand the dumping of sandy dredge spoil along the shoreline created a sandy beach.Since then, sand has been eroding from Anderson Park and was deposited againstthe steel groin at the southern boundary of Christopher Shores. With the installationof the groins and fill in the 1980's, shore erosion was minimized at Anderson Park.Episodes of local erosion and accretion occurred within the groin compartments andacross individual profiles as the result of the active littoral transport system and thesand in the groin compartments adjusting to the changing wave climate, but based onavailable data, overall little net change has occurred at Anderson Park.
Downdrift at Christopher Shores, the Anderson Park project created anembayed shoreline resulting in severe erosion initially just south of the last groin atAnderson. However, as the shoreline adjusted to the wave climate, the rate oferosion in this area seems to have decreased dramatically such that little change involume occurred between 1992 and 1993. Further south along the Christopher Shoresbeach, erosion may continue as this shoreline continues to adjust to the wave climate,but most likely, rates will eventually decrease in this area also.
King-Lincoln Park beach changed little prior the fill project in January 1995.Local episodes of erosion and accretion occurred, but essentially, there was notchange in volume on the subaerial beach between December 1993 and 1994. Thenearshore region did, however, lose slightly more than it gained during this period.Overall, King-Lincoln appears to have changed very little since 1937.
57
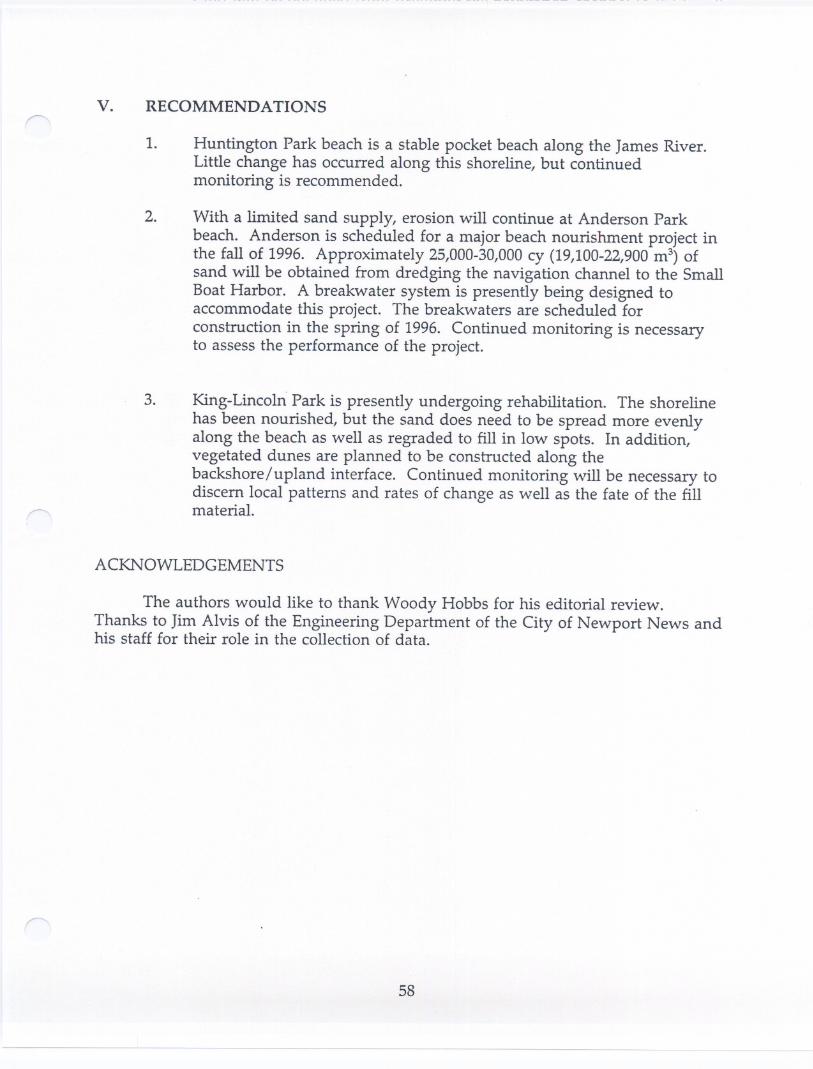
v. RECOMMENDATIONS
1. Huntington Park beach is a stable pocket beach along the James River.Little change has occurred along this shoreline, but continuedmonitoring is recommended.
2. With a limited sand supply, erosion will continue at Anderson Parkbeach. Anderson is scheduled for a major beach nourishment project inthe fall of 1996. Approximately 25,000-30,000cy (19,100-22,900m3)ofsand will be obtained from dredging the navigation channel to the SmallBoat Harbor. A breakwater system is presently being designed toaccommodate this project. The breakwaters are scheduled forconstruction in the spring of 1996. Continued monitoring is necessaryto assess the performance of the project.
3. King-Lincoln"Park is presently undergoing rehabilitation. The shorelinehas been nourished, but the sand does need to be spread more evenlyalong the beach as well as regraded to fill in low spots. In addition,vegetated dunes are planned to be constructed along thebackshore/upland interface. Continued monitoring will be necessary todiscern local patterns and rates of change as well as the fate of the fillmaterial.
ACKNOWLEDGEMENTS
The authors would like to thank Woody Hobbs for his editorial review.Thanks to Jim Alvis of the Engineering Department of the City of Newport News andhis staff for their role in the collection of data.
58
---

VI. REFERENCES
Bascom, W.N., 1959. The relationship between sand size and beach face slope. Am.Geophys.Union Transactions32(6):866-874.
Boon, J.D. and G.R Thomas, 1975. Report on Environmental Effects of the SecondHampton Roads Bridge-Tunnel Construction: Sediment Distributions and BottomCharacteristics. Virginia Institute of Marine Science, College of William andMary, Gloucester Point, VA.
Boon, J.D., C.S. Welch, H.S. Chen, R.J. Lukens, C.S. Fang, and J.M. Zeigler, 1978. AStorm Surge Model Study, Vol. 1. Storm Surge Height-FrequencyAnalysis andModel Predictionfor ChesapeakeBay. SRAMSOENo. 189. Virginia Institute ofMarine Science, College of William and Mary, Gloucester Point, VA. 149 pp. +app.
Boon, J.D., S.M. Kimball, K.D. Suh, and D.A. Hepworth, 1990. ChesapeakeBay WaveClimate. Data Report No. 32, Virginia Institute of Marine Science, College ofWilliam and Mary, Gloucester Point, VA, 38 pp. + app.
Byrne RJ, 1972. Part II. Impact on shoreline, Hampton Flats, and Newport NewsArea. In: (C.S. Fang, principal investigator) Physicaland GeologicalStudies ofthe ProposedBridge-TunnelCrossingof Hampton RoadsnearCraneyIsland.SRAMSOENo. 24. Virginia Institute of Marine Science, College of Williamand Mary, Gloucester Point, VA.
Byrne, RJ., A.Y. Kuo, RL. Mann, J.M. Brubaker, E.P. Ruzecki, P.V. Hyer, RJ. Diaz,and J.H. Posenau, 1987. New Port Island: An Evaluationof Potential ImpactsonMarine Resourcesof the LowerJamesRiver and HamptonRoads. SRAMSOENo.283. Virginia Institute of Marine Science, College of William and Mary,Gloucester Point, VA, 276 pp.
Byrne, RJ., K.P. Kiley, A.P. Mizzi and T.J. Brooks, 1979. Part Two: Geological EffectStudy. In: (C.S.Fang, principal investigator) JamesRiver Hydraulic Model Studywith Respectto theProposedThird Bridge-TunnelCausewayin Hampton Roads.SRAMSOE No. 212. Virginia Institute of Marine Science, College of Williamand Mary, Gloucester Point, VA, 159 pp.
Ebersole, B.A., M.A. Cialone, and M.D. Prater, 1986. RCPWAVE -A Linear Wave
PropagationModelfor EngineeringUse. U.S. Army Corps of EngineersReport,CERC-86-4, 260 pp.
Hardaway, C.S., Jr., G.R Thomas, and J.H. Li, 1991. ChesapeakeBay Shoreline Studies:Headland BreaJ..-watersand Pocket Beachesfor Shoreline Erosion Control. SRAMSOENo. 313. Virginia Institute of Marine Science, College of William and Mary,Gloucester Point~VA, 153 pp.
59
--

Hardaway, e.S., Jr., D.A. Milligan and G.R Thomas, 1993. Public BeachAssessmentReport: CapeCharles Beach, Town of Cape Charles, Virginia. Technical Report,Virginia Institute of Marine Science, College of William and Mary, GloucesterPoint, VA, 42 pp. + app.
Hobbs, III, e.H., G.L. Anderson, W.D. Athearn, RJ. Byrne, and J.M. Zeigler, 1974.Shoreline Situation Report -Newport News, Virginia. SRAMSOE No. 54, VirginiaInstitute of Marine Science, College of William and Mary, Gloucester Point,VA, 65 pp.
Hsu, J.Re., R Silvester, and Y.M Xia, 1989. Generalities on static equilibrium bays.Coast.Eng. 12: 353-369.
Komar, P.D., 1976. BeachProcessesand Sedimentation. Prentice-Hall, Inc., EnglewoodCliffs, NJ, 429 pp.
Silvester, R, 1974. CoastalEngineering,Vol. II. Elsevier, Amsterdam, 338 pp.
Silvester, Rand S.K. Ho, 1972. Use of crenulate shaped bays to stabilize coasts.Proc. 13th Inter. Conf. Coast. Eng. ASCE 2: 1347-65.
Silvester, Rand J.Re. Hsu, 1993. Coastal Stabilization: Innovative COl1cepts. PrenticeHall, Inc., Englewood Cliffs, NJ, 578 pp.
Stauble, D.K., A.W. Garcia, N.e. Kraus, W.G. Grosskopf, and G.P. Bass, 1993. BeachNourishment Project Responseand Design Evaluation: Ocean City, Maryland.Technical Report CERC-93-13,Coastal Engineering Research Center, U.S. ArmyCorps of Engineers Waterways Experiment Station, Vicksburg, MS.
Suh, K.D, 1990. WINDOW Program. Virginia Institute of Marine Science, College ofWilliam and Mary, Gloucester Point, VA.
U.S. Army Corps of Engineers, 1977. Shore Protection Manual. Coastal EngineeringResearch Center, Fort Belvoir, VA.
U.S. Army Corps of Engineers, 1994. Newport News Creek,Newport News, Virginia.Draft Feasibility Report, US Army Corps of Engineers, Norfolk District.
Wright, L.S., e.S. Kim, e.S. Hardaway, Jr., S.M. Kimball, and M.a. Green, 1987.Shorefaceand BeachDynamics of the Coastal Region from Cape Henry to False Cape,Virginia. Technical Report, Virginia Institute of Marine Science, College ofWilliam and Mary, Gloucester Point, VA.
Yasso, W.E., 1965. Plan geometry of headland bay beaches. ]. Geology78: 703-714.
60
--


Bagnold, RA., 1963. Beach and nearshore processes; Part I: Mechanics ofmarine sedimentation. In M.N. Hill (ed.), The Sea,Vol. 3, Wiley-Interscience,pp. 507-528.
Bowen, A.J., D.L. Inman, and V.P. Simmons, 1968. Wave "set-down" and "set-up." ]. Geophys.Res. 73:2569-2577.
Bretschneider, c.L. and RD. Reid, 1954. Modification of wave height due tobottom friction, percolation and refraction. BeachErosionBoardTech.Memo, No.45.
Coastal Engineering Research Center, 1984. ShoreProtectionManual. 4th ed.,U.S. Army Engineer Waterways Experiment Station, Vicksburg, MS.
Christoffersen, J.B. and I.G. Jonsson, 1985. Bed-friction and dissipation ina combined current and wave motion. Ocean Enginr. 12(5):387-424.
Dally, W.R, RG. Dean, and RA. Dalrymple, 1984. Modelling wavetransformation in the surf zone. U.S. Army EngineerWaterwaysExperimentStation Misc. Paper,CERC-84-8,Vicksburg, MS.
Dean, RG., 1973. Heuristic models of sand transport in the surf zone.Proceedings, Con! Enginr. Dynamics in the Swf Zone, Sydney, pp. 208-214.
Eaton, RD., 1950. Littoral processes on sandy coasts. Proceedings, 1stIntI. Con! Coastal Enginr., pp. 140-154.
Grant, W.D. and 0.5. Madsen, 1979. Combined wave and current interaction witha rough bottom. ]. Geophys.Res. 84:1797-1808.
Grant, W.D. and O.S. Madsen, 1982. Movable bed roughness in unsteadyoscillatory flow. ]. Geophys.Res. 87:469-481.
Inman, D.L. and RA. Bagnold, 1963. Beach and nearshore processes; Part II:Littoral processes. In M.N. Hill (ed.), The Sea,Vol. 3, Wiley-Interscience, pp.529-553.
Jonsson, I.G., 1966. Wave boundary layers and friction factors. Proceedings,10th Inti. Con! Coastal Enginr., pp. 127-148.
Kamphuis, J.W., 1975. Friction factor under oscillatory waves. ASCE,]. Wat.Harb. Div., ASCE, 102(WW2):135-144.
Kinsman, B., 1965. Wind Waves, Their Generation and Propagation 011the OceanSurface. Dover, New York, 676 pp.

Komar, P.D., 1975. Nearshore currents: Generation by obliquely incidentwaves and longshore variations in breaker height. Proceedings,Symp. NearshoreSediment Dynamics,Wiley, New York.
Komar, P.D., 1976. Beach Processesand Sedimentation. Prentice-Hall, NewJersey, 429 pp.
Komar, P.D., 1983. Nearshore currents and sand transport on beaches. InJohns (ed.), PhysicalOceanographyof CoastalShelf Seas,Elsevier, New York, pp.67-109.
Komar, P.D. and D.L. Inman, 1970. Longshore sand transport on beaches. ].Geophys.Res. 73(30):5914-5927.
Kraus, N.C. and T.O. Sasaki, 1979. Effects of wave angle and lateral mixingon the longshore current. CoastalEnginr. in Japan22:59-74.
LeMehaute, B. and A. Brebner, 1961. An introduction to coastal morphology andlittoral processes. C.E. ResearchReportNo. 14, Dept. of Civil Enginr., Queen'sUniv., Kingston, Ontario.
Longuet-Higgins, M.S., 1972. Recent progress in the study of longshorecurrents. In RE. Meyer (ed.), Waves on Beachesand Resulting SedimentTransport,Academic Press, New York, pp. 203-248.
Longuet-Higgins, M.S. and RW. Stewart, 1962. Radiation stress and masstransport in gravity waves, with application to surf beats. ]. FluidMech.13:481-504.
Madsen, O.S., 1976. Wave climate of the continental margin: Elements of itsmathematical description. In D.J. Stanley and D.J.P. Swift (eds.), MarineSediment Transportand EnvironmentalManagement,Wiley, New York, pp. 65-90.
Munch-Peterson, J., 1938. Littoral drift formula. BeachErosionBoardBull.4(4):1-31.
Nielsen, P., 1983. Analytical determination of nearshore wave heightvariation due to refraction, shoaling and friction. CoastalEnginr. 7(3):233-252.
Savage, RP., 1962. Laboratory determination of littoral transport rates. ].WW and Harbours Div., ASCE 88(WW2):69-92.
Weggel, J.R, 1972. Maximum breaker height. ]. WW and HarboursDiv., ASCE78(WW 4):529-548.
Wright, L.D., 1981. Beach cut in relation to surf zone morpho dynamics.Proceedings,17th IntZ.ConJ.CoastalEnginr.,Sydney, Australia,pp. 978-996.
- --

Wright, L.D. and A.D. Short, 1984. Morphodynamic variability of surf zonesand beaches: A synthesis. Mar. Geol.56:93-118.
Wright, L.D., R.J. Guza, and A.D. Short, 1982. Dynamics of a high energydissipative surfzone. Mar. Geol.45:41-62.
Wright, L.D., A.D. Short, and M.O. Green, 1985. Short-term changes in themorpho dynamic states of beaches and surfzones: An empirical predictivemodel. Mar. Geol.62:339-364.
Wright, L.D., P. Nielsen, N.C. Shi, and J.H. List, 1986b. Morphodynamics of abar-trough surfzone. Mar. Geol.70:251-285.


20
15
-10o
Ci t Y a f Newport News. Anderson Park Beach
200 400
----
600
Distance. FT
Line
11111
Survey
100105110115135
Date13 JUL B34 OCT B3
11 JUN B430 APR B5
3 JUL 89
XSL
800 1000 1200
10l-Ll..
C5
0..........10>11)
....UJ
0 . "
I-5

20
City of Newport News. Anderson Park Beach
15
;;::;;..-..-..
-5
-10o 200
Line
22222
Survey100105110115135
Date
13 JUL B34 OCT B3
11 JUN B430 APR B5
3 JUL B9
~ISL
400 600
Distance. FT
BOO 1000 1200
10l-I£.
C0
5........."'>OJ....W
0

20
15
-5
-10o
City of Newport News. Anderson Park Beach
..-----.-.---.-....
200
--
400 600
Distance. FT
Line
33333
Survey100105110115135
Date
13 JUL 834 OCT 83
11 JUN 8430 APR 85
3 JUL 89
MSL
-.:::::.-------.
800 1000 1200
10I-U.
C0 5.-....10>QJ....UJ
0

City of Newport News. Anderson Park Beach
20
15
Line
44444
Survey
100105110115135
Date
13 JUL 834 OCT 63
11 JUN 8430 APA 85
3 JUL 89
-5
-10o 200 400 600
Distance. FT
800
City of Newport News. Anderson Park Beach
20Line
4--- 4
15
Survey
135140
1000 1200
Date
3 JUL 8910 SEP 90
-5
-10o 200 400 600
Distance. FT
800 1000 1200
10
u..\ -
rf0
5........10>QI-UJ
MSL0
10
u..
rf
MSL
05....
....10>QI-UJ ..01 . .

City of Newport News. Anderson ParI< Beach
20
15
MSL
-5
-10o 200 400 600
Distance. FT
800 1000 1200
-10o 200 400 600
Distance. FT
800 1000 1200
Line Survey Date
5 100 13 JUL 83
5 105 4 OCT 83
5 110 11 JUN 84
5 115 30 APR 85
5 120 12 JUN 86
10
u.
c:0
5.
to>QJ....
W
0
City of Newport News. Anderson ParI< Beach
20Line Survey Date
5 120 12 JUN 865 135 3 JUL 89
15r
-.-.- 5 140 10 SEP 90
10
u.
c:0
5.
to>QJ....W
0,
HSL
--
-5

Ci ty Of Newport News. Anderson Park Beach
20
15
Line
66666
Survey100105110115120
Date
13 JUL B34 OCT B3
11 JUN B430 APFI B512 JUN 86
MSL
'-'--'-..-.-- "--'-.'-==-= .............-----
-5
-10o 200 400 600 BOO 1000 1200
Distance. FT
City of Newport News. Anderson Park Beach
20
15
-5
-10o 200 400 600
Distance. FT
BOO 1000 1200
10I-U.
C0 5....-'It)>OJ....UJ
0
Line Survey Date
6 120 12 JUN B66 125 27 MAYB76 130 30 APFIBB6 135 3 JUL B96 140 10 SEP 90
10I-U.
C0
5
SL
....-'It)>OJ....
"UJ
0'

City 0 f Newport News. Anderson Park Beach
20Line
6--- 6
Survey140145
Date
10 SEP 9017 NOV 92
15
-5
-10o 200 400 600 BOO 1000 1200
Distance. FT
--
10t-U.
C0
5
tSL
....
>CIJ....
\w
01

City of Newport News. Anderson Park Beach
20
15
MSL
.--.--.: -'-..
-5
-10o 200 400 600
Distance. FT
800 1000 1200
City of Newport News. Anderson Park Beach
20
15
-10o 200 400 600
Distance. FT
800 1000 1200
- -- - ---------
Line Survey Date
7 100 13 JUL 837 105 4 OCT 837 110 11 JUN 847 115 30 APR 857 120 12 JUN 86
10
l-LL.
C0
5......j,J11)>OJ....W
0
Line Survey Date7 120 12 JUN 867 125. 27 MAY B77 130 30 APR 887 135 3 JUL 897 140 10 SEP 90

City of Newport News. Anderson Park Beach
20Line
7--- 7
Survey140145
Date
10 SEP 9017 NOV 92
15
-5
-10o 200 400 600
Distance. FT
BOO 1000 1200
10l-LL
C
MSL
05....
.....It!>CIJ....
\ \w
01
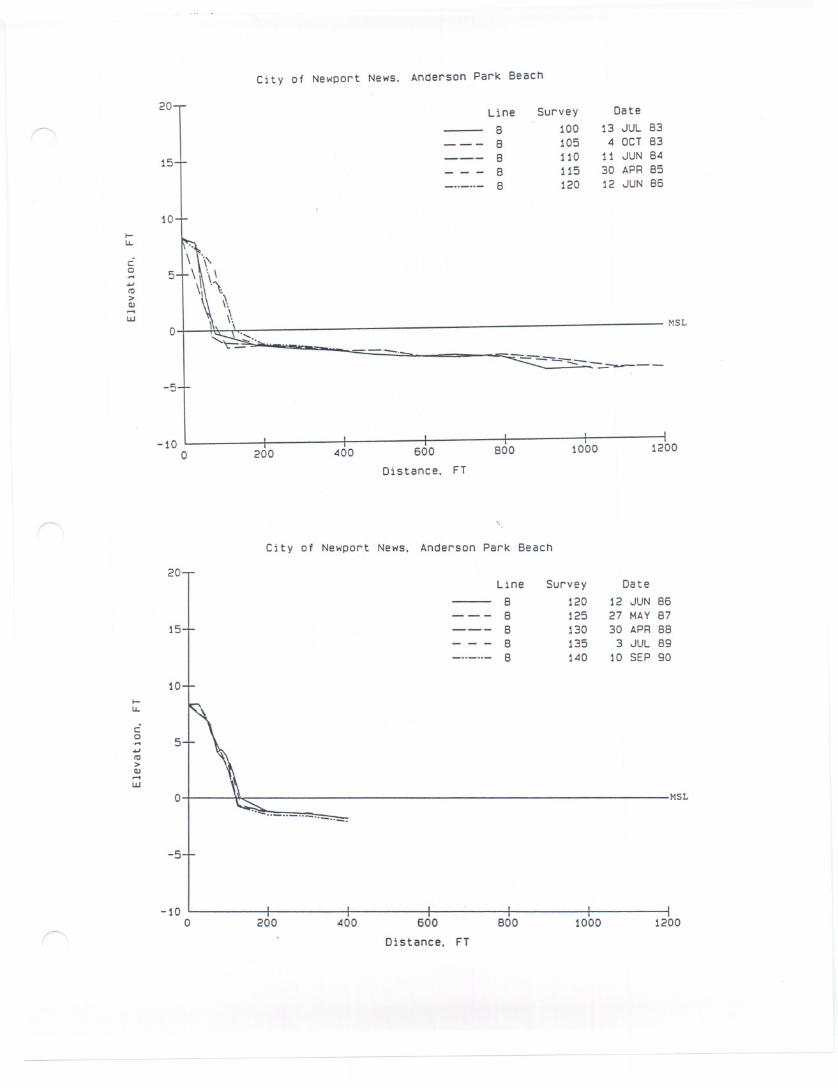
City of Newpo~t News. Ande~son Pa~k Beach
20
15
MSL
-5
-10o 200 400 600
Distance. FT
BOO 1000 1200
-10o 200 400 600
Distance. FT
800 1000 1200
Line Suvey Date
8 100 13 JUL 838 105 4 OCT 838 110 11 JUN 848 115 30 APR 858 120 12 JUN 86
10l-LL
C0 5....
ro>OJ...UJ
0
City of Newpot News. Andeson Pak Beach
20Line Suvey Date
B 120 12 JUN 86B 125 27 MAY87
15+ ---.- 8 130 30 APR 8B8 135 3 JUL 898 140 10 SEP 90
I10
l-LL
C0
5....
ro>OJ...UJ
0 MSL'.
... .. .. ..-.--........
-5
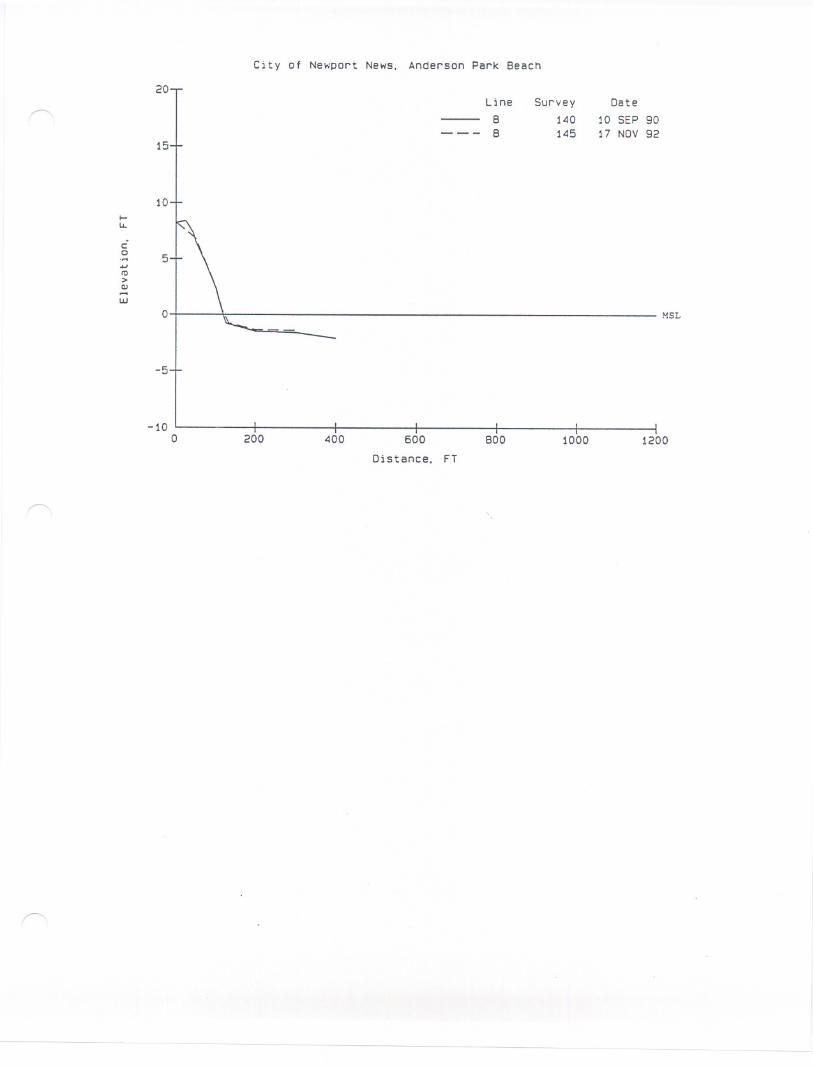
City of Newport News. Anderson Park Beach
20Line
B--- B
Survey140145
Date10 SEP 9017 NOV92
15
-5
-10o 200 400 600 BOO 1000 1200
Distance. FT
10
t-u..
C
MSL
05....
....,It!>QJ....W
."o I

City of Newpo~t News. Ande~son Pa~k Beach
20
15
~ISL
.:::-"=="=:-':::-.:----.-.--.-.-.-
-5
-10o 200 400 600
Distance. FT
800 1000 1200
City of Newpo~t News. Ande~son Pa~k Beach
20
15
-10o 200 400 600
Distance. FT
800 1000 1200
Line Suvey Date
9 100 13 JUL 839 105 4 OCT 839 110 11 JUN 849 115 30 APR 859 120 12 JUN 86
10f-U.
Cc
5...
to>QJ....UJ
0
Line Suvey Date
9 120 12 JUN 869 125 27 MAY879 130 30 APR 889 135 3 JUL 899 140 10 SEP 90
10f-U.
Cc
5
MSL
...to>QJ....UJ
0
'''';;;:''
I
-5

City of Newport News. Anderson Park Beach
20Line
9--- 9
Survey
140145
Date
10 SEP 9017 NOV 92
15
-5
-10o 200 400 600
Distance. FT
800 1000 1200
- -- -- - --
10f-I.L.
C
MSL
05....
.....It!>cu--w
'\01

City of Newport News. Anderson Park Beach
20
15
Line
1010101010
Survey100105110115120
Date
13 JUL 634 OCT 63
11 JUN 6430 APR 6512 JUN 66
MSL
--.---.-------.-.-.-.-.-.--.--~-------5
-10o 200 400 600
Distance. FT
600 1000 1200
City of Newport News. Anderson Park Beach
20
15
-5
-10o 200 400 600
Distance. FT
600 1000 1200
10I-U.
c:0 5.-..,IC>OJ....W
0
Line Survey Date10 120 12 JUN 6610 125 27 MAY6710 130 30 APR 6610 135 3 JUL 6910 140 1>0SEP 90
10I-U.
c:
MSL
05.-
..,IC>OJ....W
,......-o.

City of Newport News. Anderson Park Beach
20Line
10--- 10
Survey140145
Date
10 SEP 9017 NOV 92
15
-5
-10o 200 400 600 800 1000 1200
Distance. FT
10l-LL.
C
MSL
05....
->JItj>Q)....
\,UJ
01

City of Newport News. Anderson Park Beach
20
15
HSL
_._'~ -.-:-.~ ,_.
-10o 200 400 600
Distance. FT
800 1000 1200
City of Newport News. Anderson Park 8each
20
15
-5
-10o 200 400 600
Distance. FT
SOO 1000 1200
Line Survey Date
11 100 13 JUL 8311 105 4 OCT 8311 110 11 JUN 8411 115 30 APR 8511 120 12 JUN 86
10l-I£.
c:0.... 5...,rc>QJ....w
01 \>'\
J"":::::"..
Line Survey Date11 120 12 JUN 8611 125 27 MAY8711 130 30 APR 8811 135 .3 JUL S911 140 10 SEP 90
10l-I£.
c:0
5.......,rc>QJ
MSL
....w
0_

City of Newport News. Anderson Park Beach
20Line
1111
Survey140145
Date
10 SEP 9017 NOV 92
15
-5
-10o 200 400 600
Distance. FT
BOO 1000 1200
10I-U.
C
MSL
05....
...It)>(II....
\UJ
01

City of Newport News. Anderson Park Beach
20
15
Line
1212121212
Survey100105110115120
Date
13 JUL 834 OCT 83
11 JUN 8430 APR 8512 JUN 86
-10o 200 400 600
Distance. FT
800 1000 1200
City of Newport News. Anderson Park Beach
20
15
-5
-10o 200 400 600
Distance. FT
800 1000 1200
10
LL..
C0
5.........
MSL
>QJ .....UJ
0......... ------
I-5
Line Survey Date12 120 12 JUN 8612 125 27 MAY8712 130 30 APR 8812 135 3 JUL 8912 140 10 SEP 90
10
LL..
C
MSL
05....
.....
>QJ....UJ
.-o.

City of Newport News. Anderson Park Beach
20Line
12--- 12
Survey140145
Date
10 SEP 9017 NOV 92
15
-5
-10o 200 400 600
Distance. FT
BOO 1000 1200
10I-U.
C
MSL
05....
....10>c:J....
\UJ
01

City of Newport News. Anderson Park 8each
20
15
Line
1313131313
Survey100105110115120
Date
13 JUL 834 OCT 83
11 JUN 8430 APR 8512 JUN 86
MSL
'-'~'_. '-"'-----.-. _.~
-5
-10o 200 400 600
Distance. FT
800 1000 1200
City of Newport News. Anderson Park 8each
20
15
-5
-10o 200 400 600
Distance. FT
800 1000 1200
10l-LL.
C0 5.......It)>III....UJ
0
Line Survey Date
13 120 12 JUN 8613 125 27 MAY8713 130 30 APR 8813 135 3 JUL 8913 140 10 SEP 90
10l-LL.
C0
5
MSL
...
....It)>III....
\'UJ
01

City Of Newport News. Anderson Park Beach
20
15
Line
131313
Survey140145146
Date
10 SEP 9017 NOV 9219 OCT 93
-5
-10o 200 400 600
Distance. FT
BOO 1000 1200
10to-IJ..
C0
5
HSL
ItI>QJ-
"wo I

City of Newport News. Anderson Park Beach
20
15
Line
1414141414
Survey
100105110115120
Date
13 JUL B34 OCT 83
11 JUN 8430 APR 8512 JUN 86
~ISL
'-'-'-.-..
-5
-10o 200 400 600
Distance. FT
800 1000 1200
-10o 200 400 600
Distance. FT
800 1000 1200
10.....lL.
C0 5......,to>QJ...UJ
0
City of Newport News, Anderson Park Beach
20Line Survey Date
14 120 12 JUN 8614 125 27 MAY87
15-+ -.-.- 14 130 30 APR 8814 135 3 JUL 8914 140 10 SEP 90
I
10l-lL.
C0
5......,to>QJ...UJ
01 k. MSL
.-...E::
I-5

15
20
-5
-10o 200 400 600 BOO 1000 1200
Distance. FT
City of Newport News. Anderson Park Beach
Line Survey Date
14 140 10 SEP 9014 145 17 NDV 9214 146 19 DCT 93
10
I.L
C
M5L
05
/0>QJ-
YUJ o I

CIty of NewportNews. Anderson Park Beach
20
15
Line
1515151515
Survey
100105110115120
Date
13 JUL 834 OCT 83
11 JUN 8430 APR 8512 JUN 86
MSL
'-''::::'''.::,...",
\
-10o 200 400 600
Distance. FT
800 1000 1200
City of Newport News. Anderson Park Beach
20
15
-5
-10o 200 . 400 600
Distance. FT
800 1000 1200
10l-LL
C0
5........,It)>QJ-UJ
0.. '-
-5
Line Survey Date
15 120 12 JUN 8615 125 27 MAY 8715 130 30 APR 8815 135 3 JUL 8915 140 10 SEP 90
10
l-LL
C
MSL
05....
....,It)>QJ-UJ
-o ,

15
20
-5
-10o 200 400 600 BOO 1000 1200
Distance. FT
City of Newport News. Anderson Park Beach
L1ne Survey Date
15 140 10 SEP 9015 145 17 NOV 9215 146 19 OCT 93
10I-U.
C0
5
MSL
.-
...It!
>QJ-
01 ,.UJ

-10o 200 400 600
Distance. FT
600 1000 1200
City of Newport News. Anderson Park 6each
20
15
-5
-10o 200 400 600
Distance. FT
600 1000 1200
City of NewportNews.Anderson Park 6each
20 ILine Survey Date
16 105 4 OCT 63
16 110 11 JUN 64
15+-.-.- 16 115 30 APR 65
16 120 12 JUN 66
I
16 125 27 MAY 67
10
u.
c:0
5.....
to>QJ.....
UJ
°l... HSL
:::= -:",-'.----....:::::..
I
\
-5
Line Survey Date
16 125 27 MAY 6716 130 30 APR 6616 135 3 JUL 6916 140 10 SEP 9016 145 17 NOV 92
10
u.
c:
MSL
05.....
to>QJ.....
\.- \ :
UJ
01

-5
-10o 200 400 600
Distance. FT
800 1000 1200
10....I.L.
C
MSL
0 5.-...>CIJ-
"UJ01

-10o 200 .<100 600
Distance. FT
800 1000 1200
-5
-10o 200 .<100 600
Distance, FT
800 1000 1200
--
City of Newport News. Anderson Park Beach
20Line Survey Date
17 115 30 APR B517 120 12 JUN 86
15+ -.-.- 17 125 27 MAYB717 130 30 APR 8817 135 3 JUL 89
I
10l-II..
C0
5.......,It!>QJ....UJ
0 MSL
....;
-5
City of Newport News. Anderson Park Beach
20Line Survey Date
17 135 3 JUL 8917 1.<10 10 SEP 90
15+ 17 1.<15 17 NOV 9217 1.<16 19 OCT 93
I
10l-II..
C0
5.......,It!>QJ....UJ
o. , ISL
-10o 200 400 600 800 1000 1200
Distance. FT
15
20
-5
-10o 200 400 600
Distance. FT
800 1000 1200
City of NewportNews. Anderson Park Beach
20 .Line Survey Date
I1B 115 30 APR 8518 120 12 JUN 86
15+ -.-.- 18 125 27 MAY 8718 130 30 APR 88
I
18 135 3 JUL 89
10I-U.
r:0
5....
ro>QJ-UJ ..
0MSL
-5
City of Newport News. Anderson Park Beach
Line Survey Date
18 135 3 JUL 8918 145 17 NOV 9218 146 19 OCT 93
10
u.
r:0
5
liSL
...
ro
>QJ-
\UJ oI

City of Newport News. Anderson Park Beach
20
15
Line
1919191919
Survey
115120125130135
Date
30 APR 85
12 ..JUN 86
27 MAY B730 APR 8B
3 ..JUL 89
-5
-10o 200 400 600 800 1000 1200
Distance. FT
15
20
-10o 200 400 600
Distance. FT
BOO 1000 1200
10l-lL.
C0
5
MSt
....
oW/0>QJ....
, '. \UJ
0'
City of Newport News. Anderson Park Beach
Line Survey Date
19 135 3 ..JUL 89
19 145 17 NOV 9219 146 19 OCT 93
10l-lL.
C0
5....
oW/0>QJ....UJ
0 . !'1St-
-5

-10o 200 400 600 BOO 1000 1200
Distance. FT
-10o 200 400 600
Distance. FT
BOO 1000 1200
--
City of NewportNews. Anderson Park Beach
20 .Line Survey Date
20 115 30 APR B520 120 12 JUN B6
15+ -.-.- 20 125 27 MAYB720 130 30 APR BB
I
20 145 17 NOY 92
10I-U.
05....
It)>QI....I.LI
0\ MSL
. .--
-5
City of Newport News. Anderson Park Beach
20Line Survey Date
20 145 17 NOY 92--- 20 146 19 OCT 9315
10I-U.
05
MSL
....
It)>QI....I.LI
0
-5

City of Newport News. Anderson ParK Beach
20
15
-5
-10o 200 400 600
Distance. FT
BOO 1000 1200
-5
-10o 200 400 600
Distance. FT
BOO 1000 1200
Line Survey Date
21 115 30 APR B521 120 12 JUN B621 125 27 MAY B721 130 30 APR BB21 145 17 NOV 92
10
u.
C
MSL
05....
<6JIt)>III....
\ \ \.\UJ
01 . .-- -
City of Newport News. Anderson ParK Beach
20I
Line Survey Date
21 145 17 NOV 92--- 21 146 19 OCT 9315..J..
10
u.
C
MSL
05....
<6JIt)>III....UJ
01 ..

-10o 200 400 600
Distance. FT
800 1000 1200
-10o 200 400 600
Distance. FT
800 1000 1200
City of Newport News. Anderson Park Beach
20 ILine Survey Date
22 115 30 APR 85
22 120 12 JUN 86
15+-.-.- 22 125 27 MAY 87
22 130 30 APR 88
I
22 145 17 NOY 92
10
u.
C0
5....
o>J10>GJ...UJ . \\..
0MSL
\..-.. '--
-5
City of Newport News. Anderson Park Beach
20Line Survey Date
22 145 17 NOY 92--- 22 146 19 OCT 9315
10
u.
C
MSL
05....
o>J10>GJ...
,UJ01
-5

-5
-10o 200 400 600 BOO 1000 1200
Distance. FT
-5
-10o 200 400 600
Distance. FT
BOO 1000 1200
10....
u.
C0
5
MSL
.-
....
10>C1I.....
wO'
City of Newport News. Anderson Park Beach
20Line Survey Date
24 145 17 NOV 92--- 24 146 19 OCT 9315 '
10....
u.
C
tlSL
05.-
....
10>C1I....
\\w
01

City of Newport News. Anoerson Park BeaCh
20Line
25- -. 25
Survey
1~51~6
Date
17 NOV 9219 OCT 93
15
-5
-10o 200 ~OO 600 BOO 1000 1200
Distance. FT
-5
-10o 200 ~OO 600
Distance. FT
BOO 1000 1200
10
u.
C0
5
!!SL
.-oWIt)>III.....
.UJ
01 ,
City of Newport News. Anderson Park BeaCh
20I
Line Survey Date26 15 17 NOV 92--. 26 16 19 OCT 9315-J..
10
u.
C
MSL
05.-
oWIt)>III.....
n
UJ
O.

-5
-10o 200 400 600
Distance. FT
800 1000 1200
-5
-10o 200 400 600
Distance. FT
800 1000 1200
10........
C
HSL
05.-
oW
10>QJ....
"w01
10........
C
HSL
05.-
oW
10>QJ....
'.\w
01


.-. -.. ----
Mz =Mean
Md =Median (Dso)SI =SortingSKI =SkewnessKG =Kurtosis
Huntington Park Summary Sediment Sample Data
Percent of Sample Sand fraction onlySample gravl sand silt clay mud Mz Mz Md SI SKI KG
% % % % % phi mm phiHN86JMH 0 99.9 0.04 1.1950 0.437 1.1710 0.2990 0.2090 1.2310HN94M3-1 12.8 85.4 0.5 1.3 1.8 1.5803 0.334 1.7813 0.8051 -0.3730 0.5941HN94M3-2 0.0 99.4 0.1 0.5 0.6 1.4720 0.360 1.4904 0.5973 -0.0527 0.5903HN94M3-3 9.2 90.0 0.2 0.7 0.9 0.9701 0.510 0.9582 0.7033 0.0921 0.8121HN94M3-4 6.4 92.9 0.0 0.7 0.7 1.0693 0.477 1.1085 0.7015 -0.0071 0.9327HN94M3-5 41.2 58.0 0.3 0.5 0.8 0.7461 0.596 0.6937 0.8807 0.2057 0.8842HN94M3-6 35.4 63.2 0.0 1.4 1.4 1.7940 0.288 1.7058 0.7847 0.0351 0.7527HN9403-1 15.1 82.1 1.0 1.8 2.8 1.8433 0.279 1.9348 0.6824 -0.2417 0.5679HN9403-2 0.6 98.8 0.1 0.5 0.6 1.2979 0.407 1.3107 0.3815 -0.0419 0.5081HN9403-3 23.3 76.4 0.1 0.1 0.2 0.4900 0.712 0.4853 0.5425 0.0817 0.8699HN9403-4 17.1 82.1 0.1 0.6 0.7 0.3736 0.7720.3133 0.5733 0.3758 1.5386HN9403-5 26.1 72.9 0.1 0.8 0.9 1.0762 0.474 1.1034 0.8772 0.0081 0.6606HN9403-6 3.3 95.0 0.5 1.3 1.8 1.4816 0.358 1.4651 0.7102 0.0056 0.7012HN95A1-1 19.5 79.8 0.2 0.5 0.7 0.5093 0.703 0.4448 0.7346 0.2761 1.1929HN95A2-1 16.0 83.9 0.1 0.2 0.3 0.2249 0.856 0.1322 0.6680 0.3723 1.8659HN95A3-1 9.4 87.0 1.4 2.3 3.6 1.6298 0.323 1.6917 0.7676 -0.1372 0.6219HN95A3-2 3.6 95.5 0.3 0.5 0.9 0.9976 0.501 1.0993 0.8771 -0.0900 0.8343HN95A3-3 36.9 62.4 0.1 0.7 0.8 0.2696 0.830 0.0939 0.7968 0.5286 1.8169HN95A3-4 30.0 68.9 0.2 0.9 1.1 0.1574 0.897 0.0445 0.7872 0.4537 2.0986HN95A3-5 42.0 56.7 0.1 1.3 1.4 1.2019 0.435 1.2587 1.1247 0.0073 0.8131HN95A3-6 26.1 71.2 0.6 2.0 2.6 1.5533 0.341 1.4412 1.1687 0.1155 0.8718HN95A4-1 18.8 80.4 0.0 0.8 0.8 0.7084 0.612 0.6442 1.0560 0.1882 0.9775HN95A5-1 11.1 88.2 0.2 0.6 0.8 0.5433 0.686 0.5995 0.4007 -0.2087 0.7403

_. d U . _ ._ _
Mz = MeanMd = Median (Dso)SI = SortingSKI = Skewness.KG = Kurtosis
King-Lincoln Park Summary Sediment Sample Data-
Percent of Sample Sand fraction onlySample gravl sand silt clay Mz Mz Md SI SKI KG
% % % % phi mm phiKN9301-1 3.9 95.0 0.5 0.6 1.5642 0.338 1.6130 0.5853 -0.2307 0.7393KN9302-1 0.0 99.3 0.2 0.5 1.4015 0.379 1.4222 0.5051 0.0459 0.5659KN9303-1 8.1 91.4 0.0 0.5 1.3496 0.392 1.3065 0.7761 0.1797 0.7020KN9304-1 0.0 98.7 0.2 1.1 1.5998 0.330 1.5836 0.5190 0.0978 0.5636KN9305-1 0.5 98.1 0.4 0.9 2.0433 0.243 2.0675 0.6831 -0.0478 0.4844KN94J1-1 24.9 74.3 0.0 0.8 1.2455 0.422 0.5527 1.2297 0.6914 0.4974KN94J2-1 27.4 71.8 0.5 0.3 1.2437 0.422 0.8501 1.2202 0.3942 0.6778KN94J3-1 0.1 99.2 0.6 0.0 1.7486 0.298 1.7637 0.5030 -0.0663 0.5151KN94J3-2 7.4 91.8 0.6 0.2 1.9703 0.255 2.0163 0.6321 -0.1075 0.5088KN94J3-3 27.8 71.3 0.0 0.9 1.4287 0.371 1.2907 1.1924 0.1331 0.6053KN94J3-4 80.7 18.8 0.0 0.5 0.5012 0.707 0.2390 0.9194 0.6270 2.0503KN94J3-5 0.0 93.8 2.1 4.2 3.0609 0.120 3.1472 0.5233 -0.2453 0.3447KN94J4-1 8.1 90.7 0.4 0.8 1.5461 0.342 1.6554 1.2756 -0.0786 0.6800KN94J5-1 8.3 91.0 0.3 0.5 1.7855 0.290 1.8686 0.6877 -0.1718 0.5720KN9401-1 1.5 97.5 0.3 0.7 0.3416 0.789 0.3509 0.2616 -0.0229 0.9043KN9402-1 1.6 97.2 0.1 1.1 1.5904 0.332 1.5410 0.6330 0.1531 0.5004KN9403-1 0.0 99.7 0.1 0.2 1.6531 0.318 1.6620 0.3273 -0.0666 0.3599KN9403-2 0.1 99.1 0.9 0.0 1.9656 0.256 1.9714 0.6383 -0.0624 0.5089KN9403-3 52.6 46.8 0.2 0.4 1.3791 0.384 1.2144 1.0816 0.1855 0.6507KN9403-4 94.3 4.8 0.8 0.1 1.2029 0.434 0.6598 1.5406 0.4568 0.5595KN9404-1 5.7 93.5 0.4 0.5 1.3665 0.388 1.1703 0.9798 0.2734 0.5985KN9405-1 1.5 96.9 0.5 1.2 1.6731 0.314 1.7362 0.9436 -0.1029 0.6802KN95A1-1 3.7 94.9 0.1 1.3KN95A2-1 0.5 97.9 0.0 1.6KN95A3-1 1.9 95.6 0.9 1.5 1.9856 0.253 2.0603 0.6209 -0.2000 0.5385KN95A3-2 4.7 93.8 0.3 1.2 1.6104 0.328 1.5981 0.8500 -0.0479 0.6300KN95A3-3 0.0 99.0 0.1 0.9 1.9820 0.253 1.9664 0.5188 -0.0136 0.4550KN95A3-4 1.8 96.6 0.1 1.6 1.8054 0.286 1.8880 0.7236 -0.2460 0.6072KN95A3-5 0.0 97.6 1.2 1.2 2.6029 0.165 2.6099 0.3378 0.0077 0.2681
KN95A3-6A 0.0 96.4 1.1 2.4 2.8440 0.139 2.8179 0.3924 0.0817 0.2890KN95A3-68 0.0 30.8 37.7 31.5 3.1272 0.114 3.0804 0.5265 0.0508 0.3352KN95A4-1 1.4 97.0 0.2 1.3KN95A5-1 0.7 97.9 0.1 1.3