newmont mining 2007_Annual_Report
187
Newmont... a new day dawning. 2007 ANNUAL REPORT
-
Upload
finance37 -
Category
Economy & Finance
-
view
1.066 -
download
0
Transcript of newmont mining 2007_Annual_Report

Newmont...a new day
dawning.
2007 ANNUAL REPORT

Letter to Shareholders
Board of Directors
Corporate Officers
5-Year Shareholder Return
1
6
7
8
Contents
Twin Creeks, Nevada
Cautionary Statement: This report contains “forward-looking statements” within the meaning of Section 27A of the Securities Act of 1933, as amended, and Section 21E of the Securities Exchange Act of 1934, as amended, that are intended to be covered by the safe harbor created by such sections. Such forward-looking statements include, without limitation, (i) estimates of future gold and copper production and sales; (ii) estimates of future costs applicable to sales and the componentsthereof; (iii) estimates of future capital expenditures and project costs; (iv) estimates regarding timing of future development, construction or production activities; (v) statements regarding future exploration results and reserves; and (vi) statements regarding potential cost savings, productivity, operating performance, cost structure and competitive position. Where the Company expresses or implies an expectation or belief as to future events or results,such expectation or belief is expressed in good faith and believed to have a reasonable basis. However, forward-lookingstatements are subject to risks, uncertainties and other factors, which could cause actual results to differ materially from future results expressed, projected or implied by such forward-looking statements. Such risks include, but are not limited to, gold and other metals price volatility, currency fluctuations, increased production costs and variances in ore grade or recovery rates from those assumed in mining plans, political and operational risks in the countries inwhich we operate, and governmental regulation and judicial outcomes. For a more detailed discussion of such risks andother factors, see the Company’s 2007 Annual Report on Form 10-K, which is on file with the Securities and ExchangeCommission, as well as the Company’s other SEC filings. The Company does not undertake any obligation to releasepublicly revisions to any “forward-looking statement,” to reflect events or circumstances after the date of this newsrelease, or to reflect the occurrence of unanticipated events, except as may be required under applicable securities laws.
Front cover photo: Hope Bay, Canada

2007 ANNUAL REPORT 1
was a year of significant change at Newmont as the management team began to re-orient the company and its
strategy to build sustained value for our shareholders. In 2007, we identified and implemented initiatives to focus Newmont on its core gold business, expand our growth and exploration opportunities, unlock value embedded in our capital structure and begin to reduce our costs.
2007 highlights include:
• Production of 5.3 million equity ounces of gold, in line with our original guidance
• Major investments in our business, including over $1 billion in new gold projects and cost-cutting initiatives
• Elimination of our gold hedge book, which positions Newmont as the premier unhedged gold company and improves our financial strength and flexibility
• Monetization of our royalty portfolio and other non-core assets
• Acquisition of Miramar Mining Corporation, which gives us control of a major gold deposit in Hope Bay, Canada
We were especially pleased to be selected in September as the only gold company in the prestigious Dow Jones Sustainability Index-World, which reflects the dedication of all of the members of the Newmont family to running our business in an economically, environmentally and socially sustainable way.
2007Letter to Shareholders
Richard T. O’BrienPresident & Chief Executive Officer
prep
arat
ion
2 NEWMONT
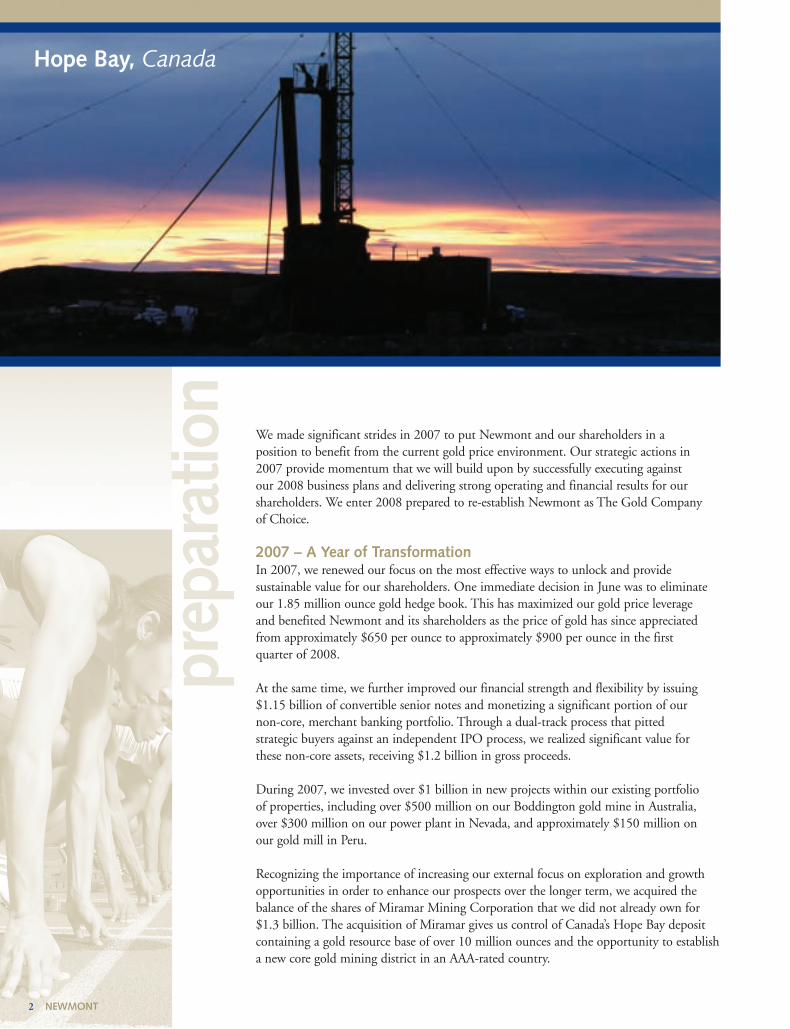
We made significant strides in 2007 to put Newmont and our shareholders in a position to benefit from the current gold price environment. Our strategic actions in 2007 provide momentum that we will build upon by successfully executing against our 2008 business plans and delivering strong operating and financial results for ourshareholders. We enter 2008 prepared to re-establish Newmont as The Gold Company of Choice.
2007 – A Year of TransformationIn 2007, we renewed our focus on the most effective ways to unlock and provide sustainable value for our shareholders. One immediate decision in June was to eliminateour 1.85 million ounce gold hedge book. This has maximized our gold price leverage and benefited Newmont and its shareholders as the price of gold has since appreciatedfrom approximately $650 per ounce to approximately $900 per ounce in the first quarter of 2008.
At the same time, we further improved our financial strength and flexibility by issuing$1.15 billion of convertible senior notes and monetizing a significant portion of our non-core, merchant banking portfolio. Through a dual-track process that pitted strategic buyers against an independent IPO process, we realized significant value for these non-core assets, receiving $1.2 billion in gross proceeds.
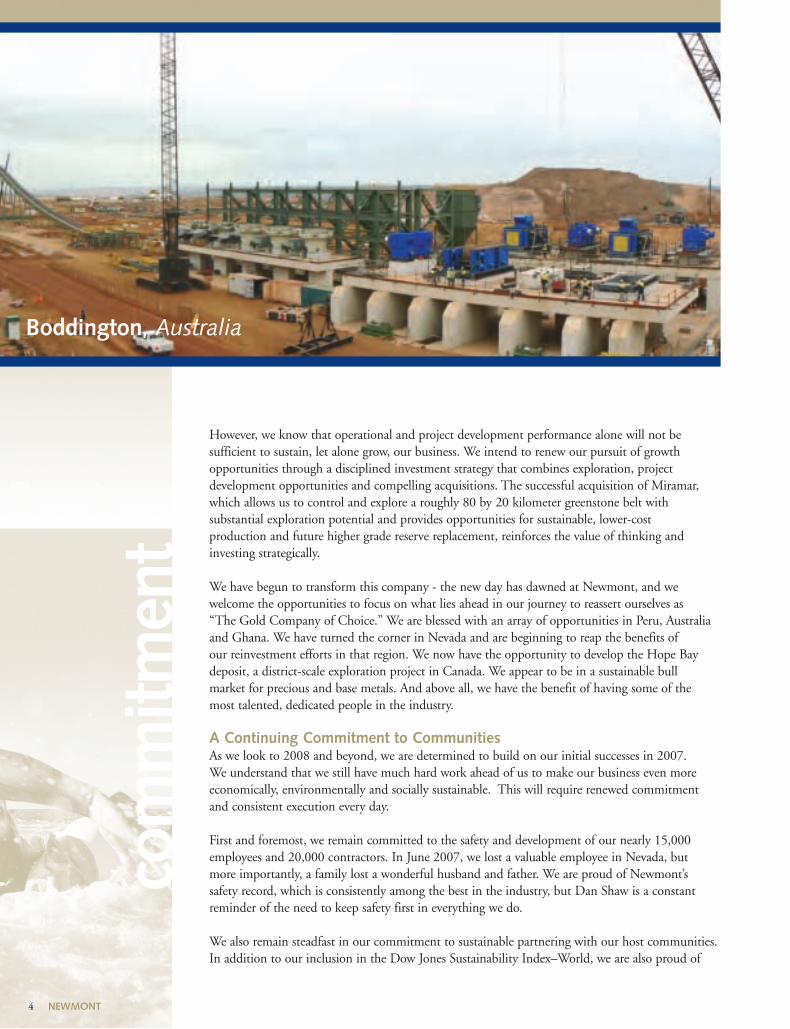
During 2007, we invested over $1 billion in new projects within our existing portfolio of properties, including over $500 million on our Boddington gold mine in Australia,over $300 million on our power plant in Nevada, and approximately $150 million on our gold mill in Peru.
Recognizing the importance of increasing our external focus on exploration and growthopportunities in order to enhance our prospects over the longer term, we acquired the balance of the shares of Miramar Mining Corporation that we did not already own for$1.3 billion. The acquisition of Miramar gives us control of Canada’s Hope Bay depositcontaining a gold resource base of over 10 million ounces and the opportunity to establisha new core gold mining district in an AAA-rated country.
Hope Bay, Canada
32887_p4.ps 2/21/08 2:53 PM Page 4
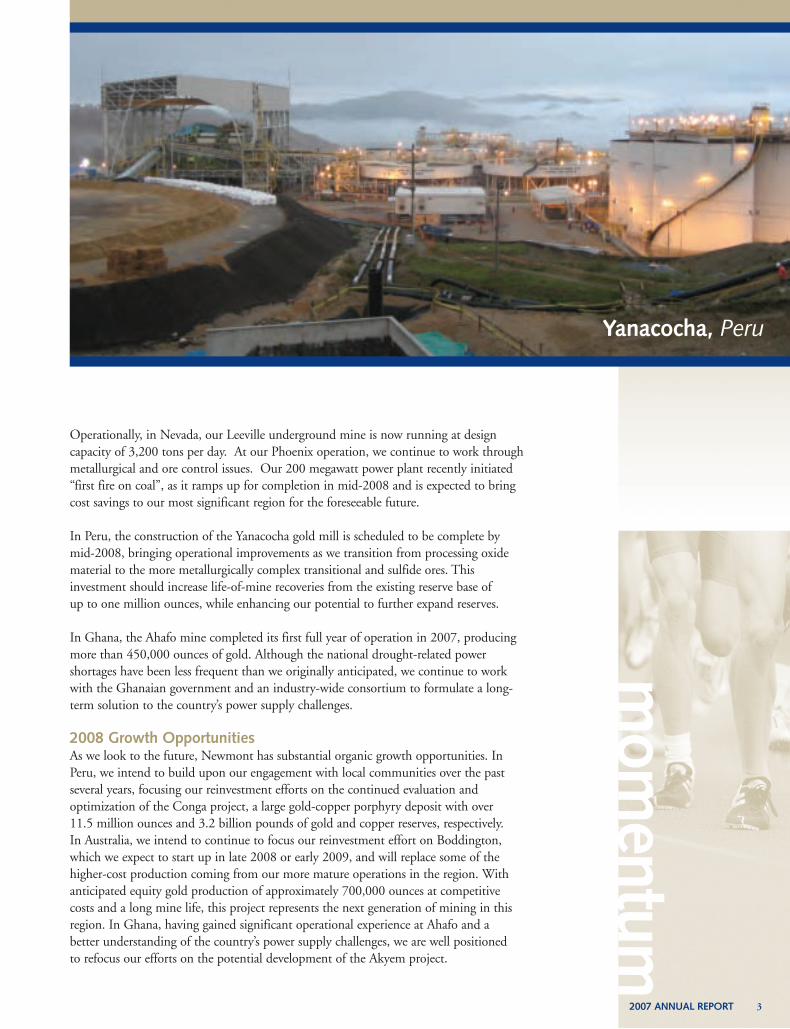
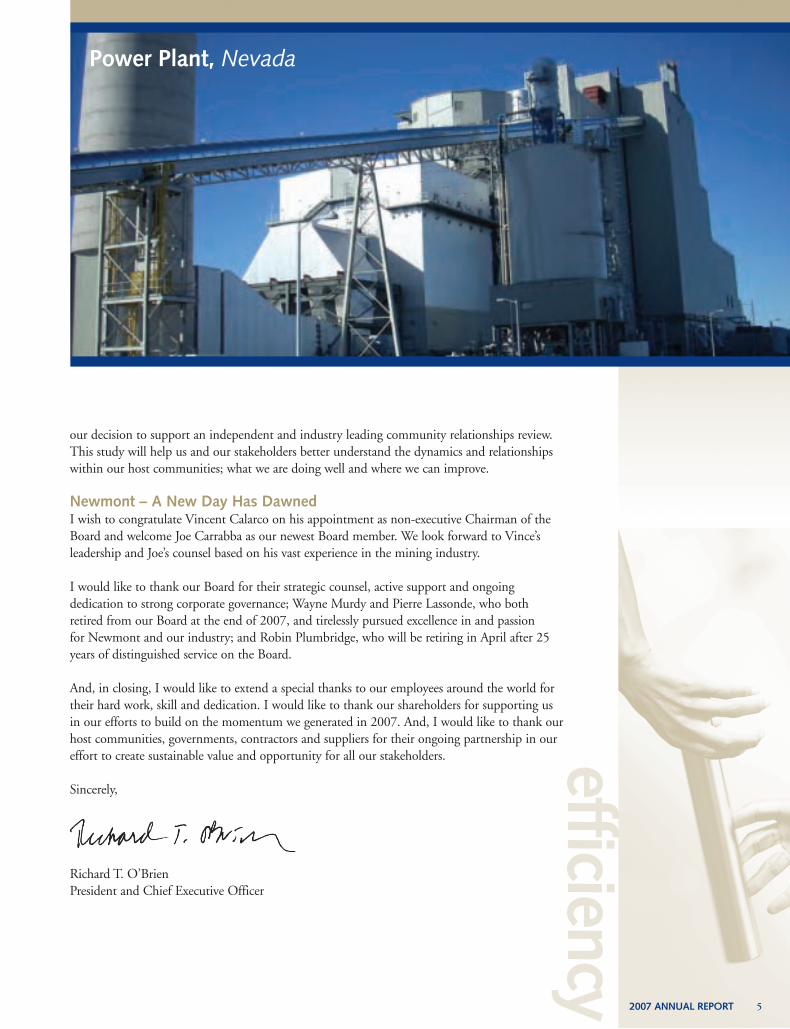
Operationally, in Nevada, our Leeville underground mine is now running at design capacity of 3,200 tons per day. At our Phoenix operation, we continue to work throughmetallurgical and ore control issues. Our 200 megawatt power plant recently initiated“first fire on coal”, as it ramps up for completion in mid-2008 and is expected to bringcost savings to our most significant region for the foreseeable future.
In Peru, the construction of the Yanacocha gold mill is scheduled to be complete by mid-2008, bringing operational improvements as we transition from processing oxidematerial to the more metallurgically complex transitional and sulfide ores. This investment should increase life-of-mine recoveries from the existing reserve base of up to one million ounces, while enhancing our potential to further expand reserves.
In Ghana, the Ahafo mine completed its first full year of operation in 2007, producingmore than 450,000 ounces of gold. Although the national drought-related power shortages have been less frequent than we originally anticipated, we continue to work with the Ghanaian government and an industry-wide consortium to formulate a long-term solution to the country’s power supply challenges.
2008 Growth OpportunitiesAs we look to the future, Newmont has substantial organic growth opportunities. In Peru, we intend to build upon our engagement with local communities over the past several years, focusing our reinvestment efforts on the continued evaluation and optimization of the Conga project, a large gold-copper porphyry deposit with over 11.5 million ounces and 3.2 billion pounds of gold and copper reserves, respectively. In Australia, we intend to continue to focus our reinvestment effort on Boddington,which we expect to start up in late 2008 or early 2009, and will replace some of the higher-cost production coming from our more mature operations in the region. Withanticipated equity gold production of approximately 700,000 ounces at competitive costs and a long mine life, this project represents the next generation of mining in thisregion. In Ghana, having gained significant operational experience at Ahafo and a better understanding of the country’s power supply challenges, we are well positioned to refocus our efforts on the potential development of the Akyem project.
mom
entum
2007 ANNUAL REPORT 3
Yanacocha, Peru
32887_p5.ps 2/21/08 2:53 PM Page 5
However, we know that operational and project development performance alone will not be sufficient to sustain, let alone grow, our business. We intend to renew our pursuit of growth opportunities through a disciplined investment strategy that combines exploration, project development opportunities and compelling acquisitions. The successful acquisition of Miramar,which allows us to control and explore a roughly 80 by 20 kilometer greenstone belt with substantial exploration potential and provides opportunities for sustainable, lower-cost production and future higher grade reserve replacement, reinforces the value of thinking andinvesting strategically.
We have begun to transform this company - the new day has dawned at Newmont, and we welcome the opportunities to focus on what lies ahead in our journey to reassert ourselves as “The Gold Company of Choice.” We are blessed with an array of opportunities in Peru, Australiaand Ghana. We have turned the corner in Nevada and are beginning to reap the benefits of our reinvestment efforts in that region. We now have the opportunity to develop the Hope Baydeposit, a district-scale exploration project in Canada. We appear to be in a sustainable bull market for precious and base metals. And above all, we have the benefit of having some of the most talented, dedicated people in the industry.
A Continuing Commitment to CommunitiesAs we look to 2008 and beyond, we are determined to build on our initial successes in 2007. We understand that we still have much hard work ahead of us to make our business even moreeconomically, environmentally and socially sustainable. This will require renewed commitmentand consistent execution every day.
First and foremost, we remain committed to the safety and development of our nearly 15,000employees and 20,000 contractors. In June 2007, we lost a valuable employee in Nevada, but more importantly, a family lost a wonderful husband and father. We are proud of Newmont’s safety record, which is consistently among the best in the industry, but Dan Shaw is a constantreminder of the need to keep safety first in everything we do.
We also remain steadfast in our commitment to sustainable partnering with our host communities.In addition to our inclusion in the Dow Jones Sustainability Index–World, we are also proud of
com
mitm
ent
4 NEWMONT
Boddington, Australia
32887_p6.ps 2/21/08 2:53 PM Page 6
our decision to support an independent and industry leading community relationships review.This study will help us and our stakeholders better understand the dynamics and relationshipswithin our host communities; what we are doing well and where we can improve.
Newmont – A New Day Has DawnedI wish to congratulate Vincent Calarco on his appointment as non-executive Chairman of theBoard and welcome Joe Carrabba as our newest Board member. We look forward to Vince’s leadership and Joe’s counsel based on his vast experience in the mining industry.
I would like to thank our Board for their strategic counsel, active support and ongoing dedication to strong corporate governance; Wayne Murdy and Pierre Lassonde, who both retired from our Board at the end of 2007, and tirelessly pursued excellence in and passion for Newmont and our industry; and Robin Plumbridge, who will be retiring in April after 25years of distinguished service on the Board.
And, in closing, I would like to extend a special thanks to our employees around the world fortheir hard work, skill and dedication. I would like to thank our shareholders for supporting us in our efforts to build on the momentum we generated in 2007. And, I would like to thank ourhost communities, governments, contractors and suppliers for their ongoing partnership in oureffort to create sustainable value and opportunity for all our stakeholders.
Sincerely,
Richard T. O’BrienPresident and Chief Executive Officer
efficiency
2007 ANNUAL REPORT 5
Power Plant, Nevada
32887_p7.ps 2/21/08 2:53 PM Page 7
exec
utio
n
6 NEWMONT
Glen A. Barton
Retired Chairman andChief Executive Officerof Caterpillar Inc.
Vincent A. Calarco
Non-Executive Chairmanof Newmont MiningCorporation. RetiredChairman, President andChief Executive Officerof CromptonCorporation (now known as ChemturaCorporation)
Joseph A. Carrabba
Chairman, President and Chief Executive Officer, Cleveland-Cliffs Inc
Noreen Doyle
Retired First VicePresident of the EuropeanBank for Reconstructionand Development
Veronica M. Hagen
Chief Executive Officerof Polymer Group, Inc.
Michael S. Hamson
Chairman of HamsonConsultants Pty Ltd andretired Joint Chairmanand Chief ExecutiveOfficer of McIntoshHamson Hoare GovettLimited (now MerrillLynch Australia)
Robert J. Miller
Principal of DutkoWorldwide and formerGovernor of the State of Nevada
Richard T. O’Brien
President and ChiefExecutive Officer ofNewmont MiningCorporation
Robin A. Plumbridge
Retired Chairman ofGold Fields of SouthAfrica Limited
John B. Prescott
Chairman of ASC PtyLtd and retired ManagingDirector of The BrokenHill ProprietaryCompany Limited
Donald C. Roth
Managing Partner of EMP Global LLC
James V. Taranik
Director of MackaySchool of Earth Sciencesand Engineering,University of Nevada
Board of Directors
32887_p8.ps 2/21/08 2:54 PM Page 8

leadership
2007 ANNUAL REPORT 7
Richard T. O’BrienPresident and Chief Executive Officer
Britt D. BanksExecutive Vice President, Legal and External Affairs
Russell BallSenior Vice President and Chief Financial Officer
Darla CaudleSenior Vice President, Human Resources
M. Stephen EndersSenior Vice President,Worldwide Exploration
Randy EngelSenior Vice President, Strategyand Corporate Development
Guy LansdownSenior Vice President, Project Development andTechnical Services
David A. BakerVice President, Environmental Affairs andSustainable Development
D. Scott BarrVice President, TechnicalStrategy and Development
Michael ByrneVice President, Safety
Nico DuursemaVice President, Project Execution
David R. FaleyVice President, Corporate Development
Stephen P. GottesfeldVice President,Communications and Public Affairs
David V. GutierrezVice President, Tax and Accounting
Brian A. HillVice President, Asia Pacific Operations
Brant HinzeVice President, North American Operations
Jeffrey R. HuspeniVice President, African Operations
Roger JohnsonVice President and Chief Accounting Officer
Thomas P. MahoneyVice President and Treasurer
Gordon R. NixonVice President, Technical Services
Blake M. RhodesVice President and Chief Counsel
Carlos Santa CruzVice President, South American Operations
John SeabergVice President, Investor Relations
Sharon E. ThomasVice President and Secretary
William M. ZischVice President, Planning
Corporate Officers
Boddington, Australia
32887_p9.ps 2/21/08 2:54 PM Page 9

$300
$250
$200
$150
$100
$50
$0Dec. 2002
Dec. 2002
$100
$100
$100
Dec. 2003
$168
$129
$144
Dec. 2004
$155
$143
$133
Dec. 2005
$188
$150
$173
Dec. 2006
$160
$173
$195
Dec. 2007
$175
$183
$241
Newmont Mining Corporation
S&P 500
PHLX Gold & Silver Index (XAU)sm
Dec. 2003 Dec. 2004 Dec. 2005 Dec. 2006 Dec. 2007
Newmont Mining CorporationS&P 500PHLX Gold & Silver Index
The following graph assumes a $100 investment, reinvestment of dividends, if any, on December 31, 2002 in each of the Company’s Common Stock, the S&P 500, and the PHLX Gold/Silver Sector (XAUsm).
Cumulative Total Return
5 -Year ShareholderReturn Comparison
8 NEWMONT
32887_p10.ps 2/21/08 2:54 PM Page 10

UNITED STATESSECURITIES AND EXCHANGE COMMISSION
Washington, D.C. 20549
Form 10-K(Mark One)È ANNUAL REPORT PURSUANT TO SECTION 13 OR 15(d) OF THE
SECURITIES EXCHANGE ACT OF 1934For the Fiscal Year Ended December 31, 2007
or
‘ TRANSITION REPORT PURSUANT TO SECTION 13 OR 15(d) OF THESECURITIES EXCHANGE ACT OF 1934
For the Transition Period From toCommission File Number 001-31240
Newmont Mining Corporation(Exact Name of Registrant as Specified in Its Charter)
Delaware 84-1611629(State or Other Jurisdiction ofIncorporation or Organization)
(I.R.S. EmployerIdentification No.)
1700 Lincoln StreetDenver, Colorado 80203
(Address of Principal Executive Offices) (Zip Code)Registrant’s telephone number, including area code (303) 863-7414
Securities registered pursuant to Section 12(b) of the Act:Title of Each Class Name of Each Exchange on Which Registered
Common Stock, $1.60 par value New York Stock ExchangeSecurities registered pursuant to Section 12(g) of the Act:
None
Indicate by check mark if the registrant is a well-known seasoned issuer, as defined in Rule 405 of the Securities Act.Yes È No ‘
Indicate by check mark if the registrant is not required to file reports pursuant to Section 13 or Section 15(d) of theExchange Act. Yes ‘ No È
Indicate by check mark whether the registrant (1) has filed all reports required to be filed by Section 13 or 15(d) of theSecurities Exchange Act of 1934 during the preceding 12 months (or for such shorter period that the registrant was required tofile such reports), and (2) has been subject to such filing requirements for the past 90 days. Yes È No ‘
Indicate by check mark if disclosure of delinquent filers pursuant to Item 405 of Regulation S-K is not contained herein,and will not be contained, to the best of registrant’s knowledge, in definitive proxy or information statements incorporated byreference in Part III of this Form 10-K or any amendment to this Form 10-K. È
Indicate by check mark whether the registrant is a large accelerated filer, an accelerated filer, a non-accelerated filer, or asmaller reporting company. See definition of “accelerated filer”, “large accelerated filer” and “smaller reporting company” inRule 12b-2 of the Exchange Act.
(Check one): Large accelerated filer È Accelerated filer ‘ Non-accelerated filer ‘ Smaller reporting company ‘
Indicate by check mark whether the registrant is a shell company (as defined in Rule 12b-2 of the ExchangeAct). Yes ‘ No È
As of June 29, 2007, the aggregate market value of the registrant’s voting and non-voting common equity held bynon-affiliates of the registrant was $17,524,404,968 based on the closing sale price as reported on the New York StockExchange. There were 435,838,958 shares of common stock outstanding (and 17,449,759 exchangeable shares exchangeableinto Newmont Mining Corporation common stock on a one-for-one basis) on February 14, 2008.
DOCUMENTS INCORPORATED BY REFERENCEPortions of Registrant’s definitive Proxy Statement submitted to the Registrant’s stockholders in connection with our
2008 Annual Stockholders Meeting to be held on April 23, 2008, are incorporated by reference into Part III of this report.

TABLE OF CONTENTS
Page
PART IITEM 1. BUSINESS . . . . . . . . . . . . . . . . . . . . . . . . . . . . . . . . . . . . . . . . . . . . . . . . . . . . . . . . . . . . . . . . . . 1
Introduction . . . . . . . . . . . . . . . . . . . . . . . . . . . . . . . . . . . . . . . . . . . . . . . . . . . . . . . . . . . . . . . . . 1Segment Information, Export Sales, etc. . . . . . . . . . . . . . . . . . . . . . . . . . . . . . . . . . . . . . . . . . . . 2Products . . . . . . . . . . . . . . . . . . . . . . . . . . . . . . . . . . . . . . . . . . . . . . . . . . . . . . . . . . . . . . . . . . . . 2Hedging Activities . . . . . . . . . . . . . . . . . . . . . . . . . . . . . . . . . . . . . . . . . . . . . . . . . . . . . . . . . . . . 4Exploration . . . . . . . . . . . . . . . . . . . . . . . . . . . . . . . . . . . . . . . . . . . . . . . . . . . . . . . . . . . . . . . . . . 4Licenses and Concessions . . . . . . . . . . . . . . . . . . . . . . . . . . . . . . . . . . . . . . . . . . . . . . . . . . . . . . 5Condition of Physical Assets and Insurance . . . . . . . . . . . . . . . . . . . . . . . . . . . . . . . . . . . . . . . . 6Environmental Matters . . . . . . . . . . . . . . . . . . . . . . . . . . . . . . . . . . . . . . . . . . . . . . . . . . . . . . . . . 6Employees . . . . . . . . . . . . . . . . . . . . . . . . . . . . . . . . . . . . . . . . . . . . . . . . . . . . . . . . . . . . . . . . . . 7Forward-Looking Statements . . . . . . . . . . . . . . . . . . . . . . . . . . . . . . . . . . . . . . . . . . . . . . . . . . . . 7Available Information . . . . . . . . . . . . . . . . . . . . . . . . . . . . . . . . . . . . . . . . . . . . . . . . . . . . . . . . . 8
ITEM 1A. RISK FACTORS . . . . . . . . . . . . . . . . . . . . . . . . . . . . . . . . . . . . . . . . . . . . . . . . . . . . . . . . . . . . . 9
Risks Related to the Mining Industry Generally . . . . . . . . . . . . . . . . . . . . . . . . . . . . . . . . . . . . . 9Risks Related to Newmont . . . . . . . . . . . . . . . . . . . . . . . . . . . . . . . . . . . . . . . . . . . . . . . . . . . . . . 11
ITEM 2. PROPERTIES . . . . . . . . . . . . . . . . . . . . . . . . . . . . . . . . . . . . . . . . . . . . . . . . . . . . . . . . . . . . . . . 17
Gold and Copper Processing Methods . . . . . . . . . . . . . . . . . . . . . . . . . . . . . . . . . . . . . . . . . . . . . 17Production Properties . . . . . . . . . . . . . . . . . . . . . . . . . . . . . . . . . . . . . . . . . . . . . . . . . . . . . . . . . . 18Operating Statistics . . . . . . . . . . . . . . . . . . . . . . . . . . . . . . . . . . . . . . . . . . . . . . . . . . . . . . . . . . . 24Proven and Probable Equity Reserves . . . . . . . . . . . . . . . . . . . . . . . . . . . . . . . . . . . . . . . . . . . . . 26
ITEM 3. LEGAL PROCEEDINGS . . . . . . . . . . . . . . . . . . . . . . . . . . . . . . . . . . . . . . . . . . . . . . . . . . . . . . 33
ITEM 4. SUBMISSION OF MATTERS TO A VOTE OF SECURITY HOLDERS . . . . . . . . . . . . . . . . 33
ITEM 4A. EXECUTIVE OFFICERS OF THE REGISTRANT . . . . . . . . . . . . . . . . . . . . . . . . . . . . . . . . . . 33
PART II
ITEM 5. MARKET FOR REGISTRANT’S COMMON EQUITY, RELATED STOCKHOLDERMATTERS AND ISSUER PURCHASE OF EQUITY SECURITIES . . . . . . . . . . . . . . . . . . . . 35
ITEM 6. SELECTED FINANCIAL DATA . . . . . . . . . . . . . . . . . . . . . . . . . . . . . . . . . . . . . . . . . . . . . . . . 36
ITEM 7. MANAGEMENT’S DISCUSSION AND ANALYSIS OF CONSOLIDATED FINANCIALCONDITION AND RESULTS OF OPERATIONS . . . . . . . . . . . . . . . . . . . . . . . . . . . . . . . . . . 37
Overview . . . . . . . . . . . . . . . . . . . . . . . . . . . . . . . . . . . . . . . . . . . . . . . . . . . . . . . . . . . . . . . . . . . 37Accounting Developments . . . . . . . . . . . . . . . . . . . . . . . . . . . . . . . . . . . . . . . . . . . . . . . . . . . . . . 40Critical Accounting Policies . . . . . . . . . . . . . . . . . . . . . . . . . . . . . . . . . . . . . . . . . . . . . . . . . . . . 42Consolidated Financial Results . . . . . . . . . . . . . . . . . . . . . . . . . . . . . . . . . . . . . . . . . . . . . . . . . . 47Results of Consolidated Operations . . . . . . . . . . . . . . . . . . . . . . . . . . . . . . . . . . . . . . . . . . . . . . . 55Recently Issued Accounting Pronouncements and Developments . . . . . . . . . . . . . . . . . . . . . . . 65Liquidity and Capital Resources . . . . . . . . . . . . . . . . . . . . . . . . . . . . . . . . . . . . . . . . . . . . . . . . . 66Environmental . . . . . . . . . . . . . . . . . . . . . . . . . . . . . . . . . . . . . . . . . . . . . . . . . . . . . . . . . . . . . . . 73Forward-Looking Statements . . . . . . . . . . . . . . . . . . . . . . . . . . . . . . . . . . . . . . . . . . . . . . . . . . . . 74
ITEM 7A. QUANTITATIVE AND QUALITATIVE DISCLOSURES ABOUT MARKET RISK . . . . . . 75
Metal Price . . . . . . . . . . . . . . . . . . . . . . . . . . . . . . . . . . . . . . . . . . . . . . . . . . . . . . . . . . . . . . . . . . 75Foreign Currency . . . . . . . . . . . . . . . . . . . . . . . . . . . . . . . . . . . . . . . . . . . . . . . . . . . . . . . . . . . . . 75Hedging . . . . . . . . . . . . . . . . . . . . . . . . . . . . . . . . . . . . . . . . . . . . . . . . . . . . . . . . . . . . . . . . . . . . 75Fixed and Variable Rate Debt . . . . . . . . . . . . . . . . . . . . . . . . . . . . . . . . . . . . . . . . . . . . . . . . . . . 78Pension and Other Benefit Plans . . . . . . . . . . . . . . . . . . . . . . . . . . . . . . . . . . . . . . . . . . . . . . . . .
i

Page
ITEM 8. FINANCIAL STATEMENTS AND SUPPLEMENTARY DATA . . . . . . . . . . . . . . . . . . . . . . 79
ITEM 9. CHANGES IN AND DISAGREEMENTS WITH ACCOUNTANTS ON ACCOUNTINGAND FINANCIAL DISCLOSURE . . . . . . . . . . . . . . . . . . . . . . . . . . . . . . . . . . . . . . . . . . . . . . . 159
ITEM 9A. CONTROLS AND PROCEDURES . . . . . . . . . . . . . . . . . . . . . . . . . . . . . . . . . . . . . . . . . . . . . . 159
ITEM 9B. OTHER INFORMATION . . . . . . . . . . . . . . . . . . . . . . . . . . . . . . . . . . . . . . . . . . . . . . . . . . . . . . 159
PART III
ITEM 10. DIRECTORS AND EXECUTIVE OFFICERS OF THE REGISTRANT . . . . . . . . . . . . . . . . . 160
ITEM 11. EXECUTIVE COMPENSATION . . . . . . . . . . . . . . . . . . . . . . . . . . . . . . . . . . . . . . . . . . . . . . . . 160
ITEM 12. SECURITY OWNERSHIP OF CERTAIN BENEFICIAL OWNERS AND MANAGEMENTAND RELATED STOCKHOLDER MATTERS . . . . . . . . . . . . . . . . . . . . . . . . . . . . . . . . . . . . 160
ITEM 13. CERTAIN RELATIONSHIPS AND RELATED TRANSACTIONS . . . . . . . . . . . . . . . . . . . . 161
ITEM 14. PRINCIPAL ACCOUNTANT FEES AND SERVICES . . . . . . . . . . . . . . . . . . . . . . . . . . . . . . . 161
PART IV
ITEM 15. EXHIBITS AND FINANCIAL STATEMENT SCHEDULES . . . . . . . . . . . . . . . . . . . . . . . . . 162
SIGNATURES . . . . . . . . . . . . . . . . . . . . . . . . . . . . . . . . . . . . . . . . . . . . . . . . . . . . . . . . . . . . . . . . . . . . . . . . . S-1
EXHIBIT INDEX . . . . . . . . . . . . . . . . . . . . . . . . . . . . . . . . . . . . . . . . . . . . . . . . . . . . . . . . . . . . . . . . . . . . . . . E-1
ii

This document (including information incorporated herein by reference) contains “forward-lookingstatements” within the meaning of Section 27A of the Securities Act of 1933 and Section 21E of the SecuritiesExchange Act of 1934, which involve a degree of risk and uncertainty due to various factors affecting NewmontMining Corporation and our affiliates and subsidiaries. For a discussion of some of these factors, see thediscussion in Item 1A, Risk Factors, of this report.
PART I
ITEM 1. BUSINESS (dollars in millions except per share, per ounce and per pound amounts)
Introduction
Newmont Mining Corporation is primarily a gold producer with significant assets or operations in theUnited States, Australia, Peru, Indonesia, Ghana, Canada, Bolivia, New Zealand and Mexico. As ofDecember 31, 2007, Newmont had proven and probable gold reserves of 86.5 million equity ounces and anaggregate land position of approximately 42,680 square miles (110,550 square kilometers). Newmont is alsoengaged in the production of copper, principally through its Batu Hijau operation in Indonesia. Newmont MiningCorporation’s original predecessor corporation was incorporated in 1921 under the laws of Delaware.
Newmont’s corporate headquarters are in Denver, Colorado, USA. In this report, “Newmont,” the“Company,” “our” and “we” refer to Newmont Mining Corporation and/or our affiliates and subsidiaries. Alldollars are in millions, except per share, per ounce, and per pound amounts.
Newmont’s revenues and long-lived assets are geographically distributed as follows:
Revenues Long-Lived Assets
2007 2006 2005 2007 2006 2005
United States . . . . . . . . . . . . . . . . . . . . . . . . . . . . . . . . . . . 29% 29% 23% 39% 54% 55%Peru . . . . . . . . . . . . . . . . . . . . . . . . . . . . . . . . . . . . . . . . . . 20% 32% 35% 11% 10% 10%Australia/New Zealand . . . . . . . . . . . . . . . . . . . . . . . . . . . 15% 15% 15% 12% 8% 7%Indonesia . . . . . . . . . . . . . . . . . . . . . . . . . . . . . . . . . . . . . . 28% 19% 23% 15% 15% 17%Ghana . . . . . . . . . . . . . . . . . . . . . . . . . . . . . . . . . . . . . . . . 6% 3% — 8% 8% 6%Other(1) . . . . . . . . . . . . . . . . . . . . . . . . . . . . . . . . . . . . . . . 2% 2% 4% 15% 5% 5%
(1) Other includes Canada, Mexico and Bolivia.
During June 2007, Newmont’s Board of Directors approved a plan to cease Merchant Banking activities.Merchant Banking previously provided advisory services to assist in managing the Company’s portfolio ofoperating and property interests. Merchant Banking was also engaged in developing value optimization strategiesfor operating and non-operating assets, business development activities, merger and acquisition analysis andnegotiations, monetizing inactive exploration properties, capitalizing on proprietary technology and know-howand acting as an internal resource for other corporate groups to improve and maximize business outcomes. As aresult of the Board’s approval of management’s plan to cease Merchant Banking activities, the Companyrecorded a $1,665 non-cash charge to impair the goodwill associated with the Merchant Banking Segment in thesecond quarter of 2007.
On October 9, 2007, the Company announced the proposed acquisition of Miramar Mining Corporation(“Miramar”) and offered to acquire all of the outstanding common shares of Miramar for C$6.25 in cash. As ofDecember 31, 2007, approximately 155 million common shares of Miramar had been validly deposited toNewmont’s offer. Newmont accepted and paid for such shares, representing approximately 70% of the commonshares of Miramar which, in addition to the 18 million shares previously owned by the Company, brought theCompany’s interest in Miramar to approximately 78%. Miramar is a Canadian gold company that controls the
1

Hope Bay project, a large undeveloped gold project in Nunavut, Canada. The Hope Bay project is consistent withthe Company’s strategic focus on exploration and project development and was acquired with the intention ofadding higher grade ore reserves and developing a new core gold mining district in a AAA-rated country.
In January 2008, Newmont acquired approximately 40 million additional common shares of Miramar at aprice of C$6.25 per common share, bringing its interest in Miramar to 96%. This successfully completed theoffer to acquire all of the outstanding common shares of Miramar. Newmont has mailed a notice of compulsoryacquisition pursuant to the Business Corporations Act (British Columbia) to acquire all the remaining commonshares of Miramar that were not acquired pursuant to the offer. As a result of the acquisition, Newmont owns theHope Bay gold mining project in the Nunavut Territory of Canada.
On December 20, 2007, Newmont sold its portfolio of royalty assets and certain other non-core investmentsto the new Franco-Nevada Corporation in a cash transaction for $1,187, resulting in a $905 pre-tax gain.
For additional information, see Item 7, Management’s Discussion and Analysis of Consolidated FinancialCondition and Results of Operations.
Segment Information, Export Sales, etc.
We have operating segments of Nevada, Yanacocha in Peru, Australia/New Zealand, Batu Hijau inIndonesia, Africa and Other Operations comprised of smaller operations in Bolivia, Mexico and Canada. We alsohave an Exploration Segment. See Note 30 to the Consolidated Financial Statements for information relating toour business segments, our domestic and export sales, and our non-dependence on a limited number ofcustomers.
Products
Gold
General. We had consolidated sales of 6.2 million ounces of gold (5.3 million equity ounces) in 2007,7.2 million ounces of gold (5.9 million equity ounces) in 2006 and 8.2 million ounces (6.5 million equity ounces)in 2005. For 2007, 2006 and 2005, 78%, 86% and 84%, respectively, of our net revenues were attributable togold sales. Of our 2007 gold sales, approximately 38% came from Nevada, 25% from Yanacocha, 19% fromAustralia/New Zealand, 8% from Batu Hijau and 7% from Africa. References in this report to “equity ounces” or“equity pounds” mean that portion of gold or copper produced, sold or included in proven and probable reservesthat is attributable to our ownership or economic interest.
Most of our revenue comes from the sale of refined gold in the international market. The end product at ourgold operations, however, is generally doré bars. Doré is an alloy consisting mostly of gold but also containingsilver, copper and other metals. Doré is sent to refiners to produce bullion that meets the required marketstandard of 99.95% pure gold. Under the terms of our refining agreements, the doré bars are refined for a fee, andour share of the refined gold and the separately-recovered silver are credited to our account or delivered tobuyers. Gold sold from Batu Hijau, and a portion of the gold from Phoenix in Nevada, is contained in aconcentrate.
Gold Uses. Gold has two main categories of use: fabrication and investment. Fabricated gold has a varietyof end uses, including jewelry, electronics, dentistry, industrial and decorative uses, medals, medallions andofficial coins. Gold investors buy gold bullion, official coins and jewelry.
Gold Supply. The supply of gold consists of a combination of current production from mining and the draw-down of existing stocks of gold held by governments, financial institutions, industrial organizations and privateindividuals. In recent years, current mine production has accounted for 60% to 70% of the annual supply of gold.
2
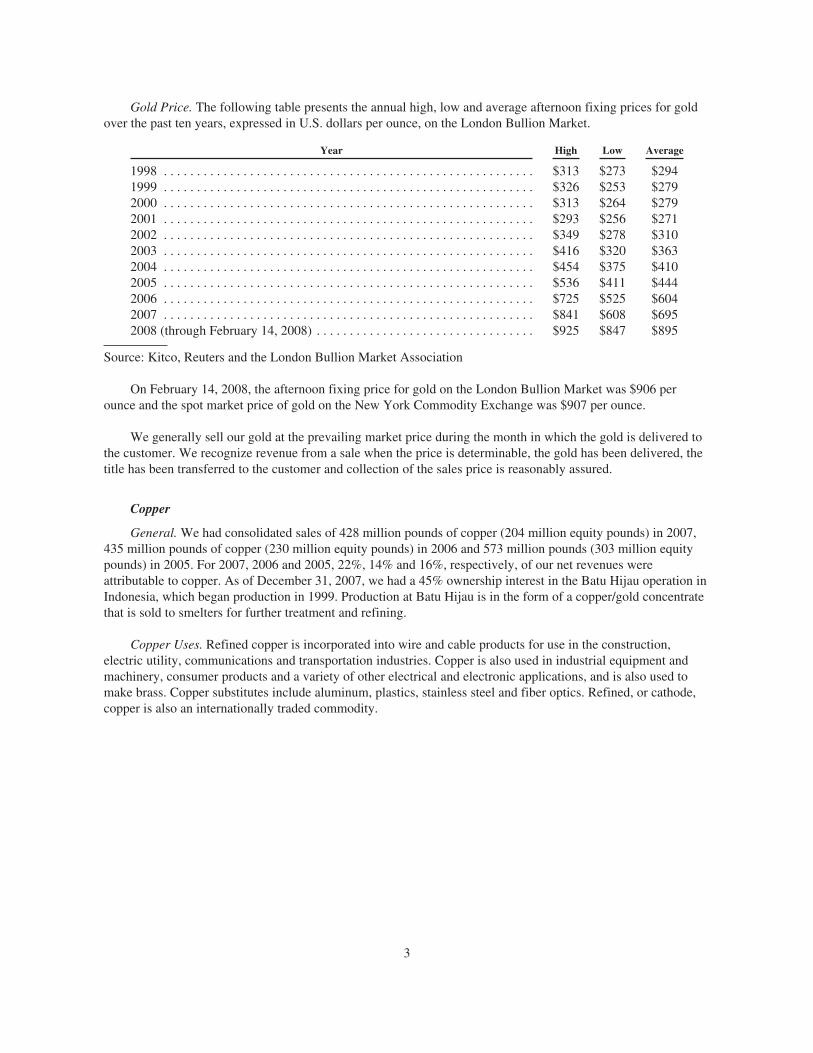
Gold Price. The following table presents the annual high, low and average afternoon fixing prices for goldover the past ten years, expressed in U.S. dollars per ounce, on the London Bullion Market.
Year High Low Average
1998 . . . . . . . . . . . . . . . . . . . . . . . . . . . . . . . . . . . . . . . . . . . . . . . . . . . . . . . . $313 $273 $2941999 . . . . . . . . . . . . . . . . . . . . . . . . . . . . . . . . . . . . . . . . . . . . . . . . . . . . . . . . $326 $253 $2792000 . . . . . . . . . . . . . . . . . . . . . . . . . . . . . . . . . . . . . . . . . . . . . . . . . . . . . . . . $313 $264 $2792001 . . . . . . . . . . . . . . . . . . . . . . . . . . . . . . . . . . . . . . . . . . . . . . . . . . . . . . . . $293 $256 $2712002 . . . . . . . . . . . . . . . . . . . . . . . . . . . . . . . . . . . . . . . . . . . . . . . . . . . . . . . . $349 $278 $3102003 . . . . . . . . . . . . . . . . . . . . . . . . . . . . . . . . . . . . . . . . . . . . . . . . . . . . . . . . $416 $320 $3632004 . . . . . . . . . . . . . . . . . . . . . . . . . . . . . . . . . . . . . . . . . . . . . . . . . . . . . . . . $454 $375 $4102005 . . . . . . . . . . . . . . . . . . . . . . . . . . . . . . . . . . . . . . . . . . . . . . . . . . . . . . . . $536 $411 $4442006 . . . . . . . . . . . . . . . . . . . . . . . . . . . . . . . . . . . . . . . . . . . . . . . . . . . . . . . . $725 $525 $6042007 . . . . . . . . . . . . . . . . . . . . . . . . . . . . . . . . . . . . . . . . . . . . . . . . . . . . . . . . $841 $608 $6952008 (through February 14, 2008) . . . . . . . . . . . . . . . . . . . . . . . . . . . . . . . . . $925 $847 $895
Source: Kitco, Reuters and the London Bullion Market Association
On February 14, 2008, the afternoon fixing price for gold on the London Bullion Market was $906 perounce and the spot market price of gold on the New York Commodity Exchange was $907 per ounce.
We generally sell our gold at the prevailing market price during the month in which the gold is delivered tothe customer. We recognize revenue from a sale when the price is determinable, the gold has been delivered, thetitle has been transferred to the customer and collection of the sales price is reasonably assured.
Copper
General. We had consolidated sales of 428 million pounds of copper (204 million equity pounds) in 2007,435 million pounds of copper (230 million equity pounds) in 2006 and 573 million pounds (303 million equitypounds) in 2005. For 2007, 2006 and 2005, 22%, 14% and 16%, respectively, of our net revenues wereattributable to copper. As of December 31, 2007, we had a 45% ownership interest in the Batu Hijau operation inIndonesia, which began production in 1999. Production at Batu Hijau is in the form of a copper/gold concentratethat is sold to smelters for further treatment and refining.
Copper Uses. Refined copper is incorporated into wire and cable products for use in the construction,electric utility, communications and transportation industries. Copper is also used in industrial equipment andmachinery, consumer products and a variety of other electrical and electronic applications, and is also used tomake brass. Copper substitutes include aluminum, plastics, stainless steel and fiber optics. Refined, or cathode,copper is also an internationally traded commodity.
3

Copper Supply. The supply of copper consists of a combination of current production from mining andrecycled scrap material. Copper supply has not kept pace with increasing demand in recent years, resulting inprice increases reflected in the chart below.
Copper Price. The price of copper is quoted on the London Metal Exchange in terms of dollars per metricton of high grade copper. The following table presents the dollar per pound equivalent of the annual high, lowand average prices of high grade copper on the London Metal Exchange over the past ten years.
Year High Low Average
1998 . . . . . . . . . . . . . . . . . . . . . . . . . . . . . . . . . . . . . . . . . . . . . . . $0.85 $0.65 $0.751999 . . . . . . . . . . . . . . . . . . . . . . . . . . . . . . . . . . . . . . . . . . . . . . . $0.84 $0.61 $0.712000 . . . . . . . . . . . . . . . . . . . . . . . . . . . . . . . . . . . . . . . . . . . . . . . $0.91 $0.73 $0.822001 . . . . . . . . . . . . . . . . . . . . . . . . . . . . . . . . . . . . . . . . . . . . . . . $0.83 $0.60 $0.722002 . . . . . . . . . . . . . . . . . . . . . . . . . . . . . . . . . . . . . . . . . . . . . . . $0.77 $0.64 $0.712003 . . . . . . . . . . . . . . . . . . . . . . . . . . . . . . . . . . . . . . . . . . . . . . . $1.05 $0.70 $0.812004 . . . . . . . . . . . . . . . . . . . . . . . . . . . . . . . . . . . . . . . . . . . . . . . $1.49 $1.06 $1.302005 . . . . . . . . . . . . . . . . . . . . . . . . . . . . . . . . . . . . . . . . . . . . . . . $2.11 $1.39 $1.672006 . . . . . . . . . . . . . . . . . . . . . . . . . . . . . . . . . . . . . . . . . . . . . . . $3.99 $2.06 $3.052007 . . . . . . . . . . . . . . . . . . . . . . . . . . . . . . . . . . . . . . . . . . . . . . . $3.77 $2.37 $3.242008 (through February 14, 2008) . . . . . . . . . . . . . . . . . . . . . . . . $3.55 $3.02 $3.27
Source: London Metal Exchange
On February 14, 2008, the closing price of high grade copper was $3.53 per pound on the London MetalExchange. Our ability to sell copper at market prices is limited in some cases by hedging activities, moreparticularly described in Item 7A, Quantitative and Qualitative Disclosures about Market Risk, and Note 14 tothe Consolidated Financial Statements.
Hedging Activities
We generally avoid gold hedging. Our philosophy is to provide shareholders with leverage to changes in thegold price by selling our gold production at market prices. We have, however, historically entered into derivativecontracts to protect the selling price for certain anticipated gold and copper production and to manage risksassociated with commodities, interest rates and foreign currencies.
For additional information, see Hedging in Item 7A, Quantitative and Qualitative Disclosures about MarketRisk, and Note 14 to the Consolidated Financial Statements.
Exploration
Our exploration group is responsible for all activities, regardless of location, associated with our efforts todiscover new mineralized material and, if successful, advance such mineralized material into proven andprobable reserves. We conduct exploration in areas surrounding our existing mines for the purpose of locatingadditional deposits and determining mine geology, and in other prospective gold regions globally. Near-mineexploration can result in the discovery of new gold mineralization, which will receive the economic benefit ofexisting operating, processing, and administrative infrastructures. Greenfields exploration is where a discovery ofnew gold mineralization would likely require the investment of new capital to build a separate, stand-aloneoperation away from any of our existing infrastructure. Our exploration group employs state-of-the-arttechnology, including airborne geophysical data acquisition systems, satellite location devices and field-portableimaging systems, as well as geochemical and geological prospecting methods, to identify prospective targets. Weexpensed $177 in 2007, $166 in 2006 and $143 in 2005 on Exploration.
4

As of December 31, 2007, we had proven and probable gold reserves of 86.5 million equity ounces. Weadded 0.8 million net equity ounces to proven and probable reserves, with 8.2 million equity ounces of depletionand divestitures during 2007. A reconciliation of the changes in proven and probable reserves during the pastthree years is as follows:
2007 2006 2005
(millions of equity ounces)
Opening balance . . . . . . . . . . . . . . . . . . . . . . . . . . . . . . . . . . . . . . . . . . . . . . . . . . . . . . . . . 93.9 93.2 92.4Greenfield additions(1) . . . . . . . . . . . . . . . . . . . . . . . . . . . . . . . . . . . . . . . . . . . . . . . . 1.6 1.7 5.5Near-mine additions . . . . . . . . . . . . . . . . . . . . . . . . . . . . . . . . . . . . . . . . . . . . . . . . . . (0.8) 4.2 3.9
Total additions(2) . . . . . . . . . . . . . . . . . . . . . . . . . . . . . . . . . . . . . . . . . . . . . . . . . . . . . 0.8 5.9 9.4Acquisitions . . . . . . . . . . . . . . . . . . . . . . . . . . . . . . . . . . . . . . . . . . . . . . . . . . . . . . . . — 3.7 —Depletion . . . . . . . . . . . . . . . . . . . . . . . . . . . . . . . . . . . . . . . . . . . . . . . . . . . . . . . . . . (7.3) (7.4) (8.3)Other divestments(3) . . . . . . . . . . . . . . . . . . . . . . . . . . . . . . . . . . . . . . . . . . . . . . . . . . (0.9) (1.5) (0.3)
Closing balance . . . . . . . . . . . . . . . . . . . . . . . . . . . . . . . . . . . . . . . . . . . . . . . . . . . . . . . . . 86.5 93.9 93.2
(1) Additions attributable to the Exploration Segment.(2) The impact of the change in gold price assumption on reserve additions was 0.7, 3.1 and 2.6 million equity
ounces in 2007, 2006 and 2005, respectively.(3) In December 2007, the Pajingo operation was sold. In May 2007, Newmont’s economic interest in Batu
Hijau was reduced from 52.875% to 45%. In August 2006, the government of Uzbekistan appropriated theCompany’s 50% interest in the Zarafshan-Newmont Joint Venture.
In Nevada, reserves decreased by depletion of 3.7 million equity ounces, resulting in total proven andprobable reserves of 29.4 million equity ounces as of December 31, 2007.
In Peru, reserves decreased to 14.2 million equity ounces, after additions of 0.3 million equity ounces anddepletion of 1.2 million equity ounces.
In Australia/New Zealand, reserves increased to 19.4 million equity ounces after depletion of 1.5 millionequity ounces, the sale of the Pajingo assets during 2007, and 2.3 million equity ounces of reserve additions,primarily from Boddington and Jundee.
At Batu Hijau, we depleted 0.3 billion equity pounds of copper and 0.3 million equity ounces of gold, andadded 0.4 billion equity pounds of copper and 0.3 million equity ounces of gold due to increased metal prices.Additions were partially offset by higher costs and revised geotechnical assumptions. On May 25, 2007, theminority owner of Batu Hijau fully repaid a loan from a Newmont subsidiary. As a result of the loan repayment,our economic interest was reduced from 52.875% to 45%. We reported proven and probable reserves of 4.1billion equity pounds of copper and 4.2 million equity ounces of gold as of December 31, 2007.
At Ahafo in Ghana, proven and probable reserves decreased by 2.4 million equity ounces as a result ofincreased cost impacts and by 0.5 million equity ounces due to depletion. As of December 31, 2007, we reportedreserves of 9.7 million equity ounces at Ahafo and 7.7 million equity ounces at Akyem.
For additional information, see Item 2, Properties, Proven and Probable Reserves.
Licenses and Concessions
Other than operating licenses for our mining and processing facilities, there are no third party patents,licenses or franchises material to our business. In many countries, however, we conduct our mining andexploration activities pursuant to concessions granted by, or under contract with, the host government. Thesecountries include, among others, Australia, Bolivia, Canada, Ghana, Indonesia, Peru, New Zealand and Mexico.
5
The concessions and contracts are subject to the political risks associated with foreign operations. See Item 1A,Risk Factors, Risks Related to Newmont Operations, below. For a more detailed description of our IndonesianContract of Work, see Item 2, Properties, below.
Condition of Physical Assets and Insurance
Our business is capital intensive, requiring ongoing capital investment for the replacement, modernizationor expansion of equipment and facilities. For more information, see Item 7, Management’s Discussion andAnalysis of Consolidated Financial Condition and Results of Operations, Liquidity and Capital Resources,below.
We maintain insurance policies against property loss and business interruption and insure against risks thatare typical in the operation of our business, in amounts that we believe to be reasonable. Such insurance,however, contains exclusions and limitations on coverage, particularly with respect to environmental liability andpolitical risk. There can be no assurance that claims would be paid under such insurance policies in connectionwith a particular event. See Item 1A, Risk Factors, Risks Related to Newmont Operations, below.
Environmental Matters
Our United States mining and exploration activities are subject to various federal and state laws andregulations governing the protection of the environment, including the Clean Air Act; the Clean Water Act; theComprehensive Environmental Response, Compensation and Liability Act; the Emergency Planning andCommunity Right-to-Know Act; the Endangered Species Act; the Federal Land Policy and Management Act; theNational Environmental Policy Act; the Resource Conservation and Recovery Act; and related state laws. Theselaws and regulations are continually changing and are generally becoming more restrictive. Our activities outsidethe United States are also subject to governmental regulations for the protection of the environment.
We conduct our operations so as to protect public health and the environment and believe our operations arein compliance with applicable laws and regulations in all material respects. Each operating mine has areclamation plan in place that meets all applicable legal and regulatory requirements. We have made, and expectto make in the future, expenditures to comply with such laws and regulations. We have made estimates of theamount of such expenditures, but cannot precisely predict the amount of such future expenditures. Estimatedfuture reclamation costs are based principally on legal and regulatory requirements. As of December 31, 2007,$569 was accrued for reclamation costs relating to currently developed and producing properties.
We are also involved in several matters concerning environmental obligations associated with former,primarily historic, mining activities. Generally, these matters concern developing and implementing remediationplans at the various sites. We believe that the related environmental obligations associated with these sites aresimilar in nature with respect to the development of remediation plans, their risk profile and the activitiesrequired to meet general environmental standards. Based upon our best estimate of our liability for these matters,$125 was accrued as of December 31, 2007 for such obligations associated with properties previously owned oroperated by us or our subsidiaries. These amounts are included in Other current liabilities and Reclamation andremediation liabilities. Depending upon the ultimate resolution of these matters, we believe that it is reasonablypossible that the liability for these matters could be as much as 61% greater or 18% lower than the amountaccrued as of December 31, 2007. The amounts accrued for these matters are reviewed periodically based uponfacts and circumstances available at the time. Changes in estimates are charged to costs and expenses in theperiod when estimates are revised.
For a discussion of the most significant reclamation and remediation activities, see Item 7, Management’sDiscussion and Analysis of Consolidated Financial Condition and Results of Operations, and Notes 24 and 32 tothe Consolidated Financial Statements, below.
6

Employees
There were approximately 15,000 people employed by Newmont as of December 31, 2007.
Forward-Looking Statements
Certain statements contained in this report (including information incorporated by reference) are “forward-looking statements” within the meaning of Section 27A of the Securities Act of 1933, as amended, andSection 21E of the Securities Exchange Act of 1934, as amended, and are intended to be covered by the safeharbor provided for under these sections. Our forward-looking statements include, without limitation:
• Statements regarding future earnings;
• Estimates of future mineral production and sales, for specific operations and on a consolidated or equitybasis;
• Estimates of future costs applicable to sales, other expenses and taxes for specific operations and on aconsolidated basis;
• Estimates of future cash flows;
• Estimates of future capital expenditures and other cash needs, for specific operations and on aconsolidated basis, and expectations as to the funding thereof;
• Estimates regarding timing of future capital expenditures, construction, production or closure activities;
• Statements as to the projected development of certain ore deposits, including estimates of developmentand other capital costs and financing plans for these deposits;
• Estimates of reserves and statements regarding future exploration results and reserve replacement andthe sensitivity of reserves to metal price changes;
• Statements regarding the availability and costs related to future borrowing, debt repayment andfinancing;
• Statements regarding modifications to hedge and derivative positions;
• Statements regarding future transactions;
• Statements regarding the impacts of changes in the legal and regulatory environment in which weoperate; and
• Estimates of future costs and other liabilities for certain environmental matters.
Where we express an expectation or belief as to future events or results, such expectation or belief isexpressed in good faith and believed to have a reasonable basis. However, our forward-looking statements aresubject to risks, uncertainties, and other factors, which could cause actual results to differ materially from futureresults expressed, projected or implied by those forward-looking statements. Such risks include, but are notlimited to: the price of gold, copper and other commodities; currency fluctuations; geological and metallurgicalassumptions; operating performance of equipment, processes and facilities; labor relations; timing of receipt ofnecessary governmental permits or approvals; domestic and foreign laws or regulations, particularly relating tothe environment and mining; domestic and international economic and political conditions; the ability ofNewmont to obtain or maintain necessary financing; and other risks and hazards associated with miningoperations. More detailed information regarding these factors is included in Item 1, Business, Item 1A, RiskFactors, and elsewhere throughout this report. Given these uncertainties, readers are cautioned not to place unduereliance on our forward-looking statements.
All subsequent written and oral forward-looking statements attributable to Newmont or to persons acting onits behalf are expressly qualified in their entirety by these cautionary statements. Newmont disclaims anyintention or obligation to update publicly any forward-looking statements, whether as a result of newinformation, future events or otherwise, except as may be required under applicable securities laws.
7
Available Information
Newmont maintains an internet web site at www.newmont.com. Newmont makes available, free of charge,through the Investor Information section of the web site, its Annual Reports on Form 10-K, Quarterly Reports onForm 10-Q, Current Reports on Form 8-K, Section 16 filings and all amendments to those reports, as soon asreasonably practicable after such material is electronically filed with the Securities and Exchange Commission.Newmont’s Corporate Governance Guidelines, the charters of key committees of its Board of Directors and itsCode of Business Ethics and Conduct are also available on the web site. Any of the foregoing information isavailable in print to any stockholder who requests it by contacting Newmont’s Investor Relations Department.
The Company filed with the New York Stock Exchange (“NYSE”) on May 24, 2007, the annualcertification by its Chief Executive Officer, certifying that, as of the date of the certification, he was not aware ofany violation by the Company of the NYSE’s corporate governance listing standards, as required bySection 303A.12(a) of the NYSE Listed Company Manual. The Company has filed the required certificationsunder Section 302 of the Sarbanes-Oxley Act of 2002 regarding the quality of its public disclosures asExhibits 31.1 and 31.2 to this report.
8
ITEM 1A. RISK FACTORS (dollars in millions except per share, per ounce and per pound amounts)
Every investor or potential investor in Newmont should carefully consider the following risks, which havebeen separated into two groups:
• Risks related to the mining industry generally; and
• Risks related to Newmont.
Risks Related to the Mining Industry Generally
A Substantial or Extended Decline in Gold or Copper Prices Would Have a Material Adverse Effect onNewmont
Our business is dependent on the realized price of gold and copper, which are affected by numerous factorsbeyond our control. Factors tending to put downward pressure on prices include:
• Sales or leasing of gold by governments and central banks;
• U.S. dollar strength;
• Recession or reduced economic activity;
• Speculative selling;
• Decreased industrial, jewelry or investment demand;
• Increased supply from production, disinvestment and scrap;
• Sales by producers in forward and other hedging transactions; and
• Devaluing local currencies (relative to gold and copper priced in U.S. dollars) leading to lowerproduction costs and higher production in certain regions.
Any drop in the realized price of gold or copper adversely impacts our revenues, net income and cash flows,particularly in light of our philosophy of generally avoiding gold hedging. We have recorded asset write-downsin the past and may experience additional impairments as a result of low gold or copper prices in the future.
In addition, sustained low gold or copper prices can:
• Reduce revenues further through production declines due to cessation of the mining of deposits, orportions of deposits, that have become uneconomic at the then-prevailing gold or copper price;
• Reduce or eliminate the profit that we currently expect from ore stockpiles;
• Halt or delay the development of new projects;
• Reduce funds available for exploration; and
• Reduce existing reserves by removing ores from reserves that can no longer be economically processedat prevailing prices.
Also see the discussion in Item 1, Business, Gold or Copper Price.
Gold and Copper Producers Must Continually Replace Reserves Depleted By Production
Gold and copper producers must continually replace reserves depleted by production. Depleted reservesmust be replaced by expanding known ore bodies or by locating new deposits in order to maintain productionlevels over the long term. Exploration is highly speculative in nature, involves many risks and frequently isunproductive. Our new or ongoing exploration programs may not result in new mineral producing operations.Once mineralization is discovered, it will likely take many years from the initial phases of exploration untilproduction, during which time the economic feasibility of production may change.
9

Estimates of Proven and Probable Reserves Are Uncertain
Estimates of proven and probable reserves are subject to considerable uncertainty. Such estimates are, to alarge extent, based on the price of gold and interpretations of geologic data obtained from drill holes and otherexploration techniques. Producers use feasibility studies to derive estimates of capital and operating costs basedupon anticipated tonnage and grades of ore to be mined and processed, the predicted configuration of the orebody, expected recovery rates of metals from the ore, the costs of comparable facilities, the costs of operatingand processing equipment and other factors. Actual operating costs and economic returns on projects may differsignificantly from original estimates. Further, it may take many years from the initial phase of exploration beforeproduction and, during that time, the economic feasibility of exploiting a discovery may change.
Increased Costs Could Affect Profitability
Costs at any particular mining location frequently are subject to variation due to a number of factors, such aschanging ore grade, changing metallurgy and revisions to mine plans in response to the physical shape andlocation of the ore body. In addition, costs are affected by the price of commodities, such as fuel, electricity andlabor. Commodity costs are at times subject to volatile price movements, including increases that could makeproduction at certain operations less profitable. Reported costs may also be affected by changes in accountingstandards. A material increase in costs at any significant location could have a significant effect on ourprofitability and cash flow.
We anticipate significant capital expenditures over the next several years in connection with thedevelopment of new projects and sustaining existing operations. Costs associated with capital expenditures haveescalated on an industry-wide basis over the last several years, as a result of major factors beyond our control,including the prices of oil, steel and other commodities and labor. Increased costs for capital expenditures mayhave an adverse effect on the profitability of existing mining operations and returns anticipated from new miningprojects.
Shortages of Critical Parts, Equipment and Skilled Labor May Adversely Affect Our Operations andDevelopment Projects
The industry has been impacted by increased demand for critical resources such as input commodities,drilling equipment, tires and skilled labor. These shortages have caused unanticipated cost increases and delaysin delivery times, thereby impacting operating costs, capital expenditures and production schedules.
Mining Accidents or Other Adverse Events or Conditions at a Mining Location Could Reduce OurProduction Levels
At any of our operations, production may fall below historic or estimated levels as a result of miningaccidents such as a pit wall failure in an open pit mine, or cave-ins or flooding at underground mines. In addition,production may be unexpectedly reduced at a location if, during the course of mining, unfavorable groundconditions or seismic activity, extreme or prolonged storm events, or prolonged adverse climate changes areencountered; ore grades are lower than expected; the physical or metallurgical characteristics of the ore are lessamenable to mining or treatment than expected; or our equipment, processes or facilities fail to operate properlyor as expected. Our Midas operations in Nevada were suspended by order of the Mine Safety and HealthAdministration (“MSHA”) after a fatal accident in June 2007. On October 11, 2007, MSHA lifted the restrictiveorder that had required Midas to halt mining activities. As a result, mining activities have resumed. MSHA’sinvestigation of the accident is continuing.
Mining Companies Are Subject to Extensive Environmental Laws and Regulations
Our exploration, mining and processing operations are regulated in all countries in which we operate undervarious federal, state, provincial and local laws relating to the protection of the environment, which generally
10

include air and water quality, hazardous waste management and reclamation. Delays in obtaining, or failure toobtain, government permits and approvals may adversely impact our operations. The regulatory environment inwhich we operate could change in ways that would substantially increase costs to achieve compliance, orotherwise could have a material adverse effect on our operations or financial position. For a more detaileddiscussion of potential environmental liabilities, see the discussion in Environmental Matters, Note 32 to theConsolidated Financial Statements.
Risks Related to Newmont
Our Operations Outside North America and Australia/New Zealand Are Subject to Risks of DoingBusiness Abroad
Exploration, development and production activities outside of North America and Australia/New Zealandare potentially subject to political and economic risks, including:
• Cancellation or renegotiation of contracts;
• Disadvantages of competing against companies from countries that are not subject to U.S. laws andregulations, including the Foreign Corrupt Practices Act;
• Changes in foreign laws or regulations;
• Royalty and tax increases or claims by governmental entities, including retroactive claims;
• Expropriation or nationalization of property;
• Currency fluctuations (particularly in countries with high inflation);
• Foreign exchange controls;
• Restrictions on the ability of local operating companies to sell gold offshore for U.S. dollars, or on theability of such companies to hold U.S. dollars or other foreign currencies in offshore bank accounts;
• Import and export regulations, including restrictions on the export of gold;
• Restrictions on the ability to pay dividends offshore;
• Risk of loss due to civil strife, acts of war, guerrilla activities, insurrection and terrorism;
• Risk of loss due to disease and other potential endemic health issues; and
• Other risks arising out of foreign sovereignty over the areas in which our operations are conducted,including risks inherent in contracts with government owned entities.
Consequently, our exploration, development and production activities outside of North America andAustralia/New Zealand may be substantially affected by factors beyond our control, some of which couldmaterially adversely affect our financial position or results of operations. Furthermore, if a dispute arises fromsuch activities, we may be subject to the exclusive jurisdiction of courts outside North America or Australia/NewZealand, which could adversely affect the outcome of a dispute.
We have substantial investments in Indonesia, a nation that since 1997 has undergone financial crises anddevaluation of its currency, outbreaks of political and religious violence, changes in national leadership, and thesecession of East Timor, one of its former provinces. These factors heighten the risk of abrupt changes in thenational policy toward foreign investors, which in turn could result in unilateral modification of concessions orcontracts, increased taxation, denial of permits or permit renewals or expropriation of assets. Subsequent to thecommencement of operations, the government purported to designate the land surrounding Batu Hijau as aprotection forest, which could make operating permits more difficult to obtain. The Company has been indiscussions to renew its forest use permit (called a pinjam pakai) for over two years. This permit is a key
11

requirement to continue to efficiently operate the Batu Hijau mine. The permit renewal has not been received andin the event it is not received by May 2008, it could have an adverse impact on operating and financial results.
Recent violence committed by radical elements in Indonesia and other countries, and the presence of U.S.forces in Iraq and Afghanistan, may increase the risk that operations owned by U.S. companies will be the targetof violence. If any of our operations were so targeted it could have an adverse effect on our business.
During the last several years, Yanacocha, in which we own a 51.35% interest, has been the target ofnumerous local political protests, including ones that blocked the road between the Yanacocha mine complex andthe City of Cajamarca in Peru. In 2004, local opposition to the Cerro Quilish project became so pronounced thatYanacocha decided to relinquish its drilling permit for Cerro Quilish and the deposit was reclassified fromproven and probable reserves to non-reserve mineralization. In 2006 a road blockade was carried out by membersof the Combayo community. This blockade resulted in a brief cessation of mining activities. We cannot predictwhether similar or more significant incidents will occur in the future, and the recurrence of significantcommunity opposition or protests could adversely affect Yanacocha’s assets and operations. In 2007 no materialroadblocks or protests occurred involving Yanacocha.
Presidential, congressional and regional elections took place in Peru in 2006, with the new nationalgovernment taking office in July 2006. In December 2006, Yanacocha, along with other mining companies inPeru, entered into an agreement with the central government to contribute 3.75% of net profits to fund socialdevelopment projects. Although the current government has generally taken positions promoting privateinvestment, we cannot predict future government positions on foreign investment, mining concessions, landtenure, environmental regulation or taxation. A change in government positions on these issues could adverselyaffect Yanacocha’s assets and operations.
Our Interest in the Batu Hijau Operation in Indonesia May Be Reduced Under the Contract of Work
Under the Contract of Work, beginning in 2005 and continuing through 2010, a portion of the shares of P.T.Newmont Nusa Tenggara, the subsidiary that owns Batu Hijau (“PTNNT”) must be offered for sale, first, to theIndonesian government or, second, to Indonesian nationals, equal to the difference between the followingpercentages and the percentage of shares already owned by the Indonesian government or Indonesian nationals(if such number is positive): 23% by March 31 2006; 30% by March 31, 2007; 37% by March 31, 2008, 44% byMarch 31, 2009; and 51% by March 31, 2010. The price at which such interest must be offered for sale to theIndonesian parties is the highest of the then-current replacement cost, the price at which shares would beaccepted for listing on the Jakarta Stock Exchange, or the fair market value of such interest as a going concern, asagreed with the Indonesian government. Pursuant to this provision, it is possible that the ownership interest of theNewmont/Sumitomo partnership in PTNNT, owner of Batu Hijau, could be reduced to 49%.
P.T. Pukuafa Indah (“PTPI”), an unrelated Indonesian company, has owned and continues to own a 20%interest in PTNNT, and therefore the Newmont/Sumitomo partnership was required to offer a 3% interest for salein 2006 and an additional 7% interest in 2007. A further 7% interest will be offered for sale in March 2008. Inaccordance with the Contract of Work, an offer to sell a 3% interest was made to the government of Indonesia in2006 and an offer for an additional 7% interest was made in 2007. While the central government declined toparticipate in the offer, local governments in the area in which the Batu Hijau mine is located have expressedinterest in acquiring shares, as have various Indonesian nationals. In January 2008, the Newmont/Sumitomopartnership agreed to sell, under a carried interest arrangement, 2% of PTNNT’s shares to Kabupaten Sumbawa,one of the local governments, subject to satisfaction of closing conditions. On February 11, 2008, PTNNTreceived notification from the Department of Energy and Mineral Resources (DEMR) alleging that PTNNT is inbreach of its divestiture requirements under the Contract of Work and threatening to issue a notice to terminatethe Contract of Work if PTNNT does not agree to divest the 2006 and 2007 shares, in accordance with thedirection of the DEMR, by February 22, 2008. Newmont and Sumitomo believe there is no basis under the
12

Contract of Work for this notification and no grounds for terminating the Contract of Work, and are currentlyevaluating possible responses to the February 11, 2008 default notice, including filing for international arbitrationas provided for under the Contract of Work. Newmont and Sumitomo are in discussions with officials of theGovernment of Indonesia to attempt to clarify or resolve this issue.
Our Success May Depend on Our Social and Environmental Performance
Our ability to operate successfully in communities around the world will likely depend on our ability todevelop, operate and close mines in a manner that is consistent with the health and safety of our employees, theprotection of the environment, and the creation of long-term economic and social opportunities in thecommunities in which we operate. We have implemented a management system designed to promote continuousimprovement in health and safety, environmental performance and community relations. However, our ability tooperate could be adversely impacted by accidents or events detrimental (or perceived to be detrimental) to thehealth and safety of our employees, the environment or the communities in which we operate.
Remediation Costs for Environmental Liabilities May Exceed the Provisions We Have Made
We have conducted extensive remediation work at two inactive sites in the United States. At one of thesesites, remediation requirements have not been finally determined, and, therefore, the final cost cannot bedetermined. At a third site in the United States, an inactive uranium mine and mill formerly operated by asubsidiary of Newmont, remediation work at the mill is ongoing, but remediation at the mine is subject to disputeand has not yet commenced. The environmental standards that may ultimately be imposed at this site remainuncertain and there is a risk that the costs of remediation may exceed the provision that has been made for suchremediation by a material amount. For a more detailed discussion of potential environmental liabilities, see thediscussion in Environmental Matters, Note 32 to the Consolidated Financial Statements.
Whenever a previously unrecognized remediation liability becomes known, or a previously estimatedreclamation cost is increased, the amount of that liability and additional cost will be recorded at that time andcould materially reduce net income in that period.
Currency Fluctuations May Affect Costs
Currency fluctuations may affect the costs that we incur at our operations. Gold is sold throughout the worldbased principally on the U.S. dollar price, but a portion of our operating expenses are incurred in local currencies.The appreciation of non-U.S. dollar currencies against the U.S. dollar increases the costs of gold production inU.S. dollar terms at mines located outside the United States.
The foreign currency that primarily impacts our results of operations is the Australian dollar. We estimatethat every $0.01 increase in U.S. dollar / Australian dollar exchange rate increases the U.S. dollar Costsapplicable to sales by approximately $4 or $5 for each ounce of gold produced in Australia. During 2007, theAustralian dollar appreciated by approximately $0.09 per U.S. dollar, or approximately 10.8%. In mid-2007, weimplemented derivative programs to hedge up to 75% of our future forecasted Australian dollar denominatedoperating and capital expenditures to reduce the variability in our Australian dollar denominated expenditures.As of December 31, 2007, we have hedged 23%, 18% and 11% of our forecasted Australian denominatedoperating costs in 2008, 2009 and 2010, respectively. We have also hedged 32% of our forecasted Australiandenominated capital expenditures for 2008. Our Australian dollar derivative programs will limit the benefit to theCompany of future decreases if any, in the US dollar/Australian dollar exchange rates. For additionalinformation, see Item 7, Management’s Discussion and Analysis of Consolidated Financial Condition andResults of Operations, Results of Consolidated Operations, Foreign Currency Exchange Rates, below. For a moredetailed description of how currency exchange rates may affect costs, see discussion in Foreign Currency inItem 7A, Quantitative and Qualitative Discussions About Market Risk.
13

Future Funding Requirements May Affect Our Business
The construction of the Boddington project in Australia, the 200 megawatt coal-fired power plant inNevada, and the gold mill at Yanacocha in Peru, as well as potential future investments in the Akyem project inGhana, the Conga project in Peru and the Hope Bay project in Nunavat, Canada, will require significant funds forcapital expenditures. At current gold and copper prices, our operating cash flow is insufficient to meet all of theseexpenditures. As a result, new sources of capital will be needed to meet the funding requirements of theseinvestments, fund our ongoing business activities and pay dividends. Our ability to raise and service significantnew sources of capital will be a function of macroeconomic conditions, future gold and copper prices and ouroperational performance, among other factors; in order to retain our investment grade rating, it may be necessaryto issue additional equity or other securities, defer projects or sell assets. In the event of lower gold and copperprices, unanticipated operating or financial challenges, or new funding limitations, our ability to pursue newbusiness opportunities, invest in existing and new projects, fund our ongoing business activities and paydividends could be significantly constrained.
Costs Estimates and Timing of New Projects Are Uncertain
The capital expenditures and time required to develop new mines or other projects are considerable andchanges in costs or construction schedules can affect project economics. There are a number of factors that canaffect costs and construction schedules, including, among others:
• Availability of labor, power, transportation, commodities and infrastructure;
• Increases in input commodity prices and labor costs;
• Fluctuations in currency exchange rates;
• Availability and terms of financing;
• Difficulty of estimating construction costs over a period of years;
• Delays in obtaining environmental or other government permits; and
• Potential delays related to social and community issues.
Our Operations May Be Adversely Affected By Power Shortages
We have experienced power shortages in Ghana resulting from a nationwide drought and insufficienthydroelectric or other generating capacity. Power shortages have caused curtailment of production at our Ahafooperations. As a result of the mining industry’s initiative to construct and install a 80 mega-watt power plantduring 2007, the Ghanaian government has agreed, if required to curtail power consumption as a result of powershortages, to distribute power proportionately between participating mines and other industrial and commercialusers. Alternative sources of power will result in higher than anticipated costs, which will affect operating costs.Continued power shortages and increased costs may adversely affect our results of operations and financialcondition.
Occurrence of Events for Which We Are Not Insured May Affect Our Cash Flow and OverallProfitability
We maintain insurance policies that mitigate against certain risks related to our operations. This insurance ismaintained in amounts that we believe are reasonable depending upon the circumstances surrounding eachidentified risk. However, we may elect not to have insurance for certain risks because of the high premiumsassociated with insuring those risks or for various other reasons; in other cases, insurance may not be availablefor certain risks. Some concern always exists with respect to investments in parts of the world where civil unrest,war, nationalist movements, political violence or economic crises are possible. These countries may also poseheightened risks of expropriation of assets, business interruption, increased taxation or unilateral modification ofconcessions and contracts. We do not maintain insurance policies against political risk. Occurrence of events forwhich we are not insured may affect our cash flow and overall profitability.
14

Our Business Depends on Good Relations with Our Employees
Due to union activities or other employee actions, we could experience labor disputes, work stoppages orother disruptions in production that could adversely affect us. As of December 31, 2007, unions representedapproximately 45% of our worldwide work force. Currently, there are labor agreements in effect for all of theseworkers. We may be unable to resolve any future disputes without disruption to operations.
Title to Some of Our Properties May Be Defective or Challenged
Although we have conducted title reviews of our properties, title review does not necessarily preclude thirdparties from challenging our title. While we believe that we have satisfactory title to our properties, some riskexists that some titles may be defective or subject to challenge. In addition, certain of our Australian propertiescould be subject to native title or traditional landowner claims, but such claims would not deprive us of theproperties. For information regarding native title or traditional landowner claims, see the discussion under theAustralia/New Zealand section of Item 2, Properties, below.
We Compete With Other Mining Companies
We compete with other mining companies to attract and retain key executives, skilled labor and otheremployees with technical skills and experience in the mining industry. We also compete with other miningcompanies for rights to mine properties containing gold and other minerals. We may be unable to continue toattract and retain skilled and experienced employees, or to acquire additional rights to mine properties.
Certain Factors Outside of Our Control May Affect Our Ability to Support the Carrying Value ofGoodwill
As of December 31, 2007, the carrying value of goodwill was approximately $186 or 1% of our total assets.Goodwill has been assigned to various mine site reporting units in the Australia/New Zealand Segment. Thisgoodwill primarily arose in connection with our February 2002 acquisition of Normandy and represents theexcess of the aggregate purchase price over the fair value of the identifiable net assets acquired. We evaluate, onat least an annual basis, the carrying amount of goodwill to determine whether current events and circumstancesindicate that such carrying amount may no longer be recoverable. This evaluation involves a comparison of theestimated fair value of our reporting units to their carrying values. If the carrying amount of goodwill for anyreporting unit exceeds its estimated fair value, a non-cash impairment charge could result. For a more detaileddescription of the estimates and assumptions involved in assessing the recoverability of the carrying value ofgoodwill, see Item 7, Management’s Discussion and Analysis of Consolidated Financial Condition and Results ofOperations, Critical Accounting Policies, below.
Our Ability to Recognize the Benefits of Deferred Tax Assets is Dependent on Future Cash Flows andTaxable Income
We recognize the expected future tax benefit from deferred tax assets when the tax benefit is considered tobe more likely than not of being realized. Otherwise, a valuation allowance is applied against deferred tax assets.Assessing the recoverability of deferred tax assets requires management to make significant estimates related toexpectations of future taxable income. Estimates of future taxable income are based on forecasted cash flowsfrom operations and the application of existing tax laws in each jurisdiction. To the extent that future cash flowsand taxable income differ significantly from estimates, our ability to realize the deferred tax assets could beimpacted. Additionally, future changes in tax laws could limit our ability to obtain the future tax benefitsrepresented by our deferred tax assets. As of December 31, 2007, the Company’s current and long-term deferredtax assets were $112 and $1,036, respectively.
15
Returns for Investments in Pension Plans Are Uncertain
We maintain pension plans for employees, which provide for specified payments after retirement for certainemployees. The ability of the pension plans to provide the specified benefits depends on our funding of the plansand returns on investments made by the plans. Returns, if any, on investments are subject to fluctuations basedon investment choices and market conditions. A sustained period of low returns or losses on investments couldrequire us to fund the pension plans to a greater extent than anticipated.
16
ITEM 2. PROPERTIES (dollars in millions except per share, per ounce and per pound amounts)
Gold and Copper Processing Methods
Gold is extracted from naturally-oxidized ores by either heap leaching or milling, depending on the amountof gold contained in the ore, the amenability of the ore to treatment and related capital and operating costs.Higher grade oxide ores are generally processed through mills, where the ore is ground into a fine powder andmixed with water in slurry, which then passes through a carbon-in-leach circuit. Lower grade oxide ores aregenerally processed using heap leaching. Heap leaching consists of stacking crushed or run-of-mine ore onimpermeable pads, where a weak cyanide solution is applied to the surface of the heap to dissolve the gold. Inboth cases, the gold-bearing solution is then collected and pumped to process facilities to remove the gold bycollection on carbon or by zinc precipitation.
Gold contained in ores that are not naturally oxidized can be directly milled if the gold is amenable tocyanidization, generally known as free milling sulfide ores. Ores that are not amenable to cyanidization, knownas refractory ores, require more costly and complex processing techniques than oxide or free milling ore. Higher-grade refractory ores are processed through either roasters or autoclaves. Roasters heat finely ground ore to ahigh temperature, burn off the carbon and oxidize the sulfide minerals that prevent efficient leaching. Autoclavesuse heat, oxygen and pressure to oxidize sulfide ores.
Some sulfide ores may be processed through a flotation plant or by bio-milling. In flotation, ore is finelyground, turned into slurry, then placed in a tank known as a flotation cell. Chemicals are added to the slurry causingthe gold-containing sulfides to float attached to air bubbles to the top of the tank. The sulfides are removed from thecell and converted into a concentrate that can then be processed in an autoclave or roaster to recover the gold.Bio-milling incorporates patented technology that involves inoculation of suitable crushed ore on a leach pad withnaturally occurring bacteria strains, which oxidize the sulfides over a period of time. The ore is then processedthrough an oxide mill.
At Batu Hijau, ore containing copper and gold is crushed to a coarse size at the mine and then transportedfrom the mine via conveyor to a concentrator, where it is finely ground and then treated by successive stages offlotation, resulting in a concentrate containing approximately 30% copper. The concentrate is dewatered andstored for loading onto ships for transport to smelters.
17

Production Properties
Set forth below is a description of Newmont’s significant production properties. Operating statistics for eachoperation are presented in a table in the next section of Item 2.
Nevada
We have been mining gold in Nevada since 1965. Nevada operations include Carlin, located west of the cityof Elko on the geologic feature known as the Carlin Trend, the Twin Creeks mine, located approximately 15miles north of Golconda, the Lone Tree Complex near the town of Valmy, and the Midas mine near the town ofthe same name. We also participate in the Turquoise Ridge joint venture with a subsidiary of Barrick Gold Corp.(“Barrick”), which utilizes mill capacity at Twin Creeks. The Phoenix mine, located 10 miles south of BattleMountain, commenced commercial production in the fourth quarter of 2006. The Leeville underground mine,located on the Carlin Trend northwest of the Carlin East underground mine, also commenced commercialproduction in the fourth quarter of 2006.
Gold sales from Nevada totaled approximately 2.3 million ounces for 2007 with ore mined from nine openpit and five underground mines. At year-end 2007, we reported 29.4 million equity ounces of gold reserves inNevada, with 84% in open pit mines and 16% in underground mines. Refractory ores require more complex,higher cost processing methods. Refractory ore treatment facilities generated 75% of Nevada’s gold productionin 2007, compared with 72% in 2006, and 69% in 2005. With respect to remaining reserves, we estimate that79% are refractory ores and 21% are oxide ores.
The Nevada operations produce gold from a variety of ore types requiring different processing techniquesdepending on economic and metallurgical characteristics. To ensure the best use of processing capacity, we use alinear programming model to guide the flow of both mining sequence selection and routing of ore streams tovarious plants. Higher-grade oxide ores are processed by conventional milling and cyanide leaching at Carlin(Mill 5), Twin Creeks (Juniper) and Lone Tree. Lower-grade material with suitable cyanide solubility is treated
18

on heap leach pads at Carlin, Twin Creeks and Lone Tree. Higher-grade refractory ores are processed througheither a roaster at Carlin (Mill 6) or autoclaves at Twin Creeks (Sage) and Lone Tree. Lower-grade refractoryores are processed by a flotation plant at Lone Tree or either bio-oxidation/flotation or direct flotation at Mill 5.Ore from the Midas mine is processed by conventional milling and Merrill-Crowe zinc precipitation. Activatedcarbon from the various leaching circuits is treated to produce gold ore at Carlin and Twin Creeks. Zincprecipitate at Midas is refined on-site. All milling at Lone Tree was completed in 2007.
We own, or control through long-term mining leases and unpatented mining claims, all of the minerals andsurface area within the boundaries of the present Nevada mining operations (except for the Turquoise Ridge jointventure described below). The long-term leases extend for at least the anticipated mine life of those deposits.With respect to a significant portion of the Gold Quarry mine at Carlin, we own a 10% undivided interest in themineral rights and lease the remaining 90%, on which we pay a royalty equivalent to 18% of the mineralproduction. We wholly-own or control the remainder of the Gold Quarry mineral rights, in some cases subject toadditional royalties. With respect to certain smaller deposits in Western Nevada, we are obligated to pay royaltieson production to third parties that vary from 2% to 5% of production.
We have a 25% interest in a joint venture with Barrick to operate the Turquoise Ridge and Getchell mines.Newmont has an agreement to provide up to 2,000 tons per day of milling capacity at Twin Creeks to the jointventure. Barrick is the operator of the joint venture. Gold sales of 62,844 in 2007, 58,300 ounces in 2006 and52,300 ounces in 2005 were attributable to Newmont, based on our 25% ownership interest.
We have ore sale agreements with Barrick and Yukon-Nevada Gold Corp. (“Yukon-Nevada”) to processsome of the Company’s ore. We recognized attributable gold sales, net of treatment charges, of 58,624 ounces in2007, 99,500 ounces in 2006 and 104,600 ounces in 2005 pursuant to these agreements.
We have sales and refining agreements with Gerald Metals, Peñoles, Yukon-Nevada, Johnson Matthey, JustRefiners and Glencore to process intermediate gold bearing product.
Yanacocha, Peru
The properties of Minera Yanacocha S.R.L. (“Yanacocha”) are located approximately 375 miles (604kilometers) north of Lima and 30 miles (48 kilometers) north of the city of Cajamarca, in Peru. Yanacocha beganproduction in 1993. We hold a 51.35% interest in Yanacocha with the remaining interests held by Compañia deMinas Buenaventura, S.A.A. (43.65%) and the International Finance Corporation (5%).
Yanacocha has mining rights with respect to a large land position. Yanacocha’s mining rights consist ofconcessions granted by the Peruvian government to Yanacocha and a related entity. These mining concessionsprovide for both the right to explore and exploit. However, Yanacocha must first obtain the respectiveexploration and exploitation permits, which are generally granted in due course. Yanacocha may retain miningconcessions indefinitely by paying annual fees and, during exploitation, complying with production obligationsor paying assessed fines. Mining concessions are freely assignable or transferable.
Yanacocha currently has three active open pit mines, Cerro Yanacocha, La Quinua and Chaquicocha. Inaddition, reclamation and/or backfilling activities at Carachugo, San José and Maqui Maqui are currentlyunderway. In addition, Yanacocha has four leach pads and three processing facilities. Yanacocha’s gold sales for2007 totaled 1.6 million ounces (0.8 million equity ounces). At year-end 2007, we reported 14.2 million equityounces of gold reserves at Yanacocha.
The Yanacocha operations contain the Conga deposit, for which a feasibility study was completed in 2004.We continue to evaluate the optimum development plan for Conga.
Yanacocha, along with other mining companies in Peru, agreed with the central government in 2006 tocontribute 3.75% of its net profits to fund social development projects for a period of up to five years, contingentupon metal prices remaining high.
19
Australia/New Zealand
In Australia, mineral exploration and mining titles are granted by the individual states or territories. Mineraltitles may also be subject to native title legislation or, in the Northern Territory, to Aboriginal freehold titlelegislation that entitles indigenous persons to compensation calculated by reference to the gross value ofproduction. In 1992, the High Court of Australia held that Aboriginal people who have maintained a continuingconnection with their land according to their traditions and customs may hold certain rights in respect of the land,such rights commonly referred to as native title. Since the High Court’s decision, Australia has passed legislationproviding for the protection of native title and established procedures for Aboriginal people to claim these rights.The fact that native title is claimed with respect to an area, however, does not necessarily mean that native titleexists, and disputes may be resolved by the courts.
Generally, under native title legislation, all mining titles granted before January 1, 1994 are valid. Titlesgranted between January 1, 1994 and December 23, 1996, however, may be subject to invalidation if they werenot obtained in compliance with applicable legislative procedures, though subsequent legislation has validatedsome of these titles. After December 23, 1996, mining titles over areas where native title is claimed to existbecame subject to legislative processes that generally give native title claimants the “right to negotiate” with thetitle applicant for compensation and other conditions. Native title holders do not have a veto over the granting ofmining titles, but if agreement cannot be reached, the matter can be referred to the National Native Title Tribunalfor decision.
We do not expect that native title claims will have a material adverse effect on any of our operations inAustralia. The High Court of Australia determined in an August 2002 decision, which refined and narrowed thescope of native title, that native title does not subsist in minerals in Western Australia and that the rights grantedunder a mining title would, to the extent inconsistent with asserted native title rights, operate to extinguish thosenative title rights. Generally, native title is only an issue for Newmont with respect to obtaining new mineraltitles or moving from one form of title to another, for example, from an exploration title to a mining title. In thesecases, the requirements for negotiation and the possibility of paying compensation may result in delay andincreased costs for mining in the affected areas. Similarly, the process of conducting Aboriginal heritage surveysto identify and locate areas or sites of Aboriginal cultural significance can result in additional costs and delay ingaining access to land for exploration and mining-related activities.
In Australia, various ad valorem royalties are paid to state and territorial governments, typically based on apercentage of gross revenues and earnings.
Tanami. The Tanami operations (100% owned) include The Granites treatment plant and associated miningoperations, which are located in the Northern Territory approximately 342 miles (550 kilometers) northwest ofAlice Springs, adjacent to the Tanami highway, and the Dead Bullock Soak mining operations, approximately 25miles (40 kilometers) west of The Granites. The Tanami operations have been wholly-owned since April 2003,when Newmont acquired the minority interests.
The operations are predominantly focused on the Callie underground mine at Dead Bullock Soak, with millfeed supplemented by production stockpiles from the Dead Bullock Soak open pit. Ore from all of theseoperations is processed through The Granites plant. During 2007, the Tanami operations sold 439,000 ounces ofgold. At year-end 2007, we reported 1.7 million equity ounces of gold reserves at Tanami.
Kalgoorlie. The Kalgoorlie operations comprise the Fimiston open pit (commonly referred to as the SuperPit) and Mt. Charlotte underground mine at Kalgoorlie-Boulder, 373 miles (600 kilometers) east of Perth. Themines are managed by Kalgoorlie Consolidated Gold Mines Pty Ltd for the joint venture owners, Newmont andBarrick, each of which holds a 50% interest. The Super Pit is one of Australia’s largest gold mines in terms ofgold production and annual mining volume. During 2007, the Kalgoorlie operations sold 323,400 equity ouncesof gold. At year-end 2007, we reported 4.6 million equity ounces of gold reserves at Kalgoorlie.
20
Jundee. The Jundee operation (100% owned) is situated approximately 435 miles (700 kilometers) northeastof Perth in Western Australia. During 2007 mining was conducted from both the underground and open pitdeposits with the open pit operation ceasing production in November 2007. The milling operation wasconsolidated during the year with the relocation of the Nimary ball mill to the Jundee plant site. Jundee sold298,200 ounces of gold in 2007. At year-end 2007, we reported 1.5 million equity ounces of gold reserves atJundee.
Waihi. The Waihi operations (100% owned) are located within the town of Waihi, located approximately 68miles (110 kilometers) southeast of Auckland, New Zealand and consist of the Favona underground deposit andthe Martha open pit. The Waihi operation sold 92,900 ounces of gold during 2007. At year-end 2007, wereported 0.5 million equity ounces of gold reserves at Waihi. The Martha mine does not currently pay royalties.At Favona, Newmont pays a royalty of 1% of gross revenues from gold and silver sales, or 5% of accountingprofit, whichever is greater.
Boddington. Boddington is a development project located 81 miles (130 kilometers) southeast of Perth inWestern Australia. Boddington is owned by Newmont (66.67%) and AngloGold Ashanti Limited (33.33%).Development of the Boddington project was approximately 62% complete as of December 31, 2007, with millstart-up expected in late 2008 or early 2009. At year-end 2007, we reported 11.1 million equity ounces of goldreserves at Boddington.
Batu Hijau, Indonesia
Batu Hijau is located on the island of Sumbawa, approximately 950 miles (1,529 kilometers) east of Jakarta.Batu Hijau is a large porphyry copper/gold deposit which Newmont discovered in 1990. Development andconstruction activities began in 1997 and start-up occurred in late 1999. In 2007, copper sales were 427.5 millionpounds (204.2 million equity pounds), while gold sales were 494,300 ounces (233,300 equity ounces). Atyear-end 2007, we reported 4.1 billion equity pounds of copper reserves and 4.2 million equity ounces of goldreserves at Batu Hijau.
We operate Batu Hijau, a producer of copper/gold concentrates, and have a 45% ownership interest therein,held through a partnership with an affiliate of Sumitomo Corporation. We have a 56.25% interest in thepartnership and the Sumitomo affiliate holds the remaining 43.75%. The partnership, in turn, owns 80% of P.T.Newmont Nusa Tenggara (“PTNNT”), the subsidiary that owns Batu Hijau. The remaining 20% interest inPTNNT is owned by P.T. Pukuafu Indah (“PTPI”), an unrelated Indonesian company. Because PTPI’s interestwas a carried interest, and because PTPI had been advanced a loan by the partnership, we reported a 52.875%economic interest in Batu Hijau, which reflected our actual economic interest in the mine until such time as theloan was fully repaid (including accrued interest). On May 25, 2007, PTPI fully repaid the loan (includingaccrued interest) and as a result, our economic interest was reduced from 52.875% to 45% and we recorded a netcharge of $25 (after-tax) against Minority interest expense in the second quarter of 2007.
In Indonesia, rights are granted to foreign investors to explore for and to develop mineral resources withindefined areas through Contracts of Work entered into with the Indonesian government. In 1986, PTNNT enteredinto a Contract of Work with the Indonesian government covering Batu Hijau, under which PTNNT was grantedthe exclusive right to explore in the contract area, construct any required facilities, extract and process themineralized materials, and sell and export the minerals produced, subject to certain requirements includingIndonesian government approvals and payment of royalties to the government. Under the Contract of Work,PTNNT has the right to continue operating the project for 30 years from operational start-up, or longer ifapproved by the Indonesian government.
Under the Contract of Work, beginning in 2005 and continuing through 2010, a portion of PTNNT’s sharesmust be offered for sale, first, to the Indonesian government or, second, to Indonesian nationals, equal to thedifference between the following percentages and the percentage of shares already owned by the Indonesian
21

government or Indonesian nationals (if such number is positive): 23% by March 31, 2006; 30% by March 31,2007; 37% by March 31, 2008, 44% by March 31, 2009; and 51% by March 31, 2010. The price at which suchinterest must be offered for sale to the Indonesian parties is the highest of the then-current replacement cost, theprice at which shares would be accepted for listing on the Jakarta Stock Exchange, or the fair market value ofsuch interest as a going concern, as agreed with the Indonesian government. Pursuant to this provision, it ispossible that the ownership interest of the Newmont/Sumitomo partnership in PTNNT, owner of Batu Hijau,could be reduced to 49%.
PTPI has owned and continues to own a 20% interest in PTNNT, and therefore the Newmont/Sumitomopartnership was required to offer a 3% interest for sale in 2006 and an additional 7% interest in 2007. A further7% interest will be offered for sale in March 2008. In accordance with the Contract of Work, an offer to sell a 3%interest was made to the government of Indonesia in 2006 and an offer for an additional 7% interest was made in2007. While the central government declined to participate in the offer, local governments in the area in whichthe Batu Hijau mine is located have expressed interest in acquiring shares, as have various Indonesian nationals.In January 2008, the Newmont/Sumitomo partnership agreed to sell, under a carried interest arrangement, 2% ofPTNNT’s shares to Kabupaten Sumbawa, one of the local governments, subject to satisfaction of closingconditions. On February 11, 2008, PTNNT received notification from the Department of Energy and MineralResources (DEMR) alleging that PTNNT is in breach of its divestiture requirements under the Contract of Workand threatening to issue a notice to terminate the Contract of Work if PTNNT does not agree to divest the 2006and 2007 shares, in accordance with the direction of the DEMR, by February 22, 2008. Newmont and Sumitomobelieve there is no basis under the Contract of Work for this notification and no grounds for terminating theContract of Work, and are currently evaluating possible responses to the February 11, 2008 default notice,including filing for international arbitration as provided for under the Contract of Work. Newmont andSumitomo are in discussions with officials of the Government of Indonesia to attempt to clarify or resolve thisissue.
The Company has been in discussions to renew its forest use permit (called a pinjam pakai) for over twoyears. This permit is a key requirement to continue to efficiently operate the Batu Hijau mine. The permitrenewal has not been received and in the event it is not received by May 2008, it could have an adverse impact onoperating and financial results.
Ghana
The Ahafo operation (100% owned) is located in the Brong-Ahafo Region of Ghana, approximately 180miles (290 kilometers) northwest of Accra. Ahafo poured its first gold on July 18, 2006 and commencedcommercial production in August 2006. Ahafo sold 445,600 ounces of gold in 2007.
We currently operate two open pits at Ahafo with reserves contained in 17 pits. The process plant consists ofa conventional mill and carbon-in-leach circuit. Ahafo reserves as of December 31, 2007, were 9.7 million equityounces.
In December 2003, Ghana’s Parliament unanimously ratified an Investment Agreement between Newmontand the Government of Ghana. The Agreement establishes a fixed fiscal and legal regime, including fixed royaltyand tax rates, for the life of any Newmont project in Ghana. Under the Agreement, we will pay corporate incometax at the Ghana statutory tax rate (presently 25%) not to exceed 32.5% and fixed gross royalties on goldproduction of 3.0% (3.6% for any production from forest reserve areas). The Government of Ghana is alsoentitled to receive 10% of a project’s net cash flow after we have recouped our investment and may acquire up to20% of a project’s equity at fair market value on or after the 15th anniversary of such project’s commencement ofproduction. The Investment Agreement also contains commitments with respect to job training for localGhanaians, community development, purchasing of local goods and services and environmental protection.
22

We have one development project in Ghana, currently the subject of further optimization studies. TheAkyem project (100% owned) is approximately 80 miles (125 kilometers) northwest of Accra. In 2007, theCompany continued optimization and engineering on alternative plans for the proposed operation. The Companyalso initiated environmental and social baseline data collection in preparation for submitting permit documents in2008.
Other Operations
Bolivia. The Kori Kollo open pit mine is on a high plain in northwestern Bolivia near Oruro, on governmentmining concessions issued to a Bolivian corporation, Empresa Minera Inti Raymi S.A. (“Inti Raymi”), in whichwe have an 88% interest. The remaining 12% is owned by Mrs. Beatriz Rocabado. Inti Raymi owns and operatesthe mine. The mill was closed in October 2003 and production continued from residual leaching. In 2005,additional material from the stockpiles and Lla Llagua pit were placed on the existing leach pad and ore from theKori Chaca pit was processed on a new leach pad. In 2007, Inti Raymi sold 76,300 equity ounces of gold. Atyear-end 2007, we reported 0.4 million equity ounces of gold reserves at Inti Raymi.
Mexico. We have a 44% interest in La Herradura, which is located in Mexico’s Sonora desert. La Herradurais operated by Industriales Peñoles (which owns the remaining 56% interest) and comprises an open pit operationwith run-of-mine heap leach processing. La Herradura sold 85,700 equity ounces of gold in 2007. At year-end2007, we reported 1.6 million equity ounces of gold reserves at La Herradura.
Canada. During 2007, our Canadian operations included one underground mine. Golden Giant (100%owned) is located approximately 25 miles (40 kilometers) east of Marathon in Ontario, Canada, and beganproduction in 1985. Mining operations at Golden Giant were completed in December 2005 with remnant salescontinuing through the second quarter of 2007. In 2007, Golden Giant sold 12,000 ounces of gold.
Other Property
Hope Bay. With the successful acquisition of Miramar in December 2007, we now control the Hope Bayproject, a large undeveloped gold project in the Nunavut Territory of Canada. Hope Bay is consistent with theCompany’s strategic focus on exploration and project development and was acquired with the intention of addinghigher grade ore reserves and developing a new core gold mining district in a AAA-rated country.
23

Operating Statistics
The following tables detail operating statistics related to gold production, sales and production costs.
Nevada Yanacocha, Peru
Year Ended December 31, 2007 2006 2005 2007 2006 2005
Tons mined (000 dry short tons):Open pit . . . . . . . . . . . . . . . . . . . . . . . 214,127 191,438 193,565 208,871 217,501 218,933Underground . . . . . . . . . . . . . . . . . . . 1,942 1,651 1,727 — — —
Tons milled/processed (000 dry shorttons):
Mill . . . . . . . . . . . . . . . . . . . . . . . . . . 25,526 17,882 15,570 — — —Leach . . . . . . . . . . . . . . . . . . . . . . . . . 14,042 22,138 21,660 98,319 118,511 146,645
Average ore grade (oz/ton):Mill . . . . . . . . . . . . . . . . . . . . . . . . . . 0.098 0.127 0.157 — — —Leach . . . . . . . . . . . . . . . . . . . . . . . . . 0.035 0.026 0.024 0.019 0.026 0.028
Average mill recovery rate . . . . . . . . . . . . 81.2% 81.1% 86.0% — — —Ounces produced (000):
Mill . . . . . . . . . . . . . . . . . . . . . . . . . . 2,004 2,059 2,061 — — —Leach . . . . . . . . . . . . . . . . . . . . . . . . . 332 364 351 1,565 2,612 3,333Incremental start-up . . . . . . . . . . . . . 6 100 22 — — —
2,342 2,523 2,434 1,565 2,612 3,333
Ounces sold (000) . . . . . . . . . . . . . . . . . . . 2,341 2,534 2,444 1,565 2,572 3,327
Production costs per ounce:Direct mining and production
costs . . . . . . . . . . . . . . . . . . . . . . . . $ 449 $ 404 $ 346 $ 337 $ 190 $ 142Deferred stripping . . . . . . . . . . . . . . . — — (20) — — —By-product credits . . . . . . . . . . . . . . . (26) (15) (7) (22) (16) (10)Royalties and production taxes . . . . . 14 9 8 13 14 11Reclamation/accretion expense . . . . . 2 3 2 6 3 2Other . . . . . . . . . . . . . . . . . . . . . . . . . 5 2 4 11 2 2
Costs applicable to sales . . . . . . . . . . 444 403 333 345 193 147Depreciation, depletion and
amortization . . . . . . . . . . . . . . . . . . 94 74 51 103 67 62
Total production costs . . . . . . . . $ 538 $ 477 $ 384 $ 448 $ 260 $ 209
24

Australia/New Zealand Batu Hijau, Indonesia
Year Ended December 31, 2007 2006 2005 2007 2006 2005
Tons mined (000 dry short tons):Open pit . . . . . . . . . . . . . . . . . . . . . . . . . . 56,259 54,221 60,691 244,907 293,159 225,838Underground . . . . . . . . . . . . . . . . . . . . . . 3,547 3,658 3,394 — — —
Tons milled (000 dry short tons) . . . . . . . . . . . 11,932 13,070 15,233 46,782 47,026 50,210Average ore grade (oz/ton) . . . . . . . . . . . . . . . 0.102 0.102 0.102 0.014 0.012 0.018Average mill recovery rate . . . . . . . . . . . . . . . 91.3% 90.9% 91.1% 81.9% 79.5% 80.7%Ounces produced (000) . . . . . . . . . . . . . . . . . . 1,117 1,216 1,402 548 448 732
Ounces sold (000) . . . . . . . . . . . . . . . . . . . . . . 1,153 1,176 1,409 494 435 720
Production costs per ounce:Direct mining and production costs . . . . $ 462 $ 364 $ 314 $ 233 $ 203 $ 145Deferred stripping . . . . . . . . . . . . . . . . . . — — (5) — — 1By-product credits . . . . . . . . . . . . . . . . . . (5) (10) (9) (8) (9) (5)Royalties and production taxes . . . . . . . . 29 28 13 15 13 9Reclamation/accretion expense . . . . . . . . 5 5 3 3 2 2Other . . . . . . . . . . . . . . . . . . . . . . . . . . . . 5 2 3 — — —
Costs applicable to sales . . . . . . . . . . . . . 496 389 319 243 209 152Depreciation, depletion and
amortization . . . . . . . . . . . . . . . . . . . . . 94 78 66 50 46 47
Total production costs . . . . . . . . . . . $ 590 $ 467 $ 385 $ 293 $ 255 $ 199
Ahafo, Ghana
Year Ended December 31, 2007 2006
Tons mined (000 dry short tons):Open pit . . . . . . . . . . . . . . . . . . . . . . . . . . 44,235 19,999Underground . . . . . . . . . . . . . . . . . . . . . . — —
Tons milled (000 dry short tons) . . . . . . . . . . . 8,090 3,515Average ore grade: (oz/ton) . . . . . . . . . . . . . . . 0.060 0.065Average mill recovery rate . . . . . . . . . . . . . . . 92.0% 88.3%Ounces produced (000): . . . . . . . . . . . . . . . . . 456 202
Ounces sold (000) . . . . . . . . . . . . . . . . . . . . . . 446 202
Production costs per ounce:Direct mining and production costs . . . . $ 373 $ 277By-product credits and other . . . . . . . . . . (1) (1)Royalties and production taxes . . . . . . . . 21 18Reclamation/accretion expense . . . . . . . . 1 1Other . . . . . . . . . . . . . . . . . . . . . . . . . . . . 2 2
Costs applicable to sales . . . . . . . . . . . . . 396 297Depreciation, depletion and
amortization . . . . . . . . . . . . . . . . . . . . . 96 94
Total production costs . . . . . . . . . . . $ 492 $ 391
25

Other Operations Total Gold
Year Ended December 31, 2007 2006 2005 2007 2006 2005
Ounces produced (000):Mill . . . . . . . . . . . . . . . . . . . . . . . . . . . . . . . . . . . . . . . . . . . 12 59 162 4,137 3,979 4,357Leach . . . . . . . . . . . . . . . . . . . . . . . . . . . . . . . . . . . . . . . . . 175 208 177 2,072 3,184 3,861Incremental start-up . . . . . . . . . . . . . . . . . . . . . . . . . . . . . . — — — 6 105 22
187 267 339 6,215 7,268 8,240
Ounces sold (000) . . . . . . . . . . . . . . . . . . . . . . . . . . . . . . . . . . . . 185 267 337 6,184 7,186 8,237
Production costs per ounce:Direct mining and production costs . . . . . . . . . . . . . . . . . . $334 $214 $230 $ 397 $ 301 $ 238Deferred stripping . . . . . . . . . . . . . . . . . . . . . . . . . . . . . . . — — (8) — — (7)By-product credits . . . . . . . . . . . . . . . . . . . . . . . . . . . . . . . (18) (11) (3) (18) (13) (8)Royalties and production taxes . . . . . . . . . . . . . . . . . . . . . (1) — 6 17 10 7Reclamation/accretion expense . . . . . . . . . . . . . . . . . . . . . 10 9 6 4 3 2Other . . . . . . . . . . . . . . . . . . . . . . . . . . . . . . . . . . . . . . . . . . 7 10 2 6 2 3
Costs applicable to sales . . . . . . . . . . . . . . . . . . . . . . . . . . . 332 222 233 406 303 235Depreciation, depletion and amortization . . . . . . . . . . . . . 91 69 58 93 71 58
Total production costs . . . . . . . . . . . . . . . . . . . . . . . . $423 $291 $291 $ 499 $ 374 $ 293
The following table details operating statistics related to Batu Hijau copper production, sales and productioncosts.
Batu Hijau, Indonesia
Year Ended December 31, 2007 2006 2005
Tons milled (000 dry short tons) . . . . . . . . . . . . . . . . . . . . . . . . . . . . 46,782 47,026 50,210Average copper grade . . . . . . . . . . . . . . . . . . . . . . . . . . . . . . . . . . . . . 0.60% 0.55% 0.69%Average copper recovery rate . . . . . . . . . . . . . . . . . . . . . . . . . . . . . . 86.1% 87.3% 86.7%Copper pounds produced (millions) . . . . . . . . . . . . . . . . . . . . . . . . . . 484 454 596Copper pounds sold (millions) . . . . . . . . . . . . . . . . . . . . . . . . . . . . . . 428 435 573
Production costs per pound:Costs applicable to sales . . . . . . . . . . . . . . . . . . . . . . . . . . . . . . . $ 1.10 $ 0.71 $ 0.53Depreciation, depletion and amortization . . . . . . . . . . . . . . . . . 0.22 0.15 0.15
Total production costs . . . . . . . . . . . . . . . . . . . . . . . . . . . . $ 1.32 $ 0.86 $ 0.68
Proven and Probable Equity Reserves
We had proven and probable equity gold reserves of 86.5 million contained ounces as of December 31,2007.
Reserves were calculated at a $575, A$750 or NZ$850 per ounce gold price assumption. Our 2007 reserveswould decline by approximately 6%, or 5.6 million ounces, if calculated at a $550 per ounce gold price. Anincrease in the gold price to $600 per ounce would increase reserves by approximately 4%, or 4.0 million ounces,all other assumptions remaining constant.
As of December 31, 2007, our equity gold reserves in Nevada were 29.4 million ounces. Outside of Nevada,year-end equity gold reserves were 57.1 million ounces, including 19.4 million ounces in Australia/New Zealand,17.4 million ounces in Ghana, 14.2 million ounces in Peru, 4.2 million ounces in Indonesia and 2.0 millionounces at Other Operations.
26

Our equity copper reserves as of December 31, 2007 were 7.6 billion contained pounds. Reserves werecalculated at a price of $1.75 or A$2.00 per pound assumption.
Under our current mining plans, all of our reserves are located on fee property or mining claims or will bedepleted during the terms of existing mining licenses or concessions, or where applicable, any assured renewal orextension periods for the licenses or concessions.
Proven and probable equity reserves are based on extensive drilling, sampling, mine modeling andmetallurgical testing from which we determined economic feasibility. The price sensitivity of reserves dependsupon several factors including grade, metallurgical recovery, operating cost, waste-to-ore ratio and ore type.Metallurgical recovery rates vary depending on the metallurgical properties of each deposit and the productionprocess used. The reserve tables below list the average metallurgical recovery rate for each deposit, which takesinto account the several different processing methods that we use. The cut-off grade, or lowest grade ofmineralized material considered economic to process, varies with material type, metallurgical recoveries andoperating costs.
The proven and probable equity reserve figures presented herein are estimates based on informationavailable at the time of calculation. No assurance can be given that the indicated levels of recovery of gold andcopper will be realized. Ounces of gold or pounds of copper in the proven and probable reserves are calculatedwithout regard to any losses during metallurgical treatment. Reserve estimates may require revision based onactual production experience. Market price fluctuations of gold and copper, as well as increased production costsor reduced metallurgical recovery rates, could render proven and probable reserves containing relatively lowergrades of mineralization uneconomic to exploit and might result in a reduction of reserves.
We publish reserves annually, and we will recalculate reserves as of December 31, 2008, taking into accountmetal prices, divestments and depletion as well as any acquisitions and additions to reserves during 2008.
27

The following tables detail gold proven and probable equity reserves(1) reflecting only those reserves owned by Newmontas of December 31, 2007 and 2006:
Deposits/DistrictsNewmont
Share
December 31, 2007
MetallurgicalRecovery(3)
Proven Reserves Probable ReservesProven and Probable
Reserves
Tonnage(2)
(000)Grade
(oz/ton)Ounces(3)
(000)Tonnage(2)
(000)Grade
(oz/ton)Ounces(3)
(000)Tonnage(2)
(000)Grade
(oz/ton)Ounces(3)
(000)
Nevada(4)
Carlin Open Pit(5) . . . . . . . . 100% 17,700 0.065 1,140 195,800 0.043 8,380 213,500 0.045 9,520 71%Carlin Underground . . . . . . 100% 1,500 0.318 490 5,700 0.407 2,330 7,200 0.388 2,820 94%Midas(6) . . . . . . . . . . . . . . . . 100% 600 0.539 340 400 0.428 190 1,000 0.493 530 95%Phoenix . . . . . . . . . . . . . . . . 100% — — — 278,100 0.027 7,600 278,100 0.027 7,600 75%Turquoise Ridge(7) . . . . . . . 25% 2,100 0.477 990 700 0.402 290 2,800 0.458 1,280 92%Twin Creeks . . . . . . . . . . . . 100% 4,200 0.072 300 47,900 0.079 3,780 52,100 0.078 4,080 80%Nevada In-Process(8) . . . . . . 100% 40,200 0.026 1,060 — — — 40,200 0.026 1,060 66%Nevada Stockpiles(9) . . . . . . 100% 30,900 0.079 2,440 1,500 0.030 40 32,400 0.077 2,480 77%
97,200 0.070 6,760 530,100 0.043 22,610 627,300 0.047 29,370 77%
Yanacocha, PeruConga(10) . . . . . . . . . . . . . . . 51.35% — — — 317,200 0.019 6,080 317,200 0.019 6,080 79%Yanacocha
In-Process(8)(11) . . . . . . . . 51.35% 20,700 0.027 560 — — — 20,700 0.027 560 76%Yanacocha Open Pits(11) . . . 51.35% 26,400 0.023 600 229,200 0.030 6,940 255,600 0.029 7,540 69%
47,100 0.025 1,160 546,400 0.024 13,020 593,500 0.024 14,180 74%
Australia/New ZealandBoddington, Western
Australia(12) . . . . . . . . . . . 66.67% 124,900 0.026 3,240 352,000 0.022 7,850 476,900 0.023 11,090 82%Jundee, Western
Australia(13) . . . . . . . . . . . 100% 3,000 0.148 450 3,700 0.283 1,040 6,700 0.222 1,490 91%Kalgoorlie Open Pits
and Underground . . 50% 32,500 0.061 1,980 33,600 0.065 2,190 66,100 0.063 4,170 86%Kalgoorlie
Stockpiles(9) . . . . . . 50% 13,500 0.031 420 — — — 13,500 0.031 420 79%
Total Kalgoorlie, WesternAustralia(14) . . . . . . . . . . . 50% 46,000 0.052 2,400 33,600 0.065 2,190 79,600 0.058 4,590 85%
Tanami Undergroundand Open Pits . . . . . 100% 6,200 0.144 890 5,200 0.138 710 11,400 0.141 1,600 95%
TanamiStockpiles(9) . . . . . . 100% 400 0.081 30 1,500 0.036 60 1,900 0.045 90 95%
Total Tanami, NorthernTerritory(15) . . . . . . . . . . . 100% 6,600 0.140 920 6,700 0.115 770 13,300 0.127 1,690 95%
Waihi, New Zealand(16) . . . 100% — — — 3,800 0.131 500 3,800 0.131 500 89%
180,500 0.039 7,010 399,800 0.031 12,350 580,300 0.033 19,360 85%
Batu Hijau, IndonesiaOpen Pit(17) . . . . . . . . . . . . . 45% 132,700 0.013 1,780 246,200 0.008 2,050 378,900 0.010 3,830 77%Stockpiles(9) (17) . . . . . . . . . . 45% — — — 114,300 0.004 410 114,300 0.004 410 64%
132,700 0.013 1,780 360,500 0.007 2,460 493,200 0.009 4,240 76%
GhanaAhafo(18) . . . . . . . . . . . . . . . 100% — — — 124,000 0.078 9,720 124,000 0.078 9,720 87%Akyem(19) . . . . . . . . . . . . . . 100% — — — 147,200 0.052 7,660 147,200 0.052 7,660 89%
— — — 271,200 0.064 17,380 271,200 0.064 17,380 88%
Other OperationsKori Kollo, Bolivia(20) . . . . . 88% 7,800 0.018 140 17,400 0.016 280 25,200 0.017 420 59%La Herradura, Mexico(21) . . 44% 32,600 0.023 760 35,100 0.023 820 67,700 0.023 1,580 66%
40,400 0.022 900 52,500 0.021 1,100 92,900 0.022 2,000 65%
Total Gold . . . . . . . . . . . . . . . . . 497,900 0.035 17,610 2,160,500 0.032 68,920 2,658,400 0.033 86,530 80%
28

Deposits/DistrictsNewmont
Share
December 31, 2006
MetallurgicalRecovery(3)
Proven Reserves Probable ReservesProven and Probable
Reserves
Tonnage(2)
(000)Grade
(oz/ton)Ounces(3)
(000)Tonnage(2)
(000)Grade
(oz/ton)Ounces(3)
(000)Tonnage(2)
(000)Grade
(oz/ton)Ounces(3)
(000)
NevadaCarlin Open Pit . . . . . . . . . . 100% 25,900 0.069 1,780 245,700 0.040 9,750 271,600 0.042 11,530 74%Carlin Underground . . . . . . 100% 1,700 0.44 750 5,700 0.44 2,510 7,400 0.44 3,260 94%Midas . . . . . . . . . . . . . . . . . 100% 600 0.58 350 600 0.35 200 1,200 0.47 550 95%Phoenix . . . . . . . . . . . . . . . . 100% — — — 295,200 0.027 8,080 295,200 0.027 8,080 75%Turquoise Ridge . . . . . . . . . 25% 1,200 0.54 640 900 0.54 510 2,100 0.54 1,150 90%Twin Creeks . . . . . . . . . . . . 100% 15,500 0.084 1,300 49,300 0.075 3,680 64,800 0.077 4,980 81%Nevada In-Process(8) . . . . . . 100% 45,600 0.024 1,120 — — — 45,600 0.024 1,120 66%Nevada Stockpiles(9) . . . . . . 100% 29,100 0.080 2,330 2,500 0.045 110 31,600 0.077 2,440 76%
119,600 0.069 8,270 599,900 0.041 24,840 719,500 0.046 33,110 78%
Yanacocha, PeruConga . . . . . . . . . . . . . . . . . 51.35% — — — 317,200 0.019 6,080 317,200 0.019 6,080 79%Yanacocha In-Process(8) . . . 51.35% 24,000 0.028 670 — — — 24,000 0.028 670 71%Yanacocha Open Pits . . . . . 51.35% 28,500 0.020 560 249,300 0.031 7,750 277,800 0.030 8,310 68%
52,500 0.023 1,230 566,500 0.024 13,830 619,000 0.024 15,060 73%
Australia/New ZealandBoddington, Western
Australia . . . . . . . . . . . . . 66.67% 100,800 0.027 2,760 276,900 0.023 6,330 377,700 0.024 9,090 82%Jundee, Western
Australia . . . . . . . . . . . . . 100% 2,500 0.086 220 4,400 0.29 1,260 6,900 0.21 1,480 93%Kalgoorlie Open Pits
and Underground . . 50% 34,500 0.061 2,120 40,100 0.064 2,550 74,600 0.063 4,670 86%Kalgoorlie
Stockpiles(9) . . . . . . 50% 13,100 0.032 420 — — — 13,100 0.032 420 79%
Total Kalgoorlie, WesternAustralia . . . . . . . . . . . . . 50% 47,600 0.053 2,540 40,100 0.064 2,550 87,700 0.058 5,090 85%
Pajingo, Queensland(22) . . . . 100% 600 0.31 170 700 0.17 130 1,300 0.23 300 96%Tanami Underground
and Open Pits . . . . . 100% 5,100 0.16 800 7,100 0.15 1,060 12,200 0.15 1,860 95%Tanami
Stockpiles(9) . . . . . . 100% 400 0.084 40 2,600 0.032 80 3,000 0.039 120 95%
Total Tanami, NorthernTerritory . . . . . . . . . . . . . 100% 5,500 0.15 840 9,700 0.12 1,140 15,200 0.13 1,980 95%
Waihi, New Zealand . . . . . . 100% — — — 4,100 0.14 560 4,100 0.14 560 90%
157,000 0.042 6,530 335,900 0.036 11,970 492,900 0.038 18,500 86%
Batu Hijau, IndonesiaOpen Pit . . . . . . . . . . . . . . . 52.875% 106,100 0.015 1,540 266,100 0.011 2,960 372,200 0.012 4,500 80%Stockpiles(9) . . . . . . . . . . . . 52.875% — — — 145,800 0.004 540 145,800 0.004 540 67%
106,100 0.015 1,540 411,900 0.009 3,500 518,000 0.010 5,040 79%
GhanaAhafo . . . . . . . . . . . . . . . . . 100% — — — 163,800 0.078 12,620 163,800 0.078 12,620 87%Akyem . . . . . . . . . . . . . . . . 100% — — — 147,200 0.052 7,660 147,200 0.052 7,660 89%
— — — 311,000 0.065 20,280 311,000 0.065 20,280 88%
Other OperationsKori Kollo, Bolivia . . . . . . . 88% 20,300 0.004 80 21,500 0.018 390 41,800 0.011 470 61%La Herradura, Mexico . . . . 44% 27,000 0.020 540 37,500 0.023 850 64,500 0.022 1,390 66%
47,300 0.013 620 59,000 0.021 1,240 106,300 0.017 1,860 65%
Total Gold . . . . . . . . . . . . . . . . . 482,500 0.038 18,190 2,284,200 0.033 75,660 2,766,700 0.034 93,850 81%
29
(1) The term “reserve” means that part of a mineral deposit that can be economically and legally extracted or produced at the time of thereserve determination.The term “economically,” as used in the definition of reserve, means that profitable extraction or production has been established oranalytically demonstrated in a full feasibility study to be viable and justifiable under reasonable investment and market assumptions.The term “legally,” as used in the definition of reserve, does not imply that all permits needed for mining and processing have beenobtained or that other legal issues have been completely resolved. However, for a reserve to exist, Newmont must have a justifiableexpectation, based on applicable laws and regulations, that issuance of permits or resolution of legal issues necessary for mining andprocessing at a particular deposit will be accomplished in the ordinary course and in a timeframe consistent with Newmont’s currentmine plans.The term “proven reserves” means reserves for which (a) quantity is computed from dimensions revealed in outcrops, trenches, workingsor drill holes; (b) grade and/or quality are computed from the results of detailed sampling; and (c) the sites for inspection, sampling andmeasurements are spaced so closely and the geologic character is sufficiently defined that size, shape, depth and mineral content ofreserves are well established.The term “probable reserves” means reserves for which quantity and grade are computed from information similar to that used for provenreserves, but the sites for sampling are farther apart or are otherwise less adequately spaced. The degree of assurance, although lowerthan that for proven reserves, is high enough to assume continuity between points of observation.Proven and probable equity reserves were calculated using different cut-off grades. The term “cut-off grade” means the lowest grade ofmineralized material that can be included in the reserves in a given deposit. Cut-off grades vary between deposits depending uponprevailing economic conditions, mineability of the deposit, by-products, amenability of the ore to gold or copper extraction, and type ofmilling or leaching facilities available.2007 reserves were calculated at a $575, A$750 or NZ$850 per ounce gold price unless otherwise noted.2006 reserves were calculated at a $500, A$675 or NZ$750 per ounce gold price unless otherwise noted.
(2) Tonnages include allowances for losses resulting from mining methods. Tonnages are rounded to the nearest 100,000.(3) Ounces or pounds are estimates of metal contained in ore tonnages and do not include allowances for processing losses. Metallurgical
recovery rates represent the estimated amount of metal to be recovered through metallurgical extraction processes. Ounces are rounded tothe nearest 10,000.
(4) Cut-off grades utilized in Nevada 2007 reserves were as follows: oxide leach material not less than 0.006 ounce per ton; oxide millmaterial not less than 0.040 ounce per ton; refractory leach material not less than 0.025 ounce per ton; and refractory mill material notless than 0.047 ounce per ton.
(5) Includes undeveloped reserves at Castle Reef, North Lantern and Emigrant deposits for combined total undeveloped reserves of1.5 million ounces.
(6) Also contains reserves of 7.5 million ounces of silver with a metallurgical recovery of 88%.(7) Reserve estimates provided by Barrick, the operator of the Turquoise Ridge Joint Venture.(8) In-process material is the material on leach pads at the end of the year from which gold remains to be recovered. In-process material
reserves are reported separately where tonnage or contained ounces are greater than 5% of the total site-reported reserves and containedounces are greater than 100,000.
(9) Stockpiles are comprised primarily of material that has been set aside to allow processing of higher grade material in the mills. Stockpilesincrease or decrease depending on current mine plans. Stockpile reserves are reported separately where tonnage or contained ounces aregreater than 5% of the total site-reported reserves and contained ounces are greater than 100,000.
(10) Deposit is currently undeveloped. Gold cut-off grade is not applicable due to reliance on copper credits.(11) Reserves include the currently undeveloped deposit at Corimayo, which contains reserves of 2.5 million equity ounces. Cut-off grades
utilized in 2007 reserves were as follows: oxide leach material not less than 0.004 ounce per ton; and oxide mill material not less than0.030 ounce per ton.
(12) Deposit is currently being developed. Mill startup is expected in late 2008 or early 2009. Gold cut-off grade is not applicable due toreliance on copper credits.
(13) Cut-off grade utilized in 2007 reserves not less than 0.020 ounce per ton.(14) Cut-off grade utilized in 2007 reserves not less than 0.026 ounce per ton.(15) Cut-off grade utilized in 2007 reserves not less than 0.031 ounce per ton.(16) Cut-off grade utilized in 2007 reserves not less than 0.023 ounce per ton.(17) Percentage reflects Newmont’s economic interest at December 31, 2007. On May 25, 2007, the minority owner of the Batu Hijau mine
fully repaid a loan from a Newmont subsidiary. As a result of the loan repayment, Newmont’s economic interest was reduced from52.875% to 45%. Gold cut-off grade is not applicable due to reliance on copper credits.
(18) Includes undeveloped reserves at Awonsu, Amoma, Yamfo South, Yamfo Central, Techire West, Subenso South, Subenso North, YamfoNortheast and Susuan totaling 5.3 million ounces. Cut-off grade utilized in 2007 reserves not less than 0.029 ounce per ton.
(19) Deposit is undeveloped. Cut-off grade utilized in 2007 reserves not less than 0.012 ounce per ton.(20) Cut-off grade utilized in 2007 reserves not less than 0.007 ounce per ton.(21) Cut-off grade utilized in 2007 reserves not less than 0.009 ounce per ton.(22) Pajingo assets were sold in 2007.
30

The following tables detail copper proven and probable equity reserves(1) reflecting only those reservesowned by Newmont as of December 31, 2007 and 2006:
Deposits/DistrictsNewmont
Share
December 31, 2007
MetallurgicalRecovery(3)
Proven Reserves Probable Reserves Proven and Probable Reserves
Tonnage(2)
(000)Grade(Cu %)
Pounds(3)
(millions)Tonnage(2)
(000)Grade(Cu %)
Pounds(3)
(millions)Tonnage(2)
(000)Grade(Cu %)
Pounds(3)
(millions)
Batu HijauOpen Pit(4) . . 45% 132,700 0.50% 1,330 246,200 0.40% 1,970 378,900 0.43% 3,300 79%
Batu HijauStockpiles(4)(5) 45% — — — 114,300 0.36% 820 114,300 0.36% 820 64%
Total Batu Hijau,Indonesia(4) . . . 45% 132,700 0.50% 1,330 360,500 0.39% 2,790 493,200 0.42% 4,120 76%
Boddington,WesternAustralia(6) . . . . 66.67% 124,900 0.11% 280 351,600 0.11% 750 476,500 0.11% 1,030 83%
Conga, Peru(7) . . . 51.35% — — — 317,200 0.26% 1,660 317,200 0.26% 1,660 85%Phoenix,
Nevada . . . . . . . 100% — — — 279,600 0.13% 740 279,600 0.13% 740 66%
Total Copper . . . . . 257,600 0.31% 1,610 1,308,900 0.23% 5,940 1,566,500 0.24% 7,550 78%
Deposits/DistrictsNewmont
Share
December 31, 2006
MetallurgicalRecovery(3)
Proven Reserves Probable Reserves Proven and Probable Reserves
Tonnage(2)
(000)Grade(Cu %)
Pounds(3)
(millions)Tonnage(2)
(000)Grade(Cu %)
Pounds(3)
(millions)Tonnage(2)
(000)Grade(Cu %)
Pounds(3)
(millions)
Batu HijauOpen Pit . . . . 52.875% 106,100 0.53% 1,120 266,100 0.47% 2,530 372,200 0.49% 3,650 85%
Batu HijauStockpiles(5) 52.875% — — — 145,800 0.37% 1,070 145,800 0.37% 1,070 72%
Total Batu Hijau,Indonesia . . . . . 52.875% 106,100 0.53% 1,120 411,900 0.44% 3,600 518,000 0.46% 4,720 82%
Boddington,WesternAustralia(6) . . . . 66.67% 100,800 0.11% 230 276,600 0.11% 610 377,400 0.11% 840 83%
Conga, Peru(7) . . . 51.35% — — — 317,200 0.26% 1,660 317,200 0.26% 1,660 85%Phoenix,
Nevada . . . . . . . 100% — — — 296,600 0.13% 770 296,600 0.13% 770 65%
Total Copper . . . . . 206,900 0.33% 1,350 1,302,300 0.25% 6,640 1,509,200 0.26% 7,990 81%
(1) See footnote (1) to the Gold Proven and Probable Equity Reserves tables above. Copper reserves for 2007 werecalculated at a $1.75 or A$2.00 per pound copper price. Copper reserves for 2006 were calculated at a $1.25 or A$1.70per pound copper price.
(2) See footnote (2) to the Gold Proven and Probable Equity Reserves tables above. Tonnages are rounded to nearest100,000.
(3) See footnote (3) to the Gold Proven and Probable Equity Reserves tables above. Pounds are rounded to the nearest 10million.
(4) Percentage reflects Newmont’s economic interest at December 31, 2007. On May 25, 2007, the minority owner of theBatu Hijau mine fully repaid a loan from a Newmont subsidiary. As a result of the loan repayment, Newmont’seconomic interest was reduced from 52.875% to 45%. Copper cut-off grade is not applicable due to reliance on goldcredits.
(5) Stockpiles are comprised primarily of material that has been set aside to allow processing of higher grade material in themills. Stockpiles increase or decrease depending on current mine plans. Stockpiles are reported separately where tonnageor contained metal are greater than 5% of the total site reported reserves.
(6) Deposit is currently being developed. Mill startup is expected in late 2008 or early 2009. Copper cut-off grade is notapplicable due to reliance on gold credits.
(7) Deposit is undeveloped. Copper cut-off grade is not applicable due to reliance on gold credits.
31
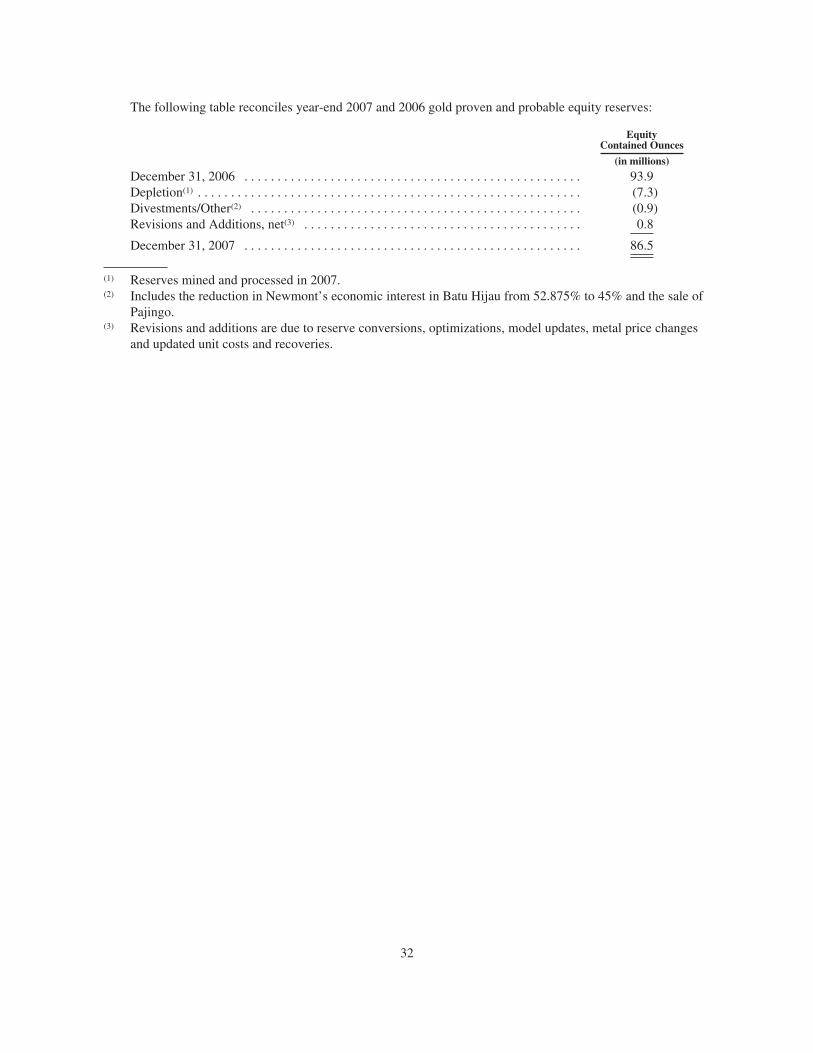
The following table reconciles year-end 2007 and 2006 gold proven and probable equity reserves:
EquityContained Ounces
(in millions)
December 31, 2006 . . . . . . . . . . . . . . . . . . . . . . . . . . . . . . . . . . . . . . . . . . . . . . . . . . . 93.9Depletion(1) . . . . . . . . . . . . . . . . . . . . . . . . . . . . . . . . . . . . . . . . . . . . . . . . . . . . . . . . . . (7.3)Divestments/Other(2) . . . . . . . . . . . . . . . . . . . . . . . . . . . . . . . . . . . . . . . . . . . . . . . . . . (0.9)Revisions and Additions, net(3) . . . . . . . . . . . . . . . . . . . . . . . . . . . . . . . . . . . . . . . . . . 0.8
December 31, 2007 . . . . . . . . . . . . . . . . . . . . . . . . . . . . . . . . . . . . . . . . . . . . . . . . . . . 86.5
(1) Reserves mined and processed in 2007.(2) Includes the reduction in Newmont’s economic interest in Batu Hijau from 52.875% to 45% and the sale of
Pajingo.(3) Revisions and additions are due to reserve conversions, optimizations, model updates, metal price changes
and updated unit costs and recoveries.
32
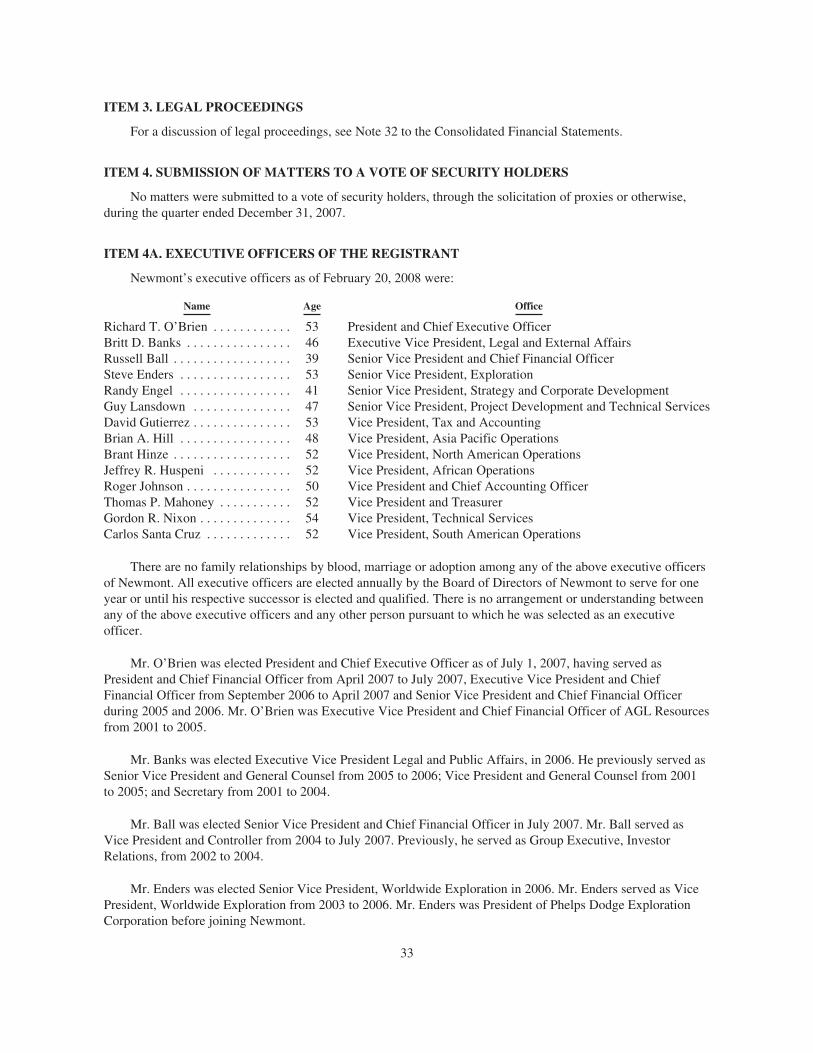
ITEM 3. LEGAL PROCEEDINGS
For a discussion of legal proceedings, see Note 32 to the Consolidated Financial Statements.
ITEM 4. SUBMISSION OF MATTERS TO A VOTE OF SECURITY HOLDERS
No matters were submitted to a vote of security holders, through the solicitation of proxies or otherwise,during the quarter ended December 31, 2007.
ITEM 4A. EXECUTIVE OFFICERS OF THE REGISTRANT
Newmont’s executive officers as of February 20, 2008 were:
Name Age Office
Richard T. O’Brien . . . . . . . . . . . . 53 President and Chief Executive OfficerBritt D. Banks . . . . . . . . . . . . . . . . 46 Executive Vice President, Legal and External AffairsRussell Ball . . . . . . . . . . . . . . . . . . 39 Senior Vice President and Chief Financial OfficerSteve Enders . . . . . . . . . . . . . . . . . 53 Senior Vice President, ExplorationRandy Engel . . . . . . . . . . . . . . . . . 41 Senior Vice President, Strategy and Corporate DevelopmentGuy Lansdown . . . . . . . . . . . . . . . 47 Senior Vice President, Project Development and Technical ServicesDavid Gutierrez . . . . . . . . . . . . . . . 53 Vice President, Tax and AccountingBrian A. Hill . . . . . . . . . . . . . . . . . 48 Vice President, Asia Pacific OperationsBrant Hinze . . . . . . . . . . . . . . . . . . 52 Vice President, North American OperationsJeffrey R. Huspeni . . . . . . . . . . . . 52 Vice President, African OperationsRoger Johnson . . . . . . . . . . . . . . . . 50 Vice President and Chief Accounting OfficerThomas P. Mahoney . . . . . . . . . . . 52 Vice President and TreasurerGordon R. Nixon . . . . . . . . . . . . . . 54 Vice President, Technical ServicesCarlos Santa Cruz . . . . . . . . . . . . . 52 Vice President, South American Operations
There are no family relationships by blood, marriage or adoption among any of the above executive officersof Newmont. All executive officers are elected annually by the Board of Directors of Newmont to serve for oneyear or until his respective successor is elected and qualified. There is no arrangement or understanding betweenany of the above executive officers and any other person pursuant to which he was selected as an executiveofficer.
Mr. O’Brien was elected President and Chief Executive Officer as of July 1, 2007, having served asPresident and Chief Financial Officer from April 2007 to July 2007, Executive Vice President and ChiefFinancial Officer from September 2006 to April 2007 and Senior Vice President and Chief Financial Officerduring 2005 and 2006. Mr. O’Brien was Executive Vice President and Chief Financial Officer of AGL Resourcesfrom 2001 to 2005.
Mr. Banks was elected Executive Vice President Legal and Public Affairs, in 2006. He previously served asSenior Vice President and General Counsel from 2005 to 2006; Vice President and General Counsel from 2001to 2005; and Secretary from 2001 to 2004.
Mr. Ball was elected Senior Vice President and Chief Financial Officer in July 2007. Mr. Ball served asVice President and Controller from 2004 to July 2007. Previously, he served as Group Executive, InvestorRelations, from 2002 to 2004.
Mr. Enders was elected Senior Vice President, Worldwide Exploration in 2006. Mr. Enders served as VicePresident, Worldwide Exploration from 2003 to 2006. Mr. Enders was President of Phelps Dodge ExplorationCorporation before joining Newmont.
33
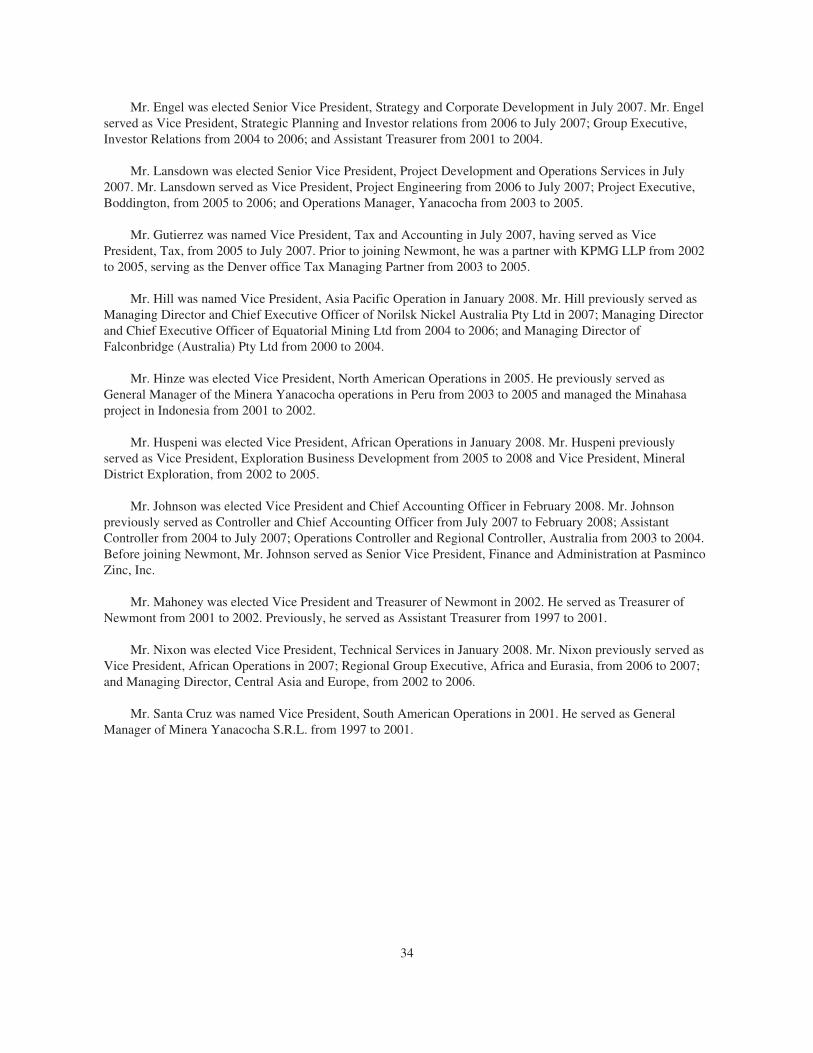
Mr. Engel was elected Senior Vice President, Strategy and Corporate Development in July 2007. Mr. Engelserved as Vice President, Strategic Planning and Investor relations from 2006 to July 2007; Group Executive,Investor Relations from 2004 to 2006; and Assistant Treasurer from 2001 to 2004.
Mr. Lansdown was elected Senior Vice President, Project Development and Operations Services in July2007. Mr. Lansdown served as Vice President, Project Engineering from 2006 to July 2007; Project Executive,Boddington, from 2005 to 2006; and Operations Manager, Yanacocha from 2003 to 2005.
Mr. Gutierrez was named Vice President, Tax and Accounting in July 2007, having served as VicePresident, Tax, from 2005 to July 2007. Prior to joining Newmont, he was a partner with KPMG LLP from 2002to 2005, serving as the Denver office Tax Managing Partner from 2003 to 2005.
Mr. Hill was named Vice President, Asia Pacific Operation in January 2008. Mr. Hill previously served asManaging Director and Chief Executive Officer of Norilsk Nickel Australia Pty Ltd in 2007; Managing Directorand Chief Executive Officer of Equatorial Mining Ltd from 2004 to 2006; and Managing Director ofFalconbridge (Australia) Pty Ltd from 2000 to 2004.
Mr. Hinze was elected Vice President, North American Operations in 2005. He previously served asGeneral Manager of the Minera Yanacocha operations in Peru from 2003 to 2005 and managed the Minahasaproject in Indonesia from 2001 to 2002.
Mr. Huspeni was elected Vice President, African Operations in January 2008. Mr. Huspeni previouslyserved as Vice President, Exploration Business Development from 2005 to 2008 and Vice President, MineralDistrict Exploration, from 2002 to 2005.
Mr. Johnson was elected Vice President and Chief Accounting Officer in February 2008. Mr. Johnsonpreviously served as Controller and Chief Accounting Officer from July 2007 to February 2008; AssistantController from 2004 to July 2007; Operations Controller and Regional Controller, Australia from 2003 to 2004.Before joining Newmont, Mr. Johnson served as Senior Vice President, Finance and Administration at PasmincoZinc, Inc.
Mr. Mahoney was elected Vice President and Treasurer of Newmont in 2002. He served as Treasurer ofNewmont from 2001 to 2002. Previously, he served as Assistant Treasurer from 1997 to 2001.
Mr. Nixon was elected Vice President, Technical Services in January 2008. Mr. Nixon previously served asVice President, African Operations in 2007; Regional Group Executive, Africa and Eurasia, from 2006 to 2007;and Managing Director, Central Asia and Europe, from 2002 to 2006.
Mr. Santa Cruz was named Vice President, South American Operations in 2001. He served as GeneralManager of Minera Yanacocha S.R.L. from 1997 to 2001.
34

PART II
ITEM 5. MARKET FOR REGISTRANT’S COMMON EQUITY, RELATED STOCKHOLDERMATTERS AND ISSUER PURCHASE OF EQUITY SECURITIES
Newmont’s common stock is listed and principally traded on the New York Stock Exchange (under thesymbol “NEM”) and is also listed in the form of CHESS Depositary Interests (“CDIs”) (under the symbol“NEM”) on the Australian Stock Exchange (“ASX”). In Australia, Newmont is referred to as “Newmont MiningCorporation ARBN 099 065 997 organized in Delaware with limited liability.” Since July 1, 2002, NewmontCDIs have traded on the ASX as a Foreign Exempt Listing granted by the ASX, which provides an ancillarytrading facility to Newmont’s primary listing on NYSE. Newmont Mining Corporation of Canada Limited’sexchangeable shares (“Exchangeable Shares”) are listed on the Toronto Stock Exchange (under the symbol“NMC”). The following table sets forth, for the periods indicated, the closing high and low sales prices per shareof Newmont’s common stock as reported on the New York Stock Exchange Composite Tape.
2007 2006
High Low High Low
First quarter . . . . . . . . . . . . . . . . . . . . . . . . . . . . . . . . . . . . . . . $47.71 $41.42 $61.95 $47.79Second quarter . . . . . . . . . . . . . . . . . . . . . . . . . . . . . . . . . . . . . $45.00 $38.53 $58.43 $47.72Third quarter . . . . . . . . . . . . . . . . . . . . . . . . . . . . . . . . . . . . . . $48.26 $39.44 $55.52 $42.75Fourth quarter . . . . . . . . . . . . . . . . . . . . . . . . . . . . . . . . . . . . . $54.50 $44.75 $47.57 $40.83
On February 14, 2008, there were outstanding 435,838,958 shares of Newmont’s common stock (includingshares represented by CDIs), which were held by approximately 15,410 stockholders of record. A dividend of$0.10 per share of common stock outstanding was declared in each quarter of 2007 and 2006, for a total of $0.40during each year.
On February 14, 2008, there were outstanding 17,449,759 Exchangeable Shares, which were held by 46holders of record. The Exchangeable Shares are exchangeable at the option of the holders into Newmontcommon stock. Holders of Exchangeable Shares are therefore entitled to receive dividends equivalent to thosethat Newmont declares on its common stock.
The determination of the amount of future dividends will be made by Newmont’s Board of Directors fromtime to time and will depend on Newmont’s future earnings, capital requirements, financial condition and otherrelevant factors.
Issuer purchase of equity securities:
Period
(a)Total
Numberof Shares
Purchased
(b)Average
Price PaidPer Share
(c)Total Number
of SharesPurchased as
Part ofPublicly
AnnouncedPlans or
Programs
(d)Maximum Number
(or ApproximateDollar Value) ofShares that mayyet be Purchased
under the Plans orPrograms
October 1, 2007 through October 31, 2007 . . . . . . . . . . . 870(1) $47.20 — N/ANovember 1, 2007 through November 30, 2007 . . . . . . . — $ — — N/ADecember 1, 2007 through December 31, 2007 . . . . . . . . 984(1) $49.27 — N/A
(1) Represents shares delivered to the Company from restricted stock held by a Company employee uponvesting for purposes of covering the recipient’s tax withholding obligation.
35

ITEM 6. SELECTED FINANCIAL DATA (dollars in millions, except per share)
Years Ended December 31,
2007 2006 2005 2004(1) 2003
Revenues . . . . . . . . . . . . . . . . . . . . . . . . . . . . . . . . . . . . . . . . $ 5,526 $ 4,882 $ 4,265 $ 4,222 $ 2,792(Loss) income from continuing operations . . . . . . . . . . . . . . $ (963) $ 563 $ 278 $ 416 $ 388Net (loss) income applicable to common shares(2)(3) . . . . . . . $ (1,886) $ 791 $ 322 $ 443 $ 476Basic (loss) income per common share:
From continuing operations . . . . . . . . . . . . . . . . . . . . . . $ (2.13) $ 1.25 $ 0.62 $ 0.94 $ 0.95Discontinued operations . . . . . . . . . . . . . . . . . . . . . . . . . (2.04) 0.51 0.10 0.17 0.29Cumulative effect of a change in accounting
principle . . . . . . . . . . . . . . . . . . . . . . . . . . . . . . . . . . . — — — (0.11) (0.08)
Net (loss) income per common share, basic . . . . . . . . . . $ (4.17) $ 1.76 $ 0.72 $ 1.00 $ 1.16
Diluted (loss) income per common share:From continuing operations . . . . . . . . . . . . . . . . . . . . . . $ (2.13) $ 1.25 $ 0.62 $ 0.93 $ 0.94Discontinued operations . . . . . . . . . . . . . . . . . . . . . . . . . (2.04) 0.51 0.10 0.17 0.29Cumulative effect of a change in accounting
principle . . . . . . . . . . . . . . . . . . . . . . . . . . . . . . . . . . . — — — (0.11) (0.08)
Net (loss) income per common share, diluted . . . . . . . . $ (4.17) $ 1.76 $ 0.72 $ 0.99 $ 1.15
Dividends declared per common share . . . . . . . . . . . . . . . . . $ 0.40 $ 0.40 $ 0.40 $ 0.30 $ 0.17
At December 31,
2007 2006 2005 2004(1) 2003
Total assets . . . . . . . . . . . . . . . . . . . . . . . . . . . . . . . . . . . . . . . $15,598 $15,601 $13,992 $12,776 $10,698Long-term debt, including current portion . . . . . . . . . . . . . . . $ 2,938 $ 1,911 $ 1,918 $ 1,590 $ 1,065Stockholders’ equity . . . . . . . . . . . . . . . . . . . . . . . . . . . . . . . . $ 7,548 $ 9,337 $ 8,376 $ 7,938 $ 7,385
(1) Effective January 1, 2004, the Company consolidated Batu Hijau.(2) Net income includes the cumulative effect of a change in accounting principle related to a net expense for
the consolidation of Batu Hijau of $47 ($0.11 per share, basic) net of tax and minority interest in 2004; anda net expense for reclamation and remediation of $35 ($0.08 per share, basic), net of tax, in 2003.
(3) Net (loss) income includes income (loss) from discontinued operations for Merchant Banking, Pajingo,Zarafshan, Holloway and Golden Grove of ($923) ($2.04 per share, basic), $228 ($0.51 per share, basic),$44 ($0.10 per share, basic), $74 ($0.17 per share, basic) and $123 ($0.29 per share, basic) net of tax in2007, 2006, 2005, 2004 and 2003, respectively.
36

ITEM 7. MANAGEMENT’S DISCUSSION AND ANALYSIS OF CONSOLIDATED FINANCIALCONDITION AND RESULTS OF OPERATIONS (dollars in millions, except per share, per ounce andper pound amounts)
The following discussion provides information that management believes is relevant to an assessment andunderstanding of the consolidated financial condition and results of operations of Newmont Mining Corporationand its subsidiaries (collectively, “Newmont” or the “Company”). References to “A$” refer to Australiancurrency, “CDN$” to Canadian currency, “NZD$” to New Zealand currency, “IDR” to Indonesian currency and“$” to United States currency.
This discussion addresses matters we consider important for an understanding of our financial condition andresults of operations as of and for the three years ended December 31, 2007, as well as our future results. Itconsists of the following subsections:
• “Overview,” which provides a brief summary of our consolidated results and financial position and theprimary factors affecting those results, as well as a summary of our expectations for 2008;
• “Accounting Developments,” which provides a discussion of recent changes to our accounting policiesthat have affected our consolidated results and financial position;
• “Critical Accounting Policies,” which provides an analysis of the accounting policies we considercritical because of their effect on the reported amounts of assets, liabilities, income and/or expenses inour consolidated financial statements and/or because they require difficult, subjective or complexjudgments by our management;
• “Consolidated Financial Results,” which includes a discussion of our consolidated financial results forthe last three years;
• “Results of Consolidated Operations,” which sets forth an analysis of the operating results for the lastthree years;
• “Recent Accounting Pronouncements and Developments,” which summarizes recently publishedauthoritative accounting guidance, how it might apply to us and how it might affect our future results;and
• “Liquidity and Capital Resources,” which contains a discussion of our cash flows and liquidity,investing activities and financing activities, contractual obligations and off-balance sheet arrangements.
This item should be read in conjunction with our consolidated financial statements and the notes theretoincluded in this annual report.
Overview
Newmont is one of the world’s largest gold producers and is the only gold company included in the S&P500 Index, Fortune 500 and in the Dow Jones Sustainability Index-World. We are also engaged in the explorationfor and acquisition of gold properties. We have significant assets or operations in the United States, Australia,Peru, Indonesia, Canada, Bolivia, New Zealand, Ghana and Mexico.
We face key risks associated with our business. One of the most significant risks is fluctuation in the pricesof gold and copper, which are affected by numerous factors beyond our control. Other challenges we face includecapital and production cost increases and social and environmental issues. Operating costs at our mines aresubject to variation due to a number of factors, such as changing ore grades, metallurgy, revisions to mine plansand changes in accounting principles. At foreign locations, such costs are also influenced by currencyfluctuations that may affect our U.S. dollar operating costs. In addition, we must continually replace reservesdepleted through production by expanding known ore bodies, by acquisition or by locating new deposits in orderto maintain production levels over the long term.
37
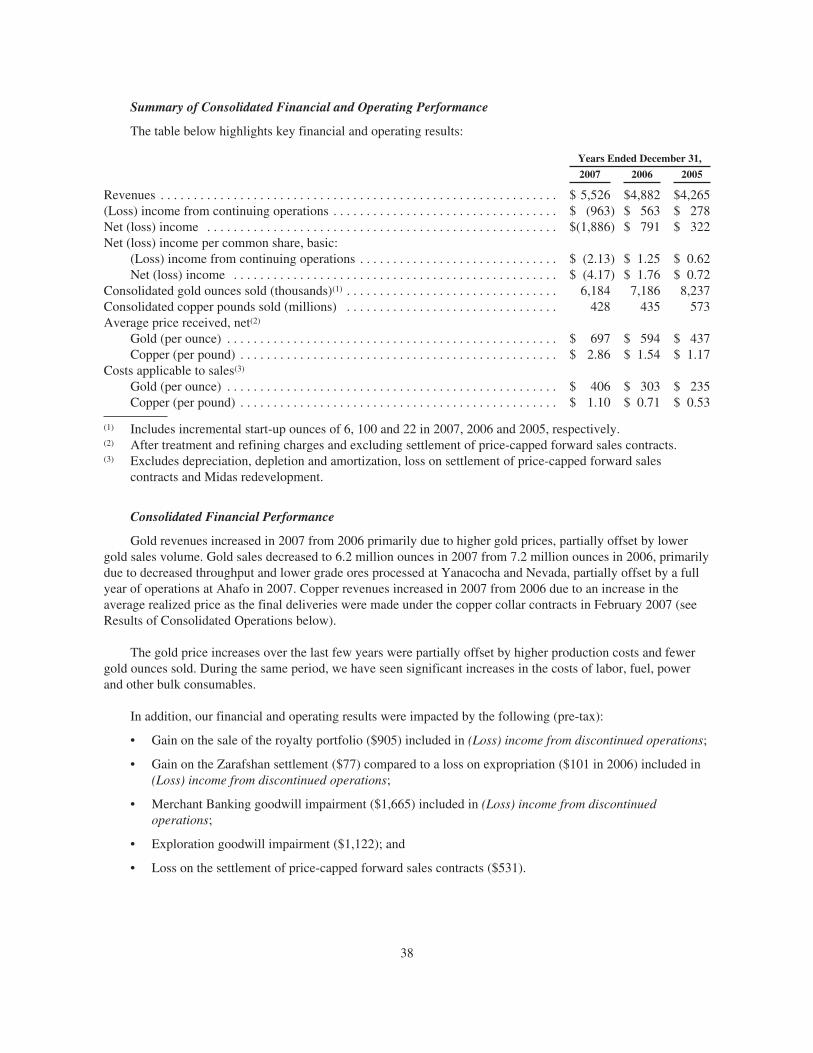
Summary of Consolidated Financial and Operating Performance
The table below highlights key financial and operating results:
Years Ended December 31,
2007 2006 2005
Revenues . . . . . . . . . . . . . . . . . . . . . . . . . . . . . . . . . . . . . . . . . . . . . . . . . . . . . . . . . . . . $ 5,526 $4,882 $4,265(Loss) income from continuing operations . . . . . . . . . . . . . . . . . . . . . . . . . . . . . . . . . . $ (963) $ 563 $ 278Net (loss) income . . . . . . . . . . . . . . . . . . . . . . . . . . . . . . . . . . . . . . . . . . . . . . . . . . . . . $(1,886) $ 791 $ 322Net (loss) income per common share, basic:
(Loss) income from continuing operations . . . . . . . . . . . . . . . . . . . . . . . . . . . . . . $ (2.13) $ 1.25 $ 0.62Net (loss) income . . . . . . . . . . . . . . . . . . . . . . . . . . . . . . . . . . . . . . . . . . . . . . . . . $ (4.17) $ 1.76 $ 0.72
Consolidated gold ounces sold (thousands)(1) . . . . . . . . . . . . . . . . . . . . . . . . . . . . . . . . 6,184 7,186 8,237Consolidated copper pounds sold (millions) . . . . . . . . . . . . . . . . . . . . . . . . . . . . . . . . 428 435 573Average price received, net(2)
Gold (per ounce) . . . . . . . . . . . . . . . . . . . . . . . . . . . . . . . . . . . . . . . . . . . . . . . . . . $ 697 $ 594 $ 437Copper (per pound) . . . . . . . . . . . . . . . . . . . . . . . . . . . . . . . . . . . . . . . . . . . . . . . . $ 2.86 $ 1.54 $ 1.17
Costs applicable to sales(3)
Gold (per ounce) . . . . . . . . . . . . . . . . . . . . . . . . . . . . . . . . . . . . . . . . . . . . . . . . . . $ 406 $ 303 $ 235Copper (per pound) . . . . . . . . . . . . . . . . . . . . . . . . . . . . . . . . . . . . . . . . . . . . . . . . $ 1.10 $ 0.71 $ 0.53
(1) Includes incremental start-up ounces of 6, 100 and 22 in 2007, 2006 and 2005, respectively.(2) After treatment and refining charges and excluding settlement of price-capped forward sales contracts.(3) Excludes depreciation, depletion and amortization, loss on settlement of price-capped forward sales
contracts and Midas redevelopment.
Consolidated Financial Performance
Gold revenues increased in 2007 from 2006 primarily due to higher gold prices, partially offset by lowergold sales volume. Gold sales decreased to 6.2 million ounces in 2007 from 7.2 million ounces in 2006, primarilydue to decreased throughput and lower grade ores processed at Yanacocha and Nevada, partially offset by a fullyear of operations at Ahafo in 2007. Copper revenues increased in 2007 from 2006 due to an increase in theaverage realized price as the final deliveries were made under the copper collar contracts in February 2007 (seeResults of Consolidated Operations below).
The gold price increases over the last few years were partially offset by higher production costs and fewergold ounces sold. During the same period, we have seen significant increases in the costs of labor, fuel, powerand other bulk consumables.
In addition, our financial and operating results were impacted by the following (pre-tax):
• Gain on the sale of the royalty portfolio ($905) included in (Loss) income from discontinued operations;
• Gain on the Zarafshan settlement ($77) compared to a loss on expropriation ($101 in 2006) included in(Loss) income from discontinued operations;
• Merchant Banking goodwill impairment ($1,665) included in (Loss) income from discontinuedoperations;
• Exploration goodwill impairment ($1,122); and
• Loss on the settlement of price-capped forward sales contracts ($531).
38

Acquisition of Miramar
On October 9, 2007, the Company announced the proposed acquisition of Miramar Mining Corporation(“Miramar”) and offered to acquire all of the outstanding common shares of Miramar for C$6.25 in cash. OnDecember 27, 2007, 155 million common shares of Miramar had been validly deposited to Newmont’s offer.Newmont took up, accepted and paid for such shares, representing approximately 70% of the common shares ofMiramar which, in addition to the 18 million shares previously owned by the Company, brought the Company’sinterest in Miramar to approximately 78%. Miramar is a Canadian company that controls the Hope Bay project, alarge undeveloped gold project in Nunavut, Canada. The Hope Bay Project is consistent with the Company’sstrategic focus on exploration and project development and was acquired with the intention of adding highergrade ore reserves and developing a new core gold mining district in a AAA-rated country.
In January 2008, Newmont acquired approximately 40 million additional common shares of Miramar at aprice of C$6.25 per common share, bringing its interest in Miramar to 96%. This successfully completed theoffer to acquire all of the outstanding common shares of Miramar. Newmont has mailed a notice of compulsoryacquisition pursuant to the Business Corporations Act (British Columbia) to acquire all the remaining commonshares of Miramar that were not acquired pursuant to the offer.
Liquidity
The Company’s financial position was as follows:
December 31,
2007 2006
Total debt . . . . . . . . . . . . . . . . . . . . . . . . . . . . . . . . . . . . . . . . . . . . . . . . . . . . . . . . . . $2,938 $1,911Total stockholders’ equity . . . . . . . . . . . . . . . . . . . . . . . . . . . . . . . . . . . . . . . . . . . . . $7,548 $9,337Cash and cash equivalents . . . . . . . . . . . . . . . . . . . . . . . . . . . . . . . . . . . . . . . . . . . . . $1,231 $1,166Marketable securities . . . . . . . . . . . . . . . . . . . . . . . . . . . . . . . . . . . . . . . . . . . . . . . . $1,500 $1,353
During 2007 our debt and liquidity positions were affected by the following:
• Proceeds from the issuance of debt of $3,008, offset by $2,036 in repayments;
• Convertible note hedge transaction including the purchase of call options for $366, partially offset byissuance of warrants of $248;
• Net cash provided from continuing operations of $525 after settlement of the price-capped forward salescontracts of $578 and settlement of pre-acquisition tax contingency of Normandy of $276;
• Net proceeds from the sale of discontinued operations of $1,197 and net proceeds from the Zarafshansettlement of $77;
• Acquisition of approximately 70% of Miramar for $991 less cash received from the purchase of $38;
• Capital expenditures of $1,670;
• Dividends paid to common shareholders of $181; and
• Dividends paid to minority interests of $270.
Looking Forward
Certain key factors will affect our future financial and operating results. These include, but are not limitedto, the following:
• Fluctuations in gold prices and, to a lesser extent, copper prices;
• We expect 2008 consolidated gold sales of approximately 5.9 to 6.4 million ounces, primarily as a resultof lower production from Australia and Batu Hijau;
39
• Costs applicable to sales per ounce for 2008 are expected to be approximately $425 to $450 per ounceas the impact of industry-wide cost pressures are expected to be compounded by slightly lower goldproduction;
• We expect 2008 consolidated copper sales of approximately 345 to 365 million pounds at Costsapplicable to sales of approximately $1.30 to $1.40 per pound as mining shifts from the high gradebottom of the pit into a lower grade mine sequence during 2008 and 2009;
• We anticipate capital expenditures of approximately $1,800 to $2,000 in 2008, with approximately 50%in Australia/New Zealand, 25% in Nevada and the remaining 25% invested at other locations.Approximately $900 to $1,000 of the 2008 capital budget is allocated to sustaining investments, with theremaining $900 to $1,000 allocated to project development initiatives, including completion of theBoddington project in Australia, the power plant in Nevada and the Yanacocha gold mill in Peru;
• We expect 2008 exploration expenditures of approximately $220 to $230 and 2008 advanced projects,research and development expenditures of approximately $120 to $180;
• The construction of the Boddington project, the 200 megawatt coal-fired power plant in Nevada and thegold mill at Yanacocha, as well as potential future investments in the Hope Bay project in Canada, theAkyem project in Ghana and the Conga project in Peru will require significant funds for capitalexpenditures. At current gold and copper prices, new sources of capital will be needed to meet thefunding requirements of these investments, fund our ongoing business activities and pay dividends. Ourability to raise and service significant new sources of capital will be a function of macroeconomicconditions, future gold and copper prices and our operational performance, among other factors. In theevent of lower gold and copper prices, unanticipated operating or financial challenges, or new fundinglimitations, our ability to pursue new business opportunities, invest in existing and new projects, fundour ongoing business activities and pay dividends could be significantly constrained; and
• Our full-year 2008 expectations, particularly with respect to sales volumes and costs applicable to salesper ounce or pound, may differ significantly from actual quarter and full year results due to variationsin: ore grades and hardness, metal recoveries, waste removed, commodity input prices, foreigncurrencies and gold and copper sales prices (as impacting royalty and labor costs).
Accounting Developments
Income Taxes
The Company operates in numerous countries around the world and accordingly is subject to, and pays,annual income taxes under the various income tax regimes in the countries in which it operates. Some of thesetax regimes are defined by contractual agreements with the local government, and others are defined by thegeneral corporate income tax laws of the country. The Company has historically filed, and continues to file, allrequired income tax returns and to pay the taxes reasonably determined to be due. The tax rules and regulationsin many countries are highly complex and subject to interpretation. From time to time the Company is subject toa review of its historic income tax filings and in connection with such reviews, disputes can arise with the taxingauthorities over the interpretation or application of certain rules to the Company’s business conducted within thecountry involved.
The Company adopted the provisions of FASB Interpretation No. 48, “Accounting for Uncertainty inIncome Taxes,” (“FIN48”) an interpretation of FASB Statement No. 109, “Accounting for Income Taxes” onJanuary 1, 2007. FIN 48 clarifies the accounting and reporting for uncertainties in the application of the incometax laws to the Company’s operations. The interpretation prescribes a comprehensive model for the financialstatement recognition, measurement, presentation and disclosure of uncertain tax positions taken or expected tobe taken in income tax returns. The cumulative effects of applying this interpretation have been recorded as adecrease in retained earnings of $108, an increase of $5 in goodwill, an increase of $4 in minority interest, adecrease in net deferred tax assets of $37 (primarily, as a result of utilization of foreign tax credits and net
40

operating losses as part of the FIN 48 measurement process, offset, in part, by the impact of the interaction of theAlternative Minimum Tax rules) and an increase of $72 in the net liability for unrecognized income tax benefits.
Pensions
As of December 31, 2006, the Company adopted the provisions of FASB Statement No. 158, “Employers’Accounting for Defined Benefit Pension and Other Postretirement Plans—an amendment of FASB StatementsNo. 87, 88, 106, and 132(R)” (“FAS 158”). FAS 158 required employers that sponsor one or more definedbenefit plans to (i) recognize the funded status of a benefit plan in its statement of financial position,(ii) recognize the gains or losses and prior service costs or credits that arise during the period as a component ofother comprehensive income, net of tax, (iii) measure the defined benefit plan assets and obligations as of thedate of the employer’s fiscal year-end statement of financial position, and (iv) disclose in the notes to thefinancial statements additional information about certain effects on net periodic cost for the next fiscal year thatarise from delayed recognition of the gains or losses, prior service costs or credits, and transition asset orobligation. The impact of adopting FAS 158 on the Consolidated Balance Sheets as of December 31, 2006 was asfollows:
BeforeApplicationof FAS 158 Adjustment
AfterApplicationof FAS 158
Other long-term assets . . . . . . . . . . . . . . . . . . . . . . . . . . . . . . . $ 193 $(15) $ 178Total assets . . . . . . . . . . . . . . . . . . . . . . . . . . . . . . . . . . . . . . . . $15,616 $(15) $15,601Employee pension and other benefits . . . . . . . . . . . . . . . . . . . . $ 229 $ 27 $ 256Deferred income taxes . . . . . . . . . . . . . . . . . . . . . . . . . . . . . . . . $ 649 $(14) $ 635Accumulated other comprehensive income . . . . . . . . . . . . . . . $ 700 $(27) $ 673Total stockholders’ equity . . . . . . . . . . . . . . . . . . . . . . . . . . . . . $ 9,364 $(27) $ 9,337
Stock Based Compensation
On January 1, 2006, the Company adopted the fair value recognition provisions of FASB StatementNo. 123(R), “Share-Based Payment” (“FAS 123(R)”). The Company adopted FAS 123(R) using the modifiedprospective transition method. Under this method, compensation cost recognized in 2006 included: a)compensation cost for all share-based payments granted prior to, but not yet vested as of January 1, 2006, basedon the grant-date fair value estimated in accordance with the original provisions of FAS 123, and b)compensation cost for all share-based payments granted subsequent to January 1, 2006, based on the grant-datefair value estimated in accordance with the provisions of FAS 123(R).
As a result of adopting FAS 123(R), the Company’s Loss from continuing operations and Net loss for 2007was $11 ($0.02 per share) higher and Income from continuing operations and Net income for 2006 was $19($0.04 per share) lower, respectively, than if we had continued to account for share-based compensation underAPB 25 as we did prior to January 1, 2006. Prior to the adoption of FAS 123(R), cash retained as a result of taxdeductions relating to stock-based compensation was included in operating cash flows, along with other tax cashflows. FAS 123(R) requires tax benefits relating to the deductibility of increases in the equity instruments issuedunder share-based compensation arrangements that are not included in Costs applicable to sales (“excess taxbenefits”) to be presented in the Statement of Cash Flows as financing cash inflows. The benefit realized for taxdeductions from option exercises totaled $3 and $6 in 2007 and 2006, respectively.
Deferred Stripping Costs
On January 1, 2006 the Company adopted Emerging Issues Task Force Issue No. 04-06 (“EITF 04-06”),“Accounting for Stripping Costs Incurred during Production in the Mining Industry.” EITF 04-06 addresses theaccounting for stripping costs incurred during the production phase of a mine and refers to these costs as variableproduction costs that should be included as a component of inventory to be recognized in Costs applicable to
41

sales in the same period as the revenue from the sale of inventory. As a result, capitalization of post-productionstripping costs is appropriate only to the extent product inventory exists at the end of a reporting period. Theguidance required the recognition of a cumulative effect adjustment to opening retained earnings in the period ofadoption, with no charge to earnings in the period of adoption for prior periods. The cumulative effect adjustmentreduced retained earnings by $81 (net of tax and minority interests) and eliminated the $71 net deferred strippingasset from the balance sheet in 2006. Adoption of EITF 04-06 had no impact on the Company’s cash position ornet cash from operations.
Critical Accounting Policies
Listed below are the accounting policies that the Company believes are critical to its financial statementsdue to the degree of uncertainty regarding the estimates or assumptions involved and the magnitude of the asset,liability, revenue or expense being reported.
Carrying Value of Goodwill
As of December 31, 2007, the carrying value of goodwill was approximately $186. Goodwill represents theexcess of the aggregate purchase price over the fair value of the identifiable net assets. Goodwill was assigned tovarious mine site reporting units in the Australia/New Zealand Segment. Our approach to allocating goodwillwas to identify those reporting units that we believed had contributed to such excess purchase price. We thenperformed valuations to measure the incremental increases in the fair values of such reporting units that wereattributable to the acquisitions, and that were not already captured in the fair values assigned to such units’identifiable net assets.
We evaluate, on at least an annual basis, the carrying amount of goodwill to determine whether currentevents and circumstances indicate that such carrying amount may no longer be recoverable. To accomplish this,we compare the estimated fair values of the reporting units to their carrying amounts. If the carrying value of areporting unit exceeds its fair value at the time of the evaluation, we would compare the implied fair value of thereporting unit’s goodwill to its carrying amount and any shortfall would be charged to earnings. Assumptionsunderlying fair value estimates are subject to risks and uncertainties.
Mine Site Goodwill
The assignment of goodwill to mine site reporting units was based on synergies that have been incorporatedinto our operations and business plans over time. The amount of goodwill assigned to each segment or reportingunit was based on discounted cash flow analyses that assumed risk-adjusted discount rates over the remaininglives of the applicable mining operations. We believe that triggering events with respect to the goodwill assignedto mine site reporting units could include, but are not limited to: (i) a significant decrease in our long-term goldand copper price assumptions; (ii) a decrease in reserves; (iii) a significant reduction in the estimated fair valueof mine site exploration potential; and (iv) any event that might otherwise adversely affect mine site productionlevels or costs. We performed our annual impairment test of mine site goodwill as of December 31, 2007 anddetermined that the fair value of each mine site reporting unit was in excess of the relevant carrying value as ofDecember 31, 2007. For more information on the discounted cash flows used to value mine site reporting units,see Carrying Value of Long-Lived Assets, below.
Exploration Segment Goodwill
The Exploration Segment is responsible for all activities, whether near-mine or greenfield, associated withthe Company’s efforts to discover new mineralized material that could ultimately advance into proven andprobable reserves. As discussed in greater detail below, when performing its Exploration Segment goodwillimpairment testing, the Company uses historic additions to proven and probable reserves as an indication of theexpected future performance of the Exploration Segment.
42

The Exploration Segment’s valuation model attributes all cash flows expected to be derived from futuregreenfield exploration discoveries, to the Exploration Segment. The valuation model includes management’s bestestimates of future reserve additions from exploration activities and all revenues and costs associated with theirdiscovery, development and production. Historical proven and probable reserve additions, excluding acquisitions,are used as an indicator of the Exploration Segment’s ability to discover additional reserves in the future. Actualreserve additions may vary significantly from year to year due to the time required to advance a deposit frominitial discovery to proven and probable reserves and based on the timing of when proven and probable reservescan be reported under the Securities and Exchange Commission Industry Guide 7.
We performed our annual impairment test of the Exploration Segment goodwill during the fourth quarter of2007. Based on the Exploration Segment’s historic additions to proven and probable reserves and management’sbest estimates of future reserve additions from exploration activities and all revenues and costs associated withtheir discovery, development and production, the Exploration Segment’s estimated fair value was negligible. Thedecreased value attributable to the Exploration Segment resulted primarily from (i) a significantly lower assumedannual reserve growth rate (from 4% to 3%), (ii) a significant change in the financial markets resulting in asignificant increase in the discount rate (from 8% to 10%), and (iii) an increase in finding costs due to acombination of increased spending and reduced exploration success.
Based on the negligible valuation, the Exploration Segment goodwill was impaired and the full $1,122 ofgoodwill was recorded as a non-cash write-down of goodwill as of December 31, 2007.
Merchant Banking Goodwill
During June 2007, Newmont’s Board of Directors approved a plan to cease Merchant Banking activities.Merchant Banking previously provided advisory services to assist in managing the Company’s portfolio ofoperating and property interests. Merchant Banking was also engaged in developing value optimization strategiesfor operating and non-operating assets, business development activities, merger and acquisition analysis andnegotiations, monetizing inactive exploration properties, capitalizing on proprietary technology and know-howand acting as an internal resource for other corporate groups to improve and maximize business outcomes. As aresult of the Board’s approval of management’s plan to cease Merchant Banking activities, the Companyrecorded a $1,665 non-cash charge to impair the goodwill associated with the Merchant Banking Segment duringthe second quarter of 2007.
Depreciation, Depletion and Amortization
Expenditures for new facilities or equipment and expenditures that extend the useful lives of existingfacilities or equipment are capitalized and depreciated using the straight-line method at rates sufficient todepreciate such costs over the estimated future lives of such facilities or equipment. These lives do not exceedthe estimated mine life based on proven and probable reserves as the useful lives of these assets are considered tobe limited to the life of the relevant mine. During the second quarter of 2007, the Company revised its estimate ofhaul truck lives prospectively to ten years based on experience. The impact of the change in estimate was areduction of Depreciation, depletion and amortization which decreased the Company’s Loss from continuingoperations and Net loss by $13 ($0.03 per share) in 2007.
Costs incurred to develop new properties are capitalized as incurred, where it has been determined that theproperty can be economically developed based on the existence of proven and probable reserves. At our surfacemines, these costs include costs to further delineate the ore body and remove overburden to initially expose theore body. At our underground mines, these costs include the cost of building access ways, shaft sinking andaccess, lateral development, drift development, ramps and infrastructure development. All such costs areamortized using the units-of-production (“UOP”) method over the estimated life of the ore body based onestimated recoverable ounces to be produced from proven and probable reserves.
43

Major development costs incurred after the commencement of production are amortized using the UOPmethod based on estimated recoverable ounces to be produced from proven and probable reserves. To the extentthat such costs benefit the entire ore body, they are amortized over the estimated recoverable ounces or pounds inproven and probable reserves of the entire ore body. Costs incurred to access specific ore blocks on areas thatonly provide benefit over the life of that block or area are amortized over the estimated recoverable ounces orpounds in proven and probable reserves of that specific ore block or area.
The calculation of the UOP rate of amortization, and therefore the annual amortization charge to operations,could be materially impacted to the extent that actual production in the future is different from current forecastsof production based on proven and probable reserves. This would generally occur to the extent that there weresignificant changes in any of the factors or assumptions used in determining reserves. These factors couldinclude: (i) an expansion of proven and probable reserves through exploration activities; (ii) differences betweenestimated and actual costs of production, due to differences in grade, metal recovery rates and foreign currencyexchange rates; and (iii) differences between actual commodity prices and commodity price assumptions used inthe estimation of reserves. If reserves decreased significantly, amortization charged to operations would increase;conversely, if reserves increased significantly, amortization charged to operations would decrease. Such changesin reserves could similarly impact the useful lives of assets depreciated on a straight-line basis, where those livesare limited to the life of the mine, which in turn is limited to the life of the proven and probable reserves.
The expected useful lives used in depreciation, depletion and amortization calculations are determined basedon applicable facts and circumstances, as described above. Significant judgment is involved in the determinationof useful lives, and no assurance can be given that actual useful lives will not differ significantly from the usefullives assumed for the purpose of depreciation, depletion and amortization calculations.
Carrying Value of Stockpiles
Stockpiles represent ore that has been extracted from the mine and is available for further processing.Stockpiles are measured by estimating the number of tons added and removed from the stockpile, the number ofcontained ounces based on assay data, and the estimated recovery percentage based on the expected processingmethod. Stockpile tonnages are verified by periodic surveys. Stockpiles are valued based on mining costsincurred up to the point of stockpiling the ore, including applicable depreciation, depletion and amortizationrelating to mining operations. Costs are added to a stockpile based on current mining costs and removed at theaverage cost per recoverable ounce of gold or pound of copper in the stockpile. Stockpiles are reduced asmaterial is removed and processed further. The adoption of EITF 04-06 resulted in the allocation of deferred andadvanced stripping costs to stockpiles and the value of our stockpiles decreased from $532 as of December 31,2005 to $515 as of January 1, 2006. As of December 31, 2007 and 2006, our stockpiles had a total carrying valueof $732 and $742, respectively.
Costs that are incurred in or benefit from the productive process are accumulated as stockpiles. We recordstockpiles at the lower of average cost or net realizable value (“NRV”), and carrying values are evaluated at leastquarterly. NRV represents the estimated future sales price of the product based on prevailing and long-termmetals prices, less estimated costs to complete production and bring the product to sale. The primary factors thatinfluence the need to record write-downs of stockpiles include short-term and long-term metals prices and costsfor production inputs such as labor, fuel and energy, materials and supplies, as well as realized ore grades andactual production levels. If short-term and long-term metals prices decrease, the value of the stockpiles decreases,and it may be necessary to record a write-down of stockpiles to NRV. During 2007, 2006 and 2005, write-downsof stockpiles to NRV totaled $14, $2 and $9, respectively.
Cost allocation to stockpiles and the NRV measurement involves the use of estimates and assumptionsunique to each mining operation regarding current and future operating and capital costs, metal recoveries,production levels, commodity prices, proven and probable reserve quantities, engineering data and other factors.A high degree of judgment is involved in determining such assumptions and estimates and no assurance can begiven that actual results will not differ significantly from those estimates and assumptions.
44

Carrying Value of Long-Lived Assets
We review and evaluate our long-lived assets for impairment when events or changes in circumstancesindicate the related carrying amounts may not be recoverable. An asset impairment is considered to exist if thetotal estimated future cash flows on an undiscounted basis are less than the carrying amount of the asset,including goodwill, if any. An impairment loss is measured and recorded based on discounted estimated futurecash flows. Future cash flows are estimated based on estimated quantities of recoverable minerals, expected goldand other commodity prices (considering current and historical prices, price trends and related factors),production levels and costs of production, capital and reclamation costs, all based on life-of-mine plans. Thesignificant assumptions in determining the future discounted cash flows for each mine site reporting unit as ofDecember 31, 2007, apart from production cost and capitalized expenditure assumptions unique to eachoperation, included a long-term gold price of $700 per ounce, a long-term copper price of $2.25 per pound and anAustralian dollar exchange rate of A$1.25 per $1.00.
Existing proven and probable reserves and value beyond proven and probable reserves, includingmineralization other than proven and probable reserves and other material that is not part of the measured,indicated or inferred resource base, are included when determining the fair value of mine site reporting units atacquisition and, subsequently, in determining whether the assets are impaired. The term “recoverable minerals”refers to the estimated amount of gold or other commodities that will be obtained after taking into account lossesduring ore processing and treatment. Estimates of recoverable minerals from such exploration stage mineralinterests are risk adjusted based on management’s relative confidence in such materials. In estimating future cashflows, assets are grouped at the lowest level for which there are identifiable cash flows that are largelyindependent of future cash flows from other asset groups.
As discussed above under Depreciation, Depletion and Amortization, various factors could impact ourability to achieve our forecasted production schedules from proven and probable reserves. Additionally,production, capital and reclamation costs could differ from the assumptions used in the cash flow models used toassess impairment. The ability to achieve the estimated quantities of recoverable minerals from exploration stagemineral interests involves further risks in addition to those factors applicable to mineral interests where provenand probable reserves have been identified, due to the lower level of confidence that the identified mineralizedmaterial could ultimately be mined economically. Assets classified as other mine-related exploration potentialand greenfields exploration potential have the highest level of risk that the carrying value of the asset can beultimately realized, due to the still lower level of geological confidence and economic modeling.
Derivative Instruments
With the exception of the Call Spread Transactions (as described below in Note 20), all financialinstruments that meet the definition of a derivative are recorded on the balance sheet at fair market value.Changes in the fair market value of derivatives recorded on the balance sheet are recorded in the statements ofconsolidated (loss) income, except for the effective portion of the change in fair market value of derivatives thatare designated as a cash flow hedge and qualify for cash flow hedge accounting. Our portfolio of derivativesincludes various complex instruments. Management applies significant judgment in estimating the fair value ofinstruments that are highly sensitive to assumptions regarding commodity prices, market volatilities, foreigncurrency exchange rates and interest rates. Variations in these factors could materially affect amounts credited orcharged to earnings to reflect the changes in fair market value of derivatives. In addition, certain derivativecontracts are accounted for as cash flow hedges, whereby the effective portion of changes in fair market value ofthese instruments are deferred in Accumulated other comprehensive income and will be recognized in thestatements of consolidated operations when the underlying production designated as the hedged item impactsearnings. All derivative contracts qualifying for hedge accounting are designated against the applicable portion offuture foreign currency expenditures or future production from proven and probable reserves, where managementbelieves the forecasted transaction is probable of occurring. To the extent that management determines that suchfuture foreign expenditures or production are no longer probable of occurring, gains and losses deferred in
45

Accumulated other comprehensive income would be reclassified to the statements of consolidated (loss) incomeimmediately.
Reclamation and Remediation Obligations (Asset Retirement Obligations)
Reclamation costs are allocated to expense over the life of the related assets and are periodically adjusted toreflect changes in the estimated present value resulting from the passage of time and revisions to the estimates ofeither the timing or amount of the reclamation and remediation costs. The asset retirement obligation is based onwhen the spending for an existing environmental disturbance will occur. We review, on at least an annual basis,the asset retirement obligation at each mine site in accordance with FASB FAS No. 143, “Accounting for AssetRetirement Obligations.”
Future remediation costs for inactive mines are accrued based on management’s best estimate at the end ofeach period of the costs expected to be incurred. Such cost estimates include, where applicable, ongoing care,water treatment, maintenance and monitoring costs. Changes in estimates at inactive mines are reflected inearnings in the period an estimate is revised.
Accounting for reclamation and remediation obligations requires management to make estimates unique toeach mining operation of the future costs we will incur to complete the reclamation and remediation workrequired to comply with existing laws and regulations. Actual costs incurred in future periods could differ fromamounts estimated. Additionally, future changes to environmental laws and regulations could increase the extentof reclamation and remediation work required. Any such increases in future costs could materially impact theamounts charged to earnings for reclamation and remediation.
Income and Mining Taxes
We recognize the expected future tax benefit from deferred tax assets when the tax benefit is considered tobe more likely than not of being realized. Assessing the recoverability of deferred tax assets requiresmanagement to make significant estimates related to expectations of future taxable income. Estimates of futuretaxable income are based on forecasted cash flows and the application of existing tax laws in each jurisdiction.Refer above under Carrying Value of Long-Lived Assets for a discussion of the factors that could cause futurecash flows to differ from estimates. To the extent that future cash flows and taxable income differ significantlyfrom estimates, our ability to realize deferred tax assets recorded at the balance sheet date could be impacted.Additionally, future changes in tax laws in the jurisdictions in which we operate could limit our ability to obtainthe future tax benefits represented by our deferred tax assets recorded at the reporting date.
The Company’s operation involves dealing with uncertainties and judgments in the application of complextax regulations in multiple jurisdictions. The final taxes paid are dependent upon many factors, includingnegotiations with taxing authorities in various jurisdictions and resolution of disputes arising from federal, state,and international tax audits. The Company recognizes potential liabilities and records tax liabilities foranticipated tax audit issues in the U.S. and other tax jurisdictions based on its estimate of whether, and the extentto which, additional taxes will be due. As of January 1, 2007, the Company adopted FASB Interpretation No. 48,“Accounting for Uncertainty in Income Taxes,” (“FIN 48”), an interpretation of FASB Statement No. 109,“Accounting for Income Taxes,” guidance to record these liabilities (refer to Note 8 of the ConsolidatedFinancial Statements for additional information). The Company adjusts these reserves in light of changing factsand circumstances; however, due to the complexity of some of these uncertainties, the ultimate resolution mayresult in a payment that is materially different from the Company’s current estimate of the tax liabilities. If theCompany’s estimate of tax liabilities proves to be less than the ultimate assessment, an additional charge toexpense would result. If payment of these amounts ultimately proves to be less than the recorded amounts, thereversal of the liabilities would result in tax benefits being recognized in the period when the Companydetermines the liabilities are no longer necessary. The Company recognizes interest and penalties, if any, relatedto unrecognized tax benefits in income tax expense.
46
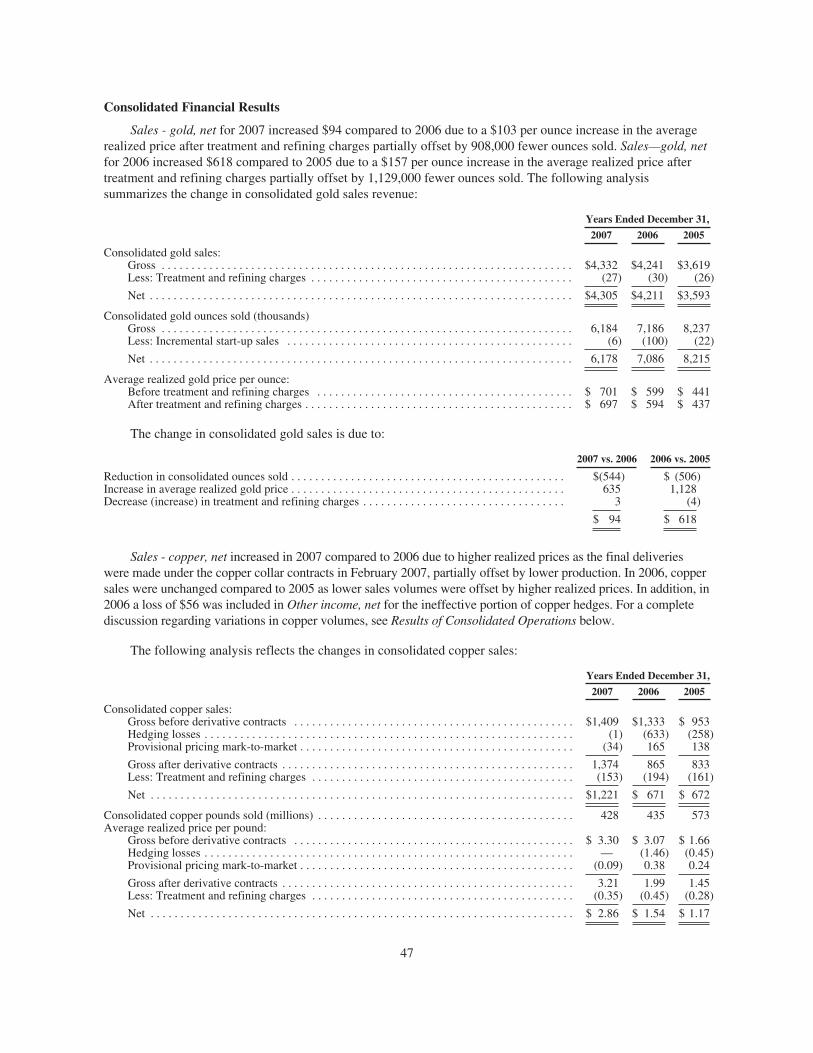
Consolidated Financial Results
Sales - gold, net for 2007 increased $94 compared to 2006 due to a $103 per ounce increase in the averagerealized price after treatment and refining charges partially offset by 908,000 fewer ounces sold. Sales—gold, netfor 2006 increased $618 compared to 2005 due to a $157 per ounce increase in the average realized price aftertreatment and refining charges partially offset by 1,129,000 fewer ounces sold. The following analysissummarizes the change in consolidated gold sales revenue:
Years Ended December 31,
2007 2006 2005
Consolidated gold sales:Gross . . . . . . . . . . . . . . . . . . . . . . . . . . . . . . . . . . . . . . . . . . . . . . . . . . . . . . . . . . . . . . . . . . . . . $4,332 $4,241 $3,619Less: Treatment and refining charges . . . . . . . . . . . . . . . . . . . . . . . . . . . . . . . . . . . . . . . . . . . . (27) (30) (26)
Net . . . . . . . . . . . . . . . . . . . . . . . . . . . . . . . . . . . . . . . . . . . . . . . . . . . . . . . . . . . . . . . . . . . . . . . $4,305 $4,211 $3,593
Consolidated gold ounces sold (thousands)Gross . . . . . . . . . . . . . . . . . . . . . . . . . . . . . . . . . . . . . . . . . . . . . . . . . . . . . . . . . . . . . . . . . . . . . 6,184 7,186 8,237Less: Incremental start-up sales . . . . . . . . . . . . . . . . . . . . . . . . . . . . . . . . . . . . . . . . . . . . . . . . (6) (100) (22)
Net . . . . . . . . . . . . . . . . . . . . . . . . . . . . . . . . . . . . . . . . . . . . . . . . . . . . . . . . . . . . . . . . . . . . . . . 6,178 7,086 8,215
Average realized gold price per ounce:Before treatment and refining charges . . . . . . . . . . . . . . . . . . . . . . . . . . . . . . . . . . . . . . . . . . . $ 701 $ 599 $ 441After treatment and refining charges . . . . . . . . . . . . . . . . . . . . . . . . . . . . . . . . . . . . . . . . . . . . . $ 697 $ 594 $ 437
The change in consolidated gold sales is due to:
2007 vs. 2006 2006 vs. 2005
Reduction in consolidated ounces sold . . . . . . . . . . . . . . . . . . . . . . . . . . . . . . . . . . . . . . . . . . . . . . $(544) $ (506)Increase in average realized gold price . . . . . . . . . . . . . . . . . . . . . . . . . . . . . . . . . . . . . . . . . . . . . . 635 1,128Decrease (increase) in treatment and refining charges . . . . . . . . . . . . . . . . . . . . . . . . . . . . . . . . . . 3 (4)
$ 94 $ 618
Sales - copper, net increased in 2007 compared to 2006 due to higher realized prices as the final deliverieswere made under the copper collar contracts in February 2007, partially offset by lower production. In 2006, coppersales were unchanged compared to 2005 as lower sales volumes were offset by higher realized prices. In addition, in2006 a loss of $56 was included in Other income, net for the ineffective portion of copper hedges. For a completediscussion regarding variations in copper volumes, see Results of Consolidated Operations below.
The following analysis reflects the changes in consolidated copper sales:
Years Ended December 31,
2007 2006 2005
Consolidated copper sales:Gross before derivative contracts . . . . . . . . . . . . . . . . . . . . . . . . . . . . . . . . . . . . . . . . . . . . . . . $1,409 $1,333 $ 953Hedging losses . . . . . . . . . . . . . . . . . . . . . . . . . . . . . . . . . . . . . . . . . . . . . . . . . . . . . . . . . . . . . . (1) (633) (258)Provisional pricing mark-to-market . . . . . . . . . . . . . . . . . . . . . . . . . . . . . . . . . . . . . . . . . . . . . . (34) 165 138
Gross after derivative contracts . . . . . . . . . . . . . . . . . . . . . . . . . . . . . . . . . . . . . . . . . . . . . . . . . 1,374 865 833Less: Treatment and refining charges . . . . . . . . . . . . . . . . . . . . . . . . . . . . . . . . . . . . . . . . . . . . (153) (194) (161)
Net . . . . . . . . . . . . . . . . . . . . . . . . . . . . . . . . . . . . . . . . . . . . . . . . . . . . . . . . . . . . . . . . . . . . . . . $1,221 $ 671 $ 672
Consolidated copper pounds sold (millions) . . . . . . . . . . . . . . . . . . . . . . . . . . . . . . . . . . . . . . . . . . . 428 435 573Average realized price per pound:
Gross before derivative contracts . . . . . . . . . . . . . . . . . . . . . . . . . . . . . . . . . . . . . . . . . . . . . . . $ 3.30 $ 3.07 $ 1.66Hedging losses . . . . . . . . . . . . . . . . . . . . . . . . . . . . . . . . . . . . . . . . . . . . . . . . . . . . . . . . . . . . . . — (1.46) (0.45)Provisional pricing mark-to-market . . . . . . . . . . . . . . . . . . . . . . . . . . . . . . . . . . . . . . . . . . . . . . (0.09) 0.38 0.24
Gross after derivative contracts . . . . . . . . . . . . . . . . . . . . . . . . . . . . . . . . . . . . . . . . . . . . . . . . . 3.21 1.99 1.45Less: Treatment and refining charges . . . . . . . . . . . . . . . . . . . . . . . . . . . . . . . . . . . . . . . . . . . . (0.35) (0.45) (0.28)
Net . . . . . . . . . . . . . . . . . . . . . . . . . . . . . . . . . . . . . . . . . . . . . . . . . . . . . . . . . . . . . . . . . . . . . . . $ 2.86 $ 1.54 $ 1.17
47

The change in consolidated copper sales is due to:
2007 vs. 2006 2006 vs. 2005
Decrease in consolidated pounds sold . . . . . . . . . . . . . . . . . . . . . . . . . . . . . . . . . . . . . . . $ (15) $(201)Increase in average realized copper price . . . . . . . . . . . . . . . . . . . . . . . . . . . . . . . . . . . . 524 233Decrease (increase) in treatment and refining charges . . . . . . . . . . . . . . . . . . . . . . . . . . 41 (33)
$550 $ (1)
The following is a summary of consolidated gold and copper sales, net:
Years Ended December 31,
2007 2006 2005
GoldNevada, USA . . . . . . . . . . . . . . . . . . . . . . . . . . . . . . . . . . . . . . . . . . . . . . . . . . . . . . . . . $1,616 $1,441 $1,053Yanacocha, Peru . . . . . . . . . . . . . . . . . . . . . . . . . . . . . . . . . . . . . . . . . . . . . . . . . . . . . . . 1,093 1,543 1,490Australia/New Zealand:
Tanami, Australia . . . . . . . . . . . . . . . . . . . . . . . . . . . . . . . . . . . . . . . . . . . . . . . . . . 305 250 221Kalgoorlie, Australia . . . . . . . . . . . . . . . . . . . . . . . . . . . . . . . . . . . . . . . . . . . . . . . 224 198 183Jundee, Australia . . . . . . . . . . . . . . . . . . . . . . . . . . . . . . . . . . . . . . . . . . . . . . . . . . 214 190 154Waihi, New Zealand . . . . . . . . . . . . . . . . . . . . . . . . . . . . . . . . . . . . . . . . . . . . . . . . 66 71 73
809 709 631
Batu Hijau, Indonesia . . . . . . . . . . . . . . . . . . . . . . . . . . . . . . . . . . . . . . . . . . . . . . . . . . . 351 264 318Ahafo, Ghana . . . . . . . . . . . . . . . . . . . . . . . . . . . . . . . . . . . . . . . . . . . . . . . . . . . . . . . . . 306 124 —Other Operations:
Kori Kollo, Bolivia . . . . . . . . . . . . . . . . . . . . . . . . . . . . . . . . . . . . . . . . . . . . . . . . . 60 77 44La Herradura, Mexico . . . . . . . . . . . . . . . . . . . . . . . . . . . . . . . . . . . . . . . . . . . . . . 61 48 36Golden Giant, Canada . . . . . . . . . . . . . . . . . . . . . . . . . . . . . . . . . . . . . . . . . . . . . . 8 35 73
129 160 153
Corporate . . . . . . . . . . . . . . . . . . . . . . . . . . . . . . . . . . . . . . . . . . . . . . . . . . . . . . . . . . . . 1 (30) (52)
$4,305 $4,211 $3,593
CopperBatu Hijau, Indonesia . . . . . . . . . . . . . . . . . . . . . . . . . . . . . . . . . . . . . . . . . . . . . . . . . . . $1,221 $ 671 $ 672
Costs applicable to sales - gold increased in 2007 compared to 2006 due to increased labor and diesel costs,the strengthening of the Australian dollar, a full year of operations at Ahafo in Ghana and Phoenix and Leevillein Nevada and higher waste removal costs at Batu Hijau. The increase in 2006 from 2005 resulted primarily fromhigher labor and input commodity prices and higher waste removal costs at Yanacocha and Batu Hijau, as well asincreased operating costs from the start-up of Phoenix and Leeville in Nevada and Ahafo in Ghana. Costsapplicable to sales - copper increased in 2007 from 2006 mainly due to higher waste removal costs at BatuHijau. We have seen significant increases in the costs of labor, fuel, power and other consumables during theseperiods for both gold and copper. For a complete discussion regarding variations in operations, see Results ofConsolidated Operations below.
Depreciation, depletion and amortization increased in 2007 from 2006 due to a full year of operations atPhoenix and Leeville in Nevada and Ahafo in Ghana. Depreciation, depletion and amortization remained at thesame level in 2006 from 2005, as capital spending increases from the start-up of Phoenix and Leeville in Nevadaand Ahafo in Ghana and capital expenditures at other operations were offset by lower production at Yanacochaand Batu Hijau. Depreciation, depletion and amortization expense fluctuates as capital expenditures increase ordecrease and as production levels increase or decrease due to the use of the units-of production amortization
48

method. For a complete discussion, see Results of Consolidated Operations, below. We expect Depreciation,depletion and amortization to increase to approximately $725 to $775 in 2008.
The following is a summary of Costs applicable to sales and Depreciation, depletion and amortization byoperation:
Costs Applicable to SalesDepreciation, Depletion
and Amortization
Years Ended December 31, Years Ended December 31,
2007 2006 2005 2007 2006 2005
GoldNevada, USA . . . . . . . . . . . . . . . . . . . . . . . . . . . . . . . . . . . . . $1,036 $ 980 $ 807 $220 $180 $124Yanacocha, Peru . . . . . . . . . . . . . . . . . . . . . . . . . . . . . . . . . . 540 498 487 160 172 205Australia/New Zealand:
Tanami, Australia . . . . . . . . . . . . . . . . . . . . . . . . . . . . . 187 155 162 37 30 33Kalgoorlie, Australia . . . . . . . . . . . . . . . . . . . . . . . . . . . 196 163 144 24 25 17Jundee, Australia . . . . . . . . . . . . . . . . . . . . . . . . . . . . . . 143 113 115 26 26 27Waihi, New Zealand . . . . . . . . . . . . . . . . . . . . . . . . . . . 47 27 29 22 10 16
573 458 450 109 91 93
Batu Hijau, Indonesia . . . . . . . . . . . . . . . . . . . . . . . . . . . . . . 120 91 109 25 20 34Ahafo, Ghana . . . . . . . . . . . . . . . . . . . . . . . . . . . . . . . . . . . . . 177 60 — 43 19 —Other Operations:
Kori Kollo, Bolivia . . . . . . . . . . . . . . . . . . . . . . . . . . . . 30 27 16 10 9 4La Herradura, Mexico . . . . . . . . . . . . . . . . . . . . . . . . . . 29 19 15 7 8 5Golden Giant, Canada . . . . . . . . . . . . . . . . . . . . . . . . . . 2 13 48 — 1 11
61 59 79 17 18 20
2,507 2,146 1,932 574 500 476
CopperBatu Hijau, Indonesia . . . . . . . . . . . . . . . . . . . . . . . . . . . . . . 471 308 303 96 66 87
OtherExploration . . . . . . . . . . . . . . . . . . . . . . . . . . . . . . . . . . . . . . — — — 1 3 4Australia/New Zealand . . . . . . . . . . . . . . . . . . . . . . . . . . . . . — — — 3 3 3Ahafo, Ghana . . . . . . . . . . . . . . . . . . . . . . . . . . . . . . . . . . . . . — — — — — 1Other Operations . . . . . . . . . . . . . . . . . . . . . . . . . . . . . . . . . . — — — — 1 2Corporate and Other . . . . . . . . . . . . . . . . . . . . . . . . . . . . . . . — — — 21 16 16
— — — 25 23 26
$2,978 $2,454 $2,235 $695 $589 $589
49

Deferred stripping. The net deferred stripping amounts included in Costs applicable to sales by operationwere as follows for the year ended December 31, 2005:
GoldNevada, USA . . . . . . . . . . . . . . . . . . . . . . . . . . . . . . . . . . . . . . . . . . . . . . . . . . . . . . . . . . . . . . . . . $(47)Australia/New Zealand:
Kalgoorlie, Australia . . . . . . . . . . . . . . . . . . . . . . . . . . . . . . . . . . . . . . . . . . . . . . . . . . . . . . . (9)Waihi, New Zealand . . . . . . . . . . . . . . . . . . . . . . . . . . . . . . . . . . . . . . . . . . . . . . . . . . . . . . . 2
(7)
Other Operations:La Herradura, Mexico . . . . . . . . . . . . . . . . . . . . . . . . . . . . . . . . . . . . . . . . . . . . . . . . . . . . . . (3)
$(57)
CopperBatu Hijau, Indonesia . . . . . . . . . . . . . . . . . . . . . . . . . . . . . . . . . . . . . . . . . . . . . . . . . . . . . . . . . . . $ 1
See Accounting Developments, above.
The Loss on settlement of price-capped forward sales contracts of $531 in 2007 resulted from theelimination of the entire 1.85 million ounces of forward sales contracts that would have impacted results in 2008and beyond.
Midas redevelopment of $11 in 2007 resulted from activities undertaken, during suspended operations, toregain entry into the mine in order to resume commercial production following the accident that occurred onJune 19, 2007.
Exploration period-to-period increases reflect increased exploration and related activity in response tohigher gold prices and increased drilling, labor and consumable costs. Advanced projects, research anddevelopment costs represent spending on advanced projects, feasibility studies and drilling at Phoenix, Akyem,Ahafo and Conga. We expect Exploration to be approximately $220 to $230 and Advanced projects, researchand development to be approximately $120 to $180 in 2008.
General and administrative expense increased in 2007 from 2006 primarily due to increased professionalfees and consulting costs. The increase in 2006 from 2005 was primarily due to $12 of stock option expense.General and administrative expense as a percentage of revenues was 2.6% in 2007, compared to 2.8% in both2006 and 2005. We expect General and administrative expenses to be approximately $140 to $150 in 2008.
Write-down of goodwill was $1,122, $nil and $41 for 2007, 2006 and 2005, respectively. The 2007impairment was related to the Exploration segment. In 2007, annual testing for impairment pursuant to FASNo. 142 resulted in a goodwill impairment charge for the Exploration Segment of $1,122. The impairmentresulted primarily from (i) a significantly lower assumed annual reserve growth rate (from 4% to 3%), (ii) asignificant change in the financial markets resulting in an increase in the discount rate (from 8% to 10%), and(iii) an increase in finding costs due to a combination of increased spending and reduced exploration success. The2005 impairment was related to the Nevada segment resulting from anticipated increased future operating andcapital costs.
Write-down of investments totaled $46 in 2007, primarily related to the impairment of investments in ShoreGold Inc. and Gabriel Resources Ltd.
Write-down of long-lived and other assets totaled $4, $3 and $41 for 2007, 2006 and 2005, respectively. The2007 write-down was primarily related to tenements in Australia. The 2006 write-down was primarily related toequipment. The 2005 write-down was primarily related to the Martabe exploration project in Indonesia andexploration tenements in Australia.
50

For a discussion of our policy for assessing the carrying value of goodwill and long-lived assets forimpairment, see Critical Accounting Policies, above.
Other expense, net includes the following:
Years Ended December 31,
2007 2006 2005
Reclamation and remediation . . . . . . . . . . . . . . . . . . . . . . . . . . . . . . . $ 29 $ 47 $ 38Pension settlement loss . . . . . . . . . . . . . . . . . . . . . . . . . . . . . . . . . . . . 17 — 4Buyat Bay settlement and other . . . . . . . . . . . . . . . . . . . . . . . . . . . . . 12 22 56Western Australia power plant . . . . . . . . . . . . . . . . . . . . . . . . . . . . . . 11 1 (3)World Gold Council dues . . . . . . . . . . . . . . . . . . . . . . . . . . . . . . . . . . 11 13 14Peruvian royalty . . . . . . . . . . . . . . . . . . . . . . . . . . . . . . . . . . . . . . . . . 10 22 —Choropampa legal costs . . . . . . . . . . . . . . . . . . . . . . . . . . . . . . . . . . . 9 5 4Reclamation accretion . . . . . . . . . . . . . . . . . . . . . . . . . . . . . . . . . . . . . 8 3 —Australian office relocation . . . . . . . . . . . . . . . . . . . . . . . . . . . . . . . . 6 5 —PTNNT divestiture . . . . . . . . . . . . . . . . . . . . . . . . . . . . . . . . . . . . . . . 3 — —Yanacocha leach pad repairs . . . . . . . . . . . . . . . . . . . . . . . . . . . . . . . . 1 10 —Peruvian workers participation reserve . . . . . . . . . . . . . . . . . . . . . . . . — 15 —Other . . . . . . . . . . . . . . . . . . . . . . . . . . . . . . . . . . . . . . . . . . . . . . . . . . 31 16 13
$148 $159 $126
The 2007 expense includes changes in environmental obligations estimates at former mines, pensionsettlement losses related to senior management retirements, World Gold Council dues and costs at the WesternAustralia power plant. The 2006 expense primarily includes changes in environmental obligation estimates atformer mines, legal and other costs incurred in regards to pollution allegations at Minahasa and at Yanacocha,the Peruvian royalty, costs associated with leach pad repairs and Peruvian worker’s participation reserves.Beginning in 2006 Yanacocha recorded a charge to Other expense, net related to an agreement with the Peruviangovernment to provide for a negotiated royalty payment during high metal prices for community improvements.The negotiated royalty is based on 3.75% of Yanacocha’s net income beginning January 1, 2006 for a period ofup to five years. The 2005 expense included legal and other costs incurred in regards to pollution allegations atMinahasa, changes in environmental obligation estimates at former mines, costs incurred to stabilize material andrepair damage to roads and utility lines for a waste dump slide in Nevada and a pension settlement loss.
Other income, net is summarized as follows:
Years Ended December 31,
2007 2006 2005
Interest income . . . . . . . . . . . . . . . . . . . . . . . . . . . . . . . . . . . . . . . . . . $ 50 $ 67 $ 59Canadian Oil Sands Trust income . . . . . . . . . . . . . . . . . . . . . . . . . . . 47 30 10Foreign currency exchange gains . . . . . . . . . . . . . . . . . . . . . . . . . . . . 25 5 8Gain on sale of property, plant and equipment . . . . . . . . . . . . . . . . . . 9 12 11Gain (loss) on ineffective portion of derivative investments, net
(Note 14) . . . . . . . . . . . . . . . . . . . . . . . . . . . . . . . . . . . . . . . . . . . . . 4 (60) 2Income from development projects, net . . . . . . . . . . . . . . . . . . . . . . . 3 19 —Loss (gain) on sale of other assets, net . . . . . . . . . . . . . . . . . . . . . . . . (1) 6 6Loss on early extinguishment of debt . . . . . . . . . . . . . . . . . . . . . . . . . — (40) —Other . . . . . . . . . . . . . . . . . . . . . . . . . . . . . . . . . . . . . . . . . . . . . . . . . . 7 14 10
$144 $ 53 $106
51

Interest income decreased in 2007 from 2006 due to lower investment yields. Interest income increased in2006 from 2005 due to increased funds invested and higher investment yields.
Income from developing projects includes gold and copper sales, net of incremental operating costsincurred, from operations prior to commercial production. Income in 2007 is from the Bob Star project in Nevadaand income in 2006 is from the Leeville and Phoenix operations also in Nevada.
Foreign currency exchange gains in 2007 resulted from the strengthening of the Canadian and Australiandollars compared to the U.S. dollar. The Canadian dollar exchange rate increased by approximately 19% fromDecember 31, 2006 while the Australian dollar exchange rate increased by approximately 11%.
On September 27, 2006, we settled our remaining obligations under the prepaid forward gold sales contractand forward gold purchase contract for which we were required to deliver 17,951 ounces of gold in December2006 and 179,062 ounces of gold in June 2007. This settlement resulted in cash payments of $96, and included a$48 reduction to the current portion of long-term debt and a $40 pre-tax loss on extinguishment of debt.
The loss on ineffective portion of derivative instruments includes a loss of $56 in 2006 for the ineffectiveportion of the copper collar instruments designated as cash flow hedges. Other losses relate to the ineffectiveportion of legacy gold puts held in Australia.
Interest expense, net of capitalized interest was $105, $97 and $97 for 2007, 2006 and 2005, respectively.Capitalized interest totaled $50, $57 and $39 in each year, respectively. Interest costs increased in 2007 due tothe issuance of the $1,150 convertible senior notes in July 2007 and the $200 bond issuance at Yanacocha in July2006. These increases were offset by capitalized interest due to construction of Leeville, Phoenix and the powerplant in Nevada, the Ahafo project in Ghana and the Boddington project in Australia. Capitalized interest hasdecreased in 2007 from 2006 due to the completion of the Leeville, Phoenix and Ahafo projects. We expectInterest expense, net of capitalized interest to be approximately $110 to $115 in 2008.
Income tax expense was $200 in 2007, compared to $326 and $270 in 2006 and 2005, respectively. Theeffective tax rates were (57%), 26%, and 29% in 2007, 2006 and 2005, respectively. Without the $1,122 goodwillimpairment charge in 2007 (which is not deductible for tax purposes and for which no related income tax benefitcan be claimed), the effective tax rate for 2007 would have been 26%. The factors that most significantly impactour effective tax rate are percentage depletion and resource allowances, the rate differential related to foreignearnings indefinitely invested, valuation allowances related to deferred tax assets, foreign earnings net of foreigntax credits, earnings attributable to minority interests in subsidiaries and affiliated companies, foreign currencytranslation gains and losses, impacts of the analysis of income taxes payable and U.S. book and tax basis ofassets and liabilities, changes in tax laws, goodwill impairment and the impact of certain specific transactions.Most of these factors are sensitive to the average realized price of gold and other metals.
Percentage depletion allowances (tax deductions for depletion that may exceed our tax basis in our mineralreserves) are available to us under the income tax laws of the United States for operations conducted in theUnited States or through branches and partnerships owned by U.S. subsidiaries included in our consolidatedUnited States income tax return. The deductions are highly sensitive to the price of gold and other mineralsproduced by the Company. For 2006 and prior years, similar types of deductions were available for miningoperations in Canada. The tax benefits from percentage depletion and resource allowances were $70, $77 and$43 in 2007, 2006 and 2005, respectively. The decrease in 2007 compared to 2006 primarily is due to a decreasein production at certain non-US mine sites.
We operate in various countries around the world that have tax laws, tax incentives and tax rates that aresignificantly different than those of the United States. Many of these differences combine to move our overalleffective tax rate higher or lower than the United States statutory rate depending on the mix of income relative toincome earned in the United States. The effect of these differences is shown in Note 8 to the Consolidated
52

Financial Statements as either a foreign rate differential or the effect of foreign earnings, net of credits.Differences in tax rates and other foreign income tax law variations make our ability to fully utilize all of ouravailable foreign income tax credits on a year-by-year basis highly dependent on the price of the gold and copperproduced by the Company and the costs of production, since lower prices or higher costs can result in our havinginsufficient sources of taxable income in the United States to utilize all available foreign tax credits. Such creditshave limited carry back and carry forward periods and can only be used to reduce the United States income taximposed on our foreign earnings included in our annual United States consolidated income tax return. The effectsof foreign earnings, net of allowable credits, were an increase of income tax expense of $10, $7 and $13, in 2007,2006 and 2005, respectively. The effect of different income tax rates in countries where earnings are indefinitelyreinvested contributed to an increase in our income tax expense of $7 and $70 in 2007 and 2006, respectively,and decreased tax expense in 2005 by $6.
The tax effect of changes in local country tax laws, as shown in our effective tax reconciliation in Note 8 tothe Consolidated Financial Statements, resulted in a net tax benefit of $2, $71 and $24 in 2007, 2006 and 2005,respectively. The net tax benefit in 2007 is primarily related to a decrease in Canadian federal and provincialstatutory tax rates and a decrease in New Zealand tax rates. The net tax benefit in 2006 is primarily related toadopting the U.S. dollar as our functional currency for Australian tax reporting purposes and a decrease in theCanadian federal and provincial statutory tax rates. The net tax benefit in 2005 is primarily related to a change inAustralian tax law regarding our ability to file consolidated income tax returns.
The need to record valuation allowances related to our deferred tax assets (primarily attributable to netoperating losses and tax credits) is principally dependent on the following factors: (i) the extent to which the netoperating losses and tax credits can be carried back and yield a tax benefit; (ii) our long-term estimate of futureaverage realized minerals prices; and (iii) the degree to which many of the tax laws and income tax agreementsimposed upon us and our subsidiaries around the world tend to create significant tax deductions early in themining process. These up-front deductions can give rise to net operating losses and tax credit carry forwards incircumstances where future sources of taxable income may not coincide with available carry forward periodseven after taking into account all available tax planning strategies. Furthermore, certain liabilities, accrued forfinancial reporting purposes, may not be deductible for tax purposes until such liabilities are actually fundedwhich could happen after mining operations have ceased, when sufficient sources of taxable income may not beavailable. Changes to valuation allowances decreased income tax expense by $17 and $3 in 2007 and 2006,respectively, and increased income tax expense by $39 in 2005. The change in 2007 primarily is due to therealization of capital gains in Australia.
We consolidate certain subsidiaries of which we do not own 100% of the outstanding equity. However, fortax purposes, we are only responsible for the income taxes on the portion of the taxable earnings attributable toour ownership interest of each consolidated entity. Such minority interests contributed $4, $15 and $15 in 2007,2006 and 2005, respectively, as reductions in our income tax expense.
Our tax expense was not affected in 2007 and decreased by $1 and $14 in 2006 and 2005 respectively due tochanges in foreign currency exchange rates. In 2005, these amounts primarily relate to the Australian tax effectof realized and unrealized translation gains attributable to United States dollar-denominated assets and liabilitiesand the gold derivatives positions at Newmont Australia Limited whose functional currency is the United Statesdollar. Because we intend to indefinitely reinvest earnings from Newmont Australia Limited, no offsettingUnited States deferred income tax effect can be recorded.
Had the $1,122 write-off of goodwill in 2007, which is non-deductible for tax purposes, been deductible,our tax expense would have decreased by $393.
During 2006 we completed a reconciliation of our U.S. book and tax basis assets and liabilities as well as adetailed analysis of our income taxes payable. This exercise identified differences of $27, which was recognizedas a tax benefit in 2006.
53

Based on the uncertainty and inherent unpredictability of the factors influencing our effective tax rate andthe sensitivity of such factors to gold and other metals prices as discussed above, the effective tax rate is expectedto be volatile in future periods. The effective tax rate is expected to be between 30% and 34% in 2008.
Minority interest in income of subsidiaries was as follows:
Years Ended December 31,
2007 2006 2005
Batu Hijau . . . . . . . . . . . . . . . . . . . . . . . . . . . . . . . . . . . . . . . . . . . . . . . . . . . . $299 $103 $119Yanacocha . . . . . . . . . . . . . . . . . . . . . . . . . . . . . . . . . . . . . . . . . . . . . . . . . . . . 108 256 256Other . . . . . . . . . . . . . . . . . . . . . . . . . . . . . . . . . . . . . . . . . . . . . . . . . . . . . . . . 3 4 5
$410 $363 $380
Minority interest in income of subsidiaries increased in 2007 from 2006 as a result of increased earnings atBatu Hijau and a $25 charge in 2007 related to the repayment of the carried interest loan at Batu Hijau, partiallyoffset by decreased earnings at Yanacocha (see Results of Consolidated Operations, Batu Hijau Operations andYanacocha Operations). The 2006 decrease from 2005 resulted from lower production and earnings at Batu Hijau(see Results of Consolidated Operations, Batu Hijau Operations).
Equity (loss) income of affiliates was as follows:
Years Ended December 31,
2007 2006 2005
European Gold Refineries . . . . . . . . . . . . . . . . . . . . . . . . . . . . . . . . . . . . . . . . $ 6 $ 3 $ 6AGR Matthey Joint Venture . . . . . . . . . . . . . . . . . . . . . . . . . . . . . . . . . . . . . . 1 1 (2)Regis Resources NL . . . . . . . . . . . . . . . . . . . . . . . . . . . . . . . . . . . . . . . . . . . . (8) (2) —
$(1) $ 2 $ 4
(Loss) income from discontinued operations was as follows:
Years Ended December 31,
2007 2006 2005
Sales - gold, net . . . . . . . . . . . . . . . . . . . . . . . . . . . . . . . . . . . . . . . . . . . . . . . . $ 119 $ 157 $171Sales - base metals, net . . . . . . . . . . . . . . . . . . . . . . . . . . . . . . . . . . . . . . . . . . — — 38
$ 119 $ 157 $209
Income (loss) from operations:Royalty portfolio . . . . . . . . . . . . . . . . . . . . . . . . . . . . . . . . . . . . . . . . . . . $ 123 $ 67 $121Pajingo . . . . . . . . . . . . . . . . . . . . . . . . . . . . . . . . . . . . . . . . . . . . . . . . . . . 8 12 1Zarafshan . . . . . . . . . . . . . . . . . . . . . . . . . . . . . . . . . . . . . . . . . . . . . . . . . — 6 18Holloway . . . . . . . . . . . . . . . . . . . . . . . . . . . . . . . . . . . . . . . . . . . . . . . . . — — (27)Golden Grove . . . . . . . . . . . . . . . . . . . . . . . . . . . . . . . . . . . . . . . . . . . . . — — (5)
131 85 108
Gain on sale of operations:Zarafshan . . . . . . . . . . . . . . . . . . . . . . . . . . . . . . . . . . . . . . . . . . . . . . . . . 77 — —Pajingo . . . . . . . . . . . . . . . . . . . . . . . . . . . . . . . . . . . . . . . . . . . . . . . . . . . 8 — —Holloway . . . . . . . . . . . . . . . . . . . . . . . . . . . . . . . . . . . . . . . . . . . . . . . . . — 13 —Golden Grove . . . . . . . . . . . . . . . . . . . . . . . . . . . . . . . . . . . . . . . . . . . . . — — 6
85 13 6
Gain on sale of royalty assets . . . . . . . . . . . . . . . . . . . . . . . . . . . . . . . . . . . . . 905 — —Gain on sale of Alberta oil sands project . . . . . . . . . . . . . . . . . . . . . . . . . . . . — 266 —Gain on sale of Martabe . . . . . . . . . . . . . . . . . . . . . . . . . . . . . . . . . . . . . . . . . — 30 —Loss from impairment . . . . . . . . . . . . . . . . . . . . . . . . . . . . . . . . . . . . . . . . . . . (1,665) (101) (42)
Pre-tax (loss) income . . . . . . . . . . . . . . . . . . . . . . . . . . . . . . . . . . . . . . . . . . . . (544) 293 72Income tax expense . . . . . . . . . . . . . . . . . . . . . . . . . . . . . . . . . . . . . . . . . . . . . (379) (65) (28)
(Loss) income from discontinued operations . . . . . . . . . . . . . . . . . . . . . . . . . $ (923) $ 228 $ 44
54

During June 2007, Newmont’s Board of Directors approved a plan to cease Merchant Banking activities.The Company decided to dispose of its royalty portfolio and a portion of its existing equity investments and willnot make further investments in equity securities that do not support its core gold mining business. Newmont andthe new Franco-Nevada Corporation (“new Franco-Nevada”) entered into an agreement under which newFranco-Nevada acquired certain mineral interests and oil and gas interests for cash consideration of $1,187. Thetransaction closed in December 2007 resulting in a $905 pre-tax gain.
In 2006, the Company received net cash proceeds of $271 for the Alberta oil sands project resulting in a$266 pre-tax gain. The Company received $42 net cash proceeds and approximately 43 million Agincourt sharesvalued at $37 for the Martabe project, resulting in a $30 pre-tax gain in 2006.
During 2007, we recognized a $1,665 non-cash charge to impair goodwill associated with the MerchantBanking segment. In 2006, we recorded a pre-tax impairment loss of $101 as a result of the Uzbekistangovernment’s expropriation of the Zarafshan operation. In 2005, we recorded a $42 pre-tax write-down of long-lived assets at the Golden Grove copper-zinc operation in Australia.
The Company’s income tax expense attributable to discontinued operations differed from the amountscomputed by applying the United States statutory corporate income tax rate primarily due to the goodwillimpairment that was nondeductible for tax, the benefit from percentage depletion and a decrease in the valuationallowance related to deferred tax assets.
Other comprehensive income, net of tax in 2007 included a $113 gain in value of marketable securities, $33related to a pension liability adjustment, and a gain of $138 on the translation of subsidiaries with non-U.S. dollarfunctional currencies. Other comprehensive income, net of tax in 2006 included a $272 gain in value ofmarketable securities, $47 for unrealized gains on derivatives designated as cash flow hedges and $17 related to apension liability adjustment, offset by a loss of $14 on the translation of subsidiaries with non-U.S. dollarfunctional currencies. Other comprehensive income, net of tax in 2005 included a $282 gain in value ofmarketable equity securities and a $26 gain on the translation of subsidiaries with non-U.S. dollar functionalcurrencies, offset by losses of $18 related to a minimum pension liability adjustment and $59 for unrealizedlosses on derivatives designated as cash flow hedges.
Results of Consolidated Operations
Gold Ounces or CopperPounds Sold(1) Costs Applicable to Sales(2)
Depreciation, Depletionand Amortization
2007 2006 2005 2007 2006 2005 2007 2006 2005
Gold (ounces in thousands) ($ per ounce) ($ per ounce)Nevada . . . . . . . . . . . . . . . . . . . . . . . . . 2,341 2,534 2,444 $ 444 $ 403 $ 333 $ 94 $ 74 $ 51Yanacocha(3) (51.35% owned) . . . . . . . 1,565 2,572 3,327 345 193 147 103 67 62Australia/New Zealand . . . . . . . . . . . . . 1,153 1,176 1,409 496 389 319 94 78 66Batu Hijau(3)(4) . . . . . . . . . . . . . . . . . . . . 494 435 720 243 209 152 50 46 47Ahafo . . . . . . . . . . . . . . . . . . . . . . . . . . 446 202 — 396 297 — 96 94 —Other(3) . . . . . . . . . . . . . . . . . . . . . . . . . 185 267 337 332 222 233 91 69 58
Total/Weighted-Average . . . . . . . 6,184 7,186 8,237 $ 406 $ 303 $ 235 $ 93 $ 71 $ 58
Copper (pounds in millions) ($ per pound) ($ per pound)Batu Hijau(2)(3) . . . . . . . . . . . . . . . . . . . . 428 435 573 $1.10 $0.71 $0.53 $0.22 $0.15 $0.15
(1) Includes incremental start-up ounces of 6, 100 and 22 in 2007, 2006 and 2005, respectively.(2) Excludes depreciation, depletion and amortization, loss on settlement of price-capped forward sales
contracts and Midas redevelopment.(3) Consolidated gold ounces or copper pounds sold includes minority interests’ share.(4) Economic interest decreased to 45% from 52.875% on May 25, 2007.
55
Consolidated gold ounces sold decreased in 2007 from 2006 due to:
• lower production at Nevada due to lower ore grades;
• lower production at Yanacocha due to lower ore grade and tons placed on the leach pads; partially offsetby
• a full year of operations at Ahafo (Ghana) and Leeville and Phoenix (Nevada); and
• higher ore grades processed at Batu Hijau.
Consolidated gold ounces sold decreased in 2006 from 2005 due to:
• decreased sales at Yanacocha and Batu Hijau due to lower grade ores and lower throughput at BatuHijau;
• the completion of operations at Lone Tree (Nevada) and Golden Giant (Other); partially offset by
• the start-up of operations at Ahafo (Ghana) and Leeville and Phoenix (Nevada).
Consolidated copper pounds sold decreased in 2007 from 2006 due to an increase in concentrate inventoryat year-end due to the timing of shipments. Consolidated copper pounds sold decreased in 2006 from 2005 due tothe processing of lower grade ore (0.55% vs. 0.69%) and lower mill throughput due to mine plan changes andharder material.
Costs applicable to sales per consolidated gold ounce sold increased in 2007 compared to 2006 due toincreased labor and diesel costs, the strengthening of the Australian dollar which increased Costs applicable tosales by approximately $8 per ounce, a full year of operations at Ahafo in Ghana and Phoenix and Leeville inNevada and higher waste removal costs at Batu Hijau. Costs applicable to sales per consolidated gold ounce soldincreased in 2006 from 2005, primarily due to the decrease in production at Yanacocha and increased operatingcosts at all sites. Costs applicable to sales per consolidated copper pound increased from year-to-year due toincreased operating costs.
We expect 2008 consolidated gold sales of approximately 5.9 to 6.4 million ounces, primarily as a result oflower production from Australia and Batu Hijau. Costs applicable to sales per ounce for 2008 are expected to beapproximately $425 to $450 per ounce as the impact of industry-wide cost pressures are expected to becompounded by slightly lower gold grades and production.
We expect 2008 consolidated copper sales of approximately 345 to 365 million pounds at Costs applicableto sales of approximately $1.30 to $1.40 per pound as mining shifts from the high grade bottom of the pit into alower grade mine sequence during 2008 and 2009.
Nevada Operations
Gold Ounces Sold(1) Costs Applicable to Sales(2)Depreciation, Depletion
and Amortization
2007 2006 2005 2007 2006 2005 2007 2006 2005
(in thousands) ($ per ounce) ($ per ounce)
Year ended December 31, . . . . . . . . . . . . 2,341 2,534 2,444 $444 $403 $333 $94 $74 $51
(1) Includes incremental start-up ounces of 6, 100, and 22 in 2007, 2006 and 2005, respectively.(2) Excludes depreciation, depletion and amortization and loss on settlement of price-capped forward sales
contracts and Midas redevelopment.
Gold ounces sold in Nevada decreased due to the milling of lower grade ore, completion of mining at LoneTree and the temporary suspension of mining operations at Midas, partially offset by a full year of operations atPhoenix and Leeville. Open pit ore mined increased to 42.6 million tons in 2007, up from 38.4 million tons in
56
2006 and underground ore production increased to 1.9 million tons in 2007 from 1.7 million tons in 2006 due to afull year of operations at Phoenix and Leeville. Ore milled increased to 25.5 million tons from 17.9 million tonsin 2006, while mill ore grade decreased 23% with the processing of lower grade ore from Phoenix. Ore placed onleach pads decreased 37% in 2007 compared to 2006 primarily as a result of mine sequencing at Gold Quarry andTwin Creeks and the completion of mining at Lone Tree in 2006. Processing at the Lone Tree mill continued in2007 with ore hauled from Twin Creeks. Nevada’s Costs applicable to sales per ounce increased in 2007compared to 2006 as lower production, higher cost production from Phoenix, the suspension of lower costmining operations at Midas and increased labor, diesel and commodity costs were partially offset by lowersurface mining costs. Surface mining costs were lower due to completion of mining at Lone Tree in 2006 andwork on capital projects at Carlin, partially offset by a full year of mining at Phoenix. Depreciation, depletionand amortization per ounce increased 27% from 2006 as a result of a full year of Phoenix and Leeville operation.
Gold ounces sold increased in 2006 from 2005, due to the commencement of commercial operations atPhoenix and Leeville in the fourth quarter of 2006 and increased access to open pit ore at the Twin Creekslayback, partially offset by lower production from Lone Tree. The Phoenix and Leeville projects commencedcommercial operations in October 2006. Leeville and Phoenix produced 243,700 ounces in 2006, including100,300 incremental start-up ounces included in Other income, net. Gold production at Lone Tree declined asmining was completed in 2006. Overall, mill ore grade decreased 17% and mill throughput increased 16% as aresult of the start-up of the lower grade Phoenix operation. Heap leach production was slightly higher than 2005due to a 9% increase in average grade of ore placed on the leach pads. Costs applicable to sales per ounceincreased due to increased labor, diesel, power, cyanide and other commodity prices, higher undergroundcontract service costs. Costs applicable to sales were also impacted by the change in accounting for open pitwaste removal costs. In 2005, $47 of mining costs was deferred which reduced Costs applicable to sales by $20per ounce. Depreciation, depletion and amortization increased as a result of placing new equipment and facilitiesin operation.
Our Midas operations in Nevada were suspended by order of the Mine Safety and Health Administration(“MSHA”) after a fatal accident in June 2007. On October 11, 2007, MSHA lifted the restrictive order that hadrequired Midas to halt mining activities. As a result, mining activities have ramped-up, and we expect Midas toreturn to historic production levels by early 2008. MSHA’s investigation of the accident is continuing. Therelated Midas redevelopment costs were $11, and are not included in the cost per ounce amounts above.
The focus at Phoenix during the fourth quarter of 2007 was continued progress on optimization projects.The scope of the in-fill drill program has been increased from 183 to 222 planned drill holes because actualdrilling costs have remained lower than originally budgeted. Approximately 80% of the planned drill footage wascomplete as of December 31, 2007. Continued progress and favorable results were realized through theimplementation of continuous improvement projects, with an emphasis on human resources, equipmentproductivity and cost reduction. Mill capacity utilization continued to improve with nearly 1 million tonsprocessed in each month of the fourth quarter of 2007 compared to almost 900,000 tons each month in the thirdquarter of 2007. Additionally, the new crusher remains on schedule for start-up by mid-2008 and wasapproximately 42% complete at the end of the fourth quarter. Phoenix produced 181,400 ounces at Costsapplicable to sales of $729 per ounce in 2007. The Company continues to expect a final optimization plan forPhoenix around mid-2008.
Consolidated gold sales are expected to remain stable in 2008 at approximately 2.2 to 2.4 million ounces.Higher production from Phoenix, Leeville and Twin Creeks is expected to be offset by lower grade surface ore atCarlin. Higher mill throughput and mill recoveries are expected to be offset by lower than planned mill gradesand leach recoveries in 2008. Costs applicable to sales are expected to decrease in 2008 to approximately $400 to$430 per ounce. Ongoing labor and energy cost pressures are expected to be offset by reduced electricity chargesas a result of generating power for approximately half the year from our newly built coal-fired power plant,reduced contracted services and other expenses, as well as lower anticipated maintenance costs associated with anewer mining fleet.
57

Construction of a 200-megawatt coal-fired power plant is approximately 96% complete as of December 31,2007. Capital costs for the power plant are expected to be between $620 and $640 and completion is targeted formid-2008.
Non-governmental organizations have brought a series of actions relating to the Nevada operations, asdescribed in more detail in Note 32 to the Consolidated Financial Statements. While we believe that the legalactions are without merit, unfavorable outcomes could result in additional conditions being imposed on ouroperations, and such conditions could have a material adverse effect on Nevada’s results of operations orfinancial position.
Yanacocha Operations
Gold Ounces Sold(1) Costs Applicable to Sales(2)Depreciation, Depletion
and Amortization
2007 2006 2005 2007 2006 2005 2007 2006 2005
(in thousands) ($ per ounce) ($ per ounce)
Year ended December 31, . . . . . . . . . . . . 1,565 2,572 3,327 $345 $193 $147 $103 $67 $62
(1) Consolidated gold ounces sold includes minority interests’ share (51.35% Newmont owned).(2) Excludes depreciation, depletion and amortization and loss on settlement of price-capped forward sales
contracts.
Consolidated gold production and sale ounces at Yanacocha decreased, as expected, in 2007 compared to2006 due to fewer ore tons and lower grade ore placed on the leach pads. Ore mined decreased to 98.6 milliontons in 2007 from 115.8 million tons in 2006. Ore grade decreased by 27% in 2007 compared to 2006 due tomine sequencing. The proportion of waste mined increased from 0.9 to 1.1 waste tons per ton of ore in 2007compared to 2006 as expected in the mine plan. Costs applicable to sales increased $152 per ounce in 2007primarily due to lower production, which impacted unit costs by approximately $125 per ounce, as well asincreased labor, diesel, mine maintenance and other costs, partially offset by lower royalties and workers’participation costs.
Gold ounces sold decreased in 2006 from 2005, primarily due to a decrease in ore tons mined and placed onthe leach pads, as anticipated in the mine plan. The proportion of waste tons mined increased from 0.50 wastetons per ton of ore in 2005 to 0.9 waste tons per ton of ore in 2006. Costs applicable to sales per ounce increaseddue to the decrease in production, increased consumption and prices of diesel, cyanide, lime and othercommodities and higher worker’s participation bonuses and royalties due to increased gold prices, partially offsetby increased silver by-product credits.
Consolidated gold sales are expected to increase in 2008 to approximately 1.7 to 1.8 million ounces,primarily as a result of completion of the gold mill partially offset by lower leach pad production. Costsapplicable to sales at Yanacocha are expected to increase in 2008 to approximately $370 to $390 per ounce,primarily due to a change in the mine sequencing resulting in increased stripping, higher labor costs and royaltypayments.
Construction of the gold mill at Yanacocha was approximately 97% complete at December 31, 2007.Progress on the gold mill continues as expected, with capital costs expected to be between $250 and $270 andcommercial production anticipated in the first half of 2008.
In 2007 and 2006, Yanacocha recorded $10 and $22 to Other expense, net, respectively, related to anagreement with the Peruvian government to provide for a royalty payment for community improvements duringcurrent high metal prices. The negotiated royalty is based on 3.75% of Yanacocha’s net income beginningJanuary 1, 2006 for a period of up to five years.
58
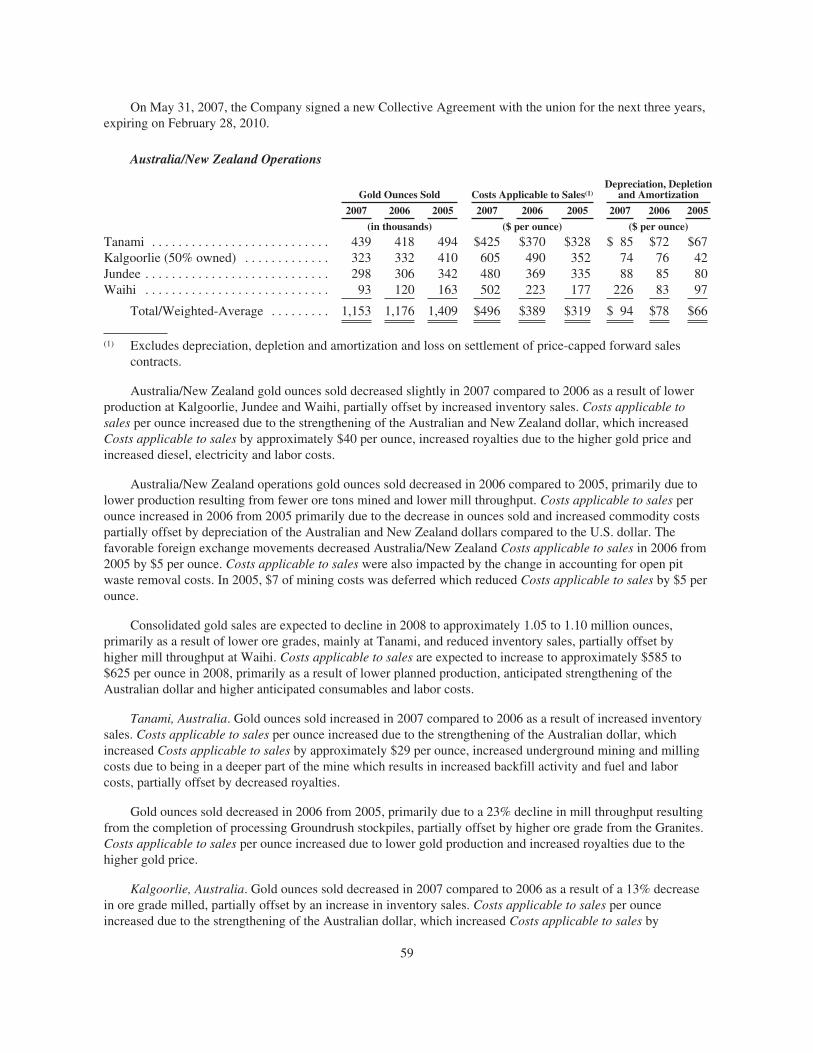
On May 31, 2007, the Company signed a new Collective Agreement with the union for the next three years,expiring on February 28, 2010.
Australia/New Zealand Operations
Gold Ounces Sold Costs Applicable to Sales(1)Depreciation, Depletion
and Amortization
2007 2006 2005 2007 2006 2005 2007 2006 2005
(in thousands) ($ per ounce) ($ per ounce)
Tanami . . . . . . . . . . . . . . . . . . . . . . . . . . . 439 418 494 $425 $370 $328 $ 85 $72 $67Kalgoorlie (50% owned) . . . . . . . . . . . . . 323 332 410 605 490 352 74 76 42Jundee . . . . . . . . . . . . . . . . . . . . . . . . . . . . 298 306 342 480 369 335 88 85 80Waihi . . . . . . . . . . . . . . . . . . . . . . . . . . . . 93 120 163 502 223 177 226 83 97
Total/Weighted-Average . . . . . . . . . 1,153 1,176 1,409 $496 $389 $319 $ 94 $78 $66
(1) Excludes depreciation, depletion and amortization and loss on settlement of price-capped forward salescontracts.
Australia/New Zealand gold ounces sold decreased slightly in 2007 compared to 2006 as a result of lowerproduction at Kalgoorlie, Jundee and Waihi, partially offset by increased inventory sales. Costs applicable tosales per ounce increased due to the strengthening of the Australian and New Zealand dollar, which increasedCosts applicable to sales by approximately $40 per ounce, increased royalties due to the higher gold price andincreased diesel, electricity and labor costs.
Australia/New Zealand operations gold ounces sold decreased in 2006 compared to 2005, primarily due tolower production resulting from fewer ore tons mined and lower mill throughput. Costs applicable to sales perounce increased in 2006 from 2005 primarily due to the decrease in ounces sold and increased commodity costspartially offset by depreciation of the Australian and New Zealand dollars compared to the U.S. dollar. Thefavorable foreign exchange movements decreased Australia/New Zealand Costs applicable to sales in 2006 from2005 by $5 per ounce. Costs applicable to sales were also impacted by the change in accounting for open pitwaste removal costs. In 2005, $7 of mining costs was deferred which reduced Costs applicable to sales by $5 perounce.
Consolidated gold sales are expected to decline in 2008 to approximately 1.05 to 1.10 million ounces,primarily as a result of lower ore grades, mainly at Tanami, and reduced inventory sales, partially offset byhigher mill throughput at Waihi. Costs applicable to sales are expected to increase to approximately $585 to$625 per ounce in 2008, primarily as a result of lower planned production, anticipated strengthening of theAustralian dollar and higher anticipated consumables and labor costs.
Tanami, Australia. Gold ounces sold increased in 2007 compared to 2006 as a result of increased inventorysales. Costs applicable to sales per ounce increased due to the strengthening of the Australian dollar, whichincreased Costs applicable to sales by approximately $29 per ounce, increased underground mining and millingcosts due to being in a deeper part of the mine which results in increased backfill activity and fuel and laborcosts, partially offset by decreased royalties.
Gold ounces sold decreased in 2006 from 2005, primarily due to a 23% decline in mill throughput resultingfrom the completion of processing Groundrush stockpiles, partially offset by higher ore grade from the Granites.Costs applicable to sales per ounce increased due to lower gold production and increased royalties due to thehigher gold price.
Kalgoorlie, Australia. Gold ounces sold decreased in 2007 compared to 2006 as a result of a 13% decreasein ore grade milled, partially offset by an increase in inventory sales. Costs applicable to sales per ounceincreased due to the strengthening of the Australian dollar, which increased Costs applicable to sales by
59
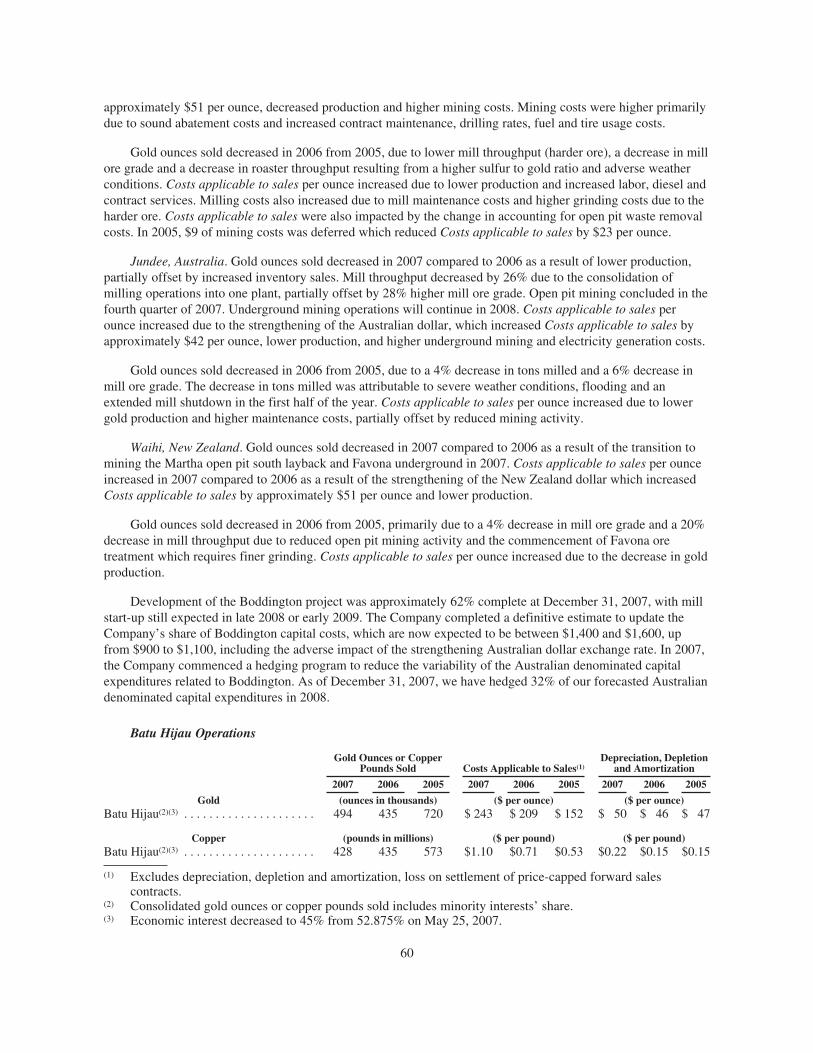
approximately $51 per ounce, decreased production and higher mining costs. Mining costs were higher primarilydue to sound abatement costs and increased contract maintenance, drilling rates, fuel and tire usage costs.
Gold ounces sold decreased in 2006 from 2005, due to lower mill throughput (harder ore), a decrease in millore grade and a decrease in roaster throughput resulting from a higher sulfur to gold ratio and adverse weatherconditions. Costs applicable to sales per ounce increased due to lower production and increased labor, diesel andcontract services. Milling costs also increased due to mill maintenance costs and higher grinding costs due to theharder ore. Costs applicable to sales were also impacted by the change in accounting for open pit waste removalcosts. In 2005, $9 of mining costs was deferred which reduced Costs applicable to sales by $23 per ounce.
Jundee, Australia. Gold ounces sold decreased in 2007 compared to 2006 as a result of lower production,partially offset by increased inventory sales. Mill throughput decreased by 26% due to the consolidation ofmilling operations into one plant, partially offset by 28% higher mill ore grade. Open pit mining concluded in thefourth quarter of 2007. Underground mining operations will continue in 2008. Costs applicable to sales perounce increased due to the strengthening of the Australian dollar, which increased Costs applicable to sales byapproximately $42 per ounce, lower production, and higher underground mining and electricity generation costs.
Gold ounces sold decreased in 2006 from 2005, due to a 4% decrease in tons milled and a 6% decrease inmill ore grade. The decrease in tons milled was attributable to severe weather conditions, flooding and anextended mill shutdown in the first half of the year. Costs applicable to sales per ounce increased due to lowergold production and higher maintenance costs, partially offset by reduced mining activity.
Waihi, New Zealand. Gold ounces sold decreased in 2007 compared to 2006 as a result of the transition tomining the Martha open pit south layback and Favona underground in 2007. Costs applicable to sales per ounceincreased in 2007 compared to 2006 as a result of the strengthening of the New Zealand dollar which increasedCosts applicable to sales by approximately $51 per ounce and lower production.
Gold ounces sold decreased in 2006 from 2005, primarily due to a 4% decrease in mill ore grade and a 20%decrease in mill throughput due to reduced open pit mining activity and the commencement of Favona oretreatment which requires finer grinding. Costs applicable to sales per ounce increased due to the decrease in goldproduction.
Development of the Boddington project was approximately 62% complete at December 31, 2007, with millstart-up still expected in late 2008 or early 2009. The Company completed a definitive estimate to update theCompany’s share of Boddington capital costs, which are now expected to be between $1,400 and $1,600, upfrom $900 to $1,100, including the adverse impact of the strengthening Australian dollar exchange rate. In 2007,the Company commenced a hedging program to reduce the variability of the Australian denominated capitalexpenditures related to Boddington. As of December 31, 2007, we have hedged 32% of our forecasted Australiandenominated capital expenditures in 2008.
Batu Hijau Operations
Gold Ounces or CopperPounds Sold Costs Applicable to Sales(1)
Depreciation, Depletionand Amortization
2007 2006 2005 2007 2006 2005 2007 2006 2005
Gold (ounces in thousands) ($ per ounce) ($ per ounce)Batu Hijau(2)(3) . . . . . . . . . . . . . . . . . . . . . 494 435 720 $ 243 $ 209 $ 152 $ 50 $ 46 $ 47
Copper (pounds in millions) ($ per pound) ($ per pound)Batu Hijau(2)(3) . . . . . . . . . . . . . . . . . . . . . 428 435 573 $1.10 $0.71 $0.53 $0.22 $0.15 $0.15
(1) Excludes depreciation, depletion and amortization, loss on settlement of price-capped forward salescontracts.
(2) Consolidated gold ounces or copper pounds sold includes minority interests’ share.(3) Economic interest decreased to 45% from 52.875% on May 25, 2007.
60

Consolidated copper sales decreased slightly in 2007 from 2006, due to increased year-end concentrateinventories, partially offset by 7% higher production. Consolidated gold sales increased in 2007 from 2006 due to22% higher production, partially offset by increased year-end concentrate inventories. Increased mill throughputfrom an improved grinding circuit control system was offset by extended mill downtime in the fourth quarter of2007 to repair a damaged mill motor. Copper production increased due to a 9% increase in ore grade, partiallyoffset by slightly lower recoveries. Gold production increased due to a 17% increase in ore grade and a 3%increase in recovery. Concentrate inventories increased due to the timing of shipments. Costs applicable to salesper pound of copper and per ounce of gold increased in 2007, compared to 2006 due to the significant processingof ore from stockpiles and higher proportion of waste tons mined. The ratio of waste tons to ore tons increasedfrom 1.3 in 2006 to 7.3 in 2007. In 2007, most of the mining occurred with Phase 5 waste stripping to preparethis phase for future production, while 2006 mining occurred substantially in Phase 4 ore. Costs applicable tosales also increased due to higher labor and maintenance costs and regional taxes.
The average realized net copper price increased to $2.86 per pound in 2007 from $1.54 per pound in 2006,as the final copper hedge contract deliveries were made in February 2007.
Batu Hijau revised its mine plan in 2006 to address geotechnical instability of the operation’s east pit walland harder than modeled ore. Production was impacted by lower grades due to the mining sequence, as well aslower mill throughput due to processing harder ore. Copper and gold sales decreased in 2006 from 2005 as aresult of 20% lower copper and 34% lower gold ore grades, and 6% lower mill throughput. Total tons minedwere 30% higher in 2006 from 2005 primarily due to the addition of new mining equipment, shorter haulingdistance and increased shovel productivity. Costs applicable to sales per pound of copper and per ounce of goldincreased due to lower production, the expansion of the mining fleet and increased diesel, tire, labor and processmaintenance costs, partially offset by an increased allocation of costs to stockpile inventories. Short-termstockpiles were built in 2006 for processing in 2007.
Consolidated sales are expected to decrease in 2008 to approximately 325,000 to 365,000 ounces of goldand approximately 345 to 365 million pounds of copper as a result of mine plan sequencing that will lead toadditional Phase 5 waste stripping compared to 2007. Consolidated gold and copper sales are expected to beimpacted by lower grades and throughput and lower copper recoveries. Costs applicable to sales are expected toincrease in 2008 to approximately $285 to $325 per ounce of gold and approximately $1.30 to $1.40 per pound ofcopper. Increasing operating costs are expected to result primarily from higher waste removal costs, as well asrising fuel, energy and consumables prices.
We have a 45% ownership interest in the Batu Hijau mine, held through a partnership (“NTP”) with anaffiliate of Sumitomo Corporation of Japan. We have a 56.25% interest in NTP and the Sumitomo affiliate holdsthe remaining 43.75%. NTP in turn owns 80% of P.T. Newmont Nusa Tenggara (“PTNNT”), the Indonesiansubsidiary that owns Batu Hijau. We identified NTP as a Variable Interest Entity as a result of certain capitalstructures and contracted relationships and have fully consolidated Batu Hijau in the consolidated financialstatements since January 1, 2004. The remaining 20% interest in PTNNT is owned by P.T. Pukuafa Indah(“PTPI”), an unrelated Indonesian company. Because PTPI’s interest was a carried interest, and because PTPIhad been advanced a loan by NTP, we reported a 52.875% economic interest in Batu Hijau, which reflected ouractual economic interest in the mine until such time as the loan was fully repaid (including accrued interest). OnMay 25, 2007, PTPI fully repaid the loan (including accrued interest) from NTP. As a result of the repayment,our economic interest in Batu Hijau was reduced from 52.875% to 45% and a net charge of $25 (after-tax) wasrecorded against Minority interest expense in the second quarter of 2007.
Under the Contract of Work, beginning in 2005 and continuing through 2010, a portion of PTNNT’s sharesmust be offered for sale, first, to the Indonesian government or, second, to Indonesian nationals, equal to thedifference between the following percentages and the percentage of shares already owned by the Indonesiangovernment or Indonesian nationals (if such number is positive): 23% by March 31, 2006; 30% by March 31,2007; 37% by March 31, 2008, 44% by March 31, 2009; and 51% by March 31, 2010. The price at which such
61

interest must be offered for sale to the Indonesian parties is the highest of the then-current replacement cost, theprice at which shares would be accepted for listing on the Jakarta Stock Exchange, or the fair market value ofsuch interest as a going concern, as agreed with the Indonesian government. Pursuant to this provision, it ispossible that the ownership interest of the Newmont/Sumitomo partnership in PTNNT, owner of Batu Hijau,could be reduced to 49%.
PTPI has owned and continues to own a 20% interest in PTNNT, and therefore the Newmont/Sumitomopartnership was required to offer a 3% interest for sale in 2006 and an additional 7% interest in 2007. A further7% interest will be offered for sale in March 2008. In accordance with the Contract of Work, an offer to sell a 3%interest was made to the government of Indonesia in 2006 and an offer for an additional 7% interest was made in2007. While the central government declined to participate in the offer, local governments in the area in whichthe Batu Hijau mine is located have expressed interest in acquiring shares, as have various Indonesian nationals.In January 2008, the Newmont/Sumitomo partnership agreed to sell, under a carried interest arrangement, 2% ofPTNNT’s shares to Kabupaten Sumbawa, one of the local governments, subject to satisfaction of closingconditions. On February 11, 2008, PTNNT received notification from the Department of Energy and MineralResources (DEMR) alleging that PTNNT is in breach of its divestiture requirements under the Contract of Workand threatening to issue a notice to terminate the Contract of Work if PTNNT does not agree to divest the 2006and 2007 shares, in accordance with the direction of the DEMR, by February 22, 2008. Newmont and Sumitomobelieve there is no basis under the Contract of Work for this notification and no grounds for terminating theContract of Work, and are currently evaluating possible responses to the February 11, 2008 default notice,including filing for international arbitration as provided for under the Contract of Work. Newmont andSumitomo are in discussions with officials of the Government of Indonesia to attempt to clarify or resolve thisissue.
The Company has been in discussions to renew its forest use permit (called a pinjam pakai) for over twoyears. This permit is a key requirement to continue to efficiently operate the Batu Hijau mine. The permitrenewal has not been received and in the event it is not received by May 2008, it could have an adverse impact onoperating and financial results. Representatives of the Indonesian government, including the Ministry of Forestry,have assured us that the permit will be issued in due course.
For more information on the results of the Batu Hijau operations, see Note 30 to the Consolidated FinancialStatements.
Ahafo Operations
Gold Ounces Sold Costs Applicable to Sales(1)Depreciation, Depletion
and Amortization
2007 2006 2005 2007 2006 2005 2007 2006 2005
(in thousands) ($ per ounce) ($ per ounce)
Year ended December 31, . . . . . . . . . . . . . . . . 446 202 — $396 $297 $— $96 $94 $—
(1) Excludes depreciation, depletion and amortization and loss on settlement of price-capped forward salescontracts.
Gold ounces sold at Ahafo increased in 2007 compared to 2006 as a result of a full year of production in2007. Costs applicable to sales per ounce increased due to higher mining and milling costs. Mining costsincreased primarily due to higher waste stripping in the Apensu pit, higher fuel, pit dewatering and maintenancecosts. Milling costs increased due to higher electricity and maintenance costs. Costs applicable to sales in 2006also benefited from the capitalization of pre-production costs.
During 2007, better than expected ore grades and mill recovery rates were realized, which resulted in higherthan expected production at Ahafo. Mill ore grades were higher than expected due to ore control improvementprograms implemented during the year. Increased mill recoveries were a result of higher than expected yieldsfrom the transitional ore mined at the Apensu deposit.
62

Consolidated gold sales are expected to increase to approximately 495,000 to 530,000 ounces in 2008mainly due to the processing of higher grade material. Costs applicable to sales of approximately $485 to $520per ounce is expected for 2008. The expected increase is mainly due to higher fuel, power, contract services andconsumable costs.
During 2007, Newmont and other gold companies with production in Ghana, formed a consortium to importpower generation equipment and constructed an 80 mega-watt power plant. The plant was completed during thefourth quarter of 2007 and is being commissioned. As a result of the mining industry’s initiative to install thepower plant, the Ghanaian government has agreed, if required to curtail power consumption as a result of powershortages, to distribute power proportionately between participating mines and other industrial and commercialcustomers.
Other Operations
Gold Ounces Sold Costs Applicable to Sales(1)Depreciation, Depletion
and Amortization
2007 2006 2005 2007 2006 2005 2007 2006 2005
(in thousands) ($ per ounce) ($ per ounce)Kori Kollo(2) (88% owned) . . . . . . . . . . . . . . . . 87 129 95 $340 $210 $167 $117 $ 68 $40La Herradura (44% owned) . . . . . . . . . . . . . . . 86 79 80 341 248 184 77 114 63Golden Giant . . . . . . . . . . . . . . . . . . . . . . . . . . 12 59 162 205 214 296 — 10 67
Total/Weighted-Average . . . . . . . . . . . . . 185 267 337 $332 $222 $233 $ 91 $ 69 $58
(1) Excludes depreciation, depletion and amortization and loss on settlement of price-capped forward salescontracts.
(2) Consolidated gold ounces sold includes minority interests’ share.
Gold ounces sold at Other Operations decreased in 2007 from 2006, primarily due to the completion ofoperations at Golden Giant and lower production from Kori Kollo. Gold production from Kori Kollo decreaseddue to the timing of flows from the leach pads. Costs applicable to sales per ounce increased in 2007 from 2006,primarily due to lower production and higher waste removal costs at La Herradura and the completion ofoperations at Golden Giant.
Gold ounces sold at Other Operations decreased in 2006 from 2005, primarily due to the wind-up ofoperations at Golden Giant. Mining operations at Golden Giant were completed in December 2005 with remnantmining and milling production continuing into 2006. Costs applicable to sales decreased primarily due to theprocessing of lower cost remnant production from Golden Giant offset by higher waste removal costs at KoriKollo and La Herradura. In 2005, $3 mining costs were deferred, reducing Costs applicable to sales by $31 perounce at La Herradura.
Consolidated gold sales for Other Operations in 2008 are expected to be approximately 200,000 to 220,000ounces at Costs applicable to sales of approximately $340 to $360 per ounce.
Exploration
Exploration expense was $177, $166 and $143 for 2007, 2006 and 2005, respectively. Exploration expensein 2007 reflects higher funding of exploration and related activities in response to higher gold prices andincreased drilling, labor and consumable costs. We anticipate spending between $220 and $230 on explorationactivities in 2008, with the increases primarily related to inflation in drilling costs and exploration at our newlyacquired Hope Bay property.
During 2007, we added 0.8 million equity gold ounces to proven and probable reserves, with 8.2 millionequity gold ounces of depletion and divestitures. Reserve additions from exploration of 3.5 million equity ounceswere primarily due to further extension drilling at Boddington, Jundee and Tanami in Australia (2.6 millionequity ounces), with the remaining additions from several open pit and underground sites in Nevada as well as La
63

Herradura in Mexico. Gold reserves were revised down by 3.4 million equity ounces, primarily due to increasingoperating and capital costs at Ahafo in Ghana (2.4 million equity ounces), and geotechnical and metallurgicalchanges, as well as higher operating costs at Nevada (0.8 million equity ounces). The impact of the change ingold price assumption on reserve additions was 0.7 million equity ounces.
Exploration activities during 2006 succeeded in converting significant new reserves at Carlin open pits (2.3million equity gold ounces), Boddington (1.4 million equity gold ounces), Twin Creeks (1.1 million equity goldounces), Ahafo (0.7 million equity gold ounces), La Herradura (0.7 million equity gold ounces), and Kalgoorlie(0.6 million equity gold ounces).
Exploration activities during 2005 primarily focused on the conversion of significant new reserves at theCarlin open pits (1.9 million equity gold ounces), the Conga district in Peru (1.6 million equity gold ounces), andthe two Ghana projects (Ahafo 1.6 million equity gold ounces, Akyem 1.1 million equity gold ounces). Newmontadded a total of 9.4 million equity gold ounces to proven and probable reserves in 2005.
Foreign Currency Exchange Rates
In addition to its domestic operations in the United States, we have operations in Australia, New Zealand,Peru, Indonesia, Ghana, Canada, Bolivia and other foreign locations. Our operations sell their production basedon U.S. dollar metal prices.
Fluctuations in local currency exchange rates in relation to the U.S. dollar can increase or decrease profitmargins and Costs applicable to sales to the extent costs are paid in local currency at foreign operations. Suchfluctuations have not had a material impact on our revenue since gold and copper are sold throughout the worldprincipally in U.S. dollars. Approximately 28%, 33% and 37% of our Costs applicable to sales were paid in localcurrencies in 2007, 2006 and 2005, respectively. Our Costs applicable to sales are most significantly impacted byvariations in the Australian dollar/U.S. dollar exchange rate. However, variations in the Australian dollar/U.S.dollar exchange rate historically have been strongly correlated to variations in the U.S. dollar gold price over thelong-term. Increases or decreases in costs at Australian locations due to exchange rate changes have thereforetended to be mitigated by changes in sales reported in U.S. dollars at Australian locations. No assurance,however, can be given that the Australian dollar/U.S. dollar exchange rate will continue to be strongly correlatedto the U.S. dollar gold price in the future.
Variations in the local currency exchange rates in relation to the U.S. dollar at our foreign mining operationsincreased Costs applicable to sales $51 in 2007 from 2006, primarily in Australia, and decreased Costsapplicable to sales $1 in 2006 from 2005 primarily at Indonesia, partially offset by Australia.
In 2007, we implemented derivative programs to hedge up to 75% of our future forecasted Australian dollardenominated operating and capital expenditures to reduce the variability in our Australian dollar denominatedexpenditures. As of December 31, 2007, we have hedged 23%, 18% and 11% of our forecasted Australiandenominated operating costs in 2008, 2009 and 2010, respectively. We have also hedged 32% of our forecastedAustralian denominated capital expenditures in 2008.
Foreign currency exchange rates in relation to the U.S. dollar have not had a material impact on ourdetermination of proven and probable reserves in the past. However, if a sustained weakening of the U.S. dollarin relation to the Australian dollar, and/or to other foreign currencies that impact our cost structure, were notmitigated by offsetting increases in the U.S. dollar gold price or by other factors, the amount of proven andprobable reserves in the applicable foreign country could be reduced as certain proven and probable reserves mayno longer be economic. The extent of any such reduction would be dependent on a variety of factors includingthe length of time of any such weakening of the U.S. dollar, and management’s long-term view of the applicableexchange rate. Future reductions of proven and probable reserves would primarily result in reduced gold orcopper sales and increased depreciation, depletion and amortization and, depending on the level of reduction,could also result in impairments of property, plant and mine development, mineral interests and/or goodwill.
64

Recently Issued Accounting Pronouncements and Developments
In December 2007, the FASB issued FASB Statement No. 141(R), “Business Combinations”, which amendsSFAS No. 141, and provides revised guidance for recognizing and measuring identifiable assets and goodwillacquired, liabilities assumed, and any noncontrolling interest in the acquiree. It also provides disclosurerequirements to enable users of the financial statements to evaluate the nature and financial effects of thebusiness combination. SFAS No. 141(R) is effective for our fiscal year beginning January 1, 2009 and is to beapplied prospectively. We are currently evaluating the potential impact of adopting this statement on ourconsolidated financial position, results of operations or cash flows.
In December 2007, the FASB issued FASB Statement No. 160, “Noncontrolling Interests in ConsolidatedFinancial Statements- an amendment of ARB No. 51” which establishes accounting and reporting standardspertaining to ownership interests in subsidiaries held by parties other than the parent, the amount of net incomeattributable to the parent and to the noncontrolling interest, changes in a parent’s ownership interest, and thevaluation of any retained noncontrolling equity investment when a subsidiary is deconsolidated. SFAS No. 160also establishes disclosure requirements that clearly identify and distinguish between the interests of the parentand the interests of the noncontrolling owners. SFAS No. 160 is effective for our fiscal year beginning January 1,2009. We are currently evaluating the potential impact of adopting this statement on our consolidated financialposition, results of operations or cash flows.
In September 2007, the FASB published Proposed FSP No. APB 14-a, “Accounting for Convertible DebtInstruments That May Be Settled in Cash upon Conversion.” The proposed FSP applies to convertible debtinstruments that, by their stated terms, may be settled in cash (or other assets) upon conversion, including partialcash settlement, unless the embedded conversion option is required to be separately accounted for as a derivativeunder SFAS 133. Convertible debt instruments within the scope of the proposed FSP are not addressed by theexisting APB 14. The proposed FSP would require that the liability and equity components of convertible debtinstruments within the scope of the proposed FSP shall be separately accounted for in a manner that reflects theentity’s nonconvertible debt borrowing rate. This will require an allocation of the convertible debt proceedsbetween the liability component and the embedded conversion option (i.e., the equity component). The differencebetween the principal amount of the debt and the amount of the proceeds allocated to the liability componentwould be reported as a debt discount and subsequently amortized to earnings over the instrument’s expected lifeusing the effective interest method. If the proposed FSP were to be adopted, we estimate that approximately $300of debt discount would be recorded and the effective interest rate on our 2014 and 2017 convertible senior notes(see Note 20 to the Consolidated Financial Statements) would increase by approximately 5 percentage points to6.25% and 6.625%, respectively, for the non-cash amortization of the debt discount.
In June 2007, the EITF reached consensus on Issue No. 06-11, “Accounting for Income Tax Benefits ofDividends on Share-Based Payment Awards.” EITF Issue No. 06-11 requires that the tax benefit related todividend and dividend equivalents paid on equity-classifed nonvested shares and nonvested share units, whichare expected to vest, be recorded as an increase to additional paid-in capital. EITF Issue No. 06-11 is to beapplied prospectively for tax benefits on dividends declared in our fiscal year beginning January 1, 2008. We arecurrently evaluating the impact that the adoption of this statement will have on our consolidated financialposition, results of operations or cash flows.
In February 2007, the FASB issued FASB Statement No. 159, “The Fair Value Option for Financial Assetsand Financial Liabilities” (“FAS 159”). FAS 159 permits entities to choose to measure many financialinstruments and certain other items at fair value, with the objective of improving financial reporting bymitigating volatility in reported earnings caused by measuring related assets and liabilities differently withouthaving to apply complex hedge accounting provisions. The provisions of FAS 159 are effective for our fiscalyear beginning January 1, 2008. We do not expect the adoption of FAS 159 to have a material impact on ourconsolidated financial statements.
65

In September 2006, the FASB issued FASB Statement No. 157, “Fair Value Measurements” (“FAS 157”).FAS 157 defines fair value, establishes a framework for measuring fair value in generally accepted accountingprinciples, and expands disclosures about fair value measurements. The provisions of FAS 157 are effective forour fiscal year beginning January 1, 2008. We do not expect the adoption of FAS 157 to have a material impacton our consolidated financial statements.
Liquidity and Capital Resources
Operating Activities
Net cash provided from continuing operations was $525, $1,129 and $1,169 for 2007, 2006 and 2005,respectively, and was significantly impacted by the following key factors:
Years Ended December 31,
2007 2006 2005
Consolidated gold ounces sold (in thousands)(1) . . . . . . . . . . . . . . . . . . . . . . . . . . . . . . 6,184 7,186 8,237Average price received per ounce of gold(2) . . . . . . . . . . . . . . . . . . . . . . . . . . . . . . . . . . $ 697 $ 594 $ 437Costs applicable to sales per ounce of gold sold(3) . . . . . . . . . . . . . . . . . . . . . . . . . . . . . $ 406 $ 303 $ 235Consolidated copper pounds sold (in millions) . . . . . . . . . . . . . . . . . . . . . . . . . . . . . . . 428 435 573Average price received per pound of copper(2) . . . . . . . . . . . . . . . . . . . . . . . . . . . . . . . $ 2.86 $ 1.54 $ 1.17Costs applicable to sales per pound of copper sold(3) . . . . . . . . . . . . . . . . . . . . . . . . . . . $ 1.10 $ 0.71 $ 0.53
(1) Includes incremental start-up ounces of 6, 100 and 22 in 2007, 2006 and 2005, respectively.(2) After treatment and refining charges and excluding settlement of price-capped forward sales contracts.(3) Excludes depreciation, depletion and amortization, loss on settlement of price-capped forward sales
contracts and Midas redevelopment.
Net cash provided from continuing operations decreased 53% compared to 2006. Cash flow provided fromoperations during 2007 was negatively impacted by the $578 settlement of the price-capped forward salescontracts, $276 settlement of pre-acquisition Australia income taxes of Normandy, $174 related to the finalsettlement of copper collar contracts, fewer gold ounces and copper pounds sold and higher operating costs,partially offset by higher realized gold and copper prices, as discussed above in Consolidated Financial Results.
We are currently planning to contribute $48 to our retirement benefit programs in 2008 which willnegatively impact Net cash provided by operating activities. For additional discussion see Note 21 to theConsolidated Financial Statements.
Investing Activities
Net cash used in investing activities of continuing operations was $2,467, $1,142 and $1,310 in 2007, 2006and 2005, respectively.
Additions to property, plant and mine development were $1,670, $1,537 and $1,204 for continuingoperations in 2007, 2006 and 2005, respectively.
66

Additions to property, plant and mine development were:
Years Ended December 31,
2007 2006 2005
Nevada, USA . . . . . . . . . . . . . . . . . . . . . . . . . . . . . . . . . . . . . . . . . . . . . . $ 588 $ 705 $ 479Yanacocha, Peru . . . . . . . . . . . . . . . . . . . . . . . . . . . . . . . . . . . . . . . . . . . . 253 269 225Australia/New Zealand:
Jundee, Australia . . . . . . . . . . . . . . . . . . . . . . . . . . . . . . . . . . . . . . . 41 23 25Tanami, Australia . . . . . . . . . . . . . . . . . . . . . . . . . . . . . . . . . . . . . . . 41 31 19Kalgoorlie, Australia . . . . . . . . . . . . . . . . . . . . . . . . . . . . . . . . . . . . 5 14 12Waihi, New Zealand . . . . . . . . . . . . . . . . . . . . . . . . . . . . . . . . . . . . . 39 28 11Boddington, Australia . . . . . . . . . . . . . . . . . . . . . . . . . . . . . . . . . . . 466 93 5Other, Australia . . . . . . . . . . . . . . . . . . . . . . . . . . . . . . . . . . . . . . . . 5 3 14
597 192 86
Batu Hijau, Indonesia . . . . . . . . . . . . . . . . . . . . . . . . . . . . . . . . . . . . . . . . 74 106 65Ghana, West Africa:
Ahafo, Ghana . . . . . . . . . . . . . . . . . . . . . . . . . . . . . . . . . . . . . . . . . . 114 177 258Akyem, Ghana . . . . . . . . . . . . . . . . . . . . . . . . . . . . . . . . . . . . . . . . . 20 57 18
134 234 276
Other Operations:Kori Kollo, Bolivia . . . . . . . . . . . . . . . . . . . . . . . . . . . . . . . . . . . . . . 3 1 22La Herradura, Mexico . . . . . . . . . . . . . . . . . . . . . . . . . . . . . . . . . . . 10 10 2
13 11 24
Corporate and Other . . . . . . . . . . . . . . . . . . . . . . . . . . . . . . . . . . . . . . . . . 11 20 49
$1,670 $1,537 $1,204
Capital expenditures in Nevada during 2007 included $280 for the power plant and $160 for mineequipment replacement. Yanacocha capital expenditures included $139 for construction of the gold mill, $39 forleach pad expansions and $12 for the Conga project. Capital expenditures in Australia/New Zealand included$466 for construction of the Boddington project, $63 for underground mine development and $27 for tailingsdams construction. Batu Hijau’s capital expenditures included $38 for mine equipment purchases and $17 formine dewatering. Capital expenditures at Ahafo included $14 for power generation facilities, $21 for a cyaniderecovery circuit, $28 for mine equipment purchases and $12 for infrastructure and land.
Capital expenditures in Nevada during 2006 included $239 for the power plant, $160 for surface miningequipment, $104 for the development of the Leeville underground mine, $87 for the development of the Phoenixproject, and $54 for tailings dams and leach pads. Yanacocha capital expenditures included $113 fordevelopment and leach pad expansions, $44 for the gold mill project, $43 for mine maintenance and services, and$11 for the Conga project. Australian capital expenditures included $93 for Boddington development and $71 formine development. Expenditures at Batu Hijau included $67 for the purchase of additional mining equipment and$20 for process improvements and replacement of the tailings line. Capital expenditures at Ahafo included $117for project completion and $24 for mining equipment. Akyem expenditures were primarily for the engineeringand procurement expenditures for process facilities and other pre-construction activities. Corporate expendituresprimarily included information technology systems.
Capital expenditures in Nevada during 2005 included $73 for the development of the Leeville undergroundmine, $43 for the power plant and $226 for the development of the Phoenix project. Yanacocha capitalexpenditures included $73 for development and leach pad expansions at La Quinua and process facilities, $12 forenvironmental projects, $30 for mining equipment and $17 for the Conga project. Kori Kollo expenditures reflectinvestment in new leach pads. Australian capital expenditures included $54 for mine development and $22 for
67

facilities. Expenditures at Batu Hijau included $36 for the purchase of additional mining equipment and $6 fortailings line replacement. Capital expenditures at Ahafo were primarily for the engineering, procurement andconstruction of the mine and process facilities. Corporate expenditures primarily included informationtechnology systems and land.
During 2007, 2006 and 2005, $19, $21 and $25 of drilling and related costs were capitalized and included inmine development costs, respectively. These capitalized costs included $11 at Australia, $4 at Nevada, $2 at LaHerradura, and $1 at Ahafo and Yanacocha for 2007; $10 at Australia, $7 at Nevada, $3 at Ghana, and $1 atYanacocha and Batu in 2006; and $11 at Nevada, $5 at Australia, $4 at Yanacocha and Ghana, and $1 at Batu in2005.
During 2007, 2006 and 2005, $16, $48 and $4 of pre-stripping costs were capitalized and included in minedevelopment costs, respectively. Pre-stripping costs included the Bob Star mine in Nevada in 2007; the Phoenixmine in Nevada, the Chaquicocha mine at Yanacocha, and the Subika and Apensu mines at Ahafo in 2006; andthe Phoenix mine and Chaquicocha mine in 2005.
We anticipate capital expenditures of approximately $1,800 to $2,000 in 2008, with approximately 50% inAustralia/New Zealand, 25% in Nevada and the remaining 25% invested at other locations. Approximately $900to $1,000 of the 2008 capital budget is allocated to sustaining investments, with the remaining $900 to $1,000allocated to project development initiatives, including completion of the Boddington project in Australia, thepower plant in Nevada and the Yanacocha gold mill in Peru;
Investments in marketable debt and equity securities, net. We had net proceeds of $2 and $774 in 2007 and2006, respectively, and net investments of $1 in 2005, from auction rate marketable debt securities. We generallyaccount for these investments as short-term available-for-sale marketable debt securities. The auction ratemarketable debt securities in which the Company has invested has not traded in an active market sincemid-August 2007 and there are currently no market quotations available. The underlying assets for theseinvestments continue to be rated AAA by Standard and Poor’s. As of December 31, 2007, the Companyreclassified approximately $7 of such securities (with accumulated unrealized losses of approximately $2 basedon indicative bids) to long-term marketable debt securities as a result of current auction market conditions andthe Company’s expectation of holding such investments for a period longer than one year.
In connection with our acquisition of Miramar Mining Corporation, the Company acquired Canadian thirdparty asset-backed commercial paper (“ABCP”) with an estimated value of $31 as of December 31, 2007. TheABCP the Company acquired, which has been classified as long-term marketable debt securities, has not tradedin an active market since mid-August 2007 and there are currently no market quotations available. The ABCPcontinues to be rated R1 (High, Under Review with Developing Implications) by Dominion Bond Rating Service.The valuation technique used by the Company to estimate the fair value of its investment in ABCP incorporatedprobability weighted discounted cash flows considering the best available public information regarding marketconditions and resulted in a discount of approximately 20% from the instruments face value.
During 2007, the Company purchased marketable equity securities of Gabriel Resources for $27 and othermarketable equity securities for $9. During 2006, the Company purchased marketable equity securities of GabrielResources for $17 and Queenstake Resources for $10. Newmont also reinvested dividends from Canadian OilSands Trust for $26. During 2005, the Company purchased marketable equity securities of Shore Gold, GabrielResources, Miramar and Miramar warrants for approximately $87, $31, $27 and $10, respectively.
Acquisitions. As of December 2007, we had acquired approximately 155 million common shares ofMiramar Mining Corporation (“Miramar”) for total consideration of $991 less cash received from the acquisitionof $38 for a net payment of $953. These shares combined with Newmont’s 18.5 million common sharespreviously owned represents approximately 78% of the outstanding shares of Miramar. Miramar owns the HopeBay Project, a large undeveloped gold project in Nunavut, Canada. In January 2008, we acquired approximately40 million additional common shares of Miramar, bringing our interest in Miramar to 96%.
In September 2006, we acquired a 40% interest in Shore Gold Inc.’s Fort a la Corne diamond Joint Venturein Saskatchewan, Canada for $152.
68

In March 2006, we acquired Newcrest Mining Limited’s 22.22% interest in the Boddington project,bringing our interest in the project to 66.67%, for total consideration of $173. Development of the Boddingtonproject in Western Australia with AngloGold Ashanti Limited was also announced in the first quarter 2006.Construction of the Boddington project is expected to cost Newmont approximately $1,400 to $1,600, with initialproduction expected in late 2008 or early 2009. The project has a current estimated mine life of more than 20years, with our share of annual production expected to be approximately 685,000 ounces for the first five yearsand average approximately 500,000 ounces over the remaining life of the project.
In January 2006, we acquired the remaining 15% interest in the Akyem project in Ghana, bringing ourinterest to 100%. In September 2006, we deferred further development of the Akyem project pending completionof permitting, resolution of country-wide power shortages and further engineering optimization. In 2007, wecontinued development studies on Akyem, and a development decision is expected in 2008.
Financing Activities
Net cash provided from (used in) financing activities of continuing operations was $465 in 2007, comparedto $(333) and $39 in 2006 and 2005, respectively.
Proceeds from debt, net. During July 2007, we completed a private offering of $1,150 convertible seniornotes due 2014 and 2017, each in the amount of $575. The 2014 notes, maturing on July 15, 2014, pay interestsemi-annually at a rate of 1.25% per annum, and the 2017 notes, maturing on July 15, 2017, pay interest semi-annually at a rate of 1.625% per annum. The notes will be convertible, at the holder’s option, equivalent to aconversion price of $46.21 per share of common stock. Upon conversion, the principle amount and all accruedinterest will be repaid in cash and any conversion premium will be settled in shares of our common stock or, atour election, cash or any combination of cash and shares of our common stock. We do not have an option toredeem the notes prior to their applicable stated maturity date. The net proceeds from the offering, after expenses,were approximately $1,126.
In connection with the convertible senior notes offering, we entered into convertible note hedge transactionsand warrant transactions (“Call Spread Transactions”). These transactions included the purchase of call optionsand the sale of warrants. The purchased call options cover, in the aggregate and subject to customary anti-dilution adjustments, 24,887,956 shares of the Company’s common stock, par value $1.60 per share. We soldwarrants to purchase, in the aggregate and subject to customary anti-dilution adjustments, 24,887,956 shares ofcommon stock at a price of $60.27 per share. In most cases, the warrants may not be exercised prior to thematurity of the notes. As a result of the call option and warrant transactions, the conversion price of $46.21 waseffectively increased to $60.27. The aggregate cost to the Company of the purchased call options was $366,partially offset by $248 that we received from the sale of the warrants.
During 2007, we borrowed and repaid $1,877 on our revolving credit facility and borrowed $7 at KoriKollo.
In July 2006, Yanacocha issued $100 of bonds in the Peruvian capital markets under a $200 bond programapproved by the Peruvian securities regulatory authority. The bonds are comprised of $42 of floating interest ratebonds bearing interest at a rate of LIBOR plus 1.4375%; and $58 of fixed rate bonds bearing interest at 7.0%.The bonds have a four year grace repayment period and amortize quarterly over six years. The bonds areuncollateralized and are non-recourse to Newmont. Funds generated from the bond issuance were used byYanacocha primarily for capital expenditures.
In May 2006, Yanacocha entered into an uncollateralized $100 bank financing with a syndicate of Peruviancommercial banks. Quarterly repayments began May 2007 with final maturity May 2014. Borrowings under thefacility bear interest at a rate of LIBOR plus 1.875%. The loan is non-recourse to Newmont.
Proceeds received during 2005 were primarily from the issuance of 30-year 5 7/8% notes for net proceeds of$582 during March 2005. The proceeds were used to fund capital investments, including a 200 megawatt powerplant in Nevada, and for general corporate purposes.
69

Repayment of debt. During 2007, we made debt repayments of $2,036 (including $1,877 on the revolvingcredit facility, $21 related to the sale-leaseback of the refractory ore treatment plant, classified as a capital lease,$11 on the Yanacocha credit facility, $4 on Australia capital leases, and $123 related to Batu Hijau).
Scheduled minimum debt repayments are $255 in 2008, $138 in 2009, $143 in 2010, $322 in 2011, $135 in2012 and $1,945 thereafter. We expect to be able to fund maturities of our debt from Net cash provided byoperating activities and existing cash balances.
Dividends paid to minority interests. We also paid dividends of $270, $264 and $186 to minority interestsduring 2007, 2006 and 2005, respectively.
Dividends paid to common stockholders. We paid annual dividends of $0.40 per common share during 2007,2006 and 2005. Additionally, Newmont Mining Corporation of Canada Limited, a subsidiary of the Company,paid annual dividends of CDN$0.43, CDN$0.46 and CDN$0.49 during 2007, 2006 and 2005, respectively. OnFebruary 20, 2008, we declared a regular quarterly dividend of $0.10 per share, payable March 28, 2008 toholders of record at the close of business on March 7, 2008. The total paid to common stockholders was $181,$180 and $179 for 2007, 2006 and 2005, respectively.
Proceeds from stock issuance. We received proceeds of $51, $78 and $43 during 2007, 2006 and 2005,respectively, from the issuance of common stock related to the exercise of stock options.
Early extinguishment of prepaid forward sales obligation. In September 2006, we settled our remainingobligations under the prepaid forward gold sales contract and forward gold purchase contract for which we wererequired to deliver 17,951 ounces of gold in December 2006 and 179,062 ounces of gold in June 2007. Thissettlement resulted in cash payments of approximately $96 and a $48 reduction to the current portion of long-term debt.
Discontinued Operations
Net operating cash provided from discontinued operations was $138 in 2007, compared to $96 and $74 in2006 and 2005, respectively, as follows:
Years Ended December 31,
2007 2006 2005
Royalty portfolio . . . . . . . . . . . . . . . . . . . . . . . . . . . . . . . . . . . . . . . . . . . . . $ 90 $ 74 $ 48Pajingo . . . . . . . . . . . . . . . . . . . . . . . . . . . . . . . . . . . . . . . . . . . . . . . . . . . . . 48 34 26Zarafshan . . . . . . . . . . . . . . . . . . . . . . . . . . . . . . . . . . . . . . . . . . . . . . . . . . . — 10 10Holloway . . . . . . . . . . . . . . . . . . . . . . . . . . . . . . . . . . . . . . . . . . . . . . . . . . . — (22) (14)Golden Grove . . . . . . . . . . . . . . . . . . . . . . . . . . . . . . . . . . . . . . . . . . . . . . . . — — 4
$138 $ 96 $ 74
Net cash provided from investing activities of discontinued operations was $1,318, $285 and $178 in 2007,2006 and 2005, respectively.
Cash provided from investing activities of discontinued operations in 2007 included $1,187 from the sale ofthe royalty portfolio, $10 from the sale of the Pajingo operation, $77 net proceeds on the settlement of theZarafshan-Newmont Joint Venture dispute, and $90 from the sale of marketable equity securities and costinvestments offset by $4 investments in marketable equity securities and cost investments and additions toproperty, plant and mine development of $6.
Cash provided from investing activities of discontinued operations in 2006 included $271 proceeds from thesale of the Alberta Oil Sands project, $42 on the sale of the Martabe project, $40 on the sale of the Holloway
70
operation, $9 from the sale of the 49% interest in Regis Resources NL and $8 proceeds from the sale ofmarketable equity securities offset by $12 investments in marketable securities and cost investments andadditions to property, plant and mine development of $20.
Cash provided from investing activities of discontinued operations in 2005 included $147 from the sale ofGolden Grove, $31 from the sale of the Mezcala gold deposit and $213 from the sale of marketable equitysecurities offset by $11 investments in marketable securities and cost investments and additions to property, plantand mine development of $47.
Net cash used in financing activities of discontinued operations was $nil, $7 and $1 in 2007, 2006 and 2005,respectively, all from the repayment of debt at Zarafshan.
Corporate Revolving Credit Facilities
The Company has an uncollateralized $2,000 revolving credit facility with a syndicate of commercial banks,which matures in April 2012. The facility contains a letter of credit sub-facility. Interest rates and facility feesvary based on the credit ratings of the Company’s senior, uncollateralized, long-term debt. Borrowings under thefacilities bear interest at an annual interest rate of LIBOR plus a margin of 0.28% or the lead bank’s primeinterest rate. Facility fees accrue at an annual rate of 0.07% of the aggregate commitments. The Company alsopays a utilization fee of 0.05% on the amount of revolving credit loans and letters of credit outstanding under thefacility for each day on which the sum of such loans and letters of credit exceed 50% of the commitments underthe facility. As of December 31, 2007 and 2006, the facility fees were 0.07% and 0.09% of the commitment,respectively. There was $440 and $321 outstanding under the letter of credit sub-facility as of December 31,2007 and 2006, respectively. As of December 31, 2007 we had $2,000 of the credit facility borrowings available.
Debt Covenants
The 57⁄8% notes, Newmont Australia 75⁄8% notes, 85⁄8% debentures, and sale-leaseback of the refractoryore treatment plant debt facilities contain various common public debt covenants and default provisions includingpayment defaults, limitation on liens, limitation on sales and leaseback agreements and merger restrictions.
In addition to the covenants noted above, the corporate revolving credit facility contains a financial ratiocovenant requiring the Company to maintain a net debt (total debt net of cash, cash equivalents and auction ratesecurities) to total capitalization ratio of less than or equal to 62.5%. Furthermore, the corporate revolving creditfacility contains covenants limiting the sale of all or substantially all of our assets, certain change of controlprovisions and a negative pledge on certain assets.
Certain of our project debt facilities contain debt covenants and default provisions including limitations ondividends subject to certain debt service cover ratios, limitations on sales of assets, negative pledges on certainassets, restricted payments to partners, change of control provisions and limitations of additional permitted debt.
As of December 31, 2007, the Company and its related entities were in compliance with all debt covenantsand default provisions.
Shelf Registration Statement
In October 2007, we filed with the Securities and Exchange Commission a shelf registration statement onForm S-3 which enables the Company to issue an indeterminate number or amount of common stock, preferredstock, debt securities, guarantees of debt securities and warrants from time to time at indeterminate prices. It alsoincluded the resale of an indeterminate amount of common stock, preferred stock and debt securities from time totime upon exercise of warrants or conversion of convertible securities.
71

Contractual Obligations
Our contractual obligations as of December 31, 2007 are summarized as follows:
Payments Due by Period
Contractual Obligations TotalLess than
1 Year1-3
Years3-5
YearsMore than
5 Years
Debt(1) . . . . . . . . . . . . . . . . . . . . . . . . . . . . . . . . . . . . . . . . . . . . . . . $3,859 $324 $ 732 $242 $2,561Capital lease obligations(1) . . . . . . . . . . . . . . . . . . . . . . . . . . . . . . . 332 47 133 107 45Remediation and reclamation obligations(2) . . . . . . . . . . . . . . . . . 1,110 79 191 81 759Employee-related benefits(3) . . . . . . . . . . . . . . . . . . . . . . . . . . . . . 213 61 94 37 21FIN 48 liability and interest(4) . . . . . . . . . . . . . . . . . . . . . . . . . . . . 171 — — — 171Operating leases . . . . . . . . . . . . . . . . . . . . . . . . . . . . . . . . . . . . . . . 31 5 14 4 8Minimum royalty payments . . . . . . . . . . . . . . . . . . . . . . . . . . . . . . 135 11 52 28 44Purchase obligations(5) . . . . . . . . . . . . . . . . . . . . . . . . . . . . . . . . . . 271 199 40 13 19Other(6) . . . . . . . . . . . . . . . . . . . . . . . . . . . . . . . . . . . . . . . . . . . . . . 429 138 240 46 5
$6,551 $864 $1,496 $558 $3,633
(1) Amounts represent principal ($2,938) and estimated interest payments ($1,252) assuming no earlyextinguishment.
(2) Mining operations are subject to extensive environmental regulations in the jurisdictions in which theyoperate. Pursuant to environmental regulations, we are required to close our operations and reclaim andremediate the lands that operations have disturbed. The estimated undiscounted cash outflows of theseremediation and reclamation obligations are reflected here. For more information regarding remediation andreclamation liabilities, see Note 24 to the Consolidated Financial Statements.
(3) Contractual obligations for Employee-related benefits include severance, workers’ participation, pensionfunding and other benefit plans. Pension plan funding beyond 2012 cannot be reasonably estimated givenvariable market conditions and actuarial assumptions and are not included.
(4) As of December 31, 2007, the Company’s FIN 48 liability and FIN 48 net interest payable were $134 and$37, respectively. We are unable to reasonably estimate the timing of FIN 48 liability and interest paymentsbeyond 2008 due to uncertainties in the timing of the effective settlement of tax positions.
(5) Purchase obligations are not recorded in the Consolidated Financial Statements. Purchase obligationsrepresent contractual obligations for purchase of power, materials and supplies, consumables, inventoriesand capital projects.
(6) Other contractual obligations that are not reflected in our Consolidated Financial Statements include laborand service contracts. Payments related to derivative contracts cannot be reasonably estimated givenvariable market conditions. See Note 14 to the Consolidated Financial Statements.
Off-Balance Sheet Arrangements
We have the following off-balance sheet arrangements: operating leases as disclosed in the above table and$662 of outstanding letters of credit, surety bonds and bank guarantees (see Note 20 to the ConsolidatedFinancial Statements). There is also an undrawn contingent sponsor support line of credit to Batu Hijau of $65, ofwhich Newmont’s pro rata share is $37.
Batu Hijau has sales agreements to sell copper concentrates as follows (in thousands of tons) 679 in 2008;697 in 2009; 834 in 2010, 730 in 2011, 725 in 2012 and 659 thereafter. For information regarding these coppersales agreements, see Item 7A, Quantitative and Qualitative Disclosures about Market Risk-Hedging, ProvisionalCopper and Gold Sales, below.
72

Future Cash Flows
We anticipate that significant capital expenditures in 2008 through 2009 (see Investing Activities, above),funding of exploration and advanced projects, debt repayments and dividends to both common shareholders andminority interests could lead to Net cash used in investing activities and Net cash used in financing activitiesexceeding Net cash provided by operating activities. We believe that financing required to execute all of theseinvestments will be available over the time period required from Net cash provided by operating activities, cash,marketable equity securities or other sources of funds, including our revolving credit facility, project financingand financing alternatives available in the broader capital markets. For information on the Company’s long-termdebt, capital lease obligations and operating leases, see Note 20 to the Consolidated Financial Statements.
Cash flows are expected to be impacted by variations in the realized spot price of gold and copper. Forinformation on the sensitivity of Newmont’s Net cash provided by operating activities to metal prices, seeItem 7A, Quantitative and Qualitative Disclosures about Market Risk.
Cash flows are also expected to be impacted by variations in foreign currency exchange rates in relation tothe U.S. dollar, particularly with respect to the Australian and Canadian dollars. Accordingly, in 2007, Newmonthas entered into derivative instruments to reduce the volatility of Costs applicable to sales in Australia/NewZealand. For information concerning the sensitivity of the Company’s Costs applicable to sales to changes inforeign currency exchange rates, see Results of Consolidated Operations, Foreign Currency Exchange Rates,above. For information on the sensitivity of Newmont’s Net cash provided from operating activities to foreigncurrency exchange rates, see Item 7A, Quantitative and Qualitative Disclosures about Market Risk.
Based on our production profile as of December 31, 2007, we expect that consolidated gold ounces sold willbe between 5.9 and 6.4 million ounces in 2008. We do not anticipate that reasonably expected variations in goldor copper sales alone will influence our ability to pay our debt and other obligations in 2008.
Environmental
Our mining and exploration activities are subject to various federal and state laws and regulations governingthe protection of the environment. These laws and regulations are continually changing and are generallybecoming more restrictive. We conduct our operations so as to protect the public health and environment andbelieve our operations are in compliance with applicable laws and regulations in all material respects. We havemade, and expect to make in the future, expenditures to comply with such laws and regulations, but cannotpredict the full amount of such future expenditures. Estimated future reclamation costs are based principally onlegal and regulatory requirements. As of December 31, 2007 and 2006, $569 and $513, respectively, wereaccrued for reclamation costs relating to currently producing mineral properties, of which $57 is classified ascurrent liabilities expected to be spent in 2008.
In addition, we are involved in several matters concerning environmental obligations associated with formermining activities. Generally, these matters concern developing and implementing remediation plans at thevarious sites involved. We believe that the related environmental obligations associated with these sites aresimilar in nature with respect to the development of remediation plans, their risk profile and the compliancerequired to meet general environmental standards. Based upon our best estimate of our liability for these matters,$125 and $85 were accrued for such obligations as of December 31, 2007 and 2006, respectively. Dependingupon the ultimate resolution of these matters, we believe that it is reasonably possible that the liability for thesematters could be as much as 61% greater or 18% lower than the amount accrued as of December 31, 2007. Theamounts accrued for these matters are reviewed periodically based upon facts and circumstances available at thetime. Changes in estimates are charged to Other expense, net in the period estimates are revised.
We spent $13, $12 and $14 in 2007, 2006 and 2005, respectively, for environmental obligations related toformer, primarily historic, mining activities, and have classified $14 as a current liability expected to be spent in2008. Expenditures for 2007, 2006 and 2005 related primarily to legacy Normandy properties in Australia, theMcCoy/Cove property in Nevada and the Dawn mill site near Ford, Washington.
73
Included in capital expenditures were $90, $124 and $35 in 2007, 2006 and 2005, respectively, to complywith environmental regulations. Ongoing costs to comply with environmental regulations have not been asignificant component of Costs applicable to sales.
Included in Other long-term assets is $28 of restricted cash that is legally restricted for purposes of settlingasset retirement obligations related to Hope Bay and former Miramar operations.
For more information on the Company’s reclamation and remediation liabilities, see Note 24 to theConsolidated Financial Statements.
Forward-Looking Statements
The foregoing discussion and analysis, as well as certain information contained elsewhere in this AnnualReport, contain “forward-looking statements” within the meaning of Section 27A of the Securities Act of 1933,as amended, and Section 21E of the Securities Exchange Act of 1934, as amended, and are intended to becovered by the safe harbor created thereby. See the discussion in Forward-Looking Statements in Item 1,Business.
74
ITEM 7A. QUANTITATIVE AND QUALITATIVE DISCLOSURES ABOUT MARKET RISK (dollars inmillions except per share, per ounce and per pound amounts)
Metal Price
Changes in the market price of gold and copper significantly affect our profitability and cash flow. Goldprices can fluctuate widely due to numerous factors, such as demand; forward selling by producers; central banksales, purchases and lending; investor sentiment; the relative strength of the U.S. dollar and global mineproduction levels. Copper is traded on established international exchanges and copper prices generally reflectmarket supply and demand, but can also be influenced by speculative trading in the commodity or by currencyexchange rates.
Foreign Currency
Changes in the foreign currency exchange rates in relation to the U.S. dollar may affect our profitability andcash flow. Foreign currency exchange rates can fluctuate widely due to numerous factors, such as supply anddemand for foreign and U.S. currencies and U.S. and foreign country economic conditions. In addition to itsoperations in the United States, we have assets or operations in Australia, Peru, Indonesia, Canada, Bolivia, NewZealand, Ghana and Mexico. Our non-U.S. operations sell their metal production based on a U.S. dollar goldprice. Fluctuations in the local currency exchange rates in relation to the U.S. dollar can increase or decreaseprofit margins and Costs applicable to sales per ounce to the extent costs are paid in local currency at foreignoperations. The Australian dollar/U.S. dollar exchange rate has had the greatest impact on our Costs applicable tosales, as measured in U.S. dollars. However, variations in the Australian dollar/U.S. dollar exchange rate havehistorically been strongly correlated to variations in the U.S. dollar gold price over the long-term. Increases ordecreases in costs at Australian gold operations due to exchange rate changes have therefore tended to bemitigated by changes in sales reported in U.S. dollars for such locations. No assurance can be given that theAustralian dollar/U.S. dollar exchange rate will continue to be strongly correlated to the U.S. dollar gold price inthe future, or that short-term changes in the Australian dollar/U.S. dollar exchange rate will not have an impacton our profitability and cash flow. Foreign currency exchange rates in relation to the U.S. dollar have not had amaterial impact on our determination of proven and probable reserves in the past. However, if a sustainedweakening of the U.S. dollar in relation to the Australian dollar, and/or to other foreign currencies that impactour cost structure, were not mitigated by offsetting increases in the U.S. dollar gold price or by other factors,profitability, cash flows and the amount of proven and probable reserves in the applicable foreign country couldbe reduced. The extent of any such reduction would be dependent on a variety of factors including the length oftime of any such weakening of the U.S. dollar, and management’s long-term view of the applicable exchangerate. For information concerning the sensitivity of our Costs applicable to sales to changes in foreign currencyexchange rates, see Item 7, Management’s Discussion and Analysis of Consolidated Results of Operations andFinancial Condition-Results of Consolidated Operations-Foreign Currency Exchange Rates, above.
Hedging
We generally avoid gold hedging. Our philosophy is to provide shareholders with leverage to changes in thegold price by selling our gold production at market prices. We have, however, entered into derivative contracts toprotect the selling price for certain anticipated gold and copper production and to manage risks associated withcommodities, interest rates and foreign currencies.
By using derivatives, we are affected by credit risk, market risk and market liquidity risk. Credit risk is therisk that a third party might fail to fulfill its performance obligations under the terms of a financial instrument.We mitigate credit risk by entering into derivatives with high credit quality counterparties, limiting the amount ofexposure to each counterparty, and monitoring the financial condition of the counterparties. Market risk is therisk that the fair value of a derivative might be adversely affected by a change in underlying commodity prices,interest rates, or currency exchange rates, and that this in turn affects our financial condition. We manage marketrisk by establishing and monitoring parameters that limit the types and degree of market risk that may beundertaken. We mitigate this risk by establishing trading agreements with counterparties under which we are not
75

required to post any collateral or make any margin calls on our derivatives. Our counterparties cannot requiresettlement solely because of an adverse change in the fair value of a derivative. Market liquidity risk is the riskthat a derivative cannot be eliminated quickly, by either liquidating it or by establishing an offsetting position.Under the terms of our trading agreements, counterparties cannot require us to immediately settle outstandingderivatives, except upon the occurrence of customary events of default such as covenant breeches, includingfinancial covenants, insolvency or bankruptcy. We generally mitigate market liquidity risk by spreading out thematurity of our derivatives over time.
During 2007, 2006, and 2005, we entered into IDR/$ forward purchase contracts to hedge a portion of ourIDR/$ operating expenditure exposure. In 2007, we entered into two programs in Australia/New Zealand tohedge a portion of our A$ operating expenditure exposure and our A$ capital expenditure exposure related to theconstruction of the Boddington project. All of the currency contracts have been designated as cash flow hedgesof future expenditures, and as such, changes in the market value have been recorded in Accumulated othercomprehensive income. During 2005 and 2006, we entered into copper option collar contracts to hedge thecopper price realized during those periods. Final delivery under the copper collar contracts occurred in February2007. As of December 31, 2006, approximately 13 million pounds of copper were hedged by the copper collarcontracts, which had been designated as cash flow hedges of forecasted copper sales, and as such, changes in thefair value related to the effective portion of the hedges were recorded in Accumulated other comprehensiveincome. As of December 31, 2006, approximately 89 million pounds of copper option collar contracts wereaccounted for on a mark-to-market basis currently through earnings.
For 2007, 2006 and 2005, net gains (losses) of $4, ($60) and $2, respectively, were included in Otherincome, net for the ineffective portion of derivative instruments designated as cash flow hedges. The amount tobe reclassified from Accumulated other comprehensive income (loss), net of tax to income for derivativeinstruments during the next 12 months is a gain of approximately $8. The maximum period over which hedgedforecasted transactions are expected to occur is 4 years.
Foreign Currency Contracts
We had the following foreign currency derivative contracts outstanding as of December 31, 2007:
Expected Maturity DateFair Value
At December 31,
2008 2009 2010Total/
Average 2007 2006
IDR Forward Purchase Contracts:$ (millions) . . . . . . . . . . . . . . . . . . . . . . . . . . . . . . . . . . $ 97 $ — $ — $ 97 $ (1)(1) $ 4(1)
Average rate (IDR/$) . . . . . . . . . . . . . . . . . . . . . . . . . . 9,422 — — 9,422A$ Operating Forward Purchase Contracts:
$ (millions) . . . . . . . . . . . . . . . . . . . . . . . . . . . . . . . . . . $ 118 $ 105 $ 75 $ 298 $ —(2) $ —Average rate ($/A$) . . . . . . . . . . . . . . . . . . . . . . . . . . . 0.8558 0.8323 0.8123 0.8362
A$ Capital Forward Purchase Contracts:$ (millions) . . . . . . . . . . . . . . . . . . . . . . . . . . . . . . . . . . $ 205 $ — $ — $ 205 $ (1)(3) $ —Average rate ($/A$) . . . . . . . . . . . . . . . . . . . . . . . . . . . 0.8676 — — 0.8676
A$ Capital Call Option Contracts:$ (millions) . . . . . . . . . . . . . . . . . . . . . . . . . . . . . . . . . . $ 75 $ — $ — $ 75 $ 1(3) $ —Average rate ($/A$) . . . . . . . . . . . . . . . . . . . . . . . . . . . 0.8876 — — 0.8876
(1) The fair value of the IDR operating forward purchase contracts includes $(1) in Derivative instruments as ofDecember 31, 2007 and $4 in Other current assets as of December 31, 2006.
(2) The fair value of the A$ operating forward purchase contracts includes $2 in Other current assets, $2 inOther Long-term assets, $(1) in Derivative instruments, and $(3) in Other long-term liabilities as ofDecember 31, 2007.
(3) The fair value of the capital hedge program related to the construction of the Boddington project includes $1in Other current assets for A$ bought call option contracts and $(1) in Derivative instruments for A$forward purchase contracts as of December 31, 2007.
76
We had copper collar contracts with a fair value of $(173) and gold put option contracts of $(1) outstandingat December 31, 2006 included in Derivative instruments. Final delivery under the copper collar contractsoccurred in February 2007.
Interest Rate Swap Contracts
At December 31, 2007, we had $100 fixed to floating swap contracts designated as a hedge against a portionof its $275 85⁄8% debentures expiring in 2011. In 2001, Newmont entered into contracts to hedge a portion of theinterest rate risk exposure on a portion of its $275 85⁄8% debentures expiring in 2011 and its $200 83⁄8%debentures which expired in 2005. Under the $275 85⁄8% debentures hedge contract terms, we receive fixed-rateinterest payments at 8.625% and pay floating-rate interest amounts based on periodic London Interbank OfferedRate (“LIBOR”) settings plus a spread, ranging from 2.60% to 3.49%. Prior to expiration of the $200 83⁄8%debentures and associated hedge contracts, Newmont received fixed-rate interest payments of 8.375% and paidfloating-rate interest amounts based on periodic LIBOR settings, plus a spread, ranging from 3.41% to 4.25%.These transactions resulted in a reduction in interest expense of $nil, $nil and $3 for the years endedDecember 31, 2007, 2006 and 2005, respectively. The fair value of the interest rate swaps was $4 and $1 atDecember 31, 2007 and 2006, respectively.
Provisional Copper and Gold Sales
Our sales based on a provisional sales price contain an embedded derivative that is required to be separatedfrom the host contract for accounting purposes. The host contract is the receivable from the sale of theconcentrates at the forward London Metal Exchange price at the time of sale. The embedded derivative, whichdoes not qualify for hedge accounting, is marked to market through earnings each period prior to final settlement.As of December 31, 2007 and 2006, respectively, we had embedded copper derivatives on 113 million poundsand 186 million pounds, recorded at an average price of $3.02 and $2.87 per pound, respectively. As ofDecember 31, 2007 and 2006, respectively, we had embedded gold derivatives on 8,000 ounces and 69,000ounces, recorded at an average price of $827.70 and $637.96 per ounce, respectively.
For 2007, 2006 and 2005, Batu Hijau recorded the following gross revenues before treatment and refiningcharges, which were subject to final price adjustments as of December 31, 2007, 2006 and 2005, as follows:
At December 31,
2007 2006 2005
Gross revenue subject to final price adjustmentsCopper . . . . . . . . . . . . . . . . . . . . . . . . . . . . . . . . . . . . . . . . . . . . . $340 $535 $447Gold . . . . . . . . . . . . . . . . . . . . . . . . . . . . . . . . . . . . . . . . . . . . . . . $ 7 $ 44 $ 19
The average final price adjustments realized were as follows:
Years Ended December 31,
2007 2006 2005
Average final price adjustmentsCopper . . . . . . . . . . . . . . . . . . . . . . . . . . . . . . . . . . . . . . . . . . . . . 1% 31% 12%Gold . . . . . . . . . . . . . . . . . . . . . . . . . . . . . . . . . . . . . . . . . . . . . . . 5% 3% 1%
Price-capped Forward Sales Contracts
In June 2007, the Company paid $578 to settle all of the 1.85 million ounce price-capped forward salescontracts which were accounted for as normal sales contracts under SFAS No. 133 “Accounting for DerivativeInstruments and Hedging Activities” and SFAS No. 138 “Accounting for Certain Derivative Instruments andCertain Hedging Activities-an Amendment to SFAS No. 133.” The Company reported a $531 pre-tax loss on theearly settlement of the contracts, after a $47 reversal of previously recognized deferred revenue in 2007. SeeNote 3 for additional details.
77

Copper Collar Contracts
During 2005 and 2006, Newmont entered into copper option collar contracts to hedge the copper pricerealized during those periods. Final delivery under the copper collar contracts occurred in February 2007. As ofDecember 31, 2006, approximately 13 million pounds of copper were hedged by the copper option collarcontracts, which had been designated as cash flow hedges of forecasted copper sales. As such, changes in the fairvalue related to the effective portion of the hedges were recorded in Accumulated other comprehensive income.As of December 31, 2006, approximately 89 million pounds of copper option collar contracts were accounted foron a mark-to-market basis through earnings, and the fair value of the copper collar contracts at December 31,2006 was $(173).
Fixed and Variable Rate Debt
We have both fixed and variable rate debt. 86% and 74% of debt was fixed and 14% and 26% was variableas of December 31, 2007 and 2006, respectively. We have managed some of our fixed rate debt exposure byentering into interest rate swaps (see Interest Rate Swap Contracts above). Our fixed rate debt exposure as ofDecember 31, 2007 and 2006 is summarized as follows:
2007 2006
Carrying value of fixed rate debt(1) . . . . . . . . . . . . . . . . . . . . . . . . . . . . . . . . . . . . . . . . . . . . . $ 1,965 $ 934Fair value of fixed rate debt(1) . . . . . . . . . . . . . . . . . . . . . . . . . . . . . . . . . . . . . . . . . . . . . . . . . $ 2,206 $ 919Pro forma fair value sensitivity of fixed rate debt of a +/–10 basis point interest rate
change(2) . . . . . . . . . . . . . . . . . . . . . . . . . . . . . . . . . . . . . . . . . . . . . . . . . . . . . . . . . . . . . . . . $+/–10.8 $ +/–8.2
(1) Excludes specialized and hybrid debt instruments for which it is not practicable to estimate fair values andpro forma fair values or sensitivities. These instruments include the Sale-Leaseback of the Refractory OreTreatment Plant, PTNNT project financing facility, PTNNT partner loan, Yanacocha project financing andcertain capital leases. The estimated fair value quoted above may or may not reflect the actual trading valueof these instruments.
(2) The pro forma information assumes a +/–10 basis point change in market interest rates as of December 31 ofeach year, and reflects the corresponding estimated change in the fair value of fixed rate debt outstanding atthat date under that assumption. Actual changes in the timing and amount of interest rate variations maydiffer from the above assumptions.
78

ITEM 8. FINANCIAL STATEMENTS AND SUPPLEMENTARY DATA
MANAGEMENT’S REPORT ON INTERNAL CONTROL OVER FINANCIAL REPORTING
The management of the Company is responsible for establishing and maintaining adequate internal controlover financial reporting. Internal control over financial reporting is a process designed by, or under thesupervision of, the company’s principal executive and principal financial officers and effected by the company’sboard of directors, management and other personnel, to provide reasonable assurance regarding the reliability offinancial reporting and the preparation of financial statements for external purposes in accordance with generallyaccepted accounting principles. Because of its inherent limitations, internal control over financial reporting maynot prevent or detect misstatements. Also, projections of any evaluation of effectiveness to future periods aresubject to risk that controls may become inadequate because of changes in conditions, or that the degree ofcompliance with the policies or procedures may deteriorate.
The Company’s management assessed the effectiveness of the Company’s internal control over financialreporting as of December 31, 2007. In making this assessment, the Company’s management used the criteria setforth by the Committee of Sponsoring Organizations of the Treadway Commission (COSO) in Internal Control-Integrated Framework. Based upon its assessment, management concluded that, as of December 31, 2007, theCompany’s internal control over financial reporting was effective. Excluded from this assessment was MiramarMining Corporation which was acquired by the Company in December 2007. Registrants are permitted toexclude acquisitions from their assessment of internal control over financial reporting during the first year if,among other circumstances and factors, there is not adequate time between the consummation date of theacquisition and the assessment date for internal controls. The total assets and revenues of the Miramar businessrepresent 10% and 0% of the Company’s consolidated total assets and revenues, respectively, for the year endedDecember 31, 2007.
The effectiveness of the Company’s assessment of internal control over financial reporting as ofDecember 31, 2007 has been audited by PricewaterhouseCoopers LLP, an independent registered publicaccounting firm, as stated in their report which appears herein.
79
REPORT OF INDEPENDENT REGISTERED PUBLIC ACCOUNTING FIRM
To the Board of Directors and Shareholders of Newmont Mining Corporation:
In our opinion, the accompanying consolidated balance sheets and the related consolidated statements of (loss)income, comprehensive income, stockholders’ equity and cash flows present fairly, in all material respects, thefinancial position of Newmont Mining Corporation and its subsidiaries as of December 31, 2007 and 2006, and theresults of their operations and their cash flows for each of the three years in the period ended December 31, 2007 inconformity with accounting principles generally accepted in the United States of America. Also in our opinion, theCompany maintained, in all material respects, effective internal control over financial reporting as of December 31,2007, based on criteria established in Internal Control—Integrated Framework issued by the Committee of SponsoringOrganizations of the Treadway Commission (COSO). The Company’s management is responsible for these financialstatements, for maintaining effective internal control over financial reporting and for its assessment of the effectivenessof internal control over financial reporting, included in Management’s Report on Internal Control Over FinancialReporting appearing under Item 8. Our responsibility is to express opinions on these financial statements and on theCompany’s internal control over financial reporting based on our integrated audits. We conducted our audits inaccordance with the standards of the Public Company Accounting Oversight Board (United States). Those standardsrequire that we plan and perform the audits to obtain reasonable assurance about whether the financial statements arefree of material misstatement and whether effective internal control over financial reporting was maintained in allmaterial respects. Our audits of the financial statements included examining, on a test basis, evidence supporting theamounts and disclosures in the financial statements, assessing the accounting principles used and significant estimatesmade by management, and evaluating the overall financial statement presentation. Our audit of internal control overfinancial reporting included obtaining an understanding of internal control over financial reporting, assessing the riskthat a material weakness exists, and testing and evaluating the design and operating effectiveness of internal controlbased on the assessed risk. Our audits also included performing such other procedures as we considered necessary inthe circumstances. We believe that our audits provide a reasonable basis for our opinions.
As discussed in Note 2 to the consolidated financial statements, the Company changed its method of accountingfor uncertain tax positions effective January 1, 2007 and changed its methods of accounting for share-based payments,stripping costs incurred during the production phase and defined benefit pension and other post retirement plans alleffective January 1, 2006.
A company’s internal control over financial reporting is a process designed to provide reasonable assuranceregarding the reliability of financial reporting and the preparation of financial statements for external purposes inaccordance with generally accepted accounting principles. A company’s internal control over financial reportingincludes those policies and procedures that (i) pertain to the maintenance of records that, in reasonable detail,accurately and fairly reflect the transactions and dispositions of the assets of the company; (ii) provide reasonableassurance that transactions are recorded as necessary to permit preparation of financial statements in accordance withgenerally accepted accounting principles, and that receipts and expenditures of the company are being made only inaccordance with authorizations of management and directors of the company; and (iii) provide reasonable assuranceregarding prevention or timely detection of unauthorized acquisition, use, or disposition of the company’s assets thatcould have a material effect on the financial statements.
Because of its inherent limitations, internal control over financial reporting may not prevent or detectmisstatements. Also, projections of any evaluation of effectiveness to future periods are subject to the risk that controlsmay become inadequate because of changes in conditions, or that the degree of compliance with the policies orprocedures may deteriorate.
As described in Management’s Report on Internal Control Over Financial Reporting, management has excludedMiramar Mining Corporation from its assessment of internal control over financial reporting as of December 31, 2007,because it was acquired in a purchase business combination during December 2007. We have also excluded MiramarMining Corporation from our audit of Internal Control Over Financial Reporting. Miramar Mining Corporation’s totalassets and total revenues represent 10% and 0%, respectively, of the related consolidated financial statement amountsas of and for the year ended December 31, 2007.
/s/ PricewaterhouseCoopers LLPDenver, ColoradoFebruary 20, 2008
80

NEWMONT MINING CORPORATION
STATEMENTS OF CONSOLIDATED (LOSS) INCOME
Years Ended December 31,
2007 2006 2005
(in millions, except per share)Revenues
Sales - gold, net . . . . . . . . . . . . . . . . . . . . . . . . . . . . . . . . . . . . . . . . . . . . . . . . . . . $ 4,305 $4,211 $3,593Sales - copper, net . . . . . . . . . . . . . . . . . . . . . . . . . . . . . . . . . . . . . . . . . . . . . . . . . 1,221 671 672
5,526 4,882 4,265Costs and expenses
Costs applicable to sales (exclusive of loss on settlement of price-cappedforward sales contracts, Midas redevelopment and depreciation, depletionand amortization shown separately below)
Gold . . . . . . . . . . . . . . . . . . . . . . . . . . . . . . . . . . . . . . . . . . . . . . . . . . . . . . . . 2,507 2,146 1,932Copper . . . . . . . . . . . . . . . . . . . . . . . . . . . . . . . . . . . . . . . . . . . . . . . . . . . . . . 471 308 303
Loss on settlement of price-capped forward sales contracts (Note 3) . . . . . . . . . 531 — —Midas redevelopment (Note 4) . . . . . . . . . . . . . . . . . . . . . . . . . . . . . . . . . . . . . . . 11 — —Depreciation, depletion and amortization . . . . . . . . . . . . . . . . . . . . . . . . . . . . . . . 695 589 589Exploration . . . . . . . . . . . . . . . . . . . . . . . . . . . . . . . . . . . . . . . . . . . . . . . . . . . . . . 177 166 143Advanced projects, research and development . . . . . . . . . . . . . . . . . . . . . . . . . . . 62 81 55General and administrative . . . . . . . . . . . . . . . . . . . . . . . . . . . . . . . . . . . . . . . . . . 143 136 120Write-down of goodwill (Note 19) . . . . . . . . . . . . . . . . . . . . . . . . . . . . . . . . . . . . 1,122 — 41Write-down of investments (Note 5) . . . . . . . . . . . . . . . . . . . . . . . . . . . . . . . . . . 46 — —Write-down of long-lived and other assets (Note 5) . . . . . . . . . . . . . . . . . . . . . . . 4 3 41Other expense, net (Note 6) . . . . . . . . . . . . . . . . . . . . . . . . . . . . . . . . . . . . . . . . . 148 159 126
5,917 3,588 3,350Other income (expense)
Other income, net (Note 7) . . . . . . . . . . . . . . . . . . . . . . . . . . . . . . . . . . . . . . . . . . 144 53 106Interest expense, net of capitalized interest of $50, $57 and $39, respectively . . (105) (97) (97)
39 (44) 9(Loss) income from continuing operations before income tax, minority interest and
equity income of affiliates . . . . . . . . . . . . . . . . . . . . . . . . . . . . . . . . . . . . . . . . . . . . (352) 1,250 924Income tax expense (Note 8) . . . . . . . . . . . . . . . . . . . . . . . . . . . . . . . . . . . . . . . . . . . . (200) (326) (270)Minority interest in income of consolidated subsidiaries (Note 9) . . . . . . . . . . . . . . . . (410) (363) (380)Equity (loss) income of affiliates (Note 10) . . . . . . . . . . . . . . . . . . . . . . . . . . . . . . . . . (1) 2 4
(Loss) income from continuing operations . . . . . . . . . . . . . . . . . . . . . . . . . . . . . . . . . . (963) 563 278(Loss) income from discontinued operations (Note 11) . . . . . . . . . . . . . . . . . . . . . . . . (923) 228 44
Net (loss) income . . . . . . . . . . . . . . . . . . . . . . . . . . . . . . . . . . . . . . . . . . . . . . . . . . . . . $(1,886) $ 791 $ 322
(Loss) income from continuing operations per common share, basic . . . . . . . . . . . . . $ (2.13) $ 1.25 $ 0.62(Loss) income from discontinued operations per common share, basic . . . . . . . . . . . . (2.04) 0.51 0.10
Net (loss) income per common share, basic (Note 12) . . . . . . . . . . . . . . . . . . . . . . . . . $ (4.17) $ 1.76 $ 0.72
(Loss) income from continuing operations per common share, diluted . . . . . . . . . . . . $ (2.13) $ 1.25 $ 0.62(Loss) income from discontinued operations per common share, diluted . . . . . . . . . . (2.04) 0.50 0.10
Net (loss) income per common share, diluted (Note 12) . . . . . . . . . . . . . . . . . . . . . . . $ (4.17) $ 1.75 $ 0.72
Basic weighted-average common shares outstanding . . . . . . . . . . . . . . . . . . . . . . . . . 452 450 446
Diluted weighted-average common shares outstanding . . . . . . . . . . . . . . . . . . . . . . . . 452 452 449
Cash dividends declared per common share . . . . . . . . . . . . . . . . . . . . . . . . . . . . . . . . . $ 0.40 $ 0.40 $ 0.40
The accompanying notes are an integral part of these consolidated financial statements.
81

NEWMONT MINING CORPORATION
CONSOLIDATED BALANCE SHEETS
At December 31,
2007 2006
(in millions)ASSETS
Cash and cash equivalents . . . . . . . . . . . . . . . . . . . . . . . . . . . . . . . . . . . . . . . . . . . . . . . . . . . . . . . . . . . $ 1,231 $ 1,166Marketable securities and other short-term investments (Note 15) . . . . . . . . . . . . . . . . . . . . . . . . . . . . 61 109Trade receivables . . . . . . . . . . . . . . . . . . . . . . . . . . . . . . . . . . . . . . . . . . . . . . . . . . . . . . . . . . . . . . . . . . 177 142Accounts receivable . . . . . . . . . . . . . . . . . . . . . . . . . . . . . . . . . . . . . . . . . . . . . . . . . . . . . . . . . . . . . . . . 168 206Inventories (Note 16) . . . . . . . . . . . . . . . . . . . . . . . . . . . . . . . . . . . . . . . . . . . . . . . . . . . . . . . . . . . . . . . 463 376Stockpiles and ore on leach pads (Note 17) . . . . . . . . . . . . . . . . . . . . . . . . . . . . . . . . . . . . . . . . . . . . . . 373 377Deferred income tax assets (Note 8) . . . . . . . . . . . . . . . . . . . . . . . . . . . . . . . . . . . . . . . . . . . . . . . . . . . 112 156Other current assets . . . . . . . . . . . . . . . . . . . . . . . . . . . . . . . . . . . . . . . . . . . . . . . . . . . . . . . . . . . . . . . . 87 93
Current assets . . . . . . . . . . . . . . . . . . . . . . . . . . . . . . . . . . . . . . . . . . . . . . . . . . . . . . . . . . . . . 2,672 2,625Property, plant and mine development, net (Note 18) . . . . . . . . . . . . . . . . . . . . . . . . . . . . . . . . . . . . . . 9,140 6,544Investments (Note 15) . . . . . . . . . . . . . . . . . . . . . . . . . . . . . . . . . . . . . . . . . . . . . . . . . . . . . . . . . . . . . . 1,527 1,319Long-term stockpiles and ore on leach pads (Note 17) . . . . . . . . . . . . . . . . . . . . . . . . . . . . . . . . . . . . . 788 812Deferred income tax assets (Note 8) . . . . . . . . . . . . . . . . . . . . . . . . . . . . . . . . . . . . . . . . . . . . . . . . . . . 1,027 793Other long-term assets . . . . . . . . . . . . . . . . . . . . . . . . . . . . . . . . . . . . . . . . . . . . . . . . . . . . . . . . . . . . . . 234 178Goodwill (Note 19) . . . . . . . . . . . . . . . . . . . . . . . . . . . . . . . . . . . . . . . . . . . . . . . . . . . . . . . . . . . . . . . . 186 1,338Assets of operations held for sale (Note 11) . . . . . . . . . . . . . . . . . . . . . . . . . . . . . . . . . . . . . . . . . . . . . 24 1,992
Total assets . . . . . . . . . . . . . . . . . . . . . . . . . . . . . . . . . . . . . . . . . . . . . . . . . . . . . . . . . . . . . . . $15,598 $15,601
LIABILITIESCurrent portion of long-term debt (Note 20) . . . . . . . . . . . . . . . . . . . . . . . . . . . . . . . . . . . . . . . . . . . . . $ 255 $ 159Accounts payable . . . . . . . . . . . . . . . . . . . . . . . . . . . . . . . . . . . . . . . . . . . . . . . . . . . . . . . . . . . . . . . . . . 339 340Employee-related benefits (Note 21) . . . . . . . . . . . . . . . . . . . . . . . . . . . . . . . . . . . . . . . . . . . . . . . . . . . 153 182Derivative instruments (Note 14) . . . . . . . . . . . . . . . . . . . . . . . . . . . . . . . . . . . . . . . . . . . . . . . . . . . . . . 3 174Income and mining taxes (Note 8) . . . . . . . . . . . . . . . . . . . . . . . . . . . . . . . . . . . . . . . . . . . . . . . . . . . . . 88 337Other current liabilities (Note 23) . . . . . . . . . . . . . . . . . . . . . . . . . . . . . . . . . . . . . . . . . . . . . . . . . . . . . 662 515
Current liabilities . . . . . . . . . . . . . . . . . . . . . . . . . . . . . . . . . . . . . . . . . . . . . . . . . . . . . . . . . . 1,500 1,707Long-term debt (Note 20) . . . . . . . . . . . . . . . . . . . . . . . . . . . . . . . . . . . . . . . . . . . . . . . . . . . . . . . . . . . 2,683 1,752Reclamation and remediation liabilities (Note 24) . . . . . . . . . . . . . . . . . . . . . . . . . . . . . . . . . . . . . . . . 623 521Deferred income tax liabilities (Note 8) . . . . . . . . . . . . . . . . . . . . . . . . . . . . . . . . . . . . . . . . . . . . . . . . . 1,025 626Employee-related benefits (Note 21) . . . . . . . . . . . . . . . . . . . . . . . . . . . . . . . . . . . . . . . . . . . . . . . . . . . 226 309Other long-term liabilities (Note 23) . . . . . . . . . . . . . . . . . . . . . . . . . . . . . . . . . . . . . . . . . . . . . . . . . . . 150 135Liabilities of operations held for sale (Note 11) . . . . . . . . . . . . . . . . . . . . . . . . . . . . . . . . . . . . . . . . . . 394 116
Total liabilities . . . . . . . . . . . . . . . . . . . . . . . . . . . . . . . . . . . . . . . . . . . . . . . . . . . . . . . . . . . . 6,601 5,166
Commitments and contingencies (Note 32)Minority interest in subsidiaries . . . . . . . . . . . . . . . . . . . . . . . . . . . . . . . . . . . . . . . . . . . . . . . . . . . . . . . 1,449 1,098
STOCKHOLDERS’ EQUITYCommon stock - $1.60 par value;
Authorized - 750 million sharesIssued and outstanding -
Common: 435 million and 423 million shares issued, less 304,000 and 246,000 treasuryshares, respectively . . . . . . . . . . . . . . . . . . . . . . . . . . . . . . . . . . . . . . . . . . . . . . . . . . . . . . . 696 677
Exchangeable: 56 million shares issued, less 38 million and 29 million redeemed shares,respectively . . . . . . . . . . . . . . . . . . . . . . . . . . . . . . . . . . . . . . . . . . . . . . . . . . . . . . . . . . . . .
Additional paid-in capital . . . . . . . . . . . . . . . . . . . . . . . . . . . . . . . . . . . . . . . . . . . . . . . . . . . . . . . . . . . . 6,696 6,703Accumulated other comprehensive income (Note 25) . . . . . . . . . . . . . . . . . . . . . . . . . . . . . . . . . . . . . . 957 673Retained (deficit) earnings . . . . . . . . . . . . . . . . . . . . . . . . . . . . . . . . . . . . . . . . . . . . . . . . . . . . . . . . . . . (801) 1,284
Total stockholders’ equity . . . . . . . . . . . . . . . . . . . . . . . . . . . . . . . . . . . . . . . . . . . . . . . . . . . 7,548 9,337
Total liabilities and stockholders’ equity . . . . . . . . . . . . . . . . . . . . . . . . . . . . . . . . . . . . . . . . $15,598 $15,601
The accompanying notes are an integral part of these consolidated financial statements.
82

NEWMONT MINING CORPORATION
STATEMENTS OF CONSOLIDATED CHANGES IN STOCKHOLDERS’ EQUITY
Common Stock Accumulated
Shares Amount
AdditionalPaid-InCapital
RetainedEarnings(Deficit)
OtherComprehensive
Income
TotalStockholders’
Equity
(in millions)
Balance at December 31, 2004 . . . . . . . . . . 446 $656 $6,524 $ 611 $147 $ 7,938Net income . . . . . . . . . . . . . . . . . . . . . . — — — 322 — 322Other comprehensive income . . . . . . . — — — — 231 231Common stock dividends . . . . . . . . . . — — — (179) — (179)Stock based compensation . . . . . . . . . . 2 3 61 — — 64Shares issued in exchange for
exchangeable shares . . . . . . . . . . . . . — 7 (7) — — —
Balance at December 31, 2005 . . . . . . . . . . 448 $666 $6,578 $ 754 $378 $ 8,376Net income . . . . . . . . . . . . . . . . . . . . . . — — — 791 — 791Other comprehensive income . . . . . . . — — — — 322 322Common stock dividends . . . . . . . . . . — — — (180) — (180)Adoption of EITF 04-06 (Note 2) . . . . — — — (81) — (81)Adoption of FAS 158 (Note 2) . . . . . . — — — — (27) (27)Stock based compensation and related
share issuances . . . . . . . . . . . . . . . . . 3 5 131 — — 136Shares issued in exchange for
exchangeable shares . . . . . . . . . . . . . — 6 (6) — — —
Balance at December 31, 2006 . . . . . . . . . . 451 $677 $6,703 $ 1,284 $673 $ 9,337Net loss . . . . . . . . . . . . . . . . . . . . . . . . — — — (1,886) — (1,886)Other comprehensive income . . . . . . . — — — — 284 284Common stock dividends . . . . . . . . . . — — (90) (91) — (181)Adoption of FIN 48 . . . . . . . . . . . . . . . — — — (108) — (108)Stock based compensation and related
share issuances . . . . . . . . . . . . . . . . . 2 4 88 — — 92Shares issued in exchange for
exchangeable shares (Note 20) . . . . — 15 (15) — — —Warrants issued (Note 20) . . . . . . . . . . — — 248 — — 248Call options purchased (net of $128
deferred tax assets) . . . . . . . . . . . . . — — (238) — — (238)
Balance at December 31, 2007 . . . . . . . . . . 453 $696 $6,696 $ (801) $957 $ 7,548
83

NEWMONT MINING CORPORATION
STATEMENTS OF CONSOLIDATED COMPREHENSIVE INCOME
Years Ended December 31,
2007 2006 2005
(in millions)
Net (loss) income . . . . . . . . . . . . . . . . . . . . . . . . . . . . . . . . . . . . . . . . . . . . . . . . . . . . . . $(1,886) $ 791 $ 322Other comprehensive income (loss):
Unrealized gains on marketable equity securities, net of $19, $49 and $61 taxexpense, respectively . . . . . . . . . . . . . . . . . . . . . . . . . . . . . . . . . . . . . . . . . . . . . 113 272 282
Foreign currency translation adjustments . . . . . . . . . . . . . . . . . . . . . . . . . . . . . . . . 138 (14) 26Change in pension liability, net of $18 and $10 tax expense and $10 tax benefit,
respectivelyNet change from periodic valuations . . . . . . . . . . . . . . . . . . . . . . . . . . . . . . . 18 12 (22)Net amount reclassified to income . . . . . . . . . . . . . . . . . . . . . . . . . . . . . . . . . 15 5 4
Net unrecognized loss on pension liability . . . . . . . . . . . . . . . . . . . . . . . 33 17 (18)
Change in fair value of cash flow hedge instruments, net of tax and minority interestsof $1, $26 and $(30), respectively
Net change from periodic revaluations . . . . . . . . . . . . . . . . . . . . . . . . . . . . . . 2 (177) (139)Net amount reclassified to income . . . . . . . . . . . . . . . . . . . . . . . . . . . . . . . . . (2) 224 80
Net unrecognized gain (loss) on derivatives . . . . . . . . . . . . . . . . . . . . . — 47 (59)
Other comprehensive income . . . . . . . . . . . . . . . . . . . . . . . . . . . . . . . . . . . . . . . . . . . . . 284 322 231
Comprehensive income . . . . . . . . . . . . . . . . . . . . . . . . . . . . . . . . . . . . . . . . . $(1,602) $1,113 $ 553
The accompanying notes are an integral part of these consolidated financial statements.
84

NEWMONT MINING CORPORATION
STATEMENTS OF CONSOLIDATED CASH FLOWS
Years Ended December 31,
2007 2006 2005
(in millions)Operating activities:
Net (loss) income . . . . . . . . . . . . . . . . . . . . . . . . . . . . . . . . . . . . . . . . . . . . . . . . . . . . $(1,886) $ 791 $ 322Adjustments to reconcile net income to net cash from continuing operations:
Write-down of goodwill . . . . . . . . . . . . . . . . . . . . . . . . . . . . . . . . . . . . . . . . . . . 1,122 — 41Loss (income) from discontinued operations . . . . . . . . . . . . . . . . . . . . . . . . . . . 923 (228) (44)Depreciation, depletion and amortization . . . . . . . . . . . . . . . . . . . . . . . . . . . . . . 695 589 589Minority interest expense . . . . . . . . . . . . . . . . . . . . . . . . . . . . . . . . . . . . . . . . . . 410 363 380Deferred income taxes . . . . . . . . . . . . . . . . . . . . . . . . . . . . . . . . . . . . . . . . . . . . . (152) (127) (40)Write-down of investments . . . . . . . . . . . . . . . . . . . . . . . . . . . . . . . . . . . . . . . . . 46 — —Stock-based compensation expense . . . . . . . . . . . . . . . . . . . . . . . . . . . . . . . . . . 46 50 27Accretion of accumulated reclamation obligations . . . . . . . . . . . . . . . . . . . . . . . 37 30 27Hedge (gain) loss, net . . . . . . . . . . . . . . . . . . . . . . . . . . . . . . . . . . . . . . . . . . . . . (9) (46) 99Amortization of deferred stripping costs, net . . . . . . . . . . . . . . . . . . . . . . . . . . . — — (56)Revenue from prepaid forward sales obligation . . . . . . . . . . . . . . . . . . . . . . . . . — (48) (48)Other operating adjustments and write-downs . . . . . . . . . . . . . . . . . . . . . . . . . . 48 102 95
Net change in operating assets and liabilities (Note 27) . . . . . . . . . . . . . . . . . . . . . . . (755) (347) (223)
Net cash provided from continuing operations . . . . . . . . . . . . . . . . . . . . . . . . . . . . . . . . . . 525 1,129 1,169Net cash provided from discontinued operations (Note 11) . . . . . . . . . . . . . . . . . . . . . . . . 138 96 74
Net cash from operations . . . . . . . . . . . . . . . . . . . . . . . . . . . . . . . . . . . . . . . . . . . . . . . . . . . 663 1,225 1,243
Investing activities:Additions to property, plant and mine development . . . . . . . . . . . . . . . . . . . . . . . . . . (1,670) (1,537) (1,204)Proceeds from sale of marketable debt securities . . . . . . . . . . . . . . . . . . . . . . . . . . . . 224 2,216 3,145Investments in marketable debt and equity securities . . . . . . . . . . . . . . . . . . . . . . . . . (258) (1,493) (3,291)Acquisitions (Note 13) . . . . . . . . . . . . . . . . . . . . . . . . . . . . . . . . . . . . . . . . . . . . . . . . (953) (348) —Cash received on repayment of Batu Hijau carried interest (Note 9) . . . . . . . . . . . . . 161 — —Other . . . . . . . . . . . . . . . . . . . . . . . . . . . . . . . . . . . . . . . . . . . . . . . . . . . . . . . . . . . . . . 29 20 40
Net cash used in investing activities of continuing operations . . . . . . . . . . . . . . . . . . . . . . (2,467) (1,142) (1,310)Net cash provided from investing activities of discontinued operations (Note 11) . . . . . . 1,354 338 333
Net cash used in investing activities . . . . . . . . . . . . . . . . . . . . . . . . . . . . . . . . . . . . . . . . . . (1,113) (804) (977)
Financing activities:Proceeds from debt, net . . . . . . . . . . . . . . . . . . . . . . . . . . . . . . . . . . . . . . . . . . . . . . . . 3,008 198 583Repayment of debt . . . . . . . . . . . . . . . . . . . . . . . . . . . . . . . . . . . . . . . . . . . . . . . . . . . (2,036) (111) (217)Dividends paid to minority interests . . . . . . . . . . . . . . . . . . . . . . . . . . . . . . . . . . . . . . (270) (264) (186)Dividends paid to common stockholders . . . . . . . . . . . . . . . . . . . . . . . . . . . . . . . . . . (181) (180) (179)Proceeds from stock issuance . . . . . . . . . . . . . . . . . . . . . . . . . . . . . . . . . . . . . . . . . . . 51 78 43Purchase of Company share call options (Note 20) . . . . . . . . . . . . . . . . . . . . . . . . . . (366) — —Issuance of Company share warrants (Note 20) . . . . . . . . . . . . . . . . . . . . . . . . . . . . . 248 — —Early extinguishment of prepaid forward sales obligation . . . . . . . . . . . . . . . . . . . . . — (48) —Change in restricted cash and other . . . . . . . . . . . . . . . . . . . . . . . . . . . . . . . . . . . . . . . 11 (6) (5)
Net cash provided from (used in) financing activities of continuing operations . . . . . . . . 465 (333) 39Net cash used in financing activities of discontinued operations (Note 11) . . . . . . . . . . . . — (7) (1)
Net cash provided from (used in) financing activities . . . . . . . . . . . . . . . . . . . . . . . . . . . . 465 (340) 38
Effect of exchange rate changes on cash . . . . . . . . . . . . . . . . . . . . . . . . . . . . . . . . . . . . . . . 50 3 (3)
Net change in cash and cash equivalents . . . . . . . . . . . . . . . . . . . . . . . . . . . . . . . . . . . . . . 65 84 301Cash and cash equivalents at beginning of period . . . . . . . . . . . . . . . . . . . . . . . . . . . . . . . 1,166 1,082 781
Cash and cash equivalents at end of period . . . . . . . . . . . . . . . . . . . . . . . . . . . . . . . . . . . . . $ 1,231 $ 1,166 $ 1,082
See Note 28 for supplemental cash flow information.
The accompanying notes are an integral part of these consolidated financial statements.
85

NEWMONT MINING CORPORATION
NOTES TO CONSOLIDATED FINANCIAL STATEMENTS(dollars in millions, except per share, per ounce and per pound amounts)
NOTE 1 THE COMPANY
Newmont Mining Corporation and its affiliates and subsidiaries (collectively, “Newmont” or the“Company”) predominantly operate in a single industry, namely, exploration for and production of gold.
The Company’s sales result from operations in the United States, Australia, Peru, Indonesia, Ghana,Canada, Bolivia, New Zealand and Mexico. The cash flow and profitability of the Company’s operations aresignificantly affected by the market price of gold, and to a lesser extent, copper. The prices of gold and coppercan fluctuate widely and are affected by numerous factors beyond the Company’s control.
References to “A$” refers to Australian currency, “CDN$” to Canadian currency, “IDR” to Indonesiancurrency, and “$” to United States currency.
NOTE 2 SUMMARY OF SIGNIFICANT ACCOUNTING POLICIES
Use of Estimates
The Company’s Consolidated Financial Statements have been prepared in accordance with accountingprinciples generally accepted in the United States of America. The preparation of the Company’s ConsolidatedFinancial Statements requires the Company to make estimates and assumptions that affect the reported amountsof assets and liabilities and the related disclosure of contingent assets and liabilities at the date of theConsolidated Financial Statements and the reported amounts of revenues and expenses during the reportingperiod. The more significant areas requiring the use of management estimates and assumptions relate to mineralreserves that are the basis for future cash flow estimates utilized in impairment calculations andunits-of-production depreciation, depletion and amortization calculations; environmental, reclamation andclosure obligations; estimates of recoverable gold and other minerals in stockpile and leach pad inventories;estimates of fair value for certain reporting units and asset impairments (including impairments of goodwill,long-lived assets and investments); write-downs of inventory to net realizable value; post employment, postretirement and other employee benefit liabilities; valuation allowances for deferred tax assets; reserves forcontingencies and litigation; and the fair value and accounting treatment of financial instruments. The Companybases its estimates on historical experience and on various other assumptions that are believed to be reasonableunder the circumstances. Accordingly, actual results may differ significantly from these estimates under differentassumptions or conditions.
Principles of Consolidation
The Consolidated Financial Statements include the accounts of Newmont Mining Corporation and more-than-50%-owned subsidiaries that it controls and entities over which control is achieved through means otherthan voting rights. The Company also includes its pro-rata share of assets, liabilities and operations forunincorporated joint ventures in which it has an interest. All significant intercompany balances and transactionshave been eliminated. The functional currency for the majority of the Company’s operations, including theAustralian operations, is the U.S. dollar. The functional currency of the Canadian operations is the Canadiandollar.
The Company follows FASB Interpretation No. 46R “Consolidation of Variable Interest Entities” (“FIN46R”), which provides guidance on the identification and reporting for entities over which control is achievedthrough means other than voting rights. FIN 46R defines such entities as Variable Interest Entities (“VIEs”).Newmont identified the Nusa Tenggara Partnership (“NTP”) which consolidates P.T. Newmont Nusa Tenggara(“PTNNT” or “Batu Hijau”), as a VIE as a result of certain capital structures and contractual relationships. TheCompany has fully consolidated Batu Hijau in its Consolidated Financial Statements.
86
NEWMONT MINING CORPORATION
NOTES TO CONSOLIDATED FINANCIAL STATEMENTS—(Continued)(dollars in millions, except per share, per ounce and per pound amounts)
Cash and Cash Equivalents
Cash and cash equivalents consist of all cash balances and highly liquid investments with an originalmaturity of three months or less. Because of the short maturity of these investments, the carrying amountsapproximate their fair value. Cash and cash equivalents are invested in United States Treasury bills and high-quality commercial paper. Restricted cash is excluded from cash and cash equivalents and is included in othercurrent and long-term assets.
Investments
Management determines the appropriate classification of its investments in equity securities at the time ofpurchase and reevaluates such determinations at each reporting date. Investments in incorporated entities inwhich the Company’s ownership is greater than 20% and less than 50%, or which the Company does not controlthrough majority ownership or means other than voting rights, are accounted for by the equity method and areincluded in long-term assets. The Company accounts for its equity security investments as available for salesecurities in accordance with Financial Accounting Standards Board (“FASB”) Statement of FinancialAccounting Standards (“FAS”) No. 115, “Accounting for Certain Investments in Debt and Equity Securities.”The Company periodically evaluates whether declines in fair values of its investments below the Company’scarrying value are other-than-temporary in accordance with FSP FAS 115 No. 115-1 and FAS 124-1, “TheMeaning of Other-Than-Temporary Impairment and its Application to Certain Investments.” The Company’spolicy is to generally treat a decline in the investment’s quoted market value that has lasted continuously formore than six months as an other-than-temporary decline in value. The Company also monitors its investmentsfor events or changes in circumstances that have occurred that may have a significant adverse effect on the fairvalue of the investment and evaluates qualitative and quantitative factors regarding the severity and duration ofthe unrealized loss and the Company’s ability to hold the investment until a forecasted recovery occurs todetermine if the decline in value of an investment is other-than-temporary. Declines in fair value below theCompany’s carrying value deemed to be other-than-temporary are charged to earnings. Additional informationconcerning the Company’s equity method and security investments is included in Note 15.
The Company accounts for its investments in auction rate securities in accordance with FAS No. 115.Specifically, when the underlying security of an auction rate security has a stated or contractual maturity date inexcess of 90 days, regardless of the frequency of the interest rate reset date, the security is classified as anavailable-for-sale marketable debt security.
87

NEWMONT MINING CORPORATION
NOTES TO CONSOLIDATED FINANCIAL STATEMENTS—(Continued)(dollars in millions, except per share, per ounce and per pound amounts)
Stockpiles, Ore on Leach Pads and Inventories
As described below, costs that are incurred in or benefit the productive process are accumulated asstockpiles, ore on leach pads and inventories. Stockpiles, ore on leach pads and inventories are carried at thelower of average cost or net realizable value. Net realizable value represents the estimated future sales price ofthe product based on current and long-term metals prices, less the estimated costs to complete production andbring the product to sale. Write-downs of stockpiles, ore on leach pads and inventories, resulting from netrealizable value impairments, are reported as a component of Costs applicable to sales. The current portion ofstockpiles, ore on leach pads and inventories is determined based on the expected amounts to be processed withinthe next 12 months. Stockpiles, ore on leach pads and inventories not expected to be processed within the next 12months are classified as long-term. The major classifications are as follows:
Stockpiles
Stockpiles represent ore that has been mined and is available for further processing. Stockpiles are measuredby estimating the number of tons added and removed from the stockpile, the number of contained ounces orpounds (based on assay data) and the estimated metallurgical recovery rates (based on the expected processingmethod). Stockpile ore tonnages are verified by periodic surveys. Costs are allocated to stockpiles based onrelative values of material stockpiled and processed using current mining costs incurred up to the point ofstockpiling the ore, including applicable overhead, depreciation, depletion and amortization relating to miningoperations, and removed at each stockpile’s average cost per recoverable unit.
Ore on Leach Pads
The recovery of gold from certain gold oxide ores is achieved through the heap leaching process. Under thismethod, oxide ore is placed on leach pads where it is treated with a chemical solution, which dissolves the goldcontained in the ore. The resulting “pregnant” solution is further processed in a plant where the gold is recovered.Costs are added to ore on leach pads based on current mining costs, including applicable depreciation, depletionand amortization relating to mining operations. Costs are removed from ore on leach pads as ounces arerecovered based on the average cost per estimated recoverable ounce of gold on the leach pad.
The estimates of recoverable gold on the leach pads are calculated from the quantities of ore placed on theleach pads (measured tons added to the leach pads), the grade of ore placed on the leach pads (based on assaydata) and a recovery percentage (based on ore type). In general, leach pads recover approximately 50% to 95% ofthe recoverable ounces in the first year of leaching, declining each year thereafter until the leaching process iscomplete.
Although the quantities of recoverable gold placed on the leach pads are reconciled by comparing the gradesof ore placed on pads to the quantities of gold actually recovered (metallurgical balancing), the nature of theleaching process inherently limits the ability to precisely monitor inventory levels. As a result, the metallurgicalbalancing process is constantly monitored and estimates are refined based on actual results over time.Historically, the Company’s operating results have not been materially impacted by variations between theestimated and actual recoverable quantities of gold on its leach pads. Variations between actual and estimatedquantities resulting from changes in assumptions and estimates that do not result in write-downs to net realizablevalue are accounted for on a prospective basis.
88

NEWMONT MINING CORPORATION
NOTES TO CONSOLIDATED FINANCIAL STATEMENTS—(Continued)(dollars in millions, except per share, per ounce and per pound amounts)
In-process Inventory
In-process inventories represent materials that are currently in the process of being converted to a saleableproduct. Conversion processes vary depending on the nature of the ore and the specific processing facility, butinclude mill in-circuit, leach in-circuit, flotation and column cells, and carbon in-pulp inventories. In-processmaterial is measured based on assays of the material fed into the process and the projected recoveries of therespective plants. In-process inventories are valued at the average cost of the material fed into the processattributable to the source material coming from the mines, stockpiles and/or leach pads plus the in-processconversion costs, including applicable depreciation relating to the process facilities incurred to that point in theprocess.
Precious Metals Inventory
Precious metals inventories include gold doré and/or gold bullion. Precious metals that result from theCompany’s mining and processing activities are valued at the average cost of the respective in-processinventories incurred prior to the refining process, plus applicable refining costs.
Concentrate Inventory
Concentrate inventories represent copper and gold concentrate available for shipment. The Company valuesconcentrate inventory at the average cost, including an allocable portion of mill support costs and milldepreciation. Costs are added and removed to the concentrate inventory based on tons of concentrate and arevalued at the lower of average cost or net realizable value.
Materials and Supplies
Materials and supplies are valued at the lower of average cost or net realizable value. Cost includesapplicable taxes and freight.
Property, Plant and Mine Development
Facilities and equipment
Expenditures for new facilities or equipment and expenditures that extend the useful lives of existingfacilities or equipment are capitalized and recorded at cost. The facilities and equipment are depreciated using thestraight-line method at rates sufficient to depreciate such costs over the estimated productive lives, which do notexceed the related estimated mine lives, of such facilities based on proven and probable reserves.
Mine Development
Mine development costs include engineering and metallurgical studies, drilling and other related costs todelineate an ore body, the removal of overburden to initially expose an ore body at open pit surface mines and thebuilding of access ways, shafts, lateral access, drifts, ramps and other infrastructure at underground mines. Costsincurred before mineralization is classified as proven and probable reserves are expensed and classified asExploration or Advanced projects, research and development expense. Capitalization of mine developmentproject costs, that meet the definition of an asset, begins once mineralization is classified as proven and probablereserves.
89

NEWMONT MINING CORPORATION
NOTES TO CONSOLIDATED FINANCIAL STATEMENTS—(Continued)(dollars in millions, except per share, per ounce and per pound amounts)
Drilling and related costs are capitalized for an ore body where proven and probable reserves exist and theactivities are directed at obtaining additional information on the ore body or converting non-reservemineralization to proven and probable reserves and the benefit is expected to be realized over a period beyondone year. All other drilling and related costs are expensed as incurred. Drilling costs incurred during theproduction phase for operational ore control are allocated to inventory costs and then included as a component ofCosts applicable to sales.
The cost of removing overburden and waste materials to access the ore body at an open pit mine prior to theproduction phase are referred to as “pre-stripping costs.” Pre-stripping costs are capitalized during thedevelopment of an open pit mine. Where multiple open pits exist at a mining complex utilizing commonprocessing facilities, pre-stripping costs are capitalized at each pit. The removal and production of de minimissaleable materials may occur during development and are recorded as Other income, net of incremental miningand processing costs.
The production phase of an open pit mine commences when saleable minerals, beyond a de minimisamount, are produced. Stripping costs incurred during the production phase of a mine are variable productioncosts that are included as a component of inventory to be recognized in Costs applicable to sales in the sameperiod as the revenue from the sale of inventory.
The Company’s definition of a mine and the mine’s production phase may differ from that of othercompanies in the mining industry resulting in incomparable allocations of stripping costs to deferred minedevelopment and production costs. Other mining companies may expense pre-stripping costs associated withsubsequent pits within a mining complex.
Mine development costs are amortized using the units-of production (“UOP”) method based on estimatedrecoverable ounces or pounds in proven and probable reserves. To the extent that these costs benefit an entire orebody, they are amortized over the estimated life of the ore body. Costs incurred to access specific ore blocks orareas that only provide benefit over the life of that area are amortized over the estimated life of that specific oreblock or area.
Interest cost allocable to the cost of developing mining properties and to constructing new facilities iscapitalized until assets are ready for their intended use.
Mineral Interests
Mineral interests include acquired interests in production, development and exploration stage properties.The amount capitalized related to a mineral interest represents its fair value at the time it was acquired, either asan individual asset purchase or as a part of a business combination.
The value of such assets is primarily driven by the nature and amount of mineralized material believed to becontained in such properties. Production stage mineral interests represent interests in operating properties thatcontain proven and probable reserves. Development stage mineral interests represent interests in properties underdevelopment that contain proven and probable reserves. Exploration stage mineral interests represent interests inproperties that are believed to potentially contain mineralized material consisting of (i) other mineralizedmaterial such as inferred material within pits; measured, indicated and inferred material with insufficient drillspacing to qualify as proven and probable reserves; and inferred material in close proximity to proven andprobable reserves; (ii) around-mine exploration potential such as inferred material not immediately adjacent to
90
NEWMONT MINING CORPORATION
NOTES TO CONSOLIDATED FINANCIAL STATEMENTS—(Continued)(dollars in millions, except per share, per ounce and per pound amounts)
existing reserves and mineralization but located within the immediate mine area; (iii) other mine-relatedexploration potential that is not part of measured, indicated or inferred material and is comprised mainly ofmaterial outside of the immediate mine area; (iv) greenfields exploration potential that is not associated with anyother production, development or exploration stage property, as described above; or (v) any acquired right toexplore or extract a potential mineral deposit. The Company’s mineral rights generally are enforceable regardlessof whether proven and probable reserves have been established. In certain limited situations, the nature of amineral right changes from an exploration right to a mining right upon the establishment of proven and probablereserves. The Company has the ability and intent to renew mineral interests where the existing term is notsufficient to recover all identified and valued proven and probable reserves and/or undeveloped mineralizedmaterial.
Asset Impairment
Long-lived Assets
The Company reviews and evaluates its long-lived assets for impairment when events or changes incircumstances indicate that the related carrying amounts may not be recoverable. An impairment is considered toexist if the total estimated future cash flows on an undiscounted basis are less than the carrying amount of theassets, including goodwill, if any. An impairment loss is measured and recorded based on discounted estimatedfuture cash flows. Future cash flows are estimated based on quantities of recoverable minerals, expected gold andother commodity prices (considering current and historical prices, price trends and related factors), productionlevels and operating costs of production and capital, all based on life-of-mine plans. Existing proven andprobable reserves and value beyond proven and probable reserves, including mineralization other than provenand probable reserves and other material that is not part of the measured, indicated or inferred resource base, areincluded when determining the fair value of mine site reporting units at acquisition and, subsequently, indetermining whether the assets are impaired. The term “recoverable minerals” refers to the estimated amount ofgold or other commodities that will be obtained after taking into account losses during ore processing andtreatment. Estimates of recoverable minerals from such exploration stage mineral interests are risk adjusted basedon management’s relative confidence in such materials. In estimating future cash flows, assets are grouped at thelowest level for which there are identifiable cash flows that are largely independent of future cash flows fromother asset groups. The Company’s estimates of future cash flows are based on numerous assumptions and it ispossible that actual future cash flows will be significantly different than the estimates, as actual future quantitiesof recoverable minerals, gold and other commodity prices, production levels and operating costs of productionand capital are each subject to significant risks and uncertainties.
Goodwill
The Company evaluates, on at least an annual basis during the fourth quarter, the carrying amount ofgoodwill to determine whether current events and circumstances indicate that such carrying amount may nolonger be recoverable. To accomplish this, the Company compares the estimated fair value of its reporting unitsto their carrying amounts. If the carrying value of a reporting unit exceeds its estimated fair value, the Companycompares the implied fair value of the reporting unit’s goodwill to its carrying amount, and any excess of thecarrying value over the fair value is charged to earnings. The Company’s fair value estimates are based onnumerous assumptions and it is possible that actual fair value will be significantly different than the estimates, asactual future quantities of recoverable minerals, gold and other commodity prices, production levels andoperating costs of production and capital are each subject to significant risks and uncertainties.
91

NEWMONT MINING CORPORATION
NOTES TO CONSOLIDATED FINANCIAL STATEMENTS—(Continued)(dollars in millions, except per share, per ounce and per pound amounts)
Revenue Recognition
Revenue is recognized, net of treatment and refining charges, from a sale when persuasive evidence of anarrangement exists, the price is determinable, the product has been delivered, the title has been transferred to thecustomer and collection of the sales price is reasonably assured. Revenues from by-product sales are credited toCosts applicable to sales as a by-product credit.
Concentrate sales are initially recorded based on 100% of the provisional sales prices. Until final settlementoccurs, adjustments to the provisional sales prices are made to take into account the mark-to-market changesbased on the forward prices for the estimated month of settlement. For changes in metal quantities upon receiptof new information and assay, the provisional sales quantities are adjusted as well. The principal risks associatedwith recognition of sales on a provisional basis include metal price fluctuations between the date initiallyrecorded and the date of final settlement. If a significant decline in metal prices occurs between the provisionalpricing date and the final settlement-date, it is reasonably possible that the Company could be required to return aportion of the sales proceeds received based on the provisional invoice.
The Company’s sales based on a provisional sales price contain an embedded derivative that is required tobe separated from the host contract for accounting purposes. The host contract is the receivable from the sale ofthe concentrates at the forward London Metal Exchange price at the time of sale. The embedded derivative,which does not qualify for hedge accounting, is marked to market through earnings each period prior to finalsettlement.
Stripping Costs
Stripping costs incurred during the production phase of a mine are variable production costs that areincluded as a component of inventory to be recognized in Costs applicable to sales in the same period as therevenue from the sale of inventory. Capitalization of post-production stripping costs is appropriate only to theextent product inventory exists at the end of a reporting period.
Prior to 2006 (see Deferred Stripping Costs below) at some of the Company’s mining operations, deferredstripping costs were charged to Costs applicable to sales as gold or copper was produced and sold using the unitsof production method based on estimated recoverable quantities of proven and probable gold or copper reserves,using a stripping ratio calculated as the ratio of total tons to be moved to total proven and probable ore reserves,which resulted in the recognition of the costs of waste removal activities over the life of the mine as gold orcopper was produced. The application of the deferred stripping accounting method generally resulted in an asset(deferred stripping costs), although a liability (advanced stripping costs) arose when the actual stripping ratioincurred to date was less than the expected stripping ratio over the life of the mine. The Advanced stripping costsprimarily pertained to the Batu Hijau operation.
Income and Mining Taxes
The Company accounts for income taxes using the liability method, recognizing certain temporarydifferences between the financial reporting basis of the Company’s liabilities and assets and the related incometax basis for such liabilities and assets. This method generates either a net deferred income tax liability or assetfor the Company, as measured by the statutory tax rates in effect. The Company derives its deferred income taxcharge or benefit by recording the change in either the net deferred income tax liability or asset balance for theyear. Mining taxes represent Canadian provincial taxes levied on mining operations and are classified as incometaxes; as such taxes are based on a percentage of mining profits. With respect to the earnings that the Company
92

NEWMONT MINING CORPORATION
NOTES TO CONSOLIDATED FINANCIAL STATEMENTS—(Continued)(dollars in millions, except per share, per ounce and per pound amounts)
derives from the operations of its consolidated subsidiaries, in those situations where the earnings are indefinitelyreinvested, no deferred taxes have been provided on the unremitted earnings (including the excess of the carryingvalue of the net equity of such entities for financial reporting purposes over the tax basis of such equity) of theseconsolidated companies.
The Company’s deferred income tax assets include certain future tax benefits. The Company records avaluation allowance against any portion of those deferred income tax assets when it believes, based on the weightof available evidence, it is more likely than not that some portion or all of the deferred income tax asset will notbe realized.
The Company’s operation involves dealing with uncertainties and judgments in the application of complextax regulations in multiple jurisdictions. The final taxes paid are dependent upon many factors, includingnegotiations with taxing authorities in various jurisdictions and resolution of disputes arising from federal, state,and international tax audits. The Company recognizes potential liabilities and records tax liabilities foranticipated tax audit issues in the U.S. and other tax jurisdictions based on its estimate of whether, and the extentto which, additional taxes will be due. As of January 1, 2007, the Company adopted FASB Interpretation No. 48,“Accounting for Uncertainty in Income Taxes,” (“FIN 48”), an interpretation of FASB Statement No. 109,“Accounting for Income Taxes,” guidance to record these liabilities (refer to Note 8 for additional information).The Company adjusts these reserves in light of changing facts and circumstances; however, due to thecomplexity of some of these uncertainties, the ultimate resolution may result in a payment that is materiallydifferent from the Company’s current estimate of the tax liabilities. If the Company’s estimate of tax liabilitiesproves to be less than the ultimate assessment, an additional charge to expense would result. If payment of theseamounts ultimately proves to be less than the recorded amounts, the reversal of the liabilities would result in taxbenefits being recognized in the period when the Company determines the liabilities are no longer necessary. TheCompany recognizes interest and penalties, if any, related to unrecognized tax benefits in income tax expense.
Reclamation and Remediation Costs (Asset Retirement Obligations)
Reclamation costs are allocated to expense over the life of the related assets and are periodically adjusted toreflect changes in the estimated present value resulting from the passage of time and revisions to the estimates ofeither the timing or amount of the reclamation and abandonment costs. The asset retirement obligation is basedon when the spending for an existing environmental disturbance and activity to date will occur. The Companyreviews, on an annual basis, unless otherwise deemed necessary, the asset retirement obligation at each mine sitein accordance with FASB FAS No. 143, “Accounting for Asset Retirement Obligations.”
Future remediation costs for inactive mines are accrued based on management’s best estimate at the end ofeach period of the costs expected to be incurred at a site. Such cost estimates include, where applicable, ongoingcare, maintenance and monitoring costs. Changes in estimates at inactive mines are reflected in earnings in theperiod an estimate is revised.
Foreign Currency
The functional currency for the majority of the Company’s operations, including the Australian operations,is the U.S. dollar. All monetary assets and liabilities where the functional currency is the U.S. dollar aretranslated at current exchange rates and the resulting adjustments are included in Other income, net. Thefunctional currency of the Canadian operations is the Canadian dollar. All monetary assets and liabilitiesrecorded in functional currencies other than U.S. dollars are translated at current exchange rates and the resulting
93

NEWMONT MINING CORPORATION
NOTES TO CONSOLIDATED FINANCIAL STATEMENTS—(Continued)(dollars in millions, except per share, per ounce and per pound amounts)
adjustments are charged or credited directly to Accumulated other comprehensive income (“OCI”) inStockholders’ equity. Revenues and expenses in foreign currencies are translated at the weighted-averageexchange rates for the period.
Derivative Instruments
Newmont has fixed forward contracts and call option contracts designated as cash flow hedges in place tohedge against changes in foreign exchanges rates. In 2005 and 2006, Newmont had zero cost copper collars tohedge the copper price realized during those periods. The fair value of derivative contracts qualifying as cashflow hedges are reflected as assets or liabilities in the balance sheet.
To the extent these hedges are effective in offsetting forecasted cash flows from the sale of production orproduction costs (the “effective portion”), changes in fair value are deferred in OCI. Amounts deferred in OCIare reclassified to Sales, net or to Costs applicable to sales, as applicable, when the hedged transaction hasoccurred. The ineffective portion of the change in the fair value of the derivative is recorded in Other income, netin each period.
When derivative contracts qualifying as cash flow hedges are settled, accelerated or restructured before thematurity date of the contracts, the accumulated OCI at the settlement date is deferred and reclassified to Sales—gold, net or Costs applicable to sales, as applicable, when the originally designated hedged transaction occurs.
The fair values of derivative contracts qualifying as fair value hedges are reflected as assets or liabilities inthe balance sheet. Changes in fair value are recorded in income in each period, consistent with recording changesto the mark-to-market value of the underlying hedged asset or liability in income. Changes in the mark-to-marketvalue of the effective portion of interest rate swaps utilized by the Company to swap a portion of its fixed rateinterest rate risk to floating rate risk are recognized as a component of Interest expense, net of capitalizedinterest.
Cash transactions related to the Company’s forward and option contracts accounted for as hedges areclassified in the same category as the item being hedged in the statement of cash flows.
Newmont assesses the effectiveness of the derivative contracts periodically using either regression analysisor the dollar offset approach, both retrospectively and prospectively, to determine whether the hedginginstruments have been highly effective in offsetting changes in the fair value of the hedged items. The Companydefines highly effective as the hedge contract and the item being hedged being between 0.8 and 1.25 correlated,and the Company measures the amount of any hedge ineffectiveness. The Company will also assess periodicallywhether the hedging instruments are expected to be highly effective in the future. If a hedging instrument is notexpected to be highly effective, the Company will stop hedge accounting prospectively. In those instances, theaccumulated gains or losses remain in OCI until the hedged item affects earnings.
The fair value of all derivative contracts that do not qualify as hedges are reflected as assets or liabilities,with the change in fair value recorded in Other income, net.
Stock Based Compensation
Compensation cost recognized in 2007 and 2006 includes: a) compensation cost for all share-basedpayments granted prior to, but not yet vested as of January 1, 2006, based on the grant-date fair value estimated
94
NEWMONT MINING CORPORATION
NOTES TO CONSOLIDATED FINANCIAL STATEMENTS—(Continued)(dollars in millions, except per share, per ounce and per pound amounts)
in accordance with the original provisions of FASB Statement No. 123, Accounting for Stock-BasedCompensation (“FAS 123”), and b) compensation cost for all share-based payments granted subsequent toJanuary 1, 2006, based on the grant-date fair value estimated in accordance with the provisions of FAS 123(R),Share Based Payment.
Prior to 2006, the Company accounted for share-based payments under the recognition and measurementprovisions of APB Opinion No. 25, Accounting for Stock Issued to Employees, and related Interpretations, aspermitted by FAS 123. In accordance with APB 25, no compensation cost was required to be recognized foroptions granted that had an exercise price equal to the market value of the underlying common stock on the dateof grant.
Net (Loss) Income per Common Share
Basic and diluted (loss) income per share are presented for Net (loss) income and for (Loss) income fromcontinuing operations. Basic (loss) income per share is computed by dividing Net (loss) income or (Loss) incomefrom continuing operations by the weighted-average number of outstanding common shares for the period,including the exchangeable shares and the convertible notes (see Notes 12 and 20). Diluted income per sharereflects the potential dilution that could occur if securities or other contracts that may require the issuance ofcommon shares in the future were converted. Diluted income per share is computed by increasing the weighted-average number of outstanding common shares to include the additional common shares that would beoutstanding after conversion and adjusting net income for changes that would result from the conversion. Onlythose securities or other contracts that result in a reduction in earnings per share are included in the calculation.
Comprehensive (Loss) Income
In addition to Net (loss) income, Comprehensive (loss) income includes all changes in equity during aperiod, such as adjustments to minimum pension liabilities, foreign currency translation adjustments, theeffective portion of changes in fair value of derivative instruments that qualify as cash flow hedges andcumulative unrecognized changes in fair value of marketable securities available-for-sale or other investments,except those resulting from investments by and distributions to owners.
Reclassifications
Certain amounts in prior years have been reclassified to conform to the 2007 presentation. The mostsignificant reclassifications were to reclassify the balance sheet amounts and the income statement results fromthe historical presentation to Assets and Liabilities of operations held for sale on the Consolidated Balance Sheetsand to (Loss) income from discontinued operations in the Consolidated Statements of Income for all periodspresented. The Consolidated Statements of Cash Flows have been reclassified for assets held for sale anddiscontinued operations for all periods presented. Additionally, the Company reclassified the World GoldCouncil dues from General and Administrative to Other Expense, net. The change was reflected in theConsolidated Statements of Income for all periods presented.
Recently Adopted Pronouncements
Income Taxes
The Company adopted Financial Accounting Standards Board (“FASB”) Interpretation No. 48, “Accountingfor Uncertainty in Income Taxes,” (“FIN 48”) an interpretation of FASB Statement No. 109, “Accounting for
95

NEWMONT MINING CORPORATION
NOTES TO CONSOLIDATED FINANCIAL STATEMENTS—(Continued)(dollars in millions, except per share, per ounce and per pound amounts)
Income Taxes” on January 1, 2007. The cumulative effects of applying this interpretation have been recorded asa decrease in retained earnings of $108, an increase of $5 in goodwill, an increase of $4 in minority interest, adecrease in net deferred tax assets of $37 (primarily, as a result of utilization of foreign tax credits and netoperating losses as part of the FIN 48 measurement process, offset, in part, by the impact of the interaction of theAlternative Minimum Tax rules) and an increase of $72 in the net liability for unrecognized income tax benefits.Refer to Note 8.
The Company’s continuing practice is to recognize interest and/or penalties related to unrecognized taxbenefits as part of its income tax expense. The Company had $34 accrued for interest at January 1, 2007.Through December 31, 2007, the Company accrued an additional $27 of interest and penalties, paid $12 ofinterest, released $4 as a result of the expiration of a statute of limitation and released $8 as a result of a changein tax law. The Company’s total accrued interest and penalties as of December 31, 2007 is $37.
The Company or one of its subsidiaries files income tax returns in the U.S. federal jurisdiction, variousstates and in foreign jurisdictions. With limited exception, the Company is no longer subject to U.S. federal, stateand local income or non-U.S. income tax audits by taxing authorities for years through 1999.
Pensions
As of December 31, 2006, the Company adopted the provisions of FASB Statement No. 158, “Employers’Accounting for Defined Benefit Pension and Other Postretirement Plans—an amendment of FASB StatementsNo. 87, 88, 106, and 132(R)” (“FAS 158”). FAS 158 required employers that sponsor one or more defined benefitplans to (i) recognize the funded status of a benefit plan in its statement of financial position, (ii) recognize the gainsor losses and prior service costs or credits that arise during the period as a component of other comprehensiveincome, net of tax, (iii) measure the defined benefit plan assets and obligations as of the date of the employer’sfiscal year-end statement of financial position, and (iv) disclose in the notes to the financial statements additionalinformation about certain effects on net periodic cost for the next fiscal year that arise from delayed recognition ofthe gains or losses, prior service costs or credits, and transition asset or obligation. The impact of adopting FAS 158on the Consolidated Balance Sheets as of December 31, 2006 was as follows:
BeforeApplicationof FAS 158 Adjustment
AfterApplicationof FAS 158
Other long-term assets . . . . . . . . . . . . . . . . . . . . . . . . . . . . . . . $ 193 $(15) $ 178Total assets . . . . . . . . . . . . . . . . . . . . . . . . . . . . . . . . . . . . . . . . $15,616 $(15) $15,601Employee pension and other benefits . . . . . . . . . . . . . . . . . . . . $ 229 $ 27 $ 256Deferred income taxes . . . . . . . . . . . . . . . . . . . . . . . . . . . . . . . . $ 649 $(14) $ 635Accumulated other comprehensive income . . . . . . . . . . . . . . . $ 700 $(27) $ 673Total stockholders’ equity . . . . . . . . . . . . . . . . . . . . . . . . . . . . . $ 9,364 $(27) $ 9,337
Stock Based Compensation
On January 1, 2006, the Company adopted the fair value recognition provisions of FASB StatementNo. 123(R), “Share-Based Payment” (“FAS 123(R)”). The Company adopted FAS 123(R) using the modifiedprospective transition method. Under this method, compensation cost recognized in 2006 included: a)compensation cost for all share-based payments granted prior to, but not yet vested as of January 1, 2006, basedon the grant-date fair value estimated in accordance with the original provisions of FAS 123, and b)compensation cost for all share-based payments granted subsequent to January 1, 2006, based on the grant-datefair value estimated in accordance with the provisions of FAS 123(R).
96

NEWMONT MINING CORPORATION
NOTES TO CONSOLIDATED FINANCIAL STATEMENTS—(Continued)(dollars in millions, except per share, per ounce and per pound amounts)
As a result of adopting FAS 123(R), the Company’s Loss from continuing operations and Net loss for 2007was $11 ($0.02 per share) higher and Income from continuing operations and Net income for 2006 was $19($0.04 per share) lower, respectively, than if we had continued to account for share-based compensation underAPB 25 as we did in the comparable prior year period. Prior to the adoption of FAS 123(R), cash retained as aresult of tax deductions relating to stock-based compensation was included in operating cash flows, along withother tax cash flows. FAS 123(R) requires tax benefits relating to the deductibility of increases in the equityinstruments issued under share-based compensation arrangements that are not included in Costs applicable tosales (“excess tax benefits”) to be presented in the Statement of Cash Flows as financing cash inflows. Thebenefit realized for tax deductions from option exercises totaled $3 and $6 in 2007 and 2006, respectively.
Deferred Stripping Costs
On January 1, 2006 the Company adopted Emerging Issues Task Force Issue No. 04-06 (“EITF 04-06”),“Accounting for Stripping Costs Incurred during Production in the Mining Industry.” EITF 04-06 addresses theaccounting for stripping costs incurred during the production phase of a mine and refers to these costs as variableproduction costs that should be included as a component of inventory to be recognized in Costs applicable tosales in the same period as the revenue from the sale of inventory. As a result, capitalization of post-productionstripping costs is appropriate only to the extent product inventory exists at the end of a reporting period. Theguidance required the recognition of a cumulative effect adjustment to opening retained earnings in the period ofadoption, with no charge to earnings in the period of adoption for prior periods. The cumulative effect adjustmentreduced retained earnings by $81 (net of tax and minority interests) and eliminated the $71 net deferred strippingasset from the balance sheet. Adoption of EITF 04-06 had no impact on the Company’s cash position or net cashfrom operations.
Prior to 2006 at some of the Company’s mining operations, deferred stripping costs were charged to Costsapplicable to sales as gold or copper was produced and sold using the units of production method based onestimated recoverable quantities of proven and probable gold or copper reserves, using a stripping ratiocalculated as the ratio of total tons to be moved to total proven and probable ore reserves, which resulted in therecognition of the costs of waste removal activities over the life of the mine as gold or copper was produced. Theapplication of the deferred stripping accounting method generally resulted in an asset (deferred stripping costs),although a liability (advanced stripping costs) arose when the actual stripping ratio incurred to date was less thanthe expected stripping ratio over the life of the mine. The Advanced stripping costs primarily pertained to theBatu Hijau operation.
Movements in the net deferred stripping cost balance were as follows:
Years EndedDecember 31,
2006 2005
Opening balance . . . . . . . . . . . . . . . . . . . . . . . . . . . . . . . . . . . . . . . . . . . . . . . . . . . . . . . $ 71 $ 19Cumulative effect adjustment . . . . . . . . . . . . . . . . . . . . . . . . . . . . . . . . . . . . . . . . . (71) —Disposition of Ovacik . . . . . . . . . . . . . . . . . . . . . . . . . . . . . . . . . . . . . . . . . . . . . . . — (4)Additions . . . . . . . . . . . . . . . . . . . . . . . . . . . . . . . . . . . . . . . . . . . . . . . . . . . . . . . . — 160Amortization . . . . . . . . . . . . . . . . . . . . . . . . . . . . . . . . . . . . . . . . . . . . . . . . . . . . . . — (104)
Closing balance . . . . . . . . . . . . . . . . . . . . . . . . . . . . . . . . . . . . . . . . . . . . . . . . . . . . . . . . $ — $ 71
97
NEWMONT MINING CORPORATION
NOTES TO CONSOLIDATED FINANCIAL STATEMENTS—(Continued)(dollars in millions, except per share, per ounce and per pound amounts)
Recently Issued Accounting Pronouncements and Developments
Business Combinations
In December 2007, the FASB issued FASB Statement No. 141(R), “Business Combinations,” which amendsSFAS No. 141, and provides revised guidance for recognizing and measuring identifiable assets and goodwillacquired, liabilities assumed, and any noncontrolling interest in the acquiree. It also provides disclosurerequirements to enable users of the financial statements to evaluate the nature and financial effects of thebusiness combination. SFAS No. 141(R) is effective for the Company’s fiscal year beginning January 1, 2009and is to be applied prospectively. The Company is currently evaluating the potential impact of adopting thisstatement on the Company’s consolidated financial position, results of operations or cash flows.
Noncontrolling Interests in Consolidated Financial Statements
In December 2007, the FASB issued FASB Statement No. 160, “Noncontrolling Interests in ConsolidatedFinancial Statements- an amendment of ARB No. 51” which establishes accounting and reporting standardspertaining to ownership interests in subsidiaries held by parties other than the parent, the amount of net incomeattributable to the parent and to the noncontrolling interest, changes in a parent’s ownership interest, and thevaluation of any retained noncontrolling equity investment when a subsidiary is deconsolidated. SFAS No. 160also establishes disclosure requirements that clearly identify and distinguish between the interests of the parentand the interests of the noncontrolling owners. SFAS No. 160 is effective for the Company’s fiscal yearbeginning January 1, 2009. The Company is currently evaluating the potential impact of adopting this statementon the Company’s consolidated financial position, results of operations or cash flows.
Accounting for Convertible Debt Instruments
In September 2007, the FASB published Proposed FSP No. APB 14-a, “Accounting for Convertible DebtInstruments That May Be Settled in Cash upon Conversion.” The proposed FSP applies to convertible debtinstruments that, by their stated terms, may be settled in cash (or other assets) upon conversion, including partialcash settlement, unless the embedded conversion option is required to be separately accounted for as a derivativeunder SFAS 133. Convertible debt instruments within the scope of the proposed FSP are not addressed by theexisting APB 14. The proposed FSP would require that the liability and equity components of convertible debtinstruments within the scope of the proposed FSP shall be separately accounted for in a manner that reflects theentity’s nonconvertible debt borrowing rate. This will require an allocation of the convertible debt proceedsbetween the liability component and the embedded conversion option (i.e., the equity component). The differencebetween the principal amount of the debt and the amount of the proceeds allocated to the liability componentwould be reported as a debt discount and subsequently amortized to earnings over the instrument’s expected lifeusing the effective interest method. If the proposed FSP were to be adopted, the Company estimates thatapproximately $300 million of debt discount would be recorded and the effective interest rate on its 2014 and2017 convertible senior notes (see Note 20) would increase by approximately 5 percentage points to 6.25% and6.625%, respectively, for the non-cash amortization of the debt discount.
Accounting for Income Tax Benefits of Dividends on Share-Based Payment Awards
In June 2007, the EITF reached consensus on Issue No. 06-11, “Accounting for Income Tax Benefits ofDividends on Share-Based Payment Awards.” EITF Issue No. 06-11 requires that the tax benefit related todividend and dividend equivalents paid on equity-classifed nonvested shares and nonvested share units, whichare expected to vest, be recorded as an increase to additional paid-in capital. EITF Issue No. 06-11 is to beapplied prospectively for tax benefits on dividends declared in the Company’s fiscal year beginning January 1,
98

NEWMONT MINING CORPORATION
NOTES TO CONSOLIDATED FINANCIAL STATEMENTS—(Continued)(dollars in millions, except per share, per ounce and per pound amounts)
2008. The Company is currently evaluating the impact that the adoption of this statement will have on theCompany’s consolidated financial position, results of operations or cash flows.
Fair Value Accounting
In February 2007, the FASB issued FASB Statement No. 159, “The Fair Value Option for Financial Assetsand Financial Liabilities” (“FAS 159”). FAS 159 permits entities to choose to measure many financialinstruments and certain other items at fair value, with the objective of improving financial reporting bymitigating volatility in reported earnings caused by measuring related assets and liabilities differently withouthaving to apply complex hedge accounting provisions. The provisions of FAS 159 are effective for theCompany’s fiscal year beginning January 1, 2008. The Company does not expect the adoption of FAS 159 tohave a material impact on the Company’s consolidated financial results.
In September 2006, the FASB issued FASB Statement No. 157, “Fair Value Measurements” (“FAS 157”).FAS 157 defines fair value, establishes a framework for measuring fair value in generally accepted accountingprinciples, and expands disclosures about fair value measurements. The provisions of FAS 157 are effective forthe Company’s fiscal year beginning January 1, 2008. The Company does not expect the adoption of FAS 157 tohave a material impact on the Company’s consolidated financial results.
NOTE 3 PRICE-CAPPED FORWARD SALES CONTRACTS
In 2001, the Company entered into transactions that closed out certain call options. The options werereplaced with a series of forward sales contracts requiring physical delivery of the same quantity of gold overslightly extended future periods. Under the terms of the contracts, the Company would realize the lower of thespot price on the delivery date or the capped price, ranging from $381 to $392 per ounce. The forward salescontracts were accounted for as normal sales contracts under SFAS No. 133 “Accounting for DerivativeInstruments and Hedging Activities” and SFAS No. 138 “Accounting for Certain Derivative Instruments andCertain Hedging Activities-an Amendment to SFAS No. 133.” The initial fair value of the forward salescontracts was recorded as deferred revenue, and the fair value of these contracts was not included on theCondensed Consolidated Balance Sheets.
In June 2007, the Company paid $578 to settle all of the 1.85 million ounce price-capped forward salescontracts. The Company reported a $531 pre-tax loss on the early settlement of the contracts, after a $47 reversalof previously recognized deferred revenue.
NOTE 4 MIDAS REDEVELOPMENT
On June 19, 2007, an accident occurred at the Midas mine in Nevada, which resulted in suspension ofoperations at the mine to initiate rescue and subsequent recovery efforts. As a result, the Mine Safety and HealthAdministration (“MSHA”) issued an order requiring operations to temporarily cease at the mine. During the thirdand fourth quarters of 2007, activities were undertaken, at the direction of MSHA, to regain entry into the minein order to ultimately resume commercial production. The redevelopment and holding costs of $11 in 2007included access development, inspection, preventative repairs and road and mill maintenance.
NOTE 5 WRITE-DOWNS
Write-down of investments totaled $46 in 2007, primarily related to the impairment of investments in ShoreGold Inc. and Gabriel Resources Ltd.
99

NEWMONT MINING CORPORATION
NOTES TO CONSOLIDATED FINANCIAL STATEMENTS—(Continued)(dollars in millions, except per share, per ounce and per pound amounts)
Write-down of long-lived and other assets totaled $4, $3 and $41 for 2007, 2006 and 2005, respectively. The2007 write-down was primarily related to tenements in Australia. The 2006 write-down was primarily related toequipment. The 2005 write-down was primarily related to the Martabe exploration project in Indonesia andexploration tenements in Australia.
NOTE 6 OTHER EXPENSE, NET
Years Ended December 31,
2007 2006 2005
Reclamation and remediation (Note 24) . . . . . . . . . . . . . . . . . . . . . . . . . . . . . . . . . . $ 29 $ 47 $ 38Pension settlement loss . . . . . . . . . . . . . . . . . . . . . . . . . . . . . . . . . . . . . . . . . . . . . . . 17 — 4Buyat Bay settlement and other (Note 32) . . . . . . . . . . . . . . . . . . . . . . . . . . . . . . . . 12 22 56Western Australia power plant . . . . . . . . . . . . . . . . . . . . . . . . . . . . . . . . . . . . . . . . . 11 1 (3)World Gold Council dues . . . . . . . . . . . . . . . . . . . . . . . . . . . . . . . . . . . . . . . . . . . . . 11 13 14Peruvian royalty . . . . . . . . . . . . . . . . . . . . . . . . . . . . . . . . . . . . . . . . . . . . . . . . . . . . 10 22 —Choropampa legal action . . . . . . . . . . . . . . . . . . . . . . . . . . . . . . . . . . . . . . . . . . . . . 9 5 4Reclamation accretion . . . . . . . . . . . . . . . . . . . . . . . . . . . . . . . . . . . . . . . . . . . . . . . . 8 3 —Australian office relocation . . . . . . . . . . . . . . . . . . . . . . . . . . . . . . . . . . . . . . . . . . . 6 5 —PTNNT divestiture . . . . . . . . . . . . . . . . . . . . . . . . . . . . . . . . . . . . . . . . . . . . . . . . . . 3 — —Yanacocha leach pad repairs . . . . . . . . . . . . . . . . . . . . . . . . . . . . . . . . . . . . . . . . . . . 1 10 —Peruvian workers participation reserves . . . . . . . . . . . . . . . . . . . . . . . . . . . . . . . . . . — 15 —Other . . . . . . . . . . . . . . . . . . . . . . . . . . . . . . . . . . . . . . . . . . . . . . . . . . . . . . . . . . . . . 31 16 13
$148 $159 $126
NOTE 7 OTHER INCOME, NET
Years Ended December 31,
2007 2006 2005
Interest income . . . . . . . . . . . . . . . . . . . . . . . . . . . . . . . . . . . . . . . . . . . . . . . . . . . . . $ 50 $ 67 $ 59Canadian Oil Sands Trust income . . . . . . . . . . . . . . . . . . . . . . . . . . . . . . . . . . . . . . 47 30 10Foreign currency exchange gains . . . . . . . . . . . . . . . . . . . . . . . . . . . . . . . . . . . . . . . 25 5 8Gain on sale of property, plant and equipment . . . . . . . . . . . . . . . . . . . . . . . . . . . . . 9 12 11Gain (loss) gain on ineffective portion of derivative investments, net (Note 14) . . 4 (60) 2Income from development projects, net . . . . . . . . . . . . . . . . . . . . . . . . . . . . . . . . . . 3 19 —(Loss) gain on sale of other assets, net . . . . . . . . . . . . . . . . . . . . . . . . . . . . . . . . . . . (1) 6 6Loss on early retirement of debt . . . . . . . . . . . . . . . . . . . . . . . . . . . . . . . . . . . . . . . . — (40) —Other . . . . . . . . . . . . . . . . . . . . . . . . . . . . . . . . . . . . . . . . . . . . . . . . . . . . . . . . . . . . . 7 14 10
$144 $ 53 $106
Foreign currency exchange gains in 2007 resulted from the strengthening of the Canadian and Australiandollars compared to the U.S. dollar. The Canadian dollar exchange rate increased by approximately 19% fromDecember 31, 2006 while the Australian dollar exchange rate increased by approximately 11%.
In September 2006, Newmont settled its remaining obligations under the prepaid forward gold sales contractand forward gold purchase contract for which it was required to deliver 17,951 ounces of gold in December 2006
100

NEWMONT MINING CORPORATION
NOTES TO CONSOLIDATED FINANCIAL STATEMENTS—(Continued)(dollars in millions, except per share, per ounce and per pound amounts)
and 179,062 ounces of gold in June 2007. This settlement resulted in cash payments of $96, and included a $48reduction to the current portion of long-term debt and a $40 pre-tax loss on extinguishment of debt.
The 2006 loss on ineffective portion of derivative instruments, net was primarily related to the ineffectiveportion of copper collar instruments designated as cash flow hedges.
NOTE 8 INCOME TAXES
The Company’s Income tax (expense) benefit consisted of:
Years Ended December 31,
2007 2006 2005
Current:United States . . . . . . . . . . . . . . . . . . . . . . . . . . . . . . . . . . . . . . . . . . . . . . . . . . . $ 121 $ — $ 14Foreign . . . . . . . . . . . . . . . . . . . . . . . . . . . . . . . . . . . . . . . . . . . . . . . . . . . . . . . (473) (453) (314)
(352) (453) (300)
Deferred:United States . . . . . . . . . . . . . . . . . . . . . . . . . . . . . . . . . . . . . . . . . . . . . . . . . . . (1) 15 40Foreign . . . . . . . . . . . . . . . . . . . . . . . . . . . . . . . . . . . . . . . . . . . . . . . . . . . . . . . 153 112 (10)
152 127 30
$(200) $(326) $(270)
The Company’s Income from continuing operations before income tax, minority interest and equity (loss)income of affiliates consisted of:
Years Ended December 31,
2007 2006 2005
United States . . . . . . . . . . . . . . . . . . . . . . . . . . . . . . . . . . . . . . . . . . . . . . . . . . . . . . . $(155) $ 188 $ (78)Foreign . . . . . . . . . . . . . . . . . . . . . . . . . . . . . . . . . . . . . . . . . . . . . . . . . . . . . . . . . . . (197) 1,062 1,002
$(352) $1,250 $ 924
101
NEWMONT MINING CORPORATION
NOTES TO CONSOLIDATED FINANCIAL STATEMENTS—(Continued)(dollars in millions, except per share, per ounce and per pound amounts)
The Company’s income tax expense differed from the amounts computed by applying the United Statesstatutory corporate income tax rate for the following reasons:
Years Ended December 31,
2007 2006 2005
(Loss) income from continuing operations before income tax, minority interest andequity (loss) income of affiliates . . . . . . . . . . . . . . . . . . . . . . . . . . . . . . . . . . . . . . . . . . $(352) $1,250 $ 924
United States statutory corporate income tax rate . . . . . . . . . . . . . . . . . . . . . . . . . . . . . . . 35% 35% 35%Income tax (expense) benefit computed at United States statutory corporate income tax
rate . . . . . . . . . . . . . . . . . . . . . . . . . . . . . . . . . . . . . . . . . . . . . . . . . . . . . . . . . . . . . . . . . 123 (438) (323)Reconciling items:
Percentage depletion and Canadian Resource Allowance . . . . . . . . . . . . . . . . . . . . . 70 77 43Change in valuation allowance on deferred tax assets . . . . . . . . . . . . . . . . . . . . . . . 17 3 (39)Effect of foreign earnings, net of allowable credits . . . . . . . . . . . . . . . . . . . . . . . . . (10) (7) (13)U.S. tax effect of minority interest attributable to non-U.S. investees . . . . . . . . . . . 4 15 15Rate differential for foreign earnings indefinitely reinvested . . . . . . . . . . . . . . . . . . (7) (70) 6FIN 48 resolution of prior years’ tax matters . . . . . . . . . . . . . . . . . . . . . . . . . . . . . . (3) 4 12Foreign currency translation of monetary assets . . . . . . . . . . . . . . . . . . . . . . . . . . . . — 1 14Tax effect of changes in tax laws . . . . . . . . . . . . . . . . . . . . . . . . . . . . . . . . . . . . . . . 4 23 24Tax effect of impairment of goodwill . . . . . . . . . . . . . . . . . . . . . . . . . . . . . . . . . . . . (393) — (14)U.S. tax payable and book/tax basis analysis . . . . . . . . . . . . . . . . . . . . . . . . . . . . . . — 27 —Change in Australia’s functional currency for tax reporting . . . . . . . . . . . . . . . . . . . — 48 —Other . . . . . . . . . . . . . . . . . . . . . . . . . . . . . . . . . . . . . . . . . . . . . . . . . . . . . . . . . . . . . (5) (9) 5
Income tax expense . . . . . . . . . . . . . . . . . . . . . . . . . . . . . . . . . . . . . . . . . . . . . . . . . . . . . . $(200) $ (326) $(270)
Components of the Company’s deferred income tax assets (liabilities) are as follows:
At December 31,
2007 2006
Deferred income tax assets:Exploration costs . . . . . . . . . . . . . . . . . . . . . . . . . . . . . . . . . . . . . . . . . . . . . . . . . . . . . . . . . . $ 59 $ 63Depreciation . . . . . . . . . . . . . . . . . . . . . . . . . . . . . . . . . . . . . . . . . . . . . . . . . . . . . . . . . . . . . 89 147Net operating losses and tax credits . . . . . . . . . . . . . . . . . . . . . . . . . . . . . . . . . . . . . . . . . . . 610 649Retiree benefit and vacation accrual costs . . . . . . . . . . . . . . . . . . . . . . . . . . . . . . . . . . . . . . 68 114Remediation and reclamation costs . . . . . . . . . . . . . . . . . . . . . . . . . . . . . . . . . . . . . . . . . . . . 141 141Derivative instruments . . . . . . . . . . . . . . . . . . . . . . . . . . . . . . . . . . . . . . . . . . . . . . . . . . . . . 128 —Other . . . . . . . . . . . . . . . . . . . . . . . . . . . . . . . . . . . . . . . . . . . . . . . . . . . . . . . . . . . . . . . . . . . 236 217
1,331 1,331Valuation allowances . . . . . . . . . . . . . . . . . . . . . . . . . . . . . . . . . . . . . . . . . . . . . . . . . . . . . . (509) (517)
822 814
Deferred income tax liabilities:Net undistributed earnings of subsidiaries . . . . . . . . . . . . . . . . . . . . . . . . . . . . . . . . . . . . . . (11) (37)Unrealized gain on investments . . . . . . . . . . . . . . . . . . . . . . . . . . . . . . . . . . . . . . . . . . . . . . (149) (135)Depletable and amortizable costs associated with mineral rights . . . . . . . . . . . . . . . . . . . . . (629) (358)Derivative instruments . . . . . . . . . . . . . . . . . . . . . . . . . . . . . . . . . . . . . . . . . . . . . . . . . . . . . (25) (15)Foreign currency exchange . . . . . . . . . . . . . . . . . . . . . . . . . . . . . . . . . . . . . . . . . . . . . . . . . . (26) (26)
(840) (571)
Net deferred income tax assets (liabilities) . . . . . . . . . . . . . . . . . . . . . . . . . . . . . . . . . . . . . . . . . . $ (18) $ 243
102
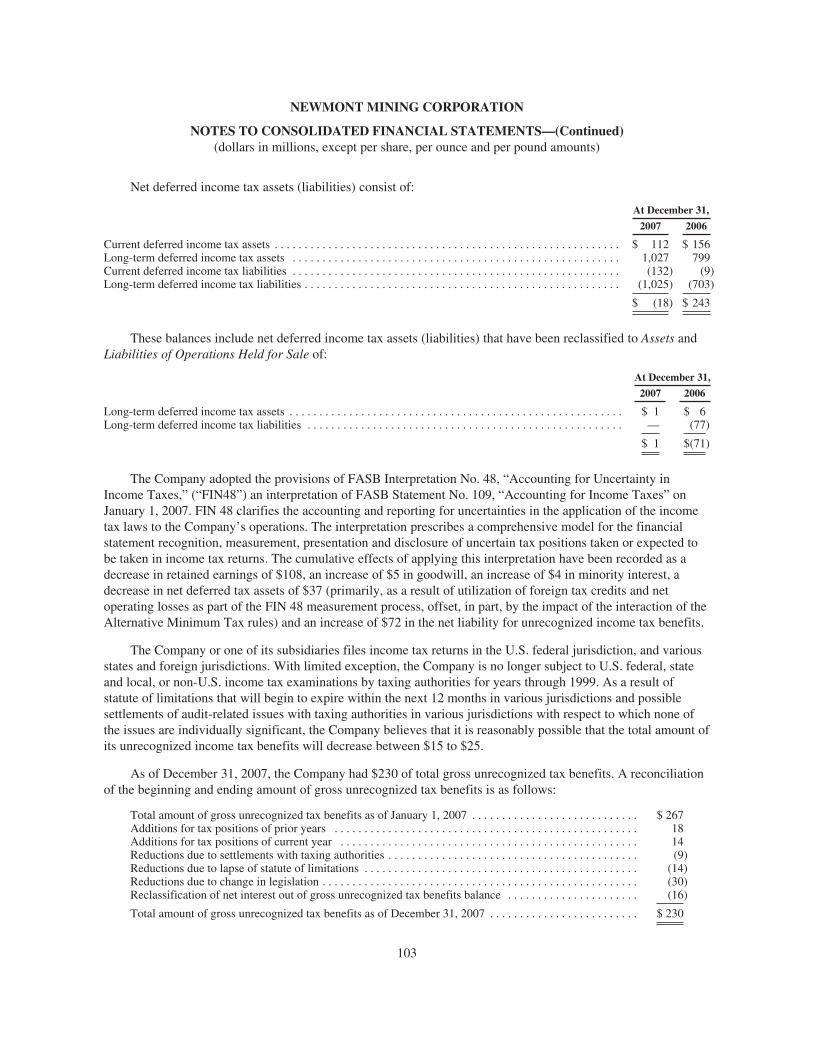
NEWMONT MINING CORPORATION
NOTES TO CONSOLIDATED FINANCIAL STATEMENTS—(Continued)(dollars in millions, except per share, per ounce and per pound amounts)
Net deferred income tax assets (liabilities) consist of:
At December 31,
2007 2006
Current deferred income tax assets . . . . . . . . . . . . . . . . . . . . . . . . . . . . . . . . . . . . . . . . . . . . . . . . . . . . . . . . . . $ 112 $ 156Long-term deferred income tax assets . . . . . . . . . . . . . . . . . . . . . . . . . . . . . . . . . . . . . . . . . . . . . . . . . . . . . . . 1,027 799Current deferred income tax liabilities . . . . . . . . . . . . . . . . . . . . . . . . . . . . . . . . . . . . . . . . . . . . . . . . . . . . . . . (132) (9)Long-term deferred income tax liabilities . . . . . . . . . . . . . . . . . . . . . . . . . . . . . . . . . . . . . . . . . . . . . . . . . . . . . (1,025) (703)
$ (18) $ 243
These balances include net deferred income tax assets (liabilities) that have been reclassified to Assets andLiabilities of Operations Held for Sale of:
At December 31,
2007 2006
Long-term deferred income tax assets . . . . . . . . . . . . . . . . . . . . . . . . . . . . . . . . . . . . . . . . . . . . . . . . . . . . . . . . $ 1 $ 6Long-term deferred income tax liabilities . . . . . . . . . . . . . . . . . . . . . . . . . . . . . . . . . . . . . . . . . . . . . . . . . . . . . — (77)
$ 1 $(71)
The Company adopted the provisions of FASB Interpretation No. 48, “Accounting for Uncertainty inIncome Taxes,” (“FIN48”) an interpretation of FASB Statement No. 109, “Accounting for Income Taxes” onJanuary 1, 2007. FIN 48 clarifies the accounting and reporting for uncertainties in the application of the incometax laws to the Company’s operations. The interpretation prescribes a comprehensive model for the financialstatement recognition, measurement, presentation and disclosure of uncertain tax positions taken or expected tobe taken in income tax returns. The cumulative effects of applying this interpretation have been recorded as adecrease in retained earnings of $108, an increase of $5 in goodwill, an increase of $4 in minority interest, adecrease in net deferred tax assets of $37 (primarily, as a result of utilization of foreign tax credits and netoperating losses as part of the FIN 48 measurement process, offset, in part, by the impact of the interaction of theAlternative Minimum Tax rules) and an increase of $72 in the net liability for unrecognized income tax benefits.
The Company or one of its subsidiaries files income tax returns in the U.S. federal jurisdiction, and variousstates and foreign jurisdictions. With limited exception, the Company is no longer subject to U.S. federal, stateand local, or non-U.S. income tax examinations by taxing authorities for years through 1999. As a result ofstatute of limitations that will begin to expire within the next 12 months in various jurisdictions and possiblesettlements of audit-related issues with taxing authorities in various jurisdictions with respect to which none ofthe issues are individually significant, the Company believes that it is reasonably possible that the total amount ofits unrecognized income tax benefits will decrease between $15 to $25.
As of December 31, 2007, the Company had $230 of total gross unrecognized tax benefits. A reconciliationof the beginning and ending amount of gross unrecognized tax benefits is as follows:
Total amount of gross unrecognized tax benefits as of January 1, 2007 . . . . . . . . . . . . . . . . . . . . . . . . . . . . $ 267Additions for tax positions of prior years . . . . . . . . . . . . . . . . . . . . . . . . . . . . . . . . . . . . . . . . . . . . . . . . . . . 18Additions for tax positions of current year . . . . . . . . . . . . . . . . . . . . . . . . . . . . . . . . . . . . . . . . . . . . . . . . . . 14Reductions due to settlements with taxing authorities . . . . . . . . . . . . . . . . . . . . . . . . . . . . . . . . . . . . . . . . . . (9)Reductions due to lapse of statute of limitations . . . . . . . . . . . . . . . . . . . . . . . . . . . . . . . . . . . . . . . . . . . . . . (14)Reductions due to change in legislation . . . . . . . . . . . . . . . . . . . . . . . . . . . . . . . . . . . . . . . . . . . . . . . . . . . . . (30)Reclassification of net interest out of gross unrecognized tax benefits balance . . . . . . . . . . . . . . . . . . . . . . (16)
Total amount of gross unrecognized tax benefits as of December 31, 2007 . . . . . . . . . . . . . . . . . . . . . . . . . $ 230
103
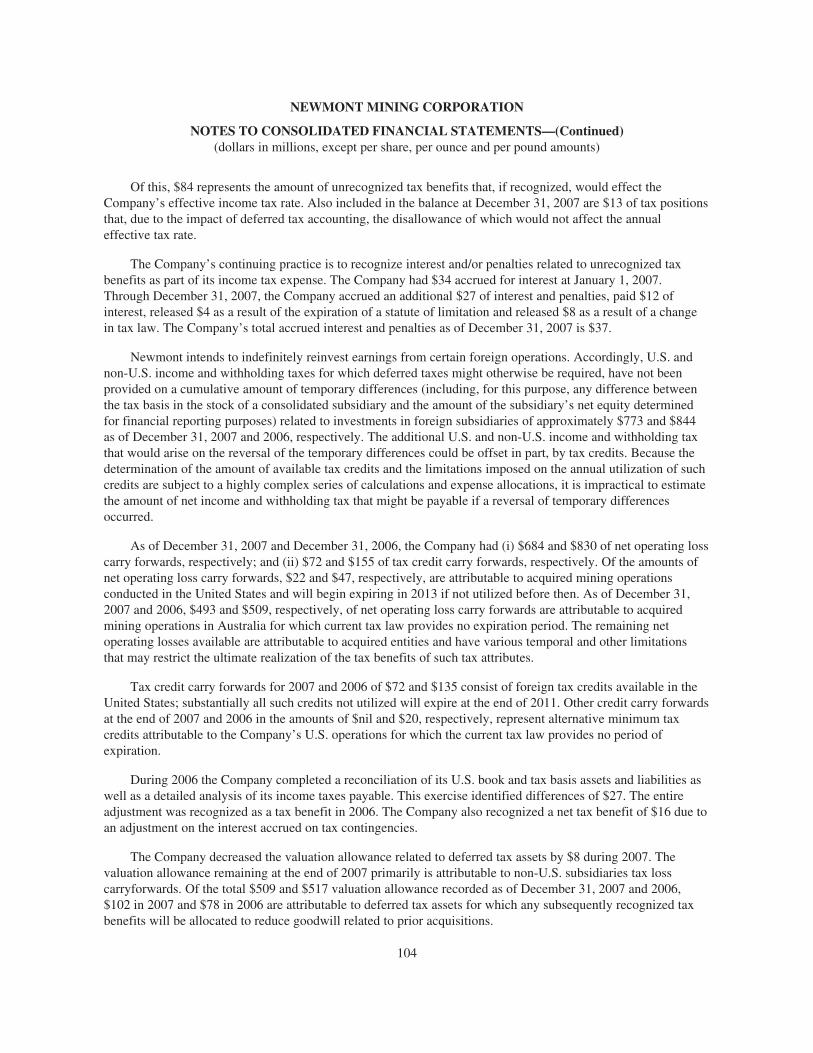
NEWMONT MINING CORPORATION
NOTES TO CONSOLIDATED FINANCIAL STATEMENTS—(Continued)(dollars in millions, except per share, per ounce and per pound amounts)
Of this, $84 represents the amount of unrecognized tax benefits that, if recognized, would effect theCompany’s effective income tax rate. Also included in the balance at December 31, 2007 are $13 of tax positionsthat, due to the impact of deferred tax accounting, the disallowance of which would not affect the annualeffective tax rate.
The Company’s continuing practice is to recognize interest and/or penalties related to unrecognized taxbenefits as part of its income tax expense. The Company had $34 accrued for interest at January 1, 2007.Through December 31, 2007, the Company accrued an additional $27 of interest and penalties, paid $12 ofinterest, released $4 as a result of the expiration of a statute of limitation and released $8 as a result of a changein tax law. The Company’s total accrued interest and penalties as of December 31, 2007 is $37.
Newmont intends to indefinitely reinvest earnings from certain foreign operations. Accordingly, U.S. andnon-U.S. income and withholding taxes for which deferred taxes might otherwise be required, have not beenprovided on a cumulative amount of temporary differences (including, for this purpose, any difference betweenthe tax basis in the stock of a consolidated subsidiary and the amount of the subsidiary’s net equity determinedfor financial reporting purposes) related to investments in foreign subsidiaries of approximately $773 and $844as of December 31, 2007 and 2006, respectively. The additional U.S. and non-U.S. income and withholding taxthat would arise on the reversal of the temporary differences could be offset in part, by tax credits. Because thedetermination of the amount of available tax credits and the limitations imposed on the annual utilization of suchcredits are subject to a highly complex series of calculations and expense allocations, it is impractical to estimatethe amount of net income and withholding tax that might be payable if a reversal of temporary differencesoccurred.
As of December 31, 2007 and December 31, 2006, the Company had (i) $684 and $830 of net operating losscarry forwards, respectively; and (ii) $72 and $155 of tax credit carry forwards, respectively. Of the amounts ofnet operating loss carry forwards, $22 and $47, respectively, are attributable to acquired mining operationsconducted in the United States and will begin expiring in 2013 if not utilized before then. As of December 31,2007 and 2006, $493 and $509, respectively, of net operating loss carry forwards are attributable to acquiredmining operations in Australia for which current tax law provides no expiration period. The remaining netoperating losses available are attributable to acquired entities and have various temporal and other limitationsthat may restrict the ultimate realization of the tax benefits of such tax attributes.
Tax credit carry forwards for 2007 and 2006 of $72 and $135 consist of foreign tax credits available in theUnited States; substantially all such credits not utilized will expire at the end of 2011. Other credit carry forwardsat the end of 2007 and 2006 in the amounts of $nil and $20, respectively, represent alternative minimum taxcredits attributable to the Company’s U.S. operations for which the current tax law provides no period ofexpiration.
During 2006 the Company completed a reconciliation of its U.S. book and tax basis assets and liabilities aswell as a detailed analysis of its income taxes payable. This exercise identified differences of $27. The entireadjustment was recognized as a tax benefit in 2006. The Company also recognized a net tax benefit of $16 due toan adjustment on the interest accrued on tax contingencies.
The Company decreased the valuation allowance related to deferred tax assets by $8 during 2007. Thevaluation allowance remaining at the end of 2007 primarily is attributable to non-U.S. subsidiaries tax losscarryforwards. Of the total $509 and $517 valuation allowance recorded as of December 31, 2007 and 2006,$102 in 2007 and $78 in 2006 are attributable to deferred tax assets for which any subsequently recognized taxbenefits will be allocated to reduce goodwill related to prior acquisitions.
104

NEWMONT MINING CORPORATION
NOTES TO CONSOLIDATED FINANCIAL STATEMENTS—(Continued)(dollars in millions, except per share, per ounce and per pound amounts)
The breakdown of the Company’s net deferred tax assets (liabilities) between the United States and foreigntaxing jurisdictions is as follows:
At December 31,
2007 2006
United States . . . . . . . . . . . . . . . . . . . . . . . . . . . . . . . . . . . . . . . . . . . . . . . . . $ 678 $ 550Foreign . . . . . . . . . . . . . . . . . . . . . . . . . . . . . . . . . . . . . . . . . . . . . . . . . . . . . (696) (307)
$ (18) $ 243
In December 2006, the Company entered into an in-principle Heads of Agreement (“HOA”) with theAustralian Taxation Office (“ATO”). The HOA specifies the terms of a proposed settlement of the outstandingaudit issues relating to Normandy Mining Limited (“Normandy”, now known as Newmont Australia Limited) forthe tax years 1994-1999. These issues relate to years before the Company acquired Normandy. At the date of thebusiness combination, Normandy had recorded no income tax liability with respect to the tax positions taken inreporting certain transactions, therefore the Company’s initial best estimate of the income tax contingencyrelating to these issues was recorded as a tax liability at the date of acquisition, February 15, 2002, by increasingthe purchase price of Normandy. As of December 31, 2006, the long-term income tax liability balance relating tothis proposed settlement was reclassified to current income taxes payable. The $276 (A$336) income tax liabilitywas paid in the second quarter of 2007. On July 13, 2007, the Company received a closure letter from theAustralian Tax Office stating that all audit issues for the tax years 1994-1999 are settled.
The breakdown of the Company’s income and mining taxes payable balance between the United States andforeign taxing jurisdictions is as follows:
At December 31,
2007 2006
United States . . . . . . . . . . . . . . . . . . . . . . . . . . . . . . . . . . . . . . . . . . . . . . . . . . $124 $ 19Foreign . . . . . . . . . . . . . . . . . . . . . . . . . . . . . . . . . . . . . . . . . . . . . . . . . . . . . . 343 332
$467 $351
NOTE 9 MINORITY INTEREST IN INCOME OF CONSOLIDATED SUBSIDIARIES
At December 31,
2007 2006 2005
Batu Hijau . . . . . . . . . . . . . . . . . . . . . . . . . . . . . . . . . . . . . . . . . . . . . . . . . . . . . $299 $103 $119Yanacocha . . . . . . . . . . . . . . . . . . . . . . . . . . . . . . . . . . . . . . . . . . . . . . . . . . . . . 108 256 256Other . . . . . . . . . . . . . . . . . . . . . . . . . . . . . . . . . . . . . . . . . . . . . . . . . . . . . . . . . 3 4 5
$410 $363 $380
Newmont has a 45% ownership interest in the Batu Hijau mine, held through a partnership (“NTP”) with anaffiliate of Sumitomo Corporation of Japan. Newmont has a 56.25% interest in NTP and the Sumitomo affiliateholds the remaining 43.75%. NTP in turn owns 80% of P.T. Newmont Nusa Tenggara (“PTNNT”), theIndonesian subsidiary that owns the Batu Hijau mine. Newmont identified NTP as a Variable Interest Entity as aresult of certain capital structures and contractual relationships and has fully consolidated Batu Hijau in itsconsolidated financial statements since January 1, 2004. The remaining 20% interest in PTNNT is owned by P.T.
105

NEWMONT MINING CORPORATION
NOTES TO CONSOLIDATED FINANCIAL STATEMENTS—(Continued)(dollars in millions, except per share, per ounce and per pound amounts)
Pukuafa Indah (“PTPI”), an unrelated Indonesian company. Because PTPI’s interest was a carried interest, andbecause PTPI had been advanced a loan by NTP, Newmont reported a 52.875% economic interest in Batu Hijau,which reflected its actual economic interest in the mine until such time as the loan was fully repaid (includingaccrued interest). On May 25, 2007, PTPI fully repaid the loan (including accrued interest) from NTP. As a resultof the loan repayment, Newmont’s economic interest in Batu Hijau was reduced from 52.875% to 45% and theCompany recorded a net charge of $25 (after-tax) against Minority interest expense in the second quarter of2007.
Newmont has a 51.35% ownership interest in the Yanacocha mine with the remaining interests held byCompañia de Minas Buenaventura, S.A.A. (43.65%) and the International Finance Corporation (5%).
NOTE 10 EQUITY (LOSS) INCOME OF AFFILIATES
Years Ended December 31,
2007 2006 2005
European Gold Refineries . . . . . . . . . . . . . . . . . . . . . . . . . . . . . . . . . . . . . . . . $ 6 $ 3 $ 6AGR Matthey Joint Venture . . . . . . . . . . . . . . . . . . . . . . . . . . . . . . . . . . . . . . 1 1 (2)Regis Resources NL . . . . . . . . . . . . . . . . . . . . . . . . . . . . . . . . . . . . . . . . . . . . . (8) (2) —
$(1) $ 2 $ 4
European Gold Refineries
Newmont holds a 46.72% interest in the European Gold Refineries SA joint venture (“EGR”), with Swissresidents and Mitsubishi International Corporation holding the remaining 53.28%. EGR owns 100% of ValcambiSA (“Valcambi”), a gold refining business, and 100% of Finorafa SA (“Finorafa”), a gold distribution business.Newmont has no guarantees related to these investments. Newmont has not received dividends from EGR in2007, 2006 and 2005. Valcambi is a London Gold Delivery precious metals refiner and manufacturer of semi-finished products for the Swiss luxury watch industry, and Finorafa is a distributor and financier of gold productsin the Italian market. See also Note 26 for details of Newmont’s transactions with EGR and Finorafa.
AGR Matthey Joint Venture
Newmont holds a 40% interest in the AGR Matthey Joint Venture (“AGR”), with Johnson Matthey(Australia) Ltd. and the West Australian Mint holding the remaining interests. Newmont has no guaranteesrelated to this investment. Newmont received dividends of $2, $1 and $nil during 2007, 2006 and 2005,respectively, from its interests in AGR. See also Note 26 for details of Newmont’s transactions with AGR.
Regis Resources NL
Newmont holds a 43% interest in Regis Resources NL, which is primarily a gold exploration company withsubstantial landholding in Western Australia. Newmont has no guarantees related to this investment.
NOTE 11 DISCONTINUED OPERATIONS AND ASSETS AND LIABILITIES HELD FOR SALE
In November 2007, the Company approved a plan to sell its Pajingo operation. In December 2007,Newmont reached an agreement with North Queensland Metals Ltd. and Heemskirk Consolidated Limited to sellPajingo for cash and shares totaling $23, of which $14 was received in 2007 and $9 is an outstanding receivableat December 31, 2007. The sale resulted in a $8 pre-tax gain.
106

NEWMONT MINING CORPORATION
NOTES TO CONSOLIDATED FINANCIAL STATEMENTS—(Continued)(dollars in millions, except per share, per ounce and per pound amounts)
During June 2007, Newmont’s Board of Directors approved a plan to cease the Company’s MerchantBanking activities. Merchant Banking previously provided advisory services to assist in managing theCompany’s portfolio of operating and property interests. Merchant Banking was also engaged in developingvalue optimization strategies for operating and non-operating assets, business development activities, merger andacquisition analysis and negotiations, monetizing inactive exploration properties, capitalizing on proprietarytechnology and know-how and acting as an internal resource for other corporate groups to improve and maximizebusiness outcomes. As a result of the Board’s approval of management’s plan to cease Merchant Bankingactivities, the Company recorded a $1,665 non-cash charge to impair the goodwill associated with the MerchantBanking Segment. The Company decided to dispose of its royalty portfolio and a portion of its existing equityinvestments and will not make further investments in equity securities that do not support its core gold miningbusiness. Newmont and the new Franco-Nevada Corporation (“new Franco-Nevada”) entered into an agreementunder which new Franco-Nevada acquired certain mineral interests and oil and gas interests for cashconsideration of $1,187. The transaction closed in December 2007 resulting in a $905 pre-tax gain.
In 2006, the Company received net cash proceeds of $271 for the Alberta oil sands project resulting in a$266 pre-tax gain. The Company received $42 net cash proceeds and approximately 43 million Agincourt sharesvalued at $37 for the Martabe project, resulting in a $30 pre-tax gain in 2006.
In July 2006, Newmont’s Board of Directors approved a plan to sell the Company’s 50% interest in theZarafshan-Newmont Joint Venture (“ZNJV”). However, as a result of the Uzbekistan government’sexpropriation of the Company’s assets in August 2006, a pre-tax impairment loss of $101 was recognized in thethird quarter of 2006. During July 2007, the Company and certain Uzbekistan parties settled a dispute involvingZNJV. The Company received proceeds of $80 and recognized a pre-tax gain of $77 in the third quarter of 2007.Under the agreements, the Company’s interest in ZNJV transferred to the Uzbekistan parties.
During the fourth quarter of 2005, Newmont committed to plans to sell its Holloway operation. InSeptember 2006, Newmont reached an agreement with St. Andrew Goldfields Ltd. to sell Holloway for cashproceeds of $40 plus certain royalties. The sale was completed in November 2006, resulting in a $13 pre-taxgain.
In 2005, Newmont sold its Golden Grove operation in Western Australia to Oxiana Limited (“Oxiana”) forcash of $147 and 82 million Oxiana shares, resulting in a $6 pre-tax gain.
The 2005 pre-tax loss from impairment included in discontinued operations of $42 was comprised of a $39impairment of Golden Grove and a $3 impairment of Holloway.
The Company’s income tax expense attributable to discontinued operations differed from the amountscomputed by applying the United States statutory corporate income tax rate primarily due to the goodwillimpairment that was nondeductible for tax, the benefit from percentage depletion and a decrease in the valuationallowance related to deferred tax assets.
Newmont has accounted for these dispositions in accordance with FAS No. 144 “Accounting for theImpairment or Disposal of Long-Lived Assets.” The Company has reclassified the balance sheet amounts and theincome statement results from the historical presentation to Assets and Liabilities of operations held for sale onthe Consolidated Balance Sheets and to Loss from discontinued operations in the Consolidated Statements of(Loss) Income for all periods presented. The Consolidated Statements of Cash Flows have been reclassified forassets held for sale and discontinued operations for all periods presented.
107
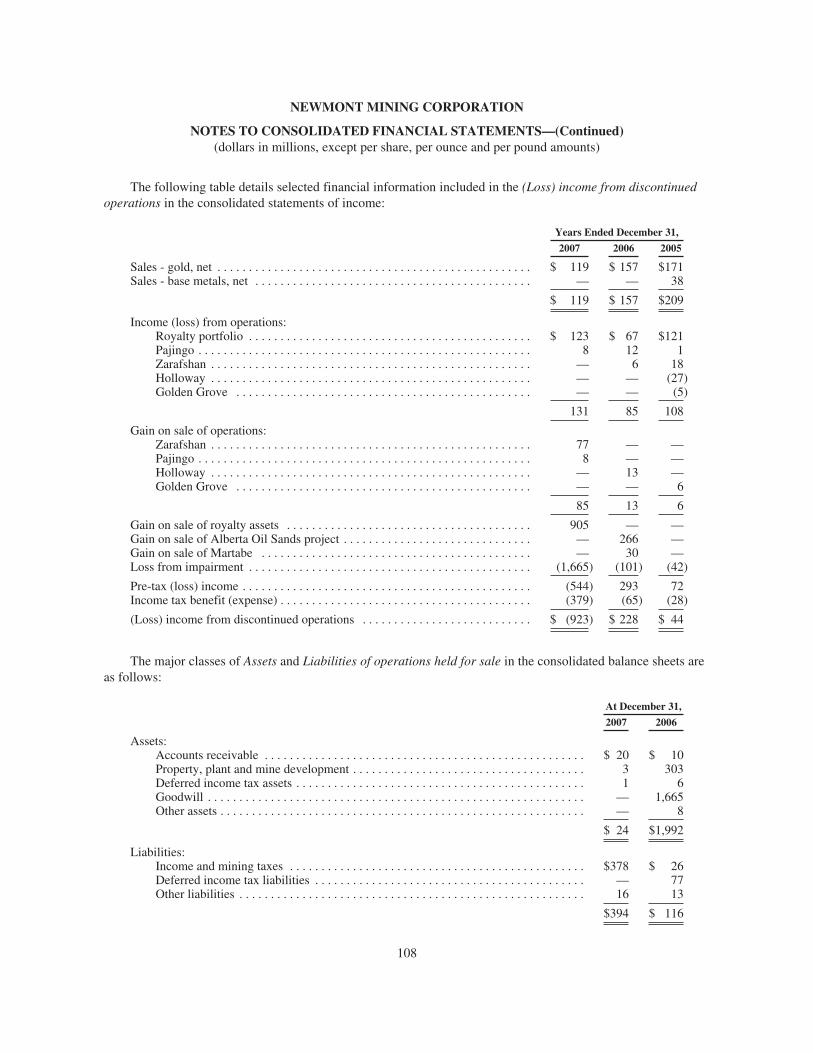
NEWMONT MINING CORPORATION
NOTES TO CONSOLIDATED FINANCIAL STATEMENTS—(Continued)(dollars in millions, except per share, per ounce and per pound amounts)
The following table details selected financial information included in the (Loss) income from discontinuedoperations in the consolidated statements of income:
Years Ended December 31,
2007 2006 2005
Sales - gold, net . . . . . . . . . . . . . . . . . . . . . . . . . . . . . . . . . . . . . . . . . . . . . . . . . . $ 119 $ 157 $171Sales - base metals, net . . . . . . . . . . . . . . . . . . . . . . . . . . . . . . . . . . . . . . . . . . . . — — 38
$ 119 $ 157 $209
Income (loss) from operations:Royalty portfolio . . . . . . . . . . . . . . . . . . . . . . . . . . . . . . . . . . . . . . . . . . . . . $ 123 $ 67 $121Pajingo . . . . . . . . . . . . . . . . . . . . . . . . . . . . . . . . . . . . . . . . . . . . . . . . . . . . . 8 12 1Zarafshan . . . . . . . . . . . . . . . . . . . . . . . . . . . . . . . . . . . . . . . . . . . . . . . . . . . — 6 18Holloway . . . . . . . . . . . . . . . . . . . . . . . . . . . . . . . . . . . . . . . . . . . . . . . . . . . — — (27)Golden Grove . . . . . . . . . . . . . . . . . . . . . . . . . . . . . . . . . . . . . . . . . . . . . . . — — (5)
131 85 108
Gain on sale of operations:Zarafshan . . . . . . . . . . . . . . . . . . . . . . . . . . . . . . . . . . . . . . . . . . . . . . . . . . . 77 — —Pajingo . . . . . . . . . . . . . . . . . . . . . . . . . . . . . . . . . . . . . . . . . . . . . . . . . . . . . 8 — —Holloway . . . . . . . . . . . . . . . . . . . . . . . . . . . . . . . . . . . . . . . . . . . . . . . . . . . — 13 —Golden Grove . . . . . . . . . . . . . . . . . . . . . . . . . . . . . . . . . . . . . . . . . . . . . . . — — 6
85 13 6
Gain on sale of royalty assets . . . . . . . . . . . . . . . . . . . . . . . . . . . . . . . . . . . . . . . 905 — —Gain on sale of Alberta Oil Sands project . . . . . . . . . . . . . . . . . . . . . . . . . . . . . . — 266 —Gain on sale of Martabe . . . . . . . . . . . . . . . . . . . . . . . . . . . . . . . . . . . . . . . . . . . — 30 —Loss from impairment . . . . . . . . . . . . . . . . . . . . . . . . . . . . . . . . . . . . . . . . . . . . . (1,665) (101) (42)
Pre-tax (loss) income . . . . . . . . . . . . . . . . . . . . . . . . . . . . . . . . . . . . . . . . . . . . . . (544) 293 72Income tax benefit (expense) . . . . . . . . . . . . . . . . . . . . . . . . . . . . . . . . . . . . . . . . (379) (65) (28)
(Loss) income from discontinued operations . . . . . . . . . . . . . . . . . . . . . . . . . . . $ (923) $ 228 $ 44
The major classes of Assets and Liabilities of operations held for sale in the consolidated balance sheets areas follows:
At December 31,
2007 2006
Assets:Accounts receivable . . . . . . . . . . . . . . . . . . . . . . . . . . . . . . . . . . . . . . . . . . . . . . . . . . . $ 20 $ 10Property, plant and mine development . . . . . . . . . . . . . . . . . . . . . . . . . . . . . . . . . . . . . 3 303Deferred income tax assets . . . . . . . . . . . . . . . . . . . . . . . . . . . . . . . . . . . . . . . . . . . . . . 1 6Goodwill . . . . . . . . . . . . . . . . . . . . . . . . . . . . . . . . . . . . . . . . . . . . . . . . . . . . . . . . . . . . — 1,665Other assets . . . . . . . . . . . . . . . . . . . . . . . . . . . . . . . . . . . . . . . . . . . . . . . . . . . . . . . . . . — 8
$ 24 $1,992
Liabilities:Income and mining taxes . . . . . . . . . . . . . . . . . . . . . . . . . . . . . . . . . . . . . . . . . . . . . . . $378 $ 26Deferred income tax liabilities . . . . . . . . . . . . . . . . . . . . . . . . . . . . . . . . . . . . . . . . . . . — 77Other liabilities . . . . . . . . . . . . . . . . . . . . . . . . . . . . . . . . . . . . . . . . . . . . . . . . . . . . . . . 16 13
$394 $ 116
108

NEWMONT MINING CORPORATION
NOTES TO CONSOLIDATED FINANCIAL STATEMENTS—(Continued)(dollars in millions, except per share, per ounce and per pound amounts)
The following table details selected financial information included in Net cash provided from discontinuedoperations and Net cash provided from (used in) investing and financing activities of discontinued operations:
Years Ended December 31,
2007 2006 2005
Net cash provided from (used in) discontinued operations:(Loss) income from discontinued operations . . . . . . . . . . . . . . . . . . . . $ (923) $ 228 $ 44Depreciation, depletion and amortization . . . . . . . . . . . . . . . . . . . . . . . 46 51 80Deferred income taxes . . . . . . . . . . . . . . . . . . . . . . . . . . . . . . . . . . . . . 55 37 22Gain on asset sales, net . . . . . . . . . . . . . . . . . . . . . . . . . . . . . . . . . . . . . (990) (309) (40)Gain on investments, net . . . . . . . . . . . . . . . . . . . . . . . . . . . . . . . . . . . . (46) (13) (54)Merchant Banking goodwill impairment . . . . . . . . . . . . . . . . . . . . . . . 1,665 — —Other operating adjustments and other write-downs . . . . . . . . . . . . . . 18 96 36Decrease (increase) in net operating assets . . . . . . . . . . . . . . . . . . . . . . 313 6 (14)
$ 138 $ 96 $ 74
Net cash provided from investing activities of discontinued operations:Additions to property, plant and mine development . . . . . . . . . . . . . . . $ (6) $ (20) $ (47)Investments in marketable equity securities . . . . . . . . . . . . . . . . . . . . . (2) (10) (10)Proceeds from sale of marketable securities . . . . . . . . . . . . . . . . . . . . . 90 8 213Proceeds from asset sales, net . . . . . . . . . . . . . . . . . . . . . . . . . . . . . . . . 1,274 353 178Other . . . . . . . . . . . . . . . . . . . . . . . . . . . . . . . . . . . . . . . . . . . . . . . . . . . (2) 7 (1)
$1,354 $ 338 $333
Net cash used in financing activities of discontinued operations:Repayment of debt . . . . . . . . . . . . . . . . . . . . . . . . . . . . . . . . . . . . . . . . $ — $ (7) $ (1)
NOTE 12 STOCKHOLDERS’ EQUITY AND (LOSS) INCOME PER SHARE
Newmont Common Stock
In October 2007, Newmont filed a shelf registration statement on Form S-3 under which it can issue anindeterminate number or amount of common stock, preferred stock, debt securities, guarantees of debt securitiesand warrants from time to time at indeterminate prices. It also included the resale of an indeterminate amount ofcommon stock, preferred stock and debt securities from time to time upon exercise of warrants or conversion ofconvertible securities.
The Company paid common stock dividends of $0.40 per share in 2007, 2006 and 2005.
Treasury Stock
Treasury stock is acquired by the Company when certain restricted stock awards vest or are forfeited (seeNote 22). At vesting, a participant has a tax liability and, pursuant to the participant’s award agreement, mayelect withholding of restricted stock to satisfy tax withholding obligations. The withheld or forfeited stock isaccounted for as treasury stock and carried at the par value of the related common stock.
109

NEWMONT MINING CORPORATION
NOTES TO CONSOLIDATED FINANCIAL STATEMENTS—(Continued)(dollars in millions, except per share, per ounce and per pound amounts)
Exchangeable Shares
In connection with the acquisition of Franco-Nevada Corporation (“Franco”) in February 2002, certainholders of Franco common stock received 0.8 of an exchangeable share of Newmont Mining Corporation ofCanada Limited (formerly Franco) for each share of common stock held. These exchangeable shares areconvertible, at the option of the holder, into shares of Newmont common stock on a one-for-one basis, and entitleholders to dividends and other rights economically equivalent to holders of Newmont common stock. As ofDecember 31, 2007 and 2006, the value of these no-par shares was included in Additional paid-in capital.
Call Spread Transactions
In connection with the issuance of $1,150 of convertible notes in July 2007 (see Note 20), the Companyentered into separate convertible note hedge transactions and separate warrant transactions with respect to theCompany’s common stock to minimize the impact of the potential dilution upon conversion of the convertiblenotes. The Company purchased call options in private transactions to cover 24,887,956 shares of the Company’scommon stock at a strike price of $46.21 per share, subject to adjustment in certain circumstances, forapproximately $366. The call options generally allow the Company to receive shares of the Company’s commonstock from counterparties equal to the number of shares of common stock payable to the holders of the notesupon conversion. The Company also sold warrants in private transactions permitting the purchasers to acquire upto 24,887,956 shares of the Company’s common stock at an exercise price of $60.27, subject to adjustments incertain circumstances, for total proceeds of approximately $248.
The Company has analyzed the Call Spread Transactions under EITF Issue No. 00-19, “Accounting forDerivative Financial Instruments Indexed to, and Potentially Settled in, a Company’s Own Stock,” and otherrelevant literature, and determined that they meet the criteria for classification as equity transactions. As a result,the Company recorded the purchase of the call options as a reduction in additional paid-in capital and theproceeds of the warrants as an addition to paid-in capital, and the Company will not recognize subsequentchanges in fair value of the instruments.
110

NEWMONT MINING CORPORATION
NOTES TO CONSOLIDATED FINANCIAL STATEMENTS—(Continued)(dollars in millions, except per share, per ounce and per pound amounts)
Net (Loss) Income per Common Share
Basic (loss) income per common share is computed by dividing income available to common shareholdersby the weighted average number of common shares outstanding for the period. Diluted (loss) income percommon share is computed similarly to basic income per common share except that the denominator is increasedto include the number of additional common shares that would have been outstanding if the potentially dilutivecommon shares had been issued.
Years Ended December 31,
2007 2006 2005
Numerator:(Loss) income from continuing operations . . . . . . . . . . . . . . . . . . . . . $ (963) $ 563 $ 278(Loss) income from discontinued operations . . . . . . . . . . . . . . . . . . . (923) 228 44
Net (loss) income . . . . . . . . . . . . . . . . . . . . . . . . . . . . . . . . . . . . . . . . $(1,886) $ 791 $ 322
Denominator:Basic . . . . . . . . . . . . . . . . . . . . . . . . . . . . . . . . . . . . . . . . . . . . . . . . . . 452 450 446Effect of employee stock-based awards . . . . . . . . . . . . . . . . . . . . . . . — 2 3
Diluted . . . . . . . . . . . . . . . . . . . . . . . . . . . . . . . . . . . . . . . . . . . . . . . . . 452 452 449
(Loss) income per common shareBasic:
(Loss) income from continuing operations . . . . . . . . . . . . . . . . . $ (2.13) $1.25 $0.62(Loss) income from discontinued operations . . . . . . . . . . . . . . . (2.04) 0.51 0.10
Net (loss) income . . . . . . . . . . . . . . . . . . . . . . . . . . . . . . . . . . . . $ (4.17) $1.76 $0.72
Diluted:(Loss) income from continuing operations . . . . . . . . . . . . . . . . . $ (2.13) $1.25 $0.62(Loss) income from discontinued operations . . . . . . . . . . . . . . . (2.04) 0.50 0.10
Net (loss) income . . . . . . . . . . . . . . . . . . . . . . . . . . . . . . . . . . . . $ (4.17) $1.75 $0.72
Options to purchase 1.7 million, 1.1 million and 3.4 million shares of common stock at average exerciseprices of $52.76, $48.48 and $48.97 were outstanding as of December 31, 2007, 2006 and 2005, respectively, butwere not included in the computation of diluted weighted average number of common shares because the strikeprices of the options exceeded the price of the common stock.
Other outstanding options to purchase 1.4 million shares of common stock were not included in thecomputation of diluted weighted average common shares in 2007 because their effect would have been anti-dilutive.
In July 2007, Newmont issued $1,150 of convertible notes that, if converted in the future, would have apotentially dilutive effect on the Company’s stock (see Note 20). Under the indenture for the convertible notes,upon conversion Newmont is required to settle the principal amount of the convertible notes in cash and mayelect to settle the remaining conversion obligation (stock price in excess of the conversion price) in cash, sharesor a combination thereof. The effect on diluted earnings per share is calculated under the net share settlementmethod in accordance with the FASB’s Emerging Issues Task Force 04-8, “The Effect of ContingentlyConvertible Instruments on Diluted Earnings per Share.” Under the net share settlement method, the Companyincludes the amount of shares it would take to satisfy the conversion obligation, assuming that all of theconvertible notes are surrendered. The average closing price of the Company’s common stock for each of theperiods presented is used as the basis for determining dilution. The average price of the Company’s commonstock for the year ended December 31, 2007 did not exceed the conversion price of $46.21 and therefore, did nothave an effect on diluted earnings per share.
111

NEWMONT MINING CORPORATION
NOTES TO CONSOLIDATED FINANCIAL STATEMENTS—(Continued)(dollars in millions, except per share, per ounce and per pound amounts)
NOTE 13 ACQUISITIONS
On October 9, 2007, the Company announced the proposed acquisition of Miramar Mining Corporation(“Miramar”) and offered to acquire all of the outstanding common shares of Miramar for C$6.25 in cash. OnDecember 27, 2007, 155 million common shares of Miramar had been validly deposited to Newmont’s offer.Newmont accepted and paid for such shares, representing approximately 70% of the common shares of Miramarwhich, in addition to the 18 million shares previously owned by the Company, brought the Company’s interest inMiramar to approximately 78%. Miramar is a Canadian gold company that controls the Hope Bay project, a largeundeveloped gold project in Nunavut, Canada. The Hope Bay Project is consistent with the Company’s strategicfocus on exploration and project development and was acquired with the intention of adding higher grade orereserves and developing a new core gold mining district in a AAA-rated country. Refer to Note 34, SubsequentEvents, for additional information regarding the Company’s acquisition of Miramar.
The combined purchase price of $1,043 was preliminarily allocated based on the estimated fair values ofassets acquired and liabilities assumed at the December 27, 2007 acquisition date as follows:
Assets:Cash and cash equivalents . . . . . . . . . . . . . . . . . . . . . . . . . . . . . . . . . . . . . . . . . . . . . . . . . $ 30Property, plant and mine development, net . . . . . . . . . . . . . . . . . . . . . . . . . . . . . . . . . . . . 1,413Investments . . . . . . . . . . . . . . . . . . . . . . . . . . . . . . . . . . . . . . . . . . . . . . . . . . . . . . . . . . . . . 31Deferred income tax asset . . . . . . . . . . . . . . . . . . . . . . . . . . . . . . . . . . . . . . . . . . . . . . . . . 43Other assets . . . . . . . . . . . . . . . . . . . . . . . . . . . . . . . . . . . . . . . . . . . . . . . . . . . . . . . . . . . . 29
1,546
Liabilities:Accrued liabilities . . . . . . . . . . . . . . . . . . . . . . . . . . . . . . . . . . . . . . . . . . . . . . . . . . . . . . . 33Deferred income tax liabilities . . . . . . . . . . . . . . . . . . . . . . . . . . . . . . . . . . . . . . . . . . . . . . 470
503
Net assets acquired . . . . . . . . . . . . . . . . . . . . . . . . . . . . . . . . . . . . . . . . . . . . . . . . . . . . . . . . . . . $1,043
The allocation of the purchase price has not been finalized. The Company plans to retain an independentthird party appraiser to assist with the assigning of the fair values to the assets acquired and liabilities assumed.The Company expects to complete the allocation in 2008.
In September 2006, Newmont acquired a 40% interest in Shore Gold Inc.’s Fort a la Corne unincorporatedjoint venture diamond project in Saskatchewan, Canada for cash consideration $152.
In March 2006, Newmont acquired Newcrest Mining Limited’s 22.22% interest in the Boddingtonunincorporated joint venture, bringing its interest in the project to 66.67%, for cash consideration of $173.
In January 2006, Newmont acquired the remaining 15% interest in the Akyem project for cash considerationof $23, bringing its interest in the project to 100%.
NOTE 14 DERIVATIVE INSTRUMENTS
Newmont generally avoids gold hedging. Newmont’s philosophy is to provide shareholders with leverage tochanges in the gold price by selling our gold production at market prices. We have, however, entered intoderivative contracts to protect the selling price for certain anticipated gold and copper production and to managerisks associated with commodities, interest rates and foreign currencies.
112
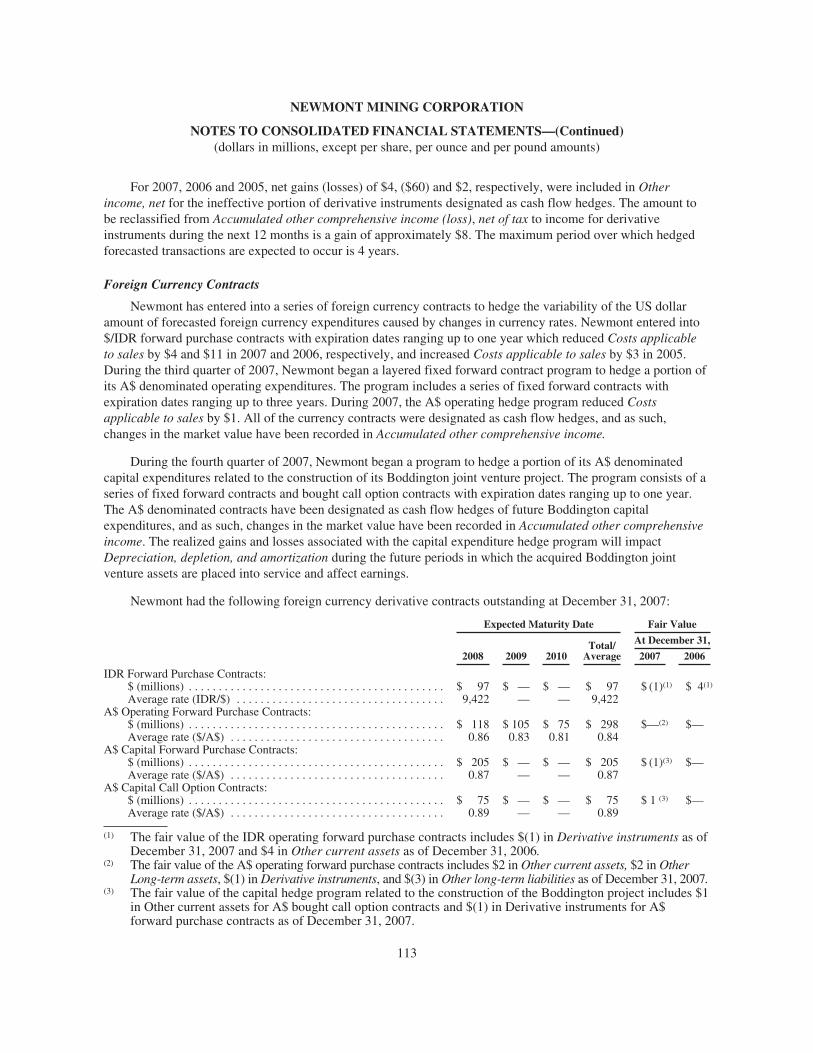
NEWMONT MINING CORPORATION
NOTES TO CONSOLIDATED FINANCIAL STATEMENTS—(Continued)(dollars in millions, except per share, per ounce and per pound amounts)
For 2007, 2006 and 2005, net gains (losses) of $4, ($60) and $2, respectively, were included in Otherincome, net for the ineffective portion of derivative instruments designated as cash flow hedges. The amount tobe reclassified from Accumulated other comprehensive income (loss), net of tax to income for derivativeinstruments during the next 12 months is a gain of approximately $8. The maximum period over which hedgedforecasted transactions are expected to occur is 4 years.
Foreign Currency Contracts
Newmont has entered into a series of foreign currency contracts to hedge the variability of the US dollaramount of forecasted foreign currency expenditures caused by changes in currency rates. Newmont entered into$/IDR forward purchase contracts with expiration dates ranging up to one year which reduced Costs applicableto sales by $4 and $11 in 2007 and 2006, respectively, and increased Costs applicable to sales by $3 in 2005.During the third quarter of 2007, Newmont began a layered fixed forward contract program to hedge a portion ofits A$ denominated operating expenditures. The program includes a series of fixed forward contracts withexpiration dates ranging up to three years. During 2007, the A$ operating hedge program reduced Costsapplicable to sales by $1. All of the currency contracts were designated as cash flow hedges, and as such,changes in the market value have been recorded in Accumulated other comprehensive income.
During the fourth quarter of 2007, Newmont began a program to hedge a portion of its A$ denominatedcapital expenditures related to the construction of its Boddington joint venture project. The program consists of aseries of fixed forward contracts and bought call option contracts with expiration dates ranging up to one year.The A$ denominated contracts have been designated as cash flow hedges of future Boddington capitalexpenditures, and as such, changes in the market value have been recorded in Accumulated other comprehensiveincome. The realized gains and losses associated with the capital expenditure hedge program will impactDepreciation, depletion, and amortization during the future periods in which the acquired Boddington jointventure assets are placed into service and affect earnings.
Newmont had the following foreign currency derivative contracts outstanding at December 31, 2007:
Expected Maturity Date Fair Value
2008 2009 2010Total/
Average
At December 31,
2007 2006
IDR Forward Purchase Contracts:$ (millions) . . . . . . . . . . . . . . . . . . . . . . . . . . . . . . . . . . . . . . . . . . . $ 97 $ — $ — $ 97 $ (1)(1) $ 4(1)
Average rate (IDR/$) . . . . . . . . . . . . . . . . . . . . . . . . . . . . . . . . . . . 9,422 — — 9,422A$ Operating Forward Purchase Contracts:
$ (millions) . . . . . . . . . . . . . . . . . . . . . . . . . . . . . . . . . . . . . . . . . . . $ 118 $ 105 $ 75 $ 298 $—(2) $—Average rate ($/A$) . . . . . . . . . . . . . . . . . . . . . . . . . . . . . . . . . . . . 0.86 0.83 0.81 0.84
A$ Capital Forward Purchase Contracts:$ (millions) . . . . . . . . . . . . . . . . . . . . . . . . . . . . . . . . . . . . . . . . . . . $ 205 $ — $ — $ 205 $ (1)(3) $—Average rate ($/A$) . . . . . . . . . . . . . . . . . . . . . . . . . . . . . . . . . . . . 0.87 — — 0.87
A$ Capital Call Option Contracts:$ (millions) . . . . . . . . . . . . . . . . . . . . . . . . . . . . . . . . . . . . . . . . . . . $ 75 $ — $ — $ 75 $ 1 (3) $—Average rate ($/A$) . . . . . . . . . . . . . . . . . . . . . . . . . . . . . . . . . . . . 0.89 — — 0.89
(1) The fair value of the IDR operating forward purchase contracts includes $(1) in Derivative instruments as ofDecember 31, 2007 and $4 in Other current assets as of December 31, 2006.
(2) The fair value of the A$ operating forward purchase contracts includes $2 in Other current assets, $2 in OtherLong-term assets, $(1) in Derivative instruments, and $(3) in Other long-term liabilities as of December 31, 2007.
(3) The fair value of the capital hedge program related to the construction of the Boddington project includes $1in Other current assets for A$ bought call option contracts and $(1) in Derivative instruments for A$forward purchase contracts as of December 31, 2007.
113

NEWMONT MINING CORPORATION
NOTES TO CONSOLIDATED FINANCIAL STATEMENTS—(Continued)(dollars in millions, except per share, per ounce and per pound amounts)
Newmont had copper collar contracts with a fair value of $(173) and gold put option contracts of $(1)outstanding at December 31, 2006 included in Derivative instruments. Final delivery under the copper collarcontracts occurred in February 2007.
Interest Rate Swap Contracts
As of December 31, 2007, Newmont had $100 fixed to floating swap contracts designated as a hedgeagainst a portion of its $275 85⁄8% debentures. In 2001, Newmont entered into contracts to hedge a portion of theinterest rate risk exposure on a portion of its $275 85⁄8% debentures expiring in 2011 and its $200 83⁄8%debentures which expired in 2005. Under the $275 85⁄8% debentures hedge contract terms, the Company receivesfixed-rate interest payments at 8.625% and pays floating-rate interest amounts based on periodic LondonInterbank Offered Rate (“LIBOR”) settings plus a spread, ranging from 2.60% to 3.49%. Prior to expiration ofthe $200 83⁄8% debentures and the associated hedge contracts, Newmont received fixed-rate interest payments of8.375% and paid floating-rate interest amounts based on periodic LIBOR settings plus a spread, ranging from3.41% to 4.25%. These transactions resulted in a reduction in interest expense of $nil, $nil and $3 for the yearsended December 31, 2007, 2006 and 2005, respectively. The fair value of the interest rate swaps was $4 and $1as of December 31, 2007 and 2006, respectively.
Provisional Copper and Gold Sales
The Company’s sales based on a provisional sales price contain an embedded derivative that is required tobe separated from the host contract for accounting purposes. The host contract is the receivable from the sale ofthe concentrates at the forward London Metal Exchange price at the time of sale. The embedded derivative,which does not qualify for hedge accounting, is marked to market through earnings each period prior to finalsettlement. As of December 31, 2007 and 2006, respectively, we had embedded copper derivatives on113 million pounds and 186 million pounds, recorded at an average price of $3.02 and $2.87 per pound,respectively. As of December 31, 2007 and 2006, respectively, we had embedded gold derivatives on 8,000ounces and 69,000 ounces, recorded at an average price of $828 and $638 per ounce, respectively.
For 2007, 2006 and 2005, the Company recorded the following gross revenues before treatment and refiningcharges, which were subject to final price adjustments as of December 31, 2007, 2006 and 2005, as follows:
At December 31,
2007 2006 2005
Gross revenue subject to final price adjustmentsCopper . . . . . . . . . . . . . . . . . . . . . . . . . . . . . . . . . . . . . . . . . . . . . . . . . . . . $340 $535 $447Gold . . . . . . . . . . . . . . . . . . . . . . . . . . . . . . . . . . . . . . . . . . . . . . . . . . . . . . $ 7 $ 44 $ 19
The average final price adjustments realized were as follows:
Years Ended December 31,
2007 2006 2005
Average final price adjustmentsCopper . . . . . . . . . . . . . . . . . . . . . . . . . . . . . . . . . . . . . . . . . . . . . . . . . . . 1% 31% 12%Gold . . . . . . . . . . . . . . . . . . . . . . . . . . . . . . . . . . . . . . . . . . . . . . . . . . . . . 5% 3% 1%
114
NEWMONT MINING CORPORATION
NOTES TO CONSOLIDATED FINANCIAL STATEMENTS—(Continued)(dollars in millions, except per share, per ounce and per pound amounts)
Price-capped Forward Sales Contracts
In June 2007, the Company paid $578 to settle all of the 1.85 million ounce price-capped forward salescontracts which were accounted for as normal sales contracts under SFAS No. 133 “Accounting for DerivativeInstruments and Hedging Activities” and SFAS No. 138 “Accounting for Certain Derivative Instruments andCertain Hedging Activities-an Amendment to SFAS No. 133.” The Company reported a $531 pre-tax loss on theearly settlement of the contracts, after a $47 reversal of previously recognized deferred revenue in 2007. SeeNote 3 for additional details.
Copper Collar Contracts
During 2005 and 2006, Newmont entered into copper option collar contracts to hedge the copper pricerealized during those periods. Final delivery under the copper collar contracts occurred in February 2007. As ofDecember 31, 2006, approximately 13 million pounds of copper were hedged by the copper option collarcontracts, which had been designated as cash flow hedges of forecasted copper sales. As such, changes in the fairvalue related to the effective portion of the hedges were recorded in Accumulated other comprehensive income.As of December 31, 2006, approximately 89 million pounds of copper option collar contracts were accounted foron a mark-to-market basis through earnings, and the fair value of the copper collar contracts at December 31,2006 was $(173).
NOTE 15 INVESTMENTS
At December 31, 2007
Cost/EquityBasis
Unrealized Fair/EquityBasisGain Loss
Current:Marketable Equity Securities . . . . . . . . . . . . . . . . . . . . . . . . . . . . . . . . . . . . . . . $ 19 $ 39 $— $ 58Other investments, at cost . . . . . . . . . . . . . . . . . . . . . . . . . . . . . . . . . . . . . . . . . . 3 — — 3
$ 22 $ 39 $— $ 61
Long-term:Marketable Debt Securities:
Auction rate securities . . . . . . . . . . . . . . . . . . . . . . . . . . . . . . . . . . . . . . . . . $ 7 $ — $ (2) $ 5Asset backed securities . . . . . . . . . . . . . . . . . . . . . . . . . . . . . . . . . . . . . . . . 31 — — 31
38 — (2) 36
Marketable Equity Securities:Canadian Oil Sands Trust . . . . . . . . . . . . . . . . . . . . . . . . . . . . . . . . . . . . . . 316 907 — 1,223Gabriel Resources Ltd. . . . . . . . . . . . . . . . . . . . . . . . . . . . . . . . . . . . . . . . . 94 — — 94Shore Gold Inc. . . . . . . . . . . . . . . . . . . . . . . . . . . . . . . . . . . . . . . . . . . . . . . 80 — — 80Other . . . . . . . . . . . . . . . . . . . . . . . . . . . . . . . . . . . . . . . . . . . . . . . . . . . . . . 37 15 (7) 45
527 922 (7) 1,442
Investment in Affiliates (Note 10):European Gold Refineries . . . . . . . . . . . . . . . . . . . . . . . . . . . . . . . . . . . . . . 29 — — 29AGR Matthey Joint Venture . . . . . . . . . . . . . . . . . . . . . . . . . . . . . . . . . . . . 17 — — 17Regis Resources NL . . . . . . . . . . . . . . . . . . . . . . . . . . . . . . . . . . . . . . . . . . 3 — — 3
49 — — 49
$614 $922 $ (9) $1,527
115

NEWMONT MINING CORPORATION
NOTES TO CONSOLIDATED FINANCIAL STATEMENTS—(Continued)(dollars in millions, except per share, per ounce and per pound amounts)
At December 31, 2006
Cost/EquityBasis
Unrealized Fair/EquityBasisGain Loss
Current:Marketable Debt Securities:
Auction rate securities . . . . . . . . . . . . . . . . . . . . . . . . . . . . . . . . . . . . . . . . . $ 10 $ — $— $ 10Marketable Equity Securities:
Agincourt Resources . . . . . . . . . . . . . . . . . . . . . . . . . . . . . . . . . . . . . . . . . . 37 10 — 47Other . . . . . . . . . . . . . . . . . . . . . . . . . . . . . . . . . . . . . . . . . . . . . . . . . . . . . . 10 33 — 43
47 43 — 90
Other investments, at cost . . . . . . . . . . . . . . . . . . . . . . . . . . . . . . . . . . . . . . . . . . 9 — — 9
$ 66 $ 43 $— $ 109
Long-term:Marketable Equity Securities:
Canadian Oil Sands Trust . . . . . . . . . . . . . . . . . . . . . . . . . . . . . . . . . . . . . . $265 $603 $— $ 868Gabriel Resources Ltd. . . . . . . . . . . . . . . . . . . . . . . . . . . . . . . . . . . . . . . . . 69 104 — 173Shore Gold Inc. . . . . . . . . . . . . . . . . . . . . . . . . . . . . . . . . . . . . . . . . . . . . . . 90 — — 90Miramar Mining Corporation . . . . . . . . . . . . . . . . . . . . . . . . . . . . . . . . . . . 28 57 — 85Other . . . . . . . . . . . . . . . . . . . . . . . . . . . . . . . . . . . . . . . . . . . . . . . . . . . . . . 34 17 (4) 47
486 781 (4) 1,263
Other investments, at cost . . . . . . . . . . . . . . . . . . . . . . . . . . . . . . . . . . . . . . . . . . 12 — — 12
Investment in Affiliates (Note 10):European Gold Refineries . . . . . . . . . . . . . . . . . . . . . . . . . . . . . . . . . . . . . . 17 — — 17AGR Matthey Joint Venture . . . . . . . . . . . . . . . . . . . . . . . . . . . . . . . . . . . . 16 — — 16Regis Resources NL . . . . . . . . . . . . . . . . . . . . . . . . . . . . . . . . . . . . . . . . . . 11 — — 11
44 — — 44
$542 $781 $ (4) $1,319
In December 2007, Newmont increased its ownership of Miramar to approximately 78% and reclassifiedthis investment from marketable equity securities to consolidated investments. See Note 13 for more informationon the acquisition of Miramar.
In June 2007, the Board of Directors of Newmont approved a plan to discontinue its Merchant BankingSegment. Specifically, the Company decided to dispose of a portion of its existing equity investments within thenext twelve months and not to make further investments in equity securities that do not support its core goldmining business. As a result, the related realized investment gains and impairments have been reclassified to(Loss) income from discontinued operations on the Statements of Consolidated (Loss) Income. For moreinformation on the discontinued operation of the Merchant Banking Segment, see Note 11.
In 2007, the Company recognized a $46 impairment of its investments in Gabriel Resources Ltd. and ShoreGold Inc. for other than temporary declines in the value of these marketable equity securities.
During 2007, the unrealized value of the Company’s investments in marketable equity securities increasedby $191, primarily related to an appreciation in value of Canadian Oil Sands Trust offset by a loss in the value ofGabriel Resources Ltd.
116

NEWMONT MINING CORPORATION
NOTES TO CONSOLIDATED FINANCIAL STATEMENTS—(Continued)(dollars in millions, except per share, per ounce and per pound amounts)
The following table presents the gross unrealized losses and fair value of the Company’s investments withunrealized losses that are not deemed to be other-than-temporarily impaired, aggregated by length of time thatthe individual securities have been in a continuous unrealized loss position as of December 31, 2007 and 2006:
2007 2006
Less than 12 Months Less than 12 Months
Fair ValueUnrealized
Losses Fair ValueUnrealized
Losses
Marketable equity securities . . . . . . . . . . . . . . . . . . . . . . . . . . . . . . $16 $ 7 $104 $ 4
The unrealized loss of $7 in 2007 is primarily related to the Company’s investments in two long-termmarketable equity securities. While the fair value of these investments has fallen below their respective cost, theCompany views these declines as temporary. The Company’s policy is to generally treat a decline in theinvestment’s quoted market value that has lasted continuously for more than six months as an other-than-temporary decline in value, and the fair values of these investments have not been continuously below cost forthe past six months. The Company continues to monitor these investments. The unrealized loss of $4 in 2006 wasprimarily related to the Company’s investments in two other long-term marketable equity securities. One of theseinvestments was impaired in 2007.
NOTE 16 INVENTORIESAt December 31,
2007 2006
In-process . . . . . . . . . . . . . . . . . . . . . . . . . . . . . . . . . . . . . . . . . . . . . . . . . . . . . . . . . . . . $ 64 $ 59Concentrate . . . . . . . . . . . . . . . . . . . . . . . . . . . . . . . . . . . . . . . . . . . . . . . . . . . . . . . . . . . 69 6Precious metals . . . . . . . . . . . . . . . . . . . . . . . . . . . . . . . . . . . . . . . . . . . . . . . . . . . . . . . . 27 41Materials, supplies and other . . . . . . . . . . . . . . . . . . . . . . . . . . . . . . . . . . . . . . . . . . . . . . 303 270
$463 $376
The Company recorded aggregate write-downs of $3, $2 and $nil for 2007, 2006 and 2005, respectively, toreduce the carrying value of inventories to net realizable value. Write-downs in 2007 were related to Australia/New Zealand. Write-downs in 2006 were related to Golden Giant (Other Operations). Inventory write-downs areclassified as components of Costs applicable to sales.
NOTE 17 STOCKPILES AND ORE ON LEACH PADSAt December 31,
2007 2006
Current:Stockpiles . . . . . . . . . . . . . . . . . . . . . . . . . . . . . . . . . . . . . . . . . . . . . . . . . . . . . . . . . . . . . . . $204 $215Ore on leach pads . . . . . . . . . . . . . . . . . . . . . . . . . . . . . . . . . . . . . . . . . . . . . . . . . . . . . . . . . 169 162
$373 $377
Long-term:Stockpiles . . . . . . . . . . . . . . . . . . . . . . . . . . . . . . . . . . . . . . . . . . . . . . . . . . . . . . . . . . . . . . . $528 $527Ore on leach pads . . . . . . . . . . . . . . . . . . . . . . . . . . . . . . . . . . . . . . . . . . . . . . . . . . . . . . . . . 260 285
$788 $812
117
NEWMONT MINING CORPORATION
NOTES TO CONSOLIDATED FINANCIAL STATEMENTS—(Continued)(dollars in millions, except per share, per ounce and per pound amounts)
The Company recorded aggregate write-downs of $14, $2 and $9 for 2007, 2006 and 2005, respectively, toreduce the carrying value of stockpiles to net realizable value. Write-downs in 2007 were primarily related toYanacocha and Australia/New Zealand. The write-down in 2006 was related to Australia/New Zealand. Stockpilewrite-downs in 2005 were largely related to Nevada and Australia/New Zealand. Stockpile and ore on leach padswrite-downs are classified as components of Costs applicable to sales.
NOTE 18 PROPERTY, PLANT AND MINE DEVELOPMENT
At December 31, 2007 At December 31, 2006
DepreciableLife Cost
AccumulatedDepreciation
andDepletion
Net BookValue Cost
AccumulatedDepreciation
andDepletion
Net BookValue
(in years)
Land . . . . . . . . . . . . . . . . . . . . — $ 88 $ — $ 88 $ 85 $ — $ 85Buildings and equipment . . . . 1–25 7,786 (4,110) 3,676 6,839 (3,832) 3,007Mine development . . . . . . . . . 1–25 1,951 (896) 1,055 1,735 (760) 975Mineral interests . . . . . . . . . . . 1–25 2,830 (509) 2,321 1,364 (462) 902Asset retirement cost . . . . . . . 1–25 335 (165) 170 288 (141) 147Construction-in-progress . . . . — 1,830 — 1,830 1,428 — 1,428
$14,820 $(5,680) $9,140 $11,739 $(5,195) $6,544
Leased assets included abovein property, plant and minedevelopment . . . . . . . . . . . . 2–11 $ 378 $ (228) $ 150 $ 389 $ (251) $ 138
At December 31, 2007 At December 31, 2006
Mineral InterestsAmortization
Period
GrossCarrying
ValueAccumulatedAmortization
Net BookValue
GrossCarrying
ValueAccumulatedAmortization
Net BookValue
(in years)
Production stage . . . . . . . . . 1–25 $ 766 $(502) $ 264 $ 684 $(452) $232Development stage . . . . . . . — 386 –– 386 402 (3) 399Exploration stage . . . . . . . . — 1,678 (7) 1,671 278 (7) 271
$2,830 $(509) $2,321 $1,364 $(462) $902
Construction-in-progress during 2007 of $1,830 included $782 at Nevada primarily related to theconstruction of the power plant as well as leach pads and a new crusher at the Phoenix operation, $242 atYanacocha primarily related to the construction of the gold mill, $598 at Australia primarily related to theBoddington project, and $178 at Africa primarily related to the Akyem project, the Ahafo North project, powergeneration projects, and a cyanide recovery circuit.
Construction-in-progress during 2006 of $1,428 included $989 at Nevada primarily related to theconstruction of the power plant and the Leeville project, $191 at Yanacocha primarily related to the constructionof the gold mill and additional leach pads, $138 at Australia primarily related to the Boddington project, and $90at Africa primarily due to the Akyem project.
118
NEWMONT MINING CORPORATION
NOTES TO CONSOLIDATED FINANCIAL STATEMENTS—(Continued)(dollars in millions, except per share, per ounce and per pound amounts)
Exploration stage Mineral Interests increased $1,396 and Development stage Mineral Interests increased$10 in 2007 from the acquisition of Miramar (see Note 13).
NOTE 19 GOODWILL
The carrying amount of goodwill by reporting unit as of December 31, 2007 and 2006 and changes in thecarrying amount of goodwill are summarized in the following table:
NevadaAustralia/
New Zealand Exploration Consolidated
Balance at January 1, 2005 . . . . . . . . . . . . . . . . . . . . . . . . . . . . . $ 41 $186 $ 1,129 $ 1,356Nevada impairment charge . . . . . . . . . . . . . . . . . . . . . . . . . (41) — — (41)
Balance at December 31, 2005 . . . . . . . . . . . . . . . . . . . . . . . . . . — 186 1,129 1,315Boddington acquisition - preliminary . . . . . . . . . . . . . . . . . — 23 — 23
Balance at January 1, 2006 . . . . . . . . . . . . . . . . . . . . . . . . . . . . . — 209 1,129 1,338Boddington acquisition - final . . . . . . . . . . . . . . . . . . . . . . . — (23) — (23)Pre-acquisition income tax contingency adjustment . . . . . . — — (7) (7)Exploration impairment . . . . . . . . . . . . . . . . . . . . . . . . . . . . — — (1,122) (1,122)
Balance at December 31, 2007 . . . . . . . . . . . . . . . . . . . . . . . . . . $ — $186 $ — $ 186
In 2007, annual testing for impairment pursuant to FAS No. 142 (comparison of implied goodwill value tocarrying value) resulted in a goodwill impairment charge for the Exploration Segment of $1,122. The impairmentresulted primarily from (i) a significantly lower assumed annual reserve growth rate (from 4% to 3%), (ii) asignificant change in the financial markets resulting in an increase in the discount rate (from 8% to 10%), and(iii) an increase in finding costs due to a combination of increased spending and reduced exploration success.
In 2005, annual testing for impairment resulted in a goodwill impairment charge for the Nevada Segment of$41. The impairment resulted from a reevaluation of future production and operating costs that indicated higherfuture operating and capital costs.
NOTE 20 DEBT
At December 31,
2007 2006
Current Non-Current Current Non-Current
Sale-leaseback of refractory ore treatment plant . . . . . . . . . . . . . . . $ 22 $ 212 $ 21 $ 23557⁄8% notes, net of discount . . . . . . . . . . . . . . . . . . . . . . . . . . . . . . . — 597 — 59785⁄8% debentures, net of discount . . . . . . . . . . . . . . . . . . . . . . . . . . . — 218 — 2172014 convertible senior notes . . . . . . . . . . . . . . . . . . . . . . . . . . . . . . — 575 — —2017 convertible senior notes . . . . . . . . . . . . . . . . . . . . . . . . . . . . . . — 575 — —Newmont Australia 75⁄8% guaranteed notes, net of premium . . . . . 119 — — 120PTNNT project financing facility . . . . . . . . . . . . . . . . . . . . . . . . . . . 87 306 87 393PTNNT shareholder loan . . . . . . . . . . . . . . . . . . . . . . . . . . . . . . . . . — — 36 —Yanacocha credit facility . . . . . . . . . . . . . . . . . . . . . . . . . . . . . . . . . 14 76 10 90Yanacocha bonds . . . . . . . . . . . . . . . . . . . . . . . . . . . . . . . . . . . . . . . — 100 — 100Project financings, capital leases and other . . . . . . . . . . . . . . . . . . . 13 24 5 —
$255 $2,683 $159 $1,752
119

NEWMONT MINING CORPORATION
NOTES TO CONSOLIDATED FINANCIAL STATEMENTS—(Continued)(dollars in millions, except per share, per ounce and per pound amounts)
Scheduled minimum debt repayments are $255 in 2008, $138 in 2009, $143 in 2010, $322 in 2011, $135 in2012 and $1,945 thereafter.
Sale-Leaseback of Refractory Ore Treatment Plant
In September 1994, the Company entered into a sale and leaseback agreement for its refractory oretreatment plant located in Carlin, Nevada. The lease term is 21 years and aggregate future minimum leasepayments, which include interest, were $299 and $335 as of December 31, 2007 and 2006, respectively. Futureminimum lease payments are $36 in 2008, $37 in 2009, $36 in 2010, $39 in 2011, $70 in 2012 and $81thereafter. The lease includes purchase options during and at the end of the lease at predetermined prices. Theinterest rate on this sale-leaseback transaction is 6.36%. In connection with this transaction, the Company enteredinto certain interest rate hedging contracts that were settled for a gain of $11, which is recognized as a reductionof interest expense over the term of the lease. Including this gain, the effective interest rate on the borrowing is6.15%. The related asset is specialized, therefore it is not practicable to estimate the fair value of this debt.
57⁄8% Notes
In March 2005, Newmont issued uncollateralized notes with a principal amount of $600 due April 2035bearing an annual interest rate of 57⁄8%. Interest on the notes is paid semi-annually in April and October. Usingprevailing interest rates on similar instruments, the estimated fair value of these notes was $523 and $556 as ofDecember 31, 2007 and 2006, respectively. The foregoing fair value estimate was prepared by an independentthird party and may or may not reflect the actual trading value of this debt.
85⁄8% Debentures
Newmont has outstanding uncollateralized debentures with a principal amount of $223 due May 2011 bearingan annual interest rate of 8.625%. Interest is paid semi-annually in May and November and the debentures areredeemable prior to maturity under certain conditions. Newmont has contracts to hedge the interest rate riskexposure on $100 of these debentures. The Company receives fixed-rate interest payments at 8.625% and paysfloating-rate interest based on periodic London Interbank Offered Rate (“LIBOR”) settings plus a spread, rangingfrom 2.60% to 3.49% (see Note 14). Using prevailing interest rates on similar instruments, the estimated fair valueof these debentures was $238 and $244 as of December 31, 2007, and 2006, respectively. The foregoing fair valueestimate was prepared by an independent third party and may or may not reflect the actual trading value of this debt.
2014 and 2017 Convertible Senior Notes
During July 2007, the Company completed a private offering of $1,150 convertible senior notes due 2014 and2017, each in the amount of $575. The 2014 notes, maturing on July 15, 2014, will pay interest semi-annually at arate of 1.25% per annum, and the 2017 notes, maturing on July 15, 2017, will pay interest semi-annually at a rate of1.625% per annum. The notes are convertible, at the holder’s option, equivalent to a conversion price of $46.21 pershare of common stock. Upon conversion, the principle amount and all accrued interest will be repaid in cash andany conversion premium will be settled in shares of our common stock or, at our election, cash or any combinationof cash and shares of our common stock. The Company does not have an option to redeem the notes prior to theirapplicable stated maturity date. The net proceeds from the offering, after expenses, were approximately $1,126.
In connection with the convertible senior notes offering, the Company entered into convertible note hedgetransactions and warrant transactions (“Call Spread Transactions”). These transactions included the purchase of calloptions and the sale of warrants. The purchased call options cover, in the aggregate and subject to customary anti-dilution adjustments, 24,887,956 shares of the Company’s common stock, par value $1.60 per share. The Company
120
NEWMONT MINING CORPORATION
NOTES TO CONSOLIDATED FINANCIAL STATEMENTS—(Continued)(dollars in millions, except per share, per ounce and per pound amounts)
sold warrants to purchase, in the aggregate and subject to customary anti-dilution adjustments, 24,887,956 shares ofcommon stock at a price of $60.27 per share. In most cases, the warrants may not be exercised prior to the maturityof the notes. As a result of the call option and warrant transactions, the conversion price of $46.21 was effectivelyincreased to $60.27. The aggregate cost to the Company of the purchased call options was $366, partially offset by$248 that the Company received from the sale of the warrants. The Company has analyzed the Call SpreadTransactions under EITF Issue No. 00-19, “Accounting for Derivative Financial Instruments Indexed to, andPotentially Settled in, a Company’s Own Stock,” and other relevant literature, and determined that they meet thecriteria for classification as equity transactions. As a result, the Company recorded the purchase of the call optionsas a reduction in paid-in capital and the proceeds of the warrants as an addition to paid-in capital, and the Companywill not recognize subsequent changes in fair value of the agreements.
Also in connection with the convertible senior notes offering, the Company entered into a Registration RightsAgreement dated as of July 17, 2007 (the “Registration Rights Agreement”). Pursuant to the Registration RightsAgreement, the Company agreed to file a shelf registration statement covering resales of the convertible seniornotes and the shares of common stock issuable upon conversion of the notes. On October 15, 2007, the Companyfiled the registration statement with the SEC, and it became effective immediately upon filing. On October 16,2007, the Company filed a prospectus supplement naming the selling security holders eligible to resell notes andcommon stock under the shelf registration statement. The Company is required to file amendments and supplementsto the shelf registration statement from time to time to update the identification of selling security holders.
Pursuant to the Registration Rights Agreement, the Company agreed to, at its cost and subject to certain rights tosuspend use of the shelf registration statement, use commercially reasonable efforts to keep the shelf registrationstatement effective for a period of two years after the closing of the offering of the notes or until the earlier of (i) thesale or transfer pursuant to a shelf registration statement of all of the notes and common stock issuable uponconversion of the notes, (ii) the date when holders (other than holders that are affiliates of the Company) of the notesand common stock issuable upon conversion of the notes are able to sell all such securities immediately withoutrestriction, and (iii) the date on which all of the notes have been converted or all of the notes and common stockissuable upon conversion of the notes otherwise cease to be outstanding. In the event that the shelf registrationstatement is not effective for reasons other than the Company’s right to suspend its use, additional interest will accrueat a rate per year equal to 0.25% for the first 90 days after the occurrence of the event and 0.50% after the first 90days until an effective registration statement is re-established. The Company expects that the shelf registrationstatement will remain effective for the required period of time and accordingly, has not recorded a liability forpotential payments resulting from the additional interest provisions of the Registration Rights Agreement.
Newmont Australia 75⁄8% Notes
Newmont Finance Limited (“NFL”) a subsidiary of Newmont Australia Limited (“NAL”) has outstandingnotes with a principal amount of $119 due July 2008 bearing an annual interest rate of 75⁄8% guaranteed byNAL. Interest on the notes is paid semi-annually in arrears in January and July. The estimated fair value of thesenotes approximates the carrying value as of December 31, 2007 and 2006. The foregoing fair value estimate wasprepared by an independent third party and may or may not reflect the actual trading value of this debt.
PTNNT Shareholder Loans
PTNNT had shareholder subordinated loan agreements (“Shareholder Loans”) with Newmont IndonesiaLimited (“NIL”), a wholly-owned subsidiary of Newmont, and Nusa Tenggara Mining Corporation (“NTMC”), anaffiliate of Sumitomo Corporation, with substantially the same terms for each shareholder. The loan principal andinterest was fully paid on November 30, 2007. Accordingly, total principal outstanding under these Shareholder
121

NEWMONT MINING CORPORATION
NOTES TO CONSOLIDATED FINANCIAL STATEMENTS—(Continued)(dollars in millions, except per share, per ounce and per pound amounts)
Loans was $nil and $83 as of December 31, 2007 and 2006, respectively. At December 31, 2006, 43.75% orapproximately $36 was due to NTMC, an unrelated third-party, and was non-recourse to Newmont, with theremainder payable to a subsidiary consolidated by Newmont. Payments of $36 and $3 were made to NTMC during2007 and 2006, respectively. Borrowings under the Shareholder Loans were guaranteed by NTP and payable ondemand, subject to the Senior Debt subordination terms. The Shareholder Loans were based on the six-monthSingapore Interbank Offering Rate (“SIBOR”) plus 3% for principal and SIBOR rate plus 4% for any unpaidaccrued interest. The weighted average interest rates were 8.4%, 8.2% and 6.3% during 2007, 2006 and 2005,respectively, and the interest rates were 8.4% and 8.4% as of December 31, 2007 and 2006, respectively.
Newmont and NTMC provide a contingent support line of credit to PTNNT. No funding was required in2007. Available additional support from NTP’s partners was $65, of which Newmont’s pro-rata share was $37,as of December 31, 2007.
Project Financings
PTNNT Project Financing Facility
PTNNT has a project financing facility with a syndicate of banks. The scheduled repayments of this debt aresemi-annual installments of $43 through November 2010 and $22 from May 2011 through November 2013.Amounts outstanding under the project financing were $393 and $480 as of December 31, 2007 and 2006.
The project financing facility is non-recourse to Newmont and substantially all of PTNNT’s assets arepledged as collateral. The carrying value of the property, plant and mine development was $1,428 and $1,456 asof December 31, 2007 and 2006, respectively. Under the terms of the project financing facility, PTNNTmaintains an escrow account for the next interest and principal installment due. Such amount totaled $57 and $61as of December 31, 2007 and 2006, respectively, and was included in Other long-term assets.
The interest rate is based on blended fixed and floating rates and at market rates on December 31, 2007, theweighted average interest rate approximated LIBOR plus 1.6%. The weighted average interest rates were 6.9%,6.7% and 5.7% during 2007, 2006 and 2005, respectively, and the interest rates were 6.5% and 7.0% as ofDecember 31, 2007 and 2006, respectively. The fair market value cannot be practicably determined due to thelack of available market information for this type of debt.
Yanacocha
$24 from Banco de Credito del Peru Leasing. During 2007, Yanacocha acquired nine haul trucks through acapital lease agreement with Banco de Credito del Peru. Monthly repayments begin in January 2008 for threeyears. The lease bears interest at an annual fixed rate of 6.10%.
$4 from Bank of Nova Scotia Leasing. During 2007, Yanacocha signed a $16 capital lease agreement withthe Scotia Bank to acquire six haul trucks. As of December 2007, as per the lease agreement, Yanacocha is onlycommitted to the bank for $4. Monthly repayments begin in February 2008 for three years. The lease bearsinterest at an annual fixed rate of 6.00%.
$100 Credit Facility. During 2006, Yanacocha entered into an uncollateralized $100 bank financing with asyndicate of Peruvian commercial banks. Quarterly repayments commenced in May 2007 ($10 was paid during2007) with final maturity May 2014. Borrowings under the facility bear interest at a rate of LIBOR plus 1.875%.The loan is non-recourse to Newmont. The estimated fair value of this credit facility approximates the carryingvalue as of December 31, 2007.
122

NEWMONT MINING CORPORATION
NOTES TO CONSOLIDATED FINANCIAL STATEMENTS—(Continued)(dollars in millions, except per share, per ounce and per pound amounts)
$100 Bond Program. During 2006, Yanacocha issued $100 of bonds into the Peruvian capital markets undera $200 bond program. The issuance is comprised of $42 of floating interest rate bonds bearing interest at a rate ofLIBOR plus 1.4375% and $58 of fixed rate bonds bearing an annual interest of 7.0%. Quarterly repaymentscommence in July 2010 for six years. The bonds are uncollateralized and are non-recourse to Newmont. Theestimated fair value of these bonds approximates the carrying value as of December 31, 2007.
Ahafo
Proposed Financing. In June 2006, Newmont Ghana Gold Limited (“NGGL”), a wholly-owned subsidiary,entered into a $125 project financing with the International Finance Corporation (“IFC”). The financing iscomprised of a $75 A-loan funded by the IFC; and a $50 B-loan funded by a syndicate of commercial lenders. Thefinancing contains certain Conditions of Disbursement that must be completed prior to funds being made available.NGGL has not yet drawn down on this facility. Under the current agreement, amounts borrowed under the financingwill be collateralized by the assets of the Ahafo project and will be guaranteed by Newmont pending the successfulcompletion of requirements associated with the Project Financial Completion Certificate (“Project FinancialCompletion”). The loans will require semi-annual payments. The A-loan has a final maturity of October 2018 andborrowings will be subject to an interest rate of LIBOR plus 1.125% pre-completion, and LIBOR plus 2.00%following Project Financial Completion. The B-loan has a final maturity of October 2017 and borrowings will besubject to an interest rate of LIBOR plus 0.80% pre-completion, and LIBOR plus 1.40% post-completion for thefirst 4-years. The interest rate on the B-loan then increases to LIBOR plus 1.70% (years 5-7); LIBOR plus 1.90%(years 8-9) and LIBOR plus 2.00% (thereafter). Due to various factors, including power disruptions and generalincreases in operating costs, NGGL has not yet completed the requirements associated with Project FinancialCompletion. NGGL is currently in discussions with the IFC and the commercial lenders regarding possible changesto the Loan Agreement that may alter the terms and structure of this financing facility.
Corporate Revolving Credit Facilities
The Company has an uncollateralized $2,000 revolving credit facility with a syndicate of commercial banks,which matures in April 2012. The facility contains a letter of credit sub-facility. Interest rates and facility feesvary based on the credit ratings of the Company’s senior, uncollateralized, long-term debt. Borrowings under thefacilities bear interest at an annual interest rate of LIBOR plus a margin of 0.28% or the lead bank’s primeinterest rate. Facility fees accrue at an annual rate of 0.07% of the aggregate commitments. The Company alsopays a utilization fee of 0.05% on the amount of revolving credit loans and letters of credit outstanding under thefacility for each day on which the sum of such loans and letters of credit exceed 50% of the commitments underthe facility. As of December 31, 2007 and 2006, the facility fees were 0.07% and 0.09% of the commitment,respectively. There was $440 and $321 outstanding under the letter of credit sub-facility as of December 31,2007 and 2006, respectively. As of December 31, 2007 we had $2,000 of the credit facility borrowings available.
Debt Covenants
The 57⁄8% notes, Newmont Australia 75⁄8% notes, 85⁄8% debentures, and sale-leaseback of the refractoryore treatment plant debt facilities contain various common public debt covenants and default provisions includingpayment defaults, limitation on liens, limitation on sales and leaseback agreements and merger restrictions.
In addition to the covenants noted above, the corporate revolving credit facility contains a financial ratiocovenant requiring the Company to maintain a net debt (total debt net of cash and cash equivalents) to totalcapitalization ratio of less than or equal to 62.5%. Furthermore, the corporate revolving credit facility containscovenants limiting the sale of all or substantially all of the Company’s assets, certain change of controlprovisions and a negative pledge on certain assets.
123
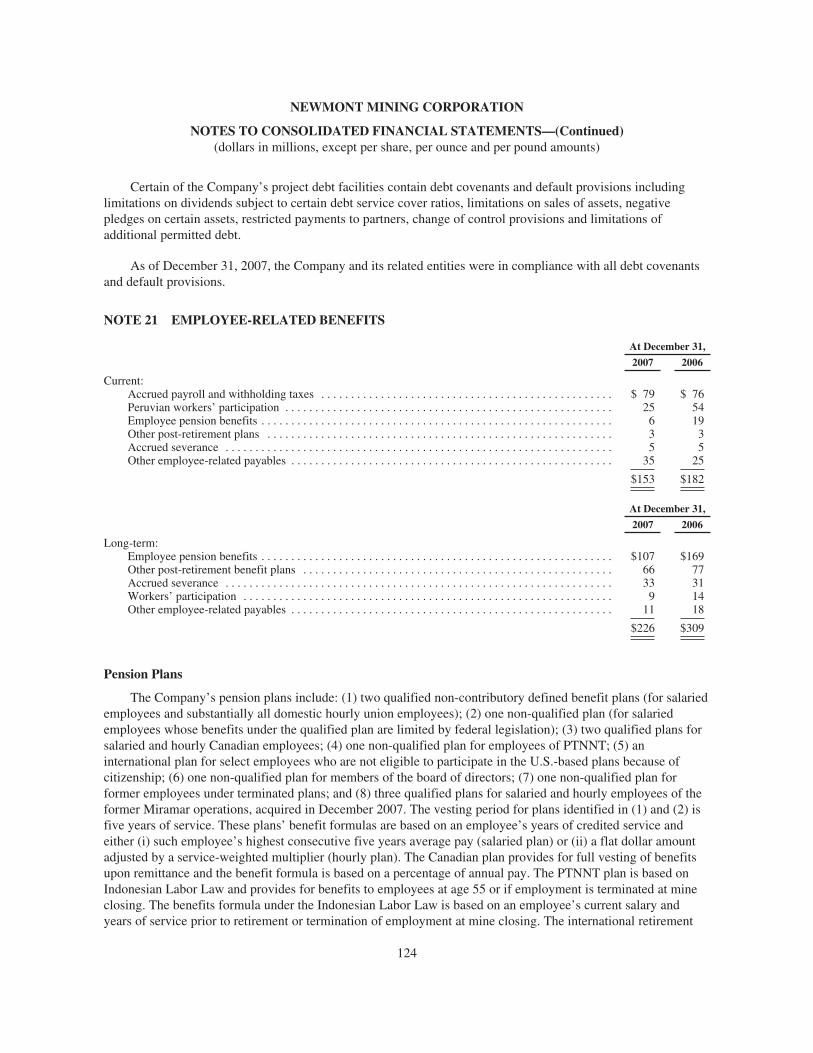
NEWMONT MINING CORPORATION
NOTES TO CONSOLIDATED FINANCIAL STATEMENTS—(Continued)(dollars in millions, except per share, per ounce and per pound amounts)
Certain of the Company’s project debt facilities contain debt covenants and default provisions includinglimitations on dividends subject to certain debt service cover ratios, limitations on sales of assets, negativepledges on certain assets, restricted payments to partners, change of control provisions and limitations ofadditional permitted debt.
As of December 31, 2007, the Company and its related entities were in compliance with all debt covenantsand default provisions.
NOTE 21 EMPLOYEE-RELATED BENEFITS
At December 31,
2007 2006
Current:Accrued payroll and withholding taxes . . . . . . . . . . . . . . . . . . . . . . . . . . . . . . . . . . . . . . . . . . . . . . . . . $ 79 $ 76Peruvian workers’ participation . . . . . . . . . . . . . . . . . . . . . . . . . . . . . . . . . . . . . . . . . . . . . . . . . . . . . . . 25 54Employee pension benefits . . . . . . . . . . . . . . . . . . . . . . . . . . . . . . . . . . . . . . . . . . . . . . . . . . . . . . . . . . . 6 19Other post-retirement plans . . . . . . . . . . . . . . . . . . . . . . . . . . . . . . . . . . . . . . . . . . . . . . . . . . . . . . . . . . 3 3Accrued severance . . . . . . . . . . . . . . . . . . . . . . . . . . . . . . . . . . . . . . . . . . . . . . . . . . . . . . . . . . . . . . . . . 5 5Other employee-related payables . . . . . . . . . . . . . . . . . . . . . . . . . . . . . . . . . . . . . . . . . . . . . . . . . . . . . . 35 25
$153 $182
At December 31,
2007 2006
Long-term:Employee pension benefits . . . . . . . . . . . . . . . . . . . . . . . . . . . . . . . . . . . . . . . . . . . . . . . . . . . . . . . . . . . $107 $169Other post-retirement benefit plans . . . . . . . . . . . . . . . . . . . . . . . . . . . . . . . . . . . . . . . . . . . . . . . . . . . . 66 77Accrued severance . . . . . . . . . . . . . . . . . . . . . . . . . . . . . . . . . . . . . . . . . . . . . . . . . . . . . . . . . . . . . . . . . 33 31Workers’ participation . . . . . . . . . . . . . . . . . . . . . . . . . . . . . . . . . . . . . . . . . . . . . . . . . . . . . . . . . . . . . . 9 14Other employee-related payables . . . . . . . . . . . . . . . . . . . . . . . . . . . . . . . . . . . . . . . . . . . . . . . . . . . . . . 11 18
$226 $309
Pension Plans
The Company’s pension plans include: (1) two qualified non-contributory defined benefit plans (for salariedemployees and substantially all domestic hourly union employees); (2) one non-qualified plan (for salariedemployees whose benefits under the qualified plan are limited by federal legislation); (3) two qualified plans forsalaried and hourly Canadian employees; (4) one non-qualified plan for employees of PTNNT; (5) aninternational plan for select employees who are not eligible to participate in the U.S.-based plans because ofcitizenship; (6) one non-qualified plan for members of the board of directors; (7) one non-qualified plan forformer employees under terminated plans; and (8) three qualified plans for salaried and hourly employees of theformer Miramar operations, acquired in December 2007. The vesting period for plans identified in (1) and (2) isfive years of service. These plans’ benefit formulas are based on an employee’s years of credited service andeither (i) such employee’s highest consecutive five years average pay (salaried plan) or (ii) a flat dollar amountadjusted by a service-weighted multiplier (hourly plan). The Canadian plan provides for full vesting of benefitsupon remittance and the benefit formula is based on a percentage of annual pay. The PTNNT plan is based onIndonesian Labor Law and provides for benefits to employees at age 55 or if employment is terminated at mineclosing. The benefits formula under the Indonesian Labor Law is based on an employee’s current salary andyears of service prior to retirement or termination of employment at mine closing. The international retirement
124

NEWMONT MINING CORPORATION
NOTES TO CONSOLIDATED FINANCIAL STATEMENTS—(Continued)(dollars in millions, except per share, per ounce and per pound amounts)
plan’s basic and savings accounts have a graded vesting schedule and are fully vested after four years of service.The international retirement plan’s supplemental account is vested after attaining age 55 with 10 years of serviceor attaining age 62. The plan’s benefit formula is based on a percentage of compensation as defined in the plandocument. The former Miramar operation’s plans will continue for current retired members and no additionalemployees will become eligible for benefits under these plans.
Pension costs are determined annually by independent actuaries and pension contributions to the qualifiedplans are made based on funding standards established under the Employee Retirement Income Security Act of1974.
Other Benefit Plans
The Company provides defined medical and life insurance benefits to selected qualified U.S. and Canadianretirees (generally salaried employees and to a limited extent their eligible dependents). In general, participantsbecome eligible for these benefits upon retirement directly from the Company if they are at least 55 years oldand, for U.S. employees, the combination of their age and years of service with the Company equals 75 or more.This benefit is not provided to employees who joined the Company after January 1, 2003.
Defined medical benefits cover most of the reasonable and customary charges for hospital, surgical,diagnostic and physician services and prescription drugs. Life insurance benefits are based on a percentage offinal base annual salary and decline over time after retirement commences. The majority of the costs of thesemedical and life insurance benefits are paid by the Company. In 2003, the Company began a strategy to moreequitably share costs with retirees; by 2008, 75% of retiree medical coverage cost will be paid by the Company.Qualified retirees that become eligible after January 1, 2003 are required to contribute additional amounts to themedical coverage.
Under the Medicare Prescription Drug, Improvement and Modernization Act of 2003 (the “Act”), beginningin 2006, the Act provides a prescription drug benefit under Medicare Part D, as well as a federal subsidy to plansponsors of retiree healthcare plans that provide a prescription drug benefit to their participants that is at leastactuarially equivalent to the benefit that is available under Medicare. The Company sponsors retiree health careplans that provide prescription drug benefits to eligible retirees that our plan actuaries have determined areactuarially equivalent to Medicare Part D. The effect of the Act was to decrease post-retirement projected benefitobligation by $6 and $8 in 2007 and 2006, respectively.
125
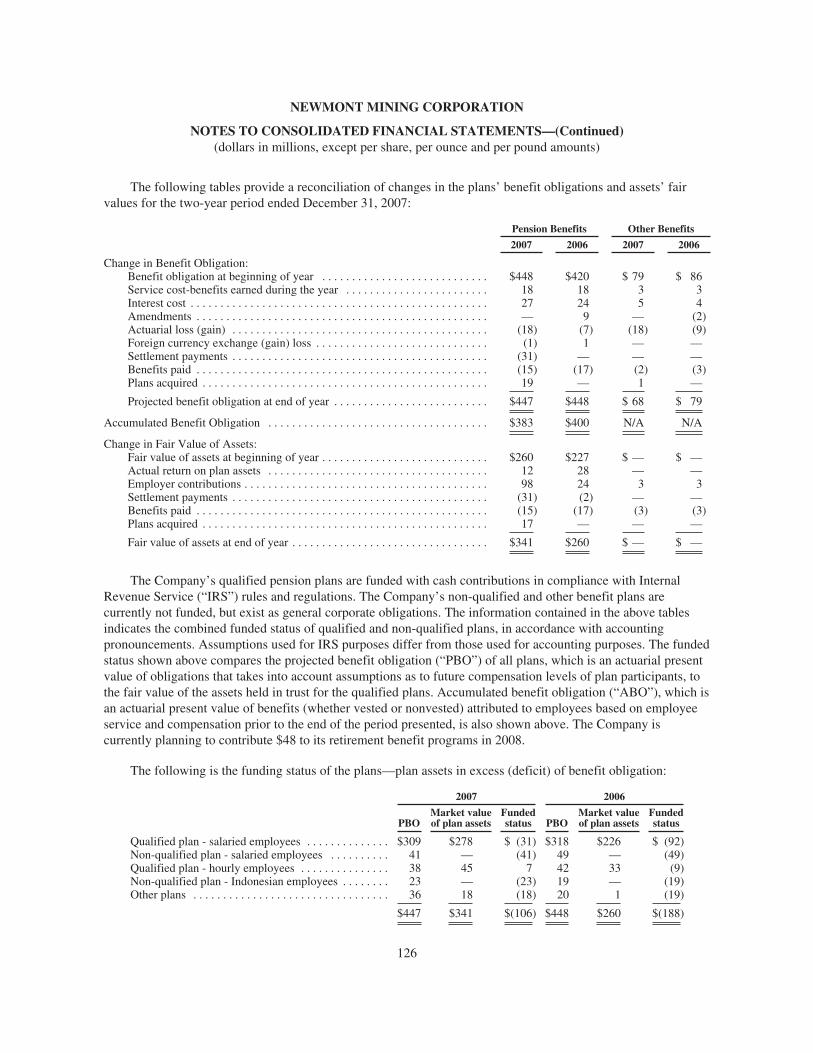
NEWMONT MINING CORPORATION
NOTES TO CONSOLIDATED FINANCIAL STATEMENTS—(Continued)(dollars in millions, except per share, per ounce and per pound amounts)
The following tables provide a reconciliation of changes in the plans’ benefit obligations and assets’ fairvalues for the two-year period ended December 31, 2007:
Pension Benefits Other Benefits
2007 2006 2007 2006
Change in Benefit Obligation:Benefit obligation at beginning of year . . . . . . . . . . . . . . . . . . . . . . . . . . . . $448 $420 $ 79 $ 86Service cost-benefits earned during the year . . . . . . . . . . . . . . . . . . . . . . . . 18 18 3 3Interest cost . . . . . . . . . . . . . . . . . . . . . . . . . . . . . . . . . . . . . . . . . . . . . . . . . . 27 24 5 4Amendments . . . . . . . . . . . . . . . . . . . . . . . . . . . . . . . . . . . . . . . . . . . . . . . . . — 9 — (2)Actuarial loss (gain) . . . . . . . . . . . . . . . . . . . . . . . . . . . . . . . . . . . . . . . . . . . (18) (7) (18) (9)Foreign currency exchange (gain) loss . . . . . . . . . . . . . . . . . . . . . . . . . . . . . (1) 1 — —Settlement payments . . . . . . . . . . . . . . . . . . . . . . . . . . . . . . . . . . . . . . . . . . . (31) — — —Benefits paid . . . . . . . . . . . . . . . . . . . . . . . . . . . . . . . . . . . . . . . . . . . . . . . . . (15) (17) (2) (3)Plans acquired . . . . . . . . . . . . . . . . . . . . . . . . . . . . . . . . . . . . . . . . . . . . . . . . 19 — 1 —
Projected benefit obligation at end of year . . . . . . . . . . . . . . . . . . . . . . . . . . $447 $448 $ 68 $ 79
Accumulated Benefit Obligation . . . . . . . . . . . . . . . . . . . . . . . . . . . . . . . . . . . . . $383 $400 N/A N/A
Change in Fair Value of Assets:Fair value of assets at beginning of year . . . . . . . . . . . . . . . . . . . . . . . . . . . . $260 $227 $ — $ —Actual return on plan assets . . . . . . . . . . . . . . . . . . . . . . . . . . . . . . . . . . . . . 12 28 — —Employer contributions . . . . . . . . . . . . . . . . . . . . . . . . . . . . . . . . . . . . . . . . . 98 24 3 3Settlement payments . . . . . . . . . . . . . . . . . . . . . . . . . . . . . . . . . . . . . . . . . . . (31) (2) — —Benefits paid . . . . . . . . . . . . . . . . . . . . . . . . . . . . . . . . . . . . . . . . . . . . . . . . . (15) (17) (3) (3)Plans acquired . . . . . . . . . . . . . . . . . . . . . . . . . . . . . . . . . . . . . . . . . . . . . . . . 17 — — —
Fair value of assets at end of year . . . . . . . . . . . . . . . . . . . . . . . . . . . . . . . . . $341 $260 $ — $ —
The Company’s qualified pension plans are funded with cash contributions in compliance with InternalRevenue Service (“IRS”) rules and regulations. The Company’s non-qualified and other benefit plans arecurrently not funded, but exist as general corporate obligations. The information contained in the above tablesindicates the combined funded status of qualified and non-qualified plans, in accordance with accountingpronouncements. Assumptions used for IRS purposes differ from those used for accounting purposes. The fundedstatus shown above compares the projected benefit obligation (“PBO”) of all plans, which is an actuarial presentvalue of obligations that takes into account assumptions as to future compensation levels of plan participants, tothe fair value of the assets held in trust for the qualified plans. Accumulated benefit obligation (“ABO”), which isan actuarial present value of benefits (whether vested or nonvested) attributed to employees based on employeeservice and compensation prior to the end of the period presented, is also shown above. The Company iscurrently planning to contribute $48 to its retirement benefit programs in 2008.
The following is the funding status of the plans—plan assets in excess (deficit) of benefit obligation:
2007 2006
PBOMarket valueof plan assets
Fundedstatus PBO
Market valueof plan assets
Fundedstatus
Qualified plan - salaried employees . . . . . . . . . . . . . . $309 $278 $ (31) $318 $226 $ (92)Non-qualified plan - salaried employees . . . . . . . . . . 41 — (41) 49 — (49)Qualified plan - hourly employees . . . . . . . . . . . . . . . 38 45 7 42 33 (9)Non-qualified plan - Indonesian employees . . . . . . . . 23 — (23) 19 — (19)Other plans . . . . . . . . . . . . . . . . . . . . . . . . . . . . . . . . . 36 18 (18) 20 1 (19)
$447 $341 $(106) $448 $260 $(188)
126
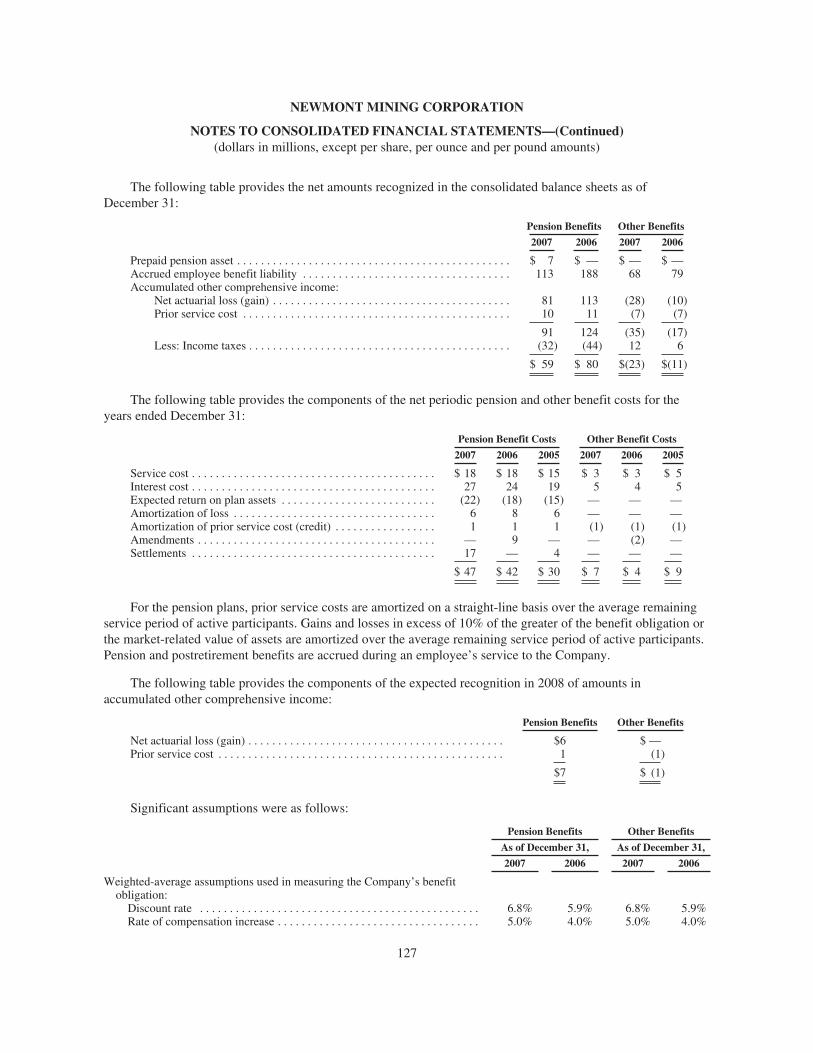
NEWMONT MINING CORPORATION
NOTES TO CONSOLIDATED FINANCIAL STATEMENTS—(Continued)(dollars in millions, except per share, per ounce and per pound amounts)
The following table provides the net amounts recognized in the consolidated balance sheets as ofDecember 31:
Pension Benefits Other Benefits
2007 2006 2007 2006
Prepaid pension asset . . . . . . . . . . . . . . . . . . . . . . . . . . . . . . . . . . . . . . . . . . . . . . $ 7 $ — $ — $ —Accrued employee benefit liability . . . . . . . . . . . . . . . . . . . . . . . . . . . . . . . . . . . 113 188 68 79Accumulated other comprehensive income:
Net actuarial loss (gain) . . . . . . . . . . . . . . . . . . . . . . . . . . . . . . . . . . . . . . . . 81 113 (28) (10)Prior service cost . . . . . . . . . . . . . . . . . . . . . . . . . . . . . . . . . . . . . . . . . . . . . 10 11 (7) (7)
91 124 (35) (17)Less: Income taxes . . . . . . . . . . . . . . . . . . . . . . . . . . . . . . . . . . . . . . . . . . . . (32) (44) 12 6
$ 59 $ 80 $(23) $(11)
The following table provides the components of the net periodic pension and other benefit costs for theyears ended December 31:
Pension Benefit Costs Other Benefit Costs
2007 2006 2005 2007 2006 2005
Service cost . . . . . . . . . . . . . . . . . . . . . . . . . . . . . . . . . . . . . . . . . $ 18 $ 18 $ 15 $ 3 $ 3 $ 5Interest cost . . . . . . . . . . . . . . . . . . . . . . . . . . . . . . . . . . . . . . . . . 27 24 19 5 4 5Expected return on plan assets . . . . . . . . . . . . . . . . . . . . . . . . . . (22) (18) (15) — — —Amortization of loss . . . . . . . . . . . . . . . . . . . . . . . . . . . . . . . . . . 6 8 6 — — —Amortization of prior service cost (credit) . . . . . . . . . . . . . . . . . 1 1 1 (1) (1) (1)Amendments . . . . . . . . . . . . . . . . . . . . . . . . . . . . . . . . . . . . . . . . — 9 — — (2) —Settlements . . . . . . . . . . . . . . . . . . . . . . . . . . . . . . . . . . . . . . . . . 17 — 4 — — —
$ 47 $ 42 $ 30 $ 7 $ 4 $ 9
For the pension plans, prior service costs are amortized on a straight-line basis over the average remainingservice period of active participants. Gains and losses in excess of 10% of the greater of the benefit obligation orthe market-related value of assets are amortized over the average remaining service period of active participants.Pension and postretirement benefits are accrued during an employee’s service to the Company.
The following table provides the components of the expected recognition in 2008 of amounts inaccumulated other comprehensive income:
Pension Benefits Other Benefits
Net actuarial loss (gain) . . . . . . . . . . . . . . . . . . . . . . . . . . . . . . . . . . . . . . . . . . . $6 $ —Prior service cost . . . . . . . . . . . . . . . . . . . . . . . . . . . . . . . . . . . . . . . . . . . . . . . . 1 (1)
$7 $ (1)
Significant assumptions were as follows:
Pension Benefits Other Benefits
As of December 31, As of December 31,
2007 2006 2007 2006
Weighted-average assumptions used in measuring the Company’s benefitobligation:
Discount rate . . . . . . . . . . . . . . . . . . . . . . . . . . . . . . . . . . . . . . . . . . . . . . . 6.8% 5.9% 6.8% 5.9%Rate of compensation increase . . . . . . . . . . . . . . . . . . . . . . . . . . . . . . . . . . 5.0% 4.0% 5.0% 4.0%
127

NEWMONT MINING CORPORATION
NOTES TO CONSOLIDATED FINANCIAL STATEMENTS—(Continued)(dollars in millions, except per share, per ounce and per pound amounts)
Pension Benefits Other Benefits
Years Ended December 31, Years Ended December 31,
2007 2006 2005 2007 2006 2005
Weighted-average assumptions used in measuringthe net periodic pension benefit cost:
Discount long-term rate . . . . . . . . . . . . . . . . . 5.9% 5.75% 5.75% 5.9% 5.75% 5.75%Expected return on plan assets . . . . . . . . . . . . 8.0% 8.0% 8.0% N/A N/A N/ARate of compensation increase . . . . . . . . . . . . 4.0% 4.0% 4.0% 4.0% 4.0% 4.0%
Yield curves matching our benefit obligations were derived using a cash flow analysis under the Citigrouppension discount curve. The Citigroup pension discount curve shows the relationship between interest rates andduration for hypothetical zero coupon investments. Under this approach, Treasury par curve data is used to setthe shape of the yield curve and calculate the AA corporate spot yield at each maturity. The resulting curve wasused to identify a discount rate for the Company of 6.8% and 5.9% in 2007 and 2006, respectively, based on thetiming of future benefit payments. The decision to use 8% as the expected long-term return on plan assets wasmade based on an analysis of the actual plan asset returns over multiple time horizons and review of assumptionsused by other U.S. corporations with defined benefit plans of similar size and investment strategy and isreviewed periodically by the audit committee. The average actual return on plan assets during the 19 years endedDecember 31, 2007 approximated 10%.
The pension plan employs several independent investment firms which invest the assets of the plan incertain approved funds that correspond to specific asset classes with associated target allocations. Dependingupon actual sector performance, the assets in the plan are periodically rebalanced to match the established targetlevels for the asset classes. The goal of the pension fund investment program is to achieve expected rates ofreturn consistent with the investment risk associated with the approved investment portfolio. The investmentperformance of the plan and that of the individual investment firms is measured against recognized marketindices. This performance is monitored by an investment committee comprised of members of the Company’smanagement, which is advised by an independent investment consultant. The performance of the plan isreviewed annually with the Audit Committee of the Company’s board of directors. The following is a summaryof the target asset allocations for 2007 and the actual asset allocation at December 31, 2007.
Asset Allocation Target
Actual atDecember 31,
2007
U.S. equity investments . . . . . . . . . . . . . . . . . . . . . . . . . . . . . . . . . . . . . . . . . . . 45% 40%International equity investments . . . . . . . . . . . . . . . . . . . . . . . . . . . . . . . . . . . . . 20% 20%Fixed income investments . . . . . . . . . . . . . . . . . . . . . . . . . . . . . . . . . . . . . . . . . 35% 35%Cash . . . . . . . . . . . . . . . . . . . . . . . . . . . . . . . . . . . . . . . . . . . . . . . . . . . . . . . . . . —% 5%
128

NEWMONT MINING CORPORATION
NOTES TO CONSOLIDATED FINANCIAL STATEMENTS—(Continued)(dollars in millions, except per share, per ounce and per pound amounts)
The assumed health care cost trend rate to measure the expected cost of benefits was 9% for 2008, 8% for2009, 7% for 2010, 6% for 2011, 5% for 2012 and each year thereafter. Assumed health care cost trend rateshave a significant effect on amounts reported for the health care plans. A one-percentage-point change inassumed health care cost trend rates would have the following effects:
One-percentage-point Increase
One-percentage-point Decrease
Effect on total of service and interest cost components of netperiodic postretirement health care benefit cost . . . . . . . . . . . . . . $1 $(1)
Effect on the health care component of the accumulatedpostretirement benefit obligation . . . . . . . . . . . . . . . . . . . . . . . . . . $9 $(7)
Cash Flows
Benefit payments expected to be paid to plan participants are as follows:
Pension Benefits Other Benefit Plans
2008 . . . . . . . . . . . . . . . . . . . . . . . . . . . . . . . . . . . . . . . . . . . . . . . . . . . $ 25 $ 32009 . . . . . . . . . . . . . . . . . . . . . . . . . . . . . . . . . . . . . . . . . . . . . . . . . . . 22 32010 . . . . . . . . . . . . . . . . . . . . . . . . . . . . . . . . . . . . . . . . . . . . . . . . . . . 24 32011 . . . . . . . . . . . . . . . . . . . . . . . . . . . . . . . . . . . . . . . . . . . . . . . . . . . 22 42012 . . . . . . . . . . . . . . . . . . . . . . . . . . . . . . . . . . . . . . . . . . . . . . . . . . . 32 42013 through 2017 . . . . . . . . . . . . . . . . . . . . . . . . . . . . . . . . . . . . . . . . 162 23
$287 $40
Savings Plans
The Company has two qualified defined contribution savings plans, one that covers salaried and non-unionhourly employees and one that covers substantially all hourly union employees. In addition, the Company hasone non-qualified supplemental savings plan for salaried employees whose benefits under the qualified plan arelimited by federal regulations. When an employee meets eligibility requirements, the Company matches 100% ofemployee contributions of up to 6% and 5% of base salary for the salaried (including non-union hourlyemployees) and hourly plans, respectively. Matching contributions are made with Newmont stock; however, noholding restrictions are placed on such contributions, which totaled $13 in 2007, $11 in 2006 and $10 in 2005.
NOTE 22 STOCK BASED COMPENSATION
Employee Stock Options
The Company has a Stock Incentive Plan (“Stock Plan”) for executives and eligible employees. Under thisStock Plan, options to purchase shares of stock can be granted with exercise prices not less than fair market valueof the underlying stock at the date of grant. Fair market value of a share of common stock as of the grant date isthe average of the high and low sales prices for a share of the Company’s common stock on the New York StockExchange. The Company also maintains prior stock plans, but no longer grants awards under these plans. Optionsgranted under the Company’s stock plans vest over periods ranging from two to four years and are exercisableover a period of time not to exceed 10 years from grant date. As of December 31, 2007, 15,345,532 shares wereavailable for future grants under the Stock Plan. During 2007, 2006 and 2005, 1,066,500, 1,238,750 and2,002,638 stock option awards were granted, respectively.
129
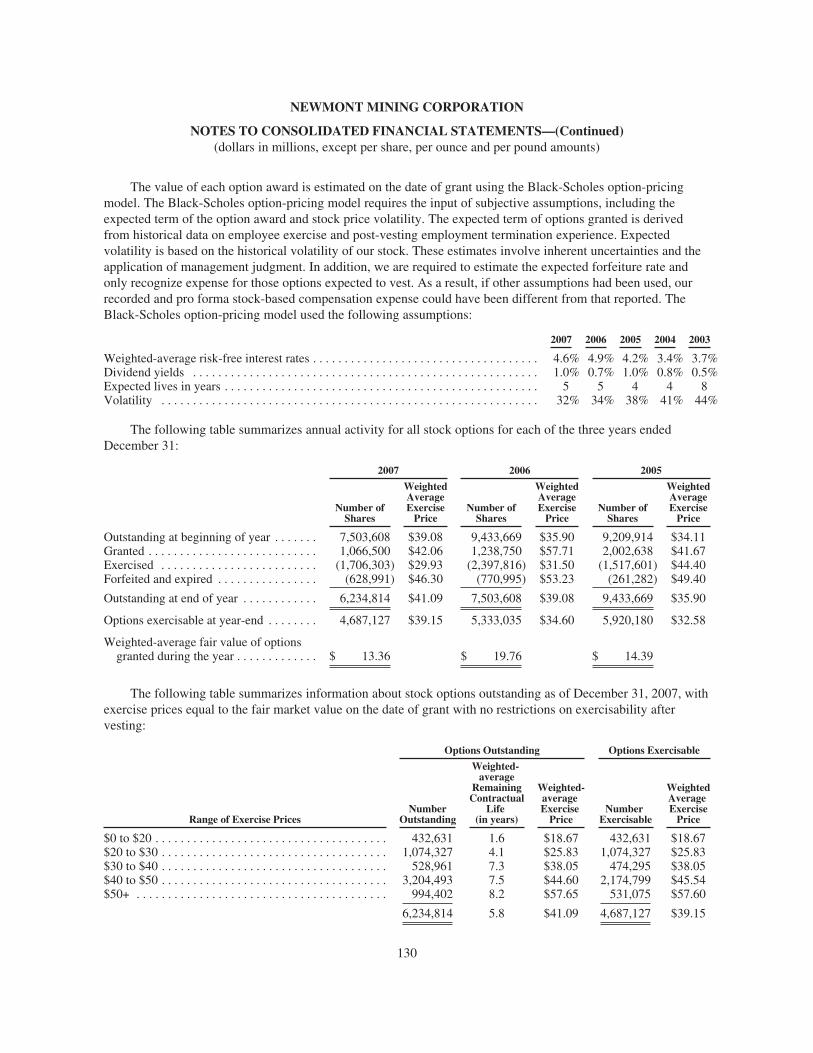
NEWMONT MINING CORPORATION
NOTES TO CONSOLIDATED FINANCIAL STATEMENTS—(Continued)(dollars in millions, except per share, per ounce and per pound amounts)
The value of each option award is estimated on the date of grant using the Black-Scholes option-pricingmodel. The Black-Scholes option-pricing model requires the input of subjective assumptions, including theexpected term of the option award and stock price volatility. The expected term of options granted is derivedfrom historical data on employee exercise and post-vesting employment termination experience. Expectedvolatility is based on the historical volatility of our stock. These estimates involve inherent uncertainties and theapplication of management judgment. In addition, we are required to estimate the expected forfeiture rate andonly recognize expense for those options expected to vest. As a result, if other assumptions had been used, ourrecorded and pro forma stock-based compensation expense could have been different from that reported. TheBlack-Scholes option-pricing model used the following assumptions:
2007 2006 2005 2004 2003
Weighted-average risk-free interest rates . . . . . . . . . . . . . . . . . . . . . . . . . . . . . . . . . . . . 4.6% 4.9% 4.2% 3.4% 3.7%Dividend yields . . . . . . . . . . . . . . . . . . . . . . . . . . . . . . . . . . . . . . . . . . . . . . . . . . . . . . . 1.0% 0.7% 1.0% 0.8% 0.5%Expected lives in years . . . . . . . . . . . . . . . . . . . . . . . . . . . . . . . . . . . . . . . . . . . . . . . . . . 5 5 4 4 8Volatility . . . . . . . . . . . . . . . . . . . . . . . . . . . . . . . . . . . . . . . . . . . . . . . . . . . . . . . . . . . . 32% 34% 38% 41% 44%
The following table summarizes annual activity for all stock options for each of the three years endedDecember 31:
2007 2006 2005
Number ofShares
WeightedAverageExercise
PriceNumber of
Shares
WeightedAverageExercise
PriceNumber of
Shares
WeightedAverageExercise
Price
Outstanding at beginning of year . . . . . . . 7,503,608 $39.08 9,433,669 $35.90 9,209,914 $34.11Granted . . . . . . . . . . . . . . . . . . . . . . . . . . . 1,066,500 $42.06 1,238,750 $57.71 2,002,638 $41.67Exercised . . . . . . . . . . . . . . . . . . . . . . . . . (1,706,303) $29.93 (2,397,816) $31.50 (1,517,601) $44.40Forfeited and expired . . . . . . . . . . . . . . . . (628,991) $46.30 (770,995) $53.23 (261,282) $49.40
Outstanding at end of year . . . . . . . . . . . . 6,234,814 $41.09 7,503,608 $39.08 9,433,669 $35.90
Options exercisable at year-end . . . . . . . . 4,687,127 $39.15 5,333,035 $34.60 5,920,180 $32.58
Weighted-average fair value of optionsgranted during the year . . . . . . . . . . . . . $ 13.36 $ 19.76 $ 14.39
The following table summarizes information about stock options outstanding as of December 31, 2007, withexercise prices equal to the fair market value on the date of grant with no restrictions on exercisability aftervesting:
Options Outstanding Options Exercisable
Range of Exercise PricesNumber
Outstanding
Weighted-average
RemainingContractual
Life(in years)
Weighted-averageExercise
PriceNumber
Exercisable
WeightedAverageExercise
Price
$0 to $20 . . . . . . . . . . . . . . . . . . . . . . . . . . . . . . . . . . . . . 432,631 1.6 $18.67 432,631 $18.67$20 to $30 . . . . . . . . . . . . . . . . . . . . . . . . . . . . . . . . . . . . 1,074,327 4.1 $25.83 1,074,327 $25.83$30 to $40 . . . . . . . . . . . . . . . . . . . . . . . . . . . . . . . . . . . . 528,961 7.3 $38.05 474,295 $38.05$40 to $50 . . . . . . . . . . . . . . . . . . . . . . . . . . . . . . . . . . . . 3,204,493 7.5 $44.60 2,174,799 $45.54$50+ . . . . . . . . . . . . . . . . . . . . . . . . . . . . . . . . . . . . . . . . 994,402 8.2 $57.65 531,075 $57.60
6,234,814 5.8 $41.09 4,687,127 $39.15
130

NEWMONT MINING CORPORATION
NOTES TO CONSOLIDATED FINANCIAL STATEMENTS—(Continued)(dollars in millions, except per share, per ounce and per pound amounts)
As of December 31, 2007, there was $19 of unrecognized compensation cost related to 1,547,687 unvestedstock options. This cost is expected to be recognized over a weighted-average period of approximately 1.7 years.The total intrinsic value of options exercised in 2007, 2006 and 2005 was $31, $54 and $25, respectively. Theaggregate intrinsic value of outstanding stock options was $58 at December 31, 2007. The aggregate intrinsicvalue of the exercisable options was $51.
The following stock options vested in each of the three years ended December 31:
2007 2006 2005
Stock options vested . . . . . . . . . . . . . . . . . . . . . . . . . . . . . . . . . . . . . . . . . . 1,447,26 2,175,307 2,147,485Weighted-average exercise price . . . . . . . . . . . . . . . . . . . . . . . . . . . . . . . . $ 46.92 $ 40.10 $ 38.55
The following table illustrates the effect on net income and earnings per share if we had applied the fairvalue recognition provisions of FAS 123(R) to options granted under our stock option plans in 2005:
Year EndedDecember 31, 2005
Net income, as reported . . . . . . . . . . . . . . . . . . . . . . . . . . . . . . . . . . . . . . . . . . . . . . . . . . . . . . . . . $ 322Less: Compensation expense determined under the fair value method, net of tax . . . . . . . . . . . . (19)
Pro forma net income . . . . . . . . . . . . . . . . . . . . . . . . . . . . . . . . . . . . . . . . . . . . . . . . . . . . . . . . . . $ 303
Net income per common share, basic:As reported . . . . . . . . . . . . . . . . . . . . . . . . . . . . . . . . . . . . . . . . . . . . . . . . . . . . . . . . . . . . . . $0.72Pro forma net income . . . . . . . . . . . . . . . . . . . . . . . . . . . . . . . . . . . . . . . . . . . . . . . . . . . . . . $0.68
Net income per common share, diluted:As reported . . . . . . . . . . . . . . . . . . . . . . . . . . . . . . . . . . . . . . . . . . . . . . . . . . . . . . . . . . . . . . $0.72Pro forma net income . . . . . . . . . . . . . . . . . . . . . . . . . . . . . . . . . . . . . . . . . . . . . . . . . . . . . . $0.68
Other Stock-Based Compensation
The Company grants restricted stock to certain employees upon achievement of certain financial andoperating thresholds at fair market value on the grant date. Prior to vesting, these shares of restricted stock aresubject to certain restrictions related to ownership and transferability. Holders of restricted stock are entitled tovote the shares and to receive any dividends declared on the shares. In 2007, 2006, and 2005, 175,114, 102,491,and 169,661 shares of restricted stock, respectively, were granted and issued, at the weighted-average fair marketvalue of $44, $58, and $45, respectively. As of December 31, 2007, 126,916, 32,891 and 29,599 shares remainedunvested for the 2007, 2006 and 2005 grants, respectively. The shares of restricted stock vest in three equalincrements over three years from the date of grant.
Restricted stock units are granted upon achievement of certain financial and operating thresholds toemployees in certain foreign jurisdictions. In 2007, 2006, and 2005 the Company granted 20,212, 19,181, and27,386 restricted stock units, respectively, at the weighted-average fair market value of $45, $58 and $45,respectively, per underlying share of the Company’s common stock. As of December 31, 2007, 5,493, 2,502 and1,494 shares remain unvested for the 2007, 2006 and 2005 grants, respectively. These restricted stock units vestin three equal increments over three years from the date of grant. Prior to vesting, holders of restricted stock unitsare not entitled to vote the underlying shares or receive dividends. Upon vesting, the employee is entitled toreceive for each restricted stock unit one share of the Company’s common stock and an amount equivalent toaccrued dividends.
131

NEWMONT MINING CORPORATION
NOTES TO CONSOLIDATED FINANCIAL STATEMENTS—(Continued)(dollars in millions, except per share, per ounce and per pound amounts)
The Company grants deferred stock awards to certain other employees. The deferred stock awards vest overperiods between two to three years. In 2007, 2006 and 2005, the Company granted deferred stock awards of365,776, 237,946, and 165,251 shares of the Company’s common stock, respectively, at weighted-average fairmarket values of $42, $58, and $41 per share, respectively. As of December 31, 2007, 342,934, 122,959 and16,662 shares remained unvested for the 2007, 2006 and 2005 awards, respectively. Prior to vesting, holders ofdeferred stock are not entitled to vote the underlying shares or receive dividends. Upon vesting, the employee isentitled to receive the number of shares of the Company’s common stock specified in the deferred stock award.
In 2007, 474,612 other stock based compensation awards vested. The total fair value of other stock-basedcompensation awards that vested in 2007, 2006 and 2005 was $21, $20 and $15, respectively.
At December 31, 2007, there was $21 of unrecognized compensation costs related to the unvested otherstock-based compensation awards.
The Company recognized stock options and other stock based compensation as follows:
Year Ended December 31,
2007 2006 2005
Stock options . . . . . . . . . . . . . . . . . . . . . . . . . . . . . . . . . . . . . . . . . . . . . . . . . . . . . . . . . . . . . . . . $17 $29 $—Restricted stock . . . . . . . . . . . . . . . . . . . . . . . . . . . . . . . . . . . . . . . . . . . . . . . . . . . . . . . . . . . . . . 4 — 9Restricted stock units . . . . . . . . . . . . . . . . . . . . . . . . . . . . . . . . . . . . . . . . . . . . . . . . . . . . . . . . . 1 — 1Deferred stock awards . . . . . . . . . . . . . . . . . . . . . . . . . . . . . . . . . . . . . . . . . . . . . . . . . . . . . . . . . 9 8 5
$31 $37 $15
NOTE 23 OTHER LIABILITIES
At December 31,
2007 2006
Other current liabilities:Accrued capital expenditures . . . . . . . . . . . . . . . . . . . . . . . . . . . . . . . . . . . . . . . . . . . . . . . . . . . $172 $128Accrued operating costs . . . . . . . . . . . . . . . . . . . . . . . . . . . . . . . . . . . . . . . . . . . . . . . . . . . . . . . 147 156Deferred income tax . . . . . . . . . . . . . . . . . . . . . . . . . . . . . . . . . . . . . . . . . . . . . . . . . . . . . . . . . 131 9Reclamation and remediation costs . . . . . . . . . . . . . . . . . . . . . . . . . . . . . . . . . . . . . . . . . . . . . . 71 77Interest . . . . . . . . . . . . . . . . . . . . . . . . . . . . . . . . . . . . . . . . . . . . . . . . . . . . . . . . . . . . . . . . . . . . 40 34Royalties . . . . . . . . . . . . . . . . . . . . . . . . . . . . . . . . . . . . . . . . . . . . . . . . . . . . . . . . . . . . . . . . . . 34 39Taxes other than income and mining . . . . . . . . . . . . . . . . . . . . . . . . . . . . . . . . . . . . . . . . . . . . . 23 18Deferred revenue . . . . . . . . . . . . . . . . . . . . . . . . . . . . . . . . . . . . . . . . . . . . . . . . . . . . . . . . . . . . 3 9Other . . . . . . . . . . . . . . . . . . . . . . . . . . . . . . . . . . . . . . . . . . . . . . . . . . . . . . . . . . . . . . . . . . . . . 41 45
$662 $515
At December 31,
2007 2006
Other long-term liabilities:Income taxes (Note 32) . . . . . . . . . . . . . . . . . . . . . . . . . . . . . . . . . . . . . . . . . . . . . . . . . . . . . . . $113 $ 54Deferred revenue from the sale of future product . . . . . . . . . . . . . . . . . . . . . . . . . . . . . . . . . . . — 47Derivative instruments . . . . . . . . . . . . . . . . . . . . . . . . . . . . . . . . . . . . . . . . . . . . . . . . . . . . . . . . 3 —Other . . . . . . . . . . . . . . . . . . . . . . . . . . . . . . . . . . . . . . . . . . . . . . . . . . . . . . . . . . . . . . . . . . . . . 34 34
$150 $135
132

NEWMONT MINING CORPORATION
NOTES TO CONSOLIDATED FINANCIAL STATEMENTS—(Continued)(dollars in millions, except per share, per ounce and per pound amounts)
NOTE 24 RECLAMATION AND REMEDIATION (ASSET RETIREMENT OBLIGATIONS)
The Company’s mining and exploration activities are subject to various federal and state laws andregulations governing the protection of the environment. These laws and regulations are continually changingand are generally becoming more restrictive. The Company conducts its operations so as to protect the publichealth and environment and believes its operations are in compliance with applicable laws and regulations in allmaterial respects. The Company has made, and expects to make in the future, expenditures to comply with suchlaws and regulations, but cannot predict the full amount of such future expenditures. Estimated futurereclamation costs are based principally on legal and regulatory requirements.
As of December 31, 2007 and 2006, $569 and $513, respectively, were accrued for reclamation obligationsrelating to currently or recently producing mineral properties. In addition, the Company is involved in severalmatters concerning environmental obligations associated with former, primarily historic, mining activities.Generally, these matters concern developing and implementing remediation plans at the various sites involved.As of December 31, 2007 and 2006, $125 and $85, respectively, were accrued for such obligations. Theseamounts are also included in Reclamation and remediation liabilities.
The following is a reconciliation of the total liability for reclamation and remediation:
Balance January 1, 2006 . . . . . . . . . . . . . . . . . . . . . . . . . . . . . . . . . . . . . . . . . . . . . . . . . . . . . . . . $499Additions, change in estimates and other . . . . . . . . . . . . . . . . . . . . . . . . . . . . . . . . . . . . . . . 122Liabilities settled . . . . . . . . . . . . . . . . . . . . . . . . . . . . . . . . . . . . . . . . . . . . . . . . . . . . . . . . . . (60)Acquisition/Disposition of liability, net . . . . . . . . . . . . . . . . . . . . . . . . . . . . . . . . . . . . . . . . 7Accretion expense . . . . . . . . . . . . . . . . . . . . . . . . . . . . . . . . . . . . . . . . . . . . . . . . . . . . . . . . . 30
Balance December 31, 2006 . . . . . . . . . . . . . . . . . . . . . . . . . . . . . . . . . . . . . . . . . . . . . . . . . . . . . 598Additions, change in estimates and other . . . . . . . . . . . . . . . . . . . . . . . . . . . . . . . . . . . . . . . 95Liabilities settled . . . . . . . . . . . . . . . . . . . . . . . . . . . . . . . . . . . . . . . . . . . . . . . . . . . . . . . . . . (54)Acquisition/Disposition of liability, net . . . . . . . . . . . . . . . . . . . . . . . . . . . . . . . . . . . . . . . . 18Accretion expense . . . . . . . . . . . . . . . . . . . . . . . . . . . . . . . . . . . . . . . . . . . . . . . . . . . . . . . . . 37
Balance December 31, 2007 . . . . . . . . . . . . . . . . . . . . . . . . . . . . . . . . . . . . . . . . . . . . . . . . . . . . . $694
The current portions of Reclamation and remediation liabilities of $71 and $77 as of December 31, 2007and 2006, respectively, are included in Other current liabilities.
The Company recorded $29, $47 and $38 of reclamation and remediation expense for 2007, 2006 and 2005,respectively, for properties associated with former mining activities (see Note 6).
Additions to reclamation in 2007 of $95 include additions from a former mining operation, Resurrection, of$24 primarily due to assumption of liabilities to settle litigation for water treatment costs related to remedialactivities in exchange for future compensation, additions to Batu Hijau of $22 primarily due to increased wastedump reclamation areas due to mine expansion, additions to Ghana of $15, Nevada at the Phoenix mine of $12,and Yanacocha of $8, primarily due to increased disturbance area related to mine expansion, additions to aformer mining operation, Empire Mine, of $8 primarily due to an investigation that indicated a need foradditional reclamation work and other additions of $6 primarily related to mine expansion.
Additions to reclamation in 2006 of $122 include additions at Batu Hijau of $31 primarily due to increasedwaste dump reclamation areas due to mine expansion, additions at Yanacocha of $22 primarily due to mine
133

NEWMONT MINING CORPORATION
NOTES TO CONSOLIDATED FINANCIAL STATEMENTS—(Continued)(dollars in millions, except per share, per ounce and per pound amounts)
expansion and post closure water management activities, additions at Nevada of $39 primarily due to changes inmine plans and additional waste dump reclamation areas, additions at Australia of $7 primarily related to watermanagement and other additions of $23 primarily related to mine expansion.
NOTE 25 ACCUMULATED OTHER COMPREHENSIVE INCOME
At December 31,
2007 2006
Unrealized gain on marketable equity securities, net of $161 and $142 tax expense,respectively . . . . . . . . . . . . . . . . . . . . . . . . . . . . . . . . . . . . . . . . . . . . . . . . . . . . . . . . . $791 $678
Foreign currency translation adjustments . . . . . . . . . . . . . . . . . . . . . . . . . . . . . . . . . . . . 181 43Pension liability adjustments, net of $32 and $44 tax benefit, respectively . . . . . . . . . . (59) (80)Other post-retirement benefit adjustments, net of $12 and $6 tax expense,
respectively . . . . . . . . . . . . . . . . . . . . . . . . . . . . . . . . . . . . . . . . . . . . . . . . . . . . . . . . . 23 11Changes in fair value of cash flow hedge instruments, net of tax and minority interests
of $9 and $13, respectively . . . . . . . . . . . . . . . . . . . . . . . . . . . . . . . . . . . . . . . . . . . . . 21 21
$957 $673
NOTE 26 RELATED PARTY TRANSACTIONS
Newmont had transactions with EGR, AGR and Finorafa, a subsidiary of EGR, as follows:
Years Ended December 31,
2007 2006 2005
Gold and silver sales:Finorafa . . . . . . . . . . . . . . . . . . . . . . . . . . . . . . . . . . . . . . . . . . . . . . . . . . . . $135 $66 $—AGR . . . . . . . . . . . . . . . . . . . . . . . . . . . . . . . . . . . . . . . . . . . . . . . . . . . . . . . $ 9 $— $—
Refining fees paid:EGR . . . . . . . . . . . . . . . . . . . . . . . . . . . . . . . . . . . . . . . . . . . . . . . . . . . . . . . $ 2 $ 3 $ 3AGR . . . . . . . . . . . . . . . . . . . . . . . . . . . . . . . . . . . . . . . . . . . . . . . . . . . . . . . $ 2 $ 1 $ 1
See Note 10 for a discussion of Newmont’s investment in EGR and AGR.
NOTE 27 NET CHANGE IN OPERATING ASSETS AND LIABILITIES
Net cash (used in) provided from operating activities attributable to the net change in operating assets andliabilities is composed of the following:
Years Ended December 31,
2007 2006 2005
Decrease (increase) in operating assets:Trade and accounts receivable . . . . . . . . . . . . . . . . . . . . . . . . . . . . . $ 17 $(110) $ (62)Inventories, stockpiles and ore on leach pads . . . . . . . . . . . . . . . . . . (95) (382) (178)Other assets . . . . . . . . . . . . . . . . . . . . . . . . . . . . . . . . . . . . . . . . . . . . 6 (25) (29)
(Decrease) increase in operating liabilitiesAccounts payable and other accrued liabilities . . . . . . . . . . . . . . . . (629) 230 94Reclamation liabilities . . . . . . . . . . . . . . . . . . . . . . . . . . . . . . . . . . . (54) (60) (48)
$(755) $(347) $(223)
134
NEWMONT MINING CORPORATION
NOTES TO CONSOLIDATED FINANCIAL STATEMENTS—(Continued)(dollars in millions, except per share, per ounce and per pound amounts)
The decrease in accounts payable and other accrued liabilities in 2007 includes $276 from the settlement ofpre-acquisition Australian income taxes of Normandy and $174 from the final settlement of copper collarcontracts.
NOTE 28 SUPPLEMENTAL CASH FLOW INFORMATION
Years Ended December 31,
2007 2006 2005
Income taxes, net of refunds . . . . . . . . . . . . . . . . . . . . . . . . . . . . . . . . . . . . . . . $324 $403 $292Interest, net of amounts capitalized . . . . . . . . . . . . . . . . . . . . . . . . . . . . . . . . . $ 88 $ 96 $ 84
Noncash Investing Activities and Financing Activities
In March 2007, the Company completed an agreement with Oxiana Resources (“Oxiana”) and AgincourtResources (“Agincourt”) in connection with Oxiana’s offer to acquire Agincourt. The transaction followed theCompany’s sale in 2006 of the Martabe project to Agincourt in exchange for Agincourt shares, and as a result,the Company received Oxiana shares classified as marketable equity securities valued at $64 in return for its43 million Agincourt shares classified as marketable equity securities.
In December 2007, the Company sold its royalty portfolio for total cash consideration of $1,197 less $21 inexpenses of which $11 is expected to be paid in 2008. Newmont also sold its Pajingo operation for totalconsideration of $23 which includes $10 received in cash in 2007, $4 received in shares of HeemskirkConsolidated Ltd, classified as marketable equity securities (see Note 11), and $4 cash and $5 in HeemskirkConsolidated Ltd shares to be received in 2008 which is recorded in Accounts receivable.
In 2007, Minera Yanacocha entered into mining equipment leases that resulted in non-cash increases toProperty, plant and mine development, net and Long-term debt of $28.
In 2006 and 2005, the Company delivered 161,111 ounces of gold in connection with the prepaid forwardsales obligation, resulting in a noncash reduction in debt of $48 each year.
NOTE 29 OPERATING LEASE COMMITMENTS
The Company leases certain assets, such as equipment and facilities, under operating leases expiring atvarious dates through 2017. Future minimum annual lease payments are $5 in 2008, $4 in 2009, $5 in 2010 and2011, $2 in 2012 and $10 thereafter, totaling $31. Rent expense for 2007, 2006 and 2005 was $21, $17 and $12,respectively.
NOTE 30 SEGMENT AND RELATED INFORMATION
Newmont predominantly operates in a single industry, namely exploration for and production of gold.Newmont’s major operations include Nevada, Yanacocha, Australia/New Zealand, Batu Hijau and Africa.Newmont also has an Exploration Segment.
The Exploration Segment is responsible for all activities, regardless of location, associated with theCompany’s efforts to discover new mineralized material that will advance into proven and probable reserves.
135

NEWMONT MINING CORPORATION
NOTES TO CONSOLIDATED FINANCIAL STATEMENTS—(Continued)(dollars in millions, except per share, per ounce and per pound amounts)
The Company identifies its reportable segments as those consolidated mining operations or functionalgroups that represent more than 10% of the combined revenue, profit or loss or total assets of all reportedoperating segments. Consolidated mining operations or functional groups not meeting this threshold areaggregated at the applicable geographic or corporate level for segment reporting purposes. Earnings fromoperations do not reflect general corporate expenses, interest (except project-specific interest) or income taxes(except for equity investments). Intercompany revenue and expense amounts have been eliminated within eachsegment in order to report on the basis that management uses internally for evaluating segment performance.
During 2007, Newmont made certain reclassifications in its segment reporting presentation for 2006 and2005 to conform to changes in presentation reflected in internal management reporting and the discontinuation ofthe Merchant Banking Segment. The presentation of Newmont’s segments for 2007, 2006 and 2005 incorporatesthe following:
• The Other Operations reportable segment includes the Golden Giant, La Herradura, and Kori Kollo goldoperations.
• The Golden Grove copper operation, the Merchant Banking Segment and the Pajingo, Zarafshan,Holloway and Golden Grove gold operations have been reclassified to discontinued operations for allperiods presented.
• World Gold Council dues, which were previously reported in General and administrative have beenreclassified to Other expense, net for all periods presented.
Nevada Yanacocha
Australia/New
ZealandBatuHijau Africa
OtherOperations
Year Ended December 31, 2007Sales, net:
Gold . . . . . . . . . . . . . . . . . . . . . . . . . . . . . . . . . . $1,616 $1,093 $809 $ 351 $306 $129Copper . . . . . . . . . . . . . . . . . . . . . . . . . . . . . . . . $ — $ — $ — $1,221 $ — $ —
Cost applicable to sales:Gold . . . . . . . . . . . . . . . . . . . . . . . . . . . . . . . . . . $1,036 $ 540 $573 $ 120 $177 $ 61Copper . . . . . . . . . . . . . . . . . . . . . . . . . . . . . . . . $ — $ — $ — $ 471 $ — $ —
Loss on settlement of price-capped forward salescontracts . . . . . . . . . . . . . . . . . . . . . . . . . . . . . . . . . $ — $ — $ — $ — $ — $ —
Midas redevelopment . . . . . . . . . . . . . . . . . . . . . . . . $ 11 $ — $ — $ — $ — $ —Depreciation, depletion and amortization:
Gold . . . . . . . . . . . . . . . . . . . . . . . . . . . . . . . . . . $ 220 $ 160 $109 $ 25 $ 43 $ 17Copper . . . . . . . . . . . . . . . . . . . . . . . . . . . . . . . . $ — $ — $ — $ 96 $ — $ —Other . . . . . . . . . . . . . . . . . . . . . . . . . . . . . . . . . $ — $ — $ 3 $ — $ — $ —
Exploration . . . . . . . . . . . . . . . . . . . . . . . . . . . . . . . . $ — $ — $ — $ — $ — $ —Advanced projects, research and development . . . . . $ 7 $ 9 $ 6 $ — $ 15 $ —Write-down of goodwill . . . . . . . . . . . . . . . . . . . . . . $ — $ — $ — $ — $ — $ —Write-down of investments . . . . . . . . . . . . . . . . . . . . $ — $ — $ — $ — $ — $ —Write-down of long-lived and other assets . . . . . . . . $ — $ 2 $ 2 $ — $ — $ —Other income . . . . . . . . . . . . . . . . . . . . . . . . . . . . . . . $ 10 $ 16 $ (8) $ 9 $ 4 $ 7Interest expense, net . . . . . . . . . . . . . . . . . . . . . . . . . $ — $ 3 $ — $ 37 $ 1 $ 1Pre-tax income (loss) before minority interest and
equity income of affiliates . . . . . . . . . . . . . . . . . . . $ 325 $ 363 $ 81 $ 829 $ 73 $ 65Equity (loss) income of affiliates . . . . . . . . . . . . . . . $ — $ — $ (7) $ — $ — $ —Capital expenditures . . . . . . . . . . . . . . . . . . . . . . . . . $ 588 $ 253 $597 $ 74 $134 $ 13
136

NEWMONT MINING CORPORATION
NOTES TO CONSOLIDATED FINANCIAL STATEMENTS—(Continued)(dollars in millions, except per share, per ounce and per pound amounts)
TotalOperations Exploration
Corporateand Other Consolidated
Year Ended December 31, 2007Sales, net:
Gold . . . . . . . . . . . . . . . . . . . . . . . . . . . . . . . . . . . . . . . . . . . $4,304 $ — $ 1 $4,305Copper . . . . . . . . . . . . . . . . . . . . . . . . . . . . . . . . . . . . . . . . . $1,221 $ — $ — $1,221
Cost applicable to sales:Gold . . . . . . . . . . . . . . . . . . . . . . . . . . . . . . . . . . . . . . . . . . . $2,507 $ — $ — $2,507Copper . . . . . . . . . . . . . . . . . . . . . . . . . . . . . . . . . . . . . . . . . $ 471 $ — $ — $ 471
Loss on settlement of price-capped forward sales contracts . . . . $ — $ — $ 531 $ 531Midas redevelopment . . . . . . . . . . . . . . . . . . . . . . . . . . . . . . . . . $ 11 $ — $ — $ 11Depreciation, depletion and amortization:
Gold . . . . . . . . . . . . . . . . . . . . . . . . . . . . . . . . . . . . . . . . . . . $ 574 $ — $ — $ 574Copper . . . . . . . . . . . . . . . . . . . . . . . . . . . . . . . . . . . . . . . . . $ 96 $ — $ — $ 96Other . . . . . . . . . . . . . . . . . . . . . . . . . . . . . . . . . . . . . . . . . . $ 3 $ 1 $ 21 $ 25
Exploration . . . . . . . . . . . . . . . . . . . . . . . . . . . . . . . . . . . . . . . . . $ — $ 177 $ — $ 177Advanced projects, research and development . . . . . . . . . . . . . . $ 37 $ — $ 25 $ 62Write-down of goodwill . . . . . . . . . . . . . . . . . . . . . . . . . . . . . . . $ — $ 1,122 $ — $1,122Write-down of investments . . . . . . . . . . . . . . . . . . . . . . . . . . . . . $ — $ — $ 46 $ 46Write-down of long-lived and other assets . . . . . . . . . . . . . . . . . $ 4 $ — $ — $ 4Other income . . . . . . . . . . . . . . . . . . . . . . . . . . . . . . . . . . . . . . . . $ 38 $ 2 $ 104 $ 144Interest expense, net . . . . . . . . . . . . . . . . . . . . . . . . . . . . . . . . . . $ 42 $ — $ 63 $ 105Pre-tax income (loss) before minority interest and equity
income of affiliates . . . . . . . . . . . . . . . . . . . . . . . . . . . . . . . . . $1,736 $(1,300) $(788) $ (352)Equity (loss) income of affiliates . . . . . . . . . . . . . . . . . . . . . . . . $ (7) $ — $ 6 $ (1)Capital expenditures . . . . . . . . . . . . . . . . . . . . . . . . . . . . . . . . . . $1,659 $ — $ 11 $1,670
Nevada Yanacocha
Australia/New
ZealandBatuHijau Africa
OtherOperations
Year Ended December 31, 2006Sales, net:
Gold . . . . . . . . . . . . . . . . . . . . . . . . . . . . . . . . . . . $1,441 $1,543 $709 $264 $124 $160Copper . . . . . . . . . . . . . . . . . . . . . . . . . . . . . . . . . $ — $ — $ — $671 $ — $ —
Cost applicable to sales:Gold . . . . . . . . . . . . . . . . . . . . . . . . . . . . . . . . . . . $ 980 $ 498 $458 $ 91 $ 60 $ 59Copper . . . . . . . . . . . . . . . . . . . . . . . . . . . . . . . . . $ — $ — $ — $308 $ — $ —
Depreciation, depletion and amortization:Gold . . . . . . . . . . . . . . . . . . . . . . . . . . . . . . . . . . . $ 180 $ 172 $ 91 $ 20 $ 19 $ 18Copper . . . . . . . . . . . . . . . . . . . . . . . . . . . . . . . . . $ — $ — $ — $ 66 $ — $ —Other . . . . . . . . . . . . . . . . . . . . . . . . . . . . . . . . . . . $ — $ — $ 3 $ — $ — $ 1
Exploration . . . . . . . . . . . . . . . . . . . . . . . . . . . . . . . . . . $ — $ — $ — $ — $ — $ —Advanced projects, research and development . . . . . . $ 10 $ 6 $ 2 $ 2 $ 28 $ 1Write-down of long-lived assets . . . . . . . . . . . . . . . . . . $ — $ 2 $ — $ — $ — $ —Other income . . . . . . . . . . . . . . . . . . . . . . . . . . . . . . . . $ 22 $ 19 $ 7 $ (45) $ 1 $ 46Interest expense, net . . . . . . . . . . . . . . . . . . . . . . . . . . . $ — $ 12 $ — $ 44 $ (1) $ 1Pre-tax income (loss) before minority interest and
equity income of affiliates . . . . . . . . . . . . . . . . . . . . $ 270 $ 808 $135 $357 $ 19 $105Equity income of affiliates . . . . . . . . . . . . . . . . . . . . . . $ — $ — $ (1) $ — $ — $ —Capital expenditures . . . . . . . . . . . . . . . . . . . . . . . . . . . $ 705 $ 269 $192 $106 $234 $ 11
137

NEWMONT MINING CORPORATION
NOTES TO CONSOLIDATED FINANCIAL STATEMENTS—(Continued)(dollars in millions, except per share, per ounce and per pound amounts)
TotalOperations Exploration
Corporateand Other Consolidated
Year Ended December 31, 2006Sales, net:
Gold . . . . . . . . . . . . . . . . . . . . . . . . . . . . . . . . . . . . . . . . . . . $4,241 $ — $ (30) $4,211Copper . . . . . . . . . . . . . . . . . . . . . . . . . . . . . . . . . . . . . . . . . $ 671 $ — $ — $ 671
Cost applicable to sales:Gold . . . . . . . . . . . . . . . . . . . . . . . . . . . . . . . . . . . . . . . . . . . $2,146 $ — $ — $2,146Copper . . . . . . . . . . . . . . . . . . . . . . . . . . . . . . . . . . . . . . . . . $ 308 $ — $ — $ 308
Depreciation, depletion and amortization:Gold . . . . . . . . . . . . . . . . . . . . . . . . . . . . . . . . . . . . . . . . . . . $ 500 $ — $ — $ 500Copper . . . . . . . . . . . . . . . . . . . . . . . . . . . . . . . . . . . . . . . . . $ 66 $ — $ — $ 66Other . . . . . . . . . . . . . . . . . . . . . . . . . . . . . . . . . . . . . . . . . . $ 4 $ 3 $ 16 $ 23
Exploration . . . . . . . . . . . . . . . . . . . . . . . . . . . . . . . . . . . . . . . . . $ — $ 166 $ — $ 166Advanced projects, research and development . . . . . . . . . . . . . . $ 49 $ — $ 32 $ 81Write-down of long-lived assets . . . . . . . . . . . . . . . . . . . . . . . . . $ 2 $ — $ 1 $ 3Other income . . . . . . . . . . . . . . . . . . . . . . . . . . . . . . . . . . . . . . . . $ 50 $ 6 $ (3) $ 53Interest expense, net . . . . . . . . . . . . . . . . . . . . . . . . . . . . . . . . . . $ 56 $ — $ 41 $ 97Pre-tax income (loss) before minority interest and equity
income of affiliates . . . . . . . . . . . . . . . . . . . . . . . . . . . . . . . . . $1,694 $(164) $(280) $1,250Equity income of affiliates . . . . . . . . . . . . . . . . . . . . . . . . . . . . . $ (1) $ — $ 3 $ 2Capital expenditures . . . . . . . . . . . . . . . . . . . . . . . . . . . . . . . . . . $1,517 $ — $ 20 $1,537
Nevada Yanacocha
Australia/New
ZealandBatuHijau Africa
OtherOperations
Year Ended December 31, 2005Sales, net:
Gold . . . . . . . . . . . . . . . . . . . . . . . . . . . . . . . . . . . $1,053 $1,490 $631 $318 $ — $153Copper . . . . . . . . . . . . . . . . . . . . . . . . . . . . . . . . . $ — $ — $ — $672 $ — $ —
Cost applicable to sales:Gold . . . . . . . . . . . . . . . . . . . . . . . . . . . . . . . . . . . $ 807 $ 487 $450 $109 $ — $ 79Copper . . . . . . . . . . . . . . . . . . . . . . . . . . . . . . . . . $ — $ — $ — $303 $ — $ —
Depreciation, depletion and amortization:Gold . . . . . . . . . . . . . . . . . . . . . . . . . . . . . . . . . . . $ 124 $ 205 $ 93 $ 34 $ — $ 20Copper . . . . . . . . . . . . . . . . . . . . . . . . . . . . . . . . . $ — $ — $ — $ 87 $ — $ —Other . . . . . . . . . . . . . . . . . . . . . . . . . . . . . . . . . . . $ — $ — $ 3 $ — $ 1 $ 2
Exploration . . . . . . . . . . . . . . . . . . . . . . . . . . . . . . . . . . $ — $ — $ — $ — $ — $ —Advanced projects, research and development . . . . . . $ — $ 8 $ — $ 2 $ 20 $ 7Write-down of goodwill . . . . . . . . . . . . . . . . . . . . . . . . $ 41 $ — $ — $ — $ — $ —Write-down of long-lived assets . . . . . . . . . . . . . . . . . . $ — $ — $ 2 $ — $ — $ 38Other income . . . . . . . . . . . . . . . . . . . . . . . . . . . . . . . . $ 8 $ 9 $ 7 $ 7 $ — $ 6Interest expense, net . . . . . . . . . . . . . . . . . . . . . . . . . . . $ — $ 1 $ — $ 43 $ — $ —Pre-tax income (loss) before minority interest and
equity income of affiliates . . . . . . . . . . . . . . . . . . . . $ 61 $ 799 $ 76 $419 $ (21) $ 7Equity income of affiliates . . . . . . . . . . . . . . . . . . . . . . $ — $ — $ (2) $ — $ — $ —Capital expenditures . . . . . . . . . . . . . . . . . . . . . . . . . . . $ 479 $ 225 $ 86 $ 65 $276 $ 24
138

NEWMONT MINING CORPORATION
NOTES TO CONSOLIDATED FINANCIAL STATEMENTS—(Continued)(dollars in millions, except per share, per ounce and per pound amounts)
TotalOperations Exploration
Corporateand Other Consolidated
Year Ended December 31, 2005Sales, net:
Gold . . . . . . . . . . . . . . . . . . . . . . . . . . . . . . . . . . . . . . . . . . . $3,645 $ — $ (52) $3,593Copper . . . . . . . . . . . . . . . . . . . . . . . . . . . . . . . . . . . . . . . . . $ 672 $ — $ — $ 672
Cost applicable to sales:Gold . . . . . . . . . . . . . . . . . . . . . . . . . . . . . . . . . . . . . . . . . . . $1,932 $ — $ — $1,932Copper . . . . . . . . . . . . . . . . . . . . . . . . . . . . . . . . . . . . . . . . . $ 303 $ — $ — $ 303
Depreciation, depletion and amortization:Gold . . . . . . . . . . . . . . . . . . . . . . . . . . . . . . . . . . . . . . . . . . . $ 476 $ — $ — $ 476Copper . . . . . . . . . . . . . . . . . . . . . . . . . . . . . . . . . . . . . . . . . $ 87 $ — $ — $ 87Other . . . . . . . . . . . . . . . . . . . . . . . . . . . . . . . . . . . . . . . . . . $ 6 $ 4 $ 16 $ 26
Exploration . . . . . . . . . . . . . . . . . . . . . . . . . . . . . . . . . . . . . . . . . $ — $ 143 $ — $ 143Advanced projects, research and development . . . . . . . . . . . . . . $ 37 $ — $ 18 $ 55Write-down of goodwill . . . . . . . . . . . . . . . . . . . . . . . . . . . . . . . $ 41 $ — $ — $ 41Write-down of long-lived assets . . . . . . . . . . . . . . . . . . . . . . . . . $ 40 $ — $ 1 $ 41Other income . . . . . . . . . . . . . . . . . . . . . . . . . . . . . . . . . . . . . . . . $ 37 $ — $ 69 $ 106Interest expense, net . . . . . . . . . . . . . . . . . . . . . . . . . . . . . . . . . . $ 44 $ — $ 53 $ 97Pre-tax income (loss) before minority interest and equity
income of affiliates . . . . . . . . . . . . . . . . . . . . . . . . . . . . . . . . . $1,341 $(143) $(274) $ 924Equity income of affiliates . . . . . . . . . . . . . . . . . . . . . . . . . . . . . $ (2) $ — $ 6 $ 4Capital expenditures . . . . . . . . . . . . . . . . . . . . . . . . . . . . . . . . . . $1,155 $ — $ 49 $1,204
At December 31,
2007 2006
Goodwill:Australia/New Zealand . . . . . . . . . . . . . . . . . . . . . . . . . . . . . . . . . . . . . . . . . . . . . . . . . . . $ 186 $ 209Exploration . . . . . . . . . . . . . . . . . . . . . . . . . . . . . . . . . . . . . . . . . . . . . . . . . . . . . . . . . . . . — 1,129
$ 186 $ 1,338
Total assets:Nevada . . . . . . . . . . . . . . . . . . . . . . . . . . . . . . . . . . . . . . . . . . . . . . . . . . . . . . . . . . . . . . . . $ 3,104 $ 2,652Yanacocha . . . . . . . . . . . . . . . . . . . . . . . . . . . . . . . . . . . . . . . . . . . . . . . . . . . . . . . . . . . . . 1,908 1,842Australia/New Zealand . . . . . . . . . . . . . . . . . . . . . . . . . . . . . . . . . . . . . . . . . . . . . . . . . . . 1,876 1,347Batu Hijau . . . . . . . . . . . . . . . . . . . . . . . . . . . . . . . . . . . . . . . . . . . . . . . . . . . . . . . . . . . . . 2,471 2,441Africa . . . . . . . . . . . . . . . . . . . . . . . . . . . . . . . . . . . . . . . . . . . . . . . . . . . . . . . . . . . . . . . . . 1,082 964Hope Bay . . . . . . . . . . . . . . . . . . . . . . . . . . . . . . . . . . . . . . . . . . . . . . . . . . . . . . . . . . . . . . 1,566 —Other operations . . . . . . . . . . . . . . . . . . . . . . . . . . . . . . . . . . . . . . . . . . . . . . . . . . . . . . . . 157 163Exploration . . . . . . . . . . . . . . . . . . . . . . . . . . . . . . . . . . . . . . . . . . . . . . . . . . . . . . . . . . . . 24 1,150Corporate and other . . . . . . . . . . . . . . . . . . . . . . . . . . . . . . . . . . . . . . . . . . . . . . . . . . . . . . 3,386 3,050
Total assets from continuing operations . . . . . . . . . . . . . . . . . . . . . . . . . . . . . . . . . . 15,574 13,609Assets held for sale . . . . . . . . . . . . . . . . . . . . . . . . . . . . . . . . . . . . . . . . . . . . . . . . . . 24 1,992
$15,598 $15,601
139

NEWMONT MINING CORPORATION
NOTES TO CONSOLIDATED FINANCIAL STATEMENTS—(Continued)(dollars in millions, except per share, per ounce and per pound amounts)
Revenues from export and domestic sales were as follows:
Years Ended December 31,
2007 2006 2005
Europe . . . . . . . . . . . . . . . . . . . . . . . . . . . . . . . . . . . . . . . . . . . . . . . . . . . $3,837 $4,053 $3,378India . . . . . . . . . . . . . . . . . . . . . . . . . . . . . . . . . . . . . . . . . . . . . . . . . . . . . 101 76 277Indonesia . . . . . . . . . . . . . . . . . . . . . . . . . . . . . . . . . . . . . . . . . . . . . . . . . 512 85 96Japan . . . . . . . . . . . . . . . . . . . . . . . . . . . . . . . . . . . . . . . . . . . . . . . . . . . . . 562 355 267Korea . . . . . . . . . . . . . . . . . . . . . . . . . . . . . . . . . . . . . . . . . . . . . . . . . . . . 248 154 172Other . . . . . . . . . . . . . . . . . . . . . . . . . . . . . . . . . . . . . . . . . . . . . . . . . . . . . 266 159 75
$5,526 $4,882 $4,265
Long-lived assets, excluding deferred tax assets, in the United States and other countries are as follows:
At December 31,
2007 2006
United States(1) . . . . . . . . . . . . . . . . . . . . . . . . . . . . . . . . . . . . . . . . . . . . . . . . . . . $ 4,589 $ 6,578Australia . . . . . . . . . . . . . . . . . . . . . . . . . . . . . . . . . . . . . . . . . . . . . . . . . . . . . . . . 1,446 947Canada . . . . . . . . . . . . . . . . . . . . . . . . . . . . . . . . . . . . . . . . . . . . . . . . . . . . . . . . . . 1,513 357Indonesia . . . . . . . . . . . . . . . . . . . . . . . . . . . . . . . . . . . . . . . . . . . . . . . . . . . . . . . . 1,801 1,866Peru . . . . . . . . . . . . . . . . . . . . . . . . . . . . . . . . . . . . . . . . . . . . . . . . . . . . . . . . . . . . 1,355 1,227Ghana . . . . . . . . . . . . . . . . . . . . . . . . . . . . . . . . . . . . . . . . . . . . . . . . . . . . . . . . . . 974 1,021Other . . . . . . . . . . . . . . . . . . . . . . . . . . . . . . . . . . . . . . . . . . . . . . . . . . . . . . . . . . . 221 187
$11,899 $12,183
(1) Goodwill allocated to Exploration in 2006 (see Note 19) is global in nature and was allocated to the UnitedStates, the Company’s headquarters.
The Company is not economically dependent on a limited number of customers for the sale of its productbecause gold can be sold through numerous gold market traders worldwide. In 2007, 2006 and 2005, sales to onecustomer, Bank of Nova Scotia, totaled approximately $876 or 16% of total gold sales, approximately $894 or21% of total gold sales, and approximately $1,214 or 33% of total gold sales, respectively.
140
NEWMONT MINING CORPORATION
NOTES TO CONSOLIDATED FINANCIAL STATEMENTS—(Continued)(dollars in millions, except per share, per ounce and per pound amounts)
NOTE 31 CONSOLIDATING FINANCIAL STATEMENTS
The following Consolidating Financial Statements are presented to satisfy disclosure requirements of Rule 3-10(e)of Regulation S-X resulting from the inclusion of Newmont USA Limited (“Newmont USA”), a wholly-ownedsubsidiary of Newmont, as a co-registrant with Newmont on a shelf registration statement on Form S-3 filed under theSecurities Act of 1933 under which securities of Newmont (including debt securities which may be guaranteed byNewmont USA) may be issued from time to time (the “Shelf Registration Statement”). To the extent Newmont issuesdebt securities under the Shelf Registration Statement, it is expected that Newmont USA will provide a guarantee ofthat debt. In accordance with Rule 3-10(e) of Regulation S-X, Newmont USA, as the subsidiary guarantor, is 100%owned by Newmont, the guarantee will be full and unconditional, and it is not expected that any other subsidiary ofNewmont will guarantee any security issued under the Shelf Registration Statement. There are no significantrestrictions on the ability of Newmont USA to obtain funds from its subsidiaries by dividend or loan.
For the Year Ended December 31, 2007
Condensed Consolidating Statement of Income
NewmontMining
CorporationNewmont
USAOther
Subsidiaries Eliminations
NewmontMining
CorporationConsolidated
RevenuesSales - gold, net . . . . . . . . . . . . . . . . . . . . . . . . . . . . . . . . . . . . . . . . . . . $ — $3,181 $ 1,124 $ — $ 4,305Sales - copper, net . . . . . . . . . . . . . . . . . . . . . . . . . . . . . . . . . . . . . . . . . — 1,221 — — 1,221
— 4,402 1,124 — 5,526
Costs and expensesCosts applicable to sales (exclusive of loss on settlement of price-
capped forward sales contracts, Midas redevelopment anddepreciation, depletion and amortization shown separately below)
Gold . . . . . . . . . . . . . . . . . . . . . . . . . . . . . . . . . . . . . . . . . . . . . . . . — 1,756 769 (18) 2,507Copper . . . . . . . . . . . . . . . . . . . . . . . . . . . . . . . . . . . . . . . . . . . . . . — 471 — — 471
Loss on settlement of price-capped forward sales . . . . . . . . . . . . . . . . . — 531 — — 531Midas redevelopment . . . . . . . . . . . . . . . . . . . . . . . . . . . . . . . . . . . . . . . — 11 — — 11Depreciation, depletion and amortization . . . . . . . . . . . . . . . . . . . . . . . — 541 155 (1) 695Exploration . . . . . . . . . . . . . . . . . . . . . . . . . . . . . . . . . . . . . . . . . . . . . . . — 113 64 — 177Advanced projects, research and development . . . . . . . . . . . . . . . . . . . — 34 30 (2) 62General and administrative . . . . . . . . . . . . . . . . . . . . . . . . . . . . . . . . . . — 118 4 21 143Write-down of goodwill . . . . . . . . . . . . . . . . . . . . . . . . . . . . . . . . . . . . . — — 1,122 — 1,122Write-down of investments . . . . . . . . . . . . . . . . . . . . . . . . . . . . . . . . . . — — 46 — 46Write-down of long-lived and other assets . . . . . . . . . . . . . . . . . . . . . . — 1 3 — 4Other expense, net . . . . . . . . . . . . . . . . . . . . . . . . . . . . . . . . . . . . . . . . . — 129 19 — 148
— 3,705 2,212 — 5,917
Other income (expense)Other income (expense), net . . . . . . . . . . . . . . . . . . . . . . . . . . . . . . . . . 35 96 13 — 144Interest income - intercompany . . . . . . . . . . . . . . . . . . . . . . . . . . . . . . . 210 52 — (262) —Interest expense - intercompany . . . . . . . . . . . . . . . . . . . . . . . . . . . . . . (7) — (255) 262 —Interest expense, net . . . . . . . . . . . . . . . . . . . . . . . . . . . . . . . . . . . . . . . . (49 ) (44) (12) — (105)
189 104 (254) — 39
(Loss)Income from continuing operations before taxes, minority interestand equity (loss) income of affiliates . . . . . . . . . . . . . . . . . . . . . . . . . . . . . 189 801 (1,342) — (352)
Income tax (expense) benefit . . . . . . . . . . . . . . . . . . . . . . . . . . . . . . . . . . . . . (56) 38 (182) — (200)Minority interest in income of subsidiaries . . . . . . . . . . . . . . . . . . . . . . . . . . — (451) 321 (280) (410)Equity (loss) income of affiliates . . . . . . . . . . . . . . . . . . . . . . . . . . . . . . . . . . (1,096) 4 (236 ) 1,327 (1)
(Loss) income from continuing operations . . . . . . . . . . . . . . . . . . . . . . . . . . (963) 392 (1,439) 1,047 (963)(Loss) income from discontinued operations . . . . . . . . . . . . . . . . . . . . . . . . . (923) (124) (760 ) 884 (923)
Net (loss) income . . . . . . . . . . . . . . . . . . . . . . . . . . . . . . . . . . . . . . . . . . . . . . $(1,886) $ 268 $(2,199) $1,931 $(1,886)
141

NEWMONT MINING CORPORATION
NOTES TO CONSOLIDATED FINANCIAL STATEMENTS—(Continued)(dollars in millions, except per share, per ounce and per pound amounts)
For the Year Ended December 31, 2006
Condensed Consolidating Statement of Income
NewmontMining
CorporationNewmont
USAOther
Subsidiaries Eliminations
NewmontMining
CorporationConsolidated
RevenuesSales - gold, net . . . . . . . . . . . . . . . . . . . . . . . $ — $3,342 $ 869 $ — $4,211Sales - copper, net . . . . . . . . . . . . . . . . . . . . . — 671 — — 671
— 4,013 869 — 4,882
Costs and expensesCosts applicable to sales (exclusive of
depreciation, depletion and amortizationshown separately below)
Gold . . . . . . . . . . . . . . . . . . . . . . . . . . . . — 1,616 540 (10) 2,146Copper . . . . . . . . . . . . . . . . . . . . . . . . . . — 308 — — 308
Depreciation, depletion and amortization . . . — 475 114 — 589Exploration . . . . . . . . . . . . . . . . . . . . . . . . . . — 120 46 — 166Advanced projects, research and
development . . . . . . . . . . . . . . . . . . . . . . . — 44 36 1 81General and administrative . . . . . . . . . . . . . . — 125 3 8 136Write-down of long-lived assets . . . . . . . . . . — 3 — — 3Other expense . . . . . . . . . . . . . . . . . . . . . . . . 37 113 9 — 159
37 2,804 748 (1) 3,588
Other income (expense)Other income . . . . . . . . . . . . . . . . . . . . . . . . . 13 6 34 — 53Interest income - intercompany . . . . . . . . . . 121 79 — (200) —Interest expense - intercompany . . . . . . . . . . (7) — (193) 200 —Interest expense, net . . . . . . . . . . . . . . . . . . . (27) (62) (8) — (97)
100 23 (167) — (44)
Income (loss) from continuing operations beforetaxes, minority interest and equity income ofaffiliates . . . . . . . . . . . . . . . . . . . . . . . . . . . . . . . 63 1,232 (46) 1 1,250
Income tax (expense) benefit . . . . . . . . . . . . . . . . (54) (303) 31 — (326)Minority interest in income of subsidiaries . . . . . — (364) (17) 18 (363)Equity income (loss) of affiliates . . . . . . . . . . . . . 554 — 119 (671) 2
Income (loss) from continuing operations . . . . . . 563 565 87 (652) 563Income (loss) from discontinued operations . . . . . 228 (65) 208 (143) 228
Net income (loss) . . . . . . . . . . . . . . . . . . . . . . . . . $791 $ 500 $ 295 $(795) $ 791
142

NEWMONT MINING CORPORATION
NOTES TO CONSOLIDATED FINANCIAL STATEMENTS—(Continued)(dollars in millions, except per share, per ounce and per pound amounts)
For the Year Ended December 31, 2005
Condensed Consolidating Statement of Income
NewmontMining
CorporationNewmont
USAOther
Subsidiaries Eliminations
NewmontMining
CorporationConsolidated
RevenuesSales - gold, net . . . . . . . . . . . . . . . . . . . . . . . $ — $2,962 $ 631 $ — $3,593Sales - copper, net . . . . . . . . . . . . . . . . . . . . . — 672 — — 672
— 3,634 631 — 4,265
Costs and expensesCosts applicable to sales (exclusive of
depreciation, depletion and amortizationshown separately below)
Gold . . . . . . . . . . . . . . . . . . . . . . . . . . . . — 1,483 456 (7) 1,932Copper . . . . . . . . . . . . . . . . . . . . . . . . . . — 303 — — 303
Depreciation, depletion and amortization . . . — 489 100 — 589Exploration . . . . . . . . . . . . . . . . . . . . . . . . . . — 97 46 — 143Advanced projects, research and
development . . . . . . . . . . . . . . . . . . . . . . . — 25 28 2 55General and administrative . . . . . . . . . . . . . . — 110 6 4 120Write-down of goodwill . . . . . . . . . . . . . . . . — 41 — — 41Write-down of long-lived assets . . . . . . . . . . — — 41 — 41Other . . . . . . . . . . . . . . . . . . . . . . . . . . . . . . . — 116 10 — 126
— 2,664 687 (1) 3,350
Other income (expense)Other income . . . . . . . . . . . . . . . . . . . . . . . . . 11 63 32 — 106Interest income - intercompany . . . . . . . . . . 118 45 1 (164) —Interest expense - intercompany . . . . . . . . . . (7) — (157) 164 —Interest expense, net . . . . . . . . . . . . . . . . . . . (31) (58) (8) — (97)
91 50 (132) — 9
Income (loss) from continuing operations beforetaxes, minority interest and equity income ofaffiliates . . . . . . . . . . . . . . . . . . . . . . . . . . . . . . . 91 1,020 (188) 1 924
Income tax (expense) benefit . . . . . . . . . . . . . . . . (12) (380) 122 — (270)Minority interest in income of subsidiaries . . . . . — (384) (4) 8 (380)Equity income (loss) of affiliates . . . . . . . . . . . . . 199 — 66 (261) 4
Income (loss) from continuing operations . . . . . . 278 256 (4 ) (252) 278Income (loss) from discontinued operations . . . . . 44 9 34 (43) 44
Net income (loss) . . . . . . . . . . . . . . . . . . . . . . . . . $322 $ 265 $ 30 $(295) $ 322
143

NEWMONT MINING CORPORATION
NOTES TO CONSOLIDATED FINANCIAL STATEMENTS—(Continued)(dollars in millions, except per share, per ounce and per pound amounts)
At December 31, 2007
Condensed Consolidating Balance Sheets
NewmontMining
CorporationNewmont
USAOther
Subsidiaries Eliminations
NewmontMining
CorporationConsolidated
AssetsCash and cash equivalents . . . . . . . . . . . . . . . . . . . . . . . . $ — $ 790 $ 441 $ — $ 1,231Marketable securities and other short-term
investments . . . . . . . . . . . . . . . . . . . . . . . . . . . . . . . . . . — 3 58 — 61Trade receivables . . . . . . . . . . . . . . . . . . . . . . . . . . . . . . . — 174 3 — 177Accounts receivable . . . . . . . . . . . . . . . . . . . . . . . . . . . . . 1,407 1,730 405 (3,374) 168Inventories . . . . . . . . . . . . . . . . . . . . . . . . . . . . . . . . . . . . — 378 85 — 463Stockpiles and ore on leach pads . . . . . . . . . . . . . . . . . . . — 330 43 — 373Deferred income tax assets . . . . . . . . . . . . . . . . . . . . . . . — 89 23 — 112Other current assets . . . . . . . . . . . . . . . . . . . . . . . . . . . . . 1 51 35 — 87
Current assets . . . . . . . . . . . . . . . . . . . . . . . . . . . . . . 1,408 3,545 1,093 (3,374) 2,672Property, plant and mine development, net . . . . . . . . . . . — 5,189 3,971 (20) 9,140Investments . . . . . . . . . . . . . . . . . . . . . . . . . . . . . . . . . . . — 7 1,520 — 1,527Investments in subsidiaries . . . . . . . . . . . . . . . . . . . . . . . 4,299 22 772 (5,093) —Long-term stockpiles and ore on leach pads . . . . . . . . . . — 718 70 — 788Deferred income tax assets . . . . . . . . . . . . . . . . . . . . . . . 119 680 228 — 1,027Other long-term assets . . . . . . . . . . . . . . . . . . . . . . . . . . . 4,037 329 131 (4,263) 234Goodwill . . . . . . . . . . . . . . . . . . . . . . . . . . . . . . . . . . . . . . — — 186 — 186Assets of operations held for sale . . . . . . . . . . . . . . . . . . — 2 22 — 24
Total assets . . . . . . . . . . . . . . . . . . . . . . . . . . . . . . . . $9,863 $10,492 $ 7,993 $(12,750) $15,598
LiabilitiesCurrent portion of long-term debt . . . . . . . . . . . . . . . . . . $ — $ 135 $ 120 $ — $ 255Accounts payable . . . . . . . . . . . . . . . . . . . . . . . . . . . . . . . 456 1,795 1,459 (3,371) 339Employee-related benefits . . . . . . . . . . . . . . . . . . . . . . . . — 111 42 — 153Derivative instruments . . . . . . . . . . . . . . . . . . . . . . . . . . . — 1 2 — 3Income and mining taxes . . . . . . . . . . . . . . . . . . . . . . . . . 66 (49) 71 — 88Other current liabilities . . . . . . . . . . . . . . . . . . . . . . . . . . 20 301 347 (6) 662
Current liabilities . . . . . . . . . . . . . . . . . . . . . . . . . . . 542 2,294 2,041 (3,377) 1,500Long-term debt . . . . . . . . . . . . . . . . . . . . . . . . . . . . . . . . . 1,747 935 1 — 2,683Reclamation and remediation liabilities . . . . . . . . . . . . . . — 456 167 — 623Deferred income tax liabilities . . . . . . . . . . . . . . . . . . . . . 66 357 602 — 1,025Employee-related benefits . . . . . . . . . . . . . . . . . . . . . . . . 2 193 31 — 226Other long-term liabilities . . . . . . . . . . . . . . . . . . . . . . . . 263 113 4,058 (4,284) 150Liabilities of operations held for sale . . . . . . . . . . . . . . . . 41 262 91 — 394
Total liabilities . . . . . . . . . . . . . . . . . . . . . . . . . . . . . 2,661 4,610 6,991 (7,661) 6,601
Minority interest in subsidiaries . . . . . . . . . . . . . . . . . . . . . . . . — 1,467 273 (291) 1,449
Stockholders’ equityPreferred stock . . . . . . . . . . . . . . . . . . . . . . . . . . . . . . . . . — — 61 (61) —Common stock . . . . . . . . . . . . . . . . . . . . . . . . . . . . . . . . . 696 — — — 696Additional paid-in capital . . . . . . . . . . . . . . . . . . . . . . . . . 6,350 2,647 2,434 (4,735) 6,696Accumulated other comprehensive income (loss) . . . . . . 957 (28) 517 (489) 957Retained (deficit) earnings . . . . . . . . . . . . . . . . . . . . . . . . (801) 1,796 (2,283) 487 (801)
Total stockholders’ equity . . . . . . . . . . . . . . . . . . . . 7,202 4,415 729 (4,798) 7,548
Total liabilities and stockholders’ equity . . . . . . . . . $9,863 $10,492 $ 7,993 $(12,750) $15,598
144

NEWMONT MINING CORPORATION
NOTES TO CONSOLIDATED FINANCIAL STATEMENTS—(Continued)(dollars in millions, except per share, per ounce and per pound amounts)
At December 31, 2006
Condensed Consolidating Balance Sheets
NewmontMining
CorporationNewmont
USAOther
Subsidiaries Eliminations
NewmontMining
CorporationConsolidated
AssetsCash and cash equivalents . . . . . . . . . . . . . . . . . . . . . . . . $ — $ 1,040 $ 126 $ — $ 1,166Marketable securities and other short-term
investments . . . . . . . . . . . . . . . . . . . . . . . . . . . . . . . . . . 1 28 80 — 109Trade receivables . . . . . . . . . . . . . . . . . . . . . . . . . . . . . . . — 139 3 — 142Accounts receivable . . . . . . . . . . . . . . . . . . . . . . . . . . . . . 1,817 587 636 (2,834) 206Inventories . . . . . . . . . . . . . . . . . . . . . . . . . . . . . . . . . . . . — 293 83 — 376Stockpiles and ore on leach pads . . . . . . . . . . . . . . . . . . . — 339 38 — 377Deferred income tax assets . . . . . . . . . . . . . . . . . . . . . . . — 100 56 — 156Other current assets . . . . . . . . . . . . . . . . . . . . . . . . . . . . . — 66 27 — 93
Current assets . . . . . . . . . . . . . . . . . . . . . . . . . . . . . . 1,818 2,592 1,049 (2,834) 2,625Property, plant and mine development, net . . . . . . . . . . . — 4,724 1,836 (16) 6,544Investments . . . . . . . . . . . . . . . . . . . . . . . . . . . . . . . . . . . — 281 1,038 — 1,319Investments in subsidiaries . . . . . . . . . . . . . . . . . . . . . . . 6,256 111 4,347 (10,714) —Long-term stockpiles and ore on leach pads . . . . . . . . . . — 756 56 — 812Deferred income tax assets . . . . . . . . . . . . . . . . . . . . . . . 43 478 272 — 793Other long-term assets . . . . . . . . . . . . . . . . . . . . . . . . . . . 1,749 1,104 198 (2,873) 178Goodwill . . . . . . . . . . . . . . . . . . . . . . . . . . . . . . . . . . . . . . — — 1,338 — 1,338Assets of operations held for sale . . . . . . . . . . . . . . . . . . — 23 1,969 — 1,992
Total assets . . . . . . . . . . . . . . . . . . . . . . . . . . . . . . . . $9,866 $10,069 $12,103 $(16,437) $15,601
LiabilitiesCurrent portion of long-term debt . . . . . . . . . . . . . . . . . . $ — $ 154 $ 5 $ — $ 159Accounts payable . . . . . . . . . . . . . . . . . . . . . . . . . . . . . . . 47 2,376 750 (2,833) 340Employee-related benefits . . . . . . . . . . . . . . . . . . . . . . . . — 147 35 — 182Derivative instruments . . . . . . . . . . . . . . . . . . . . . . . . . . . — 173 1 — 174Income and mining taxes . . . . . . . . . . . . . . . . . . . . . . . . . 85 (54) 306 — 337Other current liabilities . . . . . . . . . . . . . . . . . . . . . . . . . . 9 360 147 (1) 515
Current liabilities . . . . . . . . . . . . . . . . . . . . . . . . . . . 141 3,156 1,244 (2,834) 1,707Long-term debt . . . . . . . . . . . . . . . . . . . . . . . . . . . . . . . . . 597 1,035 120 — 1,752Reclamation and remediation liabilities . . . . . . . . . . . . . . — 404 117 — 521Deferred income tax liabilities . . . . . . . . . . . . . . . . . . . . . 53 187 361 25 626Employee-related benefits . . . . . . . . . . . . . . . . . . . . . . . . 1 283 25 — 309Other long-term liabilities . . . . . . . . . . . . . . . . . . . . . . . . 258 145 2,752 (3,020) 135Liabilities of operations held for sale . . . . . . . . . . . . . . . . — 4 112 — 116
Total liabilities . . . . . . . . . . . . . . . . . . . . . . . . . . . . . 1,050 5,214 4,731 (5,829) 5,166
Minority interest in subsidiaries . . . . . . . . . . . . . . . . . . . . . . . . — 1,140 343 (385) 1,098
Stockholders’ equityPreferred stock . . . . . . . . . . . . . . . . . . . . . . . . . . . . . . . . . — — 61 (61) —Common stock . . . . . . . . . . . . . . . . . . . . . . . . . . . . . . . . . 677 — — — 677Additional paid-in capital . . . . . . . . . . . . . . . . . . . . . . . . . 6,182 2,219 5,167 (6,865) 6,703Accumulated other comprehensive income . . . . . . . . . . . 673 19 427 (446) 673Retained earnings . . . . . . . . . . . . . . . . . . . . . . . . . . . . . . . 1,284 1,477 1,374 (2,851) 1,284
Total stockholders’ equity . . . . . . . . . . . . . . . . . . . . 8,816 3,715 7,029 (10,223) 9,337
Total liabilities and stockholders’ equity . . . . . . . . . $9,866 $10,069 $12,103 $(16,437) $15,601
145

NEWMONT MINING CORPORATION
NOTES TO CONSOLIDATED FINANCIAL STATEMENTS—(Continued)(dollars in millions, except per share, per ounce and per pound amounts)
For the Year Ended December 31, 2007
Condensed Consolidating Statement of Cash Flows
NewmontMining
CorporationNewmont
USAOther
Subsidiaries Eliminations
NewmontMining
CorporationConsolidated
Operating activities:Net (loss) income . . . . . . . . . . . . . . . . . . . . . $(1,886) $ 268 $(2,199) $ 1,931 $(1,886)Adjustments to reconcile net income to net
cash provided by operating activities . . . . 871 1,138 3,088 (1,931) 3,166Net change in operating assets and
liabilities . . . . . . . . . . . . . . . . . . . . . . . . . . 66 (549) (272) — (755)
Net cash (used in) provided from continuingoperations . . . . . . . . . . . . . . . . . . . . . . . . . . . . . (949) 857 617 — 525
Net cash provided from discontinuedoperations . . . . . . . . . . . . . . . . . . . . . . . . . . . . . — 27 111 — 138
Net cash (used in) provided from operations . . . . (949) 884 728 — 663
Investing activities:Additions to property, plant and mine
development . . . . . . . . . . . . . . . . . . . . . . . — (940) (730) — (1,670)Proceeds from sale of marketable debt
securities . . . . . . . . . . . . . . . . . . . . . . . . . . — 224 — — 224Investments in marketable debt and equity
securities . . . . . . . . . . . . . . . . . . . . . . . . . . — (222) (36) — (258)Acquisitions . . . . . . . . . . . . . . . . . . . . . . . . . — — (953) — (953)Cash received on repayment of Batu Hijau
carried interest . . . . . . . . . . . . . . . . . . . . . . — 161 — — 161Other . . . . . . . . . . . . . . . . . . . . . . . . . . . . . . . — 24 5 — 29
Net cash used in investing activities of continuingoperations . . . . . . . . . . . . . . . . . . . . . . . . . . . . . — (753) (1,714) — (2,467)
Net cash provided from investing activities ofdiscontinued operations . . . . . . . . . . . . . . . . . . . 1 122 1,231 — 1,354
Net cash provided from (used in) investingactivities . . . . . . . . . . . . . . . . . . . . . . . . . . . . . . 1 (631) (483) — (1,113)
Financing activities:Net borrowings (repayments) . . . . . . . . . . . . 1,196 (239) 15 — 972Dividends paid to minority interests . . . . . . . — (270) — — (270)Dividends paid to common stockholders . . . (181) — — — (181)Proceeds from stock issuance . . . . . . . . . . . . 51 — — — 51Purchase of Company share call options . . . (366) — — — (366)Issuance of Company share warrants . . . . . . 248 — — 248Change in restricted cash and other . . . . . . . — 6 5 — 11
Net cash provided from (used in) financingactivities of continuing operations . . . . . . . . . . 948 (503) 20 — 465
Effect of exchange rate changes on cash . . . . . . . — — 50 — 50
Net change in cash and cash equivalents . . . . . . . — (250) 315 — 65Cash and cash equivalents at beginning of
period . . . . . . . . . . . . . . . . . . . . . . . . . . . . . . . . — 1,040 126 — 1,166
Cash and cash equivalents at end of period . . . . . $ — $ 790 $ 441 $ — $ 1,231
146
NEWMONT MINING CORPORATION
NOTES TO CONSOLIDATED FINANCIAL STATEMENTS—(Continued)(dollars in millions, except per share, per ounce and per pound amounts)
For the Year Ended December 31, 2006
Condensed Consolidating Statement of Cash Flows
NewmontMining
CorporationNewmont
USAOther
Subsidiaries Eliminations
NewmontMining
CorporationConsolidated
Operating activities:Net income (loss) . . . . . . . . . . . . . . . . . . . . . $ 791 $ 505 $ 281 $(786) $ 791Adjustments to reconcile net income to net
cash provided by operating activities . . . . (826) 887 (162) 786 685Change in operating assets and liabilities . . . 64 (354) (57) — (347)
Net cash provided from continuing operations . . . 29 1,038 62 — 1,129Net cash (used in) provided from discontinued
operations . . . . . . . . . . . . . . . . . . . . . . . . . . . . . — (12) 108 — 96
Net cash provided from operations . . . . . . . . . . . . 29 1,026 170 — 1,225
Investing activities:Additions to property, plant and mine
development . . . . . . . . . . . . . . . . . . . . . . . — (1,116) (421) — (1,537)Proceeds from sale of marketable debt
securities . . . . . . . . . . . . . . . . . . . . . . . . . . — 2,216 — — 2,216Investments in marketable debt and equity
securities . . . . . . . . . . . . . . . . . . . . . . . . . . — (1,442) (51) — (1,493)Acquisitions . . . . . . . . . . . . . . . . . . . . . . . . . — — (348) — (348)Other . . . . . . . . . . . . . . . . . . . . . . . . . . . . . . . — 12 8 — 20
Net cash used in investing activities of continuingoperations . . . . . . . . . . . . . . . . . . . . . . . . . . . . . — (330) (812) — (1,142)
Net cash provided from investing activities ofdiscontinued operations . . . . . . . . . . . . . . . . . . . 48 3 287 — 338
Net cash provided from (used in) investingactivities . . . . . . . . . . . . . . . . . . . . . . . . . . . . . . 48 (327) (525) — (804)
Financing activities:Net borrowings (repayments) . . . . . . . . . . . . 6 (311) 392 — 87Dividends paid to minority interests . . . . . . . — (264) — — (264)Dividends paid to common stockholders . . . (168) — (12) — (180)Proceeds from stock issuance . . . . . . . . . . . . 78 — — — 78Early extinguishment of prepaid forward
sales obligation . . . . . . . . . . . . . . . . . . . . . — (48) — — (48)Change in restricted cash and other . . . . . . . 6 (12) — — (6)
Net cash (used in) provided from financingactivities of continuing operations . . . . . . . . . . (78) (635) 380 — (333)
Net cash used in financing activities ofdiscontinued operations . . . . . . . . . . . . . . . . . . . — (7) — — (7)
Net cash (used in) provided from financingactivities . . . . . . . . . . . . . . . . . . . . . . . . . . . . . . (78) (642) 380 — (340)
Effect of exchange rate changes on cash . . . . . . . — 4 (1) — 3
Net change in cash and cash equivalents . . . . . . . (1) 61 24 — 84Cash and cash equivalents at beginning of
period . . . . . . . . . . . . . . . . . . . . . . . . . . . . . . . . 1 979 102 — 1,082
Cash and cash equivalents at end of period . . . . . $ — $ 1,040 $ 126 $ — $ 1,166
147

NEWMONT MINING CORPORATION
NOTES TO CONSOLIDATED FINANCIAL STATEMENTS—(Continued)(dollars in millions, except per share, per ounce and per pound amounts)
For the Year Ended December 31, 2005
Condensed Consolidating Statement of Cash Flows
NewmontMining
CorporationNewmont
USAOther
Subsidiaries Eliminations
NewmontMining
CorporationConsolidated
Operating activities:Net income (loss) . . . . . . . . . . . . . . . . . . . . . $ 322 $ 265 $ 27 $(292) $ 322Adjustments to reconcile net income to net
cash provided by operating activities . . . . (253) 1,126 (95) 292 1,070Change in operating assets and liabilities . . . 8 (211) (20) — (223)
Net cash provided from (used in) continuingoperations . . . . . . . . . . . . . . . . . . . . . . . . . . . . . 77 1,180 (88) — 1,169
Net cash (used in) provided from discontinuedoperations . . . . . . . . . . . . . . . . . . . . . . . . . . . . . –– (7) 81 — 74
Net cash from operations . . . . . . . . . . . . . . . . . . . 77 1,173 (7) — 1,243
Investing activities:Additions to property, plant and mine
development . . . . . . . . . . . . . . . . . . . . . . . — (848) (356) — (1,204)Proceeds from sale of marketable debt
securities . . . . . . . . . . . . . . . . . . . . . . . . . . –– 3,145 –– –– 3,145Investments in marketable debt and equity
securities . . . . . . . . . . . . . . . . . . . . . . . . . . — (3,146) (145) — (3,291)Investments in affiliates . . . . . . . . . . . . . . . . (49) –– –– 49 ––Other . . . . . . . . . . . . . . . . . . . . . . . . . . . . . . . –– 38 2 — 40
Net cash (used in) provided from investingactivities of continuing operations . . . . . . . . . . (49) (811) (499) 49 (1,310)
Net cash (used in) provided from investingactivities of discontinued operations . . . . . . . . . –– (10) 343 –– 333
Net cash (used in) provided by investingactivities . . . . . . . . . . . . . . . . . . . . . . . . . . . . . . (49) (821) (156) 49 (977)
Financing activities:Net borrowings (repayments) . . . . . . . . . . . . 98 127 141 — 366Dividends paid to minority interests . . . . . . . –– (186) –– –– (186)Dividends paid to common stockholders . . . (169) — (10) — (179)Proceeds from stock issuance . . . . . . . . . . . . 43 — 49 (49) 43Change in restricted cash and other . . . . . . . — — (5) — (5)
Net cash (used in) provided from financingactivities of continuing operations . . . . . . . . . . (28) (59) 175 (49) 39
Net cash used in financing activities ofdiscontinued operations . . . . . . . . . . . . . . . . . . . — (1) — — (1)
Net cash (used in) provided from financingactivities . . . . . . . . . . . . . . . . . . . . . . . . . . . . . . (28) (60) 175 (49) 38
Effect of exchange rate changes on cash . . . . . . . — (3) — — (3)
Net change in cash and cash equivalents . . . . . . . — 289 12 — 301Cash and cash equivalents at beginning of
period . . . . . . . . . . . . . . . . . . . . . . . . . . . . . . . . 1 690 90 — 781
Cash and cash equivalents at end of period . . . . . $ 1 $ 979 $ 102 $ — $ 1,082
148
NEWMONT MINING CORPORATION
NOTES TO CONSOLIDATED FINANCIAL STATEMENTS—(Continued)(dollars in millions, except per share, per ounce and per pound amounts)
NOTE 32 COMMITMENTS AND CONTINGENCIES
General
The Company follows FAS No. 5, “Accounting for Contingencies,” in determining its accruals anddisclosures with respect to loss contingencies other than tax contingencies provided for in accordance with FIN48 (see Note 8). Accordingly, estimated losses from loss contingencies are accrued by a charge to income wheninformation available prior to issuance of the financial statements indicates that it is probable (greater than a 75%probability) that a liability could be been incurred and the amount of the loss can be reasonably estimated. Legalexpenses associated with the contingency are expensed as incurred. If a loss contingency is not probable orreasonably estimable, disclosure of the loss contingency is made in the financial statements when it is at leastreasonably possible that a material loss could be incurred.
Operating Segments
The Company’s operating segments are identified in Note 30. Except as noted in this paragraph, all of theCompany’s commitments and contingencies specifically described in this Note 32 relate to the Corporate andOther reportable segment. The Nevada Operations matters under Newmont USA Limited relate to the Nevadareportable segment. The PT Newmont Minahasa Raya matters relate to the Other Operations reportable segment.The Yanacocha matters relate to the Yanacocha reportable segment. The Newmont Yandal Operations PtyLimited and the Newmont Australia Limited matters relate to the Australia/New Zealand reportable segment.
Environmental Matters
The Company’s mining and exploration activities are subject to various laws and regulations governing theprotection of the environment. These laws and regulations are continually changing and are generally becomingmore restrictive. The Company conducts its operations so as to protect the public health and environment andbelieves its operations are in compliance with applicable laws and regulations in all material respects. TheCompany has made, and expects to make in the future, expenditures to comply with such laws and regulations,but cannot predict the full amount of such future expenditures.
Estimated future reclamation costs are based principally on legal and regulatory requirements. As ofDecember 31, 2007 and December 31, 2006, $569 and $513, respectively, were accrued for reclamation costsrelating to mineral properties in accordance with FAS No. 143, “Accounting for Asset Retirement Obligations,”of which $57 is classified as current liabilities expected to be spent in 2008 (see Note 24).
In addition, the Company is involved in several matters concerning environmental obligations associatedwith former mining activities. Generally, these matters concern developing and implementing remediation plansat the various sites involved. The Company believes that the related environmental obligations associated withthese sites are similar in nature with respect to the development of remediation plans, their risk profile and thecompliance required to meet general environmental standards. Based upon the Company’s best estimate of itsliability for these matters, $125 and $85 were accrued for such obligations as of December 31, 2007 andDecember 31, 2006, respectively of which $14 is classified as current liabilities expected to be spent in 2008.These amounts are included in Other current liabilities and Reclamation and remediation liabilities. Dependingupon the ultimate resolution of these matters, the Company believes that it is reasonably possible that the liabilityfor these matters could be as much as 61% greater or 18% lower than the amount accrued as of December 31,2007. The amounts accrued for these matters are reviewed periodically based upon facts and circumstancesavailable at the time. Changes in estimates are recorded in Other expense, net in the period estimates are revised.
149

NEWMONT MINING CORPORATION
NOTES TO CONSOLIDATED FINANCIAL STATEMENTS—(Continued)(dollars in millions, except per share, per ounce and per pound amounts)
Details about certain of the more significant matters involved are discussed below.
Dawn Mining Company LLC (“Dawn”) - 51% Newmont Owned
Midnite Mine Site. Dawn previously leased an open pit uranium mine, currently inactive, on the SpokaneIndian Reservation in the State of Washington. The mine site is subject to regulation by agencies of the U.S.Department of Interior (the Bureau of Indian Affairs and the Bureau of Land Management), as well as the UnitedStates Environmental Protection Agency (“EPA”).
In 1991, Dawn’s mining lease at the mine was terminated. As a result, Dawn was required to file a formalmine closure and reclamation plan. The Department of Interior commenced an analysis of Dawn’s proposed planand alternate closure and reclamation plans for the mine. Work on this analysis has been suspended indefinitely.In mid-2000, the mine was included on the National Priorities List under the Comprehensive EnvironmentalResponse, Compensation and Liability Act (“CERCLA”). In March 2003, the EPA notified Dawn and Newmontthat it had thus far expended $12 on the Remedial Investigation/Feasibility Study under CERCLA (“RI/FS”). InOctober 2005, the EPA issued the RI/FS on this property in which it indicated a preferred remedy estimated tocost approximately $150. Newmont and Dawn filed comments on the RI/FS with the EPA in January 2006. OnOctober 3, 2006, the EPA issued a final Record of Decision in which it formally selected the preferred remedyidentified in the RI/FS.
On January 28, 2005, the EPA filed a lawsuit against Dawn and Newmont under CERCLA in the U.S.District Court for the Eastern District of Washington. The EPA has asserted that Dawn and Newmont are liablefor reclamation or remediation work and costs at the mine. Dawn does not have sufficient funds to pay for thereclamation plan it proposed or for any alternate plan, or for any additional remediation work or costs at themine. Newmont intends to vigorously contest any claims as to its liability.
Newmont cannot reasonably predict the outcome of this lawsuit or the likelihood of any other action againstDawn or Newmont arising from this matter.
Dawn Mill Site. Dawn also owns a uranium mill site facility, located on private land near Ford, Washington,which is subject to state and federal regulation. In late 1999, Dawn sought and later received state approval for arevised closure plan that expedites the reclamation process at the site. The currently approved plan for the site isguaranteed by Newmont.
Idarado Mining Company (“Idarado”) - 80.1% Newmont Owned
In July 1992, Newmont and Idarado signed a consent decree with the State of Colorado (“State”), which wasagreed to by the U.S. District Court of Colorado, to settle a lawsuit brought by the State under CERCLA.
Idarado agreed in the consent decree to undertake specified remediation work at its former mining site in theTelluride/Ouray area of Colorado. Remediation work at this property is substantially complete. If the remediationdoes not achieve specific performance objectives defined in the consent decree, the State may require Idarado toimplement supplemental activities at the site, also as defined in the consent decree. Idarado and Newmontobtained a $6 reclamation bond to secure their potential obligations under the consent decree. In addition,Idarado settled natural resources damages and past and future response costs, and agreed to habitat enhancementwork under the consent decree. All of this work is substantially complete.
150

NEWMONT MINING CORPORATION
NOTES TO CONSOLIDATED FINANCIAL STATEMENTS—(Continued)(dollars in millions, except per share, per ounce and per pound amounts)
Newmont Capital Limited - 100% Newmont Owned
In February 1999, the EPA placed the Lava Cap mine site in Nevada County, California on the NationalPriorities List under CERCLA. The EPA then initiated a RI/FS under CERCLA to determine environmentalconditions and remediation options at the site.
Newmont Capital, formerly known as Franco-Nevada Mining Corporation, Inc., owned the property forapproximately three years from 1984 to 1986 but never mined or conducted exploration at the site. The EPAasserts that Newmont Capital is responsible for clean up costs incurred at the site. Newmont Capital and the EPAreached settlement on all aspects of this matter except future potential Natural Resource Damage claims. Theparties have entered into an agreement tolling the statute of limitations until December 31, 2008 to facilitate thefinalization of the agreement. The settlement will be subject to approval by the U.S. District Court for the Districtof Northern California.
Newmont USA Limited - 100% Newmont Owned
Pinal Creek. Newmont is a defendant in a lawsuit brought on November 5, 1991 in U.S. District Court inArizona by the Pinal Creek Group, alleging that the company and others are responsible for some portion of costsincurred to address groundwater contamination emanating from copper mining operations located in the area ofGlobe and Miami, Arizona. Two former subsidiaries of Newmont, Pinto Valley Copper Corporation and MagmaCopper Company (now known as BHP Copper Inc.), owned some of the mines in the area between 1983 and1987. The court has dismissed plaintiffs’ claims seeking to hold Newmont liable for the acts or omissions of itsformer subsidiaries. Based on information presently available, Newmont believes it has strong defenses toplaintiffs’ remaining claims, including, without limitation, that Newmont’s agents did not participate in anypollution causing activities; that Newmont’s liabilities, if any, were contractually transferred to one of theplaintiffs; that portions of plaintiffs’ claimed damages are not recoverable; and that Newmont’s equitable shareof liability, if any, would be immaterial. While Newmont has denied liability and is vigorously defending theseclaims, we cannot reasonably predict the final outcome of this lawsuit.
Grass Valley. On February 3, 2004, the City of Grass Valley, California brought suit against Newmontunder CERCLA in the U.S. District Court for the Northern District of California. This matter involves anabandoned mine adit on property previously owned by a predecessor of Newmont and currently owned by theCity of Grass Valley. The complaint alleges that the adit is discharging metals-bearing water into a stream on theproperty, in concentrations in excess of current EPA drinking water standards. Newmont cannot reasonablypredict the likely outcome of this matter.
Gray Eagle Mine Site. By letter dated September 3, 2002, the EPA notified Newmont that the EPA hadexpended $3 in response costs to address environmental conditions associated with a historic tailings pile locatedat the Grey Eagle Mine site near Happy Camp, California, and requested that Newmont pay those costs. The EPAhas identified four potentially responsible parties, including Newmont. Newmont does not believe it has anyliability for environmental conditions at the Grey Eagle Mine site, and intends to vigorously defend any formalclaims by the EPA. Newmont cannot reasonably predict the likelihood or outcome of any future action against itarising from this matter.
Ross Adams Mine Site. By letter dated June 5, 2007, the US Forest Service notified Newmont that it hadexpended approximately $300,000 in response costs to address environmental conditions at the Adams Rossmine in Prince of Wales, Alaska, and requested Newmont USA Limited pay those costs and perform an
151
NEWMONT MINING CORPORATION
NOTES TO CONSOLIDATED FINANCIAL STATEMENTS—(Continued)(dollars in millions, except per share, per ounce and per pound amounts)
Engineering Evaluation/Cost Analysis (“EE/CA”) to assess what future response activities might need to becompleted at the site. Newmont does not believe it has any liability for environmental conditions at the site, andintends to vigorously defend any formal claims by the EPA. Newmont has agreed to perform the EE/CA.Newmont cannot reasonably predict the likelihood or outcome of any future action against it arising from thismatter.
PT Newmont Minahasa Raya (“PTNMR”) - 80% Newmont Owned
In July 2004, a criminal complaint was filed against PTNMR, the Newmont subsidiary that operated theMinahasa mine in Indonesia, alleging environmental pollution relating to submarine tailings placement intonearby Buyat Bay. The Indonesian police detained five PTNMR employees during September and October of2004. The police investigation and the detention of PTNMR’s employees was declared illegal by the SouthJakarta District Court in December 2004, but in March 2005, the Indonesian Supreme Court upheld the legalityof the police investigation, and the police turned their evidence over to the local prosecutor. In July 2005, theprosecutor filed an indictment against PTNMR and its President Director, alleging environmental pollution atBuyat Bay. After the court rejected motions to dismiss the proceeding, the trial proceeded and all evidence,including that of the defense, was presented in court as of September 2006. In November 2006 the prosecutionfiled its charge, seeking a three-year jail sentence for PTNMR’s President Director plus a nominal fine. Inaddition, the prosecution recommended a nominal fine against PTNMR. The defense filed responses in January2007, and final briefing was completed in March 2007. On April 24, 2007, the court entered its verdict acquittingPTNMR and its President Director of all charges. In May 2007, the prosecution appealed the decision of thecourt to the Indonesian Supreme Court, despite Indonesian laws that prohibit the appeal of a verdict of acquittal.
In addition, on March 22, 2007, an Indonesian non-governmental organization named Wahana LingkunganHidup Indonesia (“WALHI”) filed a civil suit against PTNMR and Indonesia’s Ministry of Energy and MineralResources and Ministry for the Environment, alleging pollution from the disposal of mine tailings into BuyatBay, and seeking a court order requiring PTNMR to fund a 25-year monitoring program in relation to Buyat Bay.In December 2007, the court ruled in PTNMR’s favor and found that WALHI’s allegations of pollution in BuyatBay were without merit.
Independent sampling and testing of Buyat Bay water and fish, as well as area residents, conducted by theWorld Health Organization and the Australian Commonwealth Scientific and Industrial Research Organization,confirm that PTNMR has not polluted the Buyat Bay environment, and, therefore, has not adversely affected thefish in Buyat Bay or the health of nearby residents. The Company remains steadfast that it has not causedpollution or health problems and will continue to vigorously defend itself against these allegations.
Resurrection Mining Company (“Resurrection”) - 100% Newmont Owned
Newmont, Resurrection and other defendants were named in lawsuits filed by the State of Colorado (the“State”) under CERCLA in 1983, which were subsequently consolidated with a lawsuit filed by EPA in 1986.These proceedings sought to compel the defendants to remediate the impacts of pre-existing, historic miningactivities near Leadville, Colorado, which date back to the mid-1800s, and which the government agencies claimwere causing substantial environmental problems in the area.
In 1988 and 1989, the EPA issued administrative orders with respect to one area on the site and thedefendants collectively implemented those orders by constructing a water treatment plant, which was placed in
152

NEWMONT MINING CORPORATION
NOTES TO CONSOLIDATED FINANCIAL STATEMENTS—(Continued)(dollars in millions, except per share, per ounce and per pound amounts)
operation in early 1992. Remaining remedial work for this area consists of water treatment plant operation andcontinuing environmental monitoring and maintenance activities. The parties also entered into a consent decreewith respect to the remaining areas at the site, which apportioned liabilities and responsibilities for these areas.The EPA approved remedial actions for selected components of Resurrection’s portion of the site, which wereinitiated in 1995. The EPA has not selected the final remedy for the site. In March 1999, the parties entered into aMemorandum of Understanding (“MOU”) to facilitate the settlement of natural resources damages claims underCERCLA for the upper Arkansas River Basin. In January 2004, an MOU report was issued that evaluated theextent of natural resource damages and possible restoration activities that might be required.
On August 9, 2005, ASARCO LLC, another potentially responsible party at the site, filed for Chapter 11bankruptcy in the U.S. Bankruptcy Court for the Southern District of Texas (the “Bankruptcy Court”). ASARCOis contractually responsible for 50% of the ongoing expenses at the water treatment plant. In June 2007,Resurrection, the EPA, the State and ASARCO reached a settlement relating to all outstanding issues at the site.The settlement, once fully approved, will modify certain responsibilities of the parties. In July 2007, thesettlement was approved by the Bankruptcy Court. The settlement is also subject to approval by the U.S. DistrictCourt for the District of Colorado.
Other Legal Matters
Minera Yanacocha S.R.L. (“Yanacocha”) - 51.35% Newmont Owned
Choropampa. In June 2000, a transport contractor of Yanacocha spilled approximately 151 kilograms ofelemental mercury near the town of Choropampa, Peru, which is located 53 miles (85 kilometers) southwest ofthe Yanacocha mine. Elemental mercury is not used in Yanacocha’s operations but is a by-product of goldmining and was sold to a Lima firm for use in medical instruments and industrial applications. A comprehensivehealth and environmental remediation program was undertaken by Yanacocha in response to the incident. InAugust 2000, Yanacocha paid under protest a fine of 1,740,000 Peruvian soles (approximately $0.5) to thePeruvian government. Yanacocha has entered into settlement agreements with a number of individuals impactedby the incident. As compensation for the disruption and inconvenience caused by the incident Yanacocha enteredinto agreements with and provided a variety of public works in the three communities impacted by this incident.Yanacocha cannot predict the likelihood of additional expenditures related to this matter.
Yanacocha, various wholly-owned subsidiaries of Newmont, and other defendants have been named inlawsuits filed by approximately 1,100 Peruvian citizens in Denver District Court for the State of Colorado. Theseactions seek compensatory damages based on claims associated with the elemental mercury spill incident. InFebruary 2005, Yanacocha and the various Newmont defendants answered the complaint in the Denver DistrictCourt. The parties in these cases have agreed to submit these matters to binding arbitration. In October 2007, theparties to the arbitration entered a court-approved settlement agreement, resolving most of these cases.
Additional lawsuits relating to the Choropampa incident were filed against Yanacocha in the local courts ofCajamarca, Peru, in May 2002 by over 900 Peruvian citizens. A significant number of the plaintiffs in theselawsuits entered into settlement agreements with Yanacocha prior to filing such claims. In September 2006, thePeruvian Supreme Court issued contradictory opinions on the validity of these settlement agreements.Subsequent lower court decisions have upheld the validity of these settlement agreements, discharging a numberof the lawsuits. In 2005, Yanacocha entered into settlement agreements with approximately 350 additionalplaintiffs.
Neither Newmont nor Yanacocha can reasonably predict the final outcome of any of the above-describedlawsuits.
153
NEWMONT MINING CORPORATION
NOTES TO CONSOLIDATED FINANCIAL STATEMENTS—(Continued)(dollars in millions, except per share, per ounce and per pound amounts)
Conga. Yanacocha is involved in a dispute with the Provincial Municipality of Celendin regarding the authority ofthat governmental body to regulate the development of the Conga project. In the fourth quarter of 2004, the Municipalityof Celendin enacted an ordinance declaring the area around Conga to be a mining-free reserve and naturally protectedarea. Yanacocha has challenged this ordinance by means of two legal actions, one filed by Yanacocha (as the leaseholder of the Conga mining concessions) and one filed by Minera Chaupiloma (as the titleholder of the Conga miningconcessions). In August 2007, a Peruvian Court of first instance upheld Chaupiloma’s claim, stating that theMunicipality of Celendin lacks the authority to create natural protected areas. The Municipality of Celendin has notappealed the ruling. Based on legal precedent established by Peru’s Constitutional Tribunal and the foregoing resolutionof the Chaupiloma claim, it is reasonable to believe that Yanacocha’s mining rights will be upheld.
Newmont Mining Corporation
On June 8, 2005, UFCW Local 880 – Retail Food Employers Joint Pension Fund filed a putative class action inthe federal district court in Colorado purportedly on behalf of purchasers of Newmont Mining Corporation(“Newmont”) publicly traded securities between July 28, 2004 and April 26, 2005. The action named Newmont,Wayne W. Murdy, Pierre Lassonde and Bruce D. Hansen as defendants. Substantially similar purported classactions were filed in the same court on June 15, 2005 by John S. Chapman and on June 20, 2005 by Zoe Myerson.In November 2005, the court consolidated these cases and, in March 2006, appointed a lead plaintiff. In April 2006,the lead plaintiff filed a consolidated amended complaint naming David Francisco, Russell Ball, Thomas Enos andRobert Gallagher as additional defendants. It alleged, among other things, that Newmont and the individualdefendants violated certain antifraud provisions of the federal securities laws by failing to disclose alleged operatingdeficiencies and sought unspecified monetary damages and other relief. On October 20, 2006, the lead plaintiff, onbehalf of a settlement class consisting of all purchasers of Newmont securities from November 1, 2003, through andincluding March 23, 2006 (except defendants and certain related persons), entered into a Stipulation of Settlementwith defendants that (a) would release all claims asserted, or that could have been asserted, in the action; (b) wouldprovide for a payment by Newmont of $15 to be distributed to class members pursuant to a plan of allocationdeveloped by the lead plaintiff; and (c) would provide that all defendants deny any wrongdoing or liability withrespect to the settled matters. On December 11, 2007, the Court approved the settlement.
On June 14, 2005, June 30, 2005 and July 1, 2005, purported derivative actions were filed, on behalf ofNewmont, by Doris Staehr, Frank J. Donio and Jack G. Blaz, respectively, in the federal district court inColorado against certain of Newmont’s current and former directors and officers. Each action alleged that certaindefendants breached their fiduciary duties by engaging in insider trading and misappropriation of information,and that all defendants breached their fiduciary duties and engaged in conduct that constituted abuse of control,gross mismanagement, waste of corporate assets and unjust enrichment in connection with, among other things,failing to disclose alleged operating deficiencies and failing to prevent alleged violations of environmental lawsin Indonesia. The plaintiffs seek, on behalf of Newmont, among other remedies, all damages sustained by theCompany as a result of the allegedly improper conduct. In November 2005, the court consolidated these casesand in December 2005 the court appointed a lead plaintiff. On April 10, 2006, the lead plaintiff filed aconsolidated amended complaint. In a related development, on January 13, 2006, a purported Newmontshareholder sent to the Board of Directors a letter demanding the Company take action against the defendants inthe purported derivative actions with respect to the matters alleged in the derivative complaints. The Board hastaken the demand under consideration. Counsel for plaintiffs in the derivative actions, counsel for the demandingshareholder and the Company have agreed to settle the action and related disputes on the basis of certainrevisions to the Company’s corporate governance arrangements, and an attorneys’ fee to be paid by theCompany. This settlement stipulation was filed with the court on June 19, 2007 and was approved by the U.S.District Court on February 20, 2008.
154

NEWMONT MINING CORPORATION
NOTES TO CONSOLIDATED FINANCIAL STATEMENTS—(Continued)(dollars in millions, except per share, per ounce and per pound amounts)
Newmont Yandal Operations Pty Ltd (“NYOL”) - 100% Newmont Owned
On September 3, 2003, J. Aron & Co. commenced proceedings in the Supreme Court of New South Wales(Australia) against NYOL, its subsidiaries and the administrator in relation to the completed voluntaryadministration of the NYOL group. J. Aron & Co., an NYOL creditor, initially sought injunctive relief that wasdenied by the court on September 8, 2003. On October 30, 2003, J. Aron & Co. filed a statement of claimalleging various deficiencies in the implementation of the voluntary administration process and seeking damagesand other relief against NYOL and other parties. Newmont cannot reasonably predict the final outcome of thislawsuit.
Other Commitments and Contingencies
Tax contingencies are provided for under FIN 48 (see Notes 2 and 8).
In a 1993 asset exchange, a wholly-owned subsidiary transferred a coal lease under which the subsidiary hadcollected advance royalty payments totaling $484. From 1994 to 2018, remaining advance payments under thelease to the transferee total $390. In the event of title failure as stated in the lease, this subsidiary has a primaryobligation to refund previously collected payments and has a secondary obligation to refund any of the $390collected by the transferee, if the transferee fails to meet its refund obligation. The subsidiary has title insuranceon the leased coal deposits of $240 covering the secondary obligation. The Company and the subsidiary regardthe circumstances entitling the lessee to a refund as remote.
The Company has minimum royalty obligations on one of its producing mines in Nevada for the life of themine. Amounts paid as a minimum royalty (where production royalties are less than the minimum obligation) inany year are recoverable in future years when the minimum royalty obligation is exceeded. Although theminimum royalty requirement may not be met in a particular year, the Company expects that over the mine life,gold production will be sufficient to meet the minimum royalty requirements. Minimum royalty paymentspayable are $11 in 2008, $17 in 2009 and 2010, $18 in 2011, $15 in 2012 and $57 thereafter.
As part of its ongoing business and operations, the Company and its affiliates are required to provide suretybonds, bank letters of credit and bank guarantees as financial support for various purposes, includingenvironmental reclamation, exploration permitting, workers compensation programs and other general corporatepurposes. As of December 31, 2007 and December 31, 2006, there were $662 and $445, respectively, ofoutstanding letters of credit, surety bonds and bank guarantees. The surety bonds, letters of credit and bankguarantees reflect fair value as a condition of their underlying purpose and are subject to fees competitivelydetermined in the market place. The obligations associated with these instruments are generally related toperformance requirements that the Company addresses through its ongoing operations. As the specificrequirements are met, the beneficiary of the associated instrument cancels and/or returns the instrument to theissuing entity. Certain of these instruments are associated with operating sites with long-lived assets and willremain outstanding until closure. Generally, bonding requirements associated with environmental regulation arebecoming more restrictive. In addition, the surety markets for certain types of environmental bonding used by theCompany have become increasingly constrained. The Company, however, believes it is in compliance with allapplicable bonding obligations and will be able to satisfy future bonding requirements, through existing oralternative means, as they arise.
Under the Batu Hijau Contract of Work, beginning in 2005 and continuing through 2010, a portion ofPTNNT’s shares must be offered for sale, first, to the Indonesian government or, second, to Indonesian nationals,equal to the difference between the following percentages and the percentage of shares already owned by the
155

NEWMONT MINING CORPORATION
NOTES TO CONSOLIDATED FINANCIAL STATEMENTS—(Continued)(dollars in millions, except per share, per ounce and per pound amounts)
Indonesian government or Indonesian nationals (if such number is positive): 23% by March 31, 2006; 30% byMarch 31, 2007; 37% by March 31, 2008, 44% by March 31, 2009; and 51% by March 31, 2010. The price atwhich such interest must be offered for sale to the Indonesian parties is the highest of the then-currentreplacement cost, the price at which shares would be accepted for listing on the Jakarta Stock Exchange, or thefair market value of such interest as a going concern, as agreed with the Indonesian government. Pursuant to thisprovision, it is possible that the ownership interest of the Newmont/Sumitomo partnership in PTNNT, owner ofBatu Hijau, could be reduced to 49%.
PTPI has owned and continues to own a 20% interest in PTNNT, and therefore the Newmont/Sumitomopartnership was required to offer a 3% interest for sale in 2006 and an additional 7% interest in 2007. A further7% interest will be offered for sale in March 2008. In accordance with the Contract of Work, an offer to sell a 3%interest was made to the government of Indonesia in 2006 and an offer for an additional 7% interest was made in2007. While the central government declined to participate in the offer, local governments in the area in whichthe Batu Hijau mine is located have expressed interest in acquiring shares, as have various Indonesian nationals.In January 2008, the Newmont/Sumitomo partnership agreed to sell, under a carried interest arrangement, 2% ofPTNNT’s shares to Kabupaten Sumbawa, one of the local governments, subject to satisfaction of closingconditions. On February 11, 2008, PTNNT received notification from the Department of Energy and MineralResources (DEMR) alleging that PTNNT is in breach of its divestiture requirements under the Contract of Workand threatening to issue a notice to terminate the Contract of Work if PTNNT does not agree to divest the 2006and 2007 shares, in accordance with the direction of the DEMR, by February 22, 2008. Newmont and Sumitomobelieve there is no basis under the Contract of Work for this notification and no grounds for terminating theContract of Work, and are currently evaluating possible responses to the February 11, 2008 default notice,including filing for international arbitration as provided for under the Contract of Work. Newmont andSumitomo are in discussions with officials of the Government of Indonesia to attempt to clarify or resolve thisissue.
The Company has been in discussions to renew its forest use permit (called a pinjam pakai) for over twoyears. This permit is a key requirement to continue to efficiently operate the Batu Hijau mine. The permitrenewal has not been received and in the event it is not received by May 2008, it could have an adverse impact onoperating and financial results.
Newmont is from time to time involved in various legal proceedings related to its business. Except in theabove-described proceedings, management does not believe that adverse decisions in any pending or threatenedproceeding or that amounts that may be required to be paid by reason thereof will have a material adverse effecton the Company’s financial condition or results of operations.
156

NEWMONT MINING CORPORATION
NOTES TO CONSOLIDATED FINANCIAL STATEMENTS—(Continued)(dollars in millions, except per share, per ounce and per pound amounts)
NOTE 33 UNAUDITED SUPPLEMENTARY DATA
Quarterly Data
The following is a summary of selected quarterly financial information (unaudited):
2007
Three Months Ended
March 31 June 30 September 30 December 31
Revenues . . . . . . . . . . . . . . . . . . . . . . . . . . . . . . . . . . . . . . . . . . . . . . . $1,224 $ 1,276 $1,616 $1,410Gross profit (loss)(1) . . . . . . . . . . . . . . . . . . . . . . . . . . . . . . . . . . . . . . . $ 260 $ (186) $ 719 $ 518Income (loss) from continuing operations . . . . . . . . . . . . . . . . . . . . . $ 40 $ (401) $ 331 $ (933)Income (loss) from discontinued operations . . . . . . . . . . . . . . . . . . . . $ 28 $(1,661) $ 66 $ 644Net income (loss) applicable to common shares . . . . . . . . . . . . . . . . . $ 68 $(2,062) $ 397 $ (289)Income (loss) from continuing operations, per common share,
basic . . . . . . . . . . . . . . . . . . . . . . . . . . . . . . . . . . . . . . . . . . . . . . . . . $ 0.09 $ (0.89) $ 0.73 $ (2.06)Income (loss) from discontinued operations, per common share,
basic . . . . . . . . . . . . . . . . . . . . . . . . . . . . . . . . . . . . . . . . . . . . . . . . . $ 0.06 $ (3.68) $ 0.15 $ 1.43
Net income (loss) per common share, basic . . . . . . . . . . . . . . . . . . . . $ 0.15 $ (4.57) $ 0.88 $ (0.63)
Income (loss) from continuing operations, per common share,diluted . . . . . . . . . . . . . . . . . . . . . . . . . . . . . . . . . . . . . . . . . . . . . . . $ 0.09 $ (0.89) $ 0.73 $ (2.06)
Income (loss) from discontinued operations, per common share,diluted . . . . . . . . . . . . . . . . . . . . . . . . . . . . . . . . . . . . . . . . . . . . . . . $ 0.06 $ (3.68) $ 0.15 $ 1.43
Net income (loss) per common share, diluted . . . . . . . . . . . . . . . . . . . $ 0.15 $ (4.57) $ 0.88 $ (0.63)
Basic weighted-average shares outstanding . . . . . . . . . . . . . . . . . . . . 451 451 452 452Diluted weighted-average shares outstanding . . . . . . . . . . . . . . . . . . . 452 451 453 452Dividends declared per common share . . . . . . . . . . . . . . . . . . . . . . . . $ 0.10 $ 0.10 $ 0.10 $ 0.10Closing price of common stock . . . . . . . . . . . . . . . . . . . . . . . . . . . . . . $41.99 $ 39.06 $44.73 $48.83
2006
Three Months Ended
March 31 June 30 September 30 December 31
Revenues . . . . . . . . . . . . . . . . . . . . . . . . . . . . . . . . . . . . . . . . . . . . . . . $1,114 $ 1,271 $1,073 $1,424Gross profit(1) . . . . . . . . . . . . . . . . . . . . . . . . . . . . . . . . . . . . . . . . . . . . $ 439 $ 519 $ 355 $ 526Income from continuing operations . . . . . . . . . . . . . . . . . . . . . . . . . . $ 200 $ 134 $ 58 $ 171Income from discontinued operations . . . . . . . . . . . . . . . . . . . . . . . . . $ 9 $ 26 $ 141 $ 52Net income applicable to common shares . . . . . . . . . . . . . . . . . . . . . . $ 209 $ 160 $ 199 $ 223Income from continuing operations, per common share, basic . . . . . . $ 0.45 $ 0.30 $ 0.12 $ 0.38Income from discontinued operations, per common share, basic . . . . $ 0.02 $ 0.06 $ 0.31 $ 0.12
Net income per common share, basic . . . . . . . . . . . . . . . . . . . . . . . . . $ 0.47 $ 0.36 $ 0.43 $ 0.50
Income from continuing operations, per common share, diluted . . . . $ 0.45 $ 0.30 $ 0.12 $ 0.38Income from discontinued operations, per common share, diluted . . $ 0.02 $ 0.06 $ 0.31 $ 0.11
Net income per common share, diluted . . . . . . . . . . . . . . . . . . . . . . . . $ 0.47 $ 0.36 $ 0.43 $ 0.49
Basic weighted-average shares outstanding . . . . . . . . . . . . . . . . . . . . 448 449 450 450Diluted weighted-average shares outstanding . . . . . . . . . . . . . . . . . . . 451 452 452 452Dividends declared per common share . . . . . . . . . . . . . . . . . . . . . . . . $ 0.10 $ 0.10 $ 0.10 $ 0.10Closing price of common stock . . . . . . . . . . . . . . . . . . . . . . . . . . . . . . $51.89 $ 52.93 $42.75 $45.15
(1) Revenues less Costs applicable to sales, Loss on settlement of price-capped forward sales contracts, Midasredevelopment and Depreciation, depletion and amortization.
157

NEWMONT MINING CORPORATION
NOTES TO CONSOLIDATED FINANCIAL STATEMENTS—(Continued)(dollars in millions, except per share, per ounce and per pound amounts)
Significant after-tax adjustments were as follows:
Fourth quarter 2007: (i) a $1,122 ($2.48 per share, basic) loss on the write-down of Exploration Segmentgoodwill; (ii) a $39 ($0.09 per share, basic) loss on the impairment of marketable securities and (iii) a $597($1.32 per share, basic) gain on the sale of royalty and other non-core assets;
Third quarter 2007: none;
Second quarter 2007: (i) a $1,665 ($3.69 per share, basic) loss on the write-down of Merchant BankingGoodwill; (ii) a $460 ($1.02 per share, basic) loss on the settlement of price-capped forward sales contracts;(iii) a $25 ($0.06 per share, basic) loss on a Batu Hijau minority loan repayment; (iv) an $11 ($0.02 per share,basic) loss on reclamation obligations at non-operating properties and (v) an $8 ($0.02 per share, basic) loss onthe settlement of senior management retirement obligations;
First quarter 2007: (i) a $22 ($0.05 per share, basic) gain on exchange of securities and (ii) a $5 ($0.01 pershare, basic) loss on the impairment of marketable securities;
Fourth quarter 2006: (i) a $29 ($0.06 per share, basic) reclamation estimate charge; (ii) a $27 ($0.06 pershare, basic) net tax benefit from a reconciliation of the Company’s U.S. book and tax basis assets and liabilitiesas well as a detailed analysis of income taxes payable. The differences were identified as affecting the years 1998to 2005 although the amount applicable to any one year is not material. As the amounts are not material to thecurrent year or the year in which they arose, the entire adjustment was recognized as a tax benefit during thefourth quarter of 2006; (iii) a $16 ($.03 per share, basic) net tax benefit due to an adjustment in the interestaccrued on tax contingencies and (iv) an $8 ($0.02 per share, basic) net gain on the sale of Holloway;
Third quarter 2006: (i) a $173 ($0.39 per share, basic) net gain on the sale of the Alberta Oil Sands project;(ii) a $66 ($0.15 per share, basic) loss on the expropriation of Zarafshan; (iii) a $57 ($0.13 per share, basic) taxexpense for repatriation of cash from the sale of Black Gold (iv) a $26 ($0.06 per share, basic) loss on the earlyextinguishment of debt and (v) a $20 ($0.05 per share, basic) net gain on the sale of the Martabe project;
Second quarter 2006: none;
First quarter 2006: (i) a $48 ($0.11 per share, basic) net tax benefit from changes in Australia’s functionalcurrency for tax reporting.
NOTE 34 SUBSEQUENT EVENTS
Miramar
In January 2008, Newmont Mining B.C. Limited, an indirect wholly-owned indirect subsidiary ofNewmont, acquired approximately 40 million additional common shares of Miramar Mining Corporation(“Miramar”) at a price of C$6.25 per common share, bringing its interest in Miramar to 96%. This successfullycompleted the offer by Newmont Mining B.C. Limited to acquire all of the outstanding common shares ofMiramar. Newmont has mailed a notice of compulsory acquisition pursuant to the Business Corporations Act(British Columbia) to acquire all the remaining common shares of Miramar that were not acquired pursuant tothe offer. Miramar is a Canadian gold company that controls the Hope Bay Project, a large undeveloped goldproject in Nunavut, Canada. See Note 13 for information on the 2007 acquisition of Miramar common shares.
Contract of Work
See Note 32 for developments relating to the Indonesia Contract of Work.
158

ITEM 9. CHANGES IN AND DISAGREEMENTS WITH ACCOUNTANTS ON ACCOUNTING ANDFINANCIAL DISCLOSURE
None.
ITEM 9A.CONTROLS AND PROCEDURES
During the fiscal period covered by this report, the Company’s management, with the participation of theChief Executive Officer and Chief Financial Officer of the Company, carried out an evaluation of theeffectiveness of the design and operation of the Company’s disclosure controls and procedures (as defined inRules 13a-15(e) and 15d-15(e) of the Securities Exchange Act of 1934, as amended (the “Exchange Act”)).Based on such evaluation, the Company’s Chief Executive Officer and Chief Financial Officer have concludedthat, as of the end of the period covered by this report, the Company’s disclosure controls and procedures areeffective to ensure that information required to be disclosed by the Company in reports that it files or submitsunder the Exchange Act is recorded, processed, summarized and reported within the required time periods andare designed to ensure that information required to be disclosed in its reports is accumulated and communicatedto the Company’s management, including the Chief Executive Officer and Chief Financial Officer, as appropriateto allow timely decisions regarding required disclosure.
There has been no change in the Company’s internal control over financial reporting during the most recentfiscal quarter that has materially affected, or that is reasonably likely to materially affect, the Company’s internalcontrol over financial reporting.
Management’s report on internal control over financial reporting and the attestation report on management’sassessment are included in Item 8 of this annual report on Form 10-K.
ITEM 9B. OTHER INFORMATION
The Company has elected to include the following information in this Form 10-K in lieu of reporting it on aseparately filed Form 8-K. This information would otherwise have been filed on Form 8-K under the heading“Item 5.02 Departure of Directors or Certain Officers; Election of Directors; Appointment of Certain Officers;Compensatory Arrangements of Certain Officers.”
On February 19, 2008, the Company adopted a Senior Executive Compensation Program, covering theChief Executive Officer, the Chief Financial Officer and certain other senior executives of the Company. Underthe program, these senior executives will be awarded financial performance shares, the target amount for whichwill be set at the beginning of the calendar year and will be issued at the end of the year, in an amount modifiedby corporate performance metrics. Financial performance shares will vest in three annual increments. Seniorexecutives will also be eligible, at the discretion of the Company’s Compensation Committee, to receive a cashbonus for achievement of strategic objectives.
The foregoing summary of the Senior Executive Compensation Program is qualified in its entirety byreference to the complete text of the Senior Executive Compensation Program description, which is filedherewith as Exhibit 10.17 and incorporated by reference herein.
The Company also from time to time may grant discretionary cash bonuses to employees for extraordinaryperformance. In December 2007, the Chief Executive Officer, the Chief Financial Officer and other seniorexecutives were granted cash bonuses in recognition of their efforts to achieve proceeds substantially higher thananticipated in the sale of the Company’s royalty portfolio. The Chief Executive Officer and the Chief FinancialOfficer received cash bonuses of $750,000 and $375,000, respectively. A description of the bonuses is includedin the Summary of Executive Compensation, filed herewith as Exhibit 10.35 and incorporated by referenceherein.
159
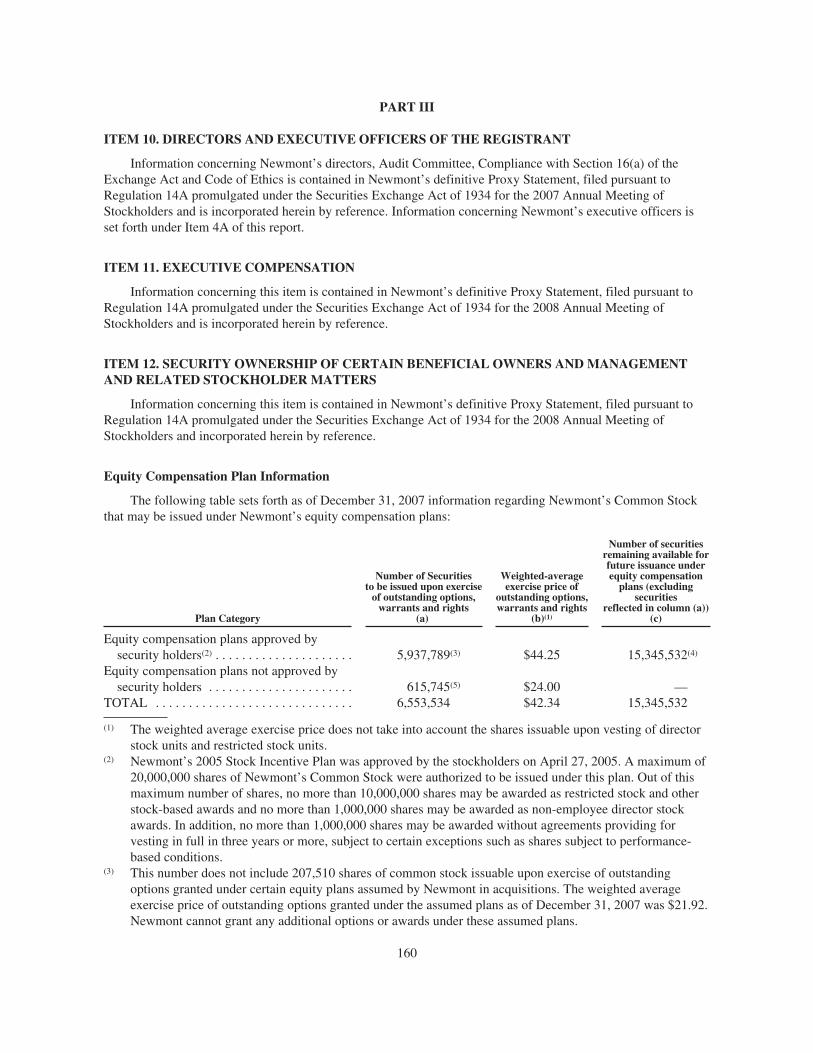
PART III
ITEM 10. DIRECTORS AND EXECUTIVE OFFICERS OF THE REGISTRANT
Information concerning Newmont’s directors, Audit Committee, Compliance with Section 16(a) of theExchange Act and Code of Ethics is contained in Newmont’s definitive Proxy Statement, filed pursuant toRegulation 14A promulgated under the Securities Exchange Act of 1934 for the 2007 Annual Meeting ofStockholders and is incorporated herein by reference. Information concerning Newmont’s executive officers isset forth under Item 4A of this report.
ITEM 11. EXECUTIVE COMPENSATION
Information concerning this item is contained in Newmont’s definitive Proxy Statement, filed pursuant toRegulation 14A promulgated under the Securities Exchange Act of 1934 for the 2008 Annual Meeting ofStockholders and is incorporated herein by reference.
ITEM 12. SECURITY OWNERSHIP OF CERTAIN BENEFICIAL OWNERS AND MANAGEMENTAND RELATED STOCKHOLDER MATTERS
Information concerning this item is contained in Newmont’s definitive Proxy Statement, filed pursuant toRegulation 14A promulgated under the Securities Exchange Act of 1934 for the 2008 Annual Meeting ofStockholders and incorporated herein by reference.
Equity Compensation Plan Information
The following table sets forth as of December 31, 2007 information regarding Newmont’s Common Stockthat may be issued under Newmont’s equity compensation plans:
Plan Category
Number of Securitiesto be issued upon exercise
of outstanding options,warrants and rights
(a)
Weighted-averageexercise price of
outstanding options,warrants and rights
(b)(1)
Number of securitiesremaining available forfuture issuance underequity compensation
plans (excludingsecurities
reflected in column (a))(c)
Equity compensation plans approved bysecurity holders(2) . . . . . . . . . . . . . . . . . . . . . 5,937,789(3) $44.25 15,345,532(4)
Equity compensation plans not approved bysecurity holders . . . . . . . . . . . . . . . . . . . . . . 615,745(5) $24.00 —
TOTAL . . . . . . . . . . . . . . . . . . . . . . . . . . . . . . 6,553,534 $42.34 15,345,532
(1) The weighted average exercise price does not take into account the shares issuable upon vesting of directorstock units and restricted stock units.
(2) Newmont’s 2005 Stock Incentive Plan was approved by the stockholders on April 27, 2005. A maximum of20,000,000 shares of Newmont’s Common Stock were authorized to be issued under this plan. Out of thismaximum number of shares, no more than 10,000,000 shares may be awarded as restricted stock and otherstock-based awards and no more than 1,000,000 shares may be awarded as non-employee director stockawards. In addition, no more than 1,000,000 shares may be awarded without agreements providing forvesting in full in three years or more, subject to certain exceptions such as shares subject to performance-based conditions.
(3) This number does not include 207,510 shares of common stock issuable upon exercise of outstandingoptions granted under certain equity plans assumed by Newmont in acquisitions. The weighted averageexercise price of outstanding options granted under the assumed plans as of December 31, 2007 was $21.92.Newmont cannot grant any additional options or awards under these assumed plans.
160

(4) Securities remaining available for future issuance under the 2005 Stock Incentive Plan. No additional grantsor awards will be made under any of the Company’s other plans.
(5) Shares of common stock issuable upon exercise of outstanding options granted under the 1999 EmployeesStock Plan. Options have a term of 10 years and vest in periods ranging from two to four years. Restrictedstock units awarded under the 1999 Employees Stock Plan are also listed in the table. Restricted stock unitsare awarded to employees in certain foreign jurisdictions. Prior to vesting, a holder of restricted stock unitsdoes not have the right to vote the underlying shares or receive any dividends. The restricted stock units vestin three equal increments over three years. Upon vesting, the holder of restricted stock units is entitled toreceive one share of Newmont common stock for each restricted stock unit and accrued dividends.
ITEM 13. CERTAIN RELATIONSHIPS AND RELATED TRANSACTIONS
Information concerning this item is contained in Newmont’s definitive Proxy Statement, filed pursuant toRegulation 14A promulgated under the Securities Exchange Act of 1934 for the 2008 Annual Meeting ofStockholders and incorporated herein by reference.
ITEM 14. PRINCIPAL ACCOUNTANT FEES AND SERVICES
Information concerning this item is contained in Newmont’s definitive Proxy Statement, filed pursuant toRegulation 14A promulgated under the Securities Exchange Act of 1934 for the 2008 Annual Meeting ofStockholders and incorporated herein by reference.
161

PART IV
ITEM 15. EXHIBITS AND FINANCIAL STATEMENT SCHEDULES
The following documents are filed as a part of this report:
(a) Financial Statements
The Consolidated Financial Statements, together with the report thereon of PricewaterhouseCoopers LLPdated February 19, 2008, are included as part of Item 8, Financial Statements and Supplementary Data,commencing on page 79 above.
Page
Report of Independent Registered Public Accounting Firm . . . . . . . . . . . . . . . . . . . . . . . . . . . . . 80Statements of Consolidated Income . . . . . . . . . . . . . . . . . . . . . . . . . . . . . . . . . . . . . . . . . . . . . . . . 81Consolidated Balance Sheets . . . . . . . . . . . . . . . . . . . . . . . . . . . . . . . . . . . . . . . . . . . . . . . . . . . . . 82Statements of Consolidated Changes in Stockholders’ Equity . . . . . . . . . . . . . . . . . . . . . . . . . . . 83Statements of Consolidated Comprehensive Income . . . . . . . . . . . . . . . . . . . . . . . . . . . . . . . . . . . 84Statements of Consolidated Cash Flows . . . . . . . . . . . . . . . . . . . . . . . . . . . . . . . . . . . . . . . . . . . . 85Notes to Consolidated Financial Statements . . . . . . . . . . . . . . . . . . . . . . . . . . . . . . . . . . . . . . . . . 86
(b) Exhibits
Reference is made to the Exhibit Index beginning on page E-1 hereof.
162

SIGNATURES
Pursuant to the requirements of Section 13 or 15(d) of the Securities Exchange Act of 1934, the registranthas duly caused this Annual Report on Form 10-K to be signed on its behalf by the undersigned, thereunto dulyauthorized.
NEWMONT MINING CORPORATION
By: /s/ BRITT D. BANKS
Britt D. BanksExecutive Vice President, Legal and External Affairs
February 21, 2008
Pursuant to the requirements of the Securities Exchange Act of 1934, this report has been signed below bythe following persons on behalf of the registrant and in the capacities indicated on February 21, 2008.
Signature Title
*Richard T. O’Brien
President, Chief Executive Officer and Director(Principal Executive Officer)
*Russell Ball
Senior Vice President and Chief Financial Officer(Principal Financial Officer)
*Roger P. Johnson
Vice President and Chief Accounting Officer(Principal Accounting Officer)
Glen A. Barton* Director
Vincent A. Calarco* Director
Joseph A. Carrabba* Director
Noreen Doyle* Director
Veronica M. Hagen* Director
Michael S. Hamson* Director
Robert J. Miller* Director
Robin A. Plumbridge* Director
John B. Prescott* Director
Donald C. Roth* Director
James V. Taranik* Director
*By: /s/ BRITT D. BANKS
Britt D. BanksAttorney-in-Fact
S-1

EXHIBIT INDEX
ExhibitNumber Description
1.1 —Underwriting Agreement, dated as of March 17, 2005, among Registrant, Newmont USA Limited,Citigroup Capital Markets Inc. and J.P. Morgan Securities Inc. Incorporated by reference toExhibit 1.1 to Registrant’s Form 8-K filed with the Securities and Exchange Commission onMarch 22, 2005.
1.2 —Underwriting Agreement, dated as of November 30, 2007, among Registrant, Franco-NevadaCorporatin, BMO Nesbitt Burns Inc., UBS Securities Canada Inc., CIBC World Markets Inc.,Citigroup Global Markets Canada Inc., J.P. Morgan Securities Inc., RBC Dominion SecuritiesInc., GMP Securities L.P., Dundee Securities Corporation, Genuity Capital Markets, HSBCSecurities (Canada) Inc., National Bank Financial Inc., Paradigm Capital Inc. and Wellington WestCapital Markets. Incorporated by reference to Exhibit 99.2 to Registrant’s Form 8-K/A filed withthe Securities and Exchange Commission on December 26, 2007.
2.1 —Arrangement Agreement, dated as of November 14, 2001, by and between Franco-Nevada MiningCorporation Limited and Newmont Mining Corporation (now known as “Newmont USALimited”). Incorporated by reference to Exhibit 2.1 to the Registrant’s Form 8-K filed with theSecurities and Exchange Commission on March 1, 2002.
2.2 —Deeds of Undertaking, dated as of November 14, 2001, November 14, 2001, and December 10,2001, by and between Newmont Mining Corporation (now known as “Newmont USA Limited”)and Normandy Mining Limited. Incorporated by reference to Exhibit 2.2 to Registrant’s Form 8-Kfiled with the Securities and Exchange Commission on March 1, 2002.
2.3 —Agreement and Plan of Merger, dated as of January 8, 2002, by and among Newmont MiningCorporation (now known as “Newmont USA Limited”), the Registrant and Delta AcquisitioncoCorp. Incorporated by reference to Exhibit 2.3 to the Registrant’s Form 8-K filed with theSecurities and Exchange Commission on March 1, 2002.
2.4 —Support Agreement dated October 8, 2007, among Registrant, Newmont Mining B.C. Limited andMiramar Mining Corporation. Incorporated by reference to Exhibit 2.1 to Registrant’s Form 8-Kfiled with the Securities and Exchange Commission on October 10, 2007 and Exhibit 7.3 toRegistrant’s Schedule 13D filed with the Securities and Exchange Commission on October 9,2007.
2.5 —Form of Lock-Up Agreement dated October 8, 2007, among Registrant, Newmont Mining B.C.Limited and each of the Officers and Directors of Miramar Mining Corporation. Incorporated byreference to Exhibit 2.2 to Registrant’s Form 8-K filed with the Securities and ExchangeCommission on October 10, 2007 and Exhibit 7.4 to Registrant’s Schedule 13D filed with theSecurities and Exchange Commission on October 9, 2007.
2.6 —Acquisition Agreement, dated November 30, 2007, between Registrant and Franco-NevadaCorporation. Incorporated by reference to Exhibit 99.1 to Registrant’s Form 8-K/A filed with theSecurities and Exchange Commission on December 26, 2007.
3.1 —Certificate of Incorporation of Registrant. Incorporated herein by reference to Appendix F to theRegistrant’s Registration Statement on Form S-4 (File No. 333-76506), filed with the Securitiesand Exchange Commission on January 10, 2002.
3.2 —Certificate of Designations of Special Voting Stock. Incorporated herein by reference to Exhibit3.3 to the Registrant’s Registration Statement on Form 8-A relating to the registration of itscommon stock, filed with the Securities and Exchange Commission on February 15, 2002.
E-1

ExhibitNumber Description
3.3 —Certificate of Amendment to the Certificate of Incorporation of Registrant. Incorporated herein byreference to Exhibit 3.4 to the Registrant’s Registration Statement on Form 8-A relating to theregistration of its common stock, filed with the Securities and Exchange Commission on February15, 2002.
3.4 —Certificate of Designations of $3.25 Convertible Preferred Stock of Registrant. Incorporated hereinby reference to Exhibit 3.6 to the Registrant’s Registration Statement on Form 8-A relating to theregistration of its $3.25 convertible preferred stock, filed with the Securities and ExchangeCommission on February 15, 2002.
3.5 —By-laws of the Registrant as amended and restated effective April 24, 2007, Incorporated byreference to Exhibit 3(1) to Registrant’s Form 10-Q for March 31, 2007, and filed with theSecurities and Exchange Commission on April 27, 2007.
4.1 —Indenture, dated as of March 22, 2005, among Newmont Mining Corporation, Newmont USALimited and Citibank, N.A. Incorporated by reference to Exhibit 4.1 to Registrant’s Form 8-Kfiled with the Securities and Exchange Commission on March 22, 2005.
4.2 —Form of 5.875% Note due 2035 issued pursuant to Indenture, dated as of March 22, 2005, amongRegistrant, Newmont USA Limited and Citibank, N.A. Incorporated by reference to Exhibit 4.2 toRegistrant’s Form 8-K filed with the Securities and Exchange Commission on March 22, 2005.
4.3 —Indenture, dated as of July 17, 2007, among Registrant, Newmont USA Limited and The Bank ofNew York Trust Company, N.A. relating to 1.250% Convertible Senior Notes due 2014.Incorporated by reference to Exhibit 4.1 to Registrant’s Quarterly Report on Form 10-Q for theperiod June 30, 2007, filed with the Securities and Exchange Commission on August 2, 2007.
4.4 —Indenture, dated as of July 17, 2007, among Registrant, Newmont USA Limited and The Bank ofNew York Trust Company, N.A relating to 1.625% Convertible Senior Notes due 2017.Incorporated by reference to Exhibit 4.2 to Registrant’s Quarterly Report on Form 10-Q for theperiod June 30, 2007, filed with the Securities and Exchange Commission on August 2, 2007.
4.5 —Registration Rights Agreement among Registrant, Newmont (USA) Limited, as Guarantor, andJ.P. Morgan Securities Inc. and Citigroup Global Markets Inc., dated July 17, 2007 relating to1.250% Convertible Senior Notes due 2014 and 1.625% Convertible Senior Notes due 2017.Incorporated by reference to Exhibit 4.3 to Registrant’s Quarterly Report on Form 10-Q for theperiod June 30, 2007, filed with the Securities and Exchange Commission on August 2, 2007.
4.6 —Pass Through Trust Agreement dated as of July 15, 1994, between Newmont Gold Company (nowknown as “Newmont USA Limited”) and The First National Bank of Chicago relating to the PassThrough Certificates, Series 1994-A1. (The front cover of this Exhibit indicates the materialdifferences between such Exhibit and the substantially similar (except for price-relatedinformation) Pass-Through Agreement between Newmont Gold Company (now known as“Newmont USA Limited”) and The First National Bank of Chicago relating to the Pass-ThroughCertificates, Series 1994-A2.) Incorporated by reference to Exhibit 4.1 to Newmont GoldCompany’s Quarterly Report on Form 10-Q for the quarter ended September 30, 1994.
4.7 —Lease dated as of September 30, 1994, between Newmont Gold Company (now known as“Newmont USA Limited”) and Shawmut Bank Connecticut, National Association relating to TrustNo. 1 and a 75% undivided interest in Newmont Gold Company’s refractory gold ore treatmentfacility. (The front cover of this Exhibit indicates the material differences between such Exhibitand the substantially similar (except for price-related information) entered into on the same daterelating to the remaining 25% undivided interest in the facility.) Incorporated by reference toExhibit 4.2 to Newmont Gold Company’s Quarterly Report on Form 10-Q for the quarter endedSeptember 30, 1994.
E-2
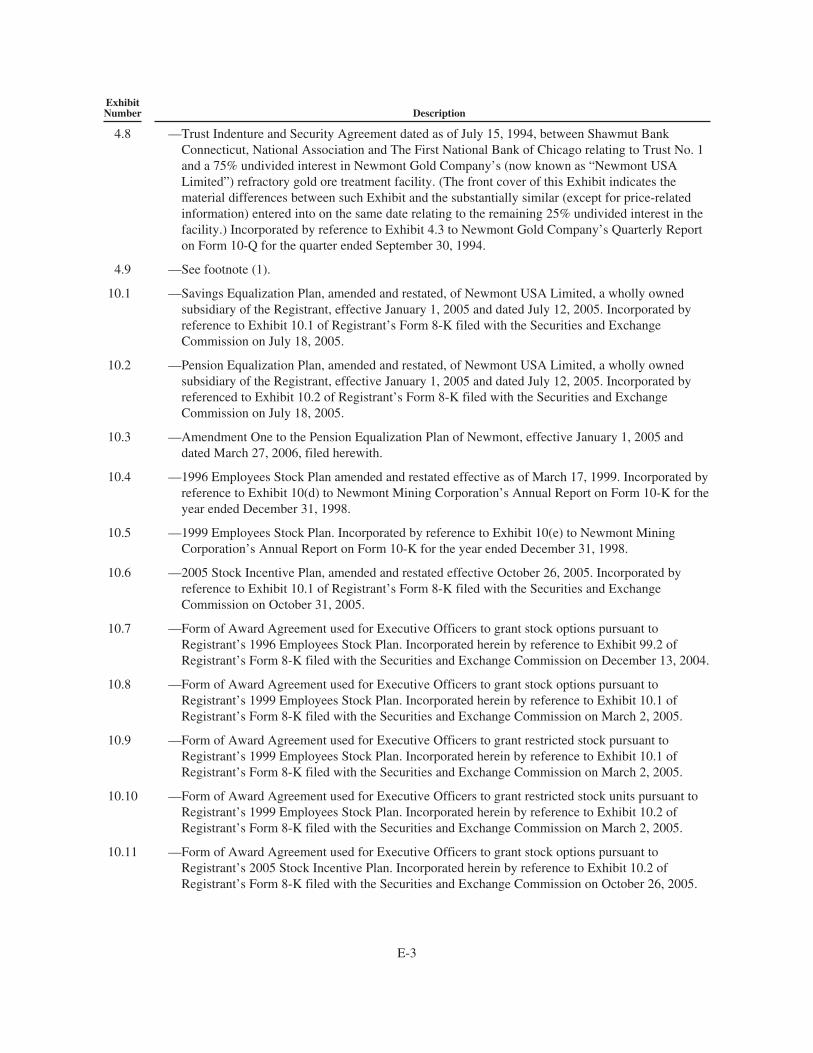
ExhibitNumber Description
4.8 —Trust Indenture and Security Agreement dated as of July 15, 1994, between Shawmut BankConnecticut, National Association and The First National Bank of Chicago relating to Trust No. 1and a 75% undivided interest in Newmont Gold Company’s (now known as “Newmont USALimited”) refractory gold ore treatment facility. (The front cover of this Exhibit indicates thematerial differences between such Exhibit and the substantially similar (except for price-relatedinformation) entered into on the same date relating to the remaining 25% undivided interest in thefacility.) Incorporated by reference to Exhibit 4.3 to Newmont Gold Company’s Quarterly Reporton Form 10-Q for the quarter ended September 30, 1994.
4.9 —See footnote (1).
10.1 —Savings Equalization Plan, amended and restated, of Newmont USA Limited, a wholly ownedsubsidiary of the Registrant, effective January 1, 2005 and dated July 12, 2005. Incorporated byreference to Exhibit 10.1 of Registrant’s Form 8-K filed with the Securities and ExchangeCommission on July 18, 2005.
10.2 —Pension Equalization Plan, amended and restated, of Newmont USA Limited, a wholly ownedsubsidiary of the Registrant, effective January 1, 2005 and dated July 12, 2005. Incorporated byreferenced to Exhibit 10.2 of Registrant’s Form 8-K filed with the Securities and ExchangeCommission on July 18, 2005.
10.3 —Amendment One to the Pension Equalization Plan of Newmont, effective January 1, 2005 anddated March 27, 2006, filed herewith.
10.4 —1996 Employees Stock Plan amended and restated effective as of March 17, 1999. Incorporated byreference to Exhibit 10(d) to Newmont Mining Corporation’s Annual Report on Form 10-K for theyear ended December 31, 1998.
10.5 —1999 Employees Stock Plan. Incorporated by reference to Exhibit 10(e) to Newmont MiningCorporation’s Annual Report on Form 10-K for the year ended December 31, 1998.
10.6 —2005 Stock Incentive Plan, amended and restated effective October 26, 2005. Incorporated byreference to Exhibit 10.1 of Registrant’s Form 8-K filed with the Securities and ExchangeCommission on October 31, 2005.
10.7 —Form of Award Agreement used for Executive Officers to grant stock options pursuant toRegistrant’s 1996 Employees Stock Plan. Incorporated herein by reference to Exhibit 99.2 ofRegistrant’s Form 8-K filed with the Securities and Exchange Commission on December 13, 2004.
10.8 —Form of Award Agreement used for Executive Officers to grant stock options pursuant toRegistrant’s 1999 Employees Stock Plan. Incorporated herein by reference to Exhibit 10.1 ofRegistrant’s Form 8-K filed with the Securities and Exchange Commission on March 2, 2005.
10.9 —Form of Award Agreement used for Executive Officers to grant restricted stock pursuant toRegistrant’s 1999 Employees Stock Plan. Incorporated herein by reference to Exhibit 10.1 ofRegistrant’s Form 8-K filed with the Securities and Exchange Commission on March 2, 2005.
10.10 —Form of Award Agreement used for Executive Officers to grant restricted stock units pursuant toRegistrant’s 1999 Employees Stock Plan. Incorporated herein by reference to Exhibit 10.2 ofRegistrant’s Form 8-K filed with the Securities and Exchange Commission on March 2, 2005.
10.11 —Form of Award Agreement used for Executive Officers to grant stock options pursuant toRegistrant’s 2005 Stock Incentive Plan. Incorporated herein by reference to Exhibit 10.2 ofRegistrant’s Form 8-K filed with the Securities and Exchange Commission on October 26, 2005.
E-3

ExhibitNumber Description
10.12 —Form of Award Agreement used for Executive Officers to grant restricted stock pursuant toRegistrant’s 2005 Stock Incentive Plan. Incorporated herein by reference to Exhibit 10.3 ofRegistrant’s Form 8-K filed with the Securities and Exchange Commission on October 26, 2005.
10.13 —Form of Award Agreement For Richard O’Brien to grant restricted stock pursuant to Registrant’s2005 Stock Incentive Plan. Incorporated herein by reference to Exhibit 10.2 to Registrant’sForm 10-Q for the period March 31, 2007, filed with the Securities and Exchange Commission onApril 27, 2007.
10.14 —Form of Award Agreement used for non-employee directors to grant director stock units pursuantto the 2005 Stock Incentive Plan. Incorporated herein by reference to Exhibit 10.1 of Registrant’sForm 8-K filed with the Securities and Exchange Commission on June 17, 2005.
10.15 —Annual Incentive Compensation Payroll Practice of the Registrant, amended and restated effectiveJanuary 1, 2007. Incorporated by reference to Exhibit 10.33 to Registrant’s Form 10-Q for theperiod June 30, 2007, filed with the Securities and Exchange Commission on August 2, 2007.
10.16 —Employee Performance Incentive Compensation Payroll Practice of Registrant, amended andrestated effective January 1, 2007. Incorporated herein by reference to Exhibit 10.33 toRegistrant’s Form 10-Q for the period June 30, 2007, filed with the Securities and ExchangeCommission on August 2, 2007.
10.17 —Senior Executive Compensation Program effective as of January 1, 2008, filed herewith.
10.18 —Amended and Restated Officers’ Death Benefit Plan effective January 1, 2004 of Newmont USALimited, a wholly owned subsidiary of Registrant. Incorporated herein by reference to Exhibit 10.1to Registrant’s Form 8-K filed with the Securities and Exchange Commission on December 22,2004.
10.19 —Amended and Restated Executive Change of Control Plan effective January 1, 2004 of NewmontUSA Limited, a wholly owned subsidiary of Registrant. Incorporated herein by reference toExhibit 10.2 of Registrant’s Form 8-K filed with the Securities and Exchange Commission onDecember 22, 2004.
10.20 —Newmont Mining Corporation 2000 Non-Employee Directors Stock Plan, as Amended andRestated as of May 17, 2000. Incorporated by reference to Exhibit 10 to Newmont MiningCorporation’s Quarterly Report on Form 10-Q for the quarter ended September 30, 2000.
10.21 —Agreement dated February 1, 1999, among Newmont Mining Corporation, Newmont GoldCompany and certain executive officers. Incorporated by reference to Exhibit 10(b) to NewmontMining Corporation’s Quarterly Report on Form 10-Q for the quarter ended March 31, 1999.
10.22 —Letter Agreement dated May 6, 1993, between Newmont Gold Company and Wayne W. Murdy.Incorporated by reference to Exhibit 10 to Newmont Gold Company’s Quarterly Report on Form10-Q for the quarter ended March 31, 1993.
10.23 —Letter Agreement dated March 23, 2001, between Wayne W. Murdy and Newmont MiningCorporation. Incorporated by reference as Exhibit 10(v) to Newmont Mining Corporation’sAnnual Report on Form 10-K for the year ended December 31, 2000.
10.24 —Amendment to Employment Agreement effective July 28, 2005 between Newmont MiningCorporation and Wayne W. Murdy. Incorporated by reference to Exhibit 10.2 to Registrant’sQuarterly Report on 10-Q, for the period June 30, 2005, filed with the Securities and ExchangeCommission on August 1, 2005.
10.25 —Employment Agreement effective January 1, 2007 between Newmont Global EmploymentLimited Partnership and Pierre Lassonde, filed herewith.
E-4

ExhibitNumber Description
10.26 —Consulting Agreement effective May 1, 2007 between Newmont Mining Corporation of CanadaLimited and Pierre Lassonde, filed herewith.
10.27 —Consulting Agreement effective as of April 1, 2002, between Newmont Capital Limited andSeymour Schulich. Incorporated by reference as Exhibit 10(x) to Newmont Mining Corporation’sAnnual Report on Form 10-K for the year ended December 31, 2002.
10.28 —Amendment to Consulting Agreement effective as of April 1, 2005 and dated December 7, 2004,between Newmont Capital Limited and Seymour Schulich. Incorporated by reference as Exhibit99.1 to Registrant’s Form 8-K filed with the Securities and Exchange Commission onDecember 13, 2004.
10.29 —Amendment No. 2 to Consulting Agreement effective July 28, 2005, between Newmont CapitalLimited and Seymour Schulich. Incorporated by reference to Exhibit 10.5 to Registrant’sForm 10-Q for the period June 30, 2005, filed with the Securities and Exchange Commission onAugust 1, 2005.
10.30 —Amendment to Consulting Agreement dated October 31, 2005, and effective as of April 26, 2006,between Newmont Capital Limited and Seymour Schulich. Incorporated by reference as Exhibit10.5 to Registrant’s Form 8-K filed with the Securities and Exchange Commission on October 31,2005.
10.31 —Credit Agreement dated as of July 30, 2004, as amended and restated as of July 28, 2005, asamended and restated April 24, 2007, among Newmont Mining Corporation, Newmont USALimited, JP Morgan Chase Bank, N.A., Australia and New Zealand Banking Group Limited,Banco Bilbao Vizcaya SA, Bank of Montreal Chicago Branch, The Bank of Nw York, The Bankof Nova Scotia, The Bank of Tokyo-Mitsubishi, Ltd., BNP Paribas, Calyon New York Branch,CIBC Inc., Citicorp USA Inc., Commonwealth Bank of Australia New York Branch, DeutscheBank AG New York Branch, HSBC Bank USA, National Association, Mizuho Corporate Bank,Ltd., Royal Bank of Canada, The Royal Bank of Scotland, plc, Societe Generale, Sumitomo MitsuiBanking Corporation, UBS Loan Finance LLC, US Bank N.A. Incorporated by reference asExhibit 10.1 to Registrant’s Quarterly Report on Form 10-Q for the period March 31, 2007, filedwith the Securities and Exchange Commission on April 27, 2007.
10.32 —Canadian Oil Sands Trust (“COST”) Agreement as of May 10, 2004 between Pierre Lassonde andNewmont Mining Corporation. Incorporated by reference as Exhibit 10(w) to Registrant’s AnnualReport on Form 10-K for the period December 31, 2004, filed with the Securities and ExchangeCommission on March 15, 2005.
10.33 —Canadian Oil Sands Trust (“COST”) Agreement as of May 10, 2004 between Seymour Schulichand Newmont Mining Corporation. Incorporated by reference as Exhibit 10(x) to Registrant’sAnnual Report on Form 10-K for the period December 31, 2004, filed with the Securities andExchange Commission on March 15, 2005.
10.34 —Summary of Non-Employee Director Compensation and Benefits filed herewith.
10.35 —Summary of Executive Compensation, filed herewith.
10.36 —Purchase Agreement, dated as of July 11, 2007, by and among Newmont Mining Corporation,Newmont USA Limited and J.P. Morgan Securities Inc. and Citigroup Global Markets Inc., asRepresentatives of the several Initial Purchasers listed in Schedule I thereto. Incorporated byreference as Exhibit 10.1 to Registrant’s Form 10-Q for the period June 30, 2007, filed with theSecurities and Exchange Commission on August 2, 2007.
E-5

ExhibitNumber Description
10.37 —Confirmation of Convertible Note Hedge, dated as of July 11, 2007, between Newmont MiningCorporation and JPMorgan Chase Bank, National Association, London Branch (with respect to2014 Notes). Incorporated by reference as Exhibit 10.2 to Registrant’s Form 10-Q for the periodJune 30, 2007, filed with the Securities and Exchange Commission on August 2, 2007.
10.38 —Confirmation of Convertible Note Hedge, dated as of July 11, 2007, between Newmont MiningCorporation and JPMorgan Chase Bank, National Association, London Branch (with respect to2017 Notes). Incorporated by reference as Exhibit 10.3 to Registrant’s Form 10-Q for the periodJune 30, 2007, filed with the Securities and Exchange Commission on August 2, 2007.
10.39 —Confirmation of Convertible Note Hedge, dated as of July 11, 2007, between Newmont MiningCorporation and Citibank, N.A. (with respect to 2014 Notes). Incorporated by reference as Exhibit10.4 to Registrant’s Form 10-Q for the period June 30, 2007, filed with the Securities andExchange Commission on August 2, 2007. 2007.
10.40 —Confirmation of Convertible Note Hedge, dated as of July 11, 2007, between Newmont MiningCorporation and Citibank, N.A. (with respect to 2017 Notes). Incorporated by reference as Exhibit10.5 to Registrant’s Form 10-Q for the period June 30, 2007, filed with the Securities andExchange Commission on August 2, 2007.
10.41 —Confirmation of Convertible Note Hedge, dated as of July 11, 2007, between Newmont MiningCorporation and UBS AG, London Branch (with respect to 2014 Notes). Incorporated by referenceas Exhibit 10.6 to Registrant’s Form 10-Q for the period June 30, 2007, filed with the Securitiesand Exchange Commission on August 2, 2007.
10.42 —Confirmation of Convertible Note Hedge, dated as of July 11, 2007, between Newmont MiningCorporation and UBS AG, London Branch (with respect to 2017 Notes). Incorporated by referenceas Exhibit 10.7 to Registrant’s Form 10-Q for the period June 30, 2007, filed with the Securitiesand Exchange Commission on August 2, 2007.
10.43 —Confirmation of Convertible Note Hedge, dated as of July 11, 2007, between Newmont MiningCorporation and Deutsche Bank AG, London Branch (with respect to 2014 Notes). Incorporatedby reference as Exhibit 10.8 to Registrant’s Form 10-Q for the period June 30, 2007, filed with theSecurities and Exchange Commission on August 2, 2007.
10.44 —Confirmation of Convertible Note Hedge, dated as of July 11, 2007, between Newmont MiningCorporation and Deutsche Bank AG, London Branch (with respect to 2017 Notes). Incorporatedby reference as Exhibit 10.9 to Registrant’s Form 10-Q for the period June 30, 2007, filed with theSecurities and Exchange Commission on August 2, 2007.
10.45 —Confirmation of Convertible Note Warrant Transaction, dated as of July 11, 2007, betweenNewmont Mining Corporation and JPMorgan Chase Bank, National Association, London Branch(with respect to 2014 Notes). Incorporated by reference as Exhibit 10.10 to Registrant’sForm 10-Q for the period June 30, 2007, filed with the Securities and Exchange Commission onAugust 2, 2007.
10.46 —Confirmation of Convertible Note Warrant Transaction, dated as of July 11, 2007, betweenNewmont Mining Corporation and JPMorgan Chase Bank, National Association, London Branch(with respect to 2017 Notes). Incorporated by reference as Exhibit 10.11 to Registrant’sForm 10-Q for the period June 30, 2007, filed with the Securities and Exchange Commission onAugust 2, 2007.
10.47 —Confirmation of Convertible Note Warrant Transaction, dated as of July 11, 2007, betweenNewmont Mining Corporation and Citibank, N.A. (with respect to 2014 Notes). Incorporated byreference as Exhibit 10.12 to Registrant’s Form 10-Q for the period June 30, 2007, filed with theSecurities and Exchange Commission on August 2, 2007.
E-6

ExhibitNumber Description
10.48 —Confirmation of Convertible Note Warrant Transaction, dated as of July 11, 2007, betweenNewmont Mining Corporation and Citibank, N.A. (with respect to 2017 Notes). Incorporated byreference as Exhibit 10.13 to Registrant’s Form 10-Q for the period June 30, 2007, filed with theSecurities and Exchange Commission on August 2, 2007.
10.49 —Confirmation of Convertible Note Warrant Transaction, dated as of July 11, 2007, betweenNewmont Mining Corporation and UBS AG, London Branch (with respect to 2014 Notes).Incorporated by reference as Exhibit 10.14 to Registrant’s Form 10-Q for the period June 30,2007, filed with the Securities and Exchange Commission on August 2, 2007.
10.50 —Confirmation of Convertible Note Warrant Transaction, dated as of July 11, 2007, betweenNewmont Mining Corporation and UBS AG, London Branch (with respect to 2017 Notes).Incorporated by reference as Exhibit 10.15 to Registrant’s Form 10-Q for the period June 30,2007, filed with the Securities and Exchange Commission on August 2, 2007.
10.51 —Confirmation of Convertible Note Warrant Transaction, dated as of July 11, 2007, betweenNewmont Mining Corporation and Deutsche Bank AG, London Branch (with respect to 2014Notes). Incorporated by reference as Exhibit 10.16 to Registrant’s Form 10-Q for the period June30, 2007, filed with the Securities and Exchange Commission on August 2, 2007.
10.52 —Confirmation of Convertible Note Warrant Transaction, dated as of July 11, 2007, betweenNewmont Mining Corporation and Deutsche Bank AG, London Branch (with respect to 2017Notes). Incorporated by reference as Exhibit 10.17 to Registrant’s on Form 10-Q for the periodJune 30, 2007, filed with the Securities and Exchange Commission on August 2, 2007.
10.53 —Confirmation of Convertible Note Hedge, dated as of July 13, 2007, between Newmont MiningCorporation and JPMorgan Chase Bank, National Association, London Branch (with respect to2014 Notes). Incorporated by reference as Exhibit 10.18 to Registrant’s Form 10-Q for the periodJune 30, 2007, filed with the Securities and Exchange Commission on August 2, 2007.
10.54 —Confirmation of Convertible Note Hedge, dated as of July 13, 2007, between Newmont MiningCorporation and JPMorgan Chase Bank, National Association, London Branch (with respect to2017 Notes). Incorporated by reference as Exhibit 10.19 to Registrant’s Form 10-Q for the periodJune 30, 2007, filed with the Securities and Exchange Commission on August 2, 2007.
10.55 —Confirmation of Convertible Note Hedge, dated as of July 13, 2007, between Newmont MiningCorporation and Citibank, N.A. (with respect to 2014 Notes). Incorporated by reference as Exhibit10.20 to Registrant’s Form 10-Q for the period June 30, 2007, filed with the Securities andExchange Commission on August 2, 2007.
10.56 —Confirmation of Convertible Note Hedge, dated as of July 13, 2007, between Newmont MiningCorporation and Citibank, N.A. (with respect to 2017 Notes). Incorporated by reference as Exhibit10.21 to Registrant’s Form 10-Q for the period June 30, 2007, filed with the Securities andExchange Commission on August 2, 2007.
10.57 —Confirmation of Convertible Note Hedge, dated as of July 13, 2007, between Newmont MiningCorporation and UBS AG, London Branch (with respect to 2014 Notes). Incorporated by referenceas Exhibit 10.22 to Registrant’s Form 10-Q for the period June 30, 2007, filed with the Securitiesand Exchange Commission on August 2, 2007.
10.58 —Confirmation of Convertible Note Hedge, dated as of July 13, 2007, between Newmont MiningCorporation and UBS AG, London Branch (with respect to 2017 Notes). Incorporated by referenceas Exhibit 10.23 to Registrant’s Form 10-Q for the period June 30, 2007, filed with the Securitiesand Exchange Commission on August 2, 2007.
E-7
ExhibitNumber Description
10.59 —Confirmation of Convertible Note Hedge, dated as of July 13, 2007, between Newmont MiningCorporation and Deutsche Bank AG, London Branch (with respect to 2014 Notes). Incorporatedby reference as Exhibit 10.24 to Registrant’s Form 10-Q for the period June 30, 2007, filed withthe Securities and Exchange Commission on August 2, 2007.
10.60 —Confirmation of Convertible Note Hedge, dated as of July 13, 2007, between Newmont MiningCorporation and Deutsche Bank AG, London Branch (with respect to 2017 Notes). Incorporatedby reference as Exhibit 10.25 to Registrant’s Form 10-Q for the period June 30, 2007, filed withthe Securities and Exchange Commission on August 2, 2007.
10.61 —Confirmation of Convertible Note Warrant Transaction, dated as of July 13, 2007, betweenNewmont Mining Corporation and JPMorgan Chase Bank, National Association, London Branch(with respect to 2014 Notes). Incorporated by reference as Exhibit 10.26 to Registrant’sForm 10-Q for the period June 30, 2007, filed with the Securities and Exchange Commission onAugust 2, 2007.
10.62 —Confirmation of Convertible Note Warrant Transaction, dated as of July 13, 2007, betweenNewmont Mining Corporation and JPMorgan Chase Bank, National Association, London Branch(with respect to 2017 Notes). Incorporated by reference as Exhibit 10.27 to Registrant’sForm 10-Q for the period June 30, 2007, filed with the Securities and Exchange Commission onAugust 2, 2007.
10.63 —Confirmation of Convertible Note Warrant Transaction, dated as of July 13, 2007, betweenNewmont Mining Corporation and Citibank, N.A. (with respect to 2014 Notes). Incorporated byreference as Exhibit 10.28 to Registrant’s Form 10-Q for the period June 30, 2007, filed with theSecurities and Exchange Commission on August 2, 2007.
10.64 —Confirmation of Convertible Note Warrant Transaction, dated as of July 13, 2007, betweenNewmont Mining Corporation and Citibank, N.A. (with respect to 2017 Notes). Incorporated byreference as Exhibit 10.29 to Registrant’s Form 10-Q for the period June 30, 2007, filed with theSecurities and Exchange Commission on August 2, 2007.
10.65 —Confirmation of Convertible Note Warrant Transaction, dated as of July 13, 2007, betweenNewmont Mining Corporation and UBS AG, London Branch (with respect to 2014 Notes).Incorporated by reference as Exhibit 10.30 to Registrant’s Form 10-Q for the period June 30,2007, filed with the Securities and Exchange Commission on August 2, 2007.
10.66 —Confirmation of Convertible Note Warrant Transaction, dated as of July 13, 2007, betweenNewmont Mining Corporation and UBS AG, London Branch (with respect to 2017 Notes).Incorporated by reference as Exhibit 10.31 to Registrant’s Form 10-Q for the period June 30,2007, filed with the Securities and Exchange Commission on August 2, 2007.
10.67 —Confirmation of Convertible Note Warrant Transaction, dated as of July 13, 2007, betweenNewmont Mining Corporation and Deutsche Bank AG, London Branch (with respect to 2014Notes). Incorporated by reference as Exhibit 10.32 to Registrant’s Form 10-Q for the period June30, 2007, filed with the Securities and Exchange Commission on August 2, 2007.
10.68 —Confirmation of Convertible Note Warrant Transaction, dated as of July 13, 2007, betweenNewmont Mining Corporation and Deutsche Bank AG, London Branch (with respect to 2017Notes). Incorporated by reference as Exhibit 10.33 to Registrant’s Form 10-Q for the period June30, 2007, filed with the Securities and Exchange Commission on August 2, 2007.
10.69 —Office Space and Office Services Agreement between Newmont (USA) Limited and Wayne W.Murdy effective January 1, 2008. Incorporated by reference as Exhibit 10.37 to Registrant’s Form10-Q for the period June 30, 2007, filed with the Securities and Exchange Commission on August2, 2007.
E-8

ExhibitNumber Description
12.1 —Statement re Computation of Ratio of Earnings to Fixed Charges, filed herewith.
21 —Subsidiaries of Newmont Mining Corporation, filed herewith.
23.1 —Consent of PricewaterhouseCoopers LLP, filed herewith.
24 —Power of Attorney, filed herewith.
31.1 —Certification Pursuant to Rule 13A-14 or 15D-14 of the Securities Exchange Act of 1934, asadopted pursuant to Section 302 of the Sarbanes-Oxley Act of 2002 signed by the PrincipalExecutive Officer, filed herewith.
31.2 —Certification Pursuant to Rule 13A-14 or 15D-14 of the Securities Exchange Act of 1934, asadopted pursuant to Section 302 of the Sarbanes-Oxley Act of 2002 signed by the PrincipalFinancial Officer, filed herewith.
32.1 —Statement Required by 18 U.S.C. Section 1350, as Adopted Pursuant to Section 906 of theSarbanes-Oxley Act of 2002 signed by Principal Executive Officer, furnished herewith.
32.2 —Statement Required by 18 U.S.C. Section 1350, as Adopted Pursuant to Section 906 of theSarbanes-Oxley Act of 2002 signed by Chief Financial Officer, furnished herewith.
(1) In reliance upon Item 601(b)(4)(iii) of Regulation S-K, various instruments defining the rights of holders oflong-term debt of the Newmont Mining Corporation are not being filed herewith because the total ofsecurities authorized under each such instrument does not exceed 10% of the total assets of NewmontMining Corporation. Newmont Mining Corporation hereby agrees to furnish a copy of any such instrumentto the Commission upon request.
E-9

Quarterly Common Stock Information
First Quarter Second Quarter Third Quarter Fourth Quarter2007 2006 2007 2006 2007 2006 2007 2006
High $47.71 $61.95 $45.00 $58.43 $48.26 $55.52 $54.50 $47.57
Low $41.42 $47.79 $38.53 $47.72 $39.44 $42.75 $44.75 $40.83
Close $41.99 $51.89 $39.06 $52.93 $44.73 $42.75 $48.83 $45.15
Average Daily 7.0 7.7 7.0 8.0 10.1 6.5 7.9 6.7Volume (million)
Dividend per $0.10 $0.10 $0.10 $0.10 $0.10 $0.10 $0.10 $0.10Share Paid
Shareholder Information
2007 ANNUAL REPORT 10
Transfer AgentsPlease contact the respective agent acting as transfer agent, registrar and dividend disbursingagent for Newmont for the securities listed below.Information regarding shareholder accounts, dividend payments, change of address, direct registration system (DRS), stock transfer and related matters for the respective securities should be directed to the transfer agent listed.
For holders of Newmont
Common Stock (NYSE: NEM)
Address: BNY Mellon Shareowner Services 480 Washington Blvd.Jersey City, NJ 07310-1900
Toll-free: (888) 216-8104(between 8:00 a.m. and 7:00 p m. Eastern Time)Telephone: (201) 680-6578 Internet: www.bnymellon.com/shareowner/isdE-mail: [email protected]
For holders of Newmont
Exchangeable Shares (TSX: NMC)
Address: Computershare Investor Services Inc.100 University Avenue, 9th FloorToronto, Ontario M5J 2Y1, Canada
Toll-free: (800) 564-6253Telephone: (514) 982-7555E-mail: [email protected]
For holders of Newmont
CHESS Depository Interests (CDIs trading on ASX: NEM)
Address: Computershare Investor Services Pty LimitedLevel 5, 115 Grentell StreetAdelaide 5000, South Australia, Australia
Telephone: 1300656171 (within Australia)+61 39154699 (overseas)
E-mail: [email protected]
.
Payment of Dividends
Newmont paid quarterly dividends per share in 2007 on its Common Stock and NewmontMining Corporation of Canada LimitedExchangeable Shares as shown in the table above.
Beneficial owners of Newmont CHESSDepository Interests receive dividends on a 10-for-one basis.
The Company currently intends to pay dividendson a quarterly basis in 2008 in such amount asdetermined by the Board of Directors.
Annual Meeting of Stockholders
The 2008 annual meeting of stockholders ofNewmont Mining Corporation will be held at1:00 p.m. on Wednesday, April 23, 2008 in the DuBarry Room, Hotel Du Pont, 11th andMarket Streets, Wilmington, Delaware USA.
Investor RelationsCorporate Headquarters1700 Lincoln StreetDenver, Colorado USA 80203www.newmont.com(303) 863-7414

NEWMONT MINING CORPORATION
1700 Lincoln Street
Denver, Colorado 80203
USA
Telephone: 303.863.7414
Facsimile: 303.837.5837
Website: www.newmont.com