NEW ZEALAND POPULATION REVIEW · · 2017-04-20NEW ZEALAND POPULATION REVIEW Vol 35 2009 ARTICLES...
166
NEW ZEALAND POPULATION REVIEW Volume 35 2009 Editors W. Friesen A. Zodgekar A. Reid PANZ Population Association of New Zealand
-
Upload
trankhuong -
Category
Documents
-
view
217 -
download
1
Transcript of NEW ZEALAND POPULATION REVIEW · · 2017-04-20NEW ZEALAND POPULATION REVIEW Vol 35 2009 ARTICLES...

NEW ZEALAND POPULATION
REVIEW
Volume 35 2009
Editors
W. Friesen A. Zodgekar
A. Reid
PANZ Population Association of New Zealand

Population Association of New Zealand Te Roopu Waihanga Iwi o Aotearoa
A forum for the discussion, study and promotion of
population issues in New Zealand
2010/11 Council President: Alison Reid Hon. Secretary: Adele Quinn Hon. Treasurer: Anne Henderson Mike Berry Kim Dunstan Ward Friesen Natalie Jackson
Tahu Kukutai Cyril Mako James Newell Arvind Zodgekar
Membership Provides
access to a network of individuals and organisations interested and active in population matters
opportunity to contribute and participate in the Association’s
activities, including a biennial conference
access to information through the Association’s publications, including the Population Review
New Members are Welcome For further details go to our website: www.population.org.nz Membership Fees for the 2010/2011 Year:
Ordinary Member: $45.00 Associate Member (students and unwaged): $20.00 Publication Member (libraries & other organisations within NZ): $65.00 Publication Member (libraries & other organisations Overseas): $100.00 Corporate Subscriptions $100.00

NEW ZEALAND POPULATION REVIEW Vol 35 2009 ARTICLES A Demographer’s Demographer: Arvind Zodgekar
PHIL MORRISON
Differential Trends in the Compression of Mortality: Assessing the Antecedents to Current Gaps in Health Expectancy in New Zealand
IAN POOL, BILL BODDINGTON, JIT CHEUNG, ROBERT DIDHAM, BEN AMEY
The Demographic Transformation of Inner City Auckland
WARDLOW FRIESEN
Too Early to Retire? Growing Participation of Older New Zealanders in the Labour Force
MANSOOR KHAWAJA, BILL BODDINGTON
Reading Engagement and Literacy for Men and Women
ELLIOT LAWES
Paid Caregivers in New Zealand: Current Supply and Future Demand
JUTHIKA BADKAR, RICHARD MANNING
RESEARCH NOTES Procreate and Cherish: A Note on Australia’s Abrupt Shift to Pro-Natalism
NATALIE JACKSON, AMINA CASEY
Ethnicity in Recent Birth Registration Data
BILL BODDINGTON, ROBERT DIDHAM
1
23
55
75
95
113
129
149

Editors Wardlow Friesen Arvind Zodgekar Alison Reid Contact Address: Dr. Wardlow Friesen School of Environment The University of Auckland Private Bag 92019 Auckland Email: [email protected] Production and editing Alison Reid Email: [email protected] © 2009 Population Association of New Zealand ISSN 0111-199X (Print) ISSN 1179-8149 (Online)

New Zealand Population Review, 35:1-22. Copyright © 2009 Population Association of New Zealand
A Demographer’s Demographer: Arvind Zodgekar
PHILIP S. MORRISON *
Abstract
For 35 years between 1973 and 2007 Dr Arvind Zodgekar taught demography and research methods within the Sociology and Social Policy Programme at Victoria University of Wellington. During that time he imbued thousands of students and dozens of staff with the excitement and relevance of demography. Much of the understanding and appreciation of population matters that is present throughout New Zealand in local and national government, and in private enterprise, results from his teaching. Others learned about demography through the radio, television and the print media. Arvind’s clarity and rigour is matched only by his modesty and genuine concern for others and their understanding. Through a review of Arvind’s research on populations in India, the United Kingdom, the United States of America, Canada, Australia and New Zealand we begin to appreciate the extensive coverage he gave to the key aspects of demography, fertility and mortality, and most recently to immigration. Entirely reliable, meticulous and relevant, Arvind’s writing laid down a mantle of scholarship upon which future generations can build with confidence. It now remains for the New Zealand university system to recognise the value of appointing mathematically trained demographers so that we can continue to understand ourselves through our population.
ne of the last of the formally trained demographers of his generation retired from the New Zealand university system in July 2007 after a long and fruitful career at Victoria University of
Wellington (VUW). For 35 years Dr Arvind Zodgekar taught demography and research methods within the Sociology and Social Policy programme: Population Studies at 200 level and Demography at 300 level, as well as Honours. He also co-taught a 300 level Sociology Research Methods course in which students had the opportunity to undertake a supervised research
* School of Geography, Environment and Earth Sciences at Victoria University of
Wellington. Email: [email protected]
O

2 Morrison
project. Many students have commented on the value of this course to them in their later careers.
It was not only students who benefited from Arvind’s expertise. During his time at VUW he worked with a range of social scientists, many of whom focused on qualitative data. He was especially valued for the contribution he made to their research and in demonstrating how a demographic dimension could strengthen and develop their arguments. In his role as resident demographer Arvind was always very generous with the advice and support to colleagues.
Arvind also served as a member of the Executive Council of the New Zealand Demographic Society since its inception in 1975 (now the Population Association of New Zealand, or PANZ) and was President for three years between 1997 and 2000. For the past five years Arvind has been a co-editor of the New Zealand Population Review. In 2006 he was made a Life Member of PANZ in recognition of his contribution to the research, teaching and promotion of demography in New Zealand.
Arvind’s expertise continues to be drawn on frequently by the news media and as a result, he has played a major role in disseminating and critically commenting on issues related to population. He appeared on a number of current affairs radio programmes including Insight and Morning Report, and has been visible in the print media, on television, in fronting an episode of Asia Downunder as well as commenting on demographic events. Throughout his career the Department of Statistics Demography Unit, Census Division and Social Welfare as well as the Population Monitoring Group have been frequent users of his expertise.
Arvind was also associated with making two major submissions on New Zealand population policy in the 1970s. The first was through the inter-departmental committee on population questions in the mid 1970s, on behalf of the New Zealand Demographic Society. The second was to the Royal Commission of Inquiry into Contraception, Sterilization and Abortion in New Zealand, again through the Society.
Against the background of these contributions the aim of this paper is to recall the contribution Arvind has made through his research. I begin by tracing his early education in India through to his Masters, PhD and post-doctoral work in the United States of America and then to his appointment to VUW.

A Demographer’s Demographer: Arvind Zodgekar 3
His research began with the population of India developed through his post-graduate work on internal migration in the U.S.A. and extended into the relationship between demographics and long swings of growth in Australia. Notwithstanding the impact of this earlier work, the bulk of Arvind’s research has been on New Zealand and it is from this body of work that I trace his additions to our understanding of changes in fertility and mortality culminating in his sequence of papers on New Zealand’s population structure. Much of Arvind’s more recent work focused on immigration, an interest that began with his enquiry into the motivations for British emigration to New Zealand. He then undertook studies of Indian settlement in New Zealand and has most recently documented the multicultural complex of current immigration patterns and the on-going issues of adjustment to a new land. Throughout this work we see demographic principles, processes and patterns outlined with unusual clarity and relevance. It is through his writing that we appreciate that Arvind was not only a very effective teacher but an excellent communicator of new and important trends within population itself.
Educational Background
Born and educated in India, Arvind graduated in 1962 with a BSc in statistics and mathematics from one of India’s premier universities, the University of Poona (now the University of Pune) in Western Maharashtra, India. He gained an MSc in Statistics in 1964 and then moved to what became the International Institute for Population Sciences (IIPS) in Mumbai which served as the regional centre for the teaching, training and population research for the ESCAP region.1 There Arvind completed a Diploma in Demography in 1967, working firstly as a Research Assistant and then as a Research Officer.
The quality of Arvind’s work was such that he was accepted for a Masters in Demography at the University of Pennsylvania, USA. In 1969 he completed his masters by course work and was subsequently invited to extend his research into a PhD. The thesis he presented carried the title Interrelation in time series of demographic and economic variables: Australia and Canada. He graduated with a doctorate in demography in 1972. His supervisor was the well known population specialist Professor Dorothy Thomas, who was also Research Director and Co-director of the Population Studies Centre at the University of Pennsylvania.2

4 Morrison
While in Pennsylvania, Arvind served as a Summer Research Assistant to Professor Thomas and then as a Research Officer for the International Bank for Reconstruction and Development (World Bank) in Washington, D.C. in 1972. In January of 1973 he took up a lecturing position with the Department of Sociology at VUW.
Research
Arvind’s first paper, ‘Increasing female age of marriage in India and its impact on the first birth interval; an empirical analysis’ was written in 1969 with a senior colleague while he was at the Population Studies Centre (Chidambaram & Zodgekar, 1969). It was published as the first paper in the first volume of the International Union for the Scientific Study of Population (IUSSP) series.
In the 1960s, India had the lowest mean age of marriage in the world and there was lobbying for an increase in the legal age of female marriage from 16 to 20 years. The increasing age of marriage was of special interest because of the impact of marital age on the birth rate. Arvind’s contribution was to point out that, although ages of effective marriage were rising throughout India, the length of the first birth interval was actually falling and hence so was the age of the mother at first birth:
It has been found that in the Indian setting when consummation takes place at young ages, say at 17 or below, the length of the first birth interval is negatively correlated with the age at consummation. Therefore “an increase of two or three years in the present age at effective marriage among the Indian women cannot be expected to delay the onset of child bearing and thereby reduce the actual reproductive period”. Not only was there no evidence to indicate any increase in the age at first birth, “but the possibility of even a reduction in the age at first birth or of quickening the onset of child bearing cannot be ruled out in the present Indian setting. (Chidambaram & Zodgekar, 1969: C2, 2.5).
It was not until Arvind was well into his time in New Zealand that he published again on demographic change in India. In 1996 the Asia-Pacific Journal carried his paper ‘Family welfare programme and population stabilisation in India’ (Zodgekar, 1996). Even though India was the first independent country in the world to adopt a policy of reducing population growth through a government sponsored national family planning programme started in 1952, the pace of fertility decline remained relatively

A Demographer’s Demographer: Arvind Zodgekar 5
slow and many were concerned, as they still are, that India might replace China as the world’s most populous country before the middle of this century.
Arvind argued that the image of the family planning programme needed to change, from being solely a birth control programme to one which improved the quality of people’s life (achieved through improvements in literacy, status of women, infant mortality and a reduction in the level of poverty). Instead of being a government programme, birth control needed to be seen as a personal programme: a transfer of responsibility from the State to the individual family which, in turn, required the acceptance of the small family norm. This required that socio-economic development reach a threshold beyond which reductions in family size would be non-threatening.
At the turn of the new century Arvind looked once again for progress in India’s fertility decline (Zodgekar, 2001). The country was still predominantly rural, poverty levels remained high and progress in addressing gender imbalances, in schooling in particular, was slow. Like many demographers at the time, Arvind foresaw the particular need for investment in the health and education of women. The mere availability of birth control facilities was not enough, nor was it sufficient to simply improve women’s well-being. New incentives for marrying after a certain age, delaying a first child until the woman was 21, adopting contraception after the birth of the second child, as well as the provision of more crèches and child care facilities, were necessary to empower women. The considerable geographic diversity of India also had to be recognised for infant and maternal mortality could vary up to eight times across the states.
Although Arvind retained an interest in population issues in India, with his domicile in the West it was inevitable that most of his research would focus on demographic trends outside the sub-continent, beginning with the USA, then Australia and New Zealand.
USA: internal migration
Arvind published two papers from his base at the Population Studies Centre in Philadelphia. The first, with Arvind as the lead author, was a paper on internal migration within the USA published in Demography (Zodgekar & Seetharam, 1972). Arvind is still the only New Zealand based demographer to have published in that premier journal. The paper entitled ‘Interdivisional

6 Morrison
migration differentials by education for groups of selected SMSA’s United States 1960’ used data supplied by Dorothy Thomas under a National Science Foundation grant.
That paper remains one of the important contributions to our understanding of the relationship between education and internal migration, a topic which is receiving particular attention today. Arvind began with the suggestion that migration was most likely to occur at higher levels of education, noting Lee’s argument that migration appears J, U or reverse J shaped over the education domain. Arvind draws attention to the importance of distinguishing between the education level of migrants and non-migrants at the origin (origin differentials) as opposed to the destination (destination differentials). It was especially important, he argued, that demographers address the principles of selectivity at both the place of origin and destination (p. 684). Focusing on ‘destination differentials’ and using four colour by sex groups from the 1960 US Census, Arvind showed how educational differentials were manifest among different types of migrants between 49 Standard Metropolitan Statistical Areas (SMSAs). He confirmed the presence of J, U and reverse J shapes over all the groups with departures being accounted for in terms of the proportion of foreign-born whites, the geography of origin and destination and the distribution of educational attainment.
Australia: long swings
The last paper submitted before Arvind came to New Zealand was published, appropriately enough, in Victoria University’s journal, known then as Pacific Viewpoint (Zodgekar, 1974). It was entitled ‘Evidence of long swings in the growth of Australian population and related economic variables, 1861-1965’. Originating in his doctoral thesis, this paper had its origins in the work that Dorothy Thomas and Nobel Prize winner Simon Kuznets undertook a decade earlier in the USA and Sweden. The focus of Arvind’s attention was on whether the waves of immigration to Australia were associated with the host country’s changing economic conditions. That the turning points of long swings in output growth typically preceded those in the rate of net immigration suggested that immigration was indeed responding to changes in conditions in Australia. This was particularly the case when conditions were represented by the unemployment rate, the ease of gaining employment in the host country being a primary inducement to

A Demographer’s Demographer: Arvind Zodgekar 7
immigration. The same series in the country of origin, the UK, apparently played little role. Instead, the demand for labour in Australia and the country’s rate of economic development accounted for about a third of the variance in the (moving age) immigration rate.
A second question out of this PhD research concerned the presence of long swings in fertility and whether they too could be explained by similar movements in the Australian Gross Domestic Product (GDP). The evidence available from 1861 through to 1961 was insufficient to link rising fertility with rising domestic product, but Arvind was nevertheless able to demonstrate the coexistence of long swings in immigration and fertility (as well as aggregate output and employment conditions).
When Arvind moved to New Zealand in 1973 there were many opportunities for research. The one that captured the imagination of several demographers at the time was the question of fertility change.
New Zealand: Fertility
Arvind’s paper published in the Journal of Biosocial Science and titled ‘Maori fertility in a period of transition’ was to be his only paper specifically on Maori in New Zealand (Zodgekar, 1975). In this work he drew attention to the fact that over the decade 1961-1972, the Maori crude birth rate had declined by nearly 28 percent with only a very small part attributable to changes in the age-sex and marital status composition. He showed how this fertility decline first became evident among older Maori women and was only later adopted by younger women. Rather than reflecting inter-marriage between Pakeha and Maori as some suggested, it was rapid urbanisation and a rapidly reducing level of infant mortality which were the main reasons for the fertility decline, as well as an increase in all levels of education associated with the widespread adoption of contraception.
The message of Arvind’s companion piece in the same journal focused on the fertility transition of non-Maori in New Zealand (Zodgekar, 1980b). Covering a much longer time span, 1860 to the mid-1970s, Arvind showed how the more extended fertility transition took place in four distinct stages: the first was the postponement of marriage to later ages between 1860-1880; the second phase was marked by an increasing control over fertility within marriage and postponement of marriage. This phase, which continued into the 1910s, resulted in a more marked decline in family size than had taken

8 Morrison
place in most other urban societies. Here the British influence appeared so pervasive that the New Zealand fertility declines took place at a similar time rather than at a similar stage in economic development. The third stage spanned the period between the World Wars until the 1950s during which fertility control within marriage became possible and widespread. The fourth stage began in the 1960s where the new type of contraceptive combined with many other factors to allow greater control over fertility. While technically the oral contraceptive was important its impact was due in large part to the social and attitudinal changes associated with the ‘new roles of women’.
The only other paper Arvind was to write specifically on fertility change in New Zealand was his first contribution to this journal in 1986, which addressed the fertility of the baby boom generation (Zodgekar & McClellan, 1986). What fascinated Arvind in this instance was the deviation of the baby boomers’ own fertility patterns from that of their parents, a departure which he recognized “had a profound influence upon the structure, organization, values and policy making within New Zealand society – an influence which will continue to be felt well into the next century” (p. 205). Instead of this ‘giant cohort of baby boom women’ producing yet another baby boom Arvind saw a marked divergence in reproductive behaviour in the space of only one generation:
The baby boom cohort did not have their children as quickly as their parents. They postponed both marriage and family production, pushing births back in timing and deepening the trough of the ‘baby bust’. These timing factors, the delay in marriage and the delay in childbearing are the crucial factors in understanding the fertility behavior of the baby boom generation. (p. 208).
What struck Arvind was the nature and speed of the change in fertility, as well as the coincidence in comparison countries, including Australia and the United States. Drawing on his awareness of timing from his earlier Indian work, he noted how in the New Zealand context, “the timing of first births is crucial for any fertility analysis and projection” (p. 212). With little data to go on even in the mid 1980s, Arvind joined several other commentators in speculating as to the reasons: education raised the returns to work, and labour force participation became a major source of additional income for households with unprecedented life style aspirations. “The

A Demographer’s Demographer: Arvind Zodgekar 9
women of the baby boom generation”, he noted, “were the first female cohort to come of age with aspirations that usually extended beyond that of motherhood and domesticity” (p. 212).
Mortality
While changes in mortality in New Zealand were nowhere near as spectacular as those involving fertility, there were characteristics of mortality which needed highlighting for an increasingly demographically literate readership. In the late 1970s Arvind was asked to write the chapter on mortality in Neville and O’Neill’s well known volume The population of New Zealand: an interdisciplinary perspective (Zodgekar, 1979). His argument begins with an observation which is also a puzzle: by the mid 1970s, New Zealand had reached a point of mortality stagnation, having experienced a continuous decline in the record since the early 1900s when the European population was the first in the world to record an expectation of life at birth of more than 60 years (p. 92). The record itself shows periods of decline alternating with periods of stagnation of which the period from the 1960s through to his time of writing was the latest.
The stagnation was due solely to the experience of men. From having a very similar mortality rate to females in the early 1900s, the differential arose because there had been greater progress in reducing the death rate among females (p. 93). Since 1921 male mortality had been higher than female mortality at every age and the difference was increasing. The most dramatic increase in the sex differential was in the 15-24 age group where the male death rate was nearly three times higher than the female death rate (p. 98).
The same chapter also contained observations on racial differentials, the mortality rate at every age from 25 to 64 years being nearly two and a half times higher for Maori than for non-Maori (p. 105). However, the growing youthfulness of the Maori population helped disguise a slowing mortality decline and partly for this reason, “the large racial differential in mortality has failed to receive the full degree of attention it deserves” (p. 103). Arvind’s other observation concerned the ‘health gradient’ - the inverse relationship between occupational class and mortality - an issue which he foresaw needed much closer research (p. 106).

10 Morrison
Arvind’s chapter on mortality ends with the expectation that low mortality rates can be expected to fall even further given the much lower rates prevailing in Sweden and other Scandinavian countries. However, he cautioned that, “any substantial reduction in mortality rates in New Zealand beyond [their then current rates] will depend on the lowering of the death rates for degenerative diseases”, heart disease and cancers making up half of all causes of death in the mid 1970s (p. 106).
Arvind revisited trends in New Zealand’s mortality rate in two subsequent papers written a decade apart, both of which reflected his increasing interest in demographic ageing. The first addressed the “Social impact of recent and prospective mortality decline among older New Zealanders” published in the Asia-Pacific Population Journal (Zodgekar, 1994) and the second appeared in Chapter 5 of the Davis and Dew book on Health and Society in Aotearoa published by Oxford University Press, entitled ‘The ‘greying’ of Aotearoa New Zealand: policy implications of demographic change and structural ageing’ (Zodgekar, 2005b). The central message of these papers was the widespread intergenerational implications of population ageing and the need to plan in order to cope with the increasing demands caring for the elderly would place on both the formal and informal systems.
The ‘Greying of Aotearoa’
The arrival of a large baby boom cohort into their 60s required the dissemination of the demographic fundamentals of the ageing process. Arvind reminded us that ageing is built into, and is therefore a natural outcome of the demographic transition, and that the passing of a large cohort only adds magnitude to the phenomenon. With a foresight that is characteristic of his discipline, Arvind was well aware of our entering ‘a critical moment in the demographic evolution of New Zealand’ (Zodgekar, 2005b):
A major part of the process is the decline in rates of death (or mortality), which has greatly increased the chances both of surviving into old age and of living longer once one reaches old age. But changes in fertility have also played their part, particularly through the post-Second World War ‘baby boom’ and the subsequent rapid decline in fertility. Fertility change has been a major factor in shaping the course of structural ageing in New Zealand. Older populations will also become more diverse with the increasing proportions of Maori, Pacific, and Asian peoples reaching and

A Demographer’s Demographer: Arvind Zodgekar 11
passing 65, both as a result of increasing life expectancy and larger birth cohorts reaching old age. (p. 69)
In contrast to the mortality trends he wrote about earlier, decline in mortality had now spread across all age groups due to “efficient control of infections and parasitic diseases”, leaving accidents and degenerative diseases as the main causes of death (Zodgekar, 1979).
Arvind’s particular concern was over who would care for older people, both within institutions and the community (Zodgekar, 2000), a concern which carried important “consequences for hospital provision, community care, and family support in old age” (Zodgekar, 2005b, p. 70). The social impact of mortality can be understood, he stressed, only once the numbers moving into these ages is appreciated. Assuming the values of the late 90s life tables hold, “almost 64 percent of men born in 2031 and 75 percent of women should live to age 80” (p. 72). Most care of the elderly is undertaken by families and therefore the social implications stem from the uneven generational size. The distribution of population within the older age groups is also going to change with the proportion over 80 contributing 23 percent of the population in 2031. In a telling statistic, “over the period 1996-2031 the number of those aged 80 and older is likely to increase from 95,700 to 314,200 which will have significant implications for the financing, organization and utilization of health care resources” (p. 74).
Not only will there be more old people in the society but a higher proportion of them will be women. The implications here are complicated by the accompanying shift of support within the family with grandparents, parents and children now more likely to be living at the same time. Falls in mortality and consequential life expectancy was producing the two-generation geriatric family – children reaching old age while their parents are still alive (p. 76). Familial aged dependency ratios were rising rapidly as a result, a situation which becomes more complicated as more and more women from this care giving age group (40-59) enter paid employment reducing the pool of women available to undertake the care-giving role (p. 77).
Although declining mortality was expected to result in an increase in the number of generations in the family, of greater public policy concern was the long-run decline in fertility resulting in a smaller number of living children and grand children to care for the elderly population (p.78).

12 Morrison
Families now have more living generations but successive generations will be smaller in size. “Therefore the potential of the family to act as a support network for its older members is diminished, a feature compounded by a greater disability burden with age” (p. 81). Pressure on care will therefore grow as emphasis shifts from institutionalised to community care, implying the need for the state to transfer resources.
With older age comes disability and here Arvind drew on the 2001 New Zealand Disability Survey to show that well over half a million (527,430) of those older than 65 were likely to carry some form of disability in the years 2031. His calculation led to an, “expected increase of nearly 186 percent in the number of beds required in the public and private hospitals for geriatric care” (p. 79). Clearly, the reductions in mobility rates in New Zealand during the twentieth century have not been accompanied by equivalent improvements in morbidity. The debate, he argued, should therefore centre on the possibility that longer life might be accompanied by prolonged periods of chronic disease, illness, and disability and for such developments to have a potential impact on future demand for health services (p 80).
New Zealand’s Population Structure
Arvind tackled the overall structure of the New Zealand population in two papers a decade apart. The first was a chapter in Spoonley, Pearson and Shirley’s book New Zealand society: a sociological perspective (Zodgekar, 1990b). The second was for the joint special issue of the Journal of Population Research and New Zealand Population Review in 2002 (Zodgekar & Khawaja, 2002). In each case he drew on the most recent figures to update his previous discussions on population growth, age structure and fertility trends, including an update on Maori fertility transition and immigration.
The two main changes in the post-World War II years through to the late 1980s were the dramatic fluctuations in international migration and the significant change in the level of fertility. These resulted in significant changes in the relative importance of natural increase and net external migration as components of population change. A decade later and the same two points emerged again, but this time there was greater emphasis on the growing cultural diversity, diversity of household structures and a slowly ageing population (Zodgekar & Khawaja, 2002).
A Demographer’s Demographer: Arvind Zodgekar 13
Two issues were given special attention against this background of compositional change and increasing diversity: the demographics of labour force participation and tertiary education. The first was addressed in the early 1980s for the ESCAP volume, Population of New Zealand (Zodgekar, 1985). Arvind’s extensive coverage of the demographics behind the composition of the New Zealand labour force still renders this one of the most useful introductions to the demography of the labour supply in New Zealand, foreshadowing as it does many of the issues such as ageing of the work force and the implications of younger populations for the growth of the labour supply of Maori.
In the case of tertiary education Arvind adopted a cohort approach (Zodgekar, 2002). In a paper that was as timely as it was influential, he focused on the implications of major demographic changes for enrolments in tertiary education noting that, “after a continuous rise during the 1980s and early 1990s, the enrolments in tertiary institutions have either slowed down or are beginning to experience a decline” (p. 143). Both changing demographics and increasing financial cost were responsible. While demographic factors will continue to play a role due to an expected decline in the future birth rate and the exit of the relatively larger size cohorts from the core tertiary age groups (15-39), Arvind noted how future growth in tertiary education and particularly in student enrolments would most likely be driven by non-demographic factors, notably changes in access requirements and government funding (p. 144).
Immigration
Interestingly, it took Arvind a good 15 years after moving to New Zealand as an immigrant to start writing about it. Personal reflections are rarely part of the academic discourse but personal experience is a profound motivator for inquiry and it is no accident that some of our best writing on immigration to New Zealand has been undertaken by those who came to New Zealand as adults.
Arvind’s 1997 text remains a remarkably uncomplicated introduction to immigration into New Zealand over the post Second World War period (Zodgekar, 1997). What is significant in terms of his own intellectual journey is that the objective of this study was not demography per se. Rather it was about adaptation and economic integration, questions which are central to immigrants themselves. More poignantly, this is a study which

14 Morrison
documents, in Arvind’s typically understated way, the less than equal returns to human capital experienced by recent immigrants from Asia and the Pacific.
Based on tabulations from the 1986 and 1991 Censuses of Population and Dwellings, Arvind’s research on immigration was undertaken against the background of economic liberalisation in the 1980s and the accompanying review of immigration policy. The introduction of the points system favouring education and specific skills in 1991 followed the removal of the racially selective White New Zealand policy in 1986. The subsequent influence on the mix of immigrants was considerable, for while the proportion of foreign-born in New Zealand remained between 15 and 17 percent, its composition changed markedly (Zodgekar, 1997, p. 60).
With a higher proportion of men and women of working age with university and post-graduate education holding professional, technical and managerial posts, the key research question was the extent to which immigrants were able to obtain returns comparable to those received by the New Zealand born. They were not. With the available statistical controls in place Arvind wrote how “The disparities in average income between the various immigrant groups clearly showed that the immigrants from traditional sources (the U.K., other European countries and USA/Canada) have a much greater higher average income than immigrants from Pacific Islands and Asia” (p. 61).3 The disparities for women were even greater.
In a companion paper published in 1998 Arvind reviewed the dominant models on the economic differences and adaption of immigrants. Conducted before access to unit record data became available to researchers, his analysis was based on a specially prepared set of cross tabulations. With relevant statistical controls in place he was able to show not only that immigrants received lower returns to education than the native New Zealand population but that there was a difference in treatment of migrants from traditional and non-traditional sources. Based on the 1991 Census results:
…it was clear from the distribution of socio-economic characteristics that immigrants from the traditional source countries (UK, Canada, USA and Australia) did not have any advantage over immigrants from the non-traditional sources. But they did command the migratory elite status and command their hierarchy within each occupational status due to ethnic stratification. Thus the labour market experiences of immigrants from the

A Demographer’s Demographer: Arvind Zodgekar 15
traditional sources lend support to the Colonial Domination Model (Zodgekar, 1998, p. 38).
In spite of their higher level of education Asian immigrants earned far less than New Zealand-born males. This may have been due, Arvind noted charitably, to the possible problems in obtaining recognition for educational skills/qualifications and work experience acquired elsewhere”. Whether or not they will improve their relative economic position as their length of residence in New Zealand increases remained to be seen (Zodgekar, 1998, p. 39).
Several of these same concerns were foreshadowed in Arvind’s earlier paper ‘Immigrants in the 1981 Census’ (Zodgekar, 1986). In a wonderfully guarded statement he wrote, “If the collection and availability of census data assist in the development of harmonious inter-group relations by alerting the host population to the contributions and problems of immigrants then New Zealanders could fairly be claimed to be well informed” (p. 55). He went on to make the case for collecting information on the use of English and other languages, an addition which would “add a valuable dimension to our perception of New Zealand as a multicultural society”:
A good case could also be made for data on the birthplaces of the parents and grandparents of New Zealand residents. In this case the descendents of immigrants could be identified, inter-generational comparison, mobility, language retention and intermarriage could conceivably be explored. Once again our perception of the ethnic dimension to our society would be significantly enhanced (p. 56).
That data on language spoken at home and birth place are now collected in the quinquennial census is indicative that some New Zealanders have listened.
The British immigration experience
Although Arvind is most immediately referred to as a demographer, his appointment was in sociology and, as noted above, he studied for his doctorate under one of the USA’s most prominent sociologists. It is not surprising therefore, that sociological questions on the fringes of demography often caught Arvind’s attention. One of these concerned the way in which potential immigrants make decisions to leave a country and

16 Morrison
travel half way round the world to a country much smaller in population than the one they left. It was this question that resulted in a series of papers on British emigrants, for as he noted “Despite the role emigration from Britain to New Zealand has played in this country’s history and demographic development, comparatively very little research has been done on this topic” (Zodgekar, 1990a, p. 427).
Arvind was interested in the decision to leave, information received and the information acted on in making the move. His empirical research into this issue was based on responses to 332 questionnaires returned from 700 questionnaires mailed to British applicants with their immigration acceptance papers over six months from March 1983. The Immigration Division of the Department of Labour and New Zealand High Commission in London offered administrative support. Emigrants were asked questions about their knowledge of New Zealand, sources of information and the influence these sources had on their decision to emigrate. There were certain characteristic features of the British emigration to New Zealand in the early 1980s, most notably that three quarters had jobs to go to, a feature which substantially reduced their risk (p. 431). Most males expected greater job satisfaction than they were currently receiving and all except those in the highest paying jobs expected to improve their income. Most were families and many of the women expected to work in their new country. A major attraction was larger dwellings and home ownership - both high priorities for young families.
The expectations of British immigrants tended to be overly optimistic and this raised a number of questions about the selective nature of the information that they used. Although a range of publicity was typically consulted, the biggest single influence in the British emigrant case was the presence of relatives in New Zealand, followed by friends. The most influential information came from personal contacts rather than through the market and government information sources (Zodgekar, 1991, p. 40).
In a way this research remained incomplete, as Arvind was left wondering about the gap between expectations and how this was resolved by migrants (Zodgekar, 1994a). “It seems to me,” he wrote towards the end of 1991, “that such a high perception of New Zealand is the result of stereotyped and much publicised material on selected aspects of New Zealand society, economy and environment. It would not be surprising if such a pre-migration image leads to some frustration among the emigrants

A Demographer’s Demographer: Arvind Zodgekar 17
after their arrival in New Zealand” (Zodgekar, 1990a, p. 433). Arvind was well aware that the adjustments British immigrants had to make paled in comparison to those arriving from India.
Indians in New Zealand
It is no surprise, given his previous work, that Arvind was asked on repeated occasions to write about the second largest group of Asian immigrants to New Zealand - a heterogeneous group which the host society simply refers to as ‘Indians’. Arvind wrote two papers on this topic; the first was started in the late 1970s (Zodgekar, 1980a) and the second some twenty years later (Zodgekar, 2009) and a related report (Davey, Keeling & Zodgekar, 2010). All three contribute to our understanding of the history of Indian settlement in New Zealand and its contemporary characteristics. We learn for example of the episodic growth in Indian in-migration to New Zealand; a burst between 1916 and 1921 and then a long period of restricted growth. However it was not until after 1945, when the Indian population was only 1554, that Indians began entering the country in substantial numbers. The number had risen to 42,408 by 1996, and had doubled to 104,582 by 2006. Initially, young males dominated but the age-sex structure evened out over the course of the last century (Zodgekar, 1980a).
The history of Indian settlement was closely related to decisions made by the New Zealand government: the 1899 Immigration Restriction Act, the Act of 1920 and the prevailing discretionary power of the Minister of Customs to control entry. Later acts were to greatly influence the educational and hence the occupational structure of immigrants with an initial concentration in farming and market gardening before World War II giving way to white collar and professional occupations in the contemporary period.
Not only had the Indian population become more occupationally diverse but the early homogeneity of the population that prevailed before the Second World War (over 90 percent from Gujarat) gave way to many different Indian communities distinguished by origin, language, religion and caste. The recent growth has meant that at the 2006 Census only 22.8 percent of resident Indian were born in New Zealand, many arriving from Fiji after the 1987 coup. Despite having qualifications levels which exceeded the New Zealand average, unemployment rates among educated Indian immigrants remain comparatively high.
18 Morrison
The changing face of immigration
While it was the British and the Indian populations that absorbed much of Arvind’s research on immigration, he also had the opportunity to comment more broadly on immigration and to consider the way in which international migration was changing the face of New Zealand’s population in his chapter for New Zealand Identities: Departures and Destinations (Zodgekar, 2005a). “The increasingly diverse composition of New Zealand society along with a growing sense of independence from the colonial past and quest for competitive advantage in the global market,” he foresaw, “were bound to be reflected in a range of developments relating to citizenship, and national and cultural identity” (p. 140).
In that chapter, Arvind looked at the broad aspects of immigration policy development since 1986, and then describes how the composition of the population has been modified as a result. After laying out the numbers he turned to the variety of migrant experiences which he labels, insightfully, “towards integration and marginalisation”.
Arvind noted how, “The overall pattern of inequality in average income clearly shows that immigrants from traditional sources achieve parity or exceed the incomes of New Zealand-born persons, but those from non-traditional sources do not perform as well” (p. 148). These are heartfelt words as Arvind was well aware of the dangers of migrants and non-migrants growing apart. Adjustment and adaptation, he stressed, are two-way processes.
Successful integration of immigrants in New Zealand will depend on new ideas and new neighbours being seen as an asset in meeting the challenges of an ineluctably changing world. Migrants will also need to take an equal responsibility in the process of adaptation and integration by making an effort to adjust to the new social and cultural environment. Much of the evidence …shows that New Zealand is still some distance from being either a bicultural or multicultural society….The real concern for New Zealand’s future is not so much to do with immigration policy, but the lack of government investment in mechanisms to ensure understanding and tolerance between entities, especially in tough economic circumstances (p. 149).
While the introduction of ‘cultural days’ in New Zealand is an important symbolic accommodation of ethnic diversity and clear evidence of the transformation and secularisation of the public celebration of such events in

A Demographer’s Demographer: Arvind Zodgekar 19
New Zealand, genuine tolerance and mutual recognition have been slower to arrive by because culturally-based needs are harder and they involve targeting resources (p. 152).
One hitherto neglected but growing group in New Zealand society is the ageing immigrant. In his most recent publication Arvind, together with Judith Davey and Sally Keeling, use interviews with representatives of the Indian community organisations and family case studies to explore the interaction between family, ageing and migration (Davey, Keeling & Zodgekar, 2010). Among Indians over 65 years, about half were born in India and a third in Fiji. Most older Indians therefore are immigrants, and the authors write poignantly about instances of social isolation, loneliness and dependence, as older Indians negotiate living arrangements, care and support with their New Zealand based families. In addressing this sensitive issue Arvind has again raised a matter of importance for consideration by the broader New Zealand public.
Conclusion
Arvind published in some of the best international journals in the field, and often as the sole author. He was in high demand as a contributor of chapters on demography due to his highly lucid, no nonsense prose, his scientific attention to the record and, above all, to an ability to focus on the demographic processes that mattered to a contemporary audience. There was a very careful delimitation in Arvind’s mind between what could be said on the basis of the facts (paying due attention to how reliable those ‘facts’ were in the first place) and what was speculation. One gets the sense that he was never particularly comfortable in speculating but his subject matter almost demanded it, for “what was likely to happen next” is the sine qua non of the demographer’s craft. As a professional demographer, Arvind never shied away from that responsibility either in text or in his numerous radio broadcasts and television work. In retrospect, his accumulated texts are ever more valuable because of this.
With Arvind’s retirement the New Zealand university system is left with the stark fact that now only one university in New Zealand teaches Population Studies - the University of Waikato. This is a marked departure from the situation in the 1970s where universities in the main centres each taught the fundamentals of demography. If there is a message from this review of Arvind’s contribution to our understanding of New Zealand

20 Morrison
society, it lies in the importance of rebuilding our stock of trained demographers throughout the university system so that all students might benefit.
That most graduates in the social sciences complete their studies without being exposed to even basic demographic concepts, let alone any training in demography, means many of our future policy analysts are going to be less sensitive to the importance of understanding the vital processes of population change and be less likely as a result to appreciate their implications. All the more reason then to celebrate the contribution which Arvind has made to the education not only of the thousands of students who took his courses over three and a half decades but also of the wider public who have been able to draw on exceedingly clear treatments of all the major implications of demographic change experienced within New Zealand.
Acknowledgements
I wish to thank Mansoor Khawaja, Demographer, Statistics New Zealand and Allison Kirkman, currently Head of the School of Sociology and Social Policy at VUW for their comments and contributions to an earlier draft as well as Professors Jacques Poot and Richard Bedford who carefully read the first draft. I am grateful to Arvind for being willing to share his papers; however, the responsibility for interpreting their content correctly remains mine.
Notes
1 The United Nations Economic and Social Commission for Asia and the Pacific (ESCAP) is the regional development arm of the United Nations for the Asia-Pacific region. With a membership of 62 Governments, 58 of which are in the region, and a geographical scope that stretches from Turkey in the west to the Pacific island nation of Kiribati in the east, and from the Russian Federation in the north to New Zealand in the south, ESCAP is the most comprehensive of the United Nations five regional commissions. Accessed from http://www.unescap.org/about/index.asp.
2 Professor Thomas subsequently became the first female professor at the
Wharton school and is acknowledged as one of the most accomplished sociologists of her generation, her contribution being primarily in developing the relationships between social, economic and demographic variables. http://www.archives.upenn.edu/faids/upt/upt50/thomasdst.html
3 Two variables which would otherwise be included in such an analysis were not available from the census data used: duration of residence and hours of work. However Arvind was well aware of this and was careful not to overstate his conclusions, and multivariate studies with a larger range of variables using

A Demographer’s Demographer: Arvind Zodgekar 21
regression analysis conducted subsequently have reached substantively the same conclusions.
References
Chidambaram, V. & Zodgekar, A. (1969). Increasing female age at marriage in India and its impact on the first birth interval: an empirical analysis. International Union for the Scientific Study of Population 1, 1-11.
Davey, J., Keeling, S. & Zodgekar, A. (2010). Families, ageing and migration: Indian communities in Auckland, Wellington and Christchurch. Working Paper No 10/03, Wellington, Institute of Policy Studies.
Zodgekar, A. (1974). Evidence of long swings in the growth of Australian population and related economic variables, 1861-1965. Pacific Viewpoint, 15(2), 135-148.
___________ (1975). Maori fertility in a period of transition. Journal of Biosocial Science, 7(3), 345-353.
___________ (1979). Mortality. In R. Neville & C. O'Neill, (Eds.) The population of New Zealand: Interdisciplinary perspectives (pp. 89-111). Auckland: Longman Paul.
___________ (1980a). Demographic aspects of Indians in New Zealand. In K. Tiwari (Ed.). Indians in New Zealand: Studies in a subculture (pp. 183-197). Wellington, Price Milburn.
__________ (1980b). The fertility transition in the non-Maori population of New Zealand. Journal of Biosocial Science, 12(2), 165-178.
__________ (1985). Demographic characteristics of the labour force. In I. Pool (Ed.), Population of New Zealand: Country Monograph Series No. 12. (Vol. 2, pp. 96-113). New York: ESCAP, United Nations.
__________ (1986). Immigrants in the 1981 Census. In A. Trlin & P. Spoonley (Eds.), New Zealand and international migration (pp. 40-57). Palmerston North: Massey University.
__________ (1990a). British emigrants to New Zealand: their motives and expectations. International Migration 28(4), 427-442.
__________ (1990b). Population. In P. Spoonley, D. Pearson, & I. Shirley (Eds.), New Zealand Society: A Sociological Perspective (pp. 293-309). Palmerston North, Dunmore Press.
__________ (1991). British emigrants' expectations and knowledge of New Zealand during 1983. New Zealand Population Review, 17(2), 27-45.
__________ (1994). The social impact of recent and prospective mortality decline among older New Zealanders. Asia Pacific Population Journal, 9(2), 47-60.
__________ (1994a). Emigration experiences of recent British migrants. New Zealand Population Review, 20(1&2), 102-109.
__________ (1996). Family welfare programme and population stabilization strategies in India. Asia-Pacific Population Journal, 11(2), 3-24.
__________ (1997). Immigrants in New Zealand society (Vol. 10). Wellington Department of Sociology and Social Policy, Victoria University of Wellington

22 Morrison
__________ (1998). Income of immigrants in New Zealand: an analysis of 1991 Census. New Zealand Population Review, 24, 21-42.
__________ (2000). Implications of New Zealand’s ageing population for human support and health funding. New Zealand Population Review 26(1), 99-114.
__________ (2001). For the people: India's new population policy. Harvard Asia Pacific Review, 5(1), 6-9.
__________ (2002). Cohort structural changes: implications for tertiary education. New Zealand Population Review, 28(1), 129-145.
__________ (2005a). The changing face of New Zealand's population and national identity. In J. Liu, T. McCreanor, T. McIntosh & T. Teaiwa (Eds.), New Zealand identities: Departures and destinations (pp. 140-154). Wellington, Victoria University Press.
__________ (2005b). The 'Greying' of Aotearoa New Zealand: policy implications of demographic change and structural ageing. In P. Davis & K. Dew (Eds.), Health and society in Aotearoa (pp. 69-81). Auckland, Oxford University Press.
__________ (2009). Indian presence in Aotearoa New Zealand: a demographic profile. In B. Sekhar (Ed.), India in New Zealand: Local identities, global relations. Dunedin, Otago University Press.
__________ & Khawaja, M. (2002). Population dynamics and compositional changes in New Zealand's population. Journal of Population Research and New Zealand Population Review: joint special issue, Sept, 137-149.
__________ & McClellan, V. (1986). Fertility of the baby boom generation: the New Zealand experience. The New Zealand Population Review, 12(3), 205-217.
__________ & Seetharam, K. S. (1972). Interdivisional migration differentials by education for groups of selected SMSA's, United States, 1960. Demography, 9(4), 683-699.

New Zealand Population Review, 35:23-53. Copyright © 2009 Population Association of New Zealand
Differential Trends in the Compression of Mortality: Assessing the Antecedents to
Current Gaps in Health Expectancy in New Zealand
IAN POOL * BILL BODDINGTON **
JIT CHEUNG *** ROBERT DIDHAM **
BEN AMEY *** Abstract
Health Expectancies (HEs) for New Zealand show significant differentials between Maori and non-Maori, but also by gender and period. These differentials correlate with findings from both generation and synthetic life-tables relating to New Zealand’s epidemiologic transition. At the beginning of that transition quartile 1 (Q(1)), and Median (Med) d(x) values were close and centred at young ages; during the transition the gap became very wide; at the transition’s end the gap again narrowed. Cohort and synthetic trends in d(x), l(x), M, Qs and Meds are reviewed and linked to recent HEs. Data point to epidemic polarisation. Cohort analysis allows the evaluation of the role of past experiences on the recent HEs, and thus point to possible strategies for reducing gaps in both d(x), and HEs.
* Emeritus Professor, University of Waikato. Email: [email protected] ** Statistics New Zealand. *** Ministry of Education

24 Pool et al.
Introduction: Past and Current Gaps in Health Status in New Zealand
n assessing population health many governments and researchers use state-of-the-art methods that are now de rigeur in the European Union and for the World Health Organisation (WHO) (Tobias et al 2008).
These are variants of ‘Sullivan methods’, a form of life-table termed Health Expectancies (HEs) (see Johnstone et al., 1998). They combine two dimensions of health: health status, as measured by functionality (achieving of tasks of daily living) and survivorship. The series of HEs for New Zealand (and most Western Developed Countries, WDCs)1 are very recent, running only from the mid-1990s (Tobias et al., 2009a). That said, they confirm that this population’s health trends fit with those seen in other WDCs. There are clear improvements in health status even over such a short period, a result confirmed in another study with an independent data set (Pool et al., 2009).
New Zealand’s population is multi-cultural, with almost a third of the population having origins other than European. This overall picture obscures major ethnic gaps in HEs, and all other measures of morbidity and mortality. The reduction of gaps between different ethnic groups has been a long-standing issue for health planning in New Zealand.
To maintain consistency over time most of this analysis is on Maori and non-Maori2, even though we recognise that increasingly this dichotomy is confounded by three factors: the non-Maori population has become more culturally diverse; there is segmentation within the Maori population; and there have always been high levels of intermarriage between different ethnic groups.
The ethnic differentials shown in recent health status measures appear to correlate with findings on the compression of mortality derived from both generation and synthetic life-tables relating to New Zealand’s epidemiologic transition. Compression occurs when the range of ages at which people die is becoming narrower and narrower – happening at older ages in today’s society.
Compression has been a normal phenomenon throughout much of history, but at younger ages as against the older ages. A shift in the force of mortality from younger to older ages occurred over each population’s
I

Differential trends in the compression of mortality 25
epidemiologic transition. For example, early in the Maori transition (1890s), quartile 1 (Q1) and median d(x) values were close and centred at young ages; during the Maori transition that gap, median minus Q1, became very wide; but in the transition’s latest phases the gap is again narrowing. Today, compression shows up only at older ages, producing a uni-modal ‘normal’ distribution of deaths (Cheung, S. et al., 2005, p. 246) 3, whereas at the start of the epidemiologic transition there was a bi-modal distribution, with the force of mortality occurring both at childhood and at older ages. The non-Maori trend for the period from 1876 is less marked. There was a wide gap between Q1 and the median, but also showing marked bi-modality, and narrowing to show classical forms of compression today (Pool, 1994; see also Pool & Cheung, J., 2003).4
The health of an individual or of a cohort is a product of two historical trends – the experiences of the cohort itself, and the passage through an epidemiologic transition of the population to which that generation belongs. HEs measure health for cohorts that, in a country such as New Zealand, live in a period when the epidemiologic transition has run much of its course. In a pluralistic society not only does each ethnic group go through a different epidemiologic transition, but each has a different mix of social, economic and health experiences accumulated during their life-spans, experiences which may play a significant role in determining their health statuses at older ages.
Aims of this Paper
This paper identifies and analyses the long-term differentials in health status in New Zealand, by focusing on the compression of mortality as measured from survival functions drawn from both cohort and synthetic life-tables, going back to the 19th century. It then compares these results with recent HE data showing that the same gap persists for health status. The analysis allows us to address three interlocking issues:
1. There is an empirical question of concern primarily to New Zealand health
policy-makers and service providers: As in other WDCs, New Zealand’s high risk populations are now mainly at older ages. This paper attempts to assess whether the historical shift to compression at these ages and the present health gaps are linked to ethnic differences in cohort patterns of survival, and thus to differential

26 Pool et al.
risks, or are a function more of period effects, over time and at present, such as socio-economic disparity and differential access to health care.
2. There is a more theoretical question of wider interest: The role of cohort effects, especially as seen in measures derived from the l(x) function of the life-table, may be rather powerful, whereby changes at any age may have momentum effects which structure patterns and trends subsequently at much older ages. The non-Maori population benefited from rapid decreases in infant and childhood mortality in the late 19th century, in a period prior to when the New Zealand public health system or bio-medical factors could have made any significant impact on health status. These gains for the values l(0) to l(15) produced momentum effects that continued to have an impact on older cohort l(x) values, and thus on expectancies throughout much of the inter-war period (Pool & Cheung, J., 2005).
Our paper reviews cohort and synthetic trends in d(x), l(x), modes, quartiles and medians, analysing all ages as well as adult ages, and links them to recent HEs and related data (e.g. a Sullivan’s observed prevalence method of Hospitalisation Utilisation Expectancies (HUEs), (Cheung, J. et al., 2001)), which show compression of both mortality and morbidity at older ages as measured by bed-use combined with life expectancy. We will also explore dynamics of the oldest-old (Robine & Cheung, 2008: Discussion). Cohort analyses of l(x) and d(x) allow us also to evaluate the role of past experiences of older cohorts on the recent HEs and thus on current polarisation, and thus to point to possible strategies for reducing gaps in both d(x), and in HEs.
Health Expectancy, Compression of Mortality and Related Trends
That longevity is increasing is incontrovertible; what is disputed is how far out longevity might be extended, and what are the implications for human populations and health systems (e.g. Oeppen & Vaupel, 2002; Tuljapurkar et al., 2000). Up until the early 1990s various protagonists put forward different scenarios about mortality itself, notably whether or not the survival curve was “rectangularising” (summarised in Levy, 1998). In a
Differential trends in the compression of mortality 27
recent paper (Cheung, S. et al., 2005), this simple geometry of survivorship curves has been shown to be rather more complex.
Along with this were debates about what would happen to morbidity: would older people live longer but suffer disability or illness for many of the later years, or would compression also be seen for sickness (classical papers include Fries, 1980; Manton, 1982; Olshansky et al., 1993). The construction of measures that looked at health in terms of functionalities proceeded at pace, and HEs have become increasingly accepted as conventional tools for health status research and policy analysis (Tobias et al., 2008).
The emerging evidence suggests that increasing longevity has been associated with two trends: a narrowing band of ages at which the majority of people die (compression), and paralleling this, a narrowing range of causes from which most people die. This shift in mortality has been brought about by changes in morbidity, also entailing compression by age and cause. These patterns have been reported widely overseas, and also for New Zealand (Pool, 1994; Cheung, J., 1999; and 2001, a paper cited internationally in Cheung, S. et al., 2005, p. 243).
Robine & Cheung (2008) argue that these trends support the Fries hypothesis. Nevertheless, they strongly qualify this by citing the rapid growth in the number of persons at oldest-old ages, especially centenarians, and emerging evidence of derectangularisation (a shift of the survival curve to the right) as indicative of extension of longevity rather than compression.
Paralleling these trends are the relationships between mortality and morbidity. This is reflected in the growing body of data on HEs and related measures, and decreases in their reciprocal - “life expectancy with severe disability” (Cai & Lubitz, 2007), both overseas and for New Zealand (Ministry of Health, 1999a: Chapter 7; Tobias et al., 2008, 2009a; Pool et al., in press).
Measuring Compression
Siu Cheung et al. (2005) review theories about ‘normal’ longevity, as proposed by Wilhelm Lexis (1837-1914). Using data on Hong Kong, they then make empirical observations on longevity, compression of mortality and related topics. They elaborate on Lexis’ (1878) and Kannisto’s (2001) work to build a framework, the parameters of which are determined by the function “four standard deviations [+/-] from [the Modal age at death, M,

28 Pool et al.
in this case adult deaths only]” (p. 246). The authors delineate and statistically define three dimensions identified by earlier theorists:
• The degree of horizontalisation, which is an incremental plateauing of l(x) values over longer and longer periods of the life-span as”‘infant and premature deaths are reduced”. Clearly, this is a process that is related to, and drives the onset of verticalisation.
• The degree of verticalisation, “the steepness of the survival curve in the region of M. This steepness depends on the concentration of the ages at death around M [i.e. this is a measure of compression]”.
• Longevity extension, which “corresponds to changes in the right-hand tail of the survival curve and describes how far the highest normal life durations can exceed the modal age at death” (Cheung, S. et al., 2005, p. 248).
These parameters are determined, as noted already, by computations of standard deviations around the mode. These calculations are far from easy to perform; indeed, Cheung, S. et al. remark, somewhat obliquely, “one must be able to carry out the indicated operations” (2005: 254). Our data are not sufficiently refined to be able to do this. For earlier cohorts the source data for both our Maori and non-Maori, period and cohort life-tables are abridged, and end at 80-100 years, depending on the date. Although the recent official period ones are full-tables, they also close off at 100, while a cohort analysis carried out by Statistics New Zealand (2006) for the total population (Maori and non-Maori) gives single-year values, again with closure at l(100).5
But we have another concern. For older populations, even in a country like New Zealand, one must question whether age reporting is of sufficient accuracy to carry such refined analyses, especially for the 19th and early 20th century. For example, Kannisto (1994) gave a less than flattering assessment about age-reporting in his review of the data available to study the ‘oldest-old’ in WDCs. The situation is known to be far more severe for Maori. Complete birth registration for Maori was not finally achieved until 1947/48 (Pool, 1977, p. 64), and neonatal death registration finally became complete after World War II (Sceats & Pool, 1985, pp 244-46).6 In this context it must be remembered that life-table computations require accurate reporting both for the denominator (self-reporting by a census respondent)

Differential trends in the compression of mortality 29
and the numerator (a third party who may not have exact details of the deceased’s date of birth). We would also worry whether some single-year age-distributions are the products of actuarial smoothing to eradicate age-heaping and other data concerns. A tendency to exaggerate self-reported ages is also common among the very elderly (Shryock & Siegel, 1976, p. 128, who see elderly as 80+ years).7
Thus we have not used the more exact and powerful statistical techniques prescribed by Cheung, S. et al., but, following some other authors, we have used modes, based on quinquennial age-groups, and arbitrarily selected medians and other percentile-based statistics applied to l(x) and d(x) life-table functions (see Cheung, S. et al., 2005, Table 1). Our rationale for this is that, as the properties of percentiles and modes computed from grouped data are well known and simple, they adequately serve an exploratory comparative study of the sort we are working on. One can also appeal to the old statistical principle that to reduce perturbations, such as those due to less than perfect age-reporting, one should cumulate. For example, as the authors argue, “Intuitively, the degree of horizontalisation can be measured by the age reached by some high percentile of survivors in a life table (i.e. the age reached by 90%, 95% or 99% of the survivors)…”. They then qualify this by adding “ …but this approach is limited to a situation in which infant mortality is low and is undermined by the arbitrary nature of the percentiles”. We must thus accept that we are in breach of a general principle enunciated by Kannisto, whose experience with these data is probably still unsurpassed: that “indicators should be free from any fixed age or percentile determinations…” (pp. 245-46). Our findings are thus indicative rather than definitive.
This is nowhere more problematic than at the oldest ages and for longevity extension, an area according to Cheung, S. et al. that has received limited attention. Moreover, as they stress, the measures often used, such as the age reached by some small defined minority (e.g. one per 10,000) are affected by population size, a problem faced by all researchers of all demographic phenomena relating to older New Zealanders -- even today our population total is only just over four million. This becomes a more urgent issue because “derectangularization of the survival curve is emerging”. Moreover, they point to “a significant growth in the number of centenarians in Europe and Japan, findings that are more in favor of an acceleration in the increase in longevity than a slowing down” (p. 244).

30 Pool et al.
We will not use data on centenarians, as our preliminary investigations suggest that a growth in their numbers as observed today, may be, at least in part, a function of the size of the cohort at birth and inter-cohort decreases in childhood and premature mortality occurring many years ago. But even if we dampen this effect by applying life-table values to birth cohort sizes, there are still problems in making inter-cohort comparisons.8
This analysis focuses on the importance of dynamics at earlier phases of the life-span, and for this we can compare New Zealand’s two major populations, as defined above. As we will show below, there are also some emerging indications of derectangularisation.
Finally, this is an exploratory study only. For that reason we do not look at gender differentials and will use males only, except in the first substantive section where we compare Maori and non-Maori females. There are significant gender differences that have been discussed fairly fully elsewhere (see Pool, 1982, 1994; summarised also in Pool & Cheung, 2003).
New Zealand’s Populations and Health Trends
New Zealand has a higher proportion of its population from outside of Europe than any other WDC.9 About 15 percent of New Zealanders belong to the indigenous ethnic group, Maori, with 8 percent in Pacific ethnicities, 9 percent in Asian and around one percent African and other non-European ethnicities. It should be noted that a growing proportion of the population identify with more than one ethnicity, for example at the 2006 Census roughly half of Maori also identified with at least one other ethnic group.
The Asian population is composed of two very different groupings, each diverse, from East Asia and South Asia, and is a roughly similar proportion of the total population compared to the Australian, Canadian and United States populations. But it is the higher proportion belonging to the indigenous ethnic group which sets New Zealand apart from other WDCs, plus the inflows of large numbers of Pasifika, typically from eastern tropical Oceania.
New Zealand became a colony in 1840. By 1859, the settler population (mainly of British Isles-European origin) outnumbered Maori. This was part of a longer-term decline in numbers of Maori from about 80,000 to 100,000 in 1769 to a nadir of 40,000 around 1890. This decrease was driven mainly by the introduction of diseases to which Maori had no immunity. It was a

Differential trends in the compression of mortality 31
catastrophic loss, but was arguably less severe than the fate suffered by Hawaiians, Tahitians and other Pasifika. In part, and this is important for the analysis that follows, this was because New Zealand was not hit by the great apocalyptic diseases such as smallpox, but instead succumbed to the prevalent diseases of Europe, typically the childhood and other communicable disorders to which they had had no previous exposure such as measles, tuberculosis and influenza.10 Malaria and most other ‘tropical diseases’ were neither endemic nor have they been epidemic in New Zealand. Representing only about six percent of the total in 1901 the proportion of the population who identify as Maori has grown to 15 percent by 2006. This came about despite a rapid decline in fertility in the 1970s, and large migration flows to Australia in particular, a characteristic shared with non-Maori New Zealanders.
By the time the first life-tables were constructed in the 1870s, non-Maori (mainly Pakeha for much of the period covered in this paper) had achieved significantly higher levels of life-expectation at birth than levels recorded from the British Isles’ populations from where they were drawn - even the English. Life expectancy for non-Maori women reached 55 years in 1876, and 60 years in 1901 - seemingly the first national population to attain these levels. Indeed they appear to have had higher levels than seen in Dr. William Farr’s ‘Healthy Districts’.11 This summary statistic obscures an important qualification seen by comparing Pakeha with Norway and Sweden: relatively speaking, e(0) and (15)p(0) values were high, but e(x)s at older ages fell below those for Norway. The reason may have been due to migration - at the end of the 19th century, many and even the majority of Pakeha were British-born, but children were almost all New Zealand-born. The migrants had carried with them their past cohort health experiences, whereas the non-Maori children benefited from conditions in the colony that we will describe below.
Throughout the colonial and post-colonial history of New Zealand, there has never been formal segregation. Even in the 19th century social policy measures applied, in principle, to Maori (e.g. free, compulsory, secular education introduced in 1877). More importantly, critical steps were taken in the early 20th century to reduce health gaps between Maori and non-Maori. The Public Health Act of 1900 set up a Department of Public Health (1901), and a Division of Maori Hygiene, in which the head and most practitioners were Maori medical graduates. These physicians played a

32 Pool et al.
significant role in achieving an improvement in life-expectation at birth from about 25 years in the 1890s to 35 years by 1911. This ensured ‘the survival of the Maori race’, something that had not been certain two decades earlier.
The introduction of a Nordic-style welfare State in 1938 went a step further by making a particular effort to ensure that Maori and non-Maori gained equal access to policy measures and health services. In the 1930s and 1940s concerns were being expressed about Maori health, notably tuberculosis death rates. Between 1940 and the 1960s, a wide range of reforms were introduced to all populations, and were to have a marked beneficial effect, particularly on Maori health. Maori were targeted in screening programmes and interventions, particularly for communicable disorders: in 1945 well over 50 percent of Maori died from this category of disease; by 1976 the level had dropped to 16 percent (Pool, 1991, Table 6.7). Campaigns such as that against tuberculosis were facilitated by the fact that Maori were geographically clustered in the rural northern and eastern North Island of New Zealand. The new chemotherapeutics, available from the 1940s, and improved biomedical and public health services could be accessed by everybody. But the very rapid urbanisation of Maori at this time, a process assisted by Government, accelerated this and also meant that the Maori workforce went quickly through an industrial labour force transformation that had flow on effects for housing, income and general wellbeing. The nesting of health policy into social policy, especially in the campaigns against tuberculosis, was an emblematic feature of these very successful reforms, and this was reflected in rapid advances in Maori survival. As these changes and their health impacts have been reported elsewhere there is no need to go into detail here (Pool, 1991; Pool & Cheung, 2003).
In the 1980s and 1990s there was radical economic restructuring, and associated cohort deterioration. This generated a great deal of concern, expressed in a number of reports and papers published in New Zealand and overseas, about marked social and ethnic differences in health status (esp. Ajwani et al., 2003; Blakely et al., 2005, 2008; Tobias et al., 2009a), and the links between social wellbeing and health - in particular about cardiovascular mortality and its proximate determinants such as diabetes (Smith et al., under editorial review). This was followed more recently by

Differential trends in the compression of mortality 33
attempts to integrate primary and secondary health care. This will be picked up later when we review mortality in relation to morbidity trends.
In sum, a continuing policy objective, for more than a century, has been to effect a convergence between Maori and Pakeha levels of health, while continuing to maintain and improve the high expectancies experienced by Pakeha from the time of early colonisation.
Figures 1 and 2 provide a big picture overview for the Maori and non-Maori epidemiologic transitions to be discussed in subsequent sections of the paper. They graph the values for female e(0) plus the proportion of the period d(x) falling into broad age-groups. Essentially they show how the force of mortality has moved up from childhood to centre at the oldest ages, in this case 75+ years. The Maori transition is much more marked than the non-Maori, with the shift-share by age becoming entrenched from about 1940 onward.
In high mortality populations e(0) is normally lower than e(x) values at age 1, and even up to adult ages. Thus the crossover for Maori, when e(0) started to exceed e(20), is particularly interesting and has useful analytical properties in disaggregating premature mortality from later mortality.12 In the 1880s, a Maori woman reaching her early 30s still had a longer life-expectation ahead of her than she had at birth. As recently as 1976, the non-Maori e(1) > e(0).
The remainder of this paper analyses in more detail at horizontalisation and verticalisation, implicit in these graphs, comparing and contrasting Maori and non-Maori. It also looks for evidence of derectangularisation. Finally it links these results to HEs.

34
Figure 1: Maori femaleyears, and pe44, 45-64, 65
Sources: Computed directly byare from official tablesestimates described in P
Notes: Maori data are highly 1945 on. These are basa given age group, x. Trecent decades that the
Pool e
e life expectancy (years) at birth and at age 20 ercent of all deaths occurring at ages 0-14, 15-5-74, and 75+ (Period life-tables)
y Ian Pool and Jit Cheung from vital data and censuses, 1945 s. Prior to that adjusted official data (1926-1941), or indirPool (1991: pass). unreliable until about 1936, becoming satisfactory only fro
sed on life table deaths, d(x): the number of any cohort dyingThe percent of d(x) at ages below 45 years are so few (<5%)
ey are difficult to discern on this graph.
et al.
on ect
om g at ) in

Differential trends in the comp
Figure 2: Non-Maori f20 years, and15-44, 45-64
Sources: Computed directly byfrom official series.
Notes: These are based on lifeage group, x. The percdecades that they are daverage of tables comexception of 1931, 194been taken six months ending in digits 1 and 6
Horizontalisation
Tables 1 and 2 (below) rapidly and then the trenfor the cohorts born arouafter the 1950s. Neverthcohort of 1921-26 the gyears for the cohorts of(adjusted data), only to because the non-Maori Maori. This was despitesynthetic table of 1986 an
pression of mortality 3
female life expectancy (years) at birth and at agd percent of all deaths occurring at ages 0-14, 4, 65-74, and 75+ (Period life-tables)
y Ian Pool and Jit Cheung from vital and census data, or draw
e table deaths, d(x): the number of any cohort dying at a givcent of d(x) at ages below 45 years are so few (<5%) in recedifficult to discern on this graph. The data for d(1876) are t
mputed for census dates 1874 and 1878, Thereafter, with t41 (when no census was taken) and 1946 (when the census h
earlier in 1945), all censuses are carried out in March of ye6.
show that horizontalisation may be achieved vend plateaus out.13 For non-Maori, this had occurrund 1930; for Maori it was delayed until those boheless, there has been some convergence: for t
gap was 30.2 years, and this had extended to 47f 1941-46, but had dropped back to 17.8 in 19increase again in 2006. This seems to have bevalue increased a little more rapidly than did t
e the Maori value actually decreasing between tnd that of 1996.
35
ge
wn
ven ent the the had ars
ery red orn the 7.9 96 en
the the

36 Pool et al.
Table 1: Horizontalisation: Age (years) by which l(x) has declined to the 90th percentile, Maori and non-Maori males, cohort life tables
Cohorts born Maori Non-Maori 1871-76 -- 0.9 1881-86 -- 1.0 1991-96 0.3 2.6 1901-06 0.4 4.5 1911-16 0.4 17.8 1921-26 0.5 30.7 1931-36 0.8 42.6 1941-46 1.0 48.9 1951-56 4.5 54.1 1961-66 32.7 --
Notes: .. = No Data. __ = Based fully/partially on projections. Projections for non-Maori are more reliable than
those for Maori, so are not reported for Maori. The non-Maori figure for 1951/56 is based in part on projections for the period 2001-06.
Synthetic data (see next table) exaggerate the level of percentiles at older ages, as the younger cohorts included in such tables have markedly better survival rates than true cohorts had had when they were younger.
The Statistics New Zealand (2006) full cohort tables for the average of the birth cohorts of 1901 and 1906 yield a lower value (1.4) than that shown here, but they are for the total population and thus include Maori (0.4). At l(5) the full total population tables are close to the non-Maori used here, 87,793 vs 89,727 (non-Maori) and 65,945. Reweighting the Maori and non-Maori l(5) proportional to population yields 88,300, a difference of only 0.6%.
Table 2: Horizontalisation: Age (years) by which l(x) has declined to the 90th percentile, Maori and non-Maori males, period life tables
Cohorts born Maori Non-Maori 1976 41.0 50.0 1986 46.7 52.6 1996 46.2 (32.7) 58.1 (50.5) 2006 49.5 (35.0) 62.2 (54.1)
Note: Figures in brackets are adjusted results. For each population, the cohort figure is used
to adjust the synthetic data to the cohort, where a reference year allows such an approximation (Maori = Cohort 1961-66/Synthetic 1996; non-Maori = cohort 1951-56/ synthetic 2006). The adjustment was carried only as far as an adjacent date, as the underlying assumptions about distributions of mortality would become difficult to sustain before and after that.

Differential trends in the compression of mortality 37
The cohort data already presented, but using data for quinquennia rather than decades, allow some interesting but speculative comments to be made about the timing and slopes of the two curves. This is shown in Table 3.
What is surprising in this table are the similar values reached by Maori and non-Maori in these periods of most rapid improvement. However, the Maori improvements in survival occurred more rapidly. The cohort of 1951-56 had already fallen off to its 90th percentile by age 4.5 years, but for those born in the 1960s this was 32.7 years after birth. These changes were implemented in a 40 year span running from circa 1958 (4.5 years after the average year of birth of this cohort) to circa 1998. For non-Maori the shift was slower, about 45 years from circa 1908 to circa 1953. This difference in velocity is to be expected as the non-Maori changes had come about primarily through social and economic change, whereas the Maori shifts came through a mix of improvements in socio-economic wellbeing, and social and health policy interventions, including access to modern chemotherapeutics and other bio-medical technology.
Table 3: Age (years) by which l(x) has declined to the 90th percentile, Maori and non-Maori male, cohort life tables, periods of steepest change
Maori, cohorts of 1951-56 to 1961-66 4.5 17.0 32.7
(1951-56) (1956-61) (1961-66)
Non-Maori, cohorts of 1901-06 to 1921-26 4.5 9.3 17.8 22.7 30.7
(1901-06) (1906-11) (1911-16) (1916-21) (1921-26) Nevertheless, the change within non-Maori had occurred at a relatively rapid speed, for an era in which shifts in health were due more to social and economic factors than bio-medical. Certainly, non-Maori benefited more than Maori from the public health reforms of the early 20th century, which were less dependent on chemotherapeutic and other bio-medical technologies than those that came after World War II and more on regulatory measures relating to hygiene and sanitation for water supplies and sewage, food processing and hospitals. But these shifts were also driven by a more latent factor. Between 1876 and 1901 male non-Maori (15)d(0) had decreased very significantly, from 19,636 to 12,655. Public health and medical technology accounted for little if anything in this shift. Instead it

38 Pool et al.
occurred because of social and economic changes that ran the whole gamut from the effects of rapid fertility decline14, to improvements in material wellbeing. This change produced a momentum effect in the l(x) column of life-tables that moved up the age-ranges affecting increasingly older age-groups through the inter-war period (Pool & Cheung, J., 2005).
But these advances were not always sustained. A detailed analysis of the cohort tables for the 1990s, for example, showed evidence of cohort deterioration – slight for non-Maori, more marked for Maori. A first hypothesis was that this could have been an artefact of definitional shifts in the ethnicity question and in coding in that period, but a review of the data showed that these changes probably instead statistically dampened the effects of any deterioration. An alternative hypothesis relates to the radical economic neo-liberal restructuring of the period, which inter alia pushed disproportionately more Maori than non-Maori into casual employment and other forms of marginalisation.15 It was concluded that the negative effects of marketisation, the stripping of the welfare state and the elimination of many of the jobs in which Maori were clustered (e.g. manufacturing). In turn, it was argued, “the deterioration in [the 1990s], especially for Maori male cohorts, was a residual effect of cycles of cohort gain and deterioration reinforced by period effects coming from restructuring”. For female Maori cohorts, who had had very high levels of fertility followed by a rapid decrease, but retaining early child-bearing (TFR. 6.1, 1961; 5.0,1973; 2.8 1978) and who were over-represented in occupations affected by the shift to casualisation, the case was made that “the negative effects of restructuring on Maori reinforced the residual cohort effects coming from a history of high fertility” (Pool & Cheung, 2003, pp. 122-23).
The most radical shifts in the process of horizontalisation, and the factor that sets the trajectory, come at infancy and early childhood. It is possible in this regard to use a mix of cohort and synthetic data without the results being affected in any significant way. This is done in Table 4, which presents values for the entire period. Three key results are shown by these data. First, (5)d(0) is high at the start of the transition; very high -- almost half the total d(x) -- in the case of Maori. Secondly, the levels drop very rapidly triggering horizontalisation. Thirdly, by the end of the transition ethnic differentials have all but disappeared.
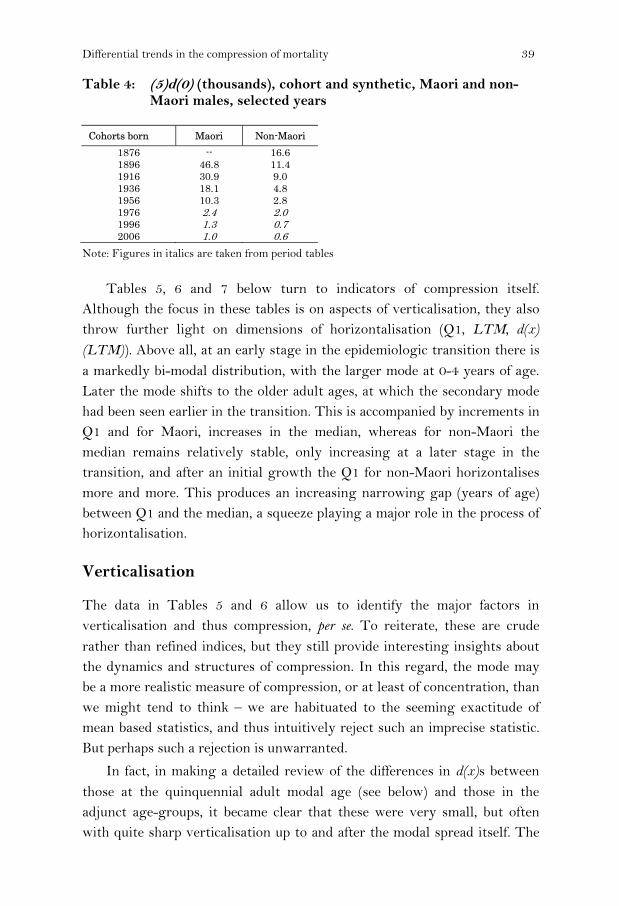
Differential trends in the compression of mortality 39
Table 4: (5)d(0) (thousands), cohort and synthetic, Maori and non-Maori males, selected years
Cohorts born Maori Non-Maori 1876 -- 16.6 1896 46.8 11.4 1916 30.9 9.0 1936 18.1 4.8 1956 10.3 2.8 1976 2.4 2.0 1996 1.3 0.7 2006 1.0 0.6
Note: Figures in italics are taken from period tables Tables 5, 6 and 7 below turn to indicators of compression itself. Although the focus in these tables is on aspects of verticalisation, they also throw further light on dimensions of horizontalisation (Q1, LTM, d(x) (LTM)). Above all, at an early stage in the epidemiologic transition there is a markedly bi-modal distribution, with the larger mode at 0-4 years of age. Later the mode shifts to the older adult ages, at which the secondary mode had been seen earlier in the transition. This is accompanied by increments in Q1 and for Maori, increases in the median, whereas for non-Maori the median remains relatively stable, only increasing at a later stage in the transition, and after an initial growth the Q1 for non-Maori horizontalises more and more. This produces an increasing narrowing gap (years of age) between Q1 and the median, a squeeze playing a major role in the process of horizontalisation.
Verticalisation
The data in Tables 5 and 6 allow us to identify the major factors in verticalisation and thus compression, per se. To reiterate, these are crude rather than refined indices, but they still provide interesting insights about the dynamics and structures of compression. In this regard, the mode may be a more realistic measure of compression, or at least of concentration, than we might tend to think – we are habituated to the seeming exactitude of mean based statistics, and thus intuitively reject such an imprecise statistic. But perhaps such a rejection is unwarranted.
In fact, in making a detailed review of the differences in d(x)s between those at the quinquennial adult modal age (see below) and those in the adjunct age-groups, it became clear that these were very small, but often with quite sharp verticalisation up to and after the modal spread itself. The

40 Pool et al.
impression that comes from that review is that the mode, rather than being a spike, as it were, is fitted by a broad bell-shaped curve. This is merely a methodological observation at this point, yet the question must be raised whether or not it has wider theoretical, substantive and even policy implications. This becomes a more pressing issue when synthetic life-table data are employed (see Table 7).
Turning to the results in Tables 5 and 6, a number of points stand out.
• Medians for non-Maori are relatively stable across cohorts, while those for Maori increase. This may mean be an indicator of the steps towards horizontalisation (Maori), and an indication (non-Maori) of the achievement of verticalisation.
• Q1 increases rapidly for Maori, but after such a surge then plateaus increasingly at what historically would have been regarded as a geriatric age. The ranges for the Q1 are huge: Q1 for the most recent non-Maori cohorts is 100+ times the age of that for the earliest Maori cohort.
• In contrast, Q3 is high, stable and not very different for both populations.
• As a result, the gap between the median and Q1 decreases, a clear result of horizontalisation, and then shows the effects of verticalisation.
• The gap between Q3 and the median remains stable for non-Maori, but decreases for Maori. By the cohort of 1921-26 the ethnic differences are relatively limited. For non-Maori the IQR also declines rapidly at first and then more slowly, but converging towards the Q3 – Median range. This ethnic difference is clearly a function of the timing differences for the two transitions.
• In Table 7 synthetic life-table data are presented on Qs and Medians, with all the caveats that we noted earlier. But they do suggest that there has been a convergence with Maori ages for Qs and the median converging on the non-Maori, which still remain higher Q-Median and IQ ranges for Maori are now smaller than for non-Maori, but this will be in part a function of censoring biases, so is a far from definitive finding.
These two tables also present a number of findings on modes. In interpreting these it is necessary to recognise the methodological point we

Differential trends in the compression of mortality 41
made earlier – that the modes are uneven mesa-like shapes rather than spikes. The table provides separate data on both life-time (0+ years), and, following Cheung, S. et al. (2005), adult modes (15+ years).
• At earlier dates, for both populations the life-time mode is centred at ages 0-4 years; but for non-Maori in more recent years the life-time mode is the adult mode.
• For both populations, the age-groups represented in, and the size of the d(x), for adult modes, and particularly for the spread around the modes, remain remarkably stable, especially for non-Maori, but with a suggestion of compression for non-Maori for younger cohorts. Larger d(x) values are also starting to show up for both populations in the age-groups immediately above the spread around the mode (Table 8), 8-84 years for Maori and 90-94 for non-Maori. This might be interpreted as an early sign of derectangularisation.
• There is, however, a persisting gap between Maori and non-Maori for adult modes, and the two populations seem to move almost in tandem (as indicated in Table 8). This raises the question whether these are purely an artefact of the different stages reached by each population, or whether the patterns of a ‘normal’ lifespan vary between groups.
Table 5: Maori male cohort life-table verticalisation
Cohorts born 1891-96 1901-06 1911-16 1921-26 1931-36
Years Median 13.8 40.2 47.9 49.4 62.6 Quartile 1 0.7 0.9 1.0 4.6 22.6 Quartile 3 60.3 67.1 68.7 72.8 .. Gap Median – Q 1 13.1 39.3 46.9 44.8 40.0 Gap Q 3 – Median 46.5 26.9 20.8 23.4 .. Inter-Quartile Range 59.6 66.2 67.6 68.2 .. Lifetime Modal Quinquennial Age at Death (LTM) 0-4 0-4 0.4 0.4 ..
d(x) (LTM)(000) 46.8 34.1 30.9 25.5 .. Modal Adult Age at Death (AM) 65-69 60-64 65-69 65-69 d(x) (AM)(000) 5.8 7.3 7.7 8.2 d(SAMx)/d(15+) 33% 34% 34% 33%
Notes: Figures relate to Years, except d(x) values, which are in 000s or %s. d(SAMx) = d(AMx) + (dAMx+5) + (dMx-5), where x = 5 year age-group.

42 Pool et al.
Table 6: Non-Maori male cohort life-table verticalisation
Cohorts born 1871-76 1881-86 1891-96 1901-06 1911-16 1921-26 1931-36
Years Median 67.5 68.0 68.5 70.3 71.6 74.8 76.5 Quartile 1 32.3 44.1 54.9 55.7 57.9 60.7 65.1 Quartile 3 77.9 78.6 78.9 79.7 80.7 84.7 87.3 Gap Median – Q 1 35.2 23.9 13.6 14.6 13.7 14.1 11.4 Gap Q 3 – Median 10.4 10.6 10.4 9.4 9.1 9.9 10.8 Inter-Quartile Range (IQR) 45.6 34.5 24.0 24.0 22.8 24.0 22.2 Lifetime Modal Quinquennial Age at Death (LTM)
0-4 0-4 75-79 70-74 70-74 80-84 85-89
d(x) (LTM)(000) 16.6 13.2 13.7 13.4 12.6 13.4 14.8 Modal Adult Age at Death (AM) 75-79 75-79 75-79 70-74 70-74 80-84 85-89 d(x) (AM)(000) 11.7 12.8 13.7 13.4 12.6 13.4 14.8 d(SAMx)/d(15+) 41% 42% 43% 43% 40% 40% 44%
Notes: Figures relate to years, except d(x) values, which are in 000s or %s. d(SAMx) = d(AMx) + (dAMx+5) + (dMx-5), where x = 5 year age-group. __ = Based fully/partially on projections. Projections for non-Maori are more reliable than
those for Maori, so are not reported for Maori.
Tables 7 and 8 draw on recent period data. It is not clear whether differences with cohort changes are real or merely a methodological artefact of the effects of using synthetic results rather than cohort ones. They suggest, however, that a gap in survival still exists. The Maori adult modal spread is compressing to become a higher and higher percent of the adult d(x), but the changes are almost in parallel with non-Maori so the gap is not closing. Two-fifths of the Maori adult d(x) and more than half of all non-Maori d(15+) occur over only about 17 percent of the adult life-span (15-105 years).
Finally, the data on Independent Life Expectancy (ILE, free from disability requiring assistance) from recent HE tables point to a similar direction. Today, both Maori and non-Maori are spending an increasing part of their old age – at the ages around which compression of d(x) is also occurring – also free from disability-based dependence. Moreover, Maori levels seem to be converging on non-Maori. But ILEs are also expanding; durations free from dependence are longer.

Differential trends in the compression of mortality 43
Table 7: Recent (2005-07) Official Period Life-Table data Q1, median and Q3 values, Maori and non-Maori males
Maori Non-Maori Gap: Maori – Non-Maori
Quartile 1 62.7 73.6 10.9 Median 73.5 82.2 8.7 Quartile 3 82.0 88.4 6.4 Median-Quartile 1 10.8 8.6 -2.2 Quartile 3-Median 8.5 6.2 -2.3 Inter-Quartile Range (IQR) 19.3 14.8 -4.5
Table 8: Recent Maori and non-Maori period data from life tables and health expectancies
Maori Non-Maori 1996 2001 2006 1996 2001 2006 l(75) 34,037 40,082 45,898 61,068 66,633 71,793 D(SAMx)/d(15+)% 41 43 43 50 52 53 AM 65-79 65-79 65-79 75-89 75-89 75-89 ILE(65)* 6.8 8.0 10.3 9.9 9.7 12.0
* Independent Life Expectancy (ILE, free from disability requiring assistance, Yrs) Notes: d(SAMx) = d(AMx) + (dAMx+5) + (dMx-5), where x = 5 year age-group. ILE data are from unpublished series, Ministry of Health. Because of risk of sampling and
other statistical errors, Maori data for ILEs are not accepted as highly reliable.
There is another possible aspect to this. Without resorting to Social Darwinism, we must remember that many older persons living without disability, whatever level, represent the hardy survivors of past epidemics and other life experiences that affect health and disability. This will be truer for Maori than for non-Maori as Maori cohorts have gone through the processes of horizontalisation and verticalisation after non-Maori. A clue to this is a measure computed for the 2006 HLEs – a so-called “survival curve”, combining the life-table L(x) with ILEs, and defined as person years lived without Level 2 disability. The Maori figure for age-group 70-79 years is 28,303 and the non-Maori is 41,302. This shows that cohort effects play an important role in fashioning disability and survival at older ages.
This raises two issues. First, as cohorts more widely representative of health experiences in the past, perhaps including in their number persons who survive because of advances in bio-medical technology, rather than dying, more and more could face ILE-level dependency or worse. For example, the interaction between having diabetes and survival on renal dialysis, and surviving but without independence, might be an example.

44 Pool et al.
Secondly, health planners and policy makers in New Zealand, and elsewhere, must be aware of the fact that the experiences of cohorts of different sub-populations will vary. This means that there must be targeted surveillance and intervention, not just by socio-economic group but by cohort (see Discussion).
Discussion
This paper has identified the very different trajectories for the epidemiologic transitions of two New Zealand sub-populations. The results show that epidemiological polarisation has been evident, markedly in the 19th and early part of the 20th centuries, but over the long term there is a degree of convergence. The data presented above show that convergence is not necessarily assured, but may require strategic interventions, and, as a consequence of this, the rates of closing-in can vary over time. The interventions must not only counteract period differences in wellbeing, access to health services and health status, but also must respond to cohort factors - for persons at middle and older ages, these are the differing cohort experiences, social and health, to which they have been exposed earlier in their life-spans. To add to this, the way the health system is fiscally organised– either through private insurance, or mainly publicly-funded - can make a difference, as a recent United States-Canada comparison shows (Huguet et al., 2008). New Zealand’s system is similar to the Canadian, so, in principle, hospital care and much of primary and pharmaceutical care is free or subsidised. Both the public health campaigns of the early 20th century, and the post-war programmes, which were responsible for a major step forward in closing gaps between Maori and non-Maori, were publicly funded.
Early non-Maori health status benefited from high per capita incomes (arguably the highest anywhere in the late 19th century), and associated factors such as diet. A bonus, as it were, came from a rapid decline in fertility. From the beginning of the 20th century, both public health and bio-medical factors gradually became more and more significant in maintaining high levels of survival, although the cohort momenta affected the l(x) function of the life-table - a latent effect produced by the radical declines in infant and childhood mortality in the late 19th century. In the post-war period, the non-Maori e(0) slipped gradually in rank among WDCs, but the range of expectancies had become narrow among members of this privileged

Differential trends in the compression of mortality 45
club – a sort of a ‘rich list’ of health status, where ranks change but the overall differences are minor on a global scale.
The differences between non-Maori and other populations on the ‘rich list’, whether in 1890, 1906, 1990 or 2006, or any other year, were far less than the epidemiological polarisation apparent within New Zealand itself. We deal with only one such dimension here – between Maori and non-Maori.16 Over the long term there was incomplete convergence, but this has tended to go in starts and stops, with the particular phase dependent to a large degree on the policy environment and thus the service programmes being delivered at any one time.
Historically, there were long periods in which, more by neglect than design, decreases in the gap between Maori and non-Maori were gradual. This was not because separate and unequal services were available, but because Maori were mainly living in isolated areas, away from health facilities, and were dependent on a semi-subsistence income or casual work. The descriptions of life on the East Coast of the North Island – a region with high concentrations of Maori – in a very competent social-epidemiological study of tuberculosis in the 1930s show this (Turbott, 1935). At this juncture the non-Maori e(0) at 65 years for males and 68 years for females, was among the highest anywhere, and contrasted markedly with Maori at 46.3 years for males and 46.0 for females (Pool 1985: Tables 116 and 124).17 The key to reducing gaps, therefore, was being more assertive in getting services out to Maori.
Between these phases when little happened to accelerate convergence, there were interventionist phases which had major positive benefits in closing gaps. Earlier in this paper two were highlighted: the WHO ‘Alma Ata-like’ programmes of public and community health driven by Maori physicians working in the Department of Health in the first decade of the 20th century; and the wide-ranging, comprehensive and effective programmes introduced in the 1940s after New Zealand had established a comprehensive welfare state (1938).
From the late 1960s these concerns seemed to be less marked, except for a focus on infant mortality, resulting in the attainment of almost no differential in neo-natal rates by about 1981 and decreases in the post-neonatal gap. By 2006, rates had decreased for both groups, but more rapidly among non-Maori, so a gap still existed. As a result, the absolute difference was greater at the neonatal age than it had been in 1981, but not

46 Pool et al.
at the post-neonatal. At both ages, though, relative differences had actually extended. Nevertheless, both were low by world standards, so that most of the risks at infancy had been eliminated.18 These rates - the post-neonatal rate in particular - reflect social and economic conditions, including the impacts of economic restructuring on Maori families, as well as health factors.
There was a period of socio-economic crisis provoked by neo-liberal restructuring during the late 1980s and early 1990s, in which many of the social welfare state props “were effectively eliminated in New Zealand” (Esping-Andersen, 1999, p. 89). This seems to have been associated with the cohort deterioration in survival discussed earlier. In the early 21st century however, there was a return to targeting sub-populations with greater needs. This was achieved by integrating primary and secondary services - for example, screening more effectively for diabetes (Smith et al., under editorial review), and by more systematic referral of more advanced cases to secondary or tertiary facilities. This meant that hospitalisations increased, and, because people (most commonly Maori or Pasifika) were presenting late, longer and more complex procedures had to be carried out. (For example, a spike in hospitalisations of Maori males around 2004, especially of older men diagnosed with cardiovascular causes appears to have come from improved screening and diagnosis at a primary health care level, coupled with increased referral into the hospital system.) Hospitalisation utilisation expectancies19 for Maori men aged 70 years increased, by comparison with years before and after that date, but, interestingly d(x), the ultimate measure of the success or failure of the system, were lower (Pool et al., forthcoming).
These three interventionist periods directed at gaps in health status could be summarised as follows:
• Period 1 (1900-1910): was one of community health approaches
addressing major issues of sanitation and housing; • Period 2 (1945-1961): saw the reduction of communicable disease
mortality, both the common acute infectious diseases and tuberculosis;
• Period 3 (early 2000s): complex campaigns against chronic non-communicable diseases and their co-morbidities.

Differential trends in the compression of mortality 47
Conclusion
Horizontalisation and verticalisation have occurred for both parts of a dichotomous split of the New Zealand population but much later, yet faster, for Maori than for non-Maori. A gap in health status between Maori and non-Maori has always existed and still exists, yet there is an indication of long-term convergence. Over three periods, the first decade of the 20th century, post-World War II and during the first decade of the 21st century convergence was accelerated by policies that aimed at closing gaps, and involved direct intervention at a community and individual level.
The first comprehensive intervention showed how much can be achieved by simple community health measures. The second, after World War II, shows that a great deal can be achieved by public health and bio-medical technologies appropriate for campaigns directed primarily at communicable disorders. But these data also show that gains achieved in this way, without a systematic and continuing underpinning of this by improved social and economic wellbeing, and the careful monitoring of higher risk populations, may be difficult to sustain. In New Zealand this was compounded by the negative impacts of economic and social policy, introduced for economic restructuring purposes rather than health development goals, using neo-liberal strategies, and without recognising the differential cohort health vulnerabilities in some ethnic groups. Under these circumstances, as in New Zealand, improvements in survival may decelerate or even show signs of cohort deterioration.
There is an irony to add to this: because of the success of earlier health programmes, there has been a shift-share in ages at which increased morbidity and d(x) cluster. Again, because of successful earlier disease control programmes, there has been a parallel shift-share in the mix of causes of morbidity and mortality -- from communicable causes, which are more likely to respond to simpler interventions, to non-communicable diseases that require more complex responses. Moreover, these are exactly the causes and ages at which co-morbidities confound the effects of interventions. The response that came in the 2000s, necessarily involved more complex forms of intervention than those which had achieved the post-war health gains for Maori. The prognosis must be that to achieve further closing of gaps (and also those between Pasifika and the Pakeha population)

48 Pool et al.
must involve increasingly complex, multi-tiered programmes of screening, primary care, referral and secondary or tertiary procedures.
Acknowledgement
We wish to thank Drs Gary Jackson, Counties-Manukau District Health Board, and Martin Tobias, Ministry of Health, for their advice and for data and papers they have made available to us.
Notes
This article was originally a presentation given at the conference of the Reseau d’Esperance de Vie En Sante (REVES) in Copenhagen, Denmark, on 29 May 2009.
1 We refer here to the northern, western and peninsular-Mediterranean countries
and micro-states of continental Europe, as far east as Austria (excluding the states in transition – the Baltic, central European and Balkan states that were formerly a part of the ‘Soviet Bloc’), the Russian Federation and Turkey; plus Europe’s offshore island-nations - Malta, Iceland, Ireland and the United Kingdom; and, outside Europe, Australia, Canada, Japan, New Zealand and the United States. For Europe, this could be seen as countries to the west of the Hajnal line.
2 The use of the term ‘non-Maori’ here refers to people who at the time of recording information did not state that they were of Maori ethnicity. It does not purport to be in any way regarded as an exclusive ethnic group and is used with the awareness that this traditional term is fraught. Thus non-Maori is a diverse residual.
3 Citing Lexis, whose ideas on the concept of ‘normal life durations’ built on the work of both Quetelet and Laplace to give statistical power to his notions on “…common human longevity… [T]he concept of an average man is not an arithmetic mean, but a typical, central value along a normal curve that expresses the deep nature of things. The modal age at death…” (Cheung, S. et al., 2005, p. 246).
4 Unfortunately we cannot at present take the non-Maori back much further, but ongoing work by Professor Ian Pool, as part of a broader analysis of New Zealand’s demographic history, will attempt to make estimates for earlier periods to see whether non-Maori tables at around 1860 showed compression at young ages.
5 The co-authors of the present paper, Boddington, Cheung and Didham, played instrumental roles in the construction of these tables, along with the lead researcher Kim Dunstan.
6 This is despite the fact that New Zealand had instituted free, compulsory education for Maori and non-Maori as early as 1877, an undertaking fully implemented by late in the 19th century. Moreover, it had a welfare state dating from the 1890s but then greatly extended by the 1938 Social Security
Differential trends in the compression of mortality 49
Act, which covered Maori and non-Maori equally, and the administration of which was dependent on the reporting of age and other vital details.
7 For Maori this tendency is far more marked. Even as recently as 1956, there were 13 Maori and 22 non-Maori centenarians, yet the non-Maori population was 15 times the size of Maori at that date.
8 The centenarians of today were born at the beginning of the 20th century and their comparators for studies of improvements in survival were born between the 1870s and 1900. Among non-Maori the quinquennial male birth cohort size between 1876-81 and 1901-06 rose from 43,350 to 57,375. Then, after allowing for changes in the survival regimes over their life spans to age 99 years experienced by these birth cohorts between these birth dates and when they became centenarians, the number of centenarians would be expected to have tripled between the 1970s to around 2001-06. A major inter-cohort improvement in the survival of these cohorts came before they had reached age 35 years, a decrease of 6,701, or 29% at (35)d(0), compensated by a small increase of 3,088, or a rise of 7%, for (40)d(35), and a further increment of 2,799, or 8%, for (20)d(75), the ages at which compression is being felt. There was also a significant percentage change at 95+ years, 131%, but only a numerical increase of 814. Standardising for duration, per year of age there were 191 fewer deaths at 0-34 years, but 77 more per year at 35-74, 139 more at 75-94, and an extension in the force of mortality of 81 life-table deaths per year at age 95 years and over. Taking absolute values, the gains in survival at age group 0-34 years accounted for 50% of this shift-share, and the increases in d(x) at 35-74 for 23%, at 75-94 for 21% and at 95+ for 6%; or weighted for differing durations, 39% at 0-34, 16% at 35-74, 29% at 75-94 and 16% at 95+. These data allow us to infer that longevity extensions have occurred, but the evidence on the oldest-old is weak in part because of data and measurement problems.
9 If all Hispanic-Americans are counted as ‘non-European’, then New Zealand and the United States share similar proportions of ‘non-European’, but many Hispanics are classified as ‘white’.
10 A ship with smallpox aboard berthed in Wellington in the 1840s but passengers were not allowed to land. A small-scale smallpox epidemic did occur in 1913 in a region with many Maori, but was quickly contained by a team led by (Dr) Sir Peter Buck (Te Rangihiroa), who was a Member of Parliament and a medical practitioner, and who later became a distinguished Professor of Anthropology at Yale and the leading Pacific ethnographer of the 1920s. He also wrote what is probably New Zealand’s first piece of modern epidemiology on this epidemic (Te Rangihiroa, 1914), a study which, inter alia, compared fatality rates between the vaccinated and non-vaccinated.
11 A separate analysis underway by Professor Ian Pool is comparing mortality in the British Isles, especially inter-country regional differences for England with those in New Zealand. There was massive immigration from the British Isles into New Zealand in the 1860s and 1870s, after which flows dropped off radically, almost to nothing. A further analysis, looking at these migration trends, will review (15)p(0) prior to when the main inflows to New Zealand occurred, for English regions from which major emigrant flows to New Zealand were drawn, and analysed by Robert Woods (2000) in his seminal book, to

50 Pool et al.
compare with the p(x) values at older ages in New Zealand around 1876-1881. The analysis is partly to test for selective migration, and partly to respond to a comment by Jim Oeppen about the low correlation between socio-economic status and mortality in ‘healthy districts’ in the “Home Counties”, and James Vaupel about Sweden, oral presentation of Pool and Cheung 2005 (reported fn 1) at the Max Planck Institute, Rostock. A parallel test for the effects of selective migration on Pakeha fertility, which was very high in the 1870s (TFR 7.0) showed no relationship between New Zealand fertility levels and British region of origin (Pool et al., 2007).
12 The Italian demographers Gabriella Caselli and Viviana Egidi wrote a series of instructive papers on Italy and Europe highlighting geographical differences between e(0) and adult e(x), which raise important questions about the varying paths of the epidemiologic transition (Caselli & Egidi, 1980; also 1981).
13 Only one measure, when the population drops below the 90th percentile, is used here. First cohort data are drawn on, and then recent period tables are analysed.
14 The TFR moved from 7.0 in 1876 (a marital TFR of almost 9.0) to 3.5 by 1901, a change resulting from what Dutch demographers Engelen and Kok describe as closing down the ‘nuptiality valve’ (cited Pool et al., 2007). This had major impacts on families, including decreases in child accident death rates as supervision of younger siblings shifted to parents from older siblings; all the expected benefits from improvements in housing, disposable income/ family member and thus things like nutrition, and declines in risks of cross-sibling infection and overcrowding. Add to this declines in maternal mortality, and, more importantly, decreases in female death rates at reproductive and post-reproductive ages due to a wide range of causes, notably tuberculosis, determined at least in part by the ‘physiological burden of child-bearing’ (Pool and Cheung, 2005, citing American bio-demographer Ingrid Waldron).
15 The Pasifika minority in the non-Maori population were as adversely affected as Maori.
16 Clearly there are others, including social class and geographical differences. Because of the social demography of New Zealand, these tend to be confounded by the ethnic differential on which we have focused.
17 It is worth recalling that in 1940, Japan’s e(0)s were only 48 years (m) and 51 (f); Australia’s were 64 (m), 68 (f), England and Wales 59(m), 64 (f), Sweden 65 (m), (68 (f).
18 1981: Neonatal (month 0), Maori 6.3, non-Maori 5.4; Post-neonatal, Maori 9.1, non-Maori 5.7, (Sceats & Pool, 1985, Table 147); 2006: Neonatal, Maori 4.6, non-Maori 2.1; post-neonatal, Maori 4.6 and non-Maori, 1.5. The post-neonatal rates reflect social and economic conditions as well as health factors.
19 Life-tables constructed using a Sullivan’s observed prevalence method, giving expectancies (days) for admission to hospital while still surviving (Cheung, J. et al., 2001).
Differential trends in the compression of mortality 51
References
Ajwani, S., Blakely, T., Robson, B., Tobias, M. & Bonne, M. (2003). Decades of disparity: Ethnic mortality trends in New Zealand, 1980-99. Wellington, Ministry of Health and University of Otago.
Buck, see Te Rangihiroa. Blakely, T., Tobias, M., Robson, B., Ajwani, S., Bonne, M. & Woodward, A. (2005).
Widening ethnic mortality disparities in New Zealand 1981-99. Social Science and Medicine, 61,10: 2233-51.
Blakely, T., Tobias, M. & Atkinson, J. (2008). Inequalities in mortality during and after restructuring of the New Zealand economy. British Medical Journal, 336: 371-75.
Cai, L. & Lubitz, J. (2007). Was there compression of disability for older Americans from 1992-2003? Demography, 44,3: 479-95.
Caselli, G. & Egidi, V. (1980). Le differenze territoriali di mortalita in Italia: Tavole de mortalita provinciali 1971-72. Rome, Instituto de Demografia, Universita di Roma.
_______ & Egidi, V. (1981). Geographie de la mortalite en Europe: Influence de l’environment et de certains aspects du comportment. International Union for the Scientific Study of Population, Conference, Manila, Liege, IUSSP:v2: 165-206.
Cheung, J. (1999). Mortality, morbidity and population health dynamics. Unpublished PhD thesis, Hamilton, University of Waikato.
_______ (2001). The long-term trend of non-Maori mortality and its more recent compression effect. Paper presented at Population Association of New Zealand Conference, 28-29 June, Wellington.
_______, Katzenellenbogen, J., Baxendine, S., Pool, I. & Jackson, G. (2001). Health utilisation expectancies in NZ, 1980-98. Australian Health Review, 24,4: 46-56.
Cheung, S., Robine, J-M., Tu, E & Caselli, G. (2005). Three dimensions of the survival curve: Horizontalization, verticalization and longevity extension. Demography, 42, 2:243-58.
Esping-Andersen, G. (1999). Social foundations of post-industrial economies. New York, OUP.
Fries, J (1980). Aging, natural death and the compression of mortality. New England Journal of Medicine, 303: 130-35
Huguet, N., Kaplan, M. & Feeny, D. (2008). Socio-economic status and health-related quality of life among Elderly People: Results from the Joint Canada/United States Survey of Health. Social Science and Medicine, 66: 803-10.
Johnstone, K., Cheung, J., and Pool, I., with Dharmalingam, A. & Hillcoat-Nalletamby, S. (1998). Health Measures: Principles and applications to New Zealand data. Hamilton, Population Studies Centre, University of Waikato.
Kannisto, V. (1994). Development of oldest-old mortality: Evidence from 28 countries. Odense University Press, Monographs on Population Ageing, Odense.
Levy, M-L. (1998). Raisonner sur le vieillissement. Population et Societes, # 341, Dec. Manton, K. (1982). Changing concepts of mortality and morbidity in the elderly
population. Milbank Memorial Fund Quarterly/Health and Society, 60: 183-244.

52 Pool et al.
Oeppen, J. & Vaupel, J. (2002). Broken limits to life expectancy. Science, 296: 1029-31.
Olshansky, S., Carnes, B. & Cassel, C. (1993). The Aging of human species. Scientific American, 268, 4: 18-24.
Pool, I. (1977). The Maori population of New Zealand, 1769-1971. Auckland, Auckland University Press.
______ (1982). Is New Zealand a healthy country? The centenary of Dr Alfred Newman’s affirmation “That it is yet the healthiest on the face of the globe”. New Zealand Population Review, 8,2: 2-27.
______ (1983). Changing patterns of sex differentials in survival: An examination of data for Maoris and non-Maoris in New Zealand. In A. Lopez, & L. Ruzicka (Eds), Sex Differentials in Mortality: Trends, Differentials and Consequences, Proceedings of ANU/UN/WHO Meeting, Canberra Dec 1981, Canberra, Dept of Demography, ANU: 193-219.
______ (1985). Mortality Trends and Differentials. In Population Division, ESCAP (Eds) The Population of New Zealand: Country Monograph # 12, 2 vols. Bangkok and New York, United Nations: 1: 209-42
______ (1991). Te iwi Maori: A New Zealand population past, present and projected. Auckland, Auckland University Press.
______ (1994). Cross-comparative perspectives on New Zealand’s health. In J. Spicer, A. Trlin, & J. Walton (Eds), Social dimensions of health and disease: New Zealand perspectives. Palmerston North, Dunmore Press.
______ & Cheung, J. (2003). A cohort history of mortality in New Zealand. New Zealand Population Review, 29,2: 107-138.
______ & Cheung, J. (2005). Why were New Zealand levels of life expectation so high at the dawn of the 20th century?. Genus, LXI, 2: 9-33.
______, Dharmalingam, A. & Sceats, J. (2007). The New Zealand family from 1840: A demographic history. Auckland, Auckland University Press.
______., Amey, B., Cameron, M. & van der Pas, S. (2009). Health and wellbeing among older New Zealanders. In P. Koopman-Boyden & C. Waldegrave (Eds), Enhancing wellbeing in an ageing society: 65-84 year olds in New Zealand in 2007. Hamilton, University of Waikato: Chapter 4.
______, Baxendine, S., Cheung, J., Coombs, N., Dharmalingam, A., Katzenellenbogen, J. & Sceats, J. (forthcoming) Sub-national differentials in health in an era of restructuring: New Zealand 1981-2001, Hamilton, Population Studies Centre, University of Waikato.
Robine, J-M. (2008). The compression of mortality. Paper presented at the Australian Population Association Conference, Alice Springs, July 2008.
Robine, J-M. & Cheung, S. (2008). Nouvelles observations sur la longevite humaine. Revue Economique, 59,5: 941-53.
Sceats, J. & Pool, I. (1985). Perinatal and infant mortality. In Population Division, ESCAP (Eds), The Population of New Zealand: Country Monograph # 12, 2 vols, Bangkok and New York, United Nations: v,1, 243-68.
Shryock, H. & Siegel, J. (1976). The methods and materials of demography. New York: Academic Press.

Differential trends in the compression of mortality 53
Smith, J., Jackson, G., Orr-Walker, B., Jackson, R., Sinclair, S., Thornley, S., Riddell, T., & Chan, W. (Under editorial review). A population-based approach to the estimation of diabetes prevalence and quality of care.
Statistics New Zealand. (2006). A history of survival in New Zealand: cohort life tables 1876-2004. Wellington, Statistics New Zealand.
Te Rangihiroa. (1914). The smallpox epidemic among Maoris of the Northern District. [Proceedings] Australian Medical Congress, Melbourne, 10th Session, Feb: 212-24.
Tobias, M., Yeh, L-C., Salzano, S., Smith, C., Mason, S. & Lash, B. (2008). Health expectancy: towards Tier 1 official statistic status. A joint Ministry of Health and Statistics New Zealand Discussion Paper. Wellington, Ministry of Health and Statistics New Zealand.
_________ Yeh, L-C., Salzano, S., Smith, C., Pinkerton, J. & Lash, B. (2009a). Longer life, better health: trends in health expectation in New Zealand 1996-2006. Wellington, Ministry of Health and Statistics New Zealand.
_________ Blakely, T., Matheson, D., Rasanathan, K., & Atkinson, J. (2009b). Changing trends in indigenous inequalities in mortality: lessons from New Zealand. International Journal of Epidemiology, 2009, 1-12.
Tuljapurkar, S., Li, N. & Boe, C. (2000). A universal pattern of mortality decline in G-7 countries. Nature, 412, 2 Aug: 490-91.
Turbott, H. (1935). Tuberculosis in the Maori, East Coast, New Zealand. Wellington, Government Printer.
Woods, R. (2000). The demography of Victorian England and Wales. Cambridge, Cambridge University Press.

New Zealand Population Review, 35:55-74. Copyright © 2009 Population Association of New Zealand
The Demographic Transformation of Inner City Auckland
WARDLOW FRIESEN * Abstract
The inner city of Auckland, comprising the inner suburbs and the Central Business District (CBD) has undergone a process of reurbanisation in recent years. Following suburbanisation, redevelopment and motorway construction after World War II, the population of the inner city declined significantly. From the 1970s onwards some inner city suburbs started to become gentrified and while this did not result in much population increase, it did change the characteristics of inner city populations. However, global and local forces converged in the 1990s to trigger a rapid repopulation of the CBD through the development of apartments, resulting in a great increase in population numbers and in new populations of local and international students as well as central city workers and others.
he transformation of Central Auckland since the mid-twentieth century has taken a number of forms. The suburbs encircling the Central Business District (CBD) have seen overall population
decline resulting from suburbanisation, as well as changing demographic and ethnic characteristics resulting from a range of factors, and some areas have been transformed into desirable, even elite, neighbourhoods. Towards the end of the twentieth century and into the twenty first century, a related but distinctive transformation has taken place in the CBD, with the rapid construction of commercial and residential buildings and a residential population growth rate of 1000 percent over a fifteen year period. While there are a number of local government and real estate reports on this phenomenon, there has been relatively little academic attention to its nature
* School of Environment, The University of Auckland. Email: [email protected].
T

56 Friesen
and causes. This paper sets the transformation of Auckland’s CBD within the broader context of changes within the surrounding areas as well as in other New Zealand cities and globally.
Conceptualising Urban Demographic Change
Urban demographic change has been conceptualised in a number of ways.
The models of the ‘Chicago School’ are perhaps best known in relation to changes to ethnic composition of inner city areas, related to cycles of immigration, and resulting negative outcomes from high levels of ethnic segregation (Atkinson & McGarrigle, 2009). While such models may have some explanatory power with regard to the movement of migrant groups through Auckland’s central city in the middle of the twentieth century, they do not adequately conceptualise more recent migrations (Xue, 2008).
Also well known is the theory of ‘gentrification’, which proposes that inner city areas in which housing has become run-down and occupied by low income residents becomes attractive to higher income residents, often professionals, as a result of their proximity to the CBD and their historic housing, which is renovated in the process (Badcock, 2001; Hammel, 2009). Gentrification is useful in analysing some of the changes that have been occurring in inner suburbs such as Ponsonby (Latham, 2000), but it is not an adequate model for the development of apartments in Auckland’s CBD, and elsewhere.
A broader model of ‘reurbanisation’ is proposed by Buzar et al. (2007) who claim it is the fourth phase of a generalised urban growth cycle which is taking place in many cities in the developed world. Their generalised urban growth cycle phases are: 1) urbanisation (centralisation of population); 2) suburbanisation (relative decentralisation); 3) deurbanisation (absolute decentralisation); 4) reurbanisation (move back to centre).
A critique of reurbanisation by Glatter and Siedhoff (2008) asserts that diversity in the term’s usage contributes to vagueness, and results from possibly contradictory empirical findings. While the term is still sometimes used by city councils and others to incorporate aspects of change, including a ‘return’ to the CBD not only of residential population, but also of diversified activities such as events (e.g. festivals) as well as increased employment in creative industries, more focussed explanations are needed to

Demographic transformation of inner city Auckland 57
identify the processes taking place in the CBDs of New Zealand’s largest cities.
The repopulation of CBDs in New Zealand cities is partly a function of the transformation of housing markets, in particular the development of apartments. The revival of ‘city centre living’ has been a phenomenon in many places, including the United Kingdom (Couch et al., 2009) and Australia (Badcock, 2001), as well as in Wellington and Christchurch (Morrison & McMurray, 1999; Buchanan et al., 2006; Statistics New Zealand, 2010). In Wellington, as in Auckland, the apartment boom started with the conversion of office buildings in the early 1990s and then moved on to purpose built residential apartments, serving a growing demand for “downtown living opportunities of a new cohort of middle-income households” (Morrison & McMurray, 1999, p. 378). There were a number of factors driving this demand and facilitating it, and these are discussed in greater detail below in the context of Auckland. First, though, it is useful to consider the changes in the nearby suburbs which preceded the dramatic repopulation of Auckland’s CBD.
Suburbanisation, Population Decline, and Diversification (1945-1980s)
Definition
The ‘inner suburbs’ referred to in this paper, along with the CBD, have been referred to elsewhere as the ‘inner city’. In recent publications this term has been used to refer to the CBD itself (Morrison & McMurray, 1999; Statistics New Zealand, 2010). Nevertheless, when the CBD and inner suburbs are considered together, the term ‘inner city’ can be retained in a way consistent with its use in much of the literature on gentrification. One criteria used in defining ‘inner suburbs’ is proximity to the CBD, with all areas being within about three kilometres of Queen Street, running through the centre of the CBD. A second criterion is the age of housing, most of this area having been developed by the early twentieth century. In Figure 1, 2006 Census Area Units are shown in relation to the better known suburb names, most of which formed their own census areas in the mid twentieth century, and which are used here to define residential suburbs.
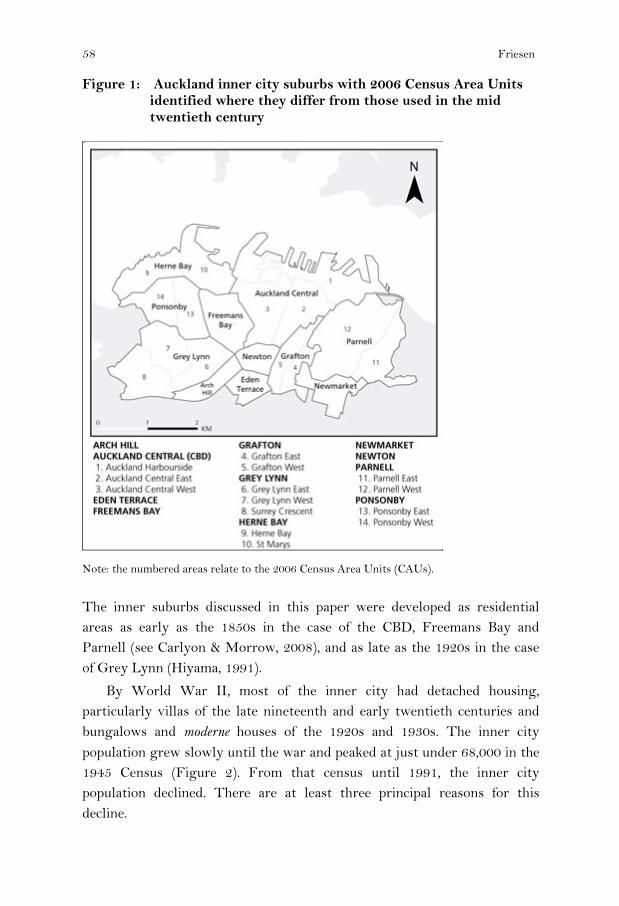
58 Friesen
Figure 1: Auckland inner city suburbs with 2006 Census Area Units identified where they differ from those used in the mid twentieth century
Note: the numbered areas relate to the 2006 Census Area Units (CAUs).
The inner suburbs discussed in this paper were developed as residential areas as early as the 1850s in the case of the CBD, Freemans Bay and Parnell (see Carlyon & Morrow, 2008), and as late as the 1920s in the case of Grey Lynn (Hiyama, 1991).
By World War II, most of the inner city had detached housing, particularly villas of the late nineteenth and early twentieth centuries and bungalows and moderne houses of the 1920s and 1930s. The inner city population grew slowly until the war and peaked at just under 68,000 in the 1945 Census (Figure 2). From that census until 1991, the inner city population declined. There are at least three principal reasons for this decline.

Demographic transformation of inner city Auckland 59
Figure 2: Actual and projected population change, inner city Auckland and CBD, 1926-2006
An important reason for the demographic decline of Auckland’s inner city was the process of suburbanisation, which characterised New Zealand cities through much of the twentieth century, and was seen through much of the rest of the developed world as well. Some inner city populations had already started to decline in the 1920s and 1930s as residential development took place along the tram lines, spreading out from central Auckland “like spokes in a wheel” (Bloomfield, 1967). However, it was in the post-World War II era that inner city Auckland showed its greatest decline (Figure 2) as suburbanisation accelerated and the status of inner city living declined. This was also the period of the baby boom, and the stereotypical larger family ideal was the ‘quarter acre section’ in suburbia, but it should be noted that suburbanisation not only involved the development of privately-developed middle-class suburbs, but also state-funded housing estates for those on lower incomes (Pool et al., 2007, pp. 199-201)
As well as suburbanisation, there were at least two other specific factors which contributed to loss of population in inner city Auckland from the 1950s to the 1970s: urban renewal and motorway construction. In 1951, the Auckland City Council declared an area of 96 hectares in Freemans Bay as an area for ‘total clearance and redevelopment’ and virtually all of the housing there, home to a population of over 7,000, was to be razed, and new public housing developed (Friesen, 1994). However, planning fashions had changed by 1971 and ‘rehabilitation and community development’ became the predominant ideology. Gentrification became the manifestation of this

60 Friesen
ideology, so only about one-quarter of the originally-designated area was redeveloped (ibid).
The construction of the motorway system to link the newly-constructed Harbour Bridge with central, south, and ultimately west Auckland was also a factor in the loss of housing stock in inner city Auckland. Clearance for the motorways was carried out through the 1960s and into the 1970s. As well as re-development this was a significant factor in the population decline of Freemans Bay. Most impacted was Newton, to the south of Karangahape Road, which was virtually eliminated (see Figure 3), while other inner city areas affected were Arch Hill and Eden Terrace.
Figure 3: Population changes in selected Auckland inner city suburbs 1926-2026
Running parallel to the period of decline of housing stock and population, and in some cases counteracting it, was the settlement of Pacific populations in the inner city. The pre-war population of the inner city was largely European (Pakeha) in origin, but the post-war period was typified by rapid ethnic diversification. With the post-war expansion of the New Zealand economy, especially manufacturing from the 1950s onwards, immigration from New Zealand’s colonies in the Pacific (Western Samoa, Cook Islands, Niue) escalated rapidly. In the initial period, central Auckland was one of the main areas of Pacific migrant settlement, providing relatively cheap rental accommodation and proximity to employment on the wharves, in Auckland Hospital and in many small to medium scale manufacturing enterprises. Although state housing in suburban areas attracted increasing

Demographic transformation of inner city Auckland 61
numbers of Pacific peoples from the 1960s onwards, they continued to also be drawn to the inner city, as Figure 4 illustrates.
Figure 4: Pacific population of Auckland inner city, 1956-2006
The phase that Buzar et al. (2007) call ‘deurbanisation’ may not apply to many of the inner city suburbs, but it does apply to the CBD in the half century leading up to 1991. In 1945 there were nearly 10,000 people living in Auckland’s CBD. This population resided in a range of residential types, including some detached houses surviving from the late nineteenth or early twentieth centuries, as well as a number of apartment blocks ranging from three to ten stories. From the 1950s onwards these residences were steadily redeveloped for commercial premises including wholesale, retail, offices and hotels. By 1991, the usually resident population of the CBD was less than 2,000 mostly housed in a handful of surviving apartment blocks.
Gentrification and Ethnic Change (1970s to the present)
Gentrification refers to “a process of neighbourhood transformation in which working-class and poor residents are displaced by an influx of middle-class residents” (Hammel, 2009, p. 360). This has generally taken place in inner cities which were occupied by lower income groups during the process of suburbanisation, in many cities around the world.
In the mid 1970s, young professionals began to buy and renovate the relatively cheap houses available in Ponsonby and nearby suburbs to the west of Auckland’s CBD. They have been described as “young, socially liberal, tertiary-educated Pakeha” whose motives went beyond the relatively

62 Friesen
cheap housing to include a desire for ‘new ways of living’ in an area which had an ethnically diverse population, and a reputation as a centre of counter-cultural lifestyles (Latham, 2003, p. 1704).
The changing housing market also had an impact on access to rental property, and it became harder for lower income families to access housing. As young professional residents moved in, historic cottages, villas and bungalows were bought by owner-occupiers and there was a steady decline of housing available to rent through the 1970s and 1980s. Studies in that period also documented discrimination against Pacific people attempting to rent a house and many were forced to relocate to state housing in peripheral suburbs (Friesen, 1994).
The countervailing processes of growth in Auckland’s Pacific population and accelerating gentrification in the inner city overlapped in the 1970s. In Freemans Bay, Ponsonby, and adjacent suburbs the proportion of the population who were Pacific peaked by 1976. Grey Lynn appeared to resist these trends however, and became a vibrant centre of Pacific, especially Samoan, culture during the 1970s (Hiyama, 1991, pp. 95-101). As a result of the large size of the population of this suburb, the Pacific population of the inner city did not decline significantly until after 1986 (Figure 4).
The impact of gentrification was not just on the residential landscape, but also on the nature of the commercial and cultural landscapes. According to Latham (2000, p. 290), many of the ‘gentrifiers’ had returned from large metropolitan centres overseas and were in search of ‘urbanity’ in the form of cafes, restaurants, bars and other cultural features. The rapid redevelopment of Ponsonby Road from the late 1970s onwards was illustrative of this demand being met.
By 2006, the nature of Auckland’s inner suburbs population was markedly different than it had been 50 years earlier. The desire of the earlier gentrifiers for (ethnic) diversity was subverted by the very changes they brought about, so that by the early 21st century the population of the inner suburbs was predominantly of European ethnic origin (71 percent versus 57 percent for the Auckland region), more highly educated and with much higher average income levels than the CBD or Auckland generally (Table 1).

Demographic transformation of inner city Auckland 63
Table 1: Selected characteristics of CBD and inner suburb populations in relation to Auckland region and New Zealand 2006
CBD Inner Suburbs
Auckland Region
New Zealand
Population growth rates % growth 1986-2006 1264% 120% 149% 123% projection % growth 2006-26 254% 160% 133% 118% Usually resident (UR) pop. 17,937 39,558 1,303,068 4,027,947 % overseas 5 yrs ago 35% 17% 13% 9% % in same residence 5 yrs ago 5% 28% 39% 38% Age and gender 2006 median age 26 32 33 35 % aged 0-14 3% 12% 22% 22% % aged 15-29 60% 32% 22% 20% % aged 30-55 29% 41% 37% 36% % aged 55 and over 8% 15% 19% 19% sex ratio (M / 100 F) 99.6 98.3 94.8 95.3 Birthplace and ethnicity 2006 % overseas born 66% 31% 37% 23% % European 43% 71% 57% 68% % Maori 5% 7% 11% 15% % Pacific 3% 9% 14% 7% % Asian 47% 12% 19% 9% Households 2006 % households with one person 43% 29% 20% 23% mean no. of residents 1.9 2.4 2.9 2.7 Family / Household circumstances 2006 % partnered 42% 50% 60% 61% % own dwelling 18% 35% 47% 53% Activity and labour force status 2006 % studying full-time 37% 14% 13% 11% % studying part-time 7% 7% 6% 5% % employed full-time 40% 61% 51% 50% Income and socio-economic status 2006 median income $19,883 $38,647 $26,800 $24,400 % with income over $50,000 19% 37% 22% 18% % with tertiary degree 24% 37% 18% 16% % occupations professional 19% 25% 16% 15%
Note: Percentages exclude ‘not specified’ and ‘not included elsewhere’ from base. * of those aged 15+ ** of those aged 15+ and in labour force (occupation by NZSCO) # of those aged 15+, employed, not including ‘worked at home’, ‘didn’t go to work’ Source: Statistics New Zealand 2006 Census Meshblock dataset

64 Friesen
Repopulation of the CBD (1991 to the present)
Although many of those who settled in the newly gentrified areas of the inner city of Auckland in the 1970s and 1980s worked in the CBD, the impacts of gentrification on the CBD itself were relatively limited (in a physical sense). However, a number of factors originating in the 1980s were seminal in the residential transformation of the CBD from the early 1990s onwards, including:
1) major international and domestic investment in commercial property development in the 1980s and an oversupply of office space by the end of the decade,
2) legislative changes impacting planning and local government perspectives on residential development in the city centre,
3) the Immigration Act 1987 which resulted in accelerated immigration and new flows from Asia,
4) the promotion of international education and the influx of students especially from the mid 1990s onwards, and
5) a regional growth strategy favouring residential intensification and related zoning changes favouring residential development in the CBD.
Although these factors had New Zealand-wide impacts, each of them had a disproportionate impact on Auckland’s CBD, and each can be seen as significant not only to repopulation, but also to the rise of the CBD in economic, cultural and political terms.
The restructuring of the New Zealand economy by the Labour government elected in 1984 and subsequent governments had far-reaching impacts on Auckland. In particular, the liberalisation of finance markets and removal of prohibitions on financial institutions raising capital from abroad resulted in a dramatic increase in the inflow of foreign direct investment, especially into the financial services sector. Much of this investment flowed into office block development in Auckland’s CBD with dramatic increases between 1984 and 1988 creating new office space in Auckland far greater in quantity than other global centres at the time (Moricz & Murphy, 1997, pp. 168-169). There was a delayed impact on global property markets following the share market crash of October 1987, but when it did occur in New Zealand, it was particularly severe. A number of property development

Demographic transformation of inner city Auckland 65
companies collapsed and the vacancy rate in Auckland CBD office space rose from about three percent in 1987 to 25 percent in 1991 (pp. 171-176). This surplus space provided an opportunity for residential development, as it also did in Wellington (Morrison & McMurray, 1999), and this coincided with other factors to initiative the rapid developments of the 1990s.
Most important of the other factors were national-level legislative changes which contributed to significant changes in urban development policy and practice in New Zealand, and which in turn had a major impact on the development of central Auckland and other New Zealand cities. These were the reorganisation of local and regional authorities under the Local Government Act (LGA) (1989) and the creation of the Auckland Regional Council, the Resource Management Act (1991), and the Building Act (1991). The LGA facilitated the creation of an “entrepreneurial local state that actively engaged in property development processes” (Murphy, 2008, p. 2525), while the RMA implemented a “new style of planning for managing resources which is effects-based” (Dixon et al., 1997, p. 605). When these changes were combined with the Building Act, which removed some of the regulation around residential building ‘to enhance consumer choice and encourage diversity of building materials and design’, one outcome was a laissez-faire attitude to inner-city residential development on the part of Auckland City Council (Murphy, 2008, p. 2525). Consequently, “…apartment development took place with little interference from planners…” including the development of many small and/or sub-standard units, and it was not until 2007 that Auckland City Council formally introduced design protocols and minimum size regulations (p. 2525).
Thus in the early 1990s, conditions of global investment, commercial building occupancy rates and local authority regulation were ideal for the both the redevelopment of existing commercial buildings for residential purposes and the construction of new residential buildings. Further impetus was provided by the implementation of the Regional Growth Strategy by Auckland Regional Council in the mid 1990s, as the strategy strongly advocated for residential intensification, in order to reduce urban sprawl and to create residential options in the proximity of major employment centres (Regional Growth Forum, 1999). Since the early 1990s, the number of residential and serviced apartments in the CBD has steadily increased, and by the year 2000 there were about 6,000 units. Major growth spurts from 2003 onwards resulted in about 18,000 units by 2007 (Bayleys Research,

66 Friesen
2008). Although the recent recession has slowed this growth, there are still many further apartment developments planned, and waiting for suitable economic conditions.
One of the aspects of reurbanisation is “an increase in the significance of the city as a whole” (Glatter & Siedhoff, 2008), and a characteristic of post-industrial cities worldwide in the last two decades has been the staging of spectacles and festivals orientated to local residents as well as to tourists (Duffy, 2009). Auckland’s CBD has been host to both spectacle and festival. In the late 1980s and early 1990s, the revitalisation of the waterfront around the Viaduct Basin can be partly attributed to the hosting of the Whitbread (later Volvo) Round the World Yacht Race. This process was accelerated when New Zealand won the America’s Cup in 1995 and subsequently hosted the 1998 and 2003 America’s Cup in Auckland. Two of the largest ethnic festivals are now annual events in the CBD, the (Chinese) Lantern Festival in Albert Park and (Indian) Diwali at Britomart near the waterfront. The Pasifika Festival, often quoted as the largest Pacific festival in the world, is held further out at Western Springs on the edge of the inner city. A biannual arts festival, the most recent being Ak09, is held in Aotea Square and surrounding areas, and many other events, ranging from film festivals to dragon boat races are also CBD based. In conjunction with the rapidly increasing repopulation of the CBD these events have given new life to the central city in which Queen Street in the early 1980s seemed destined to be a series of bank facades and tourist shops.
Just as areas of gentrification such as Ponsonby have been transformed commercially and culturally as a result of the advent of new populations, so too has the CBD. Whereas a food shop or dairy was virtually non-existent in the CBD in the late 1980s, twenty years later they are prolific. Likewise, there has been the rapid development of food outlets ranging from affordable Asian cafes catering mostly to students through to expensive restaurants frequented by tourists as well as locals. Many other commercial enterprises, ranging from karaoke bars to two-dollar shops to internet cafes have also found niche markets in Auckland’s CBD in recent years, catering to the new diversified inner city population.
Demographic transformation of inner city Auckland 67
International Education and International Students in the CBD
One of the most significant factors affecting the demand for apartments in the CBD has been the growth of international education in New Zealand. This is part of a global phenomenon linking labour and education mobilities where international students comprise “a potential flow of qualified workers, either in the course of their studies or through subsequent recruitment” (OECD, 2001, p. 93). Increasingly, governments have promoted international education, both for the revenue which it generates, but also as an integral part of other immigration strategies, including attracting skilled labour for permanent residency (OECD, 2009, pp. 172-176).
From the mid 1990s onwards, the New Zealand government, and many secondary and tertiary institutions undertook a concerted effort to promote New Zealand as a destination for international students. By 2003 there were about 120,000 international students, and it was claimed that international education was New Zealand’s fourth largest export earner. Demand for English language education was particularly high in East Asian countries and they comprised more than 80 percent of all international students in 2003, with three countries predominating, namely China (45%), South Korea (20%) and Japan (17%) (Collins, 2006, pp. 218-219).
Many international students chose Auckland as a destination because of its size and diverse population, and the CBD was particularly attractive because it is the location of the two largest tertiary institutions and the location of many English language schools and Private Training Establishments (PTEs) providing training in subjects such tourism and hospitality, computer training, business skills, film and television and others (Auckland City, 2003; Collins, 2006, 2008). The rapid growth in numbers of international students at the University of Auckland and AUT University (earlier Auckland Institute of Technology) since 1996 is shown in Figure 5, and the central role of students from the People’s Republic of China (PRC) in this growth is obvious. By 2003 PRC students made up more than one-half of all international students at these two institutions. The subsequent downturn in enrolments of students from China has impacted on the total number of international students, although both institutions have managed to diversify the source of student intake, especially from other Asian countries but also from other regions.

68 Friesen
Figure 5: Numbers of international students and students from People’s Republic of China at University of Auckland and AUT University, 1994-2008
Population Profiles
The characteristics of the population of Auckland’s CBD are markedly different from those of the inner suburbs, and of the Auckland region and New Zealand as a whole (refer to Table 1).
Firstly, the CBD population appears to be much more transient than the rest of Auckland. This is illustrated by the size of the ‘census night population’ (as opposed to the ‘usually resident population’). The former includes those who were in an area on census night, but usually live elsewhere in New Zealand or overseas. In 2006, there were more than 8,000 people present in the CBD on census night who were not usual residents, attesting to the presence of many hotels and short-term accommodation options in Auckland’s downtown. This group includes visitors and tourists (international and domestic) as well as those who “will be staying in New Zealand for less than 12 months” (2006 Census Guide Notes) - the latter including many undertaking short-term training e.g. at language schools. This number comprised about 45 percent of all short-term residents in the Auckland region at the time of the 2006 census.
Another kind of transience is shown by the proportion of the usually resident population who were living overseas five years earlier. Table 1 shows that 35 percent of those in the CBD in 2006 were in this category, a

Demographic transformation of inner city Auckland 69
level twice as high as in the inner suburbs of Auckland, nearly three times as high as in the Auckland region, and four times the national level. Even more dramatic is a consideration of the proportion of usual residents who were living in the same residence five years earlier. Only five percent of CBD residents were in this category in 2006, compared to 28 percent of inner suburbs residents, 39 percent of all Auckland regional residents and 38 percent nationally. This emphasises the high level of residential mobility in New Zealand and Auckland, with the CBD statistic being an extreme example of this, and showing that international migration is only one aspect of population transience, with internal movements also being very significant. In Auckland, the great majority of these relatively transitory residents were apartment dwellers, and these levels of short-term residence and previous overseas residence are similar to the apartment dwellers in the CBDs of Wellington and Christchurch (Statistics New Zealand, 2010, p. 3).
One of the most notable demographic features of the Auckland CBD population is its age structure. The median age of 26 years is substantially lower than the inner suburbs (32 years), the Auckland region (33), and for New Zealand as a whole (35). However, this low median is despite the fact that the CBD population has very few resident children, with only three percent of the usual population aged under 15, compared to 12 percent in the inner suburbs and 22 percent in the region and nation. Compensating this extreme is the fact that 60 percent of the CBD population is aged 15 to 29, a proportion nearly twice as high as in the inner suburbs, and about three times as high as in the region and nation. The obvious reasons for this age structure are that the CBD has a large number of resident tertiary students as well as many relatively young new entrants to the CBD labour force. The 2006 Census showed that 37 percent of the CBD population was studying full-time and a further seven percent part-time, a proportion three times as high as for the Auckland region (Table 1). The importance of students as residents of central city apartments is replicated in Wellington and Christchurch, although the proportion of full-time students in these cities is only about two-thirds of the level in Auckland (Statistics New Zealand, 2010, p. 5).
Although the development of downtown apartments has been promoted as part of the ‘smart growth goals’ of the Auckland Regional Growth Strategy by reducing travel-to-work distances (Franks, 2007), the proportion of residents in the CBD who are aged in the middle range of the

70 Friesen
labour force cohorts is still significantly lower than in the inner suburbs or in the region (Table 1). However, there is evidence that many central city workers have chosen to rent or buy an apartment in the CBD, with 40 percent of the population working full-time, a proportion lower than in most parts of Auckland, but still significant. This working population had markedly different work commuting patterns than the norm in Auckland, with 46 percent of CBD workers walking or jogging to work compared to an Auckland regional average of only four percent (Franks 2007:74).
The CBD and the inner suburbs of Auckland have ethnic compositions which are different from that of the Auckland region, but also markedly different from each other. In 2006, two-thirds of the CBD population were overseas-born, whereas less than one-third of the inner suburbs population were - lower than the regional average, although higher than the national average. The largest broad ethnic group in the CBD was Asian, at 47 percent, comprising nearly one-half of the population; this proportion had risen dramatically from only 11 percent in 1991. In the inner suburbs the predominant group was European, comprising 71 percent of the population with only 12 percent identifying as Asian, slightly ahead of the nine percent Pacific and seven percent Maori. This marked difference relates to the predominance of Asian students in the centre and the predominantly European gentrifying groups in the surrounding areas. The four largest Asian groups in the CBD in 2006 were Chinese (26 percent), Korean (eight percent), Indian (four percent) and Japanese (three percent). Asians are also significant in the CBDs of Wellington and Christchurch but when the apartment dwellers of New Zealand’s three largest cities are compared, the proportion in Auckland is about two and a half times as large (Statistics New Zealand, 2010, p. 7).
The household characteristics of Auckland’s CBD can be seen to be typical of an apartment and student-based population, with 43 percent of all households having a single resident, more than twice the Auckland average, and a mean number of residents of only 1.9 (Table 1). Only 18 percent of residents live in a dwelling which they own, which is about one-half the proportion for the inner suburbs. Perhaps surprisingly, 42 percent of CBD residents said they were living with a partner, a proportion not that much lower than the 50 percent in the inner suburbs, or even the Auckland average of 60 percent.

Demographic transformation of inner city Auckland 71
Although a high proportion of CBD residents are students, it is not surprising that only 24 percent already had a tertiary degree compared to 37 percent in the inner suburbs (Table 1). Income statistics are also consistent with a large student population, with an average income of just under $20,000 compared to nearly $39,000 in the inner suburbs; the latter though is well above the Auckland average of about $27,000. The presence of a working population is also evident though, with 19 percent of those employed being professionals, lower than the 25 percent in the inner suburbs, but higher than the regional average of 16 percent.
One part of Auckland’s CBD is markedly different from the rest. The Census Area Unit (CAU) known as Harbourside (see Figure 1) has perhaps more affinity to the gentrifying areas of the inner suburbs than the other two CAUs which make up the CBD. This is the area on the waterfront which was redeveloped as a residential precinct mostly during and following the America’s Cup campaigns from the late 1990s onwards. Much of the residential development in this area is not high-rise apartments, as is the case in most of the CBD, but relatively expensive two to four story townhouse-style developments which Murphy (2008) has characterised as “third-wave gentrification”. Unlike the earlier gentrification, which largely involved the renovation of historic housing and displacement of poorer populations, third wave gentrification is characterised as involving “new-build” developments and a different kind of “indirect and/or socio-cultural” social displacement (Lees et al., 2008, p.140 quoted in Murphy, 2008, p. 2523). Although this usage of the term ‘gentrification’ is contentious, there is no doubt that the Harbourside population is, on average, an elite population in comparison to the other areas of the CBD, with few students and many professionals working in the nearby commercial core. Dwelling ownership levels in 2006 were nearly twice that in the Central West and Central East CAUs (31 versus 17 and 18 percent), and median household income was well over twice the levels in the other CAUs (Murphy, 2008, p. 2532). The median age of 32 in Harbourside is about seven years more, and the Asian percentage of the population is about one-half of that in the rest of the CBD. The differences between these areas are not surprising since students are not generally expected to be measured as relatively ‘well-off’ in a census, no matter what their socio-economic background. However, the differences also point to fundamentally different residential developments in

72 Friesen
terms of average sales and rental prices, which are much higher in Harbourside (Murphy, 2008).
Conclusions
In the post-war decades of the 1950s to 1970s, the inner city of Auckland was in demographic decline, and this applied equally to the CBD and the suburbs surrounding it. By the late 1980s, this process of de-urbanisation had reached its nadir when the inner city had about half of the population it had had in 1945. Processes of re-urbanisation then took over to reverse this demographic decline. In the 1970s, gentrification started to increase the prestige of living in the inner city, and over subsequent decades resulted in the renovation and redevelopment of areas such as Ponsonby, Freemans Bay and Parnell. Initially, gentrification did not result in population gain because the new populations often had smaller average household sizes than the populations which were displaced, especially those of Pacific origin. However, when combined with changes in planning regulations, regional and local strategies of residential intensification and global and national market forces, population sizes remained stable or began to grow.
The CBD was, of course, the most dramatically affected by changes in planning and markets, with a dramatic growth in population from the early 1990s onwards, a process seen in other cities globally as well as in Wellington and Christchurch over the same period. Initially commercial buildings were converted for residential use, but by the mid 1990s purpose built apartments were the predominant factors in the rapid residential growth in downtown Auckland. The supply of new apartments was increasingly taken up by students, especially from Asia with the rapid expansion of international education in New Zealand from the mid 1990s onwards. Not only are two large tertiary institutions located in Auckland’s CBD, but so are many language schools and other training institutions which attract students from overseas. This has resulted in a large overseas-born, especially Asian, population, and one which is relatively young, with 60 percent being in the 15-29 year cohort. As well as this student population there is a significant population of those working in the central city, as well as a distinctively wealthier population resident in the Harbourside part of the CBD.
The repopulation of inner city Auckland, especially the CBD, has been relatively rapid, but is perhaps only in its initial stages. Population

Demographic transformation of inner city Auckland 73
projections by Statistics New Zealand suggest that the inner city population could exceed 100,000 by 2026 while the CBD population may increase to about 45,000, which is two and one half times its population in 2006 (refer to Figure 2). Planning for these major population increases will be one of the many challenges facing the new Auckland Council when it is elected in late 2010.
References Atkinson, R., & McGarrigle, J. (2009). Segregation, urban. In R. Kitchin & N. Thrift
(Eds.), International Encyclopedia of Human Geography (Vol. Urban, pp. 76-80). Oxford: Elsevier.
Auckland City Council (2003). Auckland City Council: Central Business District education project. Auckland: Auckland City Council
Auckland Regional Growth Forum (1999). Auckland Regional Growth Strategy 2050: A vision for managing growth in the Auckland region. Auckland: Auckland Regional Council.
Badcock, B. (2001). Thirty years on: gentrification and class changeover in Adelaide’s inner suburbs, 1966-96. Urban Studies 38(9):1559-1572.
Bayleys Research (2008). Property Research Annual 2008: Auckland CBD Apartments. Retrieved October 15, 2009, from www.bayleys.co.nz/Our_Services/Research/Residential
Bloomfield, G. T. (1967). The growth of Auckland 1840-1966. In J. S. Whitelaw (Ed.) Auckland in ferment. Wellington: New Zealand Geographical Society.
Buchanan, N., Barnett, R., Kingham, S. & Johnston, D. (2006). The effect of urban growth on commuting patterns in Christchurch, New Zealand. Journal of Transport Geography 14:342-354.
Buzar, S., Hall, R., & Ogden, P. E. (2007). Beyond gentrification: the demographic reurbanisation of Bologna. Environment and Planning A, 39, 64-85.
Carlyon, J. & Morrow, D. (2008). Urban village: the story of Ponsonby, Freemans Bay and St. Mary’s Bay. Auckland: Random House.
Collins, F. L. (2006). Making Asian students, making students Asian: the racialisation of export education in Auckland, New Zealand. Asia Pacific Viewpoint, 47(2): 217-234.
____________ (2008). Bridges to learning: international student mobilities, education agencies and inter-personal networks. Global Networks 8(4):398-417.
Couch, C., Fowles, S. & Karecha, J. (2009). Reurbanization and housing markets in the central and inner areas of Liverpool. Planning, Practice and Research 24(3):321-341.
Dixon, J. E., Ericksen, N. J., Crawford, J. L., & Berke, P. (1997). Planning under a co-operative mandate: new plans for New Zealand. Journal of Environmental Planning and Management, 40(5): 603-614.

74 Friesen
Duffy, M. (2009). “Festival and Spectacle”. In R. Kitchin & N. Thrift (Eds.), International Encyclopedia of Human Geography (Vol. Social and Cultural Geography, pp. 91-97). Oxford: Elsevier.
Franks, L. (2007). The global re-emergence of high rise living and its impact on Auckland's 'smart growth' goals. Unpublished BA (Honours) dissertation, Auckland: University of Auckland.
Friesen, W. (1994). Demographic and socioeconomic evolution of Auckland's inner city. D. Hawke (ed.) Proceedings of the Inaugural Joint Conference of New Zealand Geographical Society and Institute of Australian Geographers 1992, Auckland: New Zealand Geographical Society, pp. 234-244.
Glatter, J., & Siedhoff, M. (2008). Reurbanisation: inflationary use of an insufficiently defined term? Comments on the definition of a key concept of urban geography, with selected findings for the city of Dresden. Die Erde, 139(4):289-308.
Hammel, D. J. (2009). Gentrification. In R. Kitchin & N. Thrift (eds.), International Encyclopedia of Human Geography (Vol. Social and Cultural Geography, pp. 360-367). Oxford: Elsevier.
Hiyama, K. (1991). High hopes in hard times: a history of Grey Lynn and Westmere. Auckland: Media Studies Trust.
Latham, A. (2000). Urban renewal, heritage planning and the remaking of an inner-city suburb: a case study of heritage planning in Auckland, New Zealand. Planning Practice and Research, 15(4):285-298.
Latham, A. (2003). Urbanity, lifestyle and making sense of the new urban cultural economy: Notes from Auckland, New Zealand. Urban Studies 40(9):1699-1724.
Lees, L., Slater, T., & Wyly, E. (2008) Gentrification. London: Routledge. Moricz, Z., & Murphy, L. (1997). Space traders: reregulation, property companies
and Auckland's office market, 1975-94. International Journal of Urban and Regional Research 21(2):165-179.
Morrison, P.S. & McMurray, S. (1999). The inner-city apartment versus the suburb: housing sub-markets in a New Zealand city. Urban Studies 36(2):377-397.
Murphy, L. (2008). Third-wave gentrification in New Zealand: the case of Auckland. Urban Studies 45(12):2521-2540.
OECD (2001). Trends in International Migration Annual Report 2001 edition (SOPEMI 2001), Paris: Organisation for Economic Cooperation and Development.
OECD (2009). International Migration Outlook (SOPEMI 2009), Paris: Organisation for Economic Cooperation and Development.
Pool, I., Dharmalingam, A., & Sceats, J. (2007). The New Zealand family from 1840: a demographic history. Auckland: Auckland University Press.
Regional Growth Forum. (1999). Auckland Regional Growth Strategy: 2050. Auckland: Auckland Regional Council.
Statistics New Zealand. (2010). Apartment dwellers: 2006 Census, Wellington: Statistics New Zealand.
Xue, J. (2007). Chinese ethnoburbs in Auckland, New Zealand: a spatial approach. Masters thesis, Auckland: University of Auckland.

New Zealand Population Review, 35:75-93. Copyright © 2009 Population Association of New Zealand
Too Early to Retire? Growing Participation of Older New Zealanders in the Labour Force
MANSOOR KHAWAJA* BILL BODDINGTON **
Abstract This paper examines key trends in the labour force participation of New Zealanders aged 65+ years during 1986-2006, their dynamics and likely determinants. While a majority of senior New Zealanders retire by the age of eligibility for New Zealand Superannuation (65 years), a growing proportion are extending their working life, either on a full-time or a part-time basis. At the 2006 Census of Population and Dwellings, 17 percent (one in six people) aged 65+ years were gainfully employed, and for those aged 65-69 years, the figure was much higher at 34 percent (one in three). In recent decades, a host of socio-economic developments have coincided, including growth of service industries, increased opportunities for part-time or contractual work, skill shortages and a more buoyant economy in the early years of the new millennium – all of which probably had a bearing on these trends. Using a range of demographic characteristics, notably age, gender, ethnicity and education, the paper also describes and compares the labour force experiences of various population subgroups in New Zealand.
Introduction
he consequences of population ageing and the impending burgeoning of the older population in New Zealand, and appropriate policy responses, have generated considerable public
interest. Like other developed countries, issues such as the sustainability of state-funded pensions, and the likely escalation in health expenditure feature
* Social and Population Statistics Group, Statistics New Zealand.
Email:[email protected] ** Population Statistics team, Statistics New Zealand.
T
76 Khawaja and Boddington
regularly in the media. Social researchers, policy analysts, and decision makers are also interested in monitoring older people's financial situation, standard of living, general quality of life, their participation in recreation activities, the provision for aged care services, etc. This paper uses census data to analyse and discuss trends in the labour force participation of those aged 65 years and older, during the 20-year period from 1986 to 2006.
The focus is on age 65 years and beyond, because 65 is now the minimum age of eligibility for New Zealand Superannuation (NZ Superannuation) - the state-funded pension - provided one meets the residential criteria. This wasn't always the case. An increase in the minimum age for NZ Superannuation was phased in gradually, from 60 to 65 years, during 1992 to 2001 (The University of Auckland, 2009). This partly explains why there has been little research focusing on the employment patterns of the 65+ group (Haig, 2007; Hurnard, 2005). Previously, workers were generally expected, or forced, to retire after about 40 years of service.
The year 1986 is taken as the starting point for this analysis, for two main reasons. Firstly, contemporary research points to a significant impact of the economic restructuring of the late-1980s and the early 1990s, and the resulting staff lay-offs on mature workers. Secondly, it provides a long-enough time series to discern shifts in trends and differentials in employment patterns, and assess the likely impact of a host of socio-economic factors that coincided in time. These included the subsequent upturn in the economy, skill shortages, a more favourable job market as well as legislative changes related to age of eligibility for the pension and the abolition of a compulsory retirement age.
About the Population and Data Issues
The paper used labour force related data collected in five censuses of population and dwellings between 1986 and 2006. The census definition of labour force covers people aged 15 years and over, who regularly work for one or more hours per week for financial gains, or who are unemployed and seeking either full-time or part-time work. It includes people who worked without pay in work that contributed directly to the operation of a farm, business, or professional practice owned or operated by a relative. The definition excludes unpaid voluntary work. (Statistics New Zealand, 2006).

Too Early to Retire? 77
At the last (2006) Census, about 495,600 people aged 65 years and over were living in New Zealand. A majority of these (400,600) were not in the labour force, and work and labour force status could not be identified for a further 12,500 people. The 2006 analysis presented here relates to those remaining 82,500 residents who were in the labour force. Of these, 81,400 were employed, and about 1,200 were unemployed (but actively seeking work). In line with general practise, ‘work and labour force status not identified’ responses have been excluded from the denominator in deriving the labour force participation rates. The impact of these not-specified or not-identified cases on the general quality of the results presented here cannot be readily assessed. Therefore, it is important to keep this data limitation in mind, when interpreting the study's main findings.
Key Results
Table 1 gives the number of New Zealanders aged 65 years and over in the labour force at each census between 1986 and 2006, as well as the labour force participation rates. During the 20-year period 1986-2006, the number of senior New Zealanders in the labour force almost quadrupled, from 22 thousand to 83 thousand. Over half of this impressive growth occurred in the new millennium, during the inter-censal period 2001-2006.
Table 1: Labour force participation, population aged 65 years and over, New Zealand, 1986-2006
Census year Total population aged 65 years +
Population aged 65 years + in labour force
Labour force participation
rate Number Increase1986 342,111 21,828 - 6.4 1991 379,767 22,632 804 6.0 1996 422,667 37,719 15,087 9.2 2001 450,423 50,745 13,026 11.6 2006 495,603 82,545 31,800 17.1
Source: Census of Population and Dwellings, Statistics New Zealand
In principle, two demographic factors contributed to this growth. Firstly, there was a significant and steady increase in the number of New Zealanders aged 65 years and over (second column) - up from 340 thousand in 1986 to half a million by the 2006 Census - a rise of 150 thousand or 45 percent.

78 Khawaja and Boddington
A more dominant element was that more and more superannuitants continued working - that is, either they did not retire from their main job, or else they worked part-time, undertook contract work or found an alternative occupational activity. Their labour force participation rate (number of people aged 65 years and over in labour force per 100 persons aged 65+ years), virtually trebled from 6 percent in 1991 to 17 percent (or one in six) in 2006 (last column). Our calculations suggest that without this impressive rise, there would have been just 32,000 New Zealanders aged 65+ in the labour force in 2006– about 50,000 fewer than the census figure of 82,500.
Other developments are also noteworthy: Firstly, during 1992–2001, an increase in the minimum age for New Zealand Superannuation was phased in gradually, from 60 to 65 years. Secondly, the Human Rights Act which came into effect in February 1999 abolished the compulsory retirement age, and may have prompted many employees to continue working. Thirdly, an important underlying development was an improvement of five years in remaining life expectancy at age 65, between 1975-77 and 2005-2007 (Fig. 1). Prospects of living longer, along with a more favourable economic environment, skill shortages, and growth of service industries probably encouraged many older New Zealanders to postpone retirement and continue in paid employment. Income-tested surcharge was in place during 1987-1998, and this may have discouraged labour force participation to a degree. Also, since 1993, purchasing power of superannuitants has been protected, initially by indexing the pension to average wage and more recently to the rate of inflation.
Figure 1: Remaining life expectancy at age 65 years, by sex, New Zealand, 1950-2007
Source: Statistics New Zealand (2008).

Too Early to Retire? 79
International Comparison
The net outcome has been one of the highest labour force participation rates among older people in the developed world, save Japan (Fig. 2). The indices plotted in this figure should be interpreted with due care, because of the prevailing differences in pensionable age, and the likely impact on the pension entitlement of working beyond that age.
Figure 2: Labour force participation of 65+ population, selected OECD countries, 2006
In 2006, Japan had the highest life expectancy among OECD countries, and also had the highest participation at 20 percent, followed closely by New Zealand, Iceland, and the United States. By comparison, in Australia, Ireland, Sweden and the United Kingdom, less than 10 percent of older people were in the labour force.
Some countries, including Britain and Germany, are planning to raise the age of eligibility for pension in the not too distant future (The Economist 2009). Currently the state pension age in Britain is 65 years for men and 60 years for women, while the retirement age in Germany is 65 years. Also, Australia recently signalled that it would gradually raise the pension age from 65 to 67 years during 2017-2023 (Sherry 2009). These rises could force many older workers to soldier on longer in the future.
0
5
10
15
20
25
Japan New Zealand
Iceland United States(1)
Canada Australia Ireland United Kingdom
Sw eden
Perc
ent
(1) Figures for some of the countries relate to the latest available year.Source: OECD (2009)
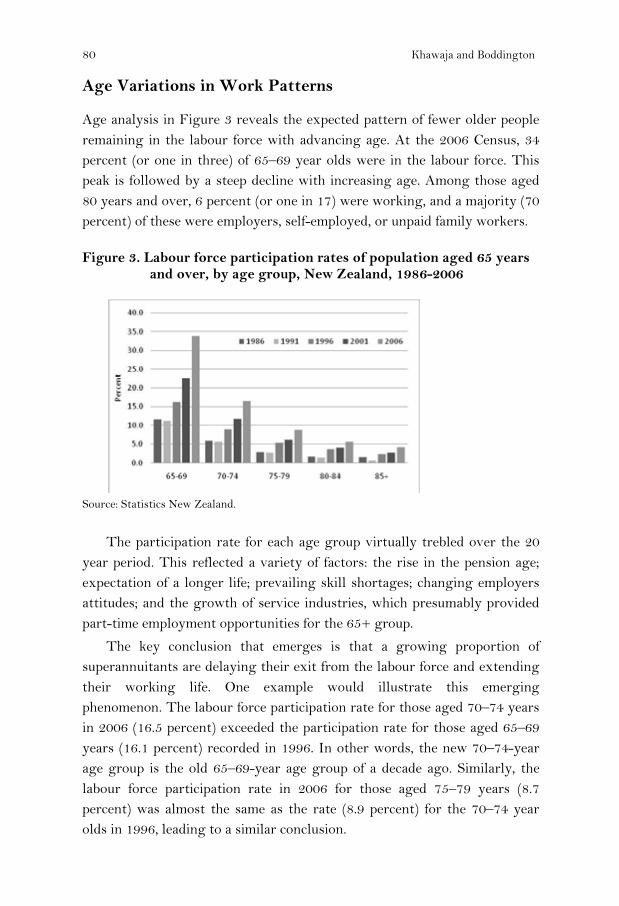
80 Khawaja and Boddington
Age Variations in Work Patterns
Age analysis in Figure 3 reveals the expected pattern of fewer older people remaining in the labour force with advancing age. At the 2006 Census, 34 percent (or one in three) of 65–69 year olds were in the labour force. This peak is followed by a steep decline with increasing age. Among those aged 80 years and over, 6 percent (or one in 17) were working, and a majority (70 percent) of these were employers, self-employed, or unpaid family workers.
Figure 3. Labour force participation rates of population aged 65 years and over, by age group, New Zealand, 1986-2006
Source: Statistics New Zealand.
The participation rate for each age group virtually trebled over the 20 year period. This reflected a variety of factors: the rise in the pension age; expectation of a longer life; prevailing skill shortages; changing employers attitudes; and the growth of service industries, which presumably provided part-time employment opportunities for the 65+ group.
The key conclusion that emerges is that a growing proportion of superannuitants are delaying their exit from the labour force and extending their working life. One example would illustrate this emerging phenomenon. The labour force participation rate for those aged 70–74 years in 2006 (16.5 percent) exceeded the participation rate for those aged 65–69 years (16.1 percent) recorded in 1996. In other words, the new 70–74-year age group is the old 65–69-year age group of a decade ago. Similarly, the labour force participation rate in 2006 for those aged 75–79 years (8.7 percent) was almost the same as the rate (8.9 percent) for the 70–74 year olds in 1996, leading to a similar conclusion.

Too Early to Retire? 81
Male-Female Differentials
While members of both sexes have been extending their working life, older men are still more likely to be employed than older women (Table 2). During the 20-year period under review, the labour force participation rate for men aged 65+ more than doubled, from 11 percent to 24 percent (or one in four). However, in relative terms, the rise was significantly greater for older women, who had much lower initial participation rates. Their labour force participation rate in 2006 (12 percent) was four times the corresponding rate two decades earlier (3 percent). By 2006, over five times as many older women were working as in 1986 – 31,000 compared with fewer than 6,000 (column 3).
Table 2: Men and women aged 65+ years in labour force, New Zealand, 1986-2006
Census year Population aged 65 years + in
labour force Women as
percentage of labour force
Labour force participation rate
Men Women Men Women 1986 16,100 5,700 26.2 11.2 2.9 1991 16,600 6,000 26.7 10.3 2.8 1996 25,400 12,300 32.6 14.4 5.2 2001 33,500 17,300 34.0 17.5 7.0 2006 51,500 31,300 37.6 23.9 11.6
Many women in the older generation may not have been in the paid labour force for much of their working life. For example, at the 1981 Census, over a third of women aged 40-49 years (thus aged 65-75 years in 2006) gave their employment status as “household duties unpaid”.
Overall, these trends have resulted in a significant narrowing of the male-female differential in employment among older New Zealanders. At the 1986 Census, women made up one-quarter of the older labour force in New Zealand. Two decades later, at the 2006 Census, the figure was close to two-fifths. Older women still have a markedly lower labour force participation rate, which is less than half of that for their male counterparts – 12 percent as against 24 percent – but they are far more likely to be working outside home than their mothers or aunts before them.
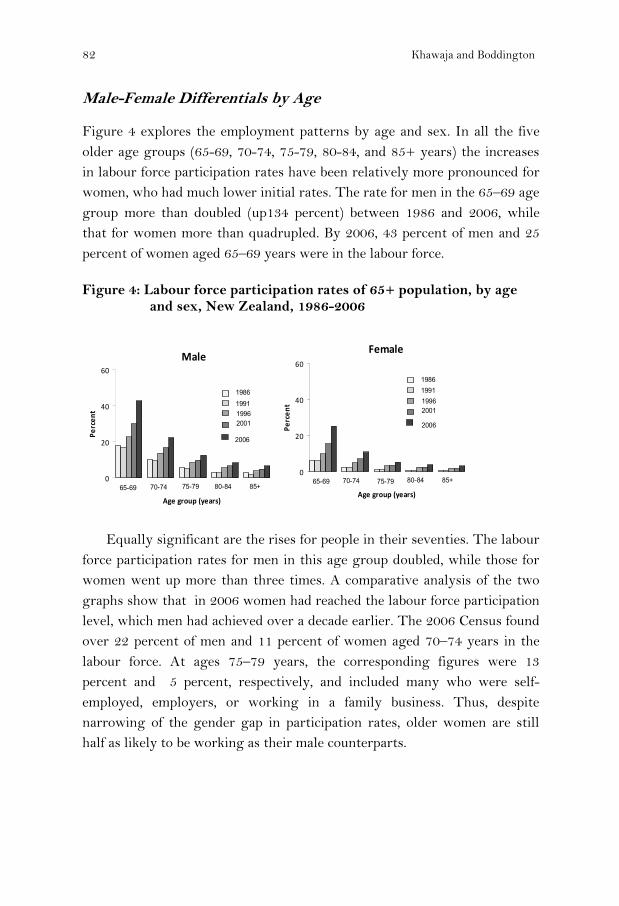
82 Khawaja and Boddington
Male-Female Differentials by Age
Figure 4 explores the employment patterns by age and sex. In all the five older age groups (65-69, 70-74, 75-79, 80-84, and 85+ years) the increases in labour force participation rates have been relatively more pronounced for women, who had much lower initial rates. The rate for men in the 65–69 age group more than doubled (up134 percent) between 1986 and 2006, while that for women more than quadrupled. By 2006, 43 percent of men and 25 percent of women aged 65–69 years were in the labour force.
Figure 4: Labour force participation rates of 65+ population, by age and sex, New Zealand, 1986-2006
Equally significant are the rises for people in their seventies. The labour force participation rates for men in this age group doubled, while those for women went up more than three times. A comparative analysis of the two graphs show that in 2006 women had reached the labour force participation level, which men had achieved over a decade earlier. The 2006 Census found over 22 percent of men and 11 percent of women aged 70–74 years in the labour force. At ages 75–79 years, the corresponding figures were 13 percent and 5 percent, respectively, and included many who were self-employed, employers, or working in a family business. Thus, despite narrowing of the gender gap in participation rates, older women are still half as likely to be working as their male counterparts.
Male
0
20
40
60
Age group (years)
Perc
ent
70-74 75-79 80-84 85+
1986199119962001
65-69
2006
Female
0
20
40
60
Age group (years)
Perc
ent
70-74 75-79 80-84 85+
1986199119962001
65-69
2006

Too Early to Retire? 83
Full-Time and Part-Time Work
The incidence of disability and the impact of degenerative processes increase significantly beyond middle ages. For this and other reasons (including lifestyle choice, economic necessity), part-time work is generally more common among older workers than among their younger colleagues (those aged 15–64 years).
Table 3: Males and females aged 65+ years in full-time and part-time employment, New Zealand, 1986-2006
Census year
Part-time workers as a percentage of 65+ employed
(1)
Workers aged 65 + years in full-time
employment
Workers aged 65 + years in part-time
employment Total 65+ employed
Male Female Total Male Female Male Female 1986 35.5 54.1 40.3 9,960 2,481 5,478 2,925 20,844 1991 39.1 59.3 44.5 9,927 2,415 6,369 3,519 22,230 1996 50.7 68.2 56.4 12,303 3,822 12,660 8,205 36,990 2001 45.6 67.6 53.1 17,913 5,508 15,030 11,478 49,929 2006 42.9 66.3 51.7 28,968 10,311 21,780 20,310 81,369
Notes: The figures for males and females are derived separately as a percentage of employed males and females, respectively.
Full-time workers are those who work 30 hours or more per week.
Of the 20,800 employed people aged 65 years and over in 1986, about 60 percent were working full time (30 hours or more per week), and the remaining 40 percent were working part-time (Table 3). The situation reversed in 1996, and successive censuses have found higher numbers of older New Zealanders working part-time than full-time. This may be partly attributed to the growth of service industries, and partly to the fact that more employers have been willing to accommodate part-time workers, or that recent cohorts of older workers have been more successful in negotiating part-time employment with their employers. Overall, during 1986–2006, growth in part-time work made a larger contribution (56 percent) to the increase in the number of employed pensioners, than did the increase in the number of full-time workers. By 2006, 52 percent of older employed New Zealanders were working part-time, and 48 percent were working full-time.
A male-female comparison also shows (second and third column) that older women are more likely to work part-time than men. This is aptly

84 Khawaja and Boddington
reflected in the large growth in the number of older women engaged in part-time work - up from less than 3,000 in 1986 to over 20,000 in 2006. This factor alone contributed almost a third of the growth in the number of employed older people during that time. By the 2006 Census, two-thirds of women worked part time compared with just two-fifths of men.
Overall then, older women’s full-time employment rate jumped from a low of 1.2 percent in 1986 to 3.8 percent in 2006, while their part-time rate went up five times to 7.6 percent. Over the same period, the rate of part-time employment among older men roughly tripled from 3.8 percent to 10.1 percent, while the full-time employment rate doubled to 13.5 percent.
Full-Time and Part-time Work by Age
Figure 5 looks at the participation in full-time and part-time employment by age of workers. The analysis here has been extended to incorporate ages 55-59 and 60-64 years. Three observations need special mention. Firstly, the 2006 indices show that a significant drop in the full-time employment rate among those aged 60-64 and 65-69 years (after the age of entitlement for NZ Superannuation at 65). Secondly, when the increase in the age for NZ Superannuation was being phased in during the 1990s, more and more workers aged 60–64 years were opting to stay in full-time employment. By 2001, over twice as many were working on a full-time basis as in 1991 – 37 percent as against 18 percent. The figure for 2006 was higher still, at 45 percent. This suggests that raising the age of eligibility to 65 years may lead to more people working full-time in their mid- and late-60s. Thirdly, beyond age 70 years, part-time engagement in work is the general rule.

Too Early to Retire? 85
Figure 5: Men and women aged 65+ years in full-time and part-time employment by age, New Zealand, 1986-2006
Full-Time and Part-time Work by Age and Sex
The combined impact of age and gender is analysed in Figure 6. Among men aged 65–69 years, participation in full-time work has nearly trebled since 1991 to reach 28 percent in 2006. Involvement in part-time work was less than half of that (14 percent), but was well up on the 1991 level (6 percent). Beyond 70 years, participation in both full-time and part-time work among men as well as women declines substantially with age, although the overall employment rate for this age group has been rising since 1991.
0
10
20
30
40
50
60
70
Perc
ent
Age group (years)
Full-time
65-69 70-74 75-79 80-84 85+
19861991199620012006
55-59 60-640
10
20
30
40
50
60
70
Perc
ent
Age group (years)
Part-time
65-69 70-74 75-79 80-84 85+
19861991199620012006
55-59 60-64
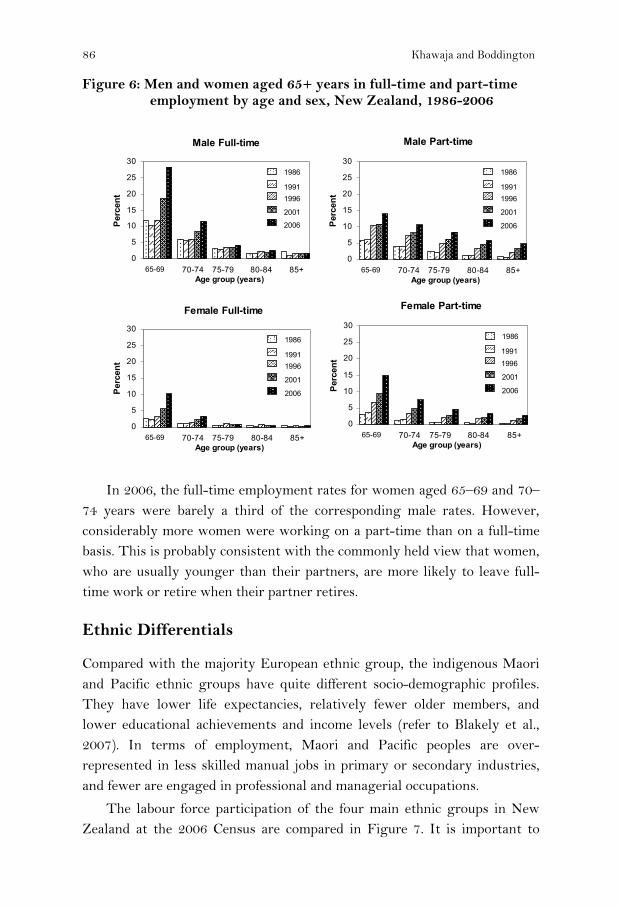
86 Khawaja and Boddington
Figure 6: Men and women aged 65+ years in full-time and part-time employment by age and sex, New Zealand, 1986-2006
In 2006, the full-time employment rates for women aged 65–69 and 70–74 years were barely a third of the corresponding male rates. However, considerably more women were working on a part-time than on a full-time basis. This is probably consistent with the commonly held view that women, who are usually younger than their partners, are more likely to leave full-time work or retire when their partner retires.
Ethnic Differentials
Compared with the majority European ethnic group, the indigenous Maori and Pacific ethnic groups have quite different socio-demographic profiles. They have lower life expectancies, relatively fewer older members, and lower educational achievements and income levels (refer to Blakely et al., 2007). In terms of employment, Maori and Pacific peoples are over-represented in less skilled manual jobs in primary or secondary industries, and fewer are engaged in professional and managerial occupations.
The labour force participation of the four main ethnic groups in New Zealand at the 2006 Census are compared in Figure 7. It is important to
Male Full-time
0
5
10
15
20
25
30
Age group (years)
Perc
ent
70-74 75-79 80-84 85+
1986
19911996
2001
65-69
2006
Female Full-time
0
5
10
15
20
25
30
Age group (years)
Perc
ent
70-74 75-79 80-84 85+
1986
19911996
2001
65-69
2006
Male Part-time
0
5
10
15
20
25
30
Age group (years)
Perc
ent
70-74 75-79 80-84 85+
1986
19911996
2001
65-69
2006
Female Part-time
0
5
10
15
20
25
30
Age group (years)
Perc
ent
70-74 75-79 80-84 85+
1986
19911996
2001
65-69
2006

Too Early to Retire?
note here that the figuremeans that all persons wcounted in each of those e
Briefly, at the 2006 C65 years and over were about 50 percent above ttwice that for the older A
Figure 7: Labour force 2006
Figure 8 exhibits thfewer older people in eacage. It also reveals a especially the Maori-Eurmore likely to be in thAmong the youngest supparticipation rate for Mabove that for the Europrate for Maori was substa
8
es on ethnicity relate to total response counts. Thwho identified with more than one ethnic group aethnic groups.
Census about 24 percent (or one in four) Maori agworking. Their labour force participation rate w
that for the older Europeans (16.6 percent) and ovAsians (10.5 percent).
participation of 65+ population, by ethnicity,
he labour force participation pattern by age, wich ethnic group continuing to work with advancinwidening of the inter-ethnic variation with agropean differential. At each age, older Maori we
he labour force than their European counterparperannuitants (aged 65–69 years), the labour for
Maori (35.2 percent) in 2006 was only fractionalpeans (35.0 percent), while at ages 75–79 years tantially higher – 12 percent as against 8 percent.
87
his are
ged was ver
ith ng ge, ere ts.
rce lly he

88 Khawaja and Boddington
Figure 8: Labour force participation of 65+ population, by ethnicity and age, 2006
Whether the higher Maori rates reflect poorer socio-economic outcomes (Ministry of Social Development, 2009) resulting in lack of adequate savings or financial assets cannot be confirmed in the absence of any definitive evidence.
Educational Differentials
Higher education seems to significantly enhance the prospects of working beyond age 64. This is well illustrated by Figure 9, which gives the labour force participation of older men and women, by highest educational achievement. Four broad educational categories are considered here, viz. no qualification, school qualification, vocational qualification and university qualification.
Among older men, one in three with a university qualification was employed at the 2006 Census, as against one in five of those with no qualification. Assuming that a majority of this latter group were involved in manual or physical work in their life, e.g. factory work, truck driving, work in construction or building industry, farm labour, etc. with a somewhat higher incidence of work-related injury or disability, many may not be able to pursue work at older ages for health-related reasons.
0
5
10
15
20
25
30
35
40
European Māori Pacific Asian
Ethnic group (total response)
Per
cent
65-69 70-74 75-79 80-84 85+

Too Early to Retire? 89
Figure 9: Labour force participation rates of 65+ population, by highest educational qualifications and sex, 1986 and 2006.
Among females, the gradient is steeper. Female graduates are almost three times more likely to be working at ages 65 and over than those without any qualification.
For both older men and women, there was a jump in labour force participation rates in all educational categories between 1986 and 2006, although it was relatively more pronounced for women. Yet, regardless of educational achievement, older women are still less likely to be employed than men. In 2006, 25 percent of 65+ women with a university qualification were in the labour force, compared with 35 percent of their male counterparts.
Regional Variations
Differentials in job prospects for senior citizens across New Zealand are influenced by a host of socio-demographic circumstances, as well as the nature of economic activity, skill shortages and life style issues in local areas. Recruitment and retention problems are also perhaps more likely to manifest in less urbanised regions. Similarly, firms in smaller areas probably don't have a high staff turnover, but when vacancies do occur, employers can find it somewhat difficult to fill them. Out-migration of young men and women from smaller or less-urbanised regions in pursuit of educational and/or employment opportunities in larger urban centres means employers
0
5
10
15
20
25
30
35
40
No qua
lificati
on
Schoo
l
Vocatio
nal
Univers
ity
No quali
ficati
on
Schoo
l
Vocati
onal
Universi
ty
Percent
Male
Female
1986 2006

90 Khawaja and Boddington
have difficulties recruiting young workers. This seemingly opens up some employment opportunities - albeit often part-time - for senior citizens.
Figure 10. Labour force participation rates of 65+ population for regional councils by sex, 2006.
At the 2006 Census, there were six regions in which the labour force participation rate for males aged 65 years and over was slightly higher than the national average for men aged 65 years and over (24 percent). These were Northland, Gisborne, Hawke’s Bay, Manawatu-Wanganui, Waikato and Southland. These regions either have small populations or are rural, and many 65+ workers are self-employed, e.g. farmers. There is possibly also an ethnic dimension, for many of these regions have a high concentration of Maori, who have higher participation rates at ages 65+ years.
Auckland is the country’s most-populated and urbanised region. It also had male (and female) participation rates above the national average. Four of the six South Island regions, including Canterbury and Otago, had male rates below the national average.
Older women’s labour force participation rates were higher than the national average for women aged 65 and over in all regions, with the exception of Taranaki, Canterbury, Otago and Nelson. Overall, older women are half as likely to be in the labour force as men, and this pattern was found in all regions.
6
8
10
12
14
16
18
20
22
24
26
28
30
Gisborn
e
Hawke's B
ay
Manawatu
-Wan
ganu
i
Southl
and
Waikato
Northlan
d
Marlboro
ugh
Auckla
nd
Tasman
West Coa
st
Wellington
Tarana
ki
Canterbu
ry
Bay of
Plenty
Otago
Nelson
Per
cent
0
NZ Males
NZ Females
FemaleMale

Too Early to Retire? 91
Concluding Comments
Not everyone retires upon reaching pensionable age (65 years). Whether before or after reaching age 65, many leave paid work either because of ill health, or because they have a partner who is retired, or they wish to spend more time with family, travel, or pursue hobbies or interests (for example, voluntary or community work) they have previously postponed or were unable to pursue. At the 2006 Census, for instance, over 15 percent of the 65+ population were doing voluntary work for or through an organisation, group or marae (Statistics New Zealand, 2007).
This study found that more and more older New Zealanders have been extending their working life in recent years, some perhaps in their lifetime career, while others, as a growing body of overseas literature suggests (for example see Ruhm, 1990) carry on working but at a different pace, part-time or switching occupations. They are still in a minority - albeit a growing one. Retirement has not gone out of fashion.
At the 2006 Census, 17 percent or one in six people aged 65+ years were employed, and for those aged 65-69 years, the figure was a high of 34 percent (or one in three). Living longer, growth of service industries, increased opportunities for part-time or contractual work, skill shortages and a more buoyant economy in the early years of the new millennium have been among the contributing factors.
Some senior workers are driven by economic necessity. Many probably find that NZ Superannuation provides only a basic standard of living. Extending working life and remaining gainfully employed is thus seen as a worthwhile option, to maintain a comfortable standard of living.
Another feature worth noting is the senior citizens' growing contribution to labour market dynamics. In 2006, workers aged 65 years and over made up 4 percent of the total labour force, compared with just 1.4 percent in 1986. Movement of the ‘baby boomers’ up the age scale would mean a burgeoning of the 65+ group in New Zealand in the future - up from 496,000 at the last (2006) Census to a projected 1.3 million by 2051 (Statistics New Zealand, 2009b). Even if their labour force participation rate remained static, one would expect a steady and substantial growth in the number of senior workers, and by implication in their share of the labour force. It would also mean further ageing of the New Zealand workforce.

92 Khawaja and Boddington
Suggestions to ensure the sustainability of NZ Superannuation have included raising the qualifying age from 65 to 67 years or even higher (Retirement Commission, 2007), similar to moves that have already been signalled in Britain, Germany and many European countries (The Economist, 2009). Across the Tasman, Australia has decided to phase in an increase in pension age, from 65 to 67 years between 2017 and 2026 (Sherry, 2009). The current National government is committed to not altering the entitlement to, or the age of eligibility to state-funded pension (House of Representatives, 2009). However, if New Zealand decided to follow other countries lead, this would place pressure on older people to work longer, and could have other implications for the labour market.
The next stage of the research is to undertake an in-depth analysis involving industries and occupations. We have already commenced such analyses and the findings will be reported in a forthcoming paper.
It is appropriate to add a few words about the major financial crisis which New Zealand and other countries faced during 2008-09. Its likely economic fall-out, especially the downsizing or closure of companies, staff lay offs, and a tightening job market, and a rise in unemployment level (Statistics New Zealand, 2009a) have meant somewhat limited employment prospects for both young and mature workers, in both white-collar and blue-collar occupations. It would be interesting to examine its impact on older workers when the labour force data from the next (2011) Census become available.
Notes
New Zealand Superannuation is the current name for the old-age pension, provided by the state. It is payable to almost all New Zealanders once they reach the current qualifying age of 65 years, irrespective of any other income they may have. The main requirements are that the person is a legal resident, has lived here for a certain amount of time and is normally resident in New Zealand. Unlike pensions in a number of other countries, New Zealand Superannuation is not means-tested. This is a revised version of a paper presented initially at the Biennial Conference of the Population Association of New Zealand in August 2009. The paper is a part of a larger research study on the employment patterns of older New Zealanders compiled by the two authors (Khawaja and Boddington, 2009). Views expressed in this paper are those of the authors and do not necessarily reflect the views of Statistics New Zealand.

Too Early to Retire? 93
The authors would like to thank their colleague Ian Richards for his helpful comments. The paper also benefited from the comments received from an anonymous referee.
References
Blakely T., Tobias M., Atkinson J., Yeh L-C. & Huang K. (2007). Tracking disparity: Trends in ethnic and socioeconomic inequalities in mortality, 1981-2004. Wellington, Ministry of Health.
Haig, R. (2007). The rising tide: Growth trends and patterns in the older workforce. Paper presented at the 2007 Biennial Conference of the Population Association of New Zealand, Wellington.
House of Representatives (2009). Question for Oral Answer, 2 June. Volume 654; page 4049. Wellington, NZ Parliament.
Hurnard, R. (2005). The effect of New Zealand Superannuation eligibility age on the labour force participation of older people. New Zealand Treasury Working Paper 05/09. Wellington, New Zealand Treasury.
Khawaja, M. & Boddington, W. (2009). Labour force participation of New Zealanders aged 65 Years and Over: 1986–2006. Wellington, Statistics New Zealand.
Ministry of Social Development (2009). Social Report 2009. Wellington. Organisation for Economic Co-operation and Development (2009) OECD. Stat
Extracts. Retirement Commission (2007). Review of retirement income policy. Wellington. Ruhm, C. (1990). “Bridge Jobs and Partial Retirement”. Journal of Labour Economics,
vol.8, no.4. Sherry, The Hon Nick (2009). Address to the Australian Institute of Superannuation
Trustees. Federal Budget Breakfast Briefing, The Treasury, Australian Government.
Statistics New Zealand (2006). 2006 Census: Definitions and Questionnaires. Wellington, Statistics New Zealand.
__________________ (2007). New Zealand’s 65+ population: A statistical volume. Wellington, Statistics New Zealand.
__________________ (2008). New Zealand life tables, 2005-2007. Wellington, Statistics New Zealand.
__________________ (2009a). Household Labour Force Survey; September 2009 quarter. Wellington, Statistics New Zealand.
__________________ (2009b). National population projections: 2009 (base) – 2061. Wellington, Statistics New Zealand.
The Economist (2009). Raising the state-pension age: early riser. October 8th, 2009. The University of Auckland (2009). Public and private provision for retirement – A
summary history 1975-2008. www.symposium.ac.nz/.../Public_and_Private_Provision_for_Retirement_sum
mary_history.pdf


New Zealand Population Review, 35:95-111. Copyright © 2009 Population Association of New Zealand
Reading Engagement and Literacy for Men and Women
ELLIOT LAWES * Abstract
The distribution and flow of skills in the adult population of New Zealand, particularly in the labour market, is an issue of key economic and social importance and has motivated a substantial amount of analytical work. This analytical work has not often incorporated the attitudes of members of the adult population. However, as this paper aims to demonstrate, attitudinal information may provide insights which are otherwise unavailable. The Adult Literacy and Life Skills (ALL) survey provides the evidence base for this demonstration. This large-scale survey – with an achieved sample size of 7131 respondents (representing a response rate of 64%) was conducted in New Zealand in 2006. A distinguishing feature is that it directly measured the English literacy skill of respondents. The ALL survey data are rich enough to allow the factor-analytic construction of an attitudinal measure: reading engagement (i.e. attitude to reading, disposition toward reading). Using linear regression techniques on the ALL survey data, it is apparent that after controlling for age, ethnicity and time spent in formal education, women tended to have higher literacy skill than men. However, this difference in literacy skill can be explained by the fact that women tend to engage more with reading than men.
Background
t is far from usual to include attitudinal factors such as reading engagement (i.e. attitude to reading, disposition toward reading) in demographic or economic analyses of New Zealand’s adult population.
This paper argues that inclusion of attitudinal factors, where possible, might provide insights unavailable when more standard factors alone are used in analysis.
* Ministry of Education, New Zealand. Email: [email protected]
I

96 Lawes
The importance of skill, its acquisition and flow are of key importance in many demographic and economic analyses. For example, a recent labour-market analysis by Maré and Stillman (2009), examines how the supply of immigrants in particular skill-groups affects the employment and wages of the New Zealand-born and of earlier migrants. They find, “…little evidence that immigrants negatively affect either the wages or employment opportunities of the average New Zealand-born worker”. They do find however “some evidence that increases in the number of high-skilled recent migrants have small negative impacts on the wages of high-skilled New Zealand-born workers, which are offset by small positive impacts on the wages of medium-skilled New Zealanders” (p.3). There are many other recent examples of analyses where skill is of primary interest (for example, Szeto & McLoughlin, 2008; Hunter, 2007; Bedford, 2003).
In many skill-based analyses, educational attainment (usually either level of qualifications and/or time spent in formal education) is used as a proxy for skill. However, this proxy has its limits, which are only able to be quantified when skill is measured (Earle, 2009a; Smyth & Lane, 2009). Earle (2009b) uses the Adult Literacy and Life Skills (ALL) survey – which measures literacy and numeracy skill – to show that (among other things) New Zealanders with English as a second language are “more likely to have lower wages and incomes than people with English as a first language, even after accounting for differences in qualifications and English-based literacy and numeracy.” Unfortunately, data that contain measures of skill (as opposed to proxies for skill) are few and far between, especially in the adult population.
Gender is another factor of primary importance in demographic and economic analyses, especially those relating to the distribution and movement of skill. Badkar et al. (2007a) investigate the gender distribution among Asian migrants to New Zealand entering through the Skilled/Business stream and Temporary categories from 1997/98 to 2005/06. They find that “although men dominate the overall Skilled/Business stream and Temporary categories, there is large diversity by nationality and women from some Asian countries are critical players in the migration process” (p.127). Johnston (2005), investigating the participation of women in New Zealand’s labour market, finds that high fertility rates and low labour-market participation of mothers with young children is likely to explain low labour-market participation of younger New

Reading Engagement and Literacy for Men and Women 97
Zealand women. Johnston also finds that “while New Zealand women tend to leave the labour force when they have children, they also tend to return strongly to paid employment when their children get older” (p.34). Other recent examples of skill- and gender-based demographic and economic analyses include Bean, 2005; Badkar et al., 2007b; and Dixon, 2004.
In addition to being key factors in demographic and economic analysis, gender and skill (especially literacy skill) are also key factors in educational research within the compulsory schooling context. There, unlike the case for the adult population, the distribution of skill is measured relatively frequently in a number of different ways. For example, New Zealand participates in the Organisation for Economic Co-operation and Development’s (OECD) Programme for International Student Assessment (PISA). PISA aims to measure the reading, science, and mathematics literacy skills of 15-year-olds in the compulsory schooling sector in an internationally comparable way (see, for example, OECD, 2007). New Zealand also participates in the Progress in International Reading Literacy Study (PIRLS), which is coordinated by the International Association for the Evaluation of Educational Achievement (IEA). PIRLS aims to measure the reading literacy achievement of Grade 4 (in New Zealand, Year 5) students in an internationally comparable way (see for example, Mullis et al. 2007).
A large number of studies, including PISA and PIRLS, confirm that in the compulsory schooling sector, on average, girls tend to have higher (reading) literacy skill than boys (for example, Wagemaker, 1996; Chamberlain, 2007 and 2008; Crooks & Flockton, 2005; Sturrock & May, 2002). In the international context, much work has been done to explain and address this gender disparity (for example, Younger et al., 2005; Condie et al., 2006), but it continues to be of high concern in the education sector.
This concern has translated into a body of work investigating the factors that are associated with both gender and literacy skill (and other measures of educational achievement) in the compulsory schooling context. Student attitudes, beliefs and practices are some of the factors that are most strongly associated with both gender and literacy skill (see, for example, Marsh and Yeung, 1998).
There are many aspects to students’ attitudes, beliefs and practices, and each of these aspects has its particularities. For example, students’ self-concept has been described as a hierarchical, multifaceted construct

98 Lawes
influenced by both situation and significant others (Hattie, 1992). Students’ self-concept in particular subject areas has also been studied: Chapman and Tunmer (1995) isolated three aspects of students’ reading self-concept: reading motivation; self-concept as a reader; and value of reading. Self-efficacy (in various subject areas), work avoidance, recognition and motivation orientations have also been studied (using New Zealand data: OECD, 2007; Meyer et al., 2009, and using American data: Baker & Wigfield, 1999). The attitudinal factor of interest in the current paper is reading engagement. This is a combination of reading enjoyment and reading activities.
Reading enjoyment and activities, and their relationship with gender and reading literacy skill have been studied in the compulsory schooling context. Notably, Schagen and Twist (2008) use modelling techniques that incorporate student data (from England) from different time-points, account for other, potentially correlated, factors and allow for differences in variation at different data-levels to examine the relationships between self-motivated reading practices, enjoyment of reading, gender and reading achievement. One of their conclusions is that after controlling for prior achievement, “… most of the gender difference in reading attainment in grade 4 is mediated by reading enjoyment and personal reading activities” (Schagen & Twist, 2008, p. 6). Analyses of similar scope have not been carried out in New Zealand.
Unsurprisingly, the relationship between gender and literacy skill in the compulsory schooling context continues in the adult population (Satherley & Lawes, 2008a). Given the key nature of skill and gender in demographic and economic analyses (which largely focus on the adult population), a question of interest is then: What role does reading engagement play in the relationship between gender and skill in the adult population?
The author is not aware of any recent analytical work that incorporates attitudinal factors in economic and demographic analyses in the context of the adult population of New Zealand. However, policy interest is growing (New Zealand Treasury, 2008), and the international literature incorporating attitudinal factors in analyses, while not large, is also growing. This literature is largely economic in focus and often loosely uses the term “non-cognitive skills” for what this paper refers to (again, loosely) as “attitudinal factors” or “attitudes, beliefs and practices”. It mostly focuses on explaining income using non-cognitive skills such as individual

Reading Engagement and Literacy for Men and Women 99
motivation (Goldsmith et al., 2000), behavioural problems in high school (Cawley et al., 2001) and mental health (for example, Mullahy & Sindelar, 1993). In one study with a somewhat broader perspective, Waddell (2006) finds that, relative to others in their cohort, youth with poor attitude and self-esteem tend to: attain fewer years of postsecondary education; be less likely to be employed 14 years following high school; and, when employed, realise lower earnings. In another study investigating the relationship (in a sample of Dutch university students) between cognitive skills (IQ) and non-cognitive skills (including performance-motivation, preference for leisure, positive fear of failure, negative fear of failure, internal locus of control, social desirability, enjoyment of success, resilience, curiosity, emotional stability, introversion, openness, agreeableness and conscientiousness), Borghans et al. (2007) find that performance on cognitive tests is strongly associated with non-cognitive skills.
Responding to a question similar to the above, Jacob (2002) investigates the role that non-cognitive skills (academic effort, behaviour and maturity) play in explaining the gender disparity in tertiary attendance (favouring women) in the United States. He finds that after controlling for other factors, “… higher non-cognitive skills and college premiums among women account for nearly 90 percent of the gender gap in higher education.” Clearly, in this case at least, attitudinal factors (i.e. non-cognitive skills) provided substantial insight.
Objective
The background section above argued that the inclusion of attitudinal factors, where possible, might provide further insights in demographic and economic analyses. The aim of the remainder of this paper is to provide a fairly simple piece of evidence demonstrating the value of including the attitudinal factor “reading engagement” in an analysis of the gender disparity in the distribution of literacy skill in the adult population. In particular, the evidence addresses the question, “what role does reading engagement play in the relationship between gender and skill in the adult population?” The Adult Literacy and Life Skills (ALL) survey provides data containing attitudinal information as well as measures of literacy. Consequently, the ALL survey data will be used as the source of evidence in this paper.

100 Lawes
Methodology
Data
The ALL survey was an investigation of the distribution of several types of literacy skill among people aged 16 to 65 years. Each type of literacy was measured using English-language tests. The survey was conducted across a number of countries, as well as providing information specific to New Zealand (Satherley & Lawes, 2007). In this paper, analysis is restricted to New Zealand’s ALL data.
Much of the surveys methodology was internationally prescribed (OECD 2005a) and was ultimately driven by international policy concern around key competencies (Rychen & Salganik, 2003). The survey had a nationally representative probability-based sample with an over-sample of Maori and Pasifika peoples. The target population was all persons aged 16 to 65 usually resident in New Zealand and living in private households at the time of data collection. One eligible person per household was selected and interviewed face to face. Interviews were structured, and took place in the respondent’s house. Exactly 7,131 interviews were achieved during the data-collection period (May 2006 - March 2007). The response rate was 64%.
An ALL interview included a background questionnaire – which collected socio-demographic information – and a task booklet. The interview consisted of the interviewer administering the background questionnaire and task booklet to the respondent. The task booklet was in two parts – a short ’core’ booklet, and a longer task booklet. Literacy tasks involved text and diagram comprehension – correct completion of these tasks involved both closed and open-ended responses. The purpose of the core booklet was to screen out those with extremely low literacy from attempting the more demanding, longer task booklet while still collecting sufficient information to compute literacy ability scores. Those with high enough literacy completed the core booklet (that is, correctly answered at least three of the six items in the core booklet) and then moved on to attempt the longer task book. The interviews lasted an average of about 90 minutes (including the assessment). Sample assessment items are publicly available (OECD 2005a).

Reading Engagement and Literacy for Men and Women 101
Analyses
The analytical approach in this paper was to create a robust measure of reading engagement using factor-analytic techniques; create a first linear regression model of literacy skill accounting for standard demographic variables such as age, ethnicity, gender and time spent in formal education; create a second linear regression model of literacy skill accounting for all of the factors in the first model as well as the measure of reading engagement; and compare the two models.
To further illuminate this process, the variables included in these linear regression models are now described.
Gender is an indicator variable for being male and age measures the age (in years) of respondents. Age squared (measuring the square of the age of respondents) was included in the modelling to allow for a non-linear relationship between age and literacy skill. Ethnicity was recorded in the ALL survey by multiple-response. That is, a single respondent could identify with up to five ethnic groups. This is reflected in the modelling process by use of a number of indicator variables (Maori, Pasifika, Asian, Other) representing identification with the appropriate ethnic group. The default identification in the model is with the New Zealand European ethnic group.
The time that respondents spent in formal education was distributed quite differently for those who had a tertiary-level education than for those who did not. For this reason the variable time spent in formal education was standardised (i.e. transformed to have mean 0 and standard deviation 1) separately for those who had a tertiary-level education and those who did not. The variable tertiary education, indicating possession of a tertiary level education, was also included. For the purposes of this analysis, a tertiary-level education consists of having the equivalent of at least a level 4 certificate in New Zealand’s National Qualifications Framework (New Zealand Qualifications Authority, 2009).
To further explain, a respondent who had an above-average value for time in formal education and who had a tertiary level education had spent more than the average time in formal education when compared to others with a tertiary level education. Another respondent who had the same value for time in formal education but did not have a tertiary level education had
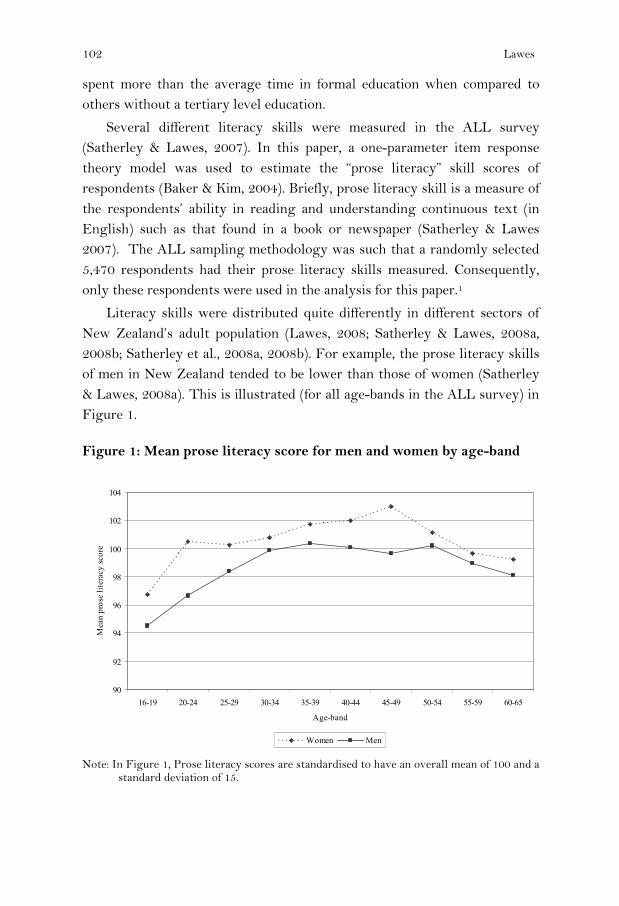
102 Lawes
spent more than the average time in formal education when compared to others without a tertiary level education.
Several different literacy skills were measured in the ALL survey (Satherley & Lawes, 2007). In this paper, a one-parameter item response theory model was used to estimate the “prose literacy” skill scores of respondents (Baker & Kim, 2004). Briefly, prose literacy skill is a measure of the respondents’ ability in reading and understanding continuous text (in English) such as that found in a book or newspaper (Satherley & Lawes 2007). The ALL sampling methodology was such that a randomly selected 5,470 respondents had their prose literacy skills measured. Consequently, only these respondents were used in the analysis for this paper.1
Literacy skills were distributed quite differently in different sectors of New Zealand’s adult population (Lawes, 2008; Satherley & Lawes, 2008a, 2008b; Satherley et al., 2008a, 2008b). For example, the prose literacy skills of men in New Zealand tended to be lower than those of women (Satherley & Lawes, 2008a). This is illustrated (for all age-bands in the ALL survey) in Figure 1.
Figure 1: Mean prose literacy score for men and women by age-band
Note: In Figure 1, Prose literacy scores are standardised to have an overall mean of 100 and a
standard deviation of 15.
90
92
94
96
98
100
102
104
16-19 20-24 25-29 30-34 35-39 40-44 45-49 50-54 55-59 60-65
Age-band
Mea
n pr
ose
liter
acy
scor
e
Women Men

Reading Engagement and Literacy for Men and Women 103
In addition to literacy information, the ALL survey collected a wide range of background information from respondents. Some of this information was related to their engagement with reading. In particular, the survey asked respondents how frequently they visited libraries and bookshops, how frequently they used books to obtain information, how many books were in their homes, as well as several questions about their attitudes to activities related to reading. See Table 1.
A factor analysis was performed to summarise responses to these questions. This factor analysis (using varimax rotation), suggested that there was a single factor underlying the responses to the above questions. This factor comprises the variable reading engagement included in the modelling process. The factor loadings are listed in Table 1.
Table 1: Factor loadings for reading engagement measure
Variable Factor loading
Library visit frequency 0.609
Bookshop visit frequency 0.684
Frequency of book use for information 0.754
Number of books in home 0.585
Disagreement with "I read only if I have to" 0.786
Agreement with "Reading is one of my favourite activities" 0.811
Agreement with "I enjoy talking about what I have read ..." 0.601
This factor (i.e. the variable reading engagement) explained around 48% of the variation in the listed variables.
The different outcome patterns of reading engagement for men and women (for all age-bands in the ALL survey) – analogous to those of prose literacy skill displayed in Figure 1 – are displayed in Figure 2.

104 Lawes
Figure 2: Mean reading engagement score for men and women by age-band.
Note: In Figure 2, reading engagement scores are standardised to have an overall mean of
100 and a standard deviation of 15. In addition to the variables described above, a number of interaction terms were included during the modelling process: Age by time in formal education allowed for different relationships between age and literacy skills for those who had spent different amounts of time in formal education; Pasifika by age allowed for a different relationship between age and literacy skills for Pasifika adults than for others. Age squared by time in formal education, Asian by age squared, Reading engagement by age and Reading engagement by tertiary education had analogous purposes.
Because of the survey’s complex design, replication methods were used to estimate standard errors in all linear regression analyses and mean calculations. Because of the sampling methodology (and in particular, the over-sample of Maori and Pasifika adults) weights were used in all linear regression analyses and mean calculations. At an early stage of modelling, age (by itself) was found to have a statistically non-significant relationship with literacy skill and was omitted from further modelling.
Standardised regression coefficients for the two linear regression models are displayed in Table 2.
80
85
90
95
100
105
110
16-19 20-24 25-29 30-34 35-39 40-44 45-49 50-54 55-59 60-65
Age-band
Mea
n re
adin
g en
gage
men
t sco
re
Women Men

Reading Engagement and Literacy for Men and Women 105
Table 2: Standardised regression coefficients and error for prose literacy
Variable First model coefficients (standard error)
Second model coefficients (standard error)
Age by time in formal education -0.037 (0.014) -0.033 (0.014)
Age squared -0.090 (0.014) -0.093 (0.012) Age squared by time in formal education 0.024 (0.011) 0.023 (0.011)
Asian -0.223 (0.012) -0.199 (0.013)
Asian by age squared 0.080 (0.012) 0.075 (0.012)
Time in formal education 0.265 (0.013) 0.216 (0.014)
Gender -0.075 (0.014) -0.015 (0.012)
Māori -0.100 (0.012) -0.074 (0.012)
Other ethnic group -0.030 (0.014) -0.030 (0.013)
Pasifika -0.234 (0.021) -0.204 (0.019)
Pasifika by age -0.097 (0.016) -0.097 (0.016)
Tertiary education 0.287 (0.017) 0.222 (0.017)
Reading engagement - - 0.287 (0.016)
Reading engagement by age - - 0.023 (0.009) Reading engagement by tertiary education - - -0.073 (0.017)
All coefficients were significant at the 0.05-level except Age squared by time in formal education in the first stage model (which was significant at the 0.06 level) and gender in the second stage model. The variables in the first stage model explained around 25% of the variation in prose literacy. The variables in the second stage model explained around 30%.
Results
Controlling for all other factors in the models except reading engagement:
• Women tended to have higher prose literacy skill than men. However after also controlling for reading engagement, this difference in skills became statistically non-significant. This is this paper’s main finding and demonstrates that attitudinal information may provide insights which are otherwise unavailable to economic and demographic analyses.
• When compared with those of middle age, both younger and older adults tended to have lower prose literacy skills. This effect persisted after also controlling for reading engagement.
106 Lawes
• Those adults who had a tertiary level education tended to have higher prose literacy skills. After accounting for tertiary level education, those adults who had spent longer in formal education tended to have higher prose literacy skills. This effect persisted after also controlling for reading engagement.
• Adults who identified as Maori, Pasifika, Asian and Other ethnic group tended to have lower prose literacy skills than those who identified as New Zealand European. In addition, Asian adults of middle age tended to have lower prose literacy skills than both younger and older Asian adults. Also older Pasifika adults tended to have lower prose literacy skills than younger Pasifika adults. These effects persisted after also controlling for reading engagement.
It is also apparent that after controlling for all other factors in the model, those with higher levels of reading engagement, especially older adults, tended to have higher prose literacy skill. This effect was somewhat less for those with a tertiary level education.
Discussion
The main finding of this paper is that the gender disparity in prose literacy skill can be explained by the fact that women tend to engage more with reading than men, providing some evidence of the value of including attitudinal information in demographic and economic analyses. However, this should be interpreted with care. It does not mean that the reading engagement patterns of men and women cause the gender disparity in literacy skill in the adult population of New Zealand (or the reverse). It also does not rule out the possibility that other factors such as income, participation in further education and training, or even an attitudinal factor like civic participation might also explain the gender disparity in prose literacy skill. Rather, it roughly means that for men, the difference in prose literacy skill between those with high reading engagement and those with low reading engagement, while significant, was similar to that for women.
To investigate the causal or temporal relationships between reading engagement and reading literacy in the adult population would require analysis of longitudinal data. It is likely that for many, reading engagement and reading literacy are factors which are first (broadly) determined at a

Reading Engagement and Literacy for Men and Women 107
young age. Therefore it seems beyond the scope of almost all current data collections to allow investigation of the causal relationships between reading engagement and reading literacy for adults with a broad range of ages. To investigate such important questions as why women tend to engage more with reading than men would require much more than analysis of longitudinal data. In the mean time, studies such as the ALL survey continue to provide valuable information.
The role that attitudinal factors (i.e. non-cognitive skills) might play in future analyses is unclear. Certainly some attitudinal factors will be better suited to some research questions than others, but the range of information that attitudinal factors might capture is vast. They might even be used as efficient proxies. For example, reading engagement – as constructed in this paper – is easy to measure: it is constructed from responses to 7 Likert-type items. Reading literacy skill, on the other hand, is difficult to measure: the average length of an ALL survey interview was about 90 minutes (mostly due to the literacy items). Therefore, when faced with issues of data-collection design, one might be tempted to use reading engagement (perhaps in combination with qualifications achieved or time spent in formal education) as a proxy for skill. Certainly, the use of attitudinal factors in demographic and economic analyses of New Zealand’s adult population seems to have much potential.
Elsewhere, Heckman (for example, Heckman et al., 2006) and collaborators have found considerable value incorporating non-cognitive skills into their economic analyses. Many of their analyses address the historical over-attribution of importance the contribution cognitive skills make to life outcomes. Instead, they seek to quantify the significant contributions of non-cognitive skills such as self-control and sociability. Similar analyses would likely provide substantial insights into New Zealand’s economic and demographic landscapes and contribute considerable challenges for policy analysts and makers alike.
Acknowledgements and Disclaimer
The author would like to thank Jit Cheung, Roger Smythe, Heleen Visser and other colleagues at the Ministry of Education for their useful comments. The author also gratefully acknowledges the improvements suggested by the reviewer. Opinions expressed in this paper are those of the author and do not necessarily coincide with
those of the Ministry of Education.

108 Lawes
Note
1 These considerations do not apply in all analyses of the ALL data: OECD, 2005a; Satherley et al., (2008) are concerned with producing population estimates describing the distribution of literacy skills. Consequently, they use a two-parameter item response theory model and plausible value methodology (Baker and Kim, 2004; OECD, 2005b).
References
Badkar, J., Callister, P., Krishnan V., Didham, R. & Bedford, R. (2007a). Gender, mobility and migration into New Zealand: A case study of Asian migration. Social Policy Journal of New Zealand (32). p. 126 - 154.
____________________________________________________ (2007b). Patterns of gendered skilled and temporary migration into New Zealand. Wellington, Department of Labour.
Baker, F. & Kim, S. (2004). Item response theory: Second edition, revised and expanded. New York, Marcel Dekker.
Baker, L. & Wigfield, A. (1999). Dimensions of children’s motivation for reading and their relations to reading activity and reading achievement. Reading Research Quarterly, 34(4), 452-477.
Bean, C. (2005). Causes of delayed childbearing in New Zealand and western societies. New Zealand Population Review 31(2):73-90.
Bedford, C. (2003). Skill shortages in New Zealand: Public and private sector responses. New Zealand Population Review 29(2):63-88.
Borghans, L., Meijers, H. & ter Weel, B. (2007). The role of non-cognitive skills in explaining cognitive test scores. Paper presented at the American Economic Association conference 2007, Chicago, USA. http://www.aeaweb.org/annual_mtg_papers/2007/conference_papers.php
Cawley, J., Heckman, J. & Vytlacil, E. (2001). Three observations on wages and measured cognitive ability. Labor Economics, 8, 419–42.
Chamberlain, M. (2007). Reading literacy in New Zealand: An overview of New Zealand’s results from the Progress in International Reading Literacy Study (PIRLS) 2005/2006. Wellington: Ministry of Education.
______________. (2008). PIRLS 2006/2007 in New Zealand: An overview of national findings from the second cycle of the Progress in International Reading Literacy Study (PIRLS). Wellington, Ministry of Education.
Chapman, J. & Tunmer, W. (1995). Development of young children’s reading self-concepts: An examination of emerging subcomponents and their relationship with reading achievement. Journal of Educational Psychology, 87, 154-167.
Condie, R., McPhee, A., Forde, C., Kane, J. & Head, G. (2006). Review of strategies to address gender inequalities in Scottish schools: final report. Scotland: Scottish Executive Social Research. Retrieved September, 30, 2009, from http://www.scotland.gov.uk/Publications/2006/05/03105823/0.

Reading Engagement and Literacy for Men and Women 109
Crooks, T., & Flockton, L. (2005). Reading and speaking assessment results 2004. National Education Monitoring Report 34. Dunedin: Educational Assessment Research Unit, University of Otago.
Dixon, S. (2004). Understanding reductions in the gender wage differential 1997-2003. Paper presented at the New Zealand Conference on Pay and Employment Equity for Women 2004, Wellington, New Zealand. Retrieved September 30, 2009 from http://www.dol.govt.nz/publication-view.asp?ID=196.
Earle, D. (2009a). How well do qualifications predict literacy and numeracy? Wellington, Ministry of Education.
_______. (2009b). The effect of first language and education on literacy, employment and income: An analysis from the Adult Literacy and Life Skills survey. Wellington, Ministry of Education.
Goldsmith, A., Veum, J. & Darity, W. Jr. (2000). Motivation and labor market outcomes. In Research in labor economics. New York, JAI/Elsevier Sciences, pp. 109–46.
Hattie, J. (1992). Self-concept. Hillsdale, NJ, Lawrence Erlbaum Associates Inc. Heckman, J., Stixrud, J. & Urzua, S. (2006). The effects of cognitive and
noncognitive abilities on labor market outcomes and social behaviour. Journal of Labor Economics, 24 (3), 411 - 482.
Hunter, J. (2007). Workplace language and communication needs: Employers and immigrant employees. Labour market dynamics research programme, Working Paper 19. Albany and Palmerston North, Massey University.
Jacob, B. (2002). Where the boys aren’t: non-cognitive skills, returns to school and the gender gap in higher education. Economics of Education Review, 21, 589 - 598.
Johnston, G. (2005). Women’s participation in the labour force. New Zealand Treasury Working Paper 05/06. Wellington, The Treasury. Retrieved September 28, 2009 from
http://www.treasury.govt.nz/publications/research-policy/wp/2005/05-06/. Lawes, E. (2008). English literacy of New Zealand’s adult Pacific peoples. Paper
presented at the NZARE National Conference 2008, Palmerston North, New Zealand. Retrieved July, 16, 2009, from the CD-Rom of Papers [ISSN 1176-4902]
Maré, D. & Stillman, S. (2009). The impact of immigration on the labour market outcomes of New Zealanders. Economic impacts of immigration working paper series, Wellington, Department of Labour. Retrieved September 28, 2009 from http://www.dol.govt.nz/publications/research/impacts-labour-market-outcomes/index.asp.
Marsh, H. & Yeung, A. (1998). Longitudinal structural equation models of academic self-concept and achievement: Gender differences in the development of math and English self-concepts. American Educational Research Journal, 35, 705-738.
Meyer, L., McClure, J., Walkey, F., Weir, K. & McKenzie, L. (2009). Secondary student motivation orientations and standards-based achievement outcomes. British Journal of Educational Psychology, 79, 273-293.
Mullahy, J. & Sindelar, J. (1993). Alcoholism, work, and income. Journal of Labor Economics, 11, 494–520.
110 Lawes
Mullis, I., Martin, M., Kennedy, A. & Foy, P. (2007). PIRLS 2006 international report: IEA’s progress in international reading literacy study in primary schools in 40 countries. Chestnut Hill, MA: TIMSS and PIRLS International Study Center, Boston College
New Zealand Qualifications Authority. (2009). National Qualifications Framework (NQF). Retrieved September 24, 2009 from http://www.nzqa.govt.nz/framework/index.html.
New Zealand Treasury. (2008) Working smarter: Driving productivity growth through skills. New Zealand Treasury Productivity Paper 08/06. Wellington, The Treasury. Retrieved September 28, 2009 from http://www.treasury.govt.nz/publications/research-policy/tprp/08-06/12.htm.
OECD. (2005a). Learning a living – first results of the Adult Literacy and Life Skills survey. Ottawa and Paris, Statistics Canada and OECD. Retrieved September 24, 2009 from http://www.statcan.gc.ca/pub/89-603-x/89-603-x2005001-eng.htm.
_____ (2005b). PISA 2003 Data Analysis Manual: SAS® Users. Paris, OECD. _____ (2007). PISA 2006 Science competencies for tomorrow’s world, Volume 1:
Analysis. Paris, OECD. Rychen, D. & Salganik, L. (Eds). (2003) Key competencies for a successful life and a well-
functioning society. Germany, Hogrefe and Huber. Satherley, P. & Lawes, E. (2007). The Adult Literacy and Life Skills (ALL) survey: an
introduction. Wellington, Ministry of Education. ___________________ (2008a). The Adult Literacy and Life Skills (ALL) survey:
gender and ethnicity. Wellington, Ministry of Education. ___________________ (2008b). The Adult Literacy and Life Skills (ALL) survey: age
and literacy. Wellington, Ministry of Education. ___________________ & Sok, S. (2008a). The Adult Literacy and Life Skills (ALL)
survey: education, work and literacy. Wellington, Ministry of Education. ___________________ & Sok, S. (2008b). The Adult Literacy and Life Skills (ALL)
survey: Overview and International Comparisons. Wellington, Ministry of Education.
Schagen, I. & Twist, L. (2008). Adding value to PIRLS by combining with national data using sophisticated modelling techniques. Paper presented at the International Research Conference of the International Association for the Evaluation of Educational Achievement 2008, Taipei, Chinese Taipei. Retrieved September 29, 2009 from http://www.iea.nl/irc2008_pirls.html
Smyth, R. & Lane, C. (2009). Skills and education: How well do educational qualifications measure skills? Wellington, Ministry of Education.
Sturrock, F. & May, S. (2002). PISA 2000: The New Zealand Context: The reading, mathematical and scientific literacy of 15-year-olds. Wellington, Ministry of Education.
Szeto, K. & McLoughlin, S. (2008). Does quality matter in labour input? The changing pattern of labour composition in New Zealand. New Zealand Treasury Working Paper 08/01. Wellington, The Treasury. Retrieved September 28, 2009 from

Reading Engagement and Literacy for Men and Women 111
http://www.treasury.govt.nz/publications/research-policy/wp/2008/08-01/. Waddell, G. (2006). Labor market consequences of poor attitude and low self-
esteem in youth. Economic Inquiry, 44 (1) 69-97. Retrieved September 28, 2009 from http://www.uoregon.edu/~waddell/papers/2006_EI_Waddell.pdf.
Wagemaker, H. (Ed.) (1996) Are girls better readers? Gender differences in reading literacy in 32 countries. Amsterdam, International Association for the Evaluation of Educational Achievement.
Younger, M., Warrington, M., Gray, J., Rudduck, J., McLellan, R., Bearne, E., Kershner, R. & Bricheno, P. (2005). Raising boys’ achievement (Research Report RR636). United Kingdom, Department for Education and Skills.
Retrieved September 28, 2009 from http://www.dcsf.gov.uk/research/data/uploadfiles/RR636.pdf.


New Zealand Population Review, 35:113-127. Copyright © 2009 Population Association of New Zealand
Paid Caregivers in New Zealand: Current Supply and Future Demand
JUTHIKA BADKAR * RICHARD MANNING *
Abstract New Zealand’s population is ageing due to a decline in the fertility rate and increases in life expectancy. The incidence of disability increases with age. This is a crucial factor in the future need for care. Department of Labour estimates suggest that the number of paid caregivers needs to almost treble in order to meet the needs of the projected number of disabled older people requiring a high level of care and support. The purpose of this paper is to examine the current supply of paid caregivers for the elderly in New Zealand by developing a demographic profile of the caregiver workforce in New Zealand, and to project the future demand for paid caregivers.
Introduction
lobally, longer lives and fewer births have resulted in an ageing population. New Zealand’s population is also ageing, and at the 2006 Census of Population and Dwellings, there were just under
half a million New Zealand residents aged 65 years and over (495,600). The number of people in this age group had doubled from 1970 to 2006, and may reach 1.3 million by 2051. Moreover, within the population aged 65 years and over, the number of people aged 85 years and over has grown significantly, trebling in the period 1978 to 2006 to a total of 58,000.
In the early 1970s, one in 12 of all New Zealanders was aged over 65; however, currently those aged 65 years and over constitute one in eight. The population aged 65 and over is expected to more than double by 2051,
* Department of Labour, New Zealand. Email: [email protected].
G

114 Badkar and Manning
when they will make up one-quarter or more of all New Zealand residents.1 This is because the large baby boom cohorts born during 1946 to 1965 will enter into the 65+ age group in 2011 (Khawaja et al., 2007).
Due to increases in longevity, the older population is itself ageing. The median age of the 65+ population has increased by almost three years since the early 1950s (from 71.4 years to 74.2 years in 2006) and is projected to exceed 77 years by 2051. This is also confirmed by the growing concentration of population at ages over 84 years (Khawaja et al., 2007).
The number of New Zealanders aged 85 years and over is projected to more than quadruple from just under 57,000 to 322,000 by 2051(Dunstan & Thomson, 2006).2 Those aged 65–74 years made up 70 percent of all residents over 65 in 1951, 53 percent in 2006 and are projected to drop to 40 percent by 2051. By contrast, over the same period, the share of those aged 85+ rose from 3.9 percent in 1951 to 11.7 percent in 2006 and is projected to rise to 24 percent in 2051. Maori, Pacific and Asian populations are likely to age less quickly than the European population due to ethnic differences in fertility, mortality and migration (Khawaja et al., 2007).
Declining national labour force participation
An ageing population will lead to a decrease in the overall labour force participation rate. In absolute terms though, New Zealand’s labour force is projected to continue to grow from an estimated 2.24 million at 30 June 2006 to 2.65 million in 2031 and 2.79 million in 2061.3
New Zealand’s labour force will age, reflected by a rising median age and an increasing proportion of the labour force in older age groups. Half of the labour force will be aged over 42 years in 2011, compared with a median age of 40 years in 2006 and 36 years in 1991. The labour force aged 65 years and over is projected to increase from roughly 62,000 in 2006 to 160,000 in 2021 and about 200,000 from the mid-2030s (Statistics New Zealand, 2008b).
The Potential Support Ratio (PSR) indicates the dependency burden on potential workers (that is, the number of persons aged 15–64 years per older person aged 65 years or older). The impact of demographic ageing is noticeable in global PSRs, which have dropped and will continue to fall. Globally, between 1950 and 2000 the PSR fell from 12 to nine people. By 2050, the PSR is projected to fall to four working-age persons for each

Paid caregivers in New Zealand 115
person 65 years or older (United Nations, 2002). However, it is worth noting that in the future a growing proportion of people aged 65 and over will be in our workforce, which may mitigate this burden.
Methods
The data sources used when conducting this analysis were the 1996, 2001 and 2006 Censuses of Population and Dwellings, Statistic New Zealand’s 2006 Disability Survey of Residential Facilities and Household Disability Survey, and Statistics New Zealand’s 2006 Population Projections (note: in order to test boundaries, we used the high mortality assumption series (series 3), the low mortality series (series 7), and the medium series (series 5), which is considered by Statistics New Zealand to be the most suitable for assessing future population changes).
One of the main limitations to the data is the quality of data collected on occupation in the Census. Occupational data on caregivers does not differentiate between caring for older people and caring for disabled people, across all age groups.
It is also important to note that the estimates provided do not factor in any productivity gains. We assume that the ratio of paid caregivers to those receiving care remains the same over the whole time period. Also, we do not factor in any income effects or shifts in demand, i.e. if incomes increase or social norms change, this might increase the relative demand for caregivers and the ratio of caregivers to those receiving care could increase.4 We also do not take into account attrition (which is likely to occur in the existing caregiver workforce) and improvements in technology that could prolong the quality of life, or change the nature of caregiving.
The data for disability is sourced from the 2006 Household Disability Survey, and assumptions made are based from this survey. In the future the disability rate for older people may decrease, given advances in medical technology, health care, and improvement in lifestyle, which could reduce the need for paid caregivers. On the other hand, the rates of disability may get worse, increasing the need for paid caregivers. In our analysis, for simplicity, we assume that the 2006 disability rate is maintained over the next 30 years.

116 Badkar and Manning
Results
Who Provides Care to Older New Zealanders?
This section examines the demographics of the caregiver workforce, using Census data on occupation.
Figure 1 superimposes the age-sex structure of caregivers with that of all employed. This not only demonstrates that caregiving is a highly gendered occupation (92 percent of the national caregiver workforce were women), but that caregivers are over-represented in the older age groups (40 years and over) compared to the younger ages. An implication of this is that caregivers also grow old, retire and leave the workforce.
Figure 1: New Zealand: Age-sex structure of aged-caregivers and total workforce, 2006
Source: Statistics New Zealand 2006b. The ageing of caregivers is demonstrated in Figure 2, by overlaying the age sex structures of caregivers in 2001 and 2006. This graph also indicates higher growth in the inter-censal period in the number of caregivers in the older groups (from 45 years and over), than among the younger age groups.
15% 10% 5% 0% 5% 10% 15%
15-19
20-24
25-29
30-34
35-39
40-44
45-49
50-54
55-59
60-64
65-69
70+FemalesMales
Ag
e C
oh
ort
Aged Care Workers
Total Workforce

Paid caregivers in New Zealand 117
Figure 2: New Zealand: Age-sex structure of aged-care workers, 2001 and 2006
Source: Statistics New Zealand 2006b.
Decreasing Trends in Caregivers for the Elderly
As indicated above, almost all caregivers for the elderly are female. In the past, women had fewer options for employment, but increased opportunities in education and employment has resulted in women being more likely to participate in higher skilled, less demanding and higher paid jobs than working as caregivers for the elderly. Societal choices and values have also changed and there has been an increase in couples with no children, smaller family sizes, fewer people living in extended family households and higher divorce rates. These changes have also contributed to a decline in the pool of informal caregivers (Fine, 2006).
In addition to the decline in informal caregivers, the availability of paid caregivers for the elderly is also decreasing. This is because of the ageing of the caregiver workforce itself and potential barriers to young workers being drawn to the aged-care industry (Hugo, 2007; OECD, 2009). A recent study in Australia estimates that over the next three decades 69,000 extra caregivers will be needed in residential care and 136,000 in non-residential care for older Australians aged over 75 years. This study recommends that policies need to be designed to increase workforce participation levels among older age groups and to draw into the workforce groups that are currently disengaged from it. It also recommends immigration as a potential means to recruit workers into the aged-care industry (Hugo, 2007).
6000 4500 3000 1500015003000
15-19
20-24
25-29
30-34
35-39
40-44
45-49
50-54
55-59
60-64
65-69
70+
Ag
e C
oh
ort
Aged-care workers
FemaleMale
2001
2006

118 Badkar and Manning
The longer-term demographic impact of an ageing population will affect the need for care, the availability of informal and formal caregivers and the affordability and provision of social provisions (Fine, 2006). Caring for older people requires a unique set of skills, resources and personal relationships. The trend across all OECD countries suggests that there are fewer children and a growing number of old people in relation to the working-age population (OECD, 2007).
Growth of New Zealand’s Aged Population
Table 1 demonstrates the demographic shifts that are expected to occur in New Zealand’s population out to 2036.5
• While the number of children (0–14 years) is expected to increase slightly between 2006 and 2016, it will decline after that time.
• The working-age population (15–64 years) will grow 0.55 percent per year in the 2006–16 period, 0.17 percent per year in the 2016–26 period and will undergo a small decline in the 2026–36 period.
• The biggest growth, however, will occur in the 65+ age group, which is projected to increase by 3.16 percent per year in the 2006–16 period, 3.13 percent per year in the 2016–26 period and 2.26 percent per year in the 2026–36 period. Between 2006 and 2036, it is expected that the proportion of the working age population that are aged 65+ will double, from 18 percent to 40 percent.
Table 1: Projections of New Zealand’s children (0–14 years), working-age population (15–64 years) and aged population (65+ years)
Year/Number by age 0–14 15–64 65+
65+ as % of working-age population
2006 888,300 2,784,700 511,600 18% 2016 895,500 2,942,800 698,500 24% 2026 877,500 2,992,800 950,200 32% 2036 859,800 2,978,500 1,187,700 40%
Annual Growth Rates
Period 0–14 15–64 65+ 2006–16 0.08% 0.55% 3.16% 2016–26 -0.20% 0.17% 3.13% 2026–36 -0.20% -0.05% 2.26%
Source: Statistics New Zealand 2006a.

Paid caregivers in New Zealand 119
Within the 65+ age group, growth will be strongest in the older age groups, mainly those aged 75 and over - these are the groups that would most likely require paid care in New Zealand. Table 2 shows projected growth of the 65–74, 75–84 and 85+ age groups. During 2006–16, growth in the 65–74 age group is 3.7 percent per year; however, the expected biggest growth will be the 85+ age group, at 4.4 percent per year.
It is expected that maximum growth in the 75–84 age group will occur during 2016–2026 at 4.1 percent per year, and for the 85+ age group, maximum growth will be during 2026–2036 at 5.0 percent per year.
Table 2: New Zealand: Projected growth of the population aged 65–74, 75–84 and 85+
Year 65–74 % growth per annum 75–84 % growth
per annum 85+ % growth per annum
2006 275,700 177,800 58,200 2016 395,700 3.7% 214,300 1.9% 89,400 4.4% 2026 508,100 2.5% 319,000 4.1% 127,100 3.6% 2036 573,300 1.2% 417,000 2.7% 206,200 5.0%
Source: Statistics New Zealand 2006a. Demand for paid care increases with age. The data in Table 3 suggests that by 2036, the number of people aged over 85 years may be 32 percent greater under the low mortality assumption than under the high mortality assumption (235,900 versus 178,700). In the 65–74 and 75–84 age groups, the differences are small (3.2 percent and 8.4 percent respectively). Given the vast potential difference in growth in the 85+ age group (based on the low and high mortality assumptions), the actual growth in this population should not be underestimated.

120 Badkar and Manning
Table 3: The effects of different mortality assumptions on the growth of New Zealand’s future aged population, 2006–2036 6
Age 65–74
Year Low High % difference between
populations 2006 275,700 275,7002016 397,400 393,900 0.9%2026 513,100 502,500 2.1%2036 581,700 563,800 3.2%
Age 75–84
Year Low High % difference between
populations 2006 177,800 177,8002016 217,100 211,900 2.5%2026 328,500 310,600 5.8%2036 436,600 402,700 8.4%
Age 85+
Year Low High % difference between
populations 2006 58,200 58,2002016 93,200 85,800 8.6%2026 139,700 115,100 21.4%2036 235,900 178,700 32.0%
Source: Statistics New Zealand 2006a.
Expected increase in need for disability care
The incidence of disability increases with age, which is a crucial factor in the need for care. In 2006, 32 percent of those aged 65–74 years, 51 percent aged 75–84 and 71 percent aged 85 years and over reported some form of disability in the Household Disability Survey (HDS). Results from that survey showed that 13 percent of older disabled people lived in a residential facility, and of these, 98 percent had a physical disability. An interesting observation is that the majority of older people with a disability lived in households (87 percent), suggesting that older New Zealanders prefer to age and stay in their homes as long as possible (Department of Labour, 2009).
If the 2006 incidence of disability is maintained out to 2036, there will be an immense increase in the number of older people with a disability who require care. However, not everyone reporting a disability will require paid care. The 2006 HDS collected information on the level of support required by disabled persons, and respondents were classified as having low, medium

Paid caregivers in New Zealand 121
or high support needs, based on their need for assistance and/or special equipment relating to their disability. Those with medium support needs used, or had an unmet need for, some type of assistive device, aid or equipment. Those with high support needs received daily assistance with tasks such as bathing, preparing meals and so on (Statistics New Zealand, 2007).
Based on these definitions, Table 4 presents the projected number of older persons with a disability that would require care, using low, medium and high disability scenarios (calculated using series 5 – medium population projections). The low scenario assumes the need for high levels of support, the medium scenario assumes medium and high levels of support and the high scenario assumes all levels of support, i.e. everyone with a disability.
Table 4: New Zealand: Projected number of older disabled persons needing care, using low, medium and high disability assumptions, 2006–2036 7
Low scenario – high level of support 65–74 years 75–84 years 85 years + Total 65 years +
2006 13,100 22,700 18,800 54,7002016 18,800 27,400 28,900 75,1002026 24,100 40,800 41,100 106,1002036 27,200 53,700 66,800 147,700
Medium scenario – medium and high levels of support 65–74 years 75–84 years 85 years + Total 65 years +
2006 55,000 71,500 38,100 164,8002016 78,900 86,300 58,500 223,7002026 101,400 128,600 83,300 313,3002036 114,400 169,100 135,400 418,800
High scenario – low, medium and high levels of support 65–74 years 75–84 years 85 years + Total 65 years +
2006 88,400 90,700 41,000 220,4002016 126,900 109,400 63,000 299,3002026 162,900 163,100 89,700 415,7002036 183,800 214,500 145,700 544,000
Source: Household Disability Survey (Statistics New Zealand 2006c), Population Projections (Statistics New Zealand 2006a) and Census of Population and Dwellings (Statistics New Zealand 2006b).
Under the low scenario, while the number of disabled people in the 65–74 and 75–84 age groups will double (2.1 and 2.4 times respectively) between 2006 and 2036, the greatest increase is observed in the 85+ age group, projected to increase by 3.5 times over the next three decades, from 18,800 in 2006 to 66,800 in 2036.8

122 Badkar and Manning
Under the medium and high scenarios, the absolute increase in the number of disabled people is apparent – though it seems unlikely that this will be the case for New Zealand.
Expected Increase in Need for Aged Caregivers
At the 2006 Census, aged-care workers (caregivers) represented just under one percent of the total workforce. In numerical terms, this roughly equated to 17,900 aged-care workers. If this proportion is maintained in the next few decades, a crude estimate suggests that there will potentially only be 21,400 caregivers available in 2036.9 This is not sustainable, given the expected increase in demand for aged-caregivers.
As shown in Table 5, the projected number of paid caregivers required to meet the needs of the projected number of disabled older persons requiring high levels of support could treble, from the current 17,900 in 2006 to 48,200 in 2036. (The projected number of paid caregivers is based on a low scenario assumption of the projected number of older disabled persons needing care (i.e. only those requiring high levels of support)).
However, if the current proportion of caregivers is maintained, the ratio of caregivers to older disabled people requiring care will deteriorate (from 1:3 in 2006 to 1:7 in 2036).
Table 5: New Zealand: Actual and projected number of paid caregivers needed and available for older New Zealanders aged 65 years and over, 2006–2036 10
2006 2016 2026 2036 Actual and projected number of disabled older persons requiring care (65+) 54,700 75,100 106,100 147,700
Actual and projected number of paid care workers needed 17,900 24,500 34,600 48,200
Projected number of paid care workers : Disabled older people requiring care (65+) 1.3 1.3 1.3 1.3
Actual and projected number of paid care workers available 17,900 19,900 20,800 21,400
Projected number of paid care workers : Disabled older people requiring care (65+) 1.3 1.4 1.5 1.7
Source: Household Disability Survey (Statistics New Zealand 2006c) and Department of Labour projections (using Statistics New Zealand 2006b).

Paid caregivers in New Zealand 123
The results presented above relate to the number of specific aged-care workers (who are non-health professionals) required under the low scenario where only those disabled persons requiring high levels of support are taken into account. It is also assumed for simplicity that the ratio of care workers to disabled persons requiring care observed in 2006 (about 1:3) will apply over the 30-year projection period (2006–2036). However it is quite conceivable that this ratio, in effect, could change, leading to proportionately fewer or greater caregivers being required if different methods of care and technology are adopted.
The number of paid caregivers required will be higher if the number of older disabled persons under medium (those requiring medium and high levels of support) or high (those requiring all levels of support) scenarios, as outlined in Table 4, are taken into account.
Conclusions and Recommendations
Over the next 30 years, the proportion of older people in New Zealand is projected to double, with the largest percentage growth occurring in the 85 years and over group. Currently, 17,900 paid caregivers are looking after older disabled New Zealanders requiring high levels of support.11 As the incidence of disability increases with age, so does the need for care. As a result, the number of older disabled persons needing high levels of care is projected to treble over the next three decades.
Department of Labour estimates show that 48,200 paid aged-caregivers will be needed in 2036 in order to care for older disabled people requiring high levels of support.12 However, if the current proportion of aged-care workers to the total population is maintained over the next 30 years, there will only be 21,400 aged-care workers available. This current pathway is clearly unsustainable.
Consequently longer term planning around the future of the aged care sector is needed. The unsustainable pathway experienced in this sector requires a comprehensive approach that not only takes the workforce into consideration, but also requires other productivity gains for the aged care industry.
Both the OECD report and Australian research strongly recommend that long-term planning around the future of the caregiver workforce is needed in order to meet the increasing demand for paid caregivers in OECD

124 Badkar and Manning
countries such as New Zealand (Hugo, 2007; OECD, 2009). Their other recommendations include: developing policies to increase workforce participation among older age groups who may be close to retirement; encouraging those who are currently disengaged from the labour force to consider elder care as a vocation; developing training programmes and established career structures in the aged-care sector; considering the immigration of low skilled workers as a potential means to recruit workers into the aged-care industry.
The research also suggests that wage rates be addressed across the care sector. This is important for New Zealand because of the strong growth of Australia’s older population and the possibility of Australia attracting our caregiver workforce given the higher wage rates for caregivers in Australia.
Clearly the aged care sector has a range of workforce challenges, however as previously indicated this is unlikely to be able to solve the issues in the longer term. As such, the sector will need to address additional productivity gains by investing in areas such as the use of Information and Communication Technologies (ICTs) to improve efficiency in organising and planning paid caregivers’ services. However, the uptake of ICTs is slow across the care sector in several countries (OECD, 2009).
However, it is worth noting that disability rates amongst older people may decrease in the future. Research in the United States (Manton et al., 1997) showed significant declines in the prevalence of chronic disability in older people. If this trend continues and is observed in New Zealand, it has implications in projecting the need for care.
Our current understanding of the dynamics of this labour market is limited, and the partial view presented in this paper does not offer any simple practice or policy remedies for the potential shortages of paid caregivers in the future. However, it is necessary to be aware that New Zealand’s population is ageing rapidly and that, if processes are not implemented now, we will not have a sufficient supply of paid caregivers for the elderly in the future.

Paid caregivers in New Zealand 125
Notes
Most of the analysis presented in this paper was originally presented in a paper written by Juthika Badkar for the Department of Labour in 2009, titled The Future Demand for Paid Caregivers in a Rapidly Ageing Society. 1 Between 1.17 million (series 1) and 1.48 million (series 9). 2 Calculations made by using Statistics New Zealand’s series 5 Population
Projections. This is the medium series, with projections based on three key assumptions – medium fertility, medium mortality and positive long-run annual net-migration of 10,000. Projections of the very-old are sensitive to mortality assumptions. Under the very low mortality scenario, this age group would number 480,000 in 2051. By comparison, under the high mortality assumption (series 1), this age group would number 260,000.
3 Using mid-range projection series 5M. 4 We also assume that the ratio of informal carers to those receiving care remains
the same. 5 Using Statistics New Zealand’s series 5 Population Projections. 6 Technical notes: Table 3 was constructed based on Statistics New Zealand’s
2006 Population Projections. The series ‘Low’ relates to the assumptions of low future mortality, medium fertility and medium positive annual net migration of 10,000 (Statistics New Zealand’s Population Projections Series 7). The series ‘High’ relates to Statistics New Zealand’s Population Projections series 3, which is based on the assumptions of medium fertility, high mortality and positive annual net migration of 10,000.
7 Technical notes: Table 5 was calculated by multiplying the disability ratios for older people within the respective age cohorts (65–74, 75–84 and 85+) with the reported care needs (low, medium or high) from Statistics New Zealand’s 2006 Disability Survey by Statistics New Zealand’s Population Projections (series 5). Series 5 was the medium series, as it assumed medium mortality, medium fertility and medium annual net migration of 10,000 people. These tables therefore give an indication of the number of persons who are likely to require care over the next 30 years, based on older persons’ current care needs.
8 This assumes that the prevalence of disability does not change in each age group.
9 The projection of the number of personal care workers for 2036 was calculated based on Statistics New Zealand’s Labour Market projections (series 5M, which is the medium series, and assumes medium fertility, medium net annual migration of 10,000 and medium labour force participation rates). A ratio was calculated for the number of personal care workers to the total estimated workforce in 2006 based on the 2006 Census of Population and Dwellings. This ratio was then multiplied by the labour force projections to provide an estimate of the number of workers who could potentially be available.
10 Technical notes: Table 5 was calculated by dividing the fractions of older persons (65+) within the 2006 Disability Survey who identified as requiring a high level of care by the total persons within this age cohort from the 2006 Census. This fraction was then multiplied by series 5 of Statistics New

126 Badkar and Manning
Zealand’s Population Projections for the years 2016, 2026 and 2036 to obtain an estimate of the numbers of older people who are likely to require care in the future years. These predictions of the persons who are likely to require care were then multiplied by the fraction of personal care workers to people who required a high level of care in 2006, to obtain the estimation of care workers needed. As the three occupations (health assistant, nurse aide and caregiver) within 513 personal care workers can be included within a number of industries, only four specific 4-digit industries that employed health assistants, nurse aides or caregivers related specifically to aged care were included – nursing homes, accommodation for the aged, residential care facilities and non-residential care facilities.
11 This is defined as requiring assistance with tasks such as bathing, preparing meals and so on.
12 However, it is important to note that these estimates are conservative as they are based on the assumption that the ratio of caregivers to those receiving care remains the same over the whole time period (1:3). Therefore, the estimates on the future demand for paid carers are at the lower scale. Our estimates are similar to research findings from Australia (Hugo 2007).
References
Dunstan, K. & Thomson, N. (2006). Demographic aspects of New Zealand’s ageing population. Wellington, Statistics New Zealand.
Department of Labour (2009). The future demand for paid caregivers in a rapidly ageing society. Wellington, Department of Labour.
Fine, M. (2006). A caring society? Care and the dilemmas of human services in the 21st century. Palgrave/MacMillan, Houndmills.
Hugo, G. (2007). Contextualising the ‘crisis in aged care’ in Australia: A demographic perspective. Australian Journal of Social Issues, 42 (2): 169-182.
Khawaja, M., Boddington, W. & Tang, I. (2007). New Zealand’s 65+ population: a statistical volume. Wellington, Statistics New Zealand.
Manton, K., Corder, L. & Stallard, E. (1997). Chronic disability trends in elderly United States populations: 1982-1994. Proceedings of the National Academy of Sciences of the United States of America, 94: 2593-2598.
OECD. (2007). Society at a glance: OECD Social Indicators. Paris, OECD. OECD. (2009). The long-term care workforce: overview and strategies to adapt supply to a
growing demand. Paris, OECD. Retrieved from http://apo.org.au/node/3719. Statistics New Zealand. (2006a). Projected population of New Zealand by age and sex,
2006 (base) – 2061. Wellington, Statistics New Zealand. ___________________ (2006b). Age group by sex, for the census night population
count, 1996, 2001, and 2006. Wellington, Statistics New Zealand. ___________________ (2006c). Disability status by pace of residence, age group,
sex and ethnic group, 2006. Wellington, Statistics New Zealand. ___________________ (2007). 2006 Disability survey. Wellington, Statistics New
Zealand.

Paid caregivers in New Zealand 127
___________________ (2008a). Demographic trends: 2007. Wellington, Statistics New Zealand.
___________________ (2008b). National labour force projections: 2006 (base)–2061. Wellington, Statistics New Zealand.
United Nations. (2002). World population ageing: 1950-2050. Department of Economic and Social Affairs Population Division. Sales No. E.02.XIII.3.
http://www.un.org/esa/population/publications/worldageing19502050/.


New Zealand Population Review, 35:129-148. Copyright © 2009 Population Association of New Zealand
Procreate and Cherish: A Note on Australia’s Abrupt Shift to Pro-Natalism
NATALIE JACKSON * AMINA CASEY **
Abstract
After a long history of arguing that Australian governments do not intervene in the bedrooms of the nation, in 2004 the Howard Government did exactly that. Under the enthusiastic choreographing of then Treasurer Peter Costello, it implemented an explicit and indirect fertility policy in the form of a maternity payment, commonly known as the ‘Baby Bonus’. Rising fertility in Australia since that time has been widely claimed as evidence of the policy’s success. Hailed as a mini ‘baby boom’, Costello was moved to describe the policy as a shift from ‘population or perish’ to ‘procreate and cherish’. Despite arguing against it while in Opposition, the policy has been continued with only a few changes by the incumbent Rudd Government, seemingly on the grounds that it may indeed be responsible for the recent ‘nudging up’ of birth rates.
This paper traces the policy shift and concludes with a brief analysis of Australian trends across the period of the Baby Bonus (2004-2008), showing that one quarter of the increase in numbers is due to cohort size, but noting that fertility has also risen in many developed countries across the same period and thus trends in Australia may just be part of a broader trend – and/or in part an artifact of the index used to measure fertility. It also draws attention to the collateral effect of an increased dependency ratio, with the mini ‘boom’ reaching school age at the very moment the post war baby boomers reach retirement age – as forewarned by Costello in 2002 when initially rejecting the idea of a Baby Bonus.
* Population Studies Centre, University of Waikato. Email: [email protected] **School of Sociology and Social Work, University of Tasmania

130 Jackson and Casey
Introduction
Over the last 30-40 years fertility rates have fallen in all advanced industrial societies and none of them has had success at a major turnaround. Boosting fertility rates actually reduces the proportion of the population of working age at least for a generation. It increases the dependant to worker ratio with a higher number of children. It has a negative effect for around 30 years before you get the pay off. Boosting fertility rates may [also] well reduce [female] participation rates. Australian Federal Treasurer Peter Costello, Luncheon address to Australian Financial Review Leaders, Sydney following the 2002-03 Budget.
You should have one for the father, one for the mother and one for the country. If you want to fix the ageing demographic, that's what you do. Federal Treasurer Peter Costello, televised comments following the 2004 Federal Budget’s announcement of the maternity allowance.
n May 2004, acknowledging concerns about population ageing and the inability of immigration to dramatically reduce it, the Australian Government introduced the now widely known ‘Baby Bonus’
(maternity payment). At its Budget night launch, the then Treasurer Peter Costello urged Australians of reproductive age to have “one for the father, one for the mother, and one for the country” (Costello 2004). Such an explicit exhortation to do one’s patriotic duty by having children had not been seen in Australia for a century (McKinnon 2000; Rottier 2005); indeed it was in complete opposition to Australia’s long cherished resistance to anything resembling governmental intervention in the bedrooms of the nation (Cocks 1998; Caldwell, Caldwell and McDonald 2002: 11; Australian Government 2004: 19a).
Since major policy shifts are important to record, this note outlines the journey, beginning with the Government’s development in 1999 of The National Strategy for an Ageing Australia (Department of Aged Care 1999a-c; Department of Health and Aged Care 2002). We also refer to the handful of background papers and statements by a small number of academics, policy advisors and government agencies which can be identified as instrumental in guiding and consolidating government interest in the issue of population ageing over the 1990s and early 2000s.1 We acknowledge that the reference here to an ‘abrupt shift’ is located in a much broader historical context, one that involves important political and theoretical nuances (Heard 2006), but
I

Procreate and Cherish 131
we argue that the Australian Government’s dramatic ‘about face’ appears to have involved a re-evaluation of the view that low fertility itself was a factor previously constraining the hand of government.2 In other words, we argue that the Howard Government perceived the ‘threat’ of structural ageing as greater than the risk of losing voters – and sold it to the public by marketing it in a friendly, jocular manner.
The National Strategy for an Ageing Australia was first released in 1999 as a series of three discussion papers by the then-Minister Bronwyn Bishop, under the carriage of the Commonwealth Department of Aged Care.3 The final version was released in February 2002 under the carriage of the Department’s new Minister Kevin Andrews.4 Of significant import is that in neither case was the focus on low fertility or the possible related needs of families and women, but rather, on the impact of population ageing on the labour force, Australia’s retirement system, and the ageing process of individuals, writ large. Indeed, in the final strategy there are only two brief mentions of the word ‘fertility’ (pages 5 and 16), while acknowledgement of the distinction between structural and numerical ageing which had appeared in the initial discussion papers (e.g. Department of Aged Care 1999a: 51) is missing. Instead, in the forward to the final report, Minister Kevin Andrews states: “As the Minister for Ageing, I intend to celebrate the contribution of older Australians, while also recognising that older people deserve to be supported across all areas of their lives” (Department of Health and Aged Care 2002: vii). His sentiments are echoed in the accompanying statement by the Prime Minister and the Executive Summary, both of which concentrate on the health, ageing, workforce and retirement issues of ‘senior Australians’.
The invisibility of the role of low fertility in driving structural population ageing and indeed of any clear distinction between structural and numerical ageing in the final release of the National Strategy is of import to this story. Population ageing was popularly perceived of as a growing increase in the numbers of elderly, and the document would have done little to alter this perception. At the same time, in the lead-up to the 2001 election, the issue of balancing work and family life had become a key platform of the Coalition party’s election strategy, yet most pronouncements show that at this stage interest in the family was ostensibly unrelated to population ageing. Faced with a number of significant challenges relating to (among other things) its handling of the ‘Tampa crisis’, when a foreign ship

132 Jackson and Casey
carrying asylum seekers whose boat had sunk was refused entry to Australian waters, the Coalition focussed its election campaign on the combined need for ‘stronger families and stronger communities’ and ‘border protection’ (Rottier 2005: 143). The manner in which these two platforms came together has been argued by several to have ideological and racist undertones, but that is tangential to the present issue.5
At the centre of the Coalition’s 2001 Stronger families, Stronger communities election campaign was the ‘First Child Tax Refund’, an incentive that would enable first time mothers to claim back some of the tax paid on their income earned in the year prior to the birth of their child.6 The refund would be available on an annual basis across a five year period, provided that the woman did not re-enter the workforce during the time the bonus was claimed. That is, to get the full benefit of the tax refund, a woman needed to have been working and then stay out of the workplace entirely for five years.
The Coalition retained government in November 2001, and the incentive (by then widely dubbed a ‘Baby Bonus’) was formally implemented at the 2002-03 Budget, presented in May 2002. At this budget, a special annexure, the first Intergenerational Report (IGR) was also unveiled (Australian Government 2002). This pivotal report outlined the economic implications of projected demographic change until 2042, and has since been taken to represent the Australian Government’s first major acknowledgement of population ageing as a phenomenon requiring long-term and strategic governmental management.
Among topics singled out for attention in the 2002-03 Budget and its complementary IGR was Australia’s declining birth rate. As Figure 1 shows, this focus was not without reason - by 2002, Australia’s TFR had been below the generational replacement rate of 2.1 births per woman for 26 years – a full generation, and was thus unlikely to be simply an artefact of the way total fertility is measured.7 With substantially lower fertility rates in evidence across most of Australia’s counterpart countries, and a broad literature drawing attention to their societal implications, the Australian Government made its first overt move to prevent further decline with the introduction of the First Child Tax Refund.
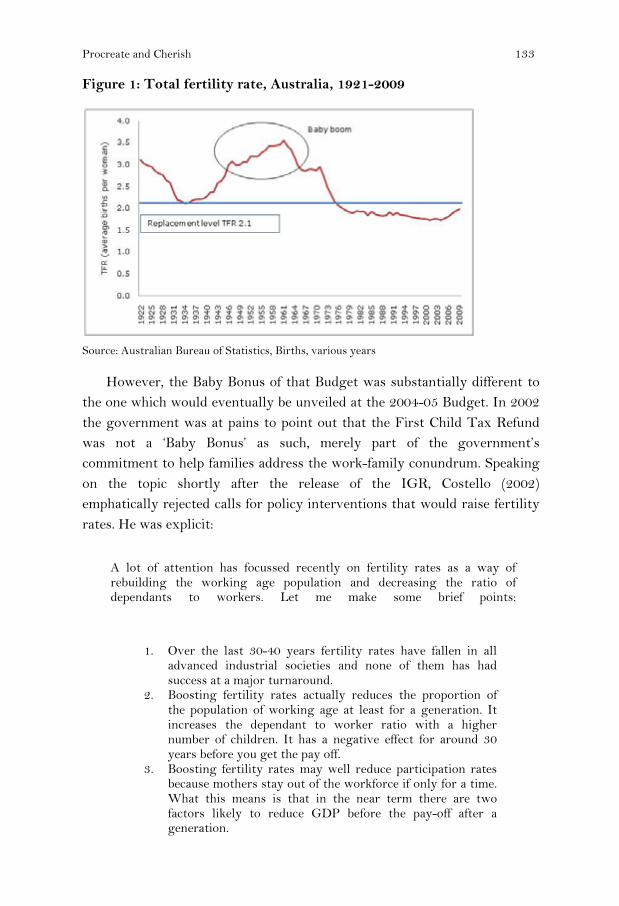
Procreate and Cherish 133
Figure 1: Total fertility rate, Australia, 1921-2009
Source: Australian Bureau of Statistics, Births, various years However, the Baby Bonus of that Budget was substantially different to the one which would eventually be unveiled at the 2004-05 Budget. In 2002 the government was at pains to point out that the First Child Tax Refund was not a ‘Baby Bonus’ as such, merely part of the government’s commitment to help families address the work-family conundrum. Speaking on the topic shortly after the release of the IGR, Costello (2002) emphatically rejected calls for policy interventions that would raise fertility rates. He was explicit:
A lot of attention has focussed recently on fertility rates as a way of rebuilding the working age population and decreasing the ratio of dependants to workers. Let me make some brief points:
1. Over the last 30-40 years fertility rates have fallen in all advanced industrial societies and none of them has had success at a major turnaround.
2. Boosting fertility rates actually reduces the proportion of the population of working age at least for a generation. It increases the dependant to worker ratio with a higher number of children. It has a negative effect for around 30 years before you get the pay off.
3. Boosting fertility rates may well reduce participation rates because mothers stay out of the workforce if only for a time. What this means is that in the near term there are two factors likely to reduce GDP before the pay-off after a generation.
134 Jackson and Casey
4. If boosting the fertility rate is done by additional expenditures, it could have a negative effect if it required higher tax rates, or crowded out better alternative uses of public expenditures.
Whilst the IGR has kicked off a great deal of interest in fertility rates, with maternity leave, divorce rates, abortion law changes, tax incentives to opt out of no-fault divorce all being raised, I would like to focus the debate on something that might actually have an achievable and practical effect. A positive development would be to encourage greater workforce participation by Australians in the 55-65 year old age bracket.
Costello also cited increased skilled immigration and increased productivity as other key solutions to ‘the problem’ of population ageing, but continually returned to the role of increased participation by older workers, which he stressed can be more readily influenced by governments and private sector employers than fertility rates:
Higher participation among the over 55s will have a much more immediate and direct impact than rising fertility rates. More flexible working arrangements, training and re-training, and raising the preservation age for superannuation would all be positive moves to address this issue.
So there is little doubt that at this stage, tweaking fertility was being eschewed in favour of other solutions. As 2002 unfolded, the government continued to reject arguments that the First Child Tax Refund was a policy aimed at raising fertility, although there were occasions when John Howard himself referred to it as a Baby Bonus:
I mean, we brought in a Baby Bonus which recognises that there's a huge loss of income when you have your first child and the Baby Bonus is designed to assist women who drop out of the workforce to have a child in that period when they lose that income. (Howard 2002)
The issue was seldom out of the media, as the policy was soon shown to be not only regressive in its effects, which gave greater returns to women who had been on higher incomes, but it also reinforced the model of the male breadwinner, in keeping mothers out of the workforce.
The issue of paid maternity leave for working women was similarly seldom out of the media during 2002. In April 2002 the Sex Discrimination

Procreate and Cherish 135
Commissioner Pru Goward released a discussion paper outlining several options and inviting submissions. In July, when referring to the battle many people have in balancing work and family responsibilities, the then Prime Minister John Howard made his now-famous ‘barbecue stopper’ comment. The issue, he said, is “the biggest ongoing social debate of our time…a barbeque stopper” (Howard 2002). Although he was referring to the balancing act itself being ”an issue of such importance that mention of it could halt the fun of a barbecue” (The Australian National Dictionary Centre), the comment was widely taken to refer to the possible introduction of paid maternity leave. The likely positive impact of such a move on Australia’s declining birth rate was also widely commented upon in the media, and was never outrightly ‘disowned’ by either Costello or Howard. Nevertheless, as history shows, the option [of paid maternity leave] was eventually soundly rejected by the government as imposing impossible costs on many businesses. There was no mention of the issue in the 2002-03 budget, and it quietly slipped from centre stage.
But not so the issue of low fertility and its relationship with population ageing. Throughout the remainder of 2002 and into 2003, both media commentary on, and academic engagement with, the topic grew. Several media articles criticised the government’s stance in failing to develop a fertility-oriented population policy as short-sighted, directly urging the Treasurer to be more proactive in reversing low fertility (e.g. Kelly 2002: 13). Others reported the opinions of many of Australia’s demographers, whose growing number of publications and pronouncements on the topic pointed out the economic and social implications of structural ageing, and the implications of delaying interventions that might arrest fertility decline and reduce the speed of future ageing. Demographic journals drew attention to the substantive and theoretical correlates of low fertility, which notably were both manifold and seemingly universal (across developed countries), indicating that local policy initiatives may do little to alter the trend. Editorials reiterated the main points8 letters to the Editor weighed in with both support for and - in some cases strong - resistance to the idea of supporting the nation’s families to have children. Surveys canvassed opinion on the desire for and the acceptance of children.9 The then Federal Treasurer of the Liberal party and chair of the Menzies Research Centre, Malcolm Turnbull, raged that the crisis was not population ageing, but low fertility per se, brought upon by the failing institution of marriage.10 Women

136 Jackson and Casey
were continually reminded of the dangers of ‘leaving it too late’.11 There was seldom a week in which the issue did not appear in the media.
Behind the scenes the government also directly sought the advice of leading economic sociologists like Britain’s Katherine Hakim. In February 2003 Hakim presented to the Department of Family and Community Services (2003: 22-23). Her tri-typology of women’s preferences as either home-centered, work-centred, or adaptive [to either of the other two positions, depending on the incentives] was later echoed in a number of statements by the Prime Minister and Treasurer. Importantly, Hakim pointed out that while these preferences should be accounted for in the development of any family and social policy, the best way of doing that was to develop policies that were ‘neutral’ and would appeal to all categories [of women], or be balanced to ensure that all categories would benefit in some way. At the same time the underlying message was that if the government could tweak the right buttons, at least some of Australia’s adaptive women (estimated to be as high as 90 percent)12 would plausibly respond with a baby, and presumably many of the home-centred women would do so as well.
Another key contributor to the debate during this period was leading Australian demographer Peter McDonald, whose work on low fertility has long pointed out the need for appropriate policy responses, and for those policies to be carefully coordinated. In a visionary paper published in 2003 he challenged the government over its failure to make the substantial reforms implicitly promised in the Prime Minister’s ‘barbeque stopper’ comment, and carefully laid out both the principles of the needed reforms, and a proposal as to where the money to pay for them would come from (McDonald 2003a). In short he argued against the government’s present ‘bolt on’ approach of constantly adding policies that have additional cost implications, proposing instead that the current ‘mish-mash’ of familial payments be scrapped and the money redirected at a broad agenda that centred around the age of a child and included measures such universal early childhood education.
Despite this advice and activity in general there was only minor mention of fertility and the family in the 2003-04 Budget (delivered on May 13th 2003), its focus instead being tax cuts and the returning of the federal budget to surplus. Rottier (2005: 134-5) argues that this ‘oversight’ was possibly related to 2003 being a non-election year: her doctoral research

Procreate and Cherish 137
identified that in election years the federal budget is far more likely to contain a family angle than in non-election years.
Be that as it may it is now widely acknowledged that across 2002 and 2003 the Prime Minister’s Department had its own ‘work and family’ task force engaging with the aforementioned literature and arguments, and considering alternatives to the ill-fated First Child Tax Refund/Baby Bonus.13 According to Summers (2004), among options that the task force investigated was a universal (non means-tested) Baby Bonus of between $3,000 and $5,000 on the birth of a child, a recommendation apparently adopted by cabinet at a meeting in late 2003 and foreshadowed by the Prime Minister some months earlier at the Liberal Party’s National Convention in Adelaide.
With deliberations over the possibility of a full-fledged Coalition Baby Bonus raging in the media throughout the remainder of 2003 and into the beginning of 2004, an election year, the then Labour Leader, Mark Latham, endeavoured to gazump the Prime Minister by announcing a non-means tested baby care payment of $3,000 spread across the first 14 weeks of a new baby’s life. From that point on the government also began to herald that its Baby Bonus (officially a Maternity Payment) would be implemented at the 2004-05 Budget. Importantly this option would also resolve most of the government’s previous problems with the now-rejected paid maternity leave option, the idea of which had proven so unpopular with the business sector. In both directions the Baby Bonus was a vote-catcher.
In February 2004 the government released another key document related to population ageing titled Australia’s Demographic Challenges (Australian Government 2004a). By contrast with the Intergenerational Report, this document had much to say about Australia’s low fertility rate. However, its policy focus, like that of the IGR, remained on improving productivity and labour force participation as the key priorities in addressing population ageing: the three ‘choices’ presented at the end of the document were to raise taxes, reduce government expenditure, or increase the country’s debt; not to increase fertility. Indeed the document’s conclusions specifically re-stated Australia’s long-held position, that “the decision to have children is certainly an individual one. It is not (and should never be) the role of governments to tell citizens how many children they should have” (Australian Government 2004a: 19).

138 Jackson and Casey
Nevertheless, just a few months later the Australian government did exactly that: it specifically and unambiguously prescribed a desired family size of three. Perhaps what most surprised the populace was the nation’s leaders mischievously engaging in sexualized banter and responding to headlines such as ‘the erection budget’ (Howard 2004). Not only did the Treasurer take great delight in extending his call to duty to hundreds of assembled media to “go home and perform your patriotic duty tonight” (Costello 2004), but the following day the Prime Minister echoed it with “Come on, come on, your country needs you” (Farouque 2004) 14
From the 1st of June 2004 the Maternity Payment (the ‘new’ Baby Bonus) replaced its predecessor, the First Child Tax Refund, and provided a $3,000 grant for each new child, irrespective of the parity of the child or income of the parent/s, rising to $4,000 in 2006-07 and $5,000 in 2008-09.15
Over the following three years to mid 2007, the call to procreate was regularly repeated by government officials and the media, and the policy was ultimately referred to by then Treasurer Costello as Australia’s shift from ‘populate or perish’ to ‘procreate and cherish’ (Costello 2006a, 2006b). Concerned that the message was perhaps being heeded a little too well by some teenagers, the only significant change to its original features under the Howard Government came in January 2007 in the form of a shift from the lump sum payment to a fortnightly payment, for mothers under the age of 18 (Commonwealth of Australia 2006).
Despite having previously disagreed with various elements of the policy, the incoming Rudd Labour Government (November 2007) vowed to continue it. By March 2008, Prime Minister Kevin Rudd stated that the policy appeared to be having an impact in terms of “slightly nudging up the birth rate” and so it would be “safe”’ under Labour.16 However, facing increasing calls from analysts that the cost of each ‘true’ extra birth was enormous and that there must be more efficient ways of delivering family payments (Guest 2007; see also Drago et al. 2009), the Rudd Government moved in its 2008 Budget to make it a means-tested payment from January 1st 2009, along with moving all payments to a fortnightly basis.17
Aside from these minor changes, and continuing occasional comments by one or other government spokesperson that the Baby Bonus is not, strictly speaking, a pro-natal policy, there can be little argument that the intervention was, and remains, an explicit policy aimed at raising the birth rate. First, it is formalised as a pro-natal policy in the Government’s own
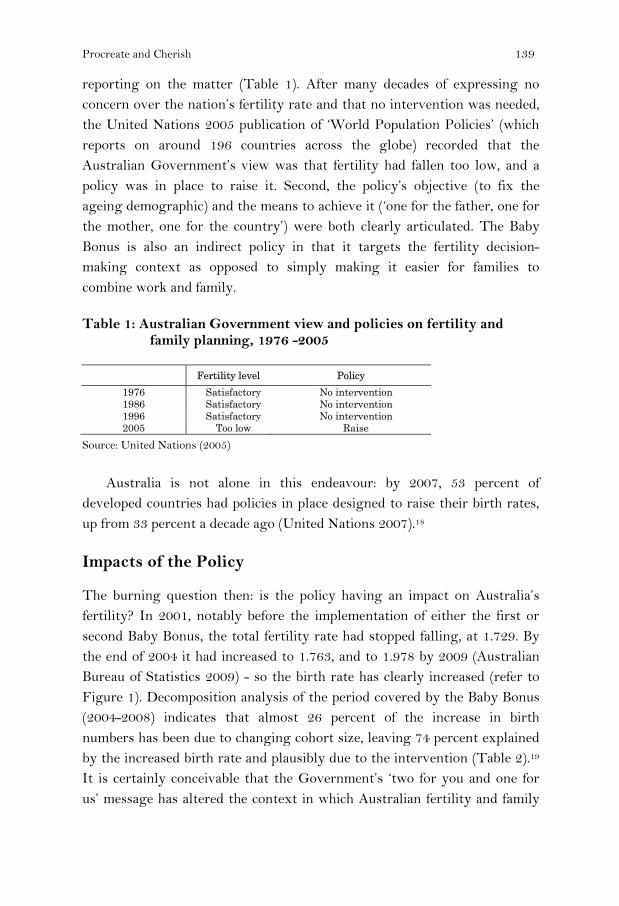
Procreate and Cherish 139
reporting on the matter (Table 1). After many decades of expressing no concern over the nation’s fertility rate and that no intervention was needed, the United Nations 2005 publication of ‘World Population Policies’ (which reports on around 196 countries across the globe) recorded that the Australian Government’s view was that fertility had fallen too low, and a policy was in place to raise it. Second, the policy’s objective (to fix the ageing demographic) and the means to achieve it (‘one for the father, one for the mother, one for the country’) were both clearly articulated. The Baby Bonus is also an indirect policy in that it targets the fertility decision-making context as opposed to simply making it easier for families to combine work and family.
Table 1: Australian Government view and policies on fertility and family planning, 1976 -2005
Fertility level Policy 1976 Satisfactory No intervention 1986 Satisfactory No intervention 1996 Satisfactory No intervention 2005 Too low Raise
Source: United Nations (2005)
Australia is not alone in this endeavour: by 2007, 53 percent of developed countries had policies in place designed to raise their birth rates, up from 33 percent a decade ago (United Nations 2007).18
Impacts of the Policy
The burning question then: is the policy having an impact on Australia’s fertility? In 2001, notably before the implementation of either the first or second Baby Bonus, the total fertility rate had stopped falling, at 1.729. By the end of 2004 it had increased to 1.763, and to 1.978 by 2009 (Australian Bureau of Statistics 2009) - so the birth rate has clearly increased (refer to Figure 1). Decomposition analysis of the period covered by the Baby Bonus (2004-2008) indicates that almost 26 percent of the increase in birth numbers has been due to changing cohort size, leaving 74 percent explained by the increased birth rate and plausibly due to the intervention (Table 2).19 It is certainly conceivable that the Government’s ‘two for you and one for us’ message has altered the context in which Australian fertility and family

140 Jackson and Casey
formation decisions are being made, as per demography’s major theoretical explanations.20
Table 2: Birth numbers and components of change due to cohort size and birth rate, 2004 and 2008
Births Component due to cohort size
Component due to birth rate
Age 2004 2008 Difference 2004-08 N % N %
15 362 434 72 16 22.2 56 77.8 16 881 1030 149 50 33.6 99 66.4 17 1949 2081 132 133 100.8 0 -0.8 18 3174 3493 319 174 54.5 145 45.5 19 4514 5283 769 188 24.4 581 75.6 20 5363 6190 827 248 30.0 579 70.0 21 6342 7207 865 295 34.1 570 65.9 22 7133 8639 1506 620 41.2 886 58.8 23 8291 9498 1207 977 80.9 230 19.1 24 9054 11163 2109 1358 64.4 751 35.6 25 10693 12652 1959 1712 87.4 247 12.6 26 12212 14537 2325 1689 72.6 636 27.4 27 13687 15898 2211 1538 69.6 673 30.4 28 15315 17363 2048 1183 57.8 865 42.2 29 17009 18624 1615 626 38.8 989 61.2 30 17813 19051 1238 -132 -10.7 1370 110.7 31 18567 19877 1310 -735 -56.1 2045 156.1 32 18639 19459 820 -1441 -175.7 2261 275.7 33 17468 18507 1039 -1355 -130.4 2394 230.4 34 15024 17302 2278 91 4.0 2187 96.0 35 12986 16397 3411 601 17.6 2810 82.4 36 10281 14106 3825 1303 34.1 2522 65.9 37 7961 11354 3393 1236 36.4 2157 63.6 38 6256 8670 2414 500 20.7 1914 79.3 39 4695 6505 1810 231 12.8 1579 87.2 40 3406 4460 1054 -65 -6.2 1119 106.2 41 2133 2976 843 -99 -11.7 942 111.7 42 1441 1809 368 -54 -14.7 422 114.7 43 831 1008 177 -21 -11.9 198 111.9 44 399 521 122 12 9.8 110 90.2 45 196 240 44 12 27.3 32 72.7 46 89 127 38 7 18.4 31 81.6 47 29 47 18 3 16.7 15 83.3 48 14 46 32 1 3.1 31 96.9 49 42 60 18 3 16.7 15 83.3
Total 254,247 296,615 42368 10,905 25.7 31,463 74.3
Source: Calculated from Australian Bureau of Statistics (2009) Births, Australia 2008, cat no 33010DO010_2008 and ERP by age and sex.
Note: Component due to cohort size is calculated by applying age-specific fertility rates for 2004 to population numbers for 2008(=expected births at 2004 rates) and subtracting the result from observed births. Component due to birth rate = the balance (observed minus expected).

Procreate and Cherish 141
Rational and risk-averse actors alike may be engaging with the perception that more support for the family is on offer; post-materialists may be broadening their options to include a/nother child, and those who have been struggling with gender inequities between the workplace and the domestic world may be finding that these have decreased. Hakim’s ‘adaptive’ and ‘home centred’ mothers may have responded to the call. However, fertility rates have also recently risen in many other countries, notably Europe (Myrskyla, Kohler and Billari 2009), generating enthusiastic claims that the era of low-low fertility is over.
On the one hand, this increase could reflect the shift to a pro-natal policy environment in those countries, but, on the other, it could mean that the changes in Australia may simply be part of a broader movement, having very little to do with the Baby Bonus per se. At this point in time we must simply watch and wait. Certainly there is no room for complacency, with some analysts cautioning that the ‘reversal of low fertility’ may be simply an artifactual tempo effect, caused by a return to slightly earlier childbearing and/or to the end of delayed and recuperated childbearing. There has been no reversal in any of the major substantive correlates of low fertility, such as increased levels of female tertiary education and labour force participation – which are still increasing.
Finally, it is worth reflecting on Peter Costello’s original concerns back at the 2002-2003 Budget when he argued that “boosting fertility rates actually … increases the dependant to worker ratio with a higher number of children. It has a negative effect for around 30 years before you get the pay off”. Australia’s 2009 age structure clearly shows this impact (Figure 2), with a small skirt at ages 0-4 years, and it must be remembered that these young people will be arriving at school and working their way through the school system at exactly the same point as the baby boomers begin to retire en masse, from 2012. It is to be hoped that the enthusiasm which surround their collective birth will continue to support them as they grow up.

142 Jackson and Casey
Figure 2: Australian population age/sex structure, 2009
Source: Australian Bureau of Statistics Cat no 3201.0
Summary and Conclusion
Despite wholeheartedly rejecting the idea of a full-fledged Baby Bonus at the 2002-03 Budget, the then Howard Government implemented exactly that just two years later, at the 2004-05 Budget. The shift to an explicit but indirect pro-natal policy not only represents an abrupt disjuncture with the past, but appears to have been based on genuine concerns by the Government about structural population ageing, undoubtedly driven by the slowly dawning reality of the economic implications of the phenomenon. Its continuation by the Rudd Government adds to its substance. However this is not the same as saying that the Baby Bonus is in any way the integrated and astute reforms espoused by McDonald in 2003a (see his comments in McDonald 2005 and 2006) – it remains an ad hoc policy with many contradictions in other non-aligned policies, which together render any fertility-raising impacts vulnerable.
Australia’s fertility rate has (at this point) stopped falling, and has risen significantly, allowing the previous Howard Government - and more guardedly the present Rudd Government - to attribute at least some of the rise to the Baby Bonus. However, fertility was actually rising sometime
Procreate and Cherish 143
before the policy was implemented, and moreover is also presently rising across many European countries. This could mean that Australia is part of a broader movement, and may have nothing at all to do with the Baby Bonus. But it may also simply reflect the way fertility is measured, via an index which cannot account for – among other factors - changes in the timing of childbirth.21 Changing cohort size and the possibility of echo effects, for example as large cohorts reach their peak reproductive years, can be more readily accounted for, and in Australia’s case are certainly making a contribution – accounting for one quarter of the increase in births since 2004. Perhaps less well understood is the likely impact on total birth numbers as these larger cohorts are replaced by smaller ones, even if the birth rate per woman remains high.
Lastly, Peter Costello’s original concerns that boosting fertility rates increases the dependency ratio, should not be overlooked. While the Government gaze around the developed world is firmly fixed on current birth rates, the births of the 1940s and ‘50s are quietly approaching retirement; if it has been successful, it was perhaps not the best time of times to introduce a pro-natal policy.
Notes
1 Among these are: House of Representatives (1992); Clare 1994; Borowski and Hugo 1996; Young (1999); Jackson (1999, 2001); Barnes (2001); Australian Bureau of Statistics (2001), and the work of Peter McDonald, Rebecca Kippen, Graeme Hugo, Donald Rowland, and Robert Birrell passim.
2 Australia’s official submission to the 1994 Cairo conference on population and development, stated that ‘Australia does not have an explicit or formal population policy directly aimed at influencing the level of the population … the government decided that a formal population policy (particularly one which would specify population targets) would not be appropriate for Australia, given its low levels of fertility and diversity of community views as to the character and objectives of such a policy.’ (National Committee 1994 cited in Cocks 1998: 23).
3 Notably another significant report was prepared for the government while Bishop was Minister for Aged Care. This report by Access Economics (2001) details the spending patterns of older Australians and concludes that population ageing would deliver as many positives and opportunities as negatives. The report does not contain the term ‘fertility’ but uses the term ‘birth rate’ on five occasions. Four of these occur together (pp. 34-35) in the context of an argument that increasing the birth rate would not begin to have a useful impact for at least 16 years (when the additional births would translate into additional labour supply).

144 Jackson and Casey
4 Now known as the Department of Health and Aged Care
5 The issue of ‘strengthening families’ and low fertility soon became linked in government discourse. Among others, Rottier (2005: 144-5 and Chapter 9) draws attention to the implicit racism in the combination, which on the one hand rejects would-be migrants from Asian countries, and on the other, calls on Australian families to ‘grow their own’. See also Manne (2001: 21) on a similar argument for Scandinavia.
6 The policy contained elitist elements, in that a minimum annual refund was set at $500, and a maximum at $2,500, being 20 percent of the tax paid on an annual salary of $52,666. Higher income mothers thus received a substantially greater bonus.
7 The Total Fertility Rate (TFR) is a synthetic measure which uses the sum of current age-specific birth rates in any year as a proxy for the number of children a woman aged 15-49 in that year will have across her life time. It is greatly affected by changes in the age at childbearing. If a large proportion of women delay having children, the TFR will be depressed; if childbearing is bought forward, the TFR will rise.
8 For example, ‘Maternity leave debate hots up’, The Sydney Morning Herald 18/7/02, p.10; ‘It still takes two, baby’, The Age 8/1/03, p10; ‘Birthrate not just an issue of motherhood’, The Australian 8/1/03, p 10.
9 The 2003 Australian Survey of Social Attitudes (AuSSA) run by the ACSPRI Centre for Social Research sampled 4,270 people aged 18 years and over. Among the questions was the statement ‘a life without children is not fully complete’ (agree/disagree).
10 ‘The crisis is fertility, not ageing’, The Age, 16/7/02, p.11. ‘Turnbull is now a government MP with much to say about Australia’s fertility, including that low fertility countries ‘are not ageing, they are dying’ (Totaro 2005).
11 Later, in 2005, McDonald argued that the ‘debate we have been having about waiting too long when you want to have children has had an effect [on the fertility rate]’ (see Legge 2005: 19 and Marriner and Totaro 2005; also McDonald 2005: 5).
12 Data from the HILDA (Household, Income and Labour Dynamics in Australia) and Women’s Health Australia presented at the Australian Institute of Family Studies (AIFS) conference (Department of Family and Community Services 2003: 23).
13 An interesting comparison with the eventual policy is Peter McDonald’s (2003a) proposal for a flat $6,500 payment to families with babies and toddlers, reducing to $2,500 per year plus 20 hours per week free childcare/education for children aged 3 to 4 years. McDonald’s proposal also included related budget costings, and called on the government to scrap its multitude of family tax and welfare benefits and to divert the funds as suggested, arguing that it would cost no more than the government was already paying.
14 It takes little effort to locate the antecedents of these exhortations. In the 1940s Winston Churchill similarly called on Britons to have four children: ‘one for mother, one for father, one for accidents and one for increase’ (Legge 2005: 19). More recently the Swedish government had Bjorn Borg urge his fellow Swedes

Procreate and Cherish 145
to ‘fuck for the future’ (Ananova 2001; Manne 2001: 6). In 1995 the Turkish Prime Minister argued for at least four children, and his successor reiterated his words, claiming ‘Allah wants it’. (Longman 2004: 9).
15 The intervention was accompanied by an increase in all levels of Family Tax Benefit (an intervention from 2000 associated with the introduction of the GST), bringing the base payment up to $1,695 per year inclusive of a new, immediate lump-sum payment of $600, and other elements of the package such as an additional 30,000 outside-school-hours childcare places and 1,500 family day care places (O’Neill 2004: 9 in Rottier 2005: 150).
16 ‘Baby Bonus will stay: Rudd’. Radio interview with Fairfax Radio, March 14th 2008 http://www.abc.net.au/news/stories/2008/03/14/2189859.htm
17 Interview of Jenny Macklin by Hilary Harper (31/12/2008) ‘Baby Bonus- Transcript’ http://www.jennymacklin.fahcsia.gov.au/internet/jennymacklin.nsf/content/baby_bonus_02jan09.htm; http://www.smh.com.au/news/national/rudd-to-end-baby-bonus-for-rich/2008/05/02/1209235155734.html
18 In some cases, non fertility oriented policies can also have this effect – see Callister and Galtry 2009 for a comparison of New Zealand’s Parental Leave policy with Australia’s Baby Bonus.
19 Certainly, in July 2004, as many as 1,000 births were due to an ‘introduction effect’, and a smaller number at each subsequent anniversary coinciding with the payment increase – see Gans and Leigh 2008.
20 See McDonald 2000 for elaboration of these theoretical explanations for low fertility. Another is the ‘low fertility trap’ proposed by Wolfgang Lutz, which generally holds that people who have grown up in an era of low fertility will not seek to have large families themselves.
21 A decline in age at childbearing typically increases the total fertility rate (because it brings births forward); an increase (in childbearing age) decreases it
References
Access Economics. (2001). Population ageing and the economy, Report prepared for Commonwealth Department of Health and Aged Care. http://www.health.gov.au/internet/wcms/publishing.nsf/content/ageing-ofoa-research-accessecon.htm/$file/popageing.pdf
Ananova. (2001). Bjorn Borg wants Europe to have more sex. http://www.ananova.com/news/story/sm_234591.html
Australian Bureau of Statistics. (2001) Ageing in Australia. Catalogue No. 2048. _________________________ (2009) Births, Australia. Catalogue No. 3301.0. Australian Government. (2002). Intergenerational report 2002-03, Budget Paper No.
5. Canberra, Department of the Treasury. http://www.dfat.gov.au/budget/2002-03/bp5/html/01_BP5Prelim.html
146 Jackson and Casey
___________________ (2004a). Australia’s demographic challenges. Canberra, Commonwealth of Australia. http://demographics.treasury.gov.au/content/discussion.asp?NavID=6
___________________ (2004b). Budget 2004-05. Canberra, Commonwealth of Australia. http://www.budget.gov.au/2004-05/
Barnes, A. (2001). Occasional Paper No. 2. Low fertility: A discussion paper. Canberra, Department of Family and Community Services.
Borowski, A. & Hugo, G. (1996). Demographic trends and policy implications. In A. Borowski, S. Encel & E. Ozanne (eds) Ageing and social policy in Australia. Melbourne, Cambridge University Press.
Caldwell, J., Caldwell, P. & McDonald, P. (2002). Policy response to low fertility and its consequences: a global survey. Journal of Population Research 19 (1): 9-24.
Callister, P. & Galtry, J. (2009). ‘Baby Bonus’ or paid parental leave – which one is better? Social Policy Journal of New Zealand, 34: 1-11.
Clare, R. (1994). Australia's Ageing Society, Canberra, Australian Government Publishing Service.
Cocks, D. (1998). People policy: Australia's population choices. Sydney, University of New South Wales Press.
Commonwealth of Australia. (12/11/2006). ‘Changes to Baby Bonus for under 18 year olds’ www.facs.gov.au/internet/Minister3.nsf/content/baby_bonus_12nov06.htm.
Costello, P. (2002). Address to the Australian Financial Review Leaders’ Luncheon, The paths to increasing Australia’s prosperity, http://www.treasurer.gov.au/tsr/content/speeches/2002/004.asp
_________ (2004). Transcript of the Treasurer The Honourable Peter Costello MP, Budget lock-up press conference, Parliament House, 11th May, http://www.treasurer.gov.au/tsr/content/transcripts/2004/047.asp
_________ (2006). Transcript of the Treasurer The Honourable Peter Costello MP, Interview with Ross Stevenson and John Barnes, 3AW, 24th July, http://www.treasurer.gov.au/tsr/content/transcripts/2006/109.asp
Department of Aged Care. (1999a). National strategy for an ageing Australia: Independence and self provision. Canberra, Commonwealth of Australia..
_______________________ (1999b). National strategy for an ageing Australia: Employment for mature age workers. Canberra, Commonwealth of Australia.
_______________________ (1999c). National strategy for an ageing Australia: Healthy ageing. Canberra, Commonwealth of Australia.
Department of Family and Community Services. (2003). FaCS Research News, 16. Department of Health and Aged Care. (2001). National strategy for an ageing
Australia. An older Australia, challenges and opportunities for all. Canberra, Commonwealth of Australia.
Department of Family and Community Services. (2003). FaCS Research News, Issue 16.
Drago, R., Sawyer, K., Sheffler, K., Warren, D. & Wooden, M. (2009). Did Australia’s baby bonus increase the fertility rate? Melbourne Institute Working

Procreate and Cherish 147
Paper Series, Working Paper 1/09, Melbourne Institute of Applied Economic and Social Research.
Faroque, F. (2004, May 15). So, will you do it for your country? The Age. Gans, J. & Leigh, A. (2008). Born on the first of July: An (un)natural experiment in
birth timing. Journal of Public Economics, 93: 246-283. Guest, R. (2007). The baby bonus: A dubious policy initiative. Policy, 23 (1): 11-16. Heard, G. (2006). Pronatalism under Howard. People and Place, 14 (3): 12-24. House of Representatives. (1992) Expectations of life: increasing the options for the 21st
Century. Canberra, House of Representatives Standing Committee for Long Term Strategies.
_____________________ (2005). Future ageing: Report on a draft report of the 40th Parliament: Inquiry into long-term strategies to address the ageing of the Australian population over the next 40 years. Canberra, Standing Committee on Health and Ageing, 41st Parliament.
Howard, J. (2002). Transcript of the Prime Minister The Honourable John Howard MP, Radio Interview with John McNamara, Radio 6Wf, 18th July. http://www.pm.gov.au/News/interviews/2002/interview1753.htm
_________ (2004). Transcript of the Prime Minister The Honourable John Howard MP, Interview with Ray Martin, A Current Affair, Channel 9, 12th May. http://www.pm.gov.au/News/interviews/Interview864.html
Hugo, G. (1984). Ageing of the Australian population: changing distribution and characteristics of the aged population. South Australia, National Institute of Labour Studies Working Paper Series, Flinders University of South Australia.
Jackson, N. (1999). Understanding population ageing. A background. Australian Social Policy 1: 203-224.
__________ (2001). The policy-makers guide to population ageing. key concepts and issues, Policy Research Paper Number 13. Canberra, Department of Family and Community Services.
__________ (2006). When is a baby boom not a baby boom? Nine points of caution when interpreting fertility trends. People and Place, 14 (4): 11-13.
Kelly, P. (2002, September 4) It’s breeding obvious. The Australian. Kippen, R. (1999). A note on ageing, immigration and the birthrate. People and Place,
7(2): 18-22. Kippen, R. & McDonald, P. (2000). Australia's population in 2000: the way we were
and the ways we might have been. People and Place, 8(3): 10-17. Legge, K. (2005, April 9). Australians born lucky. The Weekend Australian. Longman, P. (2004) The empty cradle: how falling birthrates threaten world
prosperity and what to do about it. New York, Basic Books. Manne, A. (2001). Women’s preferences, fertility and family policy; the case for
diversity. People and Place, 9 (4): 6-25. Marriner, C. & Totaro, P. (2005, April 12). Making the family cool again. Sydney
Morning Herald. Retrieved from http://www.smh.com.au/news/National/Making-the-family-cool-again/2005/04/11/1113071914272.html
148 Jackson and Casey
McDonald, P. (1997). Gender equity, social institutions and the future of fertility. Research School of Social Sciences Working Papers in Demography No 69, The Australian National University.
____________ (2000). Low fertility in Australia: evidence, causes and policy responses. People and Place, 8(2): 6-20.
____________ (2002). Sustaining fertility through public policy: the range of options. Population, 57(3): 417-446.
____________ (2003a). Reforming family support policy in Australia. People and Place, 11(2): 1-15.
____________ (2003b). Australia’s future population: population policy in a low-fertility society. In S-E Khoo & P. McDonald (Eds). The transformation of Australia’s population 1970-2030. Sydney, UNSW Press.
____________ (2005). Has the Australian fertility rate stopped falling? People and Place, 13(3): 1-5.
____________ (2006). The 2006-07 budget and family policy. People and Place, 14(2): 1-4.
McDonald, P. & Kippen, R. (1999a). The impact of immigration on the ageing of Australia’s population. Australian Government, Department of Immigration and Multicultural Affairs. Retrieved from http://www.immi.gov.au/media/statistics/population/ageing/_pdf/ageing.pdf
_______________________ (1999b). Population futures for Australia: the policy alternatives. Technical Report Research Paper 5, Demography and Sociology Program, RSSS, Australian National University. http://eprints.anu.edu.au/archive/00001279/
McKinnon, A. (2000). Bringing the unclothed immigrant into the world: population policies and gender in twentieth century Australia. Journal of Population Research 17 (2): 109-123.
Myrskyla, M., Kohler, H. & Billari, F. (2009). Advances in development reverse fertility declines. Nature, 460: 741-743.
Rottier, R. (2005). Talking up’ the birth rate: the typologising of women and their fertility. Unpublished PhD Thesis, University of Tasmania.
Rowland, D. (1991). Ageing in Australia, Melbourne, Longman Cheshire. Summers, A. (2004). Playing the game Howard’s way. Retrieved from
http://www.annesummers.com.au/smh040427.pdf#search=%22universal%20%245000%20maternity%20allowance%22
Totaro, P. (2005, April 9). Where have all the babies gone? Sydney Morning Herald, p. 27.
United Nations. (2007). World population policies. http://www.un.org/esa/population/publications/wpp2007/Publication_highlights.pdf
Young, C. (1999). Australia’s ageing population – policy options, Melbourne, House of Representatives Standing Committee for Long Term Strategies, Expectations for Life, Increasing the Options for the 21st Century, Canberra.

New Zealand Population Review, 35:149-160. Copyright © 2009 Population Association of New Zealand
Ethnicity in Recent Birth Registration Data
BILL BODDINGTON * ROBERT DIDHAM
Abstract There is an extensive and growing literature on ethnicity in New Zealand, that includes a focus on fertility and ethnicity. This paper looks at some of the dynamics in ethnic reporting in New Zealand’s birth registration data in order to better understand the relationship and dynamics between the ethnicity of parents and their children. By using questions which promote a common interpretation of ethnicity, a common world view, and point in time collection, the birth registration form provides a unique opportunity to witness the transfer of ethnicity and Maori ancestry between generations. The paper looks at the relationship between parents and children to examine the dynamics and complexity of ethnic reporting. In particular, how increased diversity is affecting the inter-generational transfer of ethnicity between parents and their children.
Introduction
thnic diversification and complexification is often discussed at a national or regional level, but it is a process which operates at the individual and family level. At the higher aggregate level, it is
relatively easy to measure changes in the reported ethnic composition and shifts between and within ethnic populations. At the family or individual level, the dynamics and complexity of ethnic reporting are often overshadowed by changes in family composition, relationships, life-stages or even the context in which the data is collected. Thus if a mother and child’s ethnic responses in statistical collections differ, there are a large number of potential causes.
By collecting ethnicities and ancestry for mother, father and child, New Zealand’s birth registration form provides a unique opportunity to track the
* Population Statistics team, Statistics New Zealand. Email [email protected]
E

150 Boddington and Didham
transfer of ethnicity and Maori ancestry between generations. This information is particularly valuable because the parent and child responses are generally completed by the same person and are collected at one point in time. A limitation to using the data is that in many cases, two of the three sets of responses are proxied.
Often it is just one parent (most commonly the mother) who completes the birth registration form.1 Decisions on ethnic affiliation should, in general, reflect that person’s perspective, although this might be modified by an awareness of affiliations and views of the other parent and the broader intended social context within which the child will live. If either parent state that they belong to a particular ethnic group, but the child does not, there is an implication that affiliation has weakened and there is no longer a sense that the child belongs to that ethnicity. Conversely, the registering of a child’s ethnic affiliation which is not shared with one’s parents may reflect anticipation of great cultural exposure or a strong desire to rekindle a cultural link – or indeed may reflect an ancestral link which the parent no longer identifies themselves with, but from which they do not want to disenfranchise the child.
As children develop their own identity, they may or may not relate to the ethnicities they were given at birth. By definition, an ethnic group is made up of people who have some or all of the following characteristics: a common proper name; one or more elements of common culture which need not be specified, but may include religion, customs, or language; unique community of interests, feelings and actions; a shared sense of common origins or ancestry, and; a common geographic origin (Statistics New Zealand, 2004, Callister et al., 2009) Therefore, it is not unreasonable for particular ethnic affiliations to strengthen, weaken or change over one’s lifetime. Analysis which follows individuals over time and establishes how life changes affect ethnic reporting, are important for understanding this ethnic mobility.
It is also understandable that data is affected by the context in which it is collected and, if not self reported, by whom it is collected. An extreme example of this is ethnic reporting in mortality data. Mortality data is supplied by the deceased’s next of kin but collected by the funeral director. While in many cases the deceased’s ethnic details will match what they themselves would have reported (say to their doctor), in other cases there

Ethnicity in recent birth regist
would be differences. Timportant for understand
Prior to a questioninfants’ ethnicities werehowever, this oversimpgenerations. Moreover, mobility it was difficultethnicity. The ethnic resp1996 allow a more thorfrom parent/s to child.
This analysis idencontributing factor in inthe internal characteristic
The Birth Registrat
This analysis focuses onby the New Zealand biethnicity was collected usand Pacific parents (Khaw
Figure 1 shows the questions are asked of the
Figure 1: Ethnicity and
Although these quesnumber of subsequent scanning/data capture, included and make the
tration data 15
Thus inter-collection consistency studies are alding the complexity of ethnic statistics.
change in 1996 on the birth registration fore derived from their parents’ stated ethnicitie
plified the transfer of ethnicity across successibecause of question context effects and ethn
t to disentangle the inter-generational transfer ponses collected by the birth registration form sinough analysis of the transfer of cultural affiliati
ntifies inter-ethnic partnering as a significancreasing ethnic complexity, leading to changes cs and dynamics of ethnic groupings.
tion Question(s)
n ethnic data collected for mother, father and chilirth registration form since 1996. Prior to 19sing a degree-of-blood question asked only of Maowaja et al., 2007).
current questions asked about the child – simile mother and father.
d Maori ancestry questions mid-2005 – present
stions were introduced in 1996, there have beenform changes, designed to facilitate electronenable additional questions/instructions to
overall form more visually appealing. These ha
51
lso
m, es; ive nic of
nce on
ant to
ld, 96 ori
lar
t
n a nic be
ave
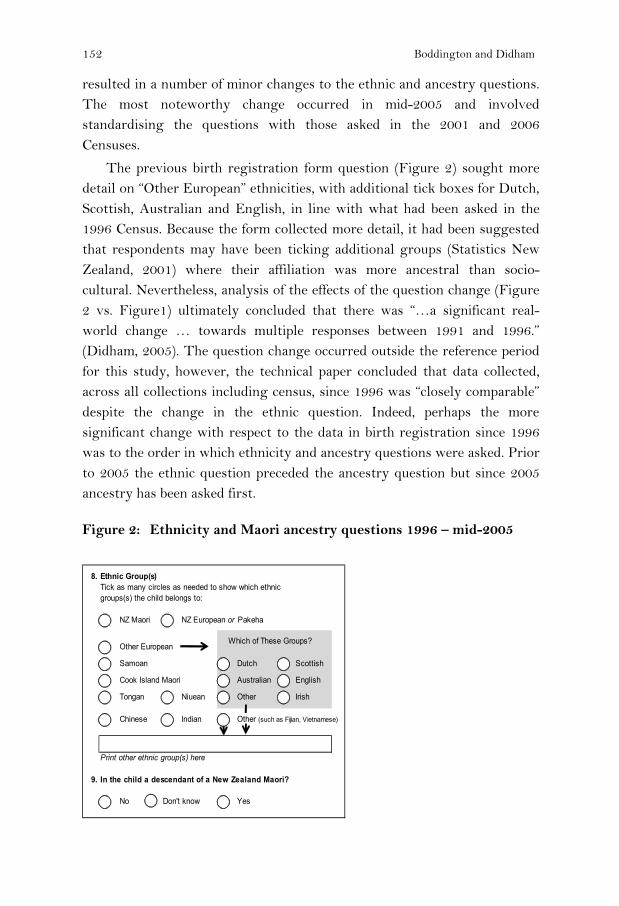
152 Boddington and Didham
resulted in a number of minor changes to the ethnic and ancestry questions. The most noteworthy change occurred in mid-2005 and involved standardising the questions with those asked in the 2001 and 2006 Censuses.
The previous birth registration form question (Figure 2) sought more detail on “Other European” ethnicities, with additional tick boxes for Dutch, Scottish, Australian and English, in line with what had been asked in the 1996 Census. Because the form collected more detail, it had been suggested that respondents may have been ticking additional groups (Statistics New Zealand, 2001) where their affiliation was more ancestral than socio-cultural. Nevertheless, analysis of the effects of the question change (Figure 2 vs. Figure1) ultimately concluded that there was “…a significant real-world change … towards multiple responses between 1991 and 1996.” (Didham, 2005). The question change occurred outside the reference period for this study, however, the technical paper concluded that data collected, across all collections including census, since 1996 was “closely comparable” despite the change in the ethnic question. Indeed, perhaps the more significant change with respect to the data in birth registration since 1996 was to the order in which ethnicity and ancestry questions were asked. Prior to 2005 the ethnic question preceded the ancestry question but since 2005 ancestry has been asked first.
Figure 2: Ethnicity and Maori ancestry questions 1996 – mid-2005
8. Ethnic Group(s)
NZ Maori NZ European or Pakeha
Other European
Samoan Dutch Scottish
Cook Island Maori Australian English
Tongan Niuean Other Irish
Chinese Indian Other (such as Fijian, Vietnamese)
9. In the child a descendant of a New Zealand Maori?
No Don't know Yes
Tick as many circles as needed to show which ethnic groups(s) the child belongs to:
Which of These Groups?
Print other ethnic group(s) here
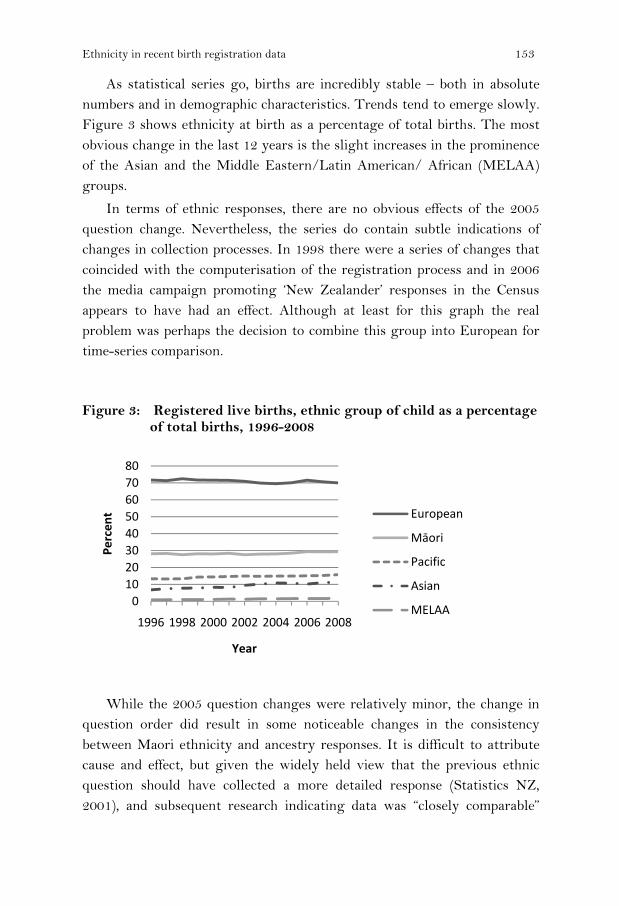
Ethnicity in recent birth registration data 153
As statistical series go, births are incredibly stable – both in absolute numbers and in demographic characteristics. Trends tend to emerge slowly. Figure 3 shows ethnicity at birth as a percentage of total births. The most obvious change in the last 12 years is the slight increases in the prominence of the Asian and the Middle Eastern/Latin American/ African (MELAA) groups.
In terms of ethnic responses, there are no obvious effects of the 2005 question change. Nevertheless, the series do contain subtle indications of changes in collection processes. In 1998 there were a series of changes that coincided with the computerisation of the registration process and in 2006 the media campaign promoting ‘New Zealander’ responses in the Census appears to have had an effect. Although at least for this graph the real problem was perhaps the decision to combine this group into European for time-series comparison.
Figure 3: Registered live births, ethnic group of child as a percentage of total births, 1996-2008
While the 2005 question changes were relatively minor, the change in question order did result in some noticeable changes in the consistency between Maori ethnicity and ancestry responses. It is difficult to attribute cause and effect, but given the widely held view that the previous ethnic question should have collected a more detailed response (Statistics NZ, 2001), and subsequent research indicating data was “closely comparable”
01020304050607080
1996 1998 2000 2002 2004 2006 2008
Perc
ent
Year
European
Māori
Pacific
Asian
MELAA

154 Boddington and Didham
(Didham, 2005), it would appear that a principal cause of changes in the resulting data was the change to the order of these questions.
Switching the order of the questions, so that ancestry was asked before ethnicity, appears to have resulted in a reduction in the number of people claiming Maori ethnicity, but not in the number claiming Maori ancestry (Table 1 - the figures in italics) decreased from over 1,000 for 2000 to 2004, to under 200 from 2006. Since belonging to the Maori ethnic group but not having Maori ancestry might be seen as something of an enigma, one interpretation is that questions are performing better. However, the increases in “not specified” would suggest more difficultly in answering the question. Moreover, the decline in Maori who do not have or do not know their Maori ancestry may reflect a shift to viewing ethnicity not as a separate question but as an extension of the one question. In the current form, the ancestry question provides a lead-in to the ethnic question and it appears to follow the normal practice of asking a simple question and then seeking more detail. Respondents may (wrongly) assume that their answers needed to be consistent. However, if a question seeking considerable detail is asked first, then the simpler ancestry question may lead respondents to conclude that something different is being sought.
Table 1: Registered live births, Maori ethnicity versus Maori ancestry, 2000-2008
Maori Ethnicity Maori Ancestry
Year Yes No Don’t Know
Not Rec. Total Yes No Not
specified Total
2000 13,811 1,114 924 2 15,851 13,811 2,141 4 15,956 2001 13,764 1,204 871 0 15,839 13,764 2,080 4 15,848 2002 13,118 1,012 741 0 14,871 13,118 1,978 9 15,105 2003 13,593 1,201 861 2 15,657 13,593 2,039 7 15,639 2004 14,311 1,087 860 1 16,259 14,311 1,981 5 16,297 2005 14,885 805 699 48 16,437 14,885 1,951 15 16,851 2006 16,561 191 483 107 17,342 16,561 2,046 16 18,623 2007 17,948 187 474 108 18,717 17,948 2,223 22 20,193 2008 18,011 190 552 91 18,844 18,011 2,105 10 20,126
It is perhaps noteworthy that prior to the question change in 2005 Maori ethnicity was passed more consistently from parents than was Maori ancestry. Since the question change the probability of intergenerational transfer of ancestry has risen to match that of ethnicity.

Ethnicity in recent birth registration data 155
Increasing Complexity through Inter-Ethnic Partnering?
By examining the percentage of new born infants, mothers and fathers of sole ethnicity (i.e. who only identify with one ethnic group), we can see inter-generational diversification at work. Comparing the ethnicity of children with their mothers reveals how inter-ethnic partnering has affected the transfer of ethnicity in just one generation (Figure 4). For example, in 2008, more than half of mothers who identified as Maori only chose that one ethnicity, while a third of their children were identified as sole Maori.
Figure 4 indicates that fathers are less ethnically diverse than mothers. Possible explanations for the difference between mothers and fathers include:
• Fathers are, on average, three years older than mothers. A simple
extrapolation of the mother/child trend would suggest that the age difference accounts for about half the difference for European, Maori and Pacific.
• Approximately seven percent of all birth registrations do not have the father’s details recorded. It is possible that because of cultural tensions the figure is higher for inter-ethnic partnerships.
.
Figure 4: Percentage of children, mothers and fathers of sole ethnicity, 2008
Source: Registered births.
0
20
40
60
80
100
European Māori Pacific Asian
Ethnic Group
Child
Mother
Father

156 Boddington and Didham
The aggregated data presented in Figure 4 excludes multiple responses within these broad level one Asian, European and Pacific groups and therefore understates diversity. For example, although 51 percent of Pacific babies were solely Pacific, as some were of more than one Pacific ethnicity, only 43 percent had a single ethnicity.
From a research or policy perspective, within-group mixing is often dismissed as being unimportant. Nevertheless for the families and communities involved, it can be culturally very significant. Moreover, this inter-ethnic partnering has typically occurred within New Zealand – at the 2006 Census only four percent of those born overseas had more than one ethnicity.
Transfer of Ethnicity across Generations
Figure 5 highlights the parental link to the ethnic affiliation of the child recorded in the birth registration data. For example, if the child’s ethnicity is shared with both parents it is plotted in black, but if only with the mother it is dark-grey. For each ethnic group there are a very small proportion of cases where there is no obvious link because one or both parents have not stated their ethnicity (lightest-grey), while when neither parent belonged to the same group as the child, it is shown in white (i.e. the child was a new entrant to the group).
Figure 5: Live births by ethnicity of child and parental ethnic link, 2008

Ethnicity in recent birth registration data 157
The ’Other’ group is relatively new to the ethnic classification and consists almost entirely of ‘New Zealander’ type responses (Kukutai and Didham, 2009). ’Other’ was the only group to have a significant proportion of new entrants (i.e. neither parent belongs to the same group as the child) and this reflects the fact that some parents are choosing to state that their child is a New Zealander while stating a different ethnicity for themselves. Asians disproportionately contribute one in three of this group despite the fact that only 11 percent of births are Asian. MELAA, who account for less than two percent of births, also disproportionately contribute, accounting for one in ten of the gains to the ‘Other’ group. Interestingly, parents who are both solely Asian, both solely MELAA, or both solely Pacific, contribute 15 percent of the increase in ‘Other’ babies.
The ‘Other’ group exhibits another interesting feature - it is the only group where the influence of the father is greater than the mother. In part, this is a reflection of the fact that males are more likely to identify with this group than females.
The European and Asian groups are the only groups in which more than half share their ethnicity with both parents. In the case of Europeans, this partly reflects the size of the population – approximately two thirds of the population of childbearing age is European. For Asian children this possibly reflects migration from Asian in the past two decades and less opportunity for inter-ethnic partnerships.
Apparent Losses to Ethnic Groups
Figure 6 plots apparent losses to each ethnic group. For example in 2008 almost 800 births in which one or both parents were Maori, did not result in a child registered as Maori. This equates to just over four percent of the total number of births to a Maori parent. As the graph indicates, there is a slightly greater loss from Maori mothers than from Maori fathers although it must be noted that ethnic response for mothers was close to 100 percent but only 90 percent for fathers.

158 Boddington and Didham
Figure 6: Percentage of ethnic group parents not passing ethnic identity to the child, 2008
The MELAA group lost a significant proportion of their children - almost nine percent. In 90 percent of these cases the child’s stated ethnicities included an European ethnicity and in nine out of ten cases this included NZ European. However significant losses from MELAA to the ‘Other’ group also warrant mention, in seven percent of cases the child’s stated ethnicity included ‘Other’.
The ‘Other’ group, which consists almost entirely of New Zealander responses, does not behave like most ethnic groups.
We have already seen that 20 percent of children who belong to this group do not share this ethnicity with their parents. Figure 6 shows that over a quarter of ‘Other’ parents do not transmit this ethnic affiliation to their child. There is a very strong sex bias, in many cases the father’s New Zealander response is not transmitted to the child. This is perhaps an acknowledgement that the write-in response ‘New Zealander’ is not considered a standard response and thus perhaps a little uncooperative with the intentions of the census takers. Mothers would appear to be a little more compliant, or at least hold sway over the child’s response.
Although the European group contributes the majority of ‘New Zealander’ responses, in proportional terms the greatest effects are to the MELAA and then Asian groups. Thus, unlike where ‘Other’ was combined with ‘European’ into one group for analysis, at least for births it is more

Ethnicity in recent birth registration data 159
correct to combine Other / European / Asian / MELAA into one group for analysis.
At present Maori and Pacific groups do not appear to be too greatly affected by ‘New Zealander’ responses. Nevertheless, this paper has highlighted how rapidly ethnic diversity is increasing. Large numbers of Maori children already belong to multiple ethnic groups and there is some evidence of the ‘Other’ group gaining at the expense of Maori, particularly where parents themselves belong to several ethnic groups.
Conclusion
The frequently stated maxim is that both ethnicity and ancestry have strong ancestral and cultural components. It would therefore be expected that birth registrations, which are instruments that parents can use to express their intentions for their child, should reflect the ethnicities of one or other of the parents. This is true for approximately half of new born Pacific, MELAA and Other babies, who gain their ethnic affiliation from both parents with up to another forty percent gaining that ethnicity from only one parent. For Maori the figure is lower at just two-fifths from both parents. Nevertheless, even these figures understate the ethnic diversification in the population. For example, although two fifths of Maori children gain their ethnic affiliation from both parents, two-thirds of Maori children also identify with ethnicities in other ethnic groups, in many cases involving ethnicities not recorded for either parent.
As each generation becomes ethnically more diverse, each ethnic group is becoming more heterogeneous; with some members belonging solely to that group while others identify also with other ethnicities. For new-borns, an added complexity may be that the biological parents (particularly fathers) may not always fulfil a parental role and the child’s ethnicities may derive from other people in their social environment. What is interesting in the birth registration data is the fact that the migration of people into the New Zealander ethnic group disproportionately implicates the Asian and MELAA ethnic groups.

160 Boddington and Didham
Notes
It is acknowledged that in an unknown number of cases the birth registration forms will be completed by the father, or by both parents in consultation, but in practice this is less common. Similarly the forms may be completed by another party such as a midwife or other family, in which case all responses are proxied.
References
Callister, P., Didham, R. & Kivi A. (2009). Who we are: the conceptualisation and expression of ethnicity. Official Statistics Research Series, volume 4. Wellington, Statistics New Zealand. http://www.statisphere.govt.nz/official-statisticsresearch/series/default.htm
Didham, R. (2005).Understanding and working with ethnicity data. Wellington, Statistics New Zealand.
Khawaja, M., Boddington, B. & Didham, R. (2007). Growing ethnic diversity in New Zealand and its implications for measuring differentials in fertility and mortality. Wellington, Statistics New Zealand. http://www.stats.govt.nz/reports/analytical-reports/review-measurement-of-ethnicity/papers.aspx
Kukutai, T. & Didham, R. (2009). In search of ethnic New Zealanders: national naming in the 2006 Census. Social Policy Journal Vol 36.
Statistics New Zealand. (1996). A report on ethnic death statistics workshop. Wellington, Statistics New Zealand.
Statistics New Zealand. (2001). Review of the measurement of ethnicity: background paper February 2001. Wellington, Statistics New Zealand.
Statistics New Zealand. (2004). Report of the review of measurement of ethnicity. Wellington, Statistics New Zealand.

INSTRUCTIONS TO CONTRIBUTORS The New Zealand Population Review is a peer reviewed journal carrying articles on many aspects of population, mainly relating to New Zealand, but in some cases dealing with issues in the Pacific, Australia, Asia or elsewhere. These articles may be based on new empirical research, theoretical perspectives or policy-related analysis. The Review is normally published once a year and solicits substantive articles of 5,000 to 8,000 words, as well as shorter research notes and commentaries. Papers should be submitted in electronic form and must follow the referencing format as published in this issue. Short quotations should be enclosed in double quotation marks. Quotations longer than three lines should be separated from the paragraph, without quotation marks, and indented three spaces from the left hand margin. Note that from 2009 the APA (American Psychological Association) referencing system will continue to be used. This system is widely used and is available on all major referencing software systems (e.g. Endnote), but contact the editors if you have any questions. References are cited in the text with the author’s name and date of publication (as in this issue) and are listed alphabetically at the end of the article following the conventions of the APA. Endnotes should be employed only where essential; they should be referenced in the text and placed at the end of the paper under the title NOTES. An abstract of 50-100 words, along with a note on the author’s affiliation, should also be submitted, on a separate page. Manuscripts or books for review should be submitted to: Dr Wardlow Friesen Senior Lecturer in Geography School of Environment The University of Auckland Email: [email protected] Or Dr Arvind Zodgekar Email: [email protected] Books for review and other correspondence should be sent to the Editor. Queries concerning subscriptions, change of address etc. should be sent to the Secretary. Views expressed in articles and reviews published in the New Zealand Population Review are those of the contributors and do not necessarily reflect the views of the Population Association of New Zealand. Except for short quotations for review or educational purposes, material must not be reproduced without the written permission of the author. Permission to reproduce entire articles for publication must be obtained from the editor.

ISSN 0111-199X (Print) ISSN 1179-8149 (Online)


![©NIDEA 1 Natalie Jackson What is on a [New Zealand] demographer’s mind? Professor of Demography, Director, National Institute of Demographic and Economic.](https://static.fdocuments.in/doc/165x107/56649f565503460f94c7aca4/nidea-1-natalie-jackson-what-is-on-a-new-zealand-demographers-mind.jpg)