NEW YORK WORKERS’ COMPENSATION OCTOBER 1, …2017-8-18 · NEW YORK WORKERS’ COMPENSATION...
88
NEW YORK WORKERS’ COMPENSATION OCTOBER 1, 2017 LOSS COST FILING • Actuarial Committee Recommended Loss Cost Level Change: -4.5% • Proposed Loss Cost Level Change: -4.5% • Approved Loss Cost Level Change: -4.5% The Rating Board submitted the 2017 General Loss Cost Revision to the New York State Department of Financial Services on May 15, 2017 requesting an average change of -4.5% in the loss cost level to become effective on October 1, 2017. The loss cost revision reflects the experience of the two most recent policy years, as well as projected trends, benefit level changes, and changes in loss adjustment expenses. In addition, the proposed change reflects the impact of certain components of the 2017 workers’ compensation reform. The filing proposed no changes to the terrorism and catastrophe loss cost provisions. The filing was approved on July 17, 2017. The attached actuarial exhibits provide specific information on all components of the approved 2017 loss cost revision. Included also is the detailed Filing Memorandum that accompanied the Rating Board’s filing submission. The Department of Financial Services’ approval letter is also attached and can be found following the actuarial exhibits.
Transcript of NEW YORK WORKERS’ COMPENSATION OCTOBER 1, …2017-8-18 · NEW YORK WORKERS’ COMPENSATION...
NEW YORK WORKERS’ COMPENSATION OCTOBER 1, 2017 LOSS COST FILING
• Actuarial Committee Recommended Loss Cost Level Change: -4.5%
• Proposed Loss Cost Level Change: -4.5%
• Approved Loss Cost Level Change: -4.5%
The Rating Board submitted the 2017 General Loss Cost Revision to the New York State Department of Financial Services on May 15, 2017 requesting an average change of -4.5% in the loss cost level to become effective on October 1, 2017.
The loss cost revision reflects the experience of the two most recent policy years, as well
as projected trends, benefit level changes, and changes in loss adjustment expenses. In addition, the proposed change reflects the impact of certain components of the 2017 workers’ compensation reform. The filing proposed no changes to the terrorism and catastrophe loss cost provisions.
The filing was approved on July 17, 2017.
The attached actuarial exhibits provide specific information on all components of the approved 2017 loss cost revision. Included also is the detailed Filing Memorandum that accompanied the Rating Board’s filing submission.
The Department of Financial Services’ approval letter is also attached and can be found following the actuarial exhibits.
New York Compensation Insurance Rating Board 733 Third Avenue New York, NY 10017 Tel: (212) 697‐3535
NEW YORK WORKERS’ COMPENSATION
October 1, 2017 Loss Cost Revision
Explanatory Memorandum This memorandum, together with the attached actuarial exhibits, provides supporting documentation for an overall loss cost level change of ‐4.5%, to become effective on October 1, 2017. The proposed loss cost change is based on the latest statistical data reported by the Rating Board’s member carriers and reflects the application of generally accepted actuarial principles and methodologies. The elements contributing to the overall change are summarized below and are presented in detail on the following pages.
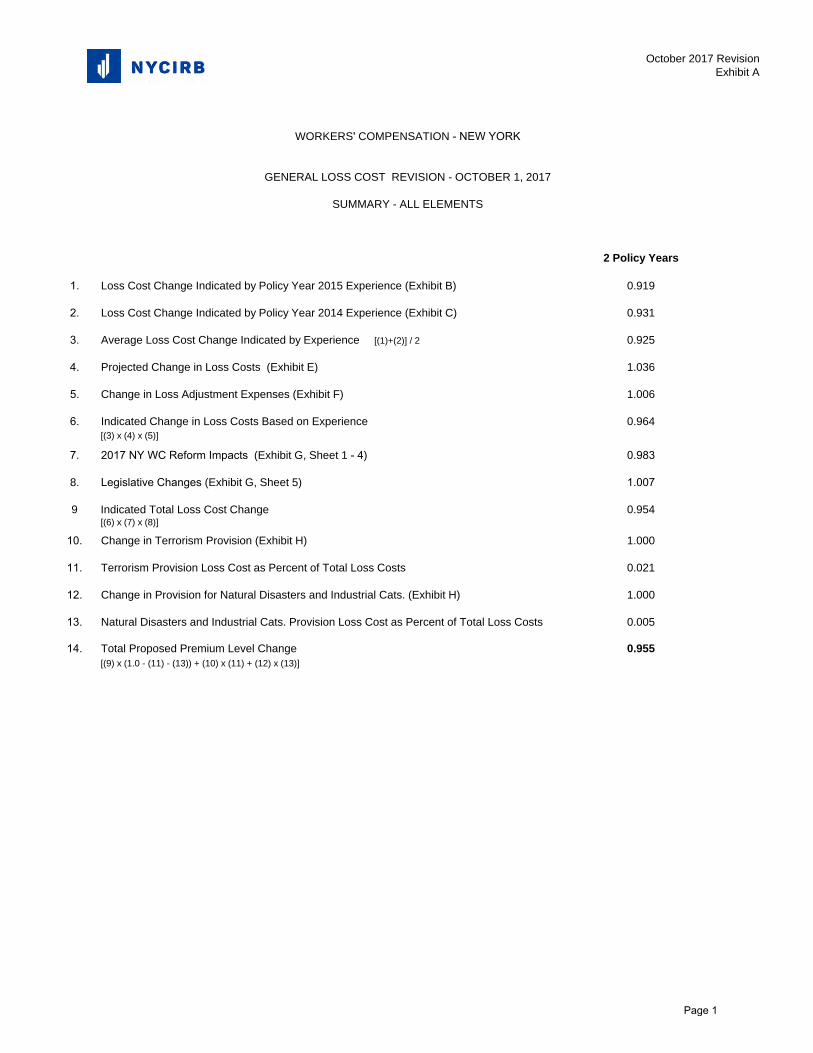
1. Change indicated by Policy Year 2015 experience 0.919 2. Change indicated by Policy Year 2014 experience 0.931 3. Average change indicated by experience [(1) + (2)] / 2 0.925 4. Change in prospective claim cost, frequency and wage levels 1.036 5. Change in loss adjustment expense (LAE) 1.006 6. Change due to experience, trend and LAE (3) x (4) x (5) 0.964 7. Change due to 2017 reforms 0.983 8. Change due to standard legislation and regulation 1.007 9. Indicated Manual Loss Cost Level Change (6) x (7) x (8) 0.954 10. Change in Terrorism Provision 1.000 11. Terrorism Provision loss cost as percent of total loss costs 0.021 12. Change in Provision for Natural Disasters and Industrial Cats. 1.000 13. Natural Disasters and Industrial Cats. Provision Loss Cost
as percent of total loss costs 0.005 14. Proposed Total Loss Cost Level Change
[(9) x (1.0 ‐ (11) ‐ (13)) + (10) x (11) + (12) x (13)] 0.955
A listing of the actuarial exhibits follows this explanatory memorandum providing easy reference for reviewing the underlying support for this filing.
- 1 -
October 1, 2017 Loss Cost Filing Explanatory Memorandum Page 2 1. Experience of Policy Years 2015 and 2014
The calculation of the indicated change in loss costs derived from the experience of Policy Year 2015 is presented as Exhibit B, and of Policy Year 2014 as Exhibit C.
The experience of Policy Years 2015 and 2014, valued as of December 31, 2016, has been compiled from the latest available statistical data submitted by the Rating Board's member companies. Similar to past years, large deductible experience is included in the determination of the indicated experience change. Although this experience is still viewed as unique and similar to self‐insurance, its inclusion reflects the Department’s long held position that this data should be included in the annual Rating Board filing. Furthermore, at the previous direction of the New York State Department of Financial Services (“DFS”), the policy year indication also includes the experience of the State Insurance Fund.
Beginning with policy year 2008, standard premiums have been reported in the annual New York Financial Data Calls on a designated statistical reporting (DSR) level. DSR level represents standard premium reported to NYCIRB excluding the effect of carrier loss cost multipliers. As a result of removing loss cost multipliers, the premium becomes an expected loss cost level against which the actual loss experience can be measured.
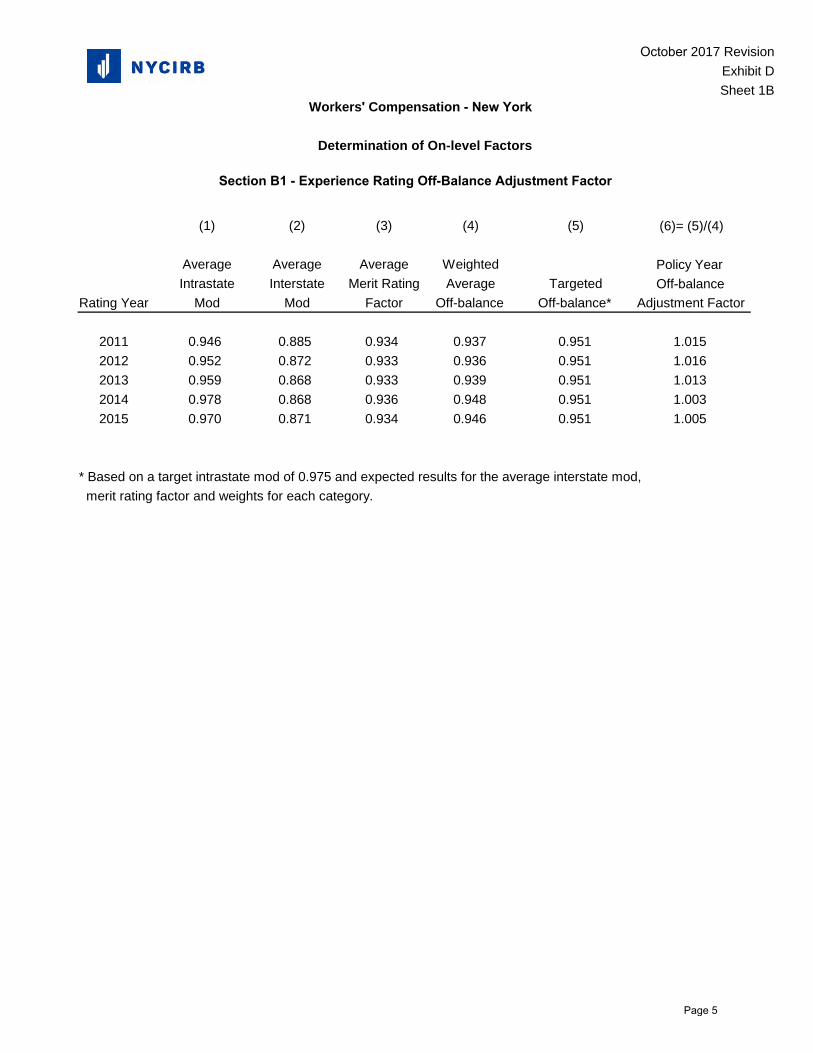
The premiums are then brought to the current loss cost level. This adjustment is done in accordance with standard actuarial procedures, reflecting the latest approved loss cost level changes. Premium amounts are also adjusted to the same level of experience rating impact that is expected during the prospective filing period. The “Experience Rating Off‐Balance” adjustment factors are 1.005 for PY 2015 and 1.003 for PY 2014. The derivation of these adjustment factors can be found on Exhibit D, Sheet 1B (page 5). After inclusion of these “Experience Rating Off‐Balance” factors, the resulting final premium on‐level factors are 1.147 for policy year 2015 and 1.160 for policy year 2014. The on‐level calculations are shown on Exhibit D, Sheet 1A (page 4).
Similar to previous filings, the Rating Board has utilized paid plus case losses for the policy year loss evaluation. Indemnity and medical losses were analyzed separately in recognition of the significant differences in their respective development patterns.
Losses emanating from the September 11, 2001 terrorist attacks have been excluded from the ratemaking data. Both policy year 2000 and policy year 2001 losses have been adjusted to remove the effects of the September 11, 2001 experience that was identified and reported under Catastrophe Code 48. The definition of Catastrophe Code 48 encompasses claims directly arising from the commercial airline hijackings of September 11, 2001 and the resulting subsequent events with accident dates of September 11, 2001 through September 14, 2001.
For loss development, two, three, four and five‐year average link ratios, as well as a three‐year average, calculated after excluding the highest and lowest points, were analyzed for both indemnity and medical. Development patterns can vary at different report levels. Following examination of the different factors, the selected loss development methodology utilizes five‐year average factors from first to twentieth reports to smooth the impact of any variations in the observed development patterns. This is consistent with the approach used in last year’s filing. Separate development factors
- 2 -
October 1, 2017 Loss Cost Filing Explanatory Memorandum Page 3
were derived for the non‐large deductible experience, the large deductible experience, and the State Insurance Fund using the same methodology, except for the 11th to 12th report development ratio for the State Insurance Fund, where the middle three of five factors were used.
The procedure used to calculate the loss development factor from 20th to ultimate (the tail factor) is similar to the procedure used in last year’s filing, utilizing paid plus case losses and applying a growth factor. The growth factor is used to adjust the experience of prior years used in the tail calculation to the level of the base development year at 19th report. The adjustment is needed to reflect trend and benefit level changes in the historical experience. Information from Policy Years 1987 through 1995 was included in the tail factor calculation. This approach is consistent with the methodology used by NCCI. An improvement, included in this year’s filing, is the utilization of seven reports of data at seven successive valuations. The final tail factor is determined by averaging these seven factors. This enhancement to the tail methodology should improve long term tail factor stability. Last year, a six‐year average was used.
Premium development factors for both non‐large deductible and large deductible private carriers, as well as the State Insurance Fund, are based on three‐year averages.
The private carrier non‐large deductible development data can be found on Exhibits BB, Sheets 1 through 2I (pages 35‐45). For large deductible development, exhibits labeled as Exhibit CC, Sheets 1‐2C (pages 46‐50) are provided.
Exhibit DD, Sheets 1‐2I (pages 51‐61) contains the experience of the State Insurance Fund. These pages include premium development factors for the policy year, and separate indemnity and medical loss development factors. Because of the large volume of State Insurance Fund data, it is appropriate that projections of ultimate losses reflect this experience’s own development patterns. This is consistent with the approach utilized in past filings. Policy year losses for the private carrier non‐large deductible experience, State Insurance Fund experience, and the large deductible experience are separately adjusted to an ultimate settlement basis, as described above.
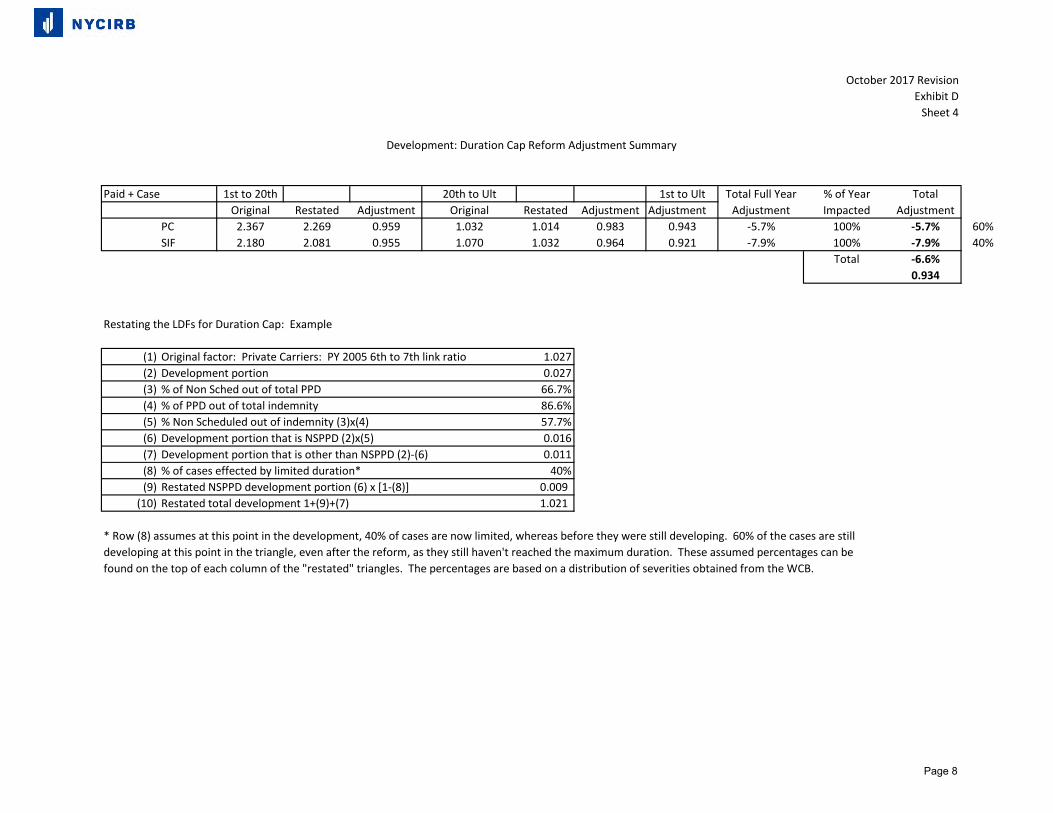
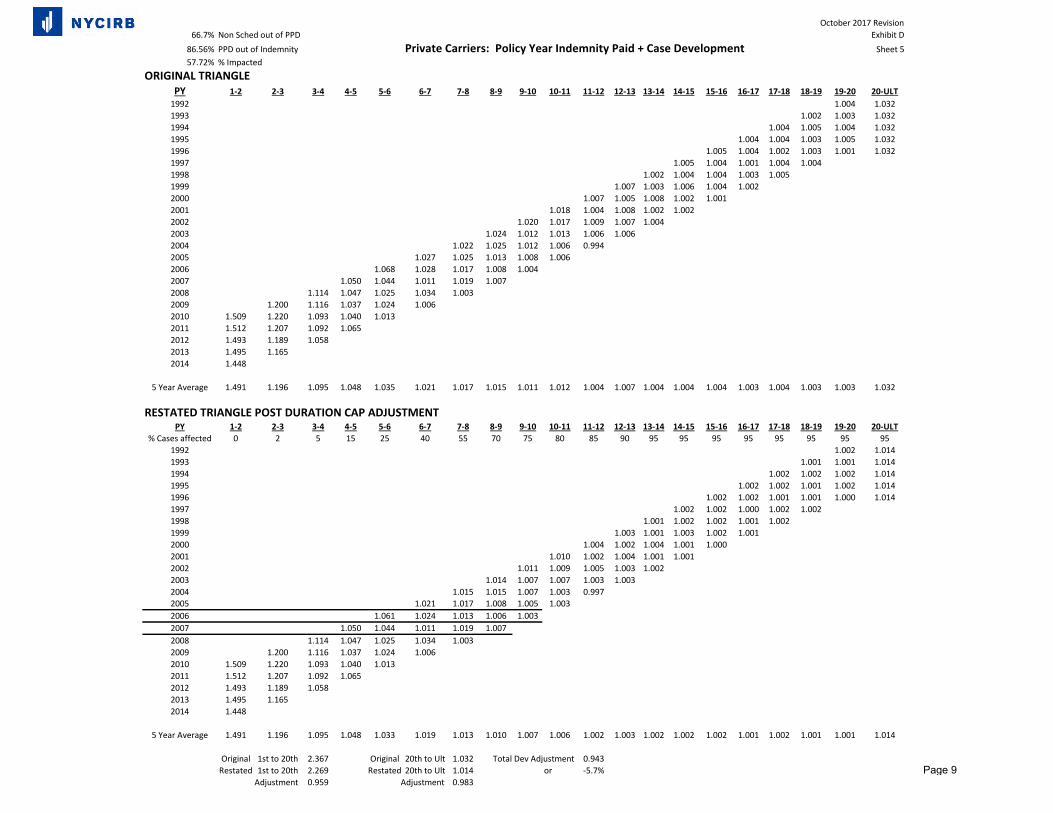
Losses are then adjusted to reflect the current benefit level. All losses in the experience period of policy years 2014 and 2015 have occurred subsequent to the 2007 reforms. The three major components of the 2007 reform are the increase in maximum weekly benefits, the elimination of the Special Disability Fund (“SDF”) and the introduction of capped benefit durations for claimants with Non‐Scheduled Permanent Partial Disability Benefits (“NS‐PPD”). In theory, losses that have occurred after the reform would not need to be adjusted for the full impact of the reform, as they are already at the post‐reform level. However, because experience from pre‐reform years is used to derive loss development factors, using the LDFs as reported may not result in appropriate post‐reform ultimate losses. Therefore, some adjustments are warranted. The adjustment due to the implementation of duration caps is derived by restating any pre‐reform link ratio from the reported development triangle to post‐reform level. Then, the adjustment factor
- 3 -
October 1, 2017 Loss Cost Filing Explanatory Memorandum Page 4
is the ratio of the resulting ultimate development factor after the restatement to the ultimate factor based on the reported values. The restatement of each link ratio assumes that a portion of the development that is reflected in the link ratio is attributable to the unwinding of discount on life annuities on NS‐PPD injuries, while the remainder is due to other injuries. Based on Unit Statistical Data, it was determined that, for the pre‐reform years, permanent partial indemnity costs account for 86.56% of total indemnity costs. It was also determined, based on data obtained from the New York State Workers’ Compensation Board (“WCB”) that 66.7% out of all permanent partial injuries were, in fact, NS‐PPD. Therefore, 57.7% (=.667 x .8656) out of total indemnity are attributable to NS‐PPD, which is the portion of the development factor that needs to be adjusted. The remaining 42.3% of indemnity costs are not adjusted. The full details of the calculation are presented on Exhibit D, Sheet 4 (page 8) and the restated LDF triangle is shown on Exhibit D, Sheet 5 (page 9) for private carriers and Exhibit D, Sheet 6 (page 10) for the State Insurance Fund. The overall adjustment factor resulting from this procedure is 0.934.
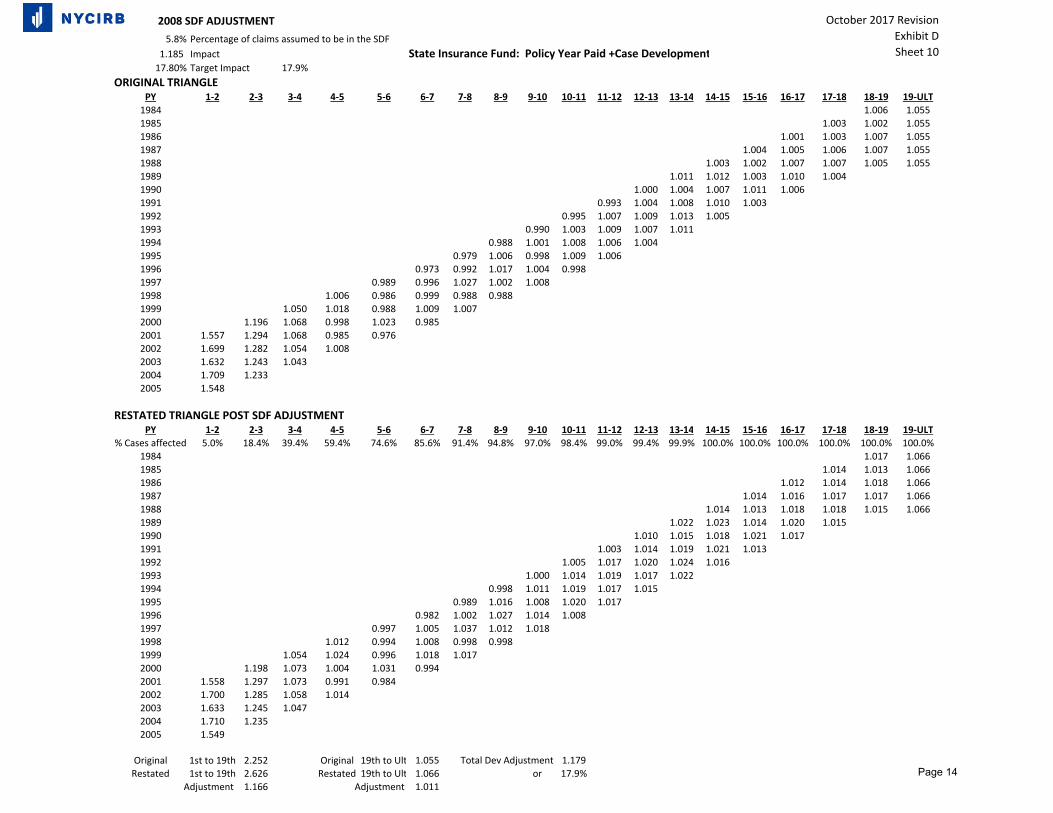
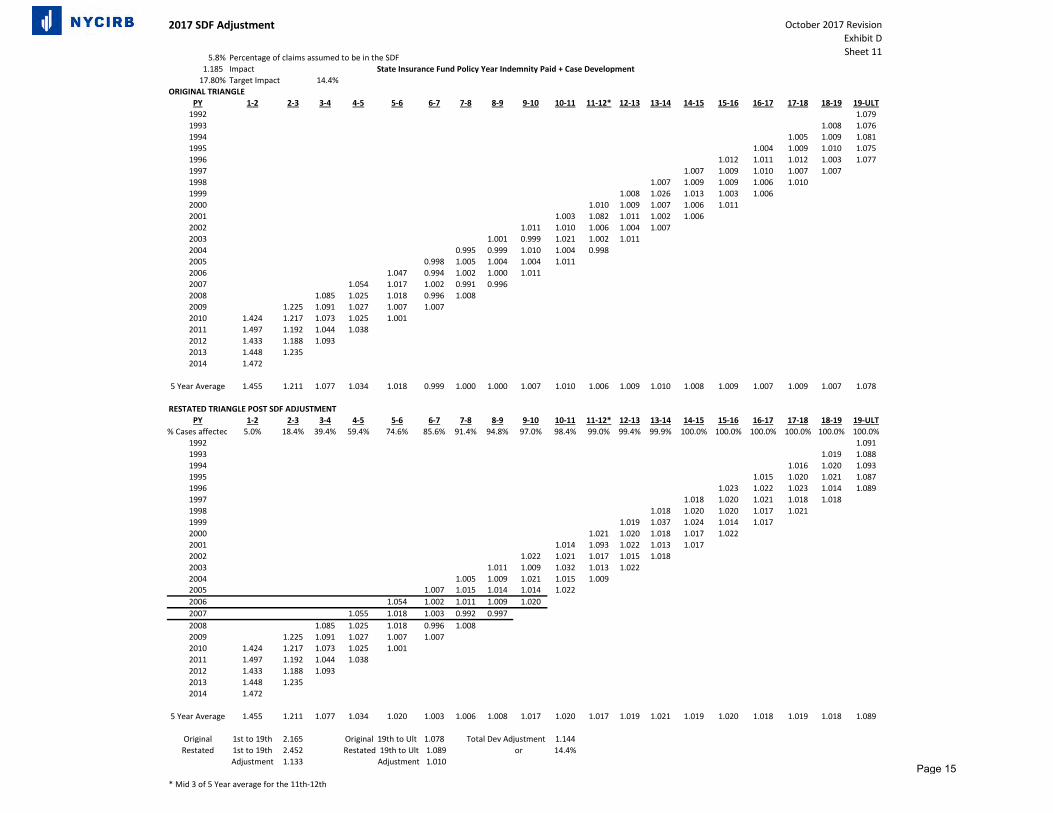
With respect to the closing of the SDF, until three years ago, indemnity losses were adjusted upward by the full estimated impact of the reform (17.8%). This is because most of the loss development factors are from pre‐reform years, and are therefore suppressed, as they reflect the subrogation from the SDF. As part of the 2013 filing, a new approach was taken to determine the impact of the SDF that needs to be applied to the reported losses. Based on information that was obtained from the Special Funds Conservation Committee with respect to the rate at which claims were accepted into the SDF, it was first determined that, on average, 5.8% of indemnity claims were affected by the SDF elimination. This percentage is multiplied by the percentage of cases accepted by the SDF at each development age, to determine the percentage out of all claims that were accepted by the SDF at each development age. The next step in the calculation is to restate each pre‐reform link ratio in the loss development triangle using the following formula:
LRS = LRO x SDF% x AF + LRO x (1‐ SDF%) Where LRS = the Restated link ratio, LRO = Original Link Ratio SDF% = percentage of cases accepted to the SDF at a given development age AF = Adjustment Factor.
The adjustment factor was determined separately for the private carriers and the State Insurance Fund by restating the latest available loss development triangle which consisted entirely of pre‐reform years (that was used as part of the 2008 Loss Cost Filing) in the same way as described above, such that the restated LDF to ultimate is 17.8% higher than the original LDF to ultimate. (This was the originally estimated impact of the reform on indemnity benefits). The 2008 triangles, which include
- 4 -
October 1, 2017 Loss Cost Filing Explanatory Memorandum Page 5
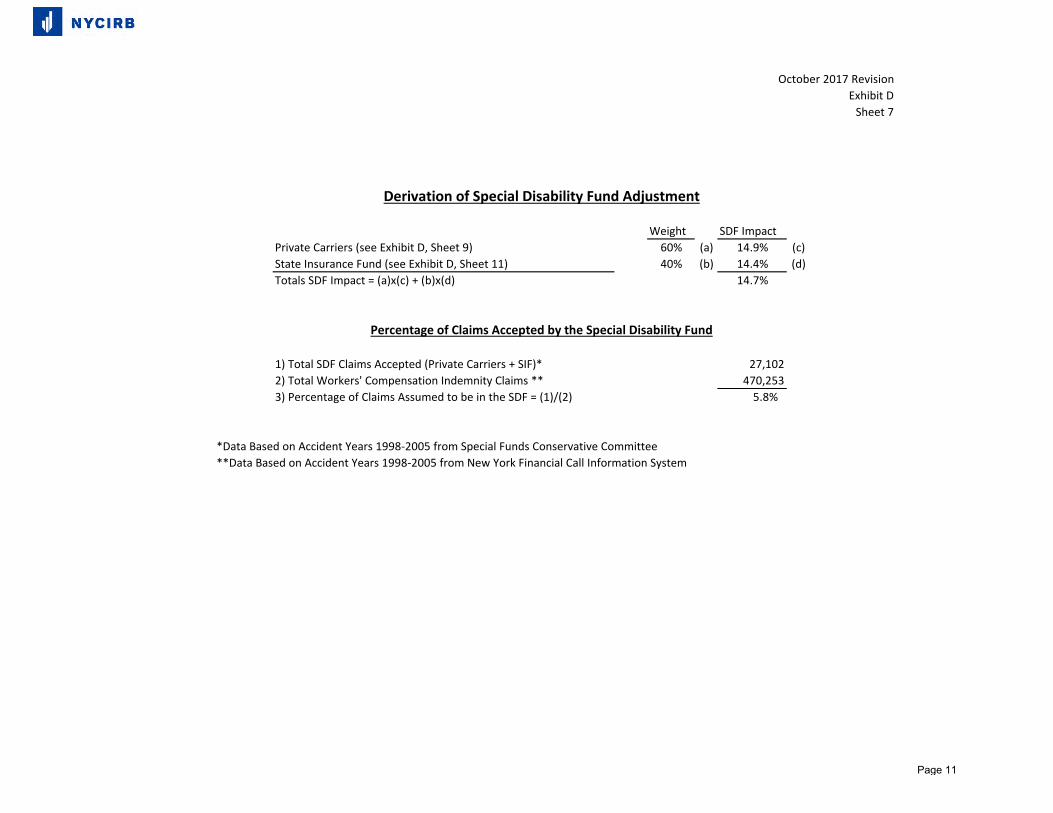
the derivation of the adjustment factors, are shown on Exhibit D, Sheet 8 (page 12) for private carriers and Exhibit D, Sheet 10 (page 14) for the State Insurance Fund. Then, the impact of the SDF that is used in this filing is determined as the ratio of the ultimate LDF in the restated triangle to the ultimate LDF in the original triangle. These impacts were 14.9% in the Private Carrier analysis and 14.4% in the SIF analysis. A weighted average using 60%/40% weights resulted in the overall impact 14.7%, as is shown in Exhibit D, Sheet 7 (page 11). This impact is used in the loss on‐level factors, which may be found in Exhibit D, Sheet 2 (page 6).
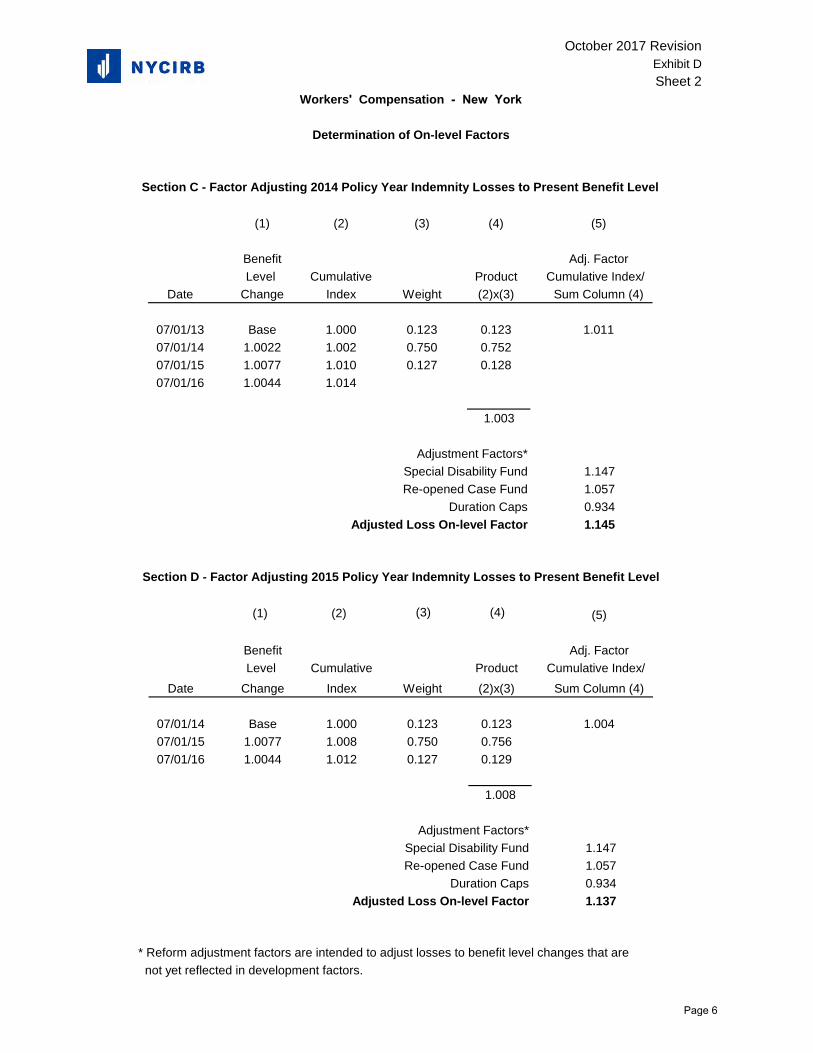
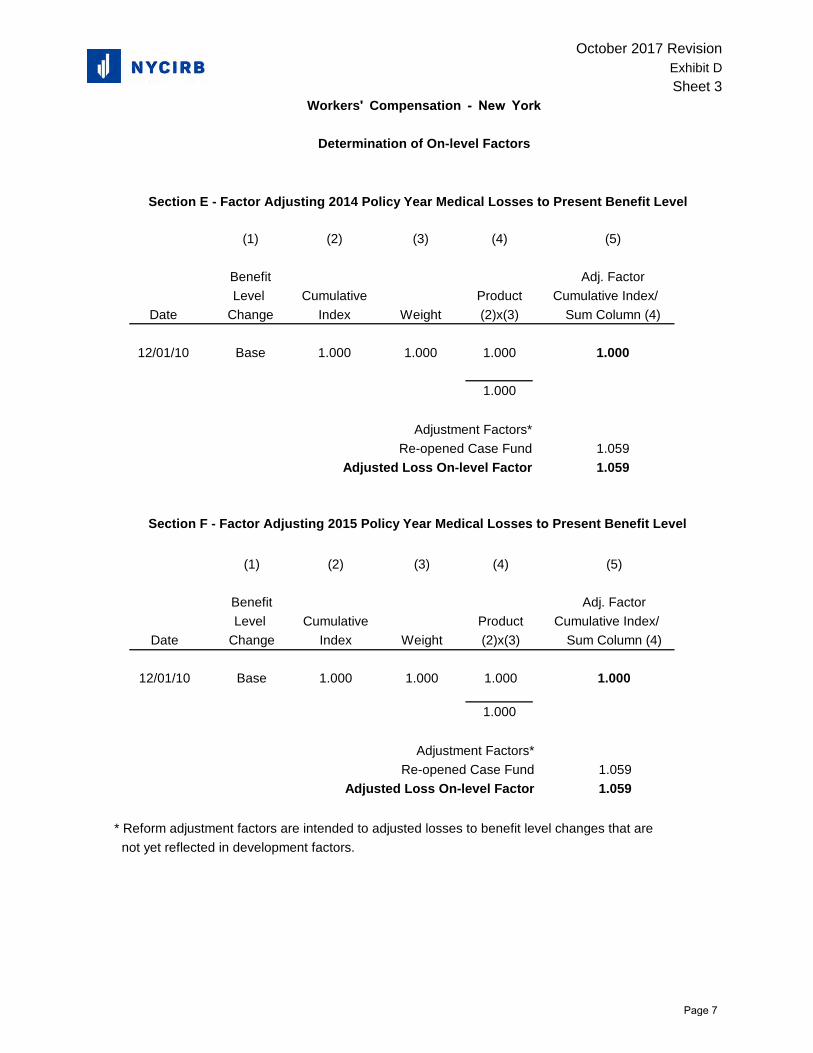
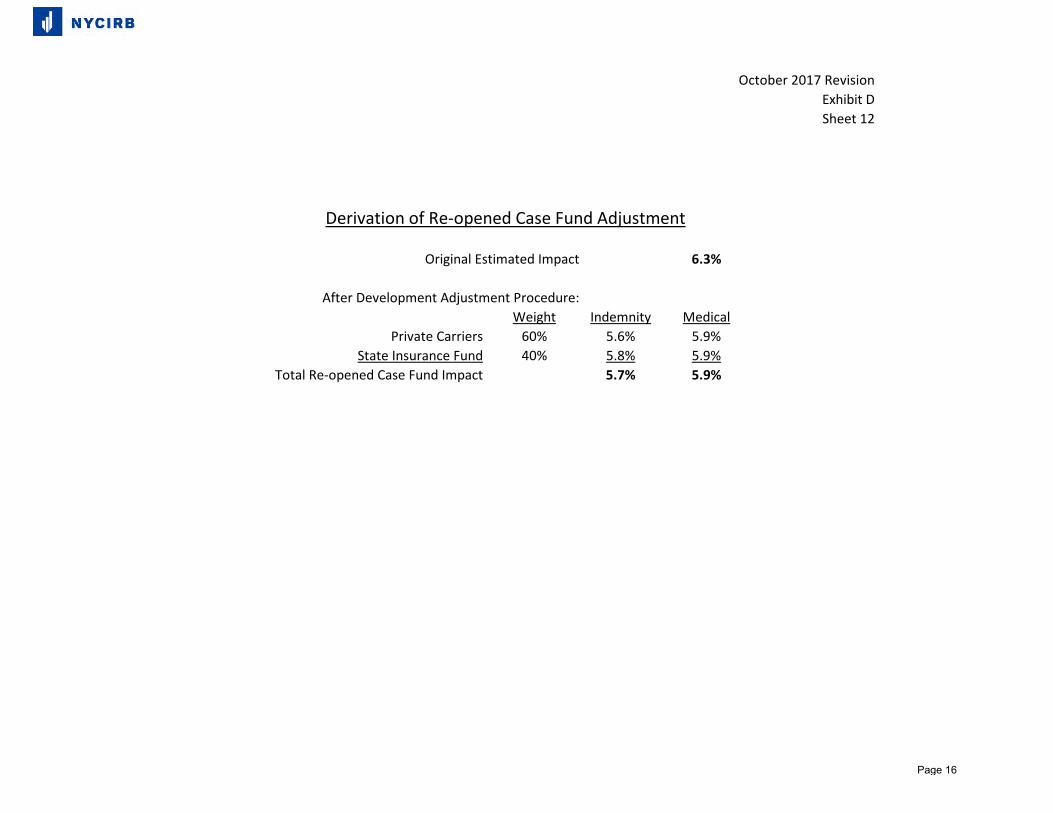
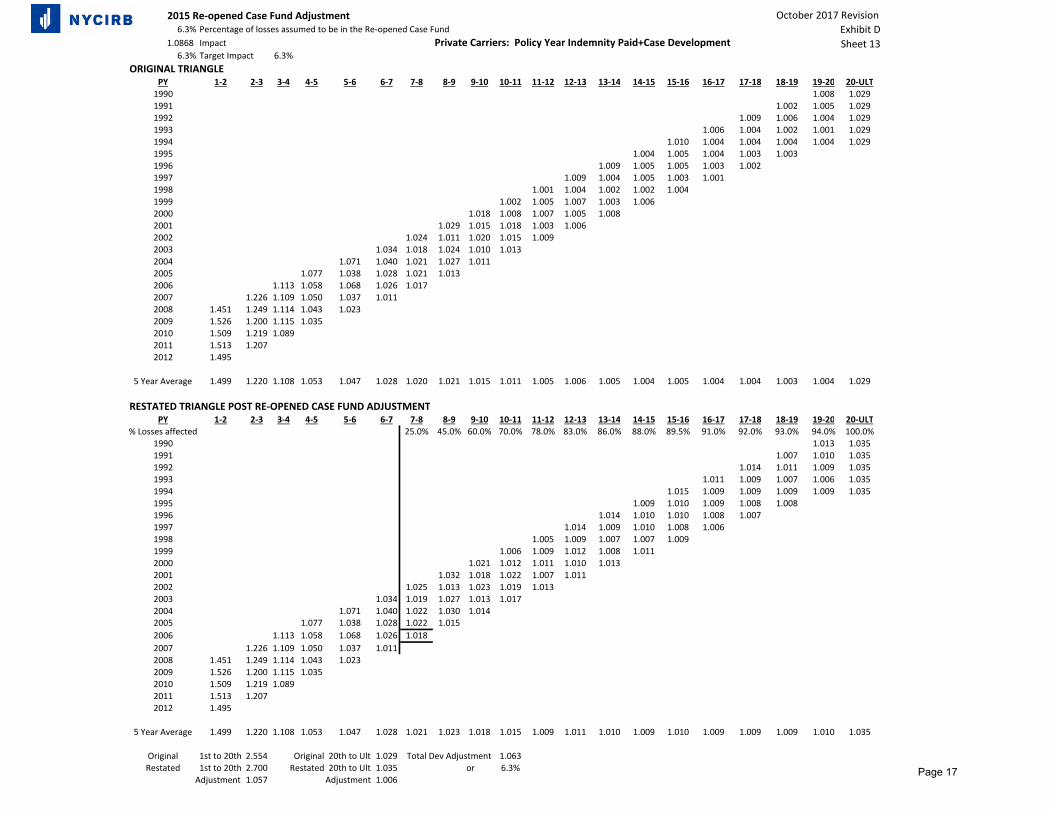
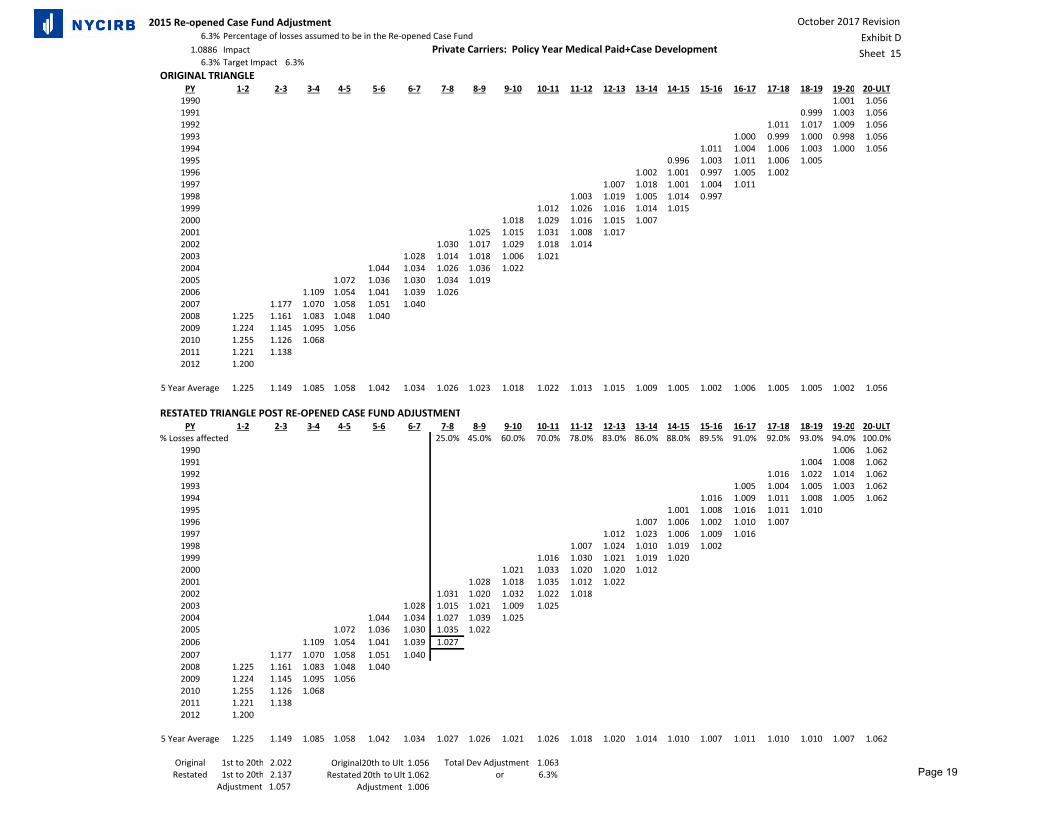
An additional adjustment is needed to account for the January 1, 2014 closing of the Re‐Opened Case Fund (25‐A). The adjustment involved using the same approach that is used to determine the SDF adjustment. It was estimated that the total impact of the Re‐Opened Case Fund elimination was 6.3%. The adjustment accounts for the fact that carriers have been paying and reserving for re‐opened claims over the last 3 calendar years, since the fund has been closed. This has been reflected on Exhibit D, Sheet 14 (page 18). After re‐stating the loss development triangles, it was determined that the appropriate factors that need to be used in this year’s revision are 5.9% for medical, and 5.7% for indemnity. The derivation of these factors can be found on Exhibit D, Sheet 12 (page 16) The loss on‐level calculations are presented on Exhibit D, Sheets 2 and 3 (pages 6‐7). The standard loss on‐level calculation is shown, followed by the reform adjustments described above, resulting in an overall factor to bring the losses to the current benefit level. The final indemnity loss on‐level factors are 1.145 for PY 2014 and 1.137 for PY 2015. For medical, the factors are 1.059 for both PY 2014 and PY 2015. Loss cost indications are calculated separately for the non‐large deductible and large deductible experience and are then weighted based on their respective net earned premiums to arrive at a decrease of 8.1% in loss cost level based upon Policy Year 2015 experience (Exhibit B) and 6.9% based on Policy Year 2014 experience (Exhibit C).
2. Average Experience Change
With equal weights given to the 8.1% decrease indicated by the Policy Year 2015 experience and the 6.9% decrease indicated by the Policy Year 2014 experience, the average effect of experience is a decrease of 7.5%.
3. Trend Factor Analysis
The presentation of the loss portion of the trend factor is similar to previous years in that indicated trends are expressed in terms of average annual changes in claim costs and claim frequencies. This year’s methodology, which is the same as filed last year, bases the indicated frequency and severities directly on the combined financial data of all private carriers (excluding large deductible experience) and the State Insurance Fund. All data has been adjusted to current levels, i.e., the premiums underlying the frequency calculation are adjusted to the current loss cost level and losses are adjusted to an estimated ultimate settlement
- 5 -
October 1, 2017 Loss Cost Filing Explanatory Memorandum Page 6
basis, as well as to the current benefit level in the same manner as previously described. Premium amounts are also adjusted to a consistent “experience rating off‐balance.” This refers to the overall impact of the experience rating, which may differ from year to year. This adjustment, which was introduced with last year’s filing, ensures that the overall trend results measures pure changes in claim frequency, which may be misrepresented if this adjustment is not made. Claim counts have also been adjusted to ultimate values.
It should be noted that the claim counts reported in the financial data include only lost‐time claims, i.e., medical‐only claim counts are not part of the analysis under this methodology. This produces amore material trend since, while medical‐only cases represent over 60% of the total claims, theyrepresent less than 4% of the losses. The inclusion of medical‐only claims in a frequency and severityanalysis can have a misleading effect on the final trend. The exclusion of medical‐only claims resultsin a greater focus on medical costs on lost‐time claims, which are a major cost driver in the workers’compensation system.
Exhibit EE, Sheets 1‐3 (pages 62‐64) show the derivation of the indicated claim frequency trend and the claim cost trend for both indemnity and medical losses. Since 2011, claim frequency in New York experienced a slight decrease each year except 2014, resulting in a small negative five‐year frequency trend. Claim costs continue to increase though at a lower rate than was observed last year. In this revision, consistent with the approach used in the past several filings, a five‐year exponential trend analysis was performed to derive the indicated trends. For claim frequency, the analysis resulted in an annual trend of ‐0.4%. For indemnity severity, the regression resulted in an annual trend of 4.4%. For medical severity, the five‐year exponential regression produced the indicated annual trend of 2.4%.
A wage trend analysis procedure, using both an exponential and linear regression of the latest five years of wage data from the New York State Department of Labor (DOL), was examined as part of the wage trend analysis as per the methodology used in previous years. The average weekly wages are derived directly from DOL statistics for all industries. The top section of Exhibit EE, Sheet 4 (page 65), shows the calculation of the wage trend factor produced by this methodology. However, the indicated annual wage trend of 2.3%, which is based on historical wage changes, may differ from the actual wage change during the trend period, i.e., from the experience period through the prospective policy period. Per the New York State Assembly’s 2017 Economic Report, average wage growth is expected to be 2.9% in 2017 and 3.0% in 2018. Using these projections, the average annual expected wage growth from the experience period to the prospective filing period is 2.2%.
As can be seen on Exhibit E, Sheet 1 (page 25), combining the frequency, severity and wage trends results in a combined annual trend of 1.011 or +1.1%. This overall annual trend factor represents an increase from the annual trend factor in last year’s filing. This is driven by the increase in the frequency trend and the decrease in wage trend. After projecting over the full trend period, the total proposed trend factor is 1.036, or +3.6%.
4. Loss Adjustment Expense
The indicated change in loss adjustment expense can be found on Exhibit F (page 26).
- 6 -
October 1, 2017 Loss Cost Filing Explanatory Memorandum Page 7
In this filing, similar to last year, loss adjustment expense has been determined based on paid policy year and accident year Financial Call data for Defense and Cost Containment Expense (DCCE), and on Insurance Expense Exhibit data for Adjusting and Other Expense (AOE). The utilization of Financial Call data for determining DCCE provides a stable base for measuring these expenses and is the most current data available. Ratios of paid DCCE to paid loss is an accurate measure of these costs since any variability over time in reserves for either loss or DCCE does not enter the calculation of this factor. AOE continues to be based on Insurance Expense Exhibit data since it is the only data available with which to calculate this expense. For both DCCE and AOE, the effects of the 2007 reforms on losses have been taken into account implicitly in the development factors. The historical underlying policy year and accident year indemnity losses were brought to the post‐reform benefit level through adjustment to the loss development factors, which are reported at pre‐reform levels. For AOE, ratios of indemnity to total loss were estimated for each calendar period. Similar to last year’s filing, an average of the latest three years of policy year and accident year ratios was used to determine the final DCCE provision. The use of the latest three years is considered to be responsive to the latest trends in DCCE ratios observed in both the policy year and accident year experience. For AOE, the five‐year average continues to be used for this element of loss adjustment expense. The proposed 1.161 factor for LAE represents an increase of 0.6% in this provision of the loss cost.
5. Legislative and Regulatory Changes ‐ 2017 Workers’ Compensation Reform
Part NNN of the Revenue Bill as part of the enacted 2017 New York State Budget Legislation (S.2009C/A3009C) included several workers’ compensation reforms that have cost impact on the overall loss cost level in the system. Specifically, the following reform provisions were examined by the Rating Board and were determined to have a cost impact included as part of this filing:
a. The law provides that for accidents occurring on or after the effective date of the law (April 10, 2017), temporary indemnity payments in excess of 130 weeks will be credited against the durational cap on NS‐PPD claims. To estimate the cost impact of the cap of 130 weeks on temporary benefits until NS‐PPD classification, the Rating Board has obtained information from the WCB with respect to the current average time to classification. The information received was by loss of earning capacity (“LOEC”) category in line with the duration caps as per Section 15 (3) (w) of the Workers’ Compensation Law. Information regarding the percentage of claims in each category was also received. Based on that information, the estimated cost savings for each loss of earning capacity category was calculated as the total number of weeks under the new law to the total number of weeks under the old law. Although the cap on temporary benefits to classification is 130 weeks, it was determined that, because some claims would take less than 130 weeks to reach maximum medical improvement (“MMI”) and be classified, the average time to classification would be 123 weeks. The expected savings for each LOEC category is determined as the ratio of the total number of weeks on the claim including the average number of temporary benefits after to the reform, to the total number of weeks per claim including the average number of temporary weeks prior to the reform. It was also estimated that, based on information
- 7 -
October 1, 2017 Loss Cost Filing Explanatory Memorandum Page 8
obtained from the WCB, for certain LOEC categories the average weekly benefits are different than the weekly benefits during the permanency period. Those differences were taken into account when calculating the cost impact by giving more weight to the temporary benefits when determining the total number of weeks. Based on this calculation, which is presented on Exhibit G, Sheet 2 (page 28), it was determined the expected cost impact on NS‐PPD claims is a savings of 14.7%.
Indemnity costs of NS‐PPD claims represent 40% of total permanent partial (“PP”) indemnity costs, and PP indemnity costs represent 89.8% of total indemnity costs. Therefore, it is estimated that the total impact on indemnity costs is ‐5.3% (= ‐14.7% x 40% x 89.8%). Indemnity costs represent 64% of overall system costs, and therefore, the overall system cost impact of this section of the reform is a 3.4% savings (= ‐5.3% x 64%), not including the impact of the possibility that some claimants will be able to extend the time of temporary benefits beyond 130 weeks (see below).
b. The law also provides that, based on medical evidence, the WCB may determine that MMI has
not been reached within 130 weeks, in which case the credit described above will not apply. The impact of this provision, referred to as the “safety valve”, was determined by estimating that 20% of claimants will be able to extend the time of temporary benefits beyond 130 weeks. Therefore, 20% of the estimated impact of the 130‐week cap would not be achieved, and the impact on NS‐PPD after accounting for the “safety valve” would be ‐11.8% (= ‐14.7% x 80%) and the overall system cost impact would be ‐2.7% following the same calculation as presented above. The impact of the “safety valve”, as presented on Exhibit G, Sheet 3 (page 29), is therefore +0.7% (=‐2.7%‐(‐3.4%)).
c. The reform reduces the eligibility criteria threshold to apply for an extreme hardship
redetermination from an 81% LOEC to a 76% LOEC. The impact of the extending the “safety net” to claimants with LOEC of 76% to 80% was determined by assuming the additional benefits obtained by such claimants would be, on average, 25 years. This assumption was derived by considering the average age of injury and examining life expectancy tables, since redetermination due to extreme financial hardship would entitle the claimant to lifetime benefits. For an individual claimant, the impact of redetermination would be an increase in benefits of 223%. It is expected, however, that of the total population of claimants in the 76% to 80% LOEC category, a certain percentage will settle, which would preclude them from applying for redetermination, and a certain percentage would pass away prior to becoming eligible to apply for redetermination. Of the remaining population, given the criteria established by the WCB for granting applications of extreme financial hardship, it is assumed that about a third would be found eligible and would get the benefit. After considering this information, and taking into account that those receiving such benefits would be relatively low wage earners, an assumption was made that 20% of the total population in this category would be receiving this benefit. Therefore, the impact of this change on the costs of claims in the 76% to 80% LOEC category is 44.6% (= 223% x 20%). Since claims in this category represent 9.6% of all NS‐PPD claims, this will have a 4.3% increase in costs of NS‐PPD claims (= 44.6% x 9.6%). Finally, the overall impact of this provision is derived in the same manner as described above, resulting in an overall system cost increase of +1.0%. These calculations are shown in Exhibit G, Sheet 4 (page30).
- 8 -
October 1, 2017 Loss Cost Filing Explanatory Memorandum Page 9
d. The combined impact of the above described components, i.e. the 2.5 year cap on temporary
benefits as part of an NS‐PPD claim, the safety valve, allowing claimants to extend temporary benefits beyond 2.5 years in certain circumstances, and the extension of the extreme hardship safety net provision to claimants with LOEC between 76% and 80%, is ‐1.7%. The derivation of the combined impact is shown in Exhibit G, Sheet 1 (page 27).
Other noteworthy components of the reform, are as follows: e. Subpart A of the reform eliminates the requirement that claimants demonstrate ongoing
attachment to the labor market to collect indemnity on NS‐PPD claims. Based on information obtained from the WCB, it was determined that this statutory change will have a negligible (i.e. less than 0.1%) impact on overall system costs. Any additional costs incurred due to this provision will be reflected in future loss experience.
f. Subpart I of the reform provides that certain emergency first responders (paid police officers and
firefighters, EMTs, paramedics, certified emergency medical providers, and emergency dispatchers) who encounter extraordinary stress in a work‐related emergency and file a mental injury claim, will no longer need to overcome the defense that the stress was not greater than that which usually occurs in the normal work environment. This provision is expected to have a negligible impact on overall system costs. However, certain classifications, which include employees described in this provision, may experience a cost increase. Such increases will be reflected in future loss experience for those classifications.
g. Subpart B directs the WCB to consult with representatives of labor, business, medical providers, insurance carriers, and self‐insured employers and issue revised permanency guidelines concerning medical evaluation of impairment and the determination of permanency. The revised guidelines must reflect modern medicine, be issued for public comment by September 1, 2017 and be adopted by January 1, 2018. Since the guidelines have not yet been published, the Rating Board has not determined the cost impact of this provision, and such cost impact is not reflected in the requested loss cost filing.
h. Subpart C directs the WCB to establish a prescription drug formulary by December 31, 2017. Since the formulary has not yet been published, the Rating Board has not determined the cost impact of this provision, and such cost impact is not reflected in the requested loss cost filing.
i. Section 4 of Subpart F directs the Rating Board to make a filing with the DFS requiring that the final premiums charged (i) on workers’ compensation policies with an effective date between April 10, 2017 and September 30, 2017, and (ii) on the unexpired portion of workers’ compensation policies in force after April 10, 2017 with an effective date on or after October 1, 2016, reflects the cost impact of the 2017 reform, and that differences between premiums charged and the final premium on such policies are to be settled by on or before December 31, 2018. Pursuant to this law, the Rating Board respectfully requests that the cost savings of 1.7%, as calculated above, be credited accordingly.
- 9 -
October 1, 2017 Loss Cost Filing Explanatory Memorandum Page 10 6. Legislative and Regulatory Changes – Standard Update due to Increase in Maximum Weekly Benefits
In accordance with the 2007 legislation, the maximum weekly benefit for injured workers increased to 2/3 of the statewide average weekly wage effective July 1, 2010, indexed annually on July 1 of each subsequent year to the statewide average weekly wage published by the New York Department of Labor. The determination of the loss cost impact resulting from the statutory benefit changes that raise the minimum or maximum weekly benefit continues to be based on a universally accepted actuarial methodology developed by Barney Fratello in a paper entitled “The Workmen’s Compensation Injury Table and Standard Wage Distribution Table – Their Development and Use in Workers Compensation Insurance Ratemaking”, published by the Casualty Actuarial Society. This publication, or portions thereof, has been used for over fifty years by actuaries in all jurisdictions to price the effects of changes in the maximum weekly benefit that are either proposed or enacted by their respective state legislatures. The incorporation of a state’s current statutory maximum weekly benefit, the new maximum weekly benefit, the state’s average weekly wage and the 2010 ‘Standard Actuarial Wage Distribution Table’ enable an actuary to produce an accurate estimate of the benefit cost when changes to the maximum are proposed or enacted. The actual methodology used by the Rating Board to calculate the effects of changes in the maximum weekly benefit is a Limit Factor Analysis, as set forth in Mr. Fratello’s actuarial paper. For a better understanding of the method, the following should be especially noted:
While the methodology refers to average benefits and wage levels, these are expressed in terms of ratios for use with the Wage Distribution Table and are not intended to be actual values.
The methodology only measures changes in the minimum and maximum benefits, or percentage that these benefits bear to an employee’s wages, and nothing more. It assumes that the current administrative functions within the workers’ compensation system and the level of disability or impairment of the injured workers that determines these benefits are at the current level.
The methodology also reflects potential increases in utilization of the system as a result of the increase in benefits. In other states, when large benefit changes were enacted, it was often seen that more claimants applied for the more generous benefits, which resulted in higher actual effects than the actuarial estimates were able to predict.
The determination of the overall impact in New York of increasing the maximum weekly benefits as of July 1, 2017, and then on July 1, 2018 and July 1, 2019, can be found on Exhibit GG. Exhibits GG, Sheets 1 through 3 (pages 66‐68) display the calculation of the 2017, 2018 and 2019 benefit changes, respectively. Note that it was assumed that the average weekly wage will increase by 2.9% in 2017 and 3.0% in 2018. The methodology is performed separately for each injury type [death, permanent total, permanent partial and temporary] to recognize any variation in the maximum, as a percent of wage, that is provided for by statute. Recognition has also been given to the lower wage levels of PPD
- 10 -
October 1, 2017 Loss Cost Filing Explanatory Memorandum Page 11
claimants and the manner of determining benefits that is used by the WCB for PPD cases. This is consistent with last year’s calculation. Once the indicated changes are determined by injury type, these changes are applied to a distribution of incurred losses by injury type to obtain the estimated change in total indemnity costs. A five‐year distribution of losses by injury type has been used to provide stability to this part of the analysis. The resultant indicated indemnity change is then weighted with the distribution of indemnity and medical losses based on 2015 policy year financial data to obtain an overall change. The Rating Board analysis then includes a utilization factor of 1.10 that contemplates the additional utilization of the workers’ compensation system as a result of the significantly higher benefit level. This adjustment is consistent with the utilization factor used in last year’s analysis. The increases in the maximum weekly benefit, as summarized in Exhibit G, Sheet 5 (page 31) is expected to result in a 0.7% increase in total workers’ compensation claim costs.
7. Catastrophe Provisions
In January 2015, the Terrorism Risk Insurance Program Reauthorization Act of 2015 (TRIPRA) extended the federal backstop for terrorism through December 31, 2020. The Rating Board has retained a catastrophe modeler (AIR Worldwide) to evaluate the proper level of terrorism loss costs in New York. The report issued by AIR indicated terrorism loss costs that vary by year, based on increased carrier retention levels as required by TRIPRA. Based on the information in the report, and following a payroll limitation adjustment, a loss cost of $0.045 (per $100 of payroll) was filed and approved as part of 2015’s loss cost filing. In this year’s filing, despite an increase in the carrier retention levels in 2018, no change is proposed in the terrorism loss cost provision. This is explained on Exhibit H (page 32). Also, note that no change in the loss cost provision for natural disasters and catastrophic industrial accidents is being proposed.
8. Industry Group Differentials
Industry group differentials are used to more equitably distribute the overall loss cost level change to individual employer classifications. Nine industry groups are used in this analysis and are listed below:
Food and Beverage Manufacturing Stores and Dealers‐Wholesale/Retail Chemical Manufacturing Professional and Office All Other Manufacturing Services Contracting Miscellaneous Maritime, Admiralty and Federal
- 11 -
October 1, 2017 Loss Cost Filing Explanatory Memorandum Page 12
The industry group methodology entails a compilation of the latest five years of Unit Statistical Plan data into the nine industry groups, and utilizes loss cost ratios as the basis for calculating a differential for each group relative to the statewide average (Exhibit I, Sheet 1 on page 33). In years prior to the 2012 filing, three years had been used. The change to five years was introduced in 2012 to further stabilize the industry group differentials from year to year. The underlying base is standard premium at current loss cost level and includes payroll development. This year, the methodology to bring premiums to current level is revised to use an “extension of exposures” procedure, which multiplies the reported payroll for each class on a policy by the current class loss cost, and then multiplying by the experience rating modification factor for the policy. This procedure adds precision to the prior methodology, which required premium level adjustments to reported premiums by industry group, removal of expenses, etc. Incurred losses have been developed to ultimate and are at the October 1, 2017 benefit level to be consistent with the classification pure premiums. The development of losses to ultimate and application of trend and excess factors was done in accordance with the revised methodology approved by DFS in 2015. Credibility for each industry group is based on the five‐year total number of lost‐time claims, with an industry standard of 12,000 lost‐time claims as the standard for full credibility. The credibility standard is intended to enable each industry group differential to be more representative of the actual experience of the respective industry groups.
Partial credibility for each group is determined by the formula (N/T)^1/2, where N is the five‐year total of lost‐time claims for the industry group and T is 12,000 lost‐time claims. The complement of credibility is the loss ratio for all groups combined. Indicated differentials are calculated by relating each credibility‐weighted industry group’s loss ratio to the overall total loss ratio. As in past revisions, an additional refinement to the indicated differential is included which recognizes different wage trends by industry group on Exhibit I, Sheet 2 (page 34). The final differentials will be applied as part of the process which calculates loss costs from class pure premiums. The use of relativities by industry group provides a more refined and equitable distribution of the overall loss cost level to each class. To ensure overall balance, after the differentials are applied in the determination of class loss costs, a test of loss costs will become the final step in the process.
9. Classification Pure Premiums
Classification pure premiums are based on the experience of all carriers for the five policy years 2010 ‐ 2014, excluding the experience of self‐rated risks. In addition, losses over $500,000 per claim are excluded from the pure premium development. Consistent with past revisions, five years of experience are used to determine the proposed pure premiums for all classes, irrespective of credibility. The classification experience was calculated in accordance with the revised methodology approved by DFS in 2015.
Complete details with respect to the classification experience are contained in a separate document that will be provided to DFS separately.
- 12 -
October 1, 2017 Loss Cost Filing Explanatory Memorandum Page 13 10. Changes in Loss Cost by Classification and Industry Group
A table showing the percentage change in loss cost level for each classification and industry group and the number of classifications for which loss costs are to be increased or decreased, as well as those to which no change will be applicable, will be provided upon approval. Loss cost changes for each classification will be limited to +/‐ 25% from the calculated industry group change to minimize the swings in loss cost level by class while still maintaining a proper relativity structure.
11. Total Change
The above analyses result in an indicated manual loss cost level change of ‐4.6%. When combined with no change in the loss cost provisions for terrorism, natural disasters, and catastrophic industrial accidents, an overall change of ‐4.5% is proposed.
12. Effective Date
It is proposed that the filed loss costs and related rating values, after approval by DFS, become effective on October 1, 2017 for new and renewal business. As indicated in item 5‐i above, it is proposed that an outstanding change of ‐1.7% will be applied to policies with effective dates between April 10, 2017 and September 30, 2017, and on the unexpired portion as of April 10, 2017, of policies effective between October 1, 2016 and April 9, 2017.
- 13 -
New York Workers Compensation
2017 Loss Cost Revision
List of Exhibits
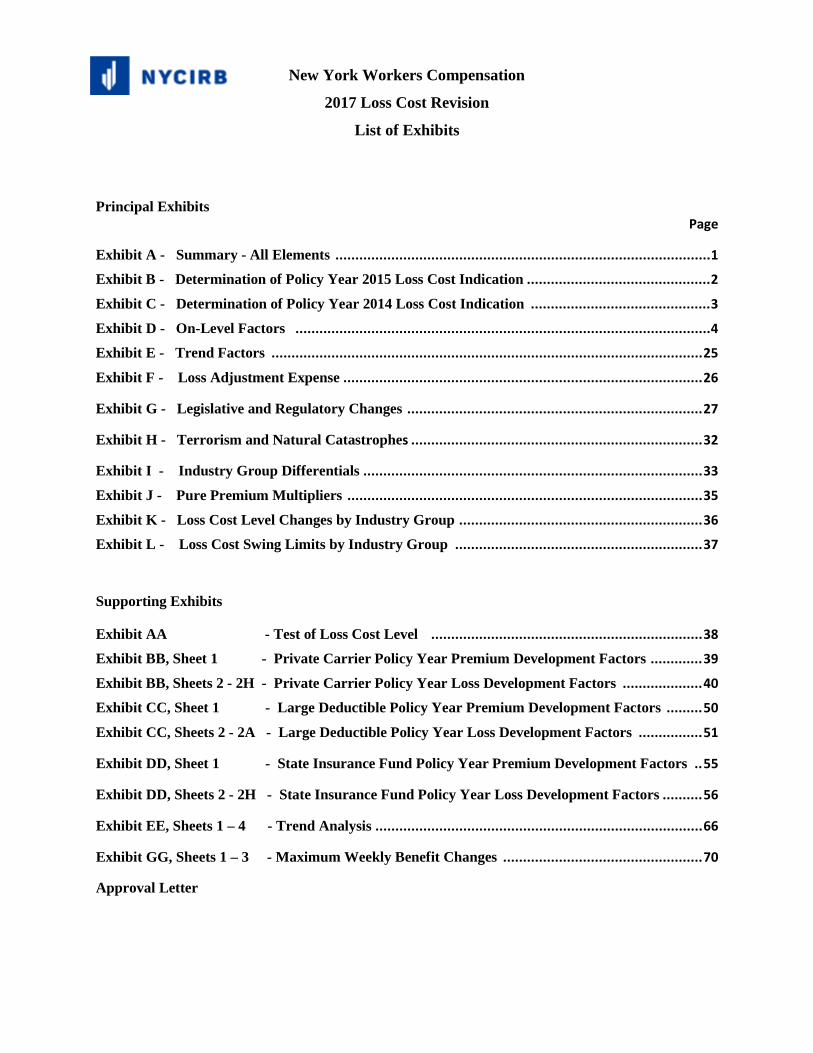
Principal Exhibits
Page
Exhibit A - Summary - All Elements .............................................................................................. 1
Exhibit B - Determination of Policy Year 2015 Loss Cost Indication .............................................. 2
Exhibit C - Determination of Policy Year 2014 Loss Cost Indication ............................................. 3
Exhibit D - On-Level Factors ........................................................................................................ 4
Exhibit E - Trend Factors ............................................................................................................ 25
Exhibit F - Loss Adjustment Expense .......................................................................................... 26
Exhibit G - Legislative and Regulatory Changes .......................................................................... 27
Exhibit H - Terrorism and Natural Catastrophes ......................................................................... 32
Exhibit I - Industry Group Differentials ..................................................................................... 33
Exhibit J - Pure Premium Multipliers ......................................................................................... 35
Exhibit K - Loss Cost Level Changes by Industry Group ............................................................. 36
Exhibit L - Loss Cost Swing Limits by Industry Group .............................................................. 37
Supporting Exhibits
Exhibit AA - Test of Loss Cost Level .................................................................... 38
Exhibit BB, Sheet 1 - Private Carrier Policy Year Premium Development Factors ............. 39
Exhibit BB, Sheets 2 - 2H - Private Carrier Policy Year Loss Development Factors .................... 40
Exhibit CC, Sheet 1 - Large Deductible Policy Year Premium Development Factors ......... 50
Exhibit CC, Sheets 2 - 2A - Large Deductible Policy Year Loss Development Factors ................ 51
Exhibit DD, Sheet 1 - State Insurance Fund Policy Year Premium Development Factors .. 55
Exhibit DD, Sheets 2 - 2H - State Insurance Fund Policy Year Loss Development Factors .......... 56
Exhibit EE, Sheets 1 – 4 - Trend Analysis .................................................................................. 66
Exhibit GG, Sheets 1 – 3 - Maximum Weekly Benefit Changes .................................................. 70
Approval Letter
October 2017 RevisionExhibit A
2 Policy Years
0.919
0.931
0.925
1.036
1.006
0.964
1. Loss Cost Change Indicated by Policy Year 2015 Experience (Exhibit B)
2. Loss Cost Change Indicated by Policy Year 2014 Experience (Exhibit C)
3. Average Loss Cost Change Indicated by Experience [(1)+(2)] / 2
4. Projected Change in Loss Costs (Exhibit E)
5. Change in Loss Adjustment Expenses (Exhibit F)
6. Indicated Change in Loss Costs Based on Experience[(3) x (4) x (5)]
7. 2017 NY WC Reform Impacts (Exhibit G, Sheet 1 - 4) 0.983
8. 1.007
9 0.954
Legislative Changes (Exhibit G, Sheet 5)
Indicated Total Loss Cost Change[(6) x (7) x (8)]
1.000
0.021
1.000
0.005
0.955
10. Change in Terrorism Provision (Exhibit H)
11. Terrorism Provision Loss Cost as Percent of Total Loss Costs
12. Change in Provision for Natural Disasters and Industrial Cats. (Exhibit H)
13. Natural Disasters and Industrial Cats. Provision Loss Cost as Percent of Total Loss Costs
14. Total Proposed Premium Level Change[(9) x (1.0 - (11) - (13)) + (10) x (11) + (12) x (13)]
WORKERS' COMPENSATION - NEW YORK
GENERAL LOSS COST REVISION - OCTOBER 1, 2017
SUMMARY - ALL ELEMENTS
Page 1
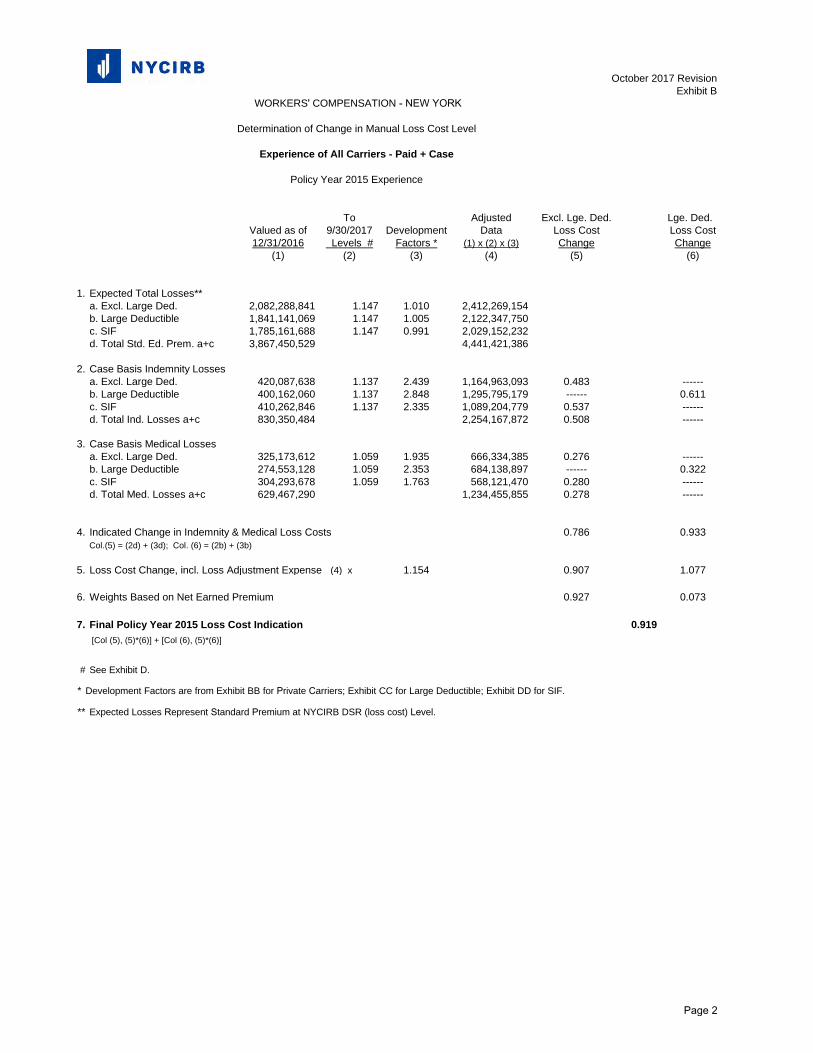
October 2017 RevisionExhibit B
To Adjusted Excl. Lge. Ded. Lge. Ded.Valued as of 9/30/2017 Development Data Loss Cost Loss Cost12/31/2016 Levels # Factors * (1) x (2) x (3) Change Change
(1) (2) (3) (4) (5) (6)
1. Expected Total Losses**a. Excl. Large Ded. 2,082,288,841 1.147 1.010 2,412,269,154b. Large Deductible 1,841,141,069 1.147 1.005 2,122,347,750c. SIF 1,785,161,688 1.147 0.991 2,029,152,232d. Total Std. Ed. Prem. a+c 3,867,450,529 4,441,421,386
2. Case Basis Indemnity Lossesa. Excl. Large Ded. 420,087,638 1.137 2.439 1,164,963,093 0.483 ------b. Large Deductible 400,162,060 1.137 2.848 1,295,795,179 ------ 0.611c. SIF 410,262,846 1.137 2.335 1,089,204,779 0.537 ------d. Total Ind. Losses a+c 830,350,484 2,254,167,872 0.508 ------
3. Case Basis Medical Lossesa. Excl. Large Ded. 325,173,612 1.059 1.935 666,334,385 0.276 ------b. Large Deductible 274,553,128 1.059 2.353 684,138,897 ------ 0.322c. SIF 304,293,678 1.059 1.763 568,121,470 0.280 ------d. Total Med. Losses a+c 629,467,290 1,234,455,855 0.278 ------
4. Indicated Change in Indemnity & Medical Loss Costs 0.786 0.933Col.(5) = (2d) + (3d); Col. (6) = (2b) + (3b)
5. Loss Cost Change, incl. Loss Adjustment Expense (4) x 1.154 0.907 1.077
6. Weights Based on Net Earned Premium 0.927 0.073
7. Final Policy Year 2015 Loss Cost Indication 0.919 [Col (5), (5)*(6)] + [Col (6), (5)*(6)]
# See Exhibit D.
* Development Factors are from Exhibit BB for Private Carriers; Exhibit CC for Large Deductible; Exhibit DD for SIF.
** Expected Losses Represent Standard Premium at NYCIRB DSR (loss cost) Level.
WORKERS' COMPENSATION - NEW YORK
Determination of Change in Manual Loss Cost Level
Experience of All Carriers - Paid + Case
Policy Year 2015 Experience
Page 2
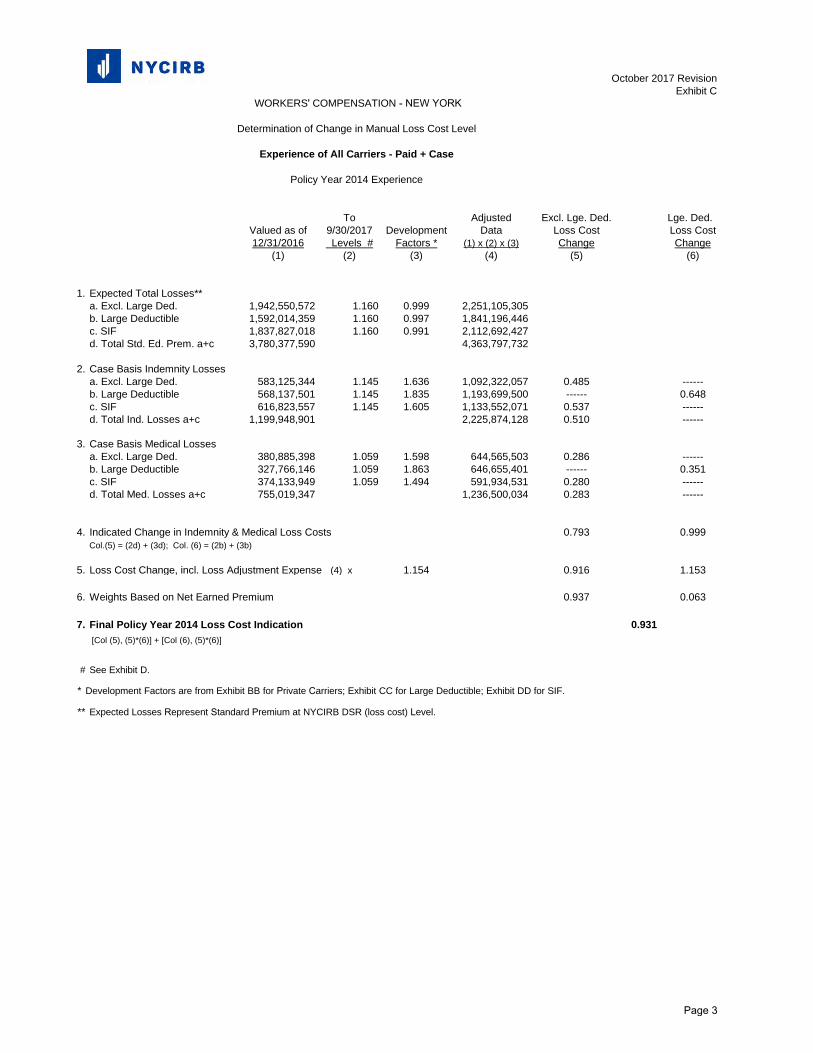
October 2017 RevisionExhibit C
To Adjusted Excl. Lge. Ded. Lge. Ded.Valued as of 9/30/2017 Development Data Loss Cost Loss Cost12/31/2016 Levels # Factors * (1) x (2) x (3) Change Change
(1) (2) (3) (4) (5) (6)
1. Expected Total Losses**a. Excl. Large Ded. 1,942,550,572 1.160 0.999 2,251,105,305b. Large Deductible 1,592,014,359 1.160 0.997 1,841,196,446c. SIF 1,837,827,018 1.160 0.991 2,112,692,427d. Total Std. Ed. Prem. a+c 3,780,377,590 4,363,797,732
2. Case Basis Indemnity Lossesa. Excl. Large Ded. 583,125,344 1.145 1.636 1,092,322,057 0.485 ------b. Large Deductible 568,137,501 1.145 1.835 1,193,699,500 ------ 0.648c. SIF 616,823,557 1.145 1.605 1,133,552,071 0.537 ------d. Total Ind. Losses a+c 1,199,948,901 2,225,874,128 0.510 ------
3. Case Basis Medical Lossesa. Excl. Large Ded. 380,885,398 1.059 1.598 644,565,503 0.286 ------b. Large Deductible 327,766,146 1.059 1.863 646,655,401 ------ 0.351c. SIF 374,133,949 1.059 1.494 591,934,531 0.280 ------d. Total Med. Losses a+c 755,019,347 1,236,500,034 0.283 ------
4. Indicated Change in Indemnity & Medical Loss Costs 0.793 0.999Col.(5) = (2d) + (3d); Col. (6) = (2b) + (3b)
5. Loss Cost Change, incl. Loss Adjustment Expense (4) x 1.154 0.916 1.153
6. Weights Based on Net Earned Premium 0.937 0.063
7. Final Policy Year 2014 Loss Cost Indication 0.931 [Col (5), (5)*(6)] + [Col (6), (5)*(6)]
# See Exhibit D.
* Development Factors are from Exhibit BB for Private Carriers; Exhibit CC for Large Deductible; Exhibit DD for SIF.
** Expected Losses Represent Standard Premium at NYCIRB DSR (loss cost) Level.
WORKERS' COMPENSATION - NEW YORK
Determination of Change in Manual Loss Cost Level
Experience of All Carriers - Paid + Case
Policy Year 2014 Experience
Page 3
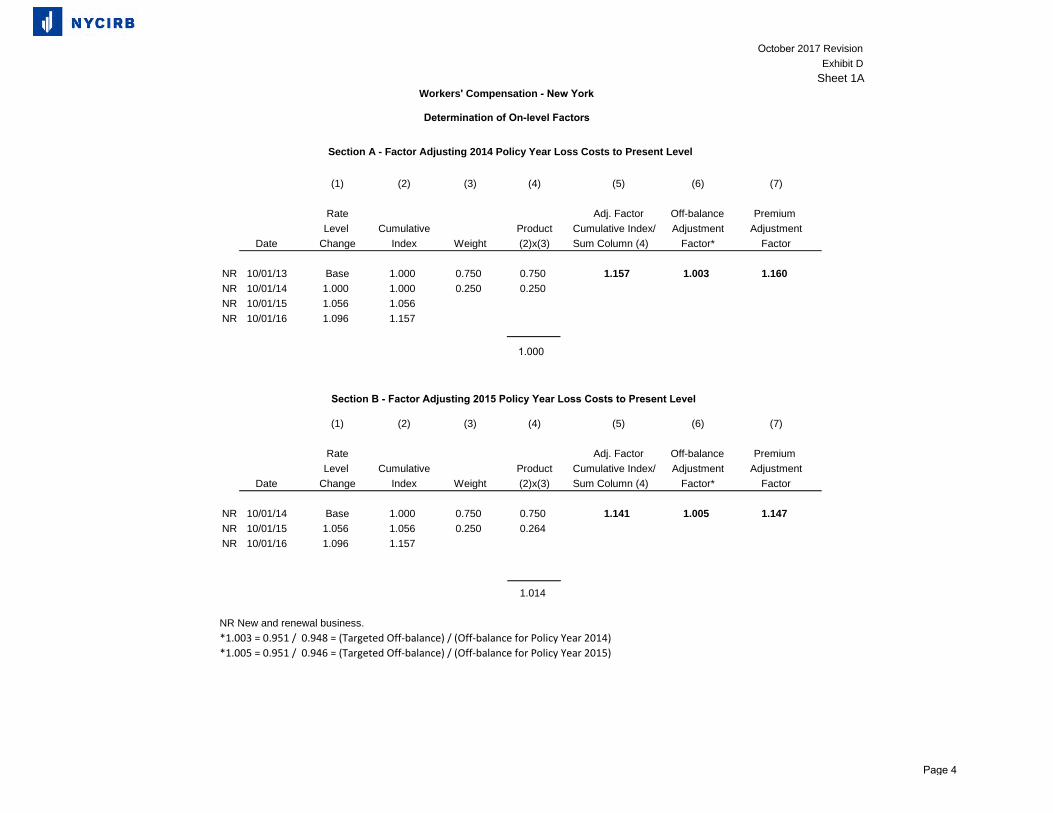
October 2017 RevisionExhibit D
Sheet 1A
(1) (2) (3) (4) (5) (6) (7)
Rate Adj. Factor Off-balance Premium Level Cumulative Product Cumulative Index/ Adjustment Adjustment
Date Change Index Weight (2)x(3) Sum Column (4) Factor* Factor
NR 10/01/13 Base 1.000 0.750 0.750 1.157 1.003 1.160NR 10/01/14 1.000 1.000 0.250 0.250NR 10/01/15 1.056 1.056 0.000NR 10/01/16 1.096 1.157
(1) (2) (3) (4) (5) (6) (7)
Rate Adj. Factor Off-balance Premium Level Cumulative Product Cumulative Index/ Adjustment Adjustment
Date Change Index Weight (2)x(3) Sum Column (4) Factor* Factor
NR 10/01/14 Base 1.000 0.750 0.750 1.141 1.005 1.147NR 10/01/15 1.056 1.056 0.250 0.264NR 10/01/16 1.096 1.157 0.000 0.000
1.014
NR New and renewal business.*1.003 = 0.951 / 0.948 = (Targeted Off-balance) / (Off-balance for Policy Year 2014)*1.005 = 0.951 / 0.946 = (Targeted Off-balance) / (Off-balance for Policy Year 2015)
Workers' Compensation - New York
Section A - Factor Adjusting 2014 Policy Year Loss Costs to Present Level
Determination of On-level Factors
Section B - Factor Adjusting 2015 Policy Year Loss Costs to Present Level
1.000
Page 4
October 2017 Revision
Exhibit D
Sheet 1B
(1) (2) (3) (4) (5)
Average Average Average WeightedIntrastate Interstate Merit Rating Average Targeted
(6)= (5)/(4)
Policy Year Off-balance
Rating Year Mod Mod Factor Off-balance Off-balance* Adjustment Factor
2011 0.946 0.885 0.934 0.937 0.951 1.0152012 0.952 0.872 0.933 0.936 0.951 1.0162013 0.959 0.868 0.933 0.939 0.951 1.0132014 0.978 0.868 0.936 0.948 0.951 1.0032015 0.970 0.871 0.934 0.946 0.951 1.005
* Based on a target intrastate mod of 0.975 and expected results for the average interstate mod,merit rating factor and weights for each category.
Workers' Compensation - New York
Determination of On-level Factors
Section B1 - Experience Rating Off-Balance Adjustment Factor
Page 5
October 2017 RevisionExhibit DSheet 2
Workers' Compensation - New York
Determination of On-level Factors
Section C - Factor Adjusting 2014 Policy Year Indemnity Losses to Present Benefit Level
(1) (2) (3) (4) (5)
Benefit Adj. FactorLevel Cumulative Product Cumulative Index/
Date Change Index Weight (2)x(3) Sum Column (4)
07/01/13 Base 1.000 0.123 0.123 1.01107/01/14 1.0022 1.002 0.750 0.75207/01/15 1.0077 1.010 0.127 0.12807/01/16 1.0044 1.014 0.000 0.000
1.003
Adjustment Factors*Special Disability Fund 1.147Re-opened Case Fund 1.057
Duration Caps 0.934Adjusted Loss On-level Factor 1.145
Section D - Factor Adjusting 2015 Policy Year Indemnity Losses to Present Benefit Level
(1) (2) (3) (4) (5)
Benefit Adj. FactorLevel Cumulative Product Cumulative Index/
Date Change Index Weight (2)x(3) Sum Column (4)
07/01/14 Base 1.000 0.123 0.123 1.00407/01/15 1.0077 1.008 0.750 0.75607/01/16 1.0044 1.012 0.127 0.129
1.008
Adjustment Factors*Special Disability Fund 1.147Re-opened Case Fund 1.057
Duration Caps 0.934Adjusted Loss On-level Factor 1.137
* Reform adjustment factors are intended to adjust losses to benefit level changes that arenot yet reflected in development factors.
Page 6
October 2017 RevisionExhibit DSheet 3
Workers' Compensation - New York
Determination of On-level Factors
Section E - Factor Adjusting 2014 Policy Year Medical Losses to Present Benefit Level
(1) (2) (3) (4) (5)
Benefit Adj. FactorLevel Cumulative Product Cumulative Index/
Date Change Index Weight (2)x(3) Sum Column (4)
12/01/10 Base 1.000 1.000 1.000 1.000
1.000
Adjustment Factors*Re-opened Case Fund 1.059
Adjusted Loss On-level Factor 1.059
Section F - Factor Adjusting 2015 Policy Year Medical Losses to Present Benefit Level
(1) (2) (3) (4) (5)
Benefit Adj. FactorLevel Cumulative Product Cumulative Index/
Date Change Index Weight (2)x(3) Sum Column (4)
12/01/10 Base 1.000 1.000 1.000 1.000
1.000
Adjustment Factors*Re-opened Case Fund 1.059
Adjusted Loss On-level Factor 1.059
* Reform adjustment factors are intended to adjusted losses to benefit level changes that arenot yet reflected in development factors.
Page 7
October 2017 Revision
Exhibit D
Sheet 4
Paid + Case 1st to 20th 20th to Ult 1st to Ult Total Full Year % of Year Total
Original Restated Adjustment Original Restated Adjustment Adjustment Adjustment Impacted Adjustment
PY 08 PC 2.367 2.269 0.959 1.032 1.014 0.983 0.943 -5.7% 100% -5.7% 60%
SIF 2.180 2.081 0.955 1.070 1.032 0.964 0.921 -7.9% 100% -7.9% 40%
Total -6.6%
0.934
Restating the LDFs for Duration Cap: Example
(1) Original factor: Private Carriers: PY 2005 6th to 7th link ratio 1.027
(2) Development portion 0.027
(3) % of Non Sched out of total PPD 66.7%
(4) % of PPD out of total indemnity 86.6%
(5) % Non Scheduled out of indemnity (3)x(4) 57.7%
(6) Development portion that is NSPPD (2)x(5) 0.016
(7) Development portion that is other than NSPPD (2)-(6) 0.011
(8) % of cases effected by limited duration* 40%
(9) Restated NSPPD development portion (6) x [1-(8)] 0.009
(10) Restated total development 1+(9)+(7) 1.021
* Row (8) assumes at this point in the development, 40% of cases are now limited, whereas before they were still developing. 60% of the cases are still
developing at this point in the triangle, even after the reform, as they still haven't reached the maximum duration. These assumed percentages can be
found on the top of each column of the "restated" triangles. The percentages are based on a distribution of severities obtained from the WCB.
Development: Duration Cap Reform Adjustment Summary
Page 8
October 2017 Revision66.7% Non Sched out of PPD Exhibit D
86.56% PPD out of Indemnity Private Carriers: Policy Year Indemnity Paid + Case Development Sheet 557.72% % Impacted
ORIGINAL TRIANGLEPY 1-2 2-3 3-4 4-5 5-6 6-7 7-8 8-9 9-10 10-11 11-12 12-13 13-14 14-15 15-16 16-17 17-18 18-19 19-20 20-ULT
1992 1.004 1.0321993 1.002 1.003 1.0321994 1.004 1.005 1.004 1.0321995 1.004 1.004 1.003 1.005 1.0321996 1.005 1.004 1.002 1.003 1.001 1.0321997 1.005 1.004 1.001 1.004 1.0041998 1.002 1.004 1.004 1.003 1.0051999 1.007 1.003 1.006 1.004 1.0022000 1.007 1.005 1.008 1.002 1.0012001 1.018 1.004 1.008 1.002 1.0022002 1.020 1.017 1.009 1.007 1.0042003 1.024 1.012 1.013 1.006 1.0062004 1.022 1.025 1.012 1.006 0.9942005 1.027 1.025 1.013 1.008 1.0062006 1.068 1.028 1.017 1.008 1.0042007 1.050 1.044 1.011 1.019 1.0072008 1.114 1.047 1.025 1.034 1.0032009 1.200 1.116 1.037 1.024 1.0062010 1.509 1.220 1.093 1.040 1.0132011 1.512 1.207 1.092 1.0652012 1.493 1.189 1.0582013 1.495 1.1652014 1.448
5 Year Average 1.491 1.196 1.095 1.048 1.035 1.021 1.017 1.015 1.011 1.012 1.004 1.007 1.004 1.004 1.004 1.003 1.004 1.003 1.003 1.032
RESTATED TRIANGLE POST DURATION CAP ADJUSTMENTPY 1-2 2-3 3-4 4-5 5-6 6-7 7-8 8-9 9-10 10-11 11-12 12-13 13-14 14-15 15-16 16-17 17-18 18-19 19-20 20-ULT
% Cases affected 0 2 5 15 25 40 55 70 75 80 85 90 95 95 95 95 95 95 95 951992 1.002 1.0141993 1.001 1.001 1.0141994 1.002 1.002 1.002 1.0141995 1.002 1.002 1.001 1.002 1.0141996 1.002 1.002 1.001 1.001 1.000 1.0141997 1.002 1.002 1.000 1.002 1.0021998 1.001 1.002 1.002 1.001 1.0021999 1.003 1.001 1.003 1.002 1.0012000 1.004 1.002 1.004 1.001 1.0002001 1.010 1.002 1.004 1.001 1.0012002 1.011 1.009 1.005 1.003 1.0022003 1.014 1.007 1.007 1.003 1.0032004 1.015 1.015 1.007 1.003 0.9972005 1.021 1.017 1.008 1.005 1.0032006 1.061 1.024 1.013 1.006 1.0032007 1.050 1.044 1.011 1.019 1.0072008 1.114 1.047 1.025 1.034 1.0032009 1.200 1.116 1.037 1.024 1.0062010 1.509 1.220 1.093 1.040 1.0132011 1.512 1.207 1.092 1.0652012 1.493 1.189 1.0582013 1.495 1.1652014 1.448
5 Year Average 1.491 1.196 1.095 1.048 1.033 1.019 1.013 1.010 1.007 1.006 1.002 1.003 1.002 1.002 1.002 1.001 1.002 1.001 1.001 1.014
Original 1st to 20th 2.367 Original 20th to Ult 1.032 Total Dev Adjustment 0.943Restated 1st to 20th 2.269 Restated 20th to Ult 1.014 or -5.7%
Adjustment 0.959 Adjustment 0.983Page 9
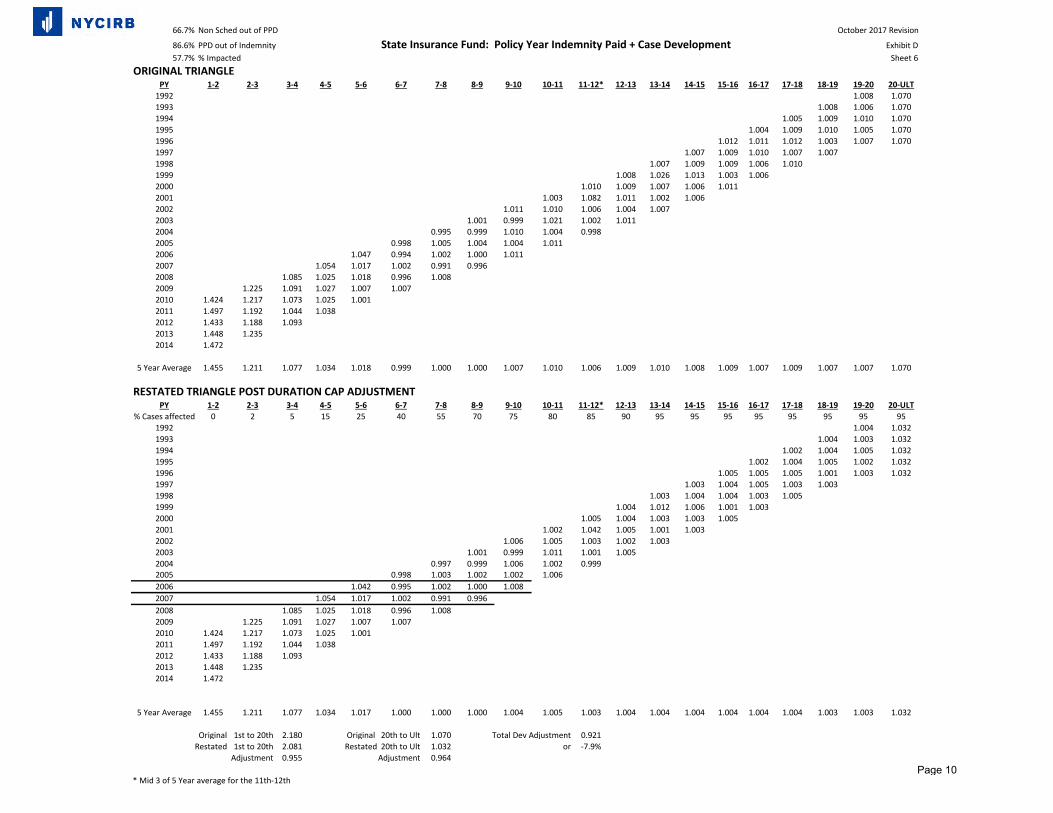
66.7% Non Sched out of PPD October 2017 Revision
86.6% PPD out of Indemnity State Insurance Fund: Policy Year Indemnity Paid + Case Development Exhibit D57.7% % Impacted Sheet 6
ORIGINAL TRIANGLEPY 1-2 2-3 3-4 4-5 5-6 6-7 7-8 8-9 9-10 10-11 11-12* 12-13 13-14 14-15 15-16 16-17 17-18 18-19 19-20 20-ULT
1992 1.008 1.0701993 1.008 1.006 1.0701994 1.005 1.009 1.010 1.0701995 1.004 1.009 1.010 1.005 1.0701996 1.012 1.011 1.012 1.003 1.007 1.0701997 1.007 1.009 1.010 1.007 1.0071998 1.007 1.009 1.009 1.006 1.0101999 1.008 1.026 1.013 1.003 1.0062000 1.010 1.009 1.007 1.006 1.0112001 1.003 1.082 1.011 1.002 1.0062002 1.011 1.010 1.006 1.004 1.0072003 1.001 0.999 1.021 1.002 1.0112004 0.995 0.999 1.010 1.004 0.9982005 0.998 1.005 1.004 1.004 1.0112006 1.047 0.994 1.002 1.000 1.0112007 1.054 1.017 1.002 0.991 0.9962008 1.085 1.025 1.018 0.996 1.0082009 1.225 1.091 1.027 1.007 1.0072010 1.424 1.217 1.073 1.025 1.0012011 1.497 1.192 1.044 1.0382012 1.433 1.188 1.0932013 1.448 1.2352014 1.472
5 Year Average 1.455 1.211 1.077 1.034 1.018 0.999 1.000 1.000 1.007 1.010 1.006 1.009 1.010 1.008 1.009 1.007 1.009 1.007 1.007 1.070
RESTATED TRIANGLE POST DURATION CAP ADJUSTMENTPY 1-2 2-3 3-4 4-5 5-6 6-7 7-8 8-9 9-10 10-11 11-12* 12-13 13-14 14-15 15-16 16-17 17-18 18-19 19-20 20-ULT
% Cases affected 0 2 5 15 25 40 55 70 75 80 85 90 95 95 95 95 95 95 95 951992 1.004 1.0321993 1.004 1.003 1.0321994 1.002 1.004 1.005 1.0321995 1.002 1.004 1.005 1.002 1.0321996 1.005 1.005 1.005 1.001 1.003 1.0321997 1.003 1.004 1.005 1.003 1.0031998 1.003 1.004 1.004 1.003 1.0051999 1.004 1.012 1.006 1.001 1.0032000 1.005 1.004 1.003 1.003 1.0052001 1.002 1.042 1.005 1.001 1.0032002 1.006 1.005 1.003 1.002 1.0032003 1.001 0.999 1.011 1.001 1.0052004 0.997 0.999 1.006 1.002 0.9992005 0.998 1.003 1.002 1.002 1.0062006 1.042 0.995 1.002 1.000 1.0082007 1.054 1.017 1.002 0.991 0.9962008 1.085 1.025 1.018 0.996 1.0082009 1.225 1.091 1.027 1.007 1.0072010 1.424 1.217 1.073 1.025 1.0012011 1.497 1.192 1.044 1.0382012 1.433 1.188 1.0932013 1.448 1.2352014 1.472
5 Year Average 1.455 1.211 1.077 1.034 1.017 1.000 1.000 1.000 1.004 1.005 1.003 1.004 1.004 1.004 1.004 1.004 1.004 1.003 1.003 1.032
Original 1st to 20th 2.180 Original 20th to Ult 1.070 Total Dev Adjustment 0.921Restated 1st to 20th 2.081 Restated 20th to Ult 1.032 or -7.9%
Adjustment 0.955 Adjustment 0.964
* Mid 3 of 5 Year average for the 11th-12thPage 10
October 2017 RevisionExhibit D
Sheet 7
Weight SDF ImpactPrivate Carriers (see Exhibit D, Sheet 9) 60% (a) 14.9% (c)State Insurance Fund (see Exhibit D, Sheet 11) 40% (b) 14.4% (d)Totals SDF Impact = (a)x(c) + (b)x(d) 14.7%
27,102470,253
1) Total SDF Claims Accepted (Private Carriers + SIF)*2) Total Workers' Compensation Indemnity Claims **3) Percentage of Claims Assumed to be in the SDF = (1)/(2) 5.8%
*Data Based on Accident Years 1998-2005 from Special Funds Conservative Committee**Data Based on Accident Years 1998-2005 from New York Financial Call Information System
Derivation of Special Disability Fund Adjustment
Percentage of Claims Accepted by the Special Disability Fund
Page 11
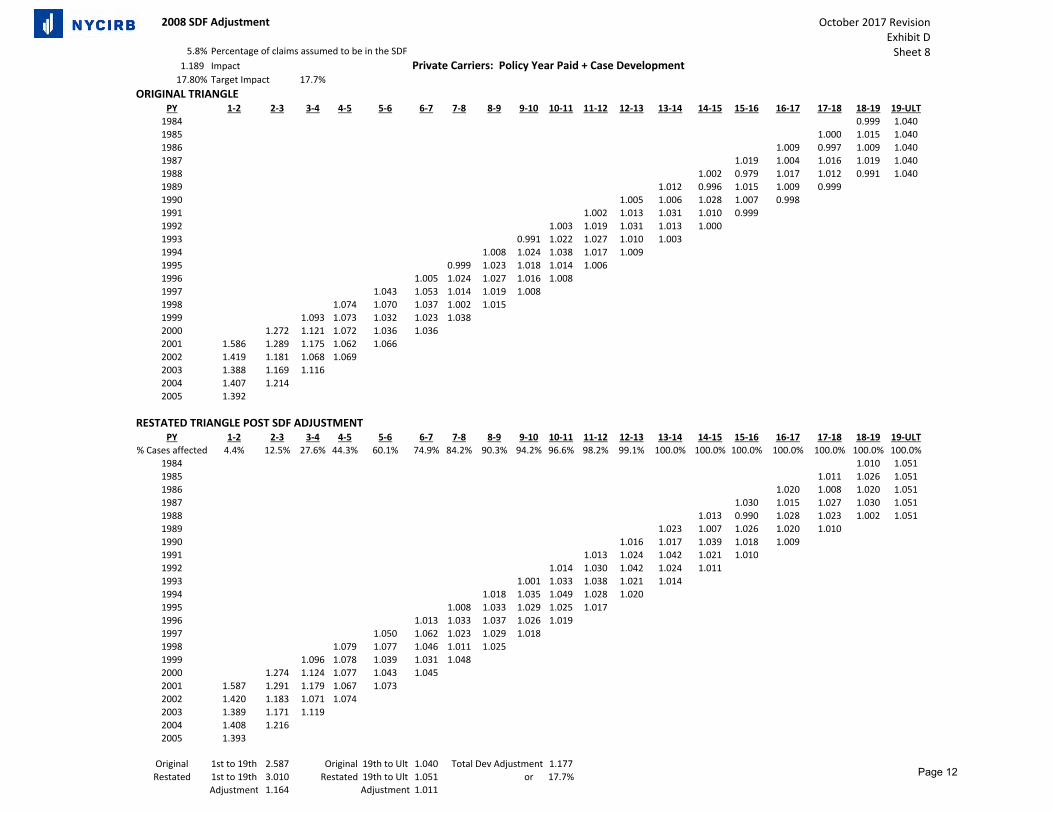
2008 SDF Adjustment October 2017 RevisionExhibit DSheet 85.8% Percentage of claims assumed to be in the SDF
1.189 Impact Private Carriers: Policy Year Paid + Case Development17.80% Target Impact 17.7%
ORIGINAL TRIANGLEPY 1‐2 2‐3 3‐4 4‐5 5‐6 6‐7 7‐8 8‐9 9‐10 10‐11 11‐12 12‐13 13‐14 14‐15 15‐16 16‐17 17‐18 18‐19 19‐ULT1984 0.999 1.0401985 1.000 1.015 1.0401986 1.009 0.997 1.009 1.0401987 1.019 1.004 1.016 1.019 1.0401988 1.002 0.979 1.017 1.012 0.991 1.0401989 1.012 0.996 1.015 1.009 0.9991990 1.005 1.006 1.028 1.007 0.9981991 1.002 1.013 1.031 1.010 0.9991992 1.003 1.019 1.031 1.013 1.0001993 0.991 1.022 1.027 1.010 1.0031994 1.008 1.024 1.038 1.017 1.0091995 0.999 1.023 1.018 1.014 1.0061996 1.005 1.024 1.027 1.016 1.0081997 1.043 1.053 1.014 1.019 1.0081998 1.074 1.070 1.037 1.002 1.0151999 1.093 1.073 1.032 1.023 1.0382000 1.272 1.121 1.072 1.036 1.0362001 1.586 1.289 1.175 1.062 1.0662002 1.419 1.181 1.068 1.0692003 1.388 1.169 1.1162004 1.407 1.2142005 1.392
RESTATED TRIANGLE POST SDF ADJUSTMENTPY 1‐2 2‐3 3‐4 4‐5 5‐6 6‐7 7‐8 8‐9 9‐10 10‐11 11‐12 12‐13 13‐14 14‐15 15‐16 16‐17 17‐18 18‐19 19‐ULT
% Cases affected 4.4% 12.5% 27.6% 44.3% 60.1% 74.9% 84.2% 90.3% 94.2% 96.6% 98.2% 99.1% 100.0% 100.0% 100.0% 100.0% 100.0% 100.0% 100.0%1984 1.010 1.0511985 1.011 1.026 1.0511986 1.020 1.008 1.020 1.0511987 1.030 1.015 1.027 1.030 1.0511988 1.013 0.990 1.028 1.023 1.002 1.0511989 1.023 1.007 1.026 1.020 1.0101990 1.016 1.017 1.039 1.018 1.0091991 1.013 1.024 1.042 1.021 1.0101992 1.014 1.030 1.042 1.024 1.0111993 1.001 1.033 1.038 1.021 1.0141994 1.018 1.035 1.049 1.028 1.0201995 1.008 1.033 1.029 1.025 1.0171996 1.013 1.033 1.037 1.026 1.0191997 1.050 1.062 1.023 1.029 1.0181998 1.079 1.077 1.046 1.011 1.0251999 1.096 1.078 1.039 1.031 1.0482000 1.274 1.124 1.077 1.043 1.0452001 1.587 1.291 1.179 1.067 1.0732002 1.420 1.183 1.071 1.0742003 1.389 1.171 1.1192004 1.408 1.2162005 1.393
Original 1st to 19th 2.587 Original 19th to Ult 1.040 Total Dev Adjustment 1.177Restated 1st to 19th 3.010 Restated 19th to Ult 1.051 or 17.7%
Adjustment 1.164 Adjustment 1.011
Page 12
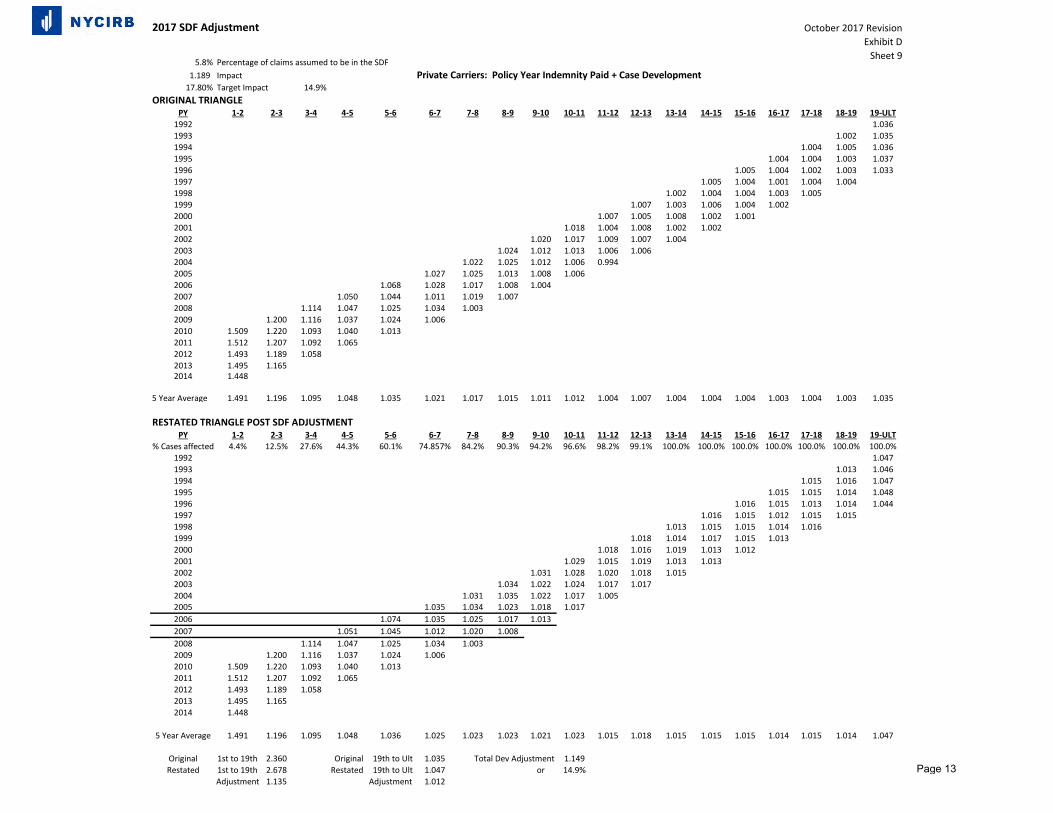
2017 SDF Adjustment October 2017 Revision
Exhibit DSheet 9
5.8% Percentage of claims assumed to be in the SDF1.189 Impact Private Carriers: Policy Year Indemnity Paid + Case Development Exhibit D
17.80% Target Impact 14.9% Sheet 9ORIGINAL TRIANGLE
PY 1-2 2-3 3-4 4-5 5-6 6-7 7-8 8-9 9-10 10-11 11-12 12-13 13-14 14-15 15-16 16-17 17-18 18-19 19-ULT1992 1.0361993 1.002 1.0351994 1.004 1.005 1.0361995 1.004 1.004 1.003 1.0371996 1.005 1.004 1.002 1.003 1.0331997 1.005 1.004 1.001 1.004 1.0041998 1.002 1.004 1.004 1.003 1.0051999 1.007 1.003 1.006 1.004 1.0022000 1.007 1.005 1.008 1.002 1.0012001 1.018 1.004 1.008 1.002 1.0022002 1.020 1.017 1.009 1.007 1.0042003 1.024 1.012 1.013 1.006 1.0062004 1.022 1.025 1.012 1.006 0.9942005 1.027 1.025 1.013 1.008 1.0062006 1.068 1.028 1.017 1.008 1.0042007 1.050 1.044 1.011 1.019 1.0072008 1.114 1.047 1.025 1.034 1.0032009 1.200 1.116 1.037 1.024 1.0062010 1.509 1.220 1.093 1.040 1.0132011 1.512 1.207 1.092 1.0652012 1.493 1.189 1.0582013 1.495 1.1652014 1.448
5 Year Average 1.491 1.196 1.095 1.048 1.035 1.021 1.017 1.015 1.011 1.012 1.004 1.007 1.004 1.004 1.004 1.003 1.004 1.003 1.035
RESTATED TRIANGLE POST SDF ADJUSTMENTPY 1-2 2-3 3-4 4-5 5-6 6-7 7-8 8-9 9-10 10-11 11-12 12-13 13-14 14-15 15-16 16-17 17-18 18-19 19-ULT
% Cases affected 4.4% 12.5% 27.6% 44.3% 60.1% 74.857% 84.2% 90.3% 94.2% 96.6% 98.2% 99.1% 100.0% 100.0% 100.0% 100.0% 100.0% 100.0% 100.0%1992 1.0471993 1.013 1.0461994 1.015 1.016 1.0471995 1.015 1.015 1.014 1.0481996 1.016 1.015 1.013 1.014 1.0441997 1.016 1.015 1.012 1.015 1.0151998 1.013 1.015 1.015 1.014 1.0161999 1.018 1.014 1.017 1.015 1.0132000 1.018 1.016 1.019 1.013 1.0122001 1.029 1.015 1.019 1.013 1.0132002 1.031 1.028 1.020 1.018 1.0152003 1.034 1.022 1.024 1.017 1.0172004 1.031 1.035 1.022 1.017 1.0052005 1.035 1.034 1.023 1.018 1.0172006 1.074 1.035 1.025 1.017 1.0132007 1.051 1.045 1.012 1.020 1.0082008 1.114 1.047 1.025 1.034 1.0032009 1.200 1.116 1.037 1.024 1.0062010 1.509 1.220 1.093 1.040 1.0132011 1.512 1.207 1.092 1.0652012 1.493 1.189 1.0582013 1.495 1.1652014 1.448
5 Year Average 1.491 1.196 1.095 1.048 1.036 1.025 1.023 1.023 1.021 1.023 1.015 1.018 1.015 1.015 1.015 1.014 1.015 1.014 1.047
Original 1st to 19th 2.360 Original 19th to Ult 1.035 Total Dev Adjustment 1.149Restated 1st to 19th 2.678 Restated 19th to Ult 1.047 or 14.9%
Adjustment 1.135 Adjustment 1.012Page 13
2008 SDF ADJUSTMENT October 2017 Revision
Exhibit D
Sheet 105.8% Percentage of claims assumed to be in the SDF
1.185 Impact State Insurance Fund: Policy Year Paid +Case Development17.80% Target Impact 17.9%
ORIGINAL TRIANGLEPY 1‐2 2‐3 3‐4 4‐5 5‐6 6‐7 7‐8 8‐9 9‐10 10‐11 11‐12 12‐13 13‐14 14‐15 15‐16 16‐17 17‐18 18‐19 19‐ULT1984 1.006 1.0551985 1.003 1.002 1.0551986 1.001 1.003 1.007 1.0551987 1.004 1.005 1.006 1.007 1.0551988 1.003 1.002 1.007 1.007 1.005 1.0551989 1.011 1.012 1.003 1.010 1.0041990 1.000 1.004 1.007 1.011 1.0061991 0.993 1.004 1.008 1.010 1.0031992 0.995 1.007 1.009 1.013 1.0051993 0.990 1.003 1.009 1.007 1.0111994 0.988 1.001 1.008 1.006 1.0041995 0.979 1.006 0.998 1.009 1.0061996 0.973 0.992 1.017 1.004 0.9981997 0.989 0.996 1.027 1.002 1.0081998 1.006 0.986 0.999 0.988 0.9881999 1.050 1.018 0.988 1.009 1.0072000 1.196 1.068 0.998 1.023 0.9852001 1.557 1.294 1.068 0.985 0.9762002 1.699 1.282 1.054 1.0082003 1.632 1.243 1.0432004 1.709 1.2332005 1.548
RESTATED TRIANGLE POST SDF ADJUSTMENTPY 1‐2 2‐3 3‐4 4‐5 5‐6 6‐7 7‐8 8‐9 9‐10 10‐11 11‐12 12‐13 13‐14 14‐15 15‐16 16‐17 17‐18 18‐19 19‐ULT
% Cases affected 5.0% 18.4% 39.4% 59.4% 74.6% 85.6% 91.4% 94.8% 97.0% 98.4% 99.0% 99.4% 99.9% 100.0% 100.0% 100.0% 100.0% 100.0% 100.0%1984 1.017 1.0661985 1.014 1.013 1.0661986 1.012 1.014 1.018 1.0661987 1.014 1.016 1.017 1.017 1.0661988 1.014 1.013 1.018 1.018 1.015 1.0661989 1.022 1.023 1.014 1.020 1.0151990 1.010 1.015 1.018 1.021 1.0171991 1.003 1.014 1.019 1.021 1.0131992 1.005 1.017 1.020 1.024 1.0161993 1.000 1.014 1.019 1.017 1.0221994 0.998 1.011 1.019 1.017 1.0151995 0.989 1.016 1.008 1.020 1.0171996 0.982 1.002 1.027 1.014 1.0081997 0.997 1.005 1.037 1.012 1.0181998 1.012 0.994 1.008 0.998 0.9981999 1.054 1.024 0.996 1.018 1.0172000 1.198 1.073 1.004 1.031 0.9942001 1.558 1.297 1.073 0.991 0.9842002 1.700 1.285 1.058 1.0142003 1.633 1.245 1.0472004 1.710 1.2352005 1.549
Original 1st to 19th 2.252 Original 19th to Ult 1.055 Total Dev Adjustment 1.179Restated 1st to 19th 2.626 Restated 19th to Ult 1.066 or 17.9%
Adjustment 1.166 Adjustment 1.011Page 14
2017 SDF Adjustment
5.8% Percentage of claims assumed to be in the SDF1.185 Impact State Insurance Fund Policy Year Indemnity Paid + Case Development
17.80% Target Impact 14.4%
October 2017 Revision
Exhibit DSheet 11
2017 Revision Exhibit DSheet 11
ORIGINAL TRIANGLEPY 1-2 2-3 3-4 4-5 5-6 6-7 7-8 8-9 9-10 10-11 11-12* 12-13 13-14 14-15 15-16 16-17 17-18 18-19 19-ULT
1992 1.0791993 1.008 1.0761994 1.005 1.009 1.0811995 1.004 1.009 1.010 1.0751996 1.012 1.011 1.012 1.003 1.0771997 1.007 1.009 1.010 1.007 1.0071998 1.007 1.009 1.009 1.006 1.0101999 1.008 1.026 1.013 1.003 1.0062000 1.010 1.009 1.007 1.006 1.0112001 1.003 1.082 1.011 1.002 1.0062002 1.011 1.010 1.006 1.004 1.0072003 1.001 0.999 1.021 1.002 1.0112004 0.995 0.999 1.010 1.004 0.9982005 0.998 1.005 1.004 1.004 1.0112006 1.047 0.994 1.002 1.000 1.0112007 1.054 1.017 1.002 0.991 0.9962008 1.085 1.025 1.018 0.996 1.0082009 1.225 1.091 1.027 1.007 1.0072010 1.424 1.217 1.073 1.025 1.0012011 1.497 1.192 1.044 1.0382012 1.433 1.188 1.0932013 1.448 1.2352014 1.472
5 Year Average 1.455 1.211 1.077 1.034 1.018 0.999 1.000 1.000 1.007 1.010 1.006 1.009 1.010 1.008 1.009 1.007 1.009 1.007 1.078
RESTATED TRIANGLE POST SDF ADJUSTMENTPY 1-2 2-3 3-4 4-5 5-6 6-7 7-8 8-9 9-10 10-11 11-12* 12-13 13-14 14-15 15-16 16-17 17-18 18-19 19-ULT
% Cases affected 5.0% 18.4% 39.4% 59.4% 74.6% 85.6% 91.4% 94.8% 97.0% 98.4% 99.0% 99.4% 99.9% 100.0% 100.0% 100.0% 100.0% 100.0% 100.0%1992 1.0911993 1.019 1.0881994 1.016 1.020 1.0931995 1.015 1.020 1.021 1.0871996 1.023 1.022 1.023 1.014 1.0891997 1.018 1.020 1.021 1.018 1.0181998 1.018 1.020 1.020 1.017 1.0211999 1.019 1.037 1.024 1.014 1.0172000 1.021 1.020 1.018 1.017 1.0222001 1.014 1.093 1.022 1.013 1.0172002 1.022 1.021 1.017 1.015 1.0182003 1.011 1.009 1.032 1.013 1.0222004 1.005 1.009 1.021 1.015 1.0092005 1.007 1.015 1.014 1.014 1.0222006 1.054 1.002 1.011 1.009 1.0202007 1.055 1.018 1.003 0.992 0.9972008 1.085 1.025 1.018 0.996 1.0082009 1.225 1.091 1.027 1.007 1.0072010 1.424 1.217 1.073 1.025 1.0012011 1.497 1.192 1.044 1.0382012 1.433 1.188 1.0932013 1.448 1.2352014 1.472
5 Year Average 1.455 1.211 1.077 1.034 1.020 1.003 1.006 1.008 1.017 1.020 1.017 1.019 1.021 1.019 1.020 1.018 1.019 1.018 1.089
Original 1st to 19th 2.165 Total Dev Adjustment 1.144Restated 1st to 19th 2.452 or 14.4%
Adjustment 1.133
Original 19th to Ult 1.078
Restated 19th to Ult 1.089
Adjustment 1.010
* Mid 3 of 5 Year average for the 11th‐12th
Page 15
October 2017 Revision
Exhibit DSheet 12
Original Estimated Impact 6.3%
After Development Adjustment Procedure:Weight Indemnity Medical
Private Carriers 60% 5.6% 5.9%State Insurance Fund 40% 5.8% 5.9%
Total Re-opened Case Fund Impact 5.7% 5.9%
Derivation of Re-opened Case Fund Adjustment
Page 16
2015 Re‐opened Case Fund Adjustment October 2017 RevisionExhibit DSheet 13
6.3% Percentage of losses assumed to be in the Re‐opened Case Fund1.0868 Impact Private Carriers: Policy Year Indemnity Paid+Case Development
6.3% Target Impact 6.3%ORIGINAL TRIANGLE
PY 1‐2 2‐3 3‐4 4‐5 5‐6 6‐7 7‐8 8‐9 9‐10 10‐11 11‐12 12‐13 13‐14 14‐15 15‐16 16‐17 17‐18 18‐19 19‐20 20‐ULT1990 1.008 1.0291991 1.002 1.005 1.0291992 1.009 1.006 1.004 1.0291993 1.006 1.004 1.002 1.001 1.0291994 1.010 1.004 1.004 1.004 1.004 1.0291995 1.004 1.005 1.004 1.003 1.0031996 1.009 1.005 1.005 1.003 1.0021997 1.009 1.004 1.005 1.003 1.0011998 1.001 1.004 1.002 1.002 1.0041999 1.002 1.005 1.007 1.003 1.0062000 1.018 1.008 1.007 1.005 1.0082001 1.029 1.015 1.018 1.003 1.0062002 1.024 1.011 1.020 1.015 1.0092003 1.034 1.018 1.024 1.010 1.0132004 1.071 1.040 1.021 1.027 1.0112005 1.077 1.038 1.028 1.021 1.0132006 1.113 1.058 1.068 1.026 1.0172007 1.226 1.109 1.050 1.037 1.0112008 1.451 1.249 1.114 1.043 1.0232009 1.526 1.200 1.115 1.0352010 1.509 1.219 1.0892011 1.513 1.2072012 1.495
5 Year Average 1.499 1.220 1.108 1.053 1.047 1.028 1.020 1.021 1.015 1.011 1.005 1.006 1.005 1.004 1.005 1.004 1.004 1.003 1.004 1.029
RESTATED TRIANGLE POST RE‐OPENED CASE FUND ADJUSTMENTPY 1‐2 2‐3 3‐4 4‐5 5‐6 6‐7 7‐8 8‐9 9‐10 10‐11 11‐12 12‐13 13‐14 14‐15 15‐16 16‐17 17‐18 18‐19 19‐20 20‐ULT
% Losses affected 25.0% 45.0% 60.0% 70.0% 78.0% 83.0% 86.0% 88.0% 89.5% 91.0% 92.0% 93.0% 94.0% 100.0%1990 1.013 1.0351991 1.007 1.010 1.0351992 1.014 1.011 1.009 1.0351993 1.011 1.009 1.007 1.006 1.0351994 1.015 1.009 1.009 1.009 1.009 1.0351995 1.009 1.010 1.009 1.008 1.0081996 1.014 1.010 1.010 1.008 1.0071997 1.014 1.009 1.010 1.008 1.0061998 1.005 1.009 1.007 1.007 1.0091999 1.006 1.009 1.012 1.008 1.0112000 1.021 1.012 1.011 1.010 1.0132001 1.032 1.018 1.022 1.007 1.0112002 1.025 1.013 1.023 1.019 1.0132003 1.034 1.019 1.027 1.013 1.0172004 1.071 1.040 1.022 1.030 1.0142005 1.077 1.038 1.028 1.022 1.0152006 1.113 1.058 1.068 1.026 1.0182007 1.226 1.109 1.050 1.037 1.0112008 1.451 1.249 1.114 1.043 1.0232009 1.526 1.200 1.115 1.0352010 1.509 1.219 1.0892011 1.513 1.2072012 1.495
5 Year Average 1.499 1.220 1.108 1.053 1.047 1.028 1.021 1.023 1.018 1.015 1.009 1.011 1.010 1.009 1.010 1.009 1.009 1.009 1.010 1.035
Original 1st to 20th 2.554 Original 20th to Ult 1.029 Total Dev Adjustment 1.063Restated 1st to 20th 2.700 Restated 20th to Ult 1.035 or 6.3%
Adjustment 1.057 Adjustment 1.006Page 17
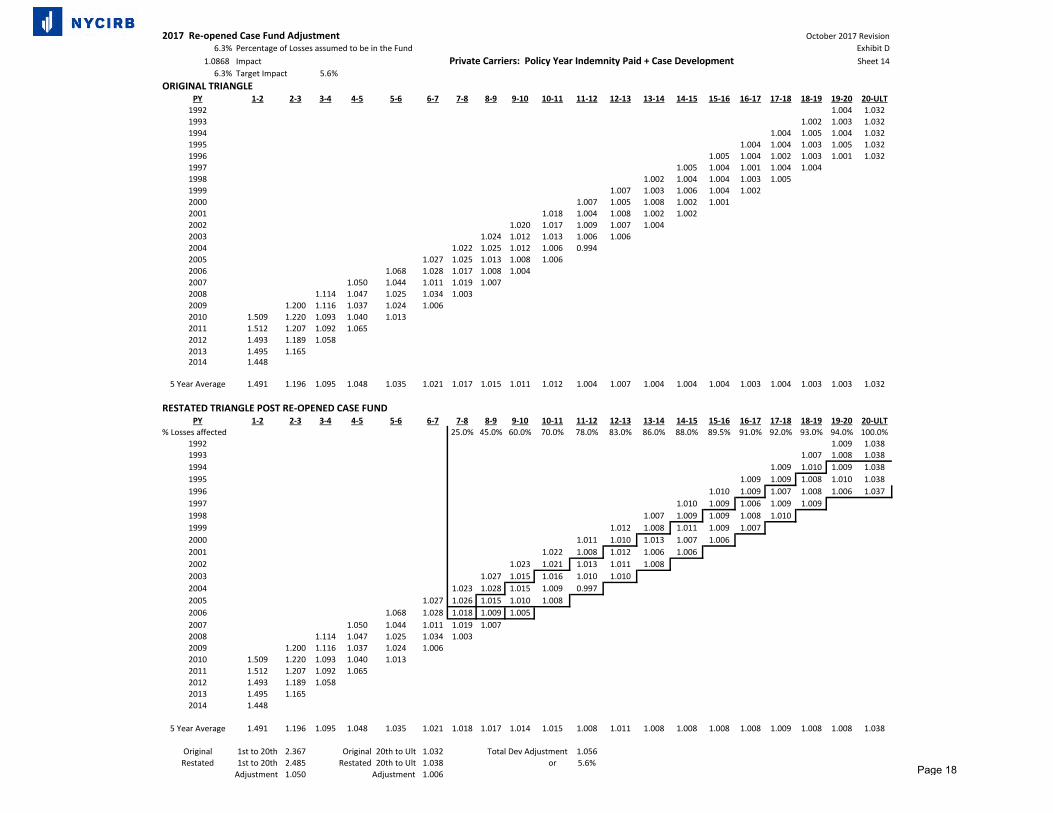
2017 Re-opened Case Fund Adjustment October 2017 Revision6.3% Percentage of Losses assumed to be in the Fund Exhibit D
1.0868 Impact Private Carriers: Policy Year Indemnity Paid + Case Development Sheet 146.3% Target Impact 5.6%
ORIGINAL TRIANGLEPY 1-2 2-3 3-4 4-5 5-6 6-7 7-8 8-9 9-10 10-11 11-12 12-13 13-14 14-15 15-16 16-17 17-18 18-19 19-20 20-ULT
1992 1.004 1.0321993 1.002 1.003 1.0321994 1.004 1.005 1.004 1.0321995 1.004 1.004 1.003 1.005 1.0321996 1.005 1.004 1.002 1.003 1.001 1.0321997 1.005 1.004 1.001 1.004 1.0041998 1.002 1.004 1.004 1.003 1.0051999 1.007 1.003 1.006 1.004 1.0022000 1.007 1.005 1.008 1.002 1.0012001 1.018 1.004 1.008 1.002 1.0022002 1.020 1.017 1.009 1.007 1.0042003 1.024 1.012 1.013 1.006 1.0062004 1.022 1.025 1.012 1.006 0.9942005 1.027 1.025 1.013 1.008 1.0062006 1.068 1.028 1.017 1.008 1.0042007 1.050 1.044 1.011 1.019 1.0072008 1.114 1.047 1.025 1.034 1.0032009 1.200 1.116 1.037 1.024 1.0062010 1.509 1.220 1.093 1.040 1.0132011 1.512 1.207 1.092 1.0652012 1.493 1.189 1.0582013 1.495 1.1652014 1.448
5 Year Average 1.491 1.196 1.095 1.048 1.035 1.021 1.017 1.015 1.011 1.012 1.004 1.007 1.004 1.004 1.004 1.003 1.004 1.003 1.003 1.032
RESTATED TRIANGLE POST RE-OPENED CASE FUNDPY 1-2 2-3 3-4 4-5 5-6 6-7 7-8 8-9 9-10 10-11 11-12 12-13 13-14 14-15 15-16 16-17 17-18 18-19 19-20 20-ULT
% Losses affected 25.0% 45.0% 60.0% 70.0% 78.0% 83.0% 86.0% 88.0% 89.5% 91.0% 92.0% 93.0% 94.0% 100.0%1992 1.009 1.0381993 1.007 1.008 1.0381994 1.009 1.010 1.009 1.0381995 1.009 1.009 1.008 1.010 1.0381996 1.010 1.009 1.007 1.008 1.006 1.0371997 1.010 1.009 1.006 1.009 1.0091998 1.007 1.009 1.009 1.008 1.0101999 1.012 1.008 1.011 1.009 1.0072000 1.011 1.010 1.013 1.007 1.0062001 1.022 1.008 1.012 1.006 1.0062002 1.023 1.021 1.013 1.011 1.0082003 1.027 1.015 1.016 1.010 1.0102004 1.023 1.028 1.015 1.009 0.9972005 1.027 1.026 1.015 1.010 1.0082006 1.068 1.028 1.018 1.009 1.0052007 1.050 1.044 1.011 1.019 1.0072008 1.114 1.047 1.025 1.034 1.0032009 1.200 1.116 1.037 1.024 1.0062010 1.509 1.220 1.093 1.040 1.0132011 1.512 1.207 1.092 1.0652012 1.493 1.189 1.0582013 1.495 1.1652014 1.448
5 Year Average 1.491 1.196 1.095 1.048 1.035 1.021 1.018 1.017 1.014 1.015 1.008 1.011 1.008 1.008 1.008 1.008 1.009 1.008 1.008 1.038
Original 1st to 20th 2.367 Original 20th to Ult 1.032 Total Dev Adjustment 1.056Restated 1st to 20th 2.485 Restated 20th to Ult 1.038 or 5.6%
Adjustment 1.050 Adjustment 1.006 Page 18
2015 Re‐opened Case Fund Adjustment October 2017 Revision Exhibit D
Sheet 15
6.3% Percentage of losses assumed to be in the Re‐opened Case Fund1.0886 Impact Private Carriers: Policy Year Medical Paid+Case Development
6.3% Target Impact 6.3%ORIGINAL TRIANGLE
PY 1‐2 2‐3 3‐4 4‐5 5‐6 6‐7 7‐8 8‐9 9‐10 10‐11 11‐12 12‐13 13‐14 14‐15 15‐16 16‐17 17‐18 18‐19 19‐20 20‐ULT1990 1.001 1.0561991 0.999 1.003 1.0561992 1.011 1.017 1.009 1.0561993 1.000 0.999 1.000 0.998 1.0561994 1.011 1.004 1.006 1.003 1.000 1.0561995 0.996 1.003 1.011 1.006 1.0051996 1.002 1.001 0.997 1.005 1.0021997 1.007 1.018 1.001 1.004 1.0111998 1.003 1.019 1.005 1.014 0.9971999 1.012 1.026 1.016 1.014 1.0152000 1.018 1.029 1.016 1.015 1.0072001 1.025 1.015 1.031 1.008 1.0172002 1.030 1.017 1.029 1.018 1.0142003 1.028 1.014 1.018 1.006 1.0212004 1.044 1.034 1.026 1.036 1.0222005 1.072 1.036 1.030 1.034 1.0192006 1.109 1.054 1.041 1.039 1.0262007 1.177 1.070 1.058 1.051 1.0402008 1.225 1.161 1.083 1.048 1.0402009 1.224 1.145 1.095 1.0562010 1.255 1.126 1.0682011 1.221 1.1382012 1.200
5 Year Average 1.225 1.149 1.085 1.058 1.042 1.034 1.026 1.023 1.018 1.022 1.013 1.015 1.009 1.005 1.002 1.006 1.005 1.005 1.002 1.056
RESTATED TRIANGLE POST RE‐OPENED CASE FUND ADJUSTMENTPY 1‐2 2‐3 3‐4 4‐5 5‐6 6‐7 7‐8 8‐9 9‐10 10‐11 11‐12 12‐13 13‐14 14‐15 15‐16 16‐17 17‐18 18‐19 19‐20 20‐ULT
% Losses affected 25.0% 45.0% 60.0% 70.0% 78.0% 83.0% 86.0% 88.0% 89.5% 91.0% 92.0% 93.0% 94.0% 100.0%1990 1.006 1.0621991 1.004 1.008 1.0621992 1.016 1.022 1.014 1.0621993 1.005 1.004 1.005 1.003 1.0621994 1.016 1.009 1.011 1.008 1.005 1.0621995 1.001 1.008 1.016 1.011 1.0101996 1.007 1.006 1.002 1.010 1.0071997 1.012 1.023 1.006 1.009 1.0161998 1.007 1.024 1.010 1.019 1.0021999 1.016 1.030 1.021 1.019 1.0202000 1.021 1.033 1.020 1.020 1.0122001 1.028 1.018 1.035 1.012 1.0222002 1.031 1.020 1.032 1.022 1.0182003 1.028 1.015 1.021 1.009 1.0252004 1.044 1.034 1.027 1.039 1.0252005 1.072 1.036 1.030 1.035 1.0222006 1.109 1.054 1.041 1.039 1.0272007 1.177 1.070 1.058 1.051 1.0402008 1.225 1.161 1.083 1.048 1.0402009 1.224 1.145 1.095 1.0562010 1.255 1.126 1.0682011 1.221 1.1382012 1.200
5 Year Average 1.225 1.149 1.085 1.058 1.042 1.034 1.027 1.026 1.021 1.026 1.018 1.020 1.014 1.010 1.007 1.011 1.010 1.010 1.007 1.062
Original 1st to 20th 2.022 Total Dev Adjustment 1.063Restated 1st to 20th 2.137 or 6.3%
Adjustment 1.057
Original20th to Ult 1.056 Restated 20th to Ult 1.062
Adjustment 1.006Page 19
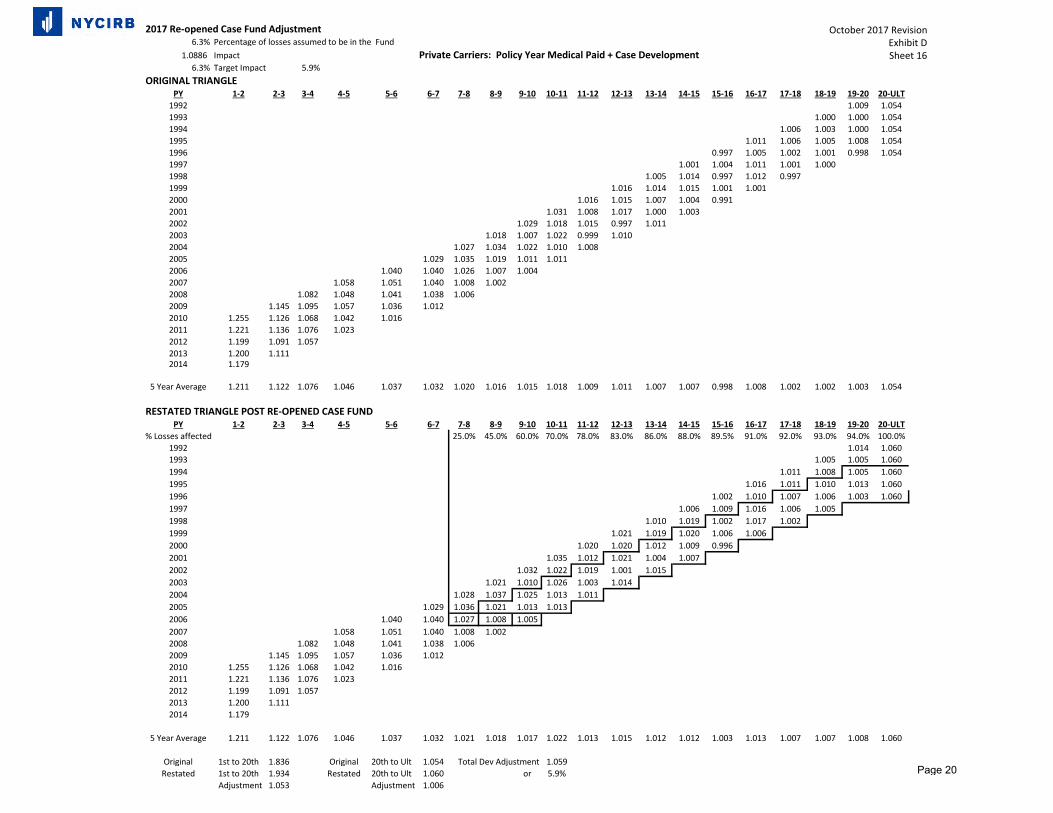
2017 Re-opened Case Fund Adjustment October 2017 RevisionExhibit DSheet 16
6.3% Percentage of losses assumed to be in the Fund1.0886 Impact Private Carriers: Policy Year Medical Paid + Case Development
6.3% Target Impact 5.9%ORIGINAL TRIANGLE
PY 1-2 2-3 3-4 4-5 5-6 6-7 7-8 8-9 9-10 10-11 11-12 12-13 13-14 14-15 15-16 16-17 17-18 18-19 19-20 20-ULT1992 1.009 1.0541993 1.000 1.000 1.0541994 1.006 1.003 1.000 1.0541995 1.011 1.006 1.005 1.008 1.0541996 0.997 1.005 1.002 1.001 0.998 1.0541997 1.001 1.004 1.011 1.001 1.0001998 1.005 1.014 0.997 1.012 0.9971999 1.016 1.014 1.015 1.001 1.0012000 1.016 1.015 1.007 1.004 0.9912001 1.031 1.008 1.017 1.000 1.0032002 1.029 1.018 1.015 0.997 1.0112003 1.018 1.007 1.022 0.999 1.0102004 1.027 1.034 1.022 1.010 1.0082005 1.029 1.035 1.019 1.011 1.0112006 1.040 1.040 1.026 1.007 1.0042007 1.058 1.051 1.040 1.008 1.0022008 1.082 1.048 1.041 1.038 1.0062009 1.145 1.095 1.057 1.036 1.0122010 1.255 1.126 1.068 1.042 1.0162011 1.221 1.136 1.076 1.0232012 1.199 1.091 1.0572013 1.200 1.1112014 1.179
5 Year Average 1.211 1.122 1.076 1.046 1.037 1.032 1.020 1.016 1.015 1.018 1.009 1.011 1.007 1.007 0.998 1.008 1.002 1.002 1.003 1.054
RESTATED TRIANGLE POST RE-OPENED CASE FUNDPY 1-2 2-3 3-4 4-5 5-6 6-7 7-8 8-9 9-10 10-11 11-12 12-13 13-14 14-15 15-16 16-17 17-18 18-19 19-20 20-ULT
% Losses affected 25.0% 45.0% 60.0% 70.0% 78.0% 83.0% 86.0% 88.0% 89.5% 91.0% 92.0% 93.0% 94.0% 100.0%1992 1.014 1.0601993 1.005 1.005 1.0601994 1.011 1.008 1.005 1.0601995 1.016 1.011 1.010 1.013 1.0601996 1.002 1.010 1.007 1.006 1.003 1.0601997 1.006 1.009 1.016 1.006 1.0051998 1.010 1.019 1.002 1.017 1.0021999 1.021 1.019 1.020 1.006 1.0062000 1.020 1.020 1.012 1.009 0.9962001 1.035 1.012 1.021 1.004 1.0072002 1.032 1.022 1.019 1.001 1.0152003 1.021 1.010 1.026 1.003 1.0142004 1.028 1.037 1.025 1.013 1.0112005 1.029 1.036 1.021 1.013 1.0132006 1.040 1.040 1.027 1.008 1.0052007 1.058 1.051 1.040 1.008 1.0022008 1.082 1.048 1.041 1.038 1.0062009 1.145 1.095 1.057 1.036 1.0122010 1.255 1.126 1.068 1.042 1.0162011 1.221 1.136 1.076 1.0232012 1.199 1.091 1.0572013 1.200 1.1112014 1.179
5 Year Average 1.211 1.122 1.076 1.046 1.037 1.032 1.021 1.018 1.017 1.022 1.013 1.015 1.012 1.012 1.003 1.013 1.007 1.007 1.008 1.060
Original 1st to 20th 1.836 Original 20th to Ult 1.054 Total Dev Adjustment 1.059Restated 1st to 20th 1.934 Restated 20th to Ult 1.060 or 5.9%
Adjustment 1.053 Adjustment 1.006
Page 20
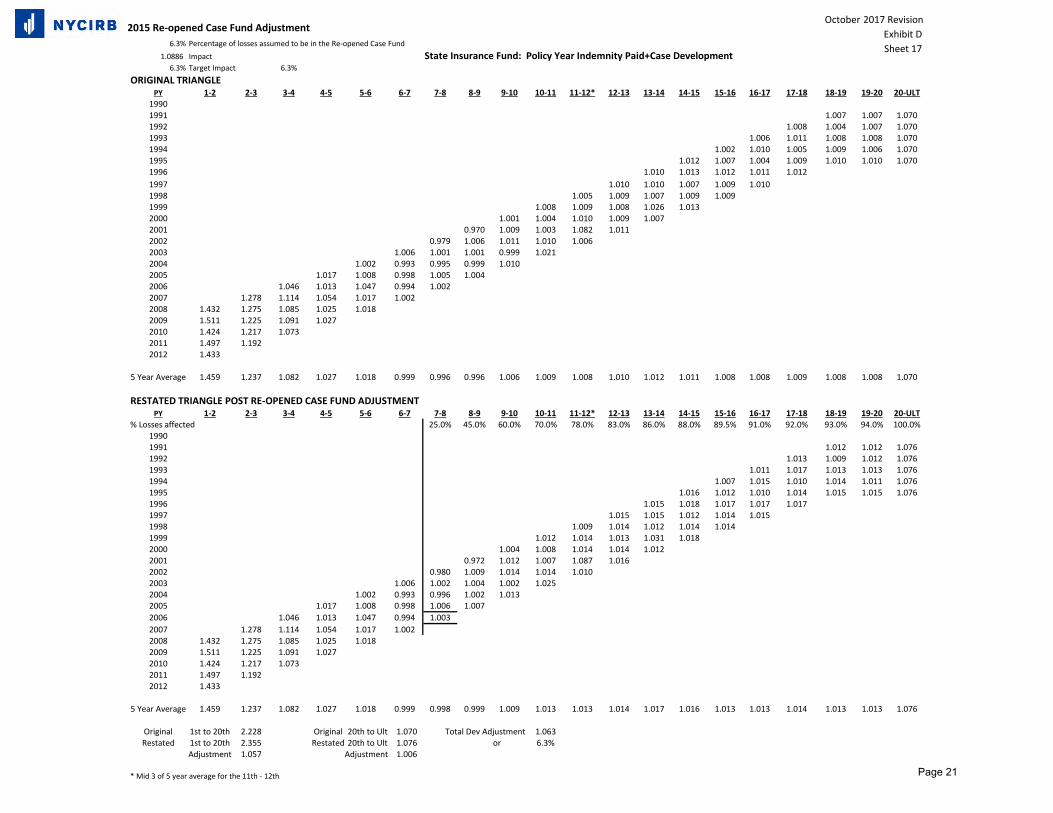
October 2017 Revision
Exhibit D
Sheet 176.3% Percentage of losses assumed to be in the Re‐opened Case Fund1.0886 Impact State Insurance Fund: Policy Year Indemnity Paid+Case Development
6.3% Target Impact 6.3%ORIGINAL TRIANGLE
PY 1‐2 2‐3 3‐4 4‐5 5‐6 6‐7 7‐8 8‐9 9‐10 10‐11 11‐12* 12‐13 13‐14 14‐15 15‐16 16‐17 17‐18 18‐19 19‐20 20‐ULT19901991 1.007 1.007 1.0701992 1.008 1.004 1.007 1.0701993 1.006 1.011 1.008 1.008 1.0701994 1.002 1.010 1.005 1.009 1.006 1.0701995 1.012 1.007 1.004 1.009 1.010 1.010 1.0701996 1.010 1.013 1.012 1.011 1.0121997 1.010 1.010 1.007 1.009 1.0101998 1.005 1.009 1.007 1.009 1.0091999 1.008 1.009 1.008 1.026 1.0132000 1.001 1.004 1.010 1.009 1.0072001 0.970 1.009 1.003 1.082 1.0112002 0.979 1.006 1.011 1.010 1.0062003 1.006 1.001 1.001 0.999 1.0212004 1.002 0.993 0.995 0.999 1.0102005 1.017 1.008 0.998 1.005 1.0042006 1.046 1.013 1.047 0.994 1.0022007 1.278 1.114 1.054 1.017 1.0022008 1.432 1.275 1.085 1.025 1.0182009 1.511 1.225 1.091 1.0272010 1.424 1.217 1.0732011 1.497 1.1922012 1.433
5 Year Average 1.459 1.237 1.082 1.027 1.018 0.999 0.996 0.996 1.006 1.009 1.008 1.010 1.012 1.011 1.008 1.008 1.009 1.008 1.008 1.070
RESTATED TRIANGLE POST RE‐OPENED CASE FUND ADJUSTMENTPY 1‐2 2‐3 3‐4 4‐5 5‐6 6‐7 7‐8 8‐9 9‐10 10‐11 11‐12* 12‐13 13‐14 14‐15 15‐16 16‐17 17‐18 18‐19 19‐20 20‐ULT
% Losses affected 25.0% 45.0% 60.0% 70.0% 78.0% 83.0% 86.0% 88.0% 89.5% 91.0% 92.0% 93.0% 94.0% 100.0%19901991 1.012 1.012 1.0761992 1.013 1.009 1.012 1.0761993 1.011 1.017 1.013 1.013 1.0761994 1.007 1.015 1.010 1.014 1.011 1.0761995 1.016 1.012 1.010 1.014 1.015 1.015 1.0761996 1.015 1.018 1.017 1.017 1.0171997 1.015 1.015 1.012 1.014 1.0151998 1.009 1.014 1.012 1.014 1.0141999 1.012 1.014 1.013 1.031 1.0182000 1.004 1.008 1.014 1.014 1.0122001 0.972 1.012 1.007 1.087 1.0162002 0.980 1.009 1.014 1.014 1.0102003 1.006 1.002 1.004 1.002 1.0252004 1.002 0.993 0.996 1.002 1.0132005 1.017 1.008 0.998 1.006 1.0072006 1.046 1.013 1.047 0.994 1.0032007 1.278 1.114 1.054 1.017 1.0022008 1.432 1.275 1.085 1.025 1.0182009 1.511 1.225 1.091 1.0272010 1.424 1.217 1.0732011 1.497 1.1922012 1.433
5 Year Average 1.459 1.237 1.082 1.027 1.018 0.999 0.998 0.999 1.009 1.013 1.013 1.014 1.017 1.016 1.013 1.013 1.014 1.013 1.013 1.076
Original 1st to 20th 2.228 Total Dev Adjustment 1.063Restated 1st to 20th 2.355 or 6.3%
Adjustment 1.057
Original 20th to Ult 1.070 Restated 20th to Ult 1.076
Adjustment 1.006
* Mid 3 of 5 year average for the 11th ‐ 12th
2015 Re‐opened Case Fund Adjustment
Page 21
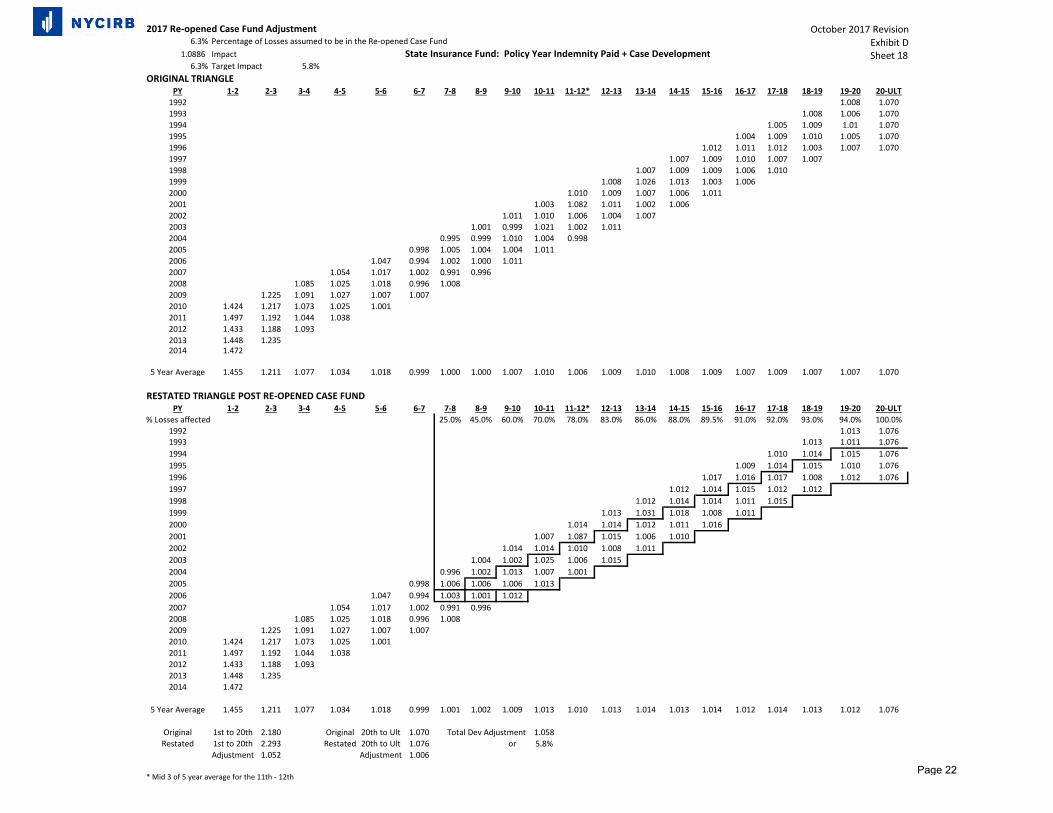
2017 Re-opened Case Fund Adjustment October 2017 Revision6.3% Percentage of Losses assumed to be in the Re-opened Case Fund Exhibit D
1.0886 Impact State Insurance Fund: Policy Year Indemnity Paid + Case Development Sheet 186.3% Target Impact 5.8%
ORIGINAL TRIANGLEPY 1-2 2-3 3-4 4-5 5-6 6-7 7-8 8-9 9-10 10-11 11-12* 12-13 13-14 14-15 15-16 16-17 17-18 18-19 19-20 20-ULT
1992 1.008 1.0701993 1.008 1.006 1.0701994 1.005 1.009 1.01 1.0701995 1.004 1.009 1.010 1.005 1.0701996 1.012 1.011 1.012 1.003 1.007 1.0701997 1.007 1.009 1.010 1.007 1.0071998 1.007 1.009 1.009 1.006 1.0101999 1.008 1.026 1.013 1.003 1.0062000 1.010 1.009 1.007 1.006 1.0112001 1.003 1.082 1.011 1.002 1.0062002 1.011 1.010 1.006 1.004 1.0072003 1.001 0.999 1.021 1.002 1.0112004 0.995 0.999 1.010 1.004 0.9982005 0.998 1.005 1.004 1.004 1.0112006 1.047 0.994 1.002 1.000 1.0112007 1.054 1.017 1.002 0.991 0.9962008 1.085 1.025 1.018 0.996 1.0082009 1.225 1.091 1.027 1.007 1.0072010 1.424 1.217 1.073 1.025 1.0012011 1.497 1.192 1.044 1.0382012 1.433 1.188 1.0932013 1.448 1.2352014 1.472
5 Year Average 1.455 1.211 1.077 1.034 1.018 0.999 1.000 1.000 1.007 1.010 1.006 1.009 1.010 1.008 1.009 1.007 1.009 1.007 1.007 1.070
RESTATED TRIANGLE POST RE-OPENED CASE FUNDPY 1-2 2-3 3-4 4-5 5-6 6-7 7-8 8-9 9-10 10-11 11-12* 12-13 13-14 14-15 15-16 16-17 17-18 18-19 19-20 20-ULT
% Losses affected 25.0% 45.0% 60.0% 70.0% 78.0% 83.0% 86.0% 88.0% 89.5% 91.0% 92.0% 93.0% 94.0% 100.0%1992 1.013 1.0761993 1.013 1.011 1.0761994 1.010 1.014 1.015 1.0761995 1.009 1.014 1.015 1.010 1.0761996 1.017 1.016 1.017 1.008 1.012 1.0761997 1.012 1.014 1.015 1.012 1.0121998 1.012 1.014 1.014 1.011 1.0151999 1.013 1.031 1.018 1.008 1.0112000 1.014 1.014 1.012 1.011 1.0162001 1.007 1.087 1.015 1.006 1.0102002 1.014 1.014 1.010 1.008 1.0112003 1.004 1.002 1.025 1.006 1.0152004 0.996 1.002 1.013 1.007 1.0012005 0.998 1.006 1.006 1.006 1.0132006 1.047 0.994 1.003 1.001 1.0122007 1.054 1.017 1.002 0.991 0.9962008 1.085 1.025 1.018 0.996 1.0082009 1.225 1.091 1.027 1.007 1.0072010 1.424 1.217 1.073 1.025 1.0012011 1.497 1.192 1.044 1.0382012 1.433 1.188 1.0932013 1.448 1.2352014 1.472
5 Year Average 1.455 1.211 1.077 1.034 1.018 0.999 1.001 1.002 1.009 1.013 1.010 1.013 1.014 1.013 1.014 1.012 1.014 1.013 1.012 1.076
Original 1st to 20th 2.180 Original 20th to Ult 1.070 Total Dev Adjustment 1.058Restated 1st to 20th 2.293 Restated 20th to Ult 1.076 or 5.8%
Adjustment 1.052 Adjustment 1.006
* Mid 3 of 5 year average for the 11th - 12thPage 22
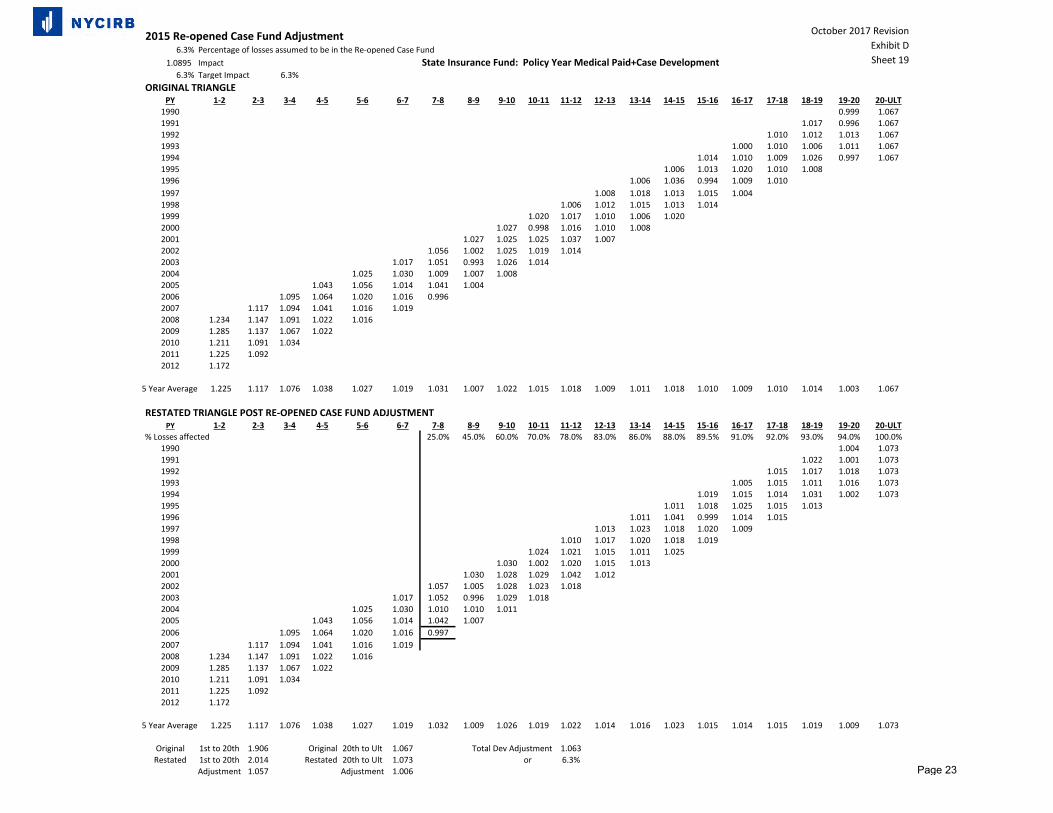
2015 Re-opened Case Fund Adjustment6.3% Percentage of losses assumed to be in the Re-opened Case Fund
1.0895 Impact State Insurance Fund: Policy Year Medical Paid+Case Development6.3% Target Impact 6.3%
ORIGINAL TRIANGLEPY 1-2 2-3 3-4 4-5 5-6 6-7 7-8 8-9 9-10 10-11 11-12 12-13 13-14 14-15 15-16 16-17 17-18 18-19 19-20 20-ULT
1990 0.999 1.0671991 1.017 0.996 1.0671992 1.010 1.012 1.013 1.0671993 1.000 1.010 1.006 1.011 1.0671994 1.014 1.010 1.009 1.026 0.997 1.0671995 1.006 1.013 1.020 1.010 1.0081996 1.006 1.036 0.994 1.009 1.0101997 1.008 1.018 1.013 1.015 1.0041998 1.006 1.012 1.015 1.013 1.0141999 1.020 1.017 1.010 1.006 1.0202000 1.027 0.998 1.016 1.010 1.0082001 1.027 1.025 1.025 1.037 1.0072002 1.056 1.002 1.025 1.019 1.0142003 1.017 1.051 0.993 1.026 1.0142004 1.025 1.030 1.009 1.007 1.0082005 1.043 1.056 1.014 1.041 1.0042006 1.095 1.064 1.020 1.016 0.9962007 1.117 1.094 1.041 1.016 1.0192008 1.234 1.147 1.091 1.022 1.0162009 1.285 1.137 1.067 1.0222010 1.211 1.091 1.0342011 1.225 1.0922012 1.172
5 Year Average 1.225 1.117 1.076 1.038 1.027 1.019 1.031 1.007 1.022 1.015 1.018 1.009 1.011 1.018 1.010 1.009 1.010 1.014 1.003 1.067
RESTATED TRIANGLE POST RE-OPENED CASE FUND ADJUSTMENTPY 1-2 2-3 3-4 4-5 5-6 6-7 7-8 8-9 9-10 10-11 11-12 12-13 13-14 14-15 15-16 16-17 17-18 18-19 19-20 20-ULT
% Losses affected 25.0% 45.0% 60.0% 70.0% 78.0% 83.0% 86.0% 88.0% 89.5% 91.0% 92.0% 93.0% 94.0% 100.0%1990 1.004 1.0731991 1.022 1.001 1.0731992 1.015 1.017 1.018 1.0731993 1.005 1.015 1.011 1.016 1.0731994 1.019 1.015 1.014 1.031 1.002 1.0731995 1.011 1.018 1.025 1.015 1.0131996 1.011 1.041 0.999 1.014 1.0151997 1.013 1.023 1.018 1.020 1.0091998 1.010 1.017 1.020 1.018 1.0191999 1.024 1.021 1.015 1.011 1.0252000 1.030 1.002 1.020 1.015 1.0132001 1.030 1.028 1.029 1.042 1.0122002 1.057 1.005 1.028 1.023 1.0182003 1.017 1.052 0.996 1.029 1.0182004 1.025 1.030 1.010 1.010 1.0112005 1.043 1.056 1.014 1.042 1.0072006 1.095 1.064 1.020 1.016 0.9972007 1.117 1.094 1.041 1.016 1.0192008 1.234 1.147 1.091 1.022 1.0162009 1.285 1.137 1.067 1.0222010 1.211 1.091 1.0342011 1.225 1.0922012 1.172
5 Year Average 1.225 1.117 1.076 1.038 1.027 1.019 1.032 1.009 1.026 1.019 1.022 1.014 1.016 1.023 1.015 1.014 1.015 1.019 1.009 1.073
Original 1st to 20th 1.906 Original 20th to Ult 1.067 Total Dev Adjustment 1.063Restated 1st to 20th 2.014 Restated 20th to Ult 1.073 or 6.3%
Adjustment 1.057 Adjustment 1.006
October 2017 Revision
Exhibit D
Sheet 19
Page 23
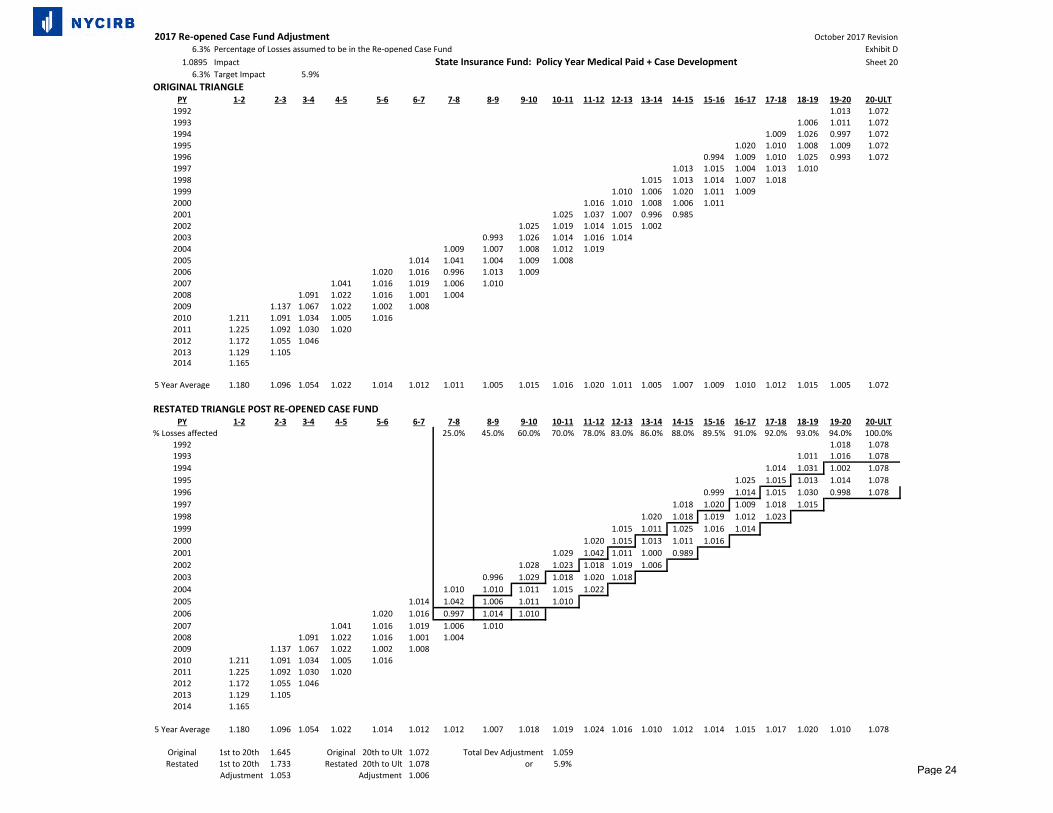
2017 Re-opened Case Fund Adjustment October 2017 Revision6.3% Percentage of Losses assumed to be in the Re-opened Case Fund Exhibit D
1.0895 Impact State Insurance Fund: Policy Year Medical Paid + Case Development Sheet 206.3% Target Impact 5.9%
ORIGINAL TRIANGLEPY 1-2 2-3 3-4 4-5 5-6 6-7 7-8 8-9 9-10 10-11 11-12 12-13 13-14 14-15 15-16 16-17 17-18 18-19 19-20 20-ULT
1992 1.013 1.0721993 1.006 1.011 1.0721994 1.009 1.026 0.997 1.0721995 1.020 1.010 1.008 1.009 1.0721996 0.994 1.009 1.010 1.025 0.993 1.0721997 1.013 1.015 1.004 1.013 1.0101998 1.015 1.013 1.014 1.007 1.0181999 1.010 1.006 1.020 1.011 1.0092000 1.016 1.010 1.008 1.006 1.0112001 1.025 1.037 1.007 0.996 0.9852002 1.025 1.019 1.014 1.015 1.0022003 0.993 1.026 1.014 1.016 1.0142004 1.009 1.007 1.008 1.012 1.0192005 1.014 1.041 1.004 1.009 1.0082006 1.020 1.016 0.996 1.013 1.0092007 1.041 1.016 1.019 1.006 1.0102008 1.091 1.022 1.016 1.001 1.0042009 1.137 1.067 1.022 1.002 1.0082010 1.211 1.091 1.034 1.005 1.0162011 1.225 1.092 1.030 1.0202012 1.172 1.055 1.0462013 1.129 1.1052014 1.165
5 Year Average 1.180 1.096 1.054 1.022 1.014 1.012 1.011 1.005 1.015 1.016 1.020 1.011 1.005 1.007 1.009 1.010 1.012 1.015 1.005 1.072
RESTATED TRIANGLE POST RE-OPENED CASE FUNDPY 1-2 2-3 3-4 4-5 5-6 6-7 7-8 8-9 9-10 10-11 11-12 12-13 13-14 14-15 15-16 16-17 17-18 18-19 19-20 20-ULT
% Losses affected 25.0% 45.0% 60.0% 70.0% 78.0% 83.0% 86.0% 88.0% 89.5% 91.0% 92.0% 93.0% 94.0% 100.0%1992 1.018 1.0781993 1.011 1.016 1.0781994 1.014 1.031 1.002 1.0781995 1.025 1.015 1.013 1.014 1.0781996 0.999 1.014 1.015 1.030 0.998 1.0781997 1.018 1.020 1.009 1.018 1.0151998 1.020 1.018 1.019 1.012 1.0231999 1.015 1.011 1.025 1.016 1.0142000 1.020 1.015 1.013 1.011 1.0162001 1.029 1.042 1.011 1.000 0.9892002 1.028 1.023 1.018 1.019 1.0062003 0.996 1.029 1.018 1.020 1.0182004 1.010 1.010 1.011 1.015 1.0222005 1.014 1.042 1.006 1.011 1.0102006 1.020 1.016 0.997 1.014 1.0102007 1.041 1.016 1.019 1.006 1.0102008 1.091 1.022 1.016 1.001 1.0042009 1.137 1.067 1.022 1.002 1.0082010 1.211 1.091 1.034 1.005 1.0162011 1.225 1.092 1.030 1.0202012 1.172 1.055 1.0462013 1.129 1.1052014 1.165
5 Year Average 1.180 1.096 1.054 1.022 1.014 1.012 1.012 1.007 1.018 1.019 1.024 1.016 1.010 1.012 1.014 1.015 1.017 1.020 1.010 1.078
Original 1st to 20th 1.645 Original 20th to Ult 1.072 Total Dev Adjustment 1.059Restated 1st to 20th 1.733 Restated 20th to Ult 1.078 or 5.9%
Adjustment 1.053 Adjustment 1.006 Page 24
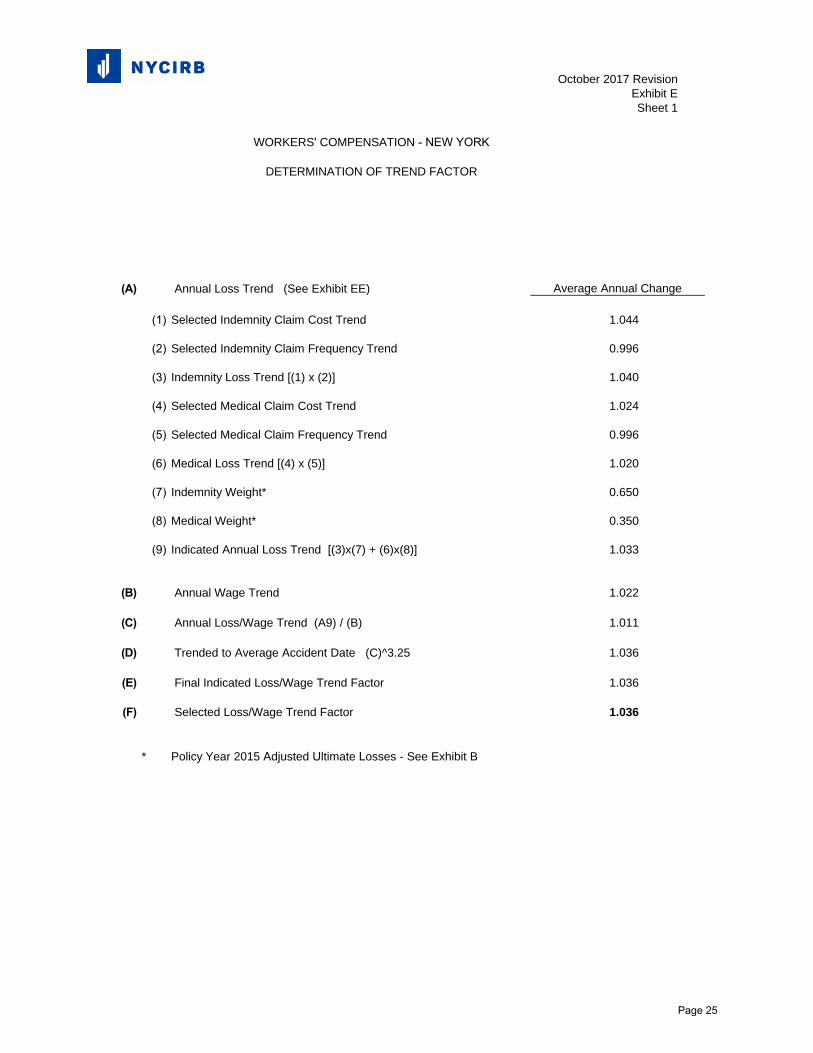
October 2017 Revision Exhibit ESheet 1
1.044
0.996
1.040
1.024
0.996
1.020
0.650
0.350
1.033
1.022
1.011
1.036
1.036
1.036
(A) Annual Loss Trend (See Exhibit EE)
(1) Selected Indemnity Claim Cost Trend
(2) Selected Indemnity Claim Frequency Trend
(3) Indemnity Loss Trend [(1) x (2)]
(4) Selected Medical Claim Cost Trend
(5) Selected Medical Claim Frequency Trend
(6) Medical Loss Trend [(4) x (5)]
(7) Indemnity Weight*
(8) Medical Weight*
(9) Indicated Annual Loss Trend [(3)x(7) + (6)x(8)]
(B) Annual Wage Trend
(C) Annual Loss/Wage Trend (A9) / (B)
(D) Trended to Average Accident Date (C)^3.25
(E) Final Indicated Loss/Wage Trend Factor
(F) Selected Loss/Wage Trend Factor
* Policy Year 2015 Adjusted Ultimate Losses - See Exhibit B
WORKERS' COMPENSATION - NEW YORK
DETERMINATION OF TREND FACTOR
Average Annual Change
Page 25
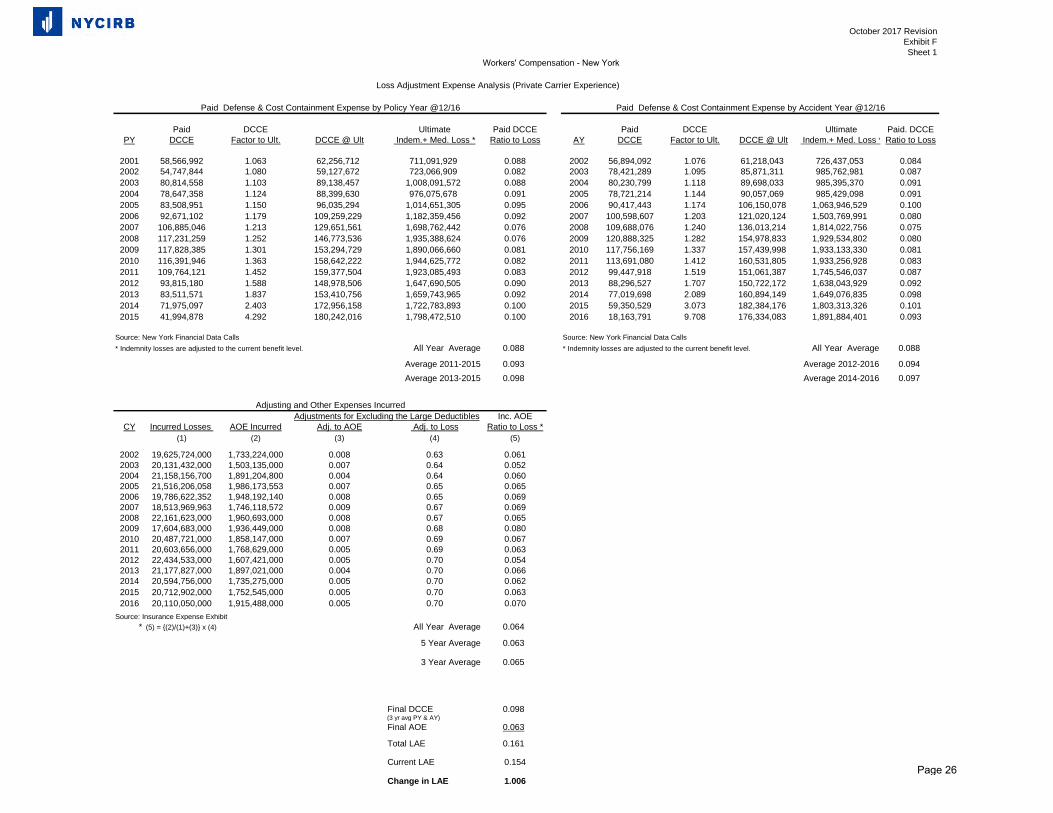
October 2017 RevisionExhibit FSheet 1
Paid DCCE Ultimate Paid DCCE Paid DCCE Ultimate Paid. DCCEPY DCCE Factor to Ult. DCCE @ Ult Indem.+ Med. Loss * Ratio to Loss AY DCCE Factor to Ult. DCCE @ Ult Indem.+ Med. Loss * Ratio to Loss
2001 58,566,992 1.063 62,256,712 711,091,929 0.088 2002 56,894,092 1.076 61,218,043 726,437,053 0.0842002 54,747,844 1.080 59,127,672 723,066,909 0.082 2003 78,421,289 1.095 85,871,311 985,762,981 0.0872003 80,814,558 1.103 89,138,457 1,008,091,572 0.088 2004 80,230,799 1.118 89,698,033 985,395,370 0.0912004 78,647,358 1.124 88,399,630 976,075,678 0.091 2005 78,721,214 1.144 90,057,069 985,429,098 0.0912005 83,508,951 1.150 96,035,294 1,014,651,305 0.095 2006 90,417,443 1.174 106,150,078 1,063,946,529 0.1002006 92,671,102 1.179 109,259,229 1,182,359,456 0.092 2007 100,598,607 1.203 121,020,124 1,503,769,991 0.0802007 106,885,046 1.213 129,651,561 1,698,762,442 0.076 2008 109,688,076 1.240 136,013,214 1,814,022,756 0.0752008 117,231,259 1.252 146,773,536 1,935,388,624 0.076 2009 120,888,325 1.282 154,978,833 1,929,534,802 0.0802009 117,828,385 1.301 153,294,729 1,890,066,660 0.081 2010 117,756,169 1.337 157,439,998 1,933,133,330 0.0812010 116,391,946 1.363 158,642,222 1,944,625,772 0.082 2011 113,691,080 1.412 160,531,805 1,933,256,928 0.0832011 109,764,121 1.452 159,377,504 1,923,085,493 0.083 2012 99,447,918 1.519 151,061,387 1,745,546,037 0.0872012 93,815,180 1.588 148,978,506 1,647,690,505 0.090 2013 88,296,527 1.707 150,722,172 1,638,043,929 0.0922013 83,511,571 1.837 153,410,756 1,659,743,965 0.092 2014 77,019,698 2.089 160,894,149 1,649,076,835 0.0982014 71,975,097 2.403 172,956,158 1,722,783,893 0.100 2015 59,350,529 3.073 182,384,176 1,803,313,326 0.1012015 41,994,878 4.292 180,242,016 1,798,472,510 0.100 2016 18,163,791 9.708 176,334,083 1,891,884,401 0.093
Source: New York Financial Data Calls Source: New York Financial Data Calls* Indemnity losses are adjusted to the current benefit level. All Year Average 0.088 * Indemnity losses are adjusted to the current benefit level. All Year Average 0.088
Average 2011-2015 0.093 Average 2012-2016 0.094Average 2013-2015 0.098 Average 2014-2016 0.097
Adjustments for Excluding the Large Deductibles Inc. AOECY Incurred Losses AOE Incurred Adj. to AOE Adj. to Loss Ratio to Loss *
(1) (2) (3) (4) (5)
2002 19,625,724,000 1,733,224,000 0.008 0.63 0.0612003 20,131,432,000 1,503,135,000 0.007 0.64 0.0522004 21,158,156,700 1,891,204,800 0.004 0.64 0.0602005 21,516,206,058 1,986,173,553 0.007 0.65 0.0652006 19,786,622,352 1,948,192,140 0.008 0.65 0.0692007 18,513,969,963 1,746,118,572 0.009 0.67 0.0692008 22,161,623,000 1,960,693,000 0.008 0.67 0.0652009 17,604,683,000 1,936,449,000 0.008 0.68 0.0802010 20,487,721,000 1,858,147,000 0.007 0.69 0.0672011 20,603,656,000 1,768,629,000 0.005 0.69 0.0632012 22,434,533,000 1,607,421,000 0.005 0.70 0.0542013 21,177,827,000 1,897,021,000 0.004 0.70 0.0662014 20,594,756,000 1,735,275,000 0.005 0.70 0.0622015 20,712,902,000 1,752,545,000 0.005 0.70 0.0632016 20,110,050,000 1,915,488,000 0.005 0.70 0.070
Source: Insurance Expense Exhibit* (5) = {(2)/(1)+(3)} x (4) All Year Average 0.064
5 Year Average 0.063
3 Year Average 0.065
Final DCCE 0.098(3 yr avg PY & AY)Final AOE 0.063
Total LAE 0.161
Current LAE 0.154
Change in LAE 1.006
Adjusting and Other Expenses Incurred
Workers' Compensation - New York
Loss Adjustment Expense Analysis (Private Carrier Experience)
Paid Defense & Cost Containment Expense by Policy Year @12/16 Paid Defense & Cost Containment Expense by Accident Year @12/16
Page 26
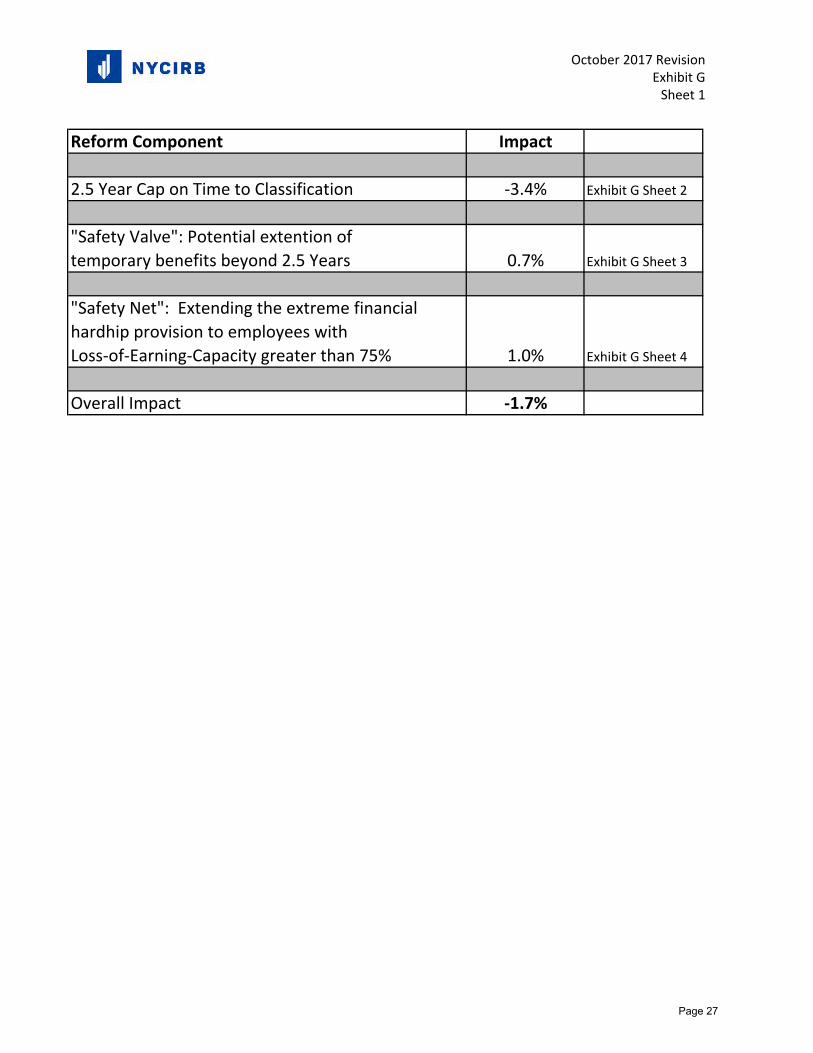
October 2017 RevisionExhibit G
Sheet 1
Reform Component Impact
2.5 Year Cap on Time to Classification ‐3.4% Exhibit G Sheet 2
"Safety Valve": Potential extention of
temporary benefits beyond 2.5 Years 0.7% Exhibit G Sheet 3
"Safety Net": Extending the extreme financial
hardhip provision to employees with
Loss‐of‐Earning‐Capacity greater than 75% 1.0% Exhibit G Sheet 4
Overall Impact ‐1.7%
Page 27
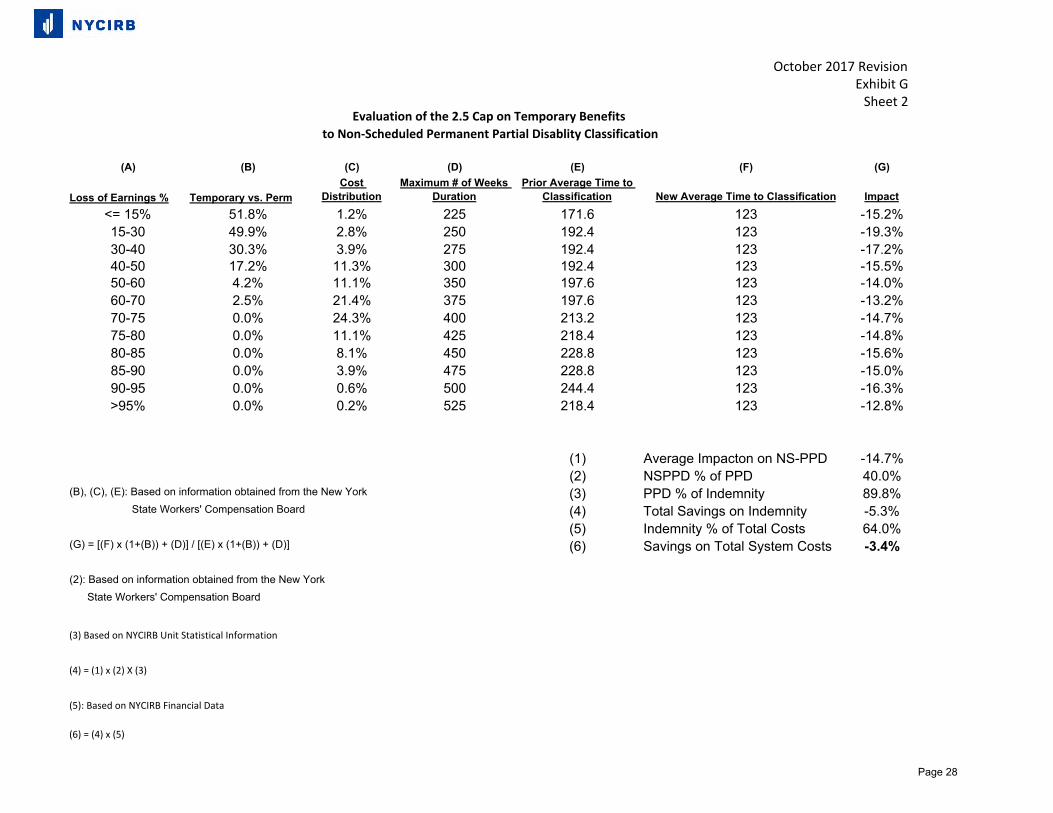
(A) (B) (C) (D) (E) (F) (G)
Loss of Earnings % Temporary vs. Perm
Cost Distribution
Maximum # of Weeks Duration
Prior Average Time to Classification New Average Time to Classification Impact
<= 15% 51.8% 1.2% 225 171.6 123 -15.2%15-30 49.9% 2.8% 250 192.4 123 -19.3%30-40 30.3% 3.9% 275 192.4 123 -17.2%40-50 17.2% 11.3% 300 192.4 123 -15.5%50-60 4.2% 11.1% 350 197.6 123 -14.0%60-70 2.5% 21.4% 375 197.6 123 -13.2%70-75 0.0% 24.3% 400 213.2 123 -14.7%75-80 0.0% 11.1% 425 218.4 123 -14.8%80-85 0.0% 8.1% 450 228.8 123 -15.6%85-90 0.0% 3.9% 475 228.8 123 -15.0%90-95 0.0% 0.6% 500 244.4 123 -16.3%>95% 0.0% 0.2% 525 218.4 123 -12.8%
(1) Average Impacton on NS-PPD -14.7%(2) NSPPD % of PPD 40.0%
(B), (C), (E): Based on information obtained from the New York (3) PPD % of Indemnity 89.8%State Workers' Compensation Board (4) Total Savings on Indemnity -5.3%
(5) Indemnity % of Total Costs 64.0%(G) = [(F) x (1+(B)) + (D)] / [(E) x (1+(B)) + (D)] (6) Savings on Total System Costs -3.4%
(2): Based on information obtained from the New York
State Workers' Compensation Board
(3) Based on NYCIRB Unit Statistical Information
(4) = (1) x (2) X (3)
(5): Based on NYCIRB Financial Data
(6) = (4) x (5)
Evaluation of the 2.5 Cap on Temporary Benefits
to Non‐Scheduled Permanent Partial Disablity Classification
October 2017 Revision Exhibit G
Sheet 2
Page 28
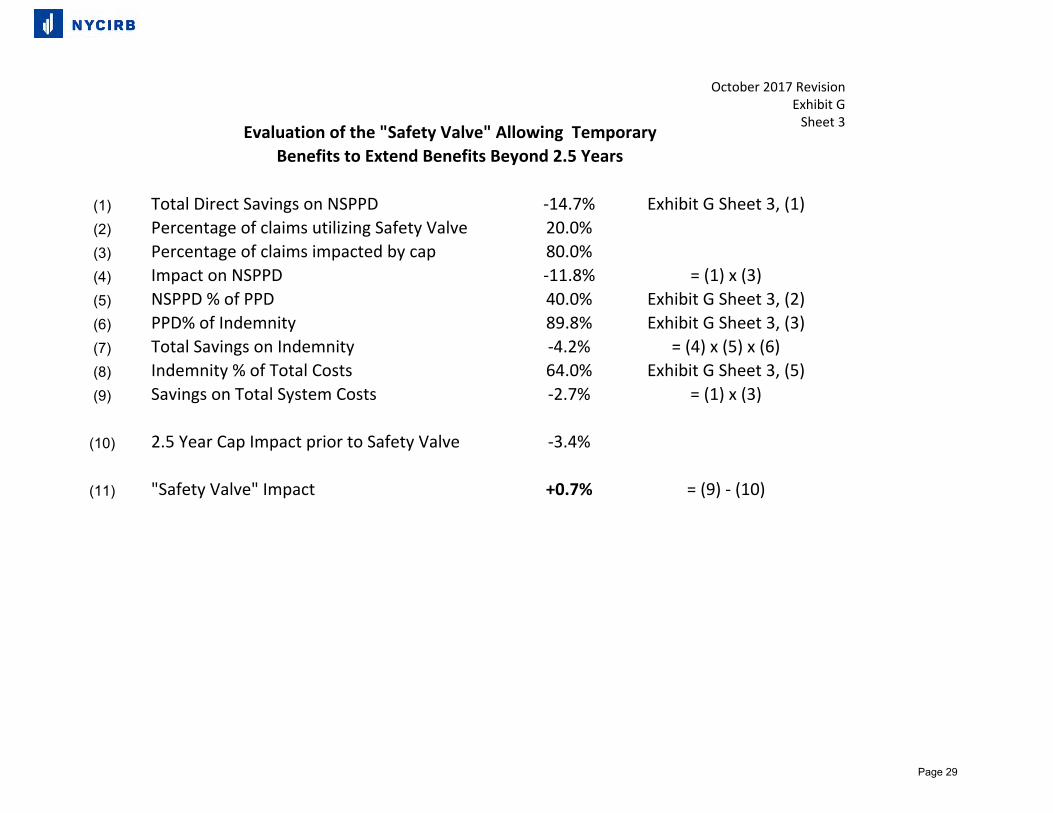
(1) Total Direct Savings on NSPPD ‐14.7% Exhibit G Sheet 3, (1)
(2) Percentage of claims utilizing Safety Valve 20.0%
(3) Percentage of claims impacted by cap 80.0%
(4) Impact on NSPPD ‐11.8% = (1) x (3)
(5) NSPPD % of PPD 40.0% Exhibit G Sheet 3, (2)
(6) PPD% of Indemnity 89.8% Exhibit G Sheet 3, (3)
(7) Total Savings on Indemnity ‐4.2% = (4) x (5) x (6)
(8) Indemnity % of Total Costs 64.0% Exhibit G Sheet 3, (5)
(9) Savings on Total System Costs ‐2.7% = (1) x (3)
(10) 2.5 Year Cap Impact prior to Safety Valve ‐3.4%
(11) "Safety Valve" Impact +0.7% = (9) ‐ (10)
Evaluation of the "Safety Valve" Allowing Temporary
Benefits to Extend Benefits Beyond 2.5 Years
October 2017 Revision Exhibit G
Sheet 3
Page 29
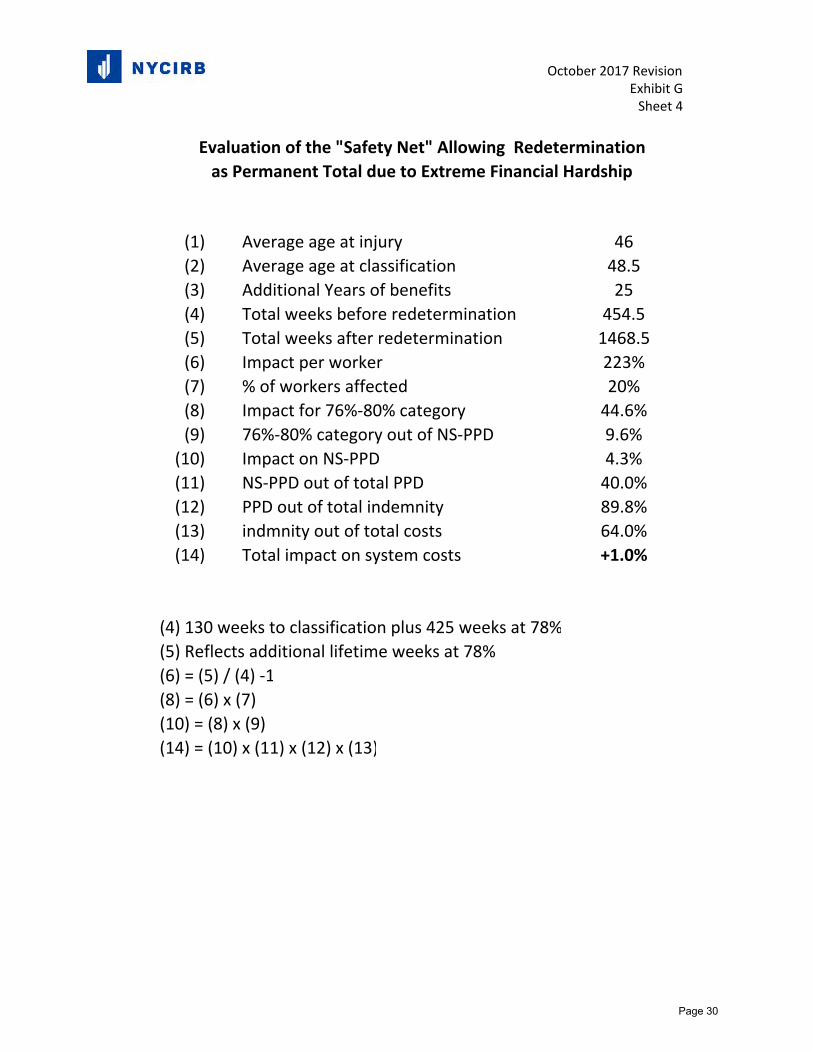
October 2017 Revision Exhibit G
Sheet 4
46
48.5
25
454.5
1468.5
223%
20%
44.6%
9.6%
4.3%
40.0%
89.8%
64.0%
(1) Average age at injury
(2) Average age at classification
(3) Additional Years of benefits
(4) Total weeks before redetermination
(5) Total weeks after redetermination
(6) Impact per worker
(7) % of workers affected
(8) Impact for 76%‐80% category
(9) 76%‐80% category out of NS‐PPD
(10) Impact on NS‐PPD
(11) NS‐PPD out of total PPD
(12) PPD out of total indemnity
(13) indmnity out of total costs
(14) Total impact on system costs +1.0%
(4) 130 weeks to classification plus 425 weeks at 78%
(5) Reflects additional lifetime weeks at 78%
(6) = (5) / (4) ‐1
(8) = (6) x (7)
(10) = (8) x (9)
(14) = (10) x (11) x (12) x (13)
Evaluation of the "Safety Net" Allowing Redetermination
as Permanent Total due to Extreme Financial Hardship
Page 30
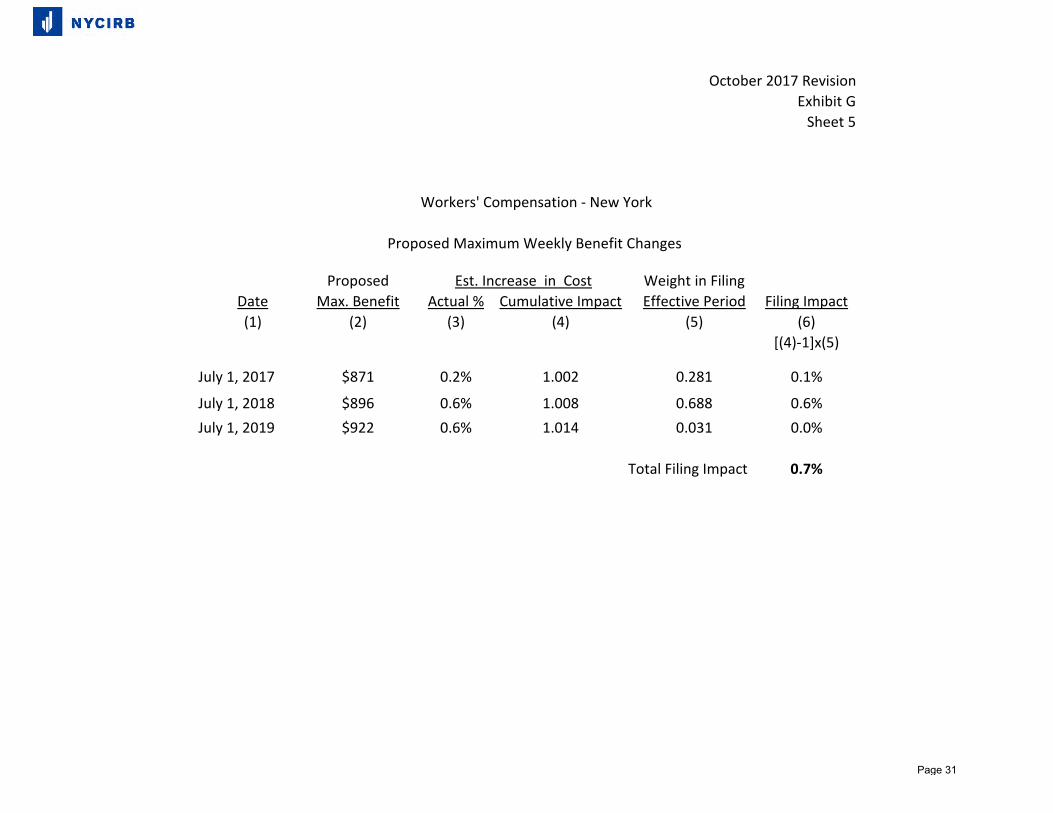
October 2017 Revision
Exhibit GSheet 5
Proposed Weight in FilingDate Max. Benefit Actual % Cumulative Impact Effective Period Filing Impact(1) (2) (3) (4) (5) (6)
[(4)-1]x(5)
July 1, 2017 $871 0.2% 1.002 0.281 0.1%
July 1, 2018 $896 0.6% 1.008 0.688 0.6%July 1, 2019 $922 0.6% 1.014 0.031 0.0%
0.7%Total Filing Impact
Workers' Compensation - New York
Proposed Maximum Weekly Benefit Changes
Est. Increase in Cost
Page 31
October 2017 Revision
Exhibit H
In the October 1, 2015 loss cost filing, the charge for terrorism was changed to reflect the higher carrier
retentions required by the enactment of the Terrorism Risk Insurance Program Reauthorization Act of 2015
(TRIPRA). The charge for natural disasters and catastrophic industrial accidents was last updated as part of
the 2008 Loss Cost revision.
In this filing, no changes to these catastrophe charges are being proposed. Consequently, the currently approved
loss cost for terrorism will remain at $ .045 per $100 of payroll (3.4% of premium for per capita classes) and the
current loss cost for natural disasters and catastrophic industrial accidents will remain at $ .008 per $100 of
payroll (0.7% of premium for per capita classes).
Workers' Compensation - New York Terrorism and Catastrophe Charges
Page 32
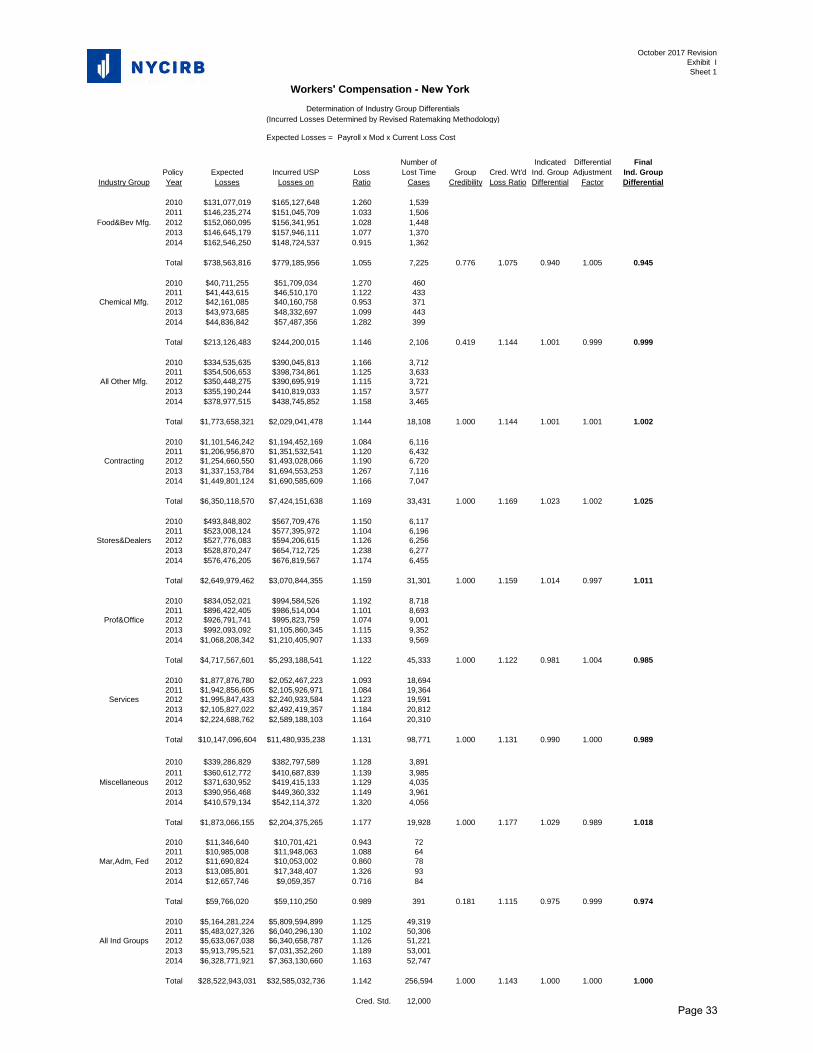
October 2017 RevisionExhibit ISheet 1
Number of Indicated Differential FinalPolicy Expected Incurred USP Loss Lost Time Group Cred. Wt'd Ind. Group Adjustment Ind. Group
Industry Group Year Losses Losses on Ratio Cases Credibility Loss Ratio Differential Factor Differential
2010 $131,077,019 $165,127,648 1.260 1,5392011 $146,235,274 $151,045,709 1.033 1,506
Food&Bev Mfg. 2012 $152,060,095 $156,341,951 1.028 1,4482013 $146,645,179 $157,946,111 1.077 1,3702014 $162,546,250 $148,724,537 0.915 1,362
Total $738,563,816 $779,185,956 1.055 7,225 0.776 1.075 0.940 1.005 0.945
2010 $40,711,255 $51,709,034 1.270 4602011 $41,443,615 $46,510,170 1.122 433
Chemical Mfg. 2012 $42,161,085 $40,160,758 0.953 3712013 $43,973,685 $48,332,697 1.099 4432014 $44,836,842 $57,487,356 1.282 399
Total $213,126,483 $244,200,015 1.146 2,106 0.419 1.144 1.001 0.999 0.999
2010 $334,535,635 $390,045,813 1.166 3,7122011 $354,506,653 $398,734,861 1.125 3,633
All Other Mfg. 2012 $350,448,275 $390,695,919 1.115 3,7212013 $355,190,244 $410,819,033 1.157 3,5772014 $378,977,515 $438,745,852 1.158 3,465
Total $1,773,658,321 $2,029,041,478 1.144 18,108 1.000 1.144 1.001 1.001 1.002
2010 $1,101,546,242 $1,194,452,169 1.084 6,1162011 $1,206,956,870 $1,351,532,541 1.120 6,432
Contracting 2012 $1,254,660,550 $1,493,028,066 1.190 6,7202013 $1,337,153,784 $1,694,553,253 1.267 7,1162014 $1,449,801,124 $1,690,585,609 1.166 7,047
Total $6,350,118,570 $7,424,151,638 1.169 33,431 1.000 1.169 1.023 1.002 1.025
2010 $493,848,802 $567,709,476 1.150 6,1172011 $523,008,124 $577,395,972 1.104 6,196
Stores&Dealers 2012 $527,776,083 $594,206,615 1.126 6,2562013 $528,870,247 $654,712,725 1.238 6,2772014 $576,476,205 $676,819,567 1.174 6,455
Total $2,649,979,462 $3,070,844,355 1.159 31,301 1.000 1.159 1.014 0.997 1.011
2010 $834,052,021 $994,584,526 1.192 8,7182011 $896,422,405 $986,514,004 1.101 8,693
Prof&Office 2012 $926,791,741 $995,823,759 1.074 9,0012013 $992,093,092 $1,105,860,345 1.115 9,3522014 $1,068,208,342 $1,210,405,907 1.133 9,569
Total $4,717,567,601 $5,293,188,541 1.122 45,333 1.000 1.122 0.981 1.004 0.985
2010 $1,877,876,780 $2,052,467,223 1.093 18,6942011 $1,942,856,605 $2,105,926,971 1.084 19,364
Services 2012 $1,995,847,433 $2,240,933,584 1.123 19,5912013 $2,105,827,022 $2,492,419,357 1.184 20,8122014 $2,224,688,762 $2,589,188,103 1.164 20,310
Total $10,147,096,604 $11,480,935,238 1.131 98,771 1.000 1.131 0.990 1.000 0.989
2010 $339,286,829 $382,797,589 1.128 3,8912011 $360,612,772 $410,687,839 1.139 3,985
Miscellaneous 2012 $371,630,952 $419,415,133 1.129 4,0352013 $390,956,468 $449,360,332 1.149 3,9612014 $410,579,134 $542,114,372 1.320 4,056
Total $1,873,066,155 $2,204,375,265 1.177 19,928 1.000 1.177 1.029 0.989 1.018
2010 $11,346,640 $10,701,421 0.943 722011 $10,985,008 $11,948,063 1.088 64
Mar,Adm, Fed 2012 $11,690,824 $10,053,002 0.860 782013 $13,085,801 $17,348,407 1.326 932014 $12,657,746 $9,059,357 0.716 84
Total $59,766,020 $59,110,250 0.989 391 0.181 1.115 0.975 0.999 0.974
2010 $5,164,281,224 $5,809,594,899 1.125 49,3192011 $5,483,027,326 $6,040,296,130 1.102 50,306
All Ind Groups 2012 $5,633,067,038 $6,340,658,787 1.126 51,2212013 $5,913,795,521 $7,031,352,260 1.189 53,0012014 $6,328,771,921 $7,363,130,660 1.163 52,747
Total $28,522,943,031 $32,585,032,736 1.142 256,594 1.000 1.143 1.000 1.000 1.000
Cred. Std. 12,000
Workers' Compensation - New YorkDetermination of Industry Group Differentials
(Incurred Losses Determined by Revised Ratemaking Methodology)
Expected Losses = Payroll x Mod x Current Loss Cost
Page 33
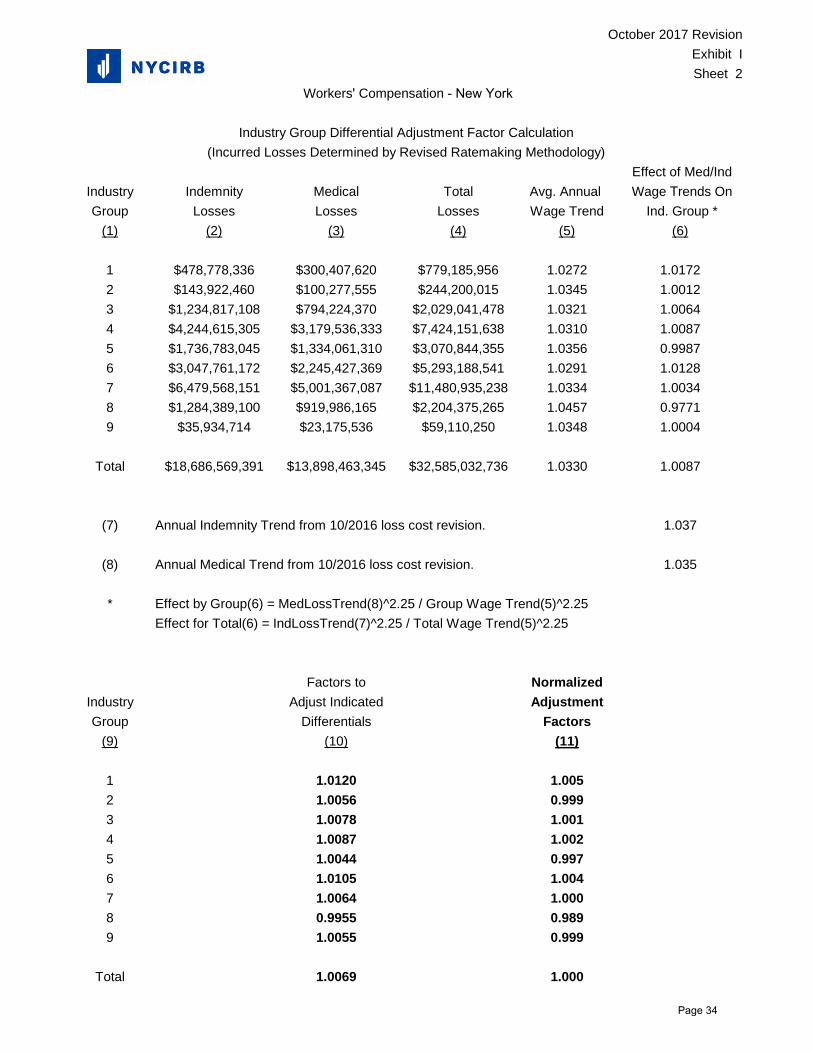
October 2017 RevisionExhibit I
Sheet 2 Workers' Compensation - New York
Industry Group Differential Adjustment Factor Calculation(Incurred Losses Determined by Revised Ratemaking Methodology)
Industry Indemnity Medical Total Avg. AnnualGroup Losses Losses Losses Wage Trend
Effect of Med/Ind
Wage Trends On Ind. Group *
(1) (2) (3) (4) (5) (6)
1 $478,778,336 $300,407,620 $779,185,956 1.0272 1.01722 $143,922,460 $100,277,555 $244,200,015 1.0345 1.00123 $1,234,817,108 $794,224,370 $2,029,041,478 1.0321 1.00644 $4,244,615,305 $3,179,536,333 $7,424,151,638 1.0310 1.00875 $1,736,783,045 $1,334,061,310 $3,070,844,355 1.0356 0.99876 $3,047,761,172 $2,245,427,369 $5,293,188,541 1.0291 1.01287 $6,479,568,151 $5,001,367,087 $11,480,935,238 1.0334 1.00348 $1,284,389,100 $919,986,165 $2,204,375,265 1.0457 0.97719 $35,934,714 $23,175,536 $59,110,250 1.0348 1.0004
Total $18,686,569,391 $13,898,463,345 $32,585,032,736 1.0330 1.0087
(7) Annual Indemnity Trend from 10/2016 loss cost revision. 1.037
(8) Annual Medical Trend from 10/2016 loss cost revision. 1.035
* Effect by Group(6) = MedLossTrend(8)^2.25 / Group Wage Trend(5)^2.25Effect for Total(6) = IndLossTrend(7)^2.25 / Total Wage Trend(5)^2.25
Factors to NormalizedIndustry Adjust Indicated AdjustmentGroup Differentials Factors
(9) (10) (11)
1 1.0120 1.0052 1.0056 0.9993 1.0078 1.0014 1.0087 1.0025 1.0044 0.9976 1.0105 1.0047 1.0064 1.0008 0.9955 0.9899 1.0055 0.999
Total 1.0069 1.000
Page 34
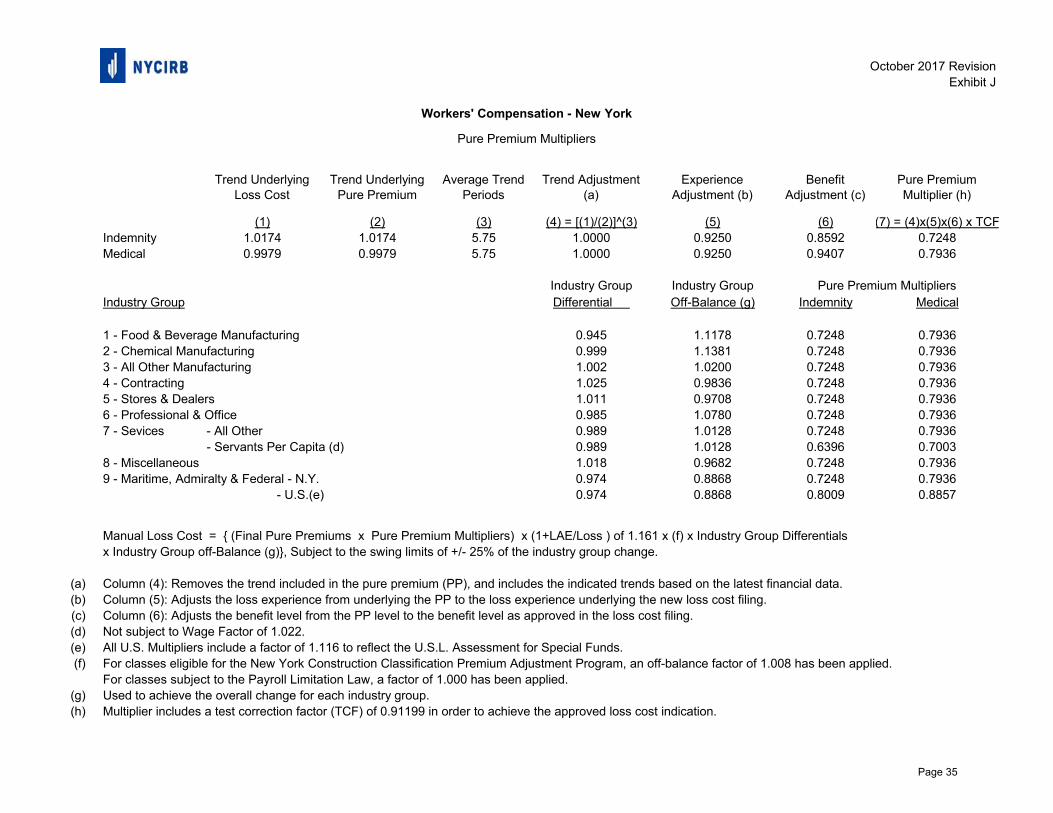
October 2017 RevisionExhibit J
Trend Underlying Loss Cost
Trend Underlying Pure Premium
Average Trend Periods
Trend Adjustment (a)
Experience Adjustment (b)
Benefit Adjustment (c)
Pure Premium Multiplier (h)
(1) (2) (3) (4) = [(1)/(2)]^(3) (5) (6) (7) = (4)x(5)x(6) x TCFIndemnity 1.0174 1.0174 5.75 1.0000 0.9250 0.8592 0.7248Medical 0.9979 0.9979 5.75 1.0000 0.9250 0.9407 0.7936
Industry Group Industry GroupIndustry Group Differential Off-Balance (g) Indemnity Medical
1 - Food & Beverage Manufacturing 0.945 1.1178 0.7248 0.79362 - Chemical Manufacturing 0.999 1.1381 0.7248 0.79363 - All Other Manufacturing 1.002 1.0200 0.7248 0.79364 - Contracting 1.025 0.9836 0.7248 0.79365 - Stores & Dealers 1.011 0.9708 0.7248 0.79366 - Professional & Office 0.985 1.0780 0.7248 0.79367 - Sevices - All Other 0.989 1.0128 0.7248 0.7936
- Servants Per Capita (d) 0.989 1.0128 0.6396 0.70038 - Miscellaneous 1.018 0.9682 0.7248 0.79369 - Maritime, Admiralty & Federal - N.Y. 0.974 0.8868 0.7248 0.7936
- U.S.(e) 0.974 0.8868 0.8009 0.8857
Manual Loss Cost = { (Final Pure Premiums x Pure Premium Multipliers) x (1+LAE/Loss ) of 1.161 x (f) x Industry Group Differentials x Industry Group off-Balance (g)}, Subject to the swing limits of +/- 25% of the industry group change.
(a) Column (4): Removes the trend included in the pure premium (PP), and includes the indicated trends based on the latest financial data.(b) Column (5): Adjusts the loss experience from underlying the PP to the loss experience underlying the new loss cost filing.(c) Column (6): Adjusts the benefit level from the PP level to the benefit level as approved in the loss cost filing.(d) Not subject to Wage Factor of 1.022.(e) All U.S. Multipliers include a factor of 1.116 to reflect the U.S.L. Assessment for Special Funds.(f) For classes eligible for the New York Construction Classification Premium Adjustment Program, an off-balance factor of 1.008 has been applied.
For classes subject to the Payroll Limitation Law, a factor of 1.000 has been applied.(g) Used to achieve the overall change for each industry group.(h) Multiplier includes a test correction factor (TCF) of 0.91199 in order to achieve the approved loss cost indication.
Pure Premium Multipliers
Pure Premium Multipliers
Workers' Compensation - New York
Page 35
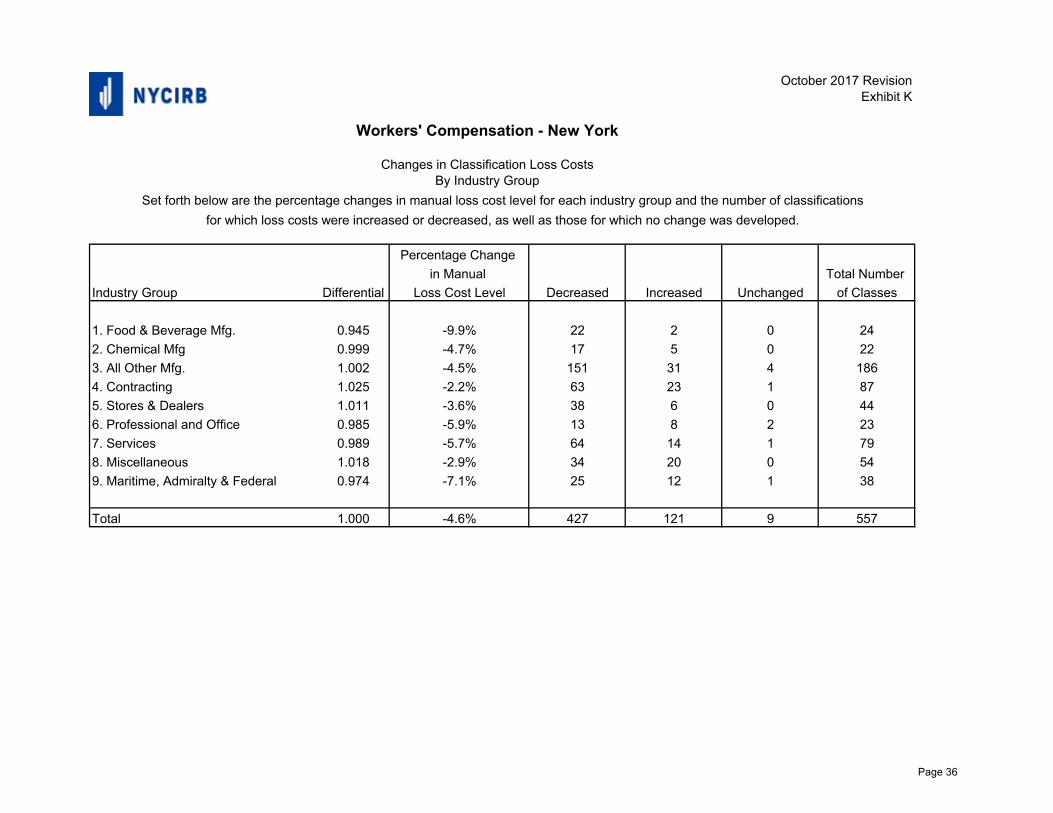
October 2017 RevisionExhibit K
Percentage Change
in Manual Total Number
Industry Group Differential Loss Cost Level Decreased Increased Unchanged of Classes
1 1. Food & Beverage Mfg. 0.945 -9.9% 22 2 0 24
2 2. Chemical Mfg 0.999 -4.7% 17 5 0 22
3 3. All Other Mfg. 1.002 -4.5% 151 31 4 186
4 4. Contracting 1.025 -2.2% 63 23 1 87
5 5. Stores & Dealers 1.011 -3.6% 38 6 0 44
6 6. Professional and Office 0.985 -5.9% 13 8 2 23
7 7. Services 0.989 -5.7% 64 14 1 79
8 8. Miscellaneous 1.018 -2.9% 34 20 0 54
9 9. Maritime, Admiralty & Federal 0.974 -7.1% 25 12 1 38
Total 1.000 -4.6% 427 121 9 557
Workers' Compensation - New York
Changes in Classification Loss CostsBy Industry Group
Set forth below are the percentage changes in manual loss cost level for each industry group and the number of classifications
for which loss costs were increased or decreased, as well as those for which no change was developed.
Page 36
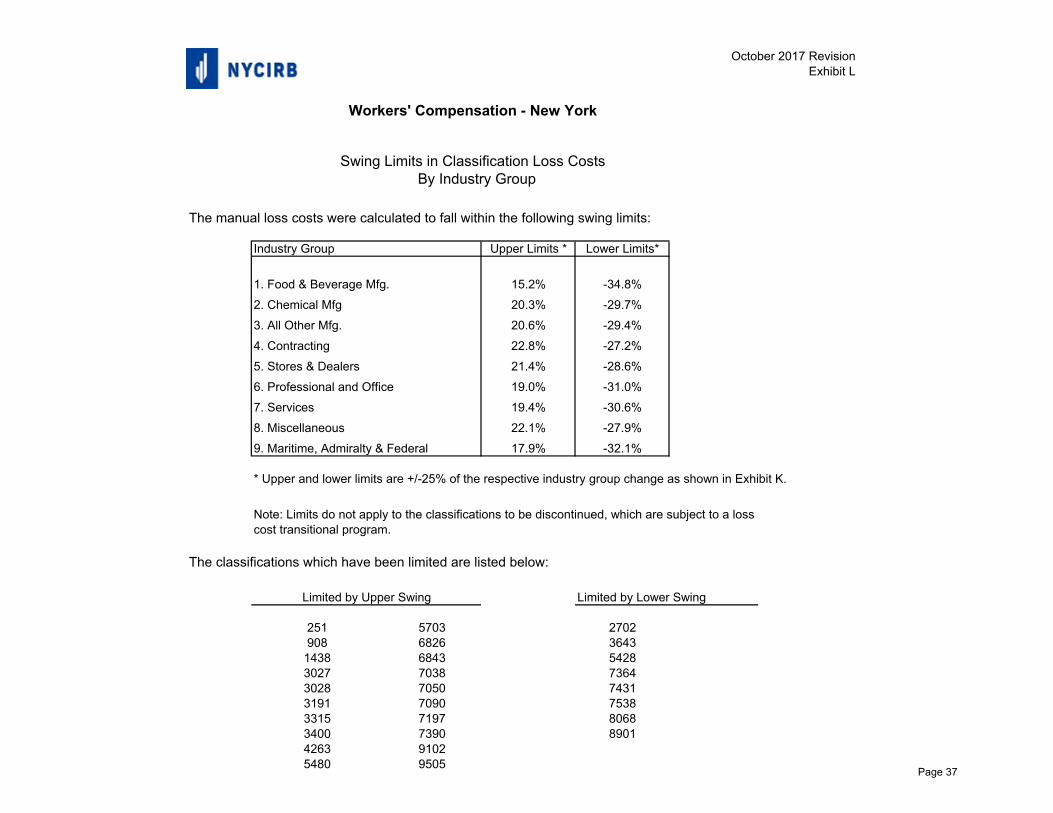
October 2017 RevisionExhibit L
The manual loss costs were calculated to fall within the following swing limits:
Industry Group Upper Limits * Lower Limits*
1. Food & Beverage Mfg. 15.2% -34.8%
2. Chemical Mfg 20.3% -29.7%
3. All Other Mfg. 20.6% -29.4%
4. Contracting 22.8% -27.2%
5. Stores & Dealers 21.4% -28.6%
6. Professional and Office 19.0% -31.0%
7. Services 19.4% -30.6%
8. Miscellaneous 22.1% -27.9%
9. Maritime, Admiralty & Federal 17.9% -32.1%
* Upper and lower limits are +/-25% of the respective industry group change as shown in Exhibit K.
The classifications which have been limited are listed below:
Limited by Lower Swing
251 5703 2702908 6826 3643
1438 6843 54283027 7038 73643028 7050 74313191 7090 75383315 7197 80683400 7390 89014263 91025480 9505
Limited by Upper Swing
Workers' Compensation - New York
Swing Limits in Classification Loss Costs By Industry Group
Note: Limits do not apply to the classifications to be discontinued, which are subject to a loss cost transitional program.
Page 37
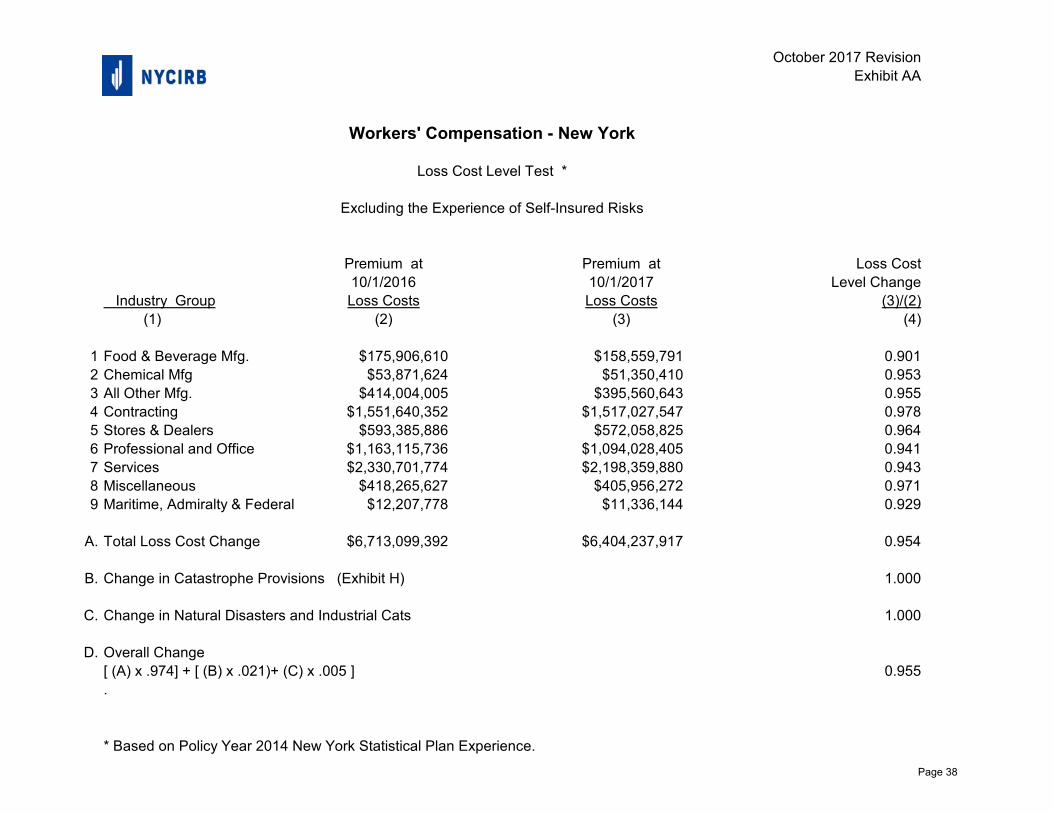
October 2017 RevisionExhibit AA
Workers' Compensation - New York
Loss Cost Level Test *
Excluding the Experience of Self-Insured Risks
Premium at Premium at Loss Cost10/1/2016 10/1/2017 Level Change
Industry Group Loss Costs Loss Costs (3)/(2) (1) (2) (3) (4)
1 Food & Beverage Mfg. $175,906,610 $158,559,791 0.9012 Chemical Mfg $53,871,624 $51,350,410 0.9533 All Other Mfg. $414,004,005 $395,560,643 0.9554 Contracting $1,551,640,352 $1,517,027,547 0.9785 Stores & Dealers $593,385,886 $572,058,825 0.9646 Professional and Office $1,163,115,736 $1,094,028,405 0.9417 Services $2,330,701,774 $2,198,359,880 0.9438 Miscellaneous $418,265,627 $405,956,272 0.9719 Maritime, Admiralty & Federal $12,207,778 $11,336,144 0.929
A. Total Loss Cost Change $6,713,099,392 $6,404,237,917 0.954
B. Change in Catastrophe Provisions (Exhibit H) 1.000
C. Change in Natural Disasters and Industrial Cats 1.000
D. Overall Change[ (A) x .974] + [ (B) x .021)+ (C) x .005 ] 0.955.
* Based on Policy Year 2014 New York Statistical Plan Experience.
Page 38
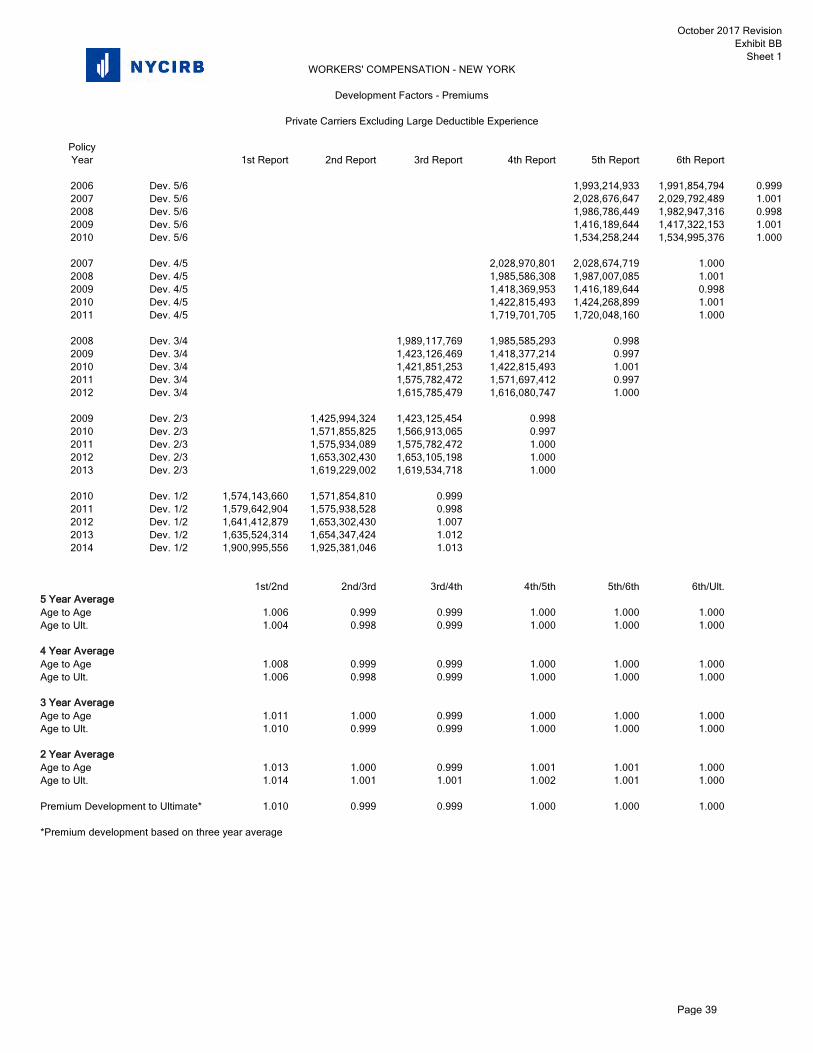
October 2017 RevisionExhibit BB
Sheet 1
PolicyYear 1st Report 2nd Report 3rd Report 4th Report 5th Report 6th Report
2006 Dev. 5/6 1,993,214,933 1,991,854,794 0.9992007 Dev. 5/6 2,028,676,647 2,029,792,489 1.0012008 Dev. 5/6 1,986,786,449 1,982,947,316 0.9982009 Dev. 5/6 1,416,189,644 1,417,322,153 1.0012010 Dev. 5/6 1,534,258,244 1,534,995,376 1.000
2007 Dev. 4/5 2,028,970,801 2,028,674,719 1.0002008 Dev. 4/5 1,985,586,308 1,987,007,085 1.0012009 Dev. 4/5 1,418,369,953 1,416,189,644 0.9982010 Dev. 4/5 1,422,815,493 1,424,268,899 1.0012011 Dev. 4/5 1,719,701,705 1,720,048,160 1.000
2008 Dev. 3/4 1,989,117,769 1,985,585,293 0.9982009 Dev. 3/4 1,423,126,469 1,418,377,214 0.9972010 Dev. 3/4 1,421,851,253 1,422,815,493 1.0012011 Dev. 3/4 1,575,782,472 1,571,697,412 0.9972012 Dev. 3/4 1,615,785,479 1,616,080,747 1.000
2009 Dev. 2/3 1,425,994,324 1,423,125,454 0.9982010 Dev. 2/3 1,571,855,825 1,566,913,065 0.9972011 Dev. 2/3 1,575,934,089 1,575,782,472 1.0002012 Dev. 2/3 1,653,302,430 1,653,105,198 1.0002013 Dev. 2/3 1,619,229,002 1,619,534,718 1.000
2010 Dev. 1/2 1,574,143,660 1,571,854,810 0.9992011 Dev. 1/2 1,579,642,904 1,575,938,528 0.9982012 Dev. 1/2 1,641,412,879 1,653,302,430 1.0072013 Dev. 1/2 1,635,524,314 1,654,347,424 1.0122014 Dev. 1/2 1,900,995,556 1,925,381,046 1.013
1st/2nd 2nd/3rd 3rd/4th 4th/5th 5th/6th 6th/Ult.5 Year AverageAge to Age 1.006 0.999 0.999 1.000 1.000 1.000Age to Ult. 1.004 0.998 0.999 1.000 1.000 1.000
4 Year AverageAge to Age 1.008 0.999 0.999 1.000 1.000 1.000Age to Ult. 1.006 0.998 0.999 1.000 1.000 1.000
3 Year AverageAge to Age 1.011 1.000 0.999 1.000 1.000 1.000Age to Ult. 1.010 0.999 0.999 1.000 1.000 1.000
2 Year AverageAge to Age 1.013 1.000 0.999 1.001 1.001 1.000Age to Ult. 1.014 1.001 1.001 1.002 1.001 1.000
Premium Development to Ultimate* 1.010 0.999 0.999 1.000 1.000 1.000
*Premium development based on three year average
WORKERS' COMPENSATION - NEW YORK
Development Factors - Premiums
Private Carriers Excluding Large Deductible Experience
Page 39
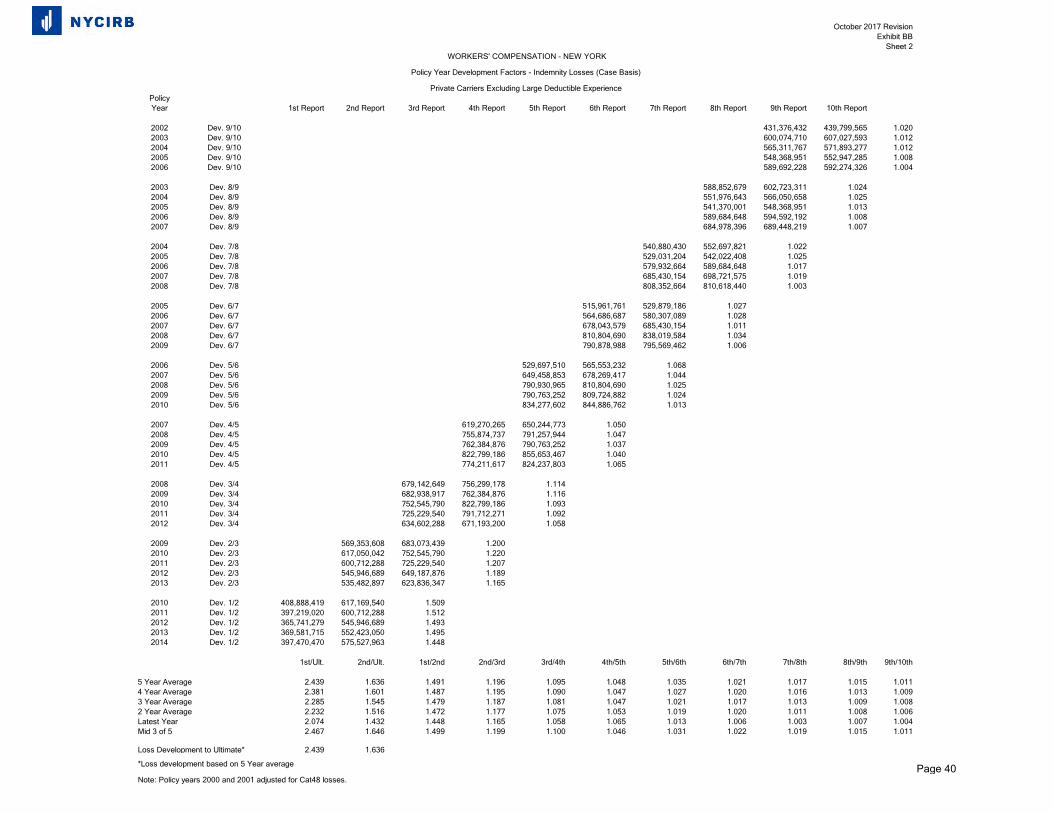
October 2017 RevisionExhibit BB
Sheet 2
PolicyYear 1st Report 2nd Report 3rd Report 4th Report 5th Report 6th Report 7th Report 8th Report 9th Report 10th Report
2002 Dev. 9/10 431,376,432 439,799,565 1.0202003 Dev. 9/10 600,074,710 607,027,593 1.0122004 Dev. 9/10 565,311,767 571,893,277 1.0122005 Dev. 9/10 548,368,951 552,947,285 1.0082006 Dev. 9/10 589,692,228 592,274,326 1.004
2003 Dev. 8/9 588,852,679 602,723,311 1.0242004 Dev. 8/9 551,976,643 566,050,658 1.0252005 Dev. 8/9 541,370,001 548,368,951 1.0132006 Dev. 8/9 589,684,648 594,592,192 1.0082007 Dev. 8/9 684,978,396 689,448,219 1.007
2004 Dev. 7/8 540,880,430 552,697,821 1.0222005 Dev. 7/8 529,031,204 542,022,408 1.0252006 Dev. 7/8 579,932,664 589,684,648 1.0172007 Dev. 7/8 685,430,154 698,721,575 1.0192008 Dev. 7/8 808,352,664 810,618,440 1.003
2005 Dev. 6/7 515,961,761 529,879,186 1.0272006 Dev. 6/7 564,686,687 580,307,089 1.0282007 Dev. 6/7 678,043,579 685,430,154 1.0112008 Dev. 6/7 810,804,690 838,019,584 1.0342009 Dev. 6/7 790,878,988 795,569,462 1.006
2006 Dev. 5/6 529,697,510 565,553,232 1.0682007 Dev. 5/6 649,458,853 678,269,417 1.0442008 Dev. 5/6 790,930,965 810,804,690 1.0252009 Dev. 5/6 790,763,252 809,724,882 1.0242010 Dev. 5/6 834,277,602 844,886,762 1.013
2007 Dev. 4/5 619,270,265 650,244,773 1.0502008 Dev. 4/5 755,874,737 791,257,944 1.0472009 Dev. 4/5 762,384,876 790,763,252 1.0372010 Dev. 4/5 822,799,186 855,653,467 1.0402011 Dev. 4/5 774,211,617 824,237,803 1.065
2008 Dev. 3/4 679,142,649 756,299,178 1.1142009 Dev. 3/4 682,938,917 762,384,876 1.1162010 Dev. 3/4 752,545,790 822,799,186 1.0932011 Dev. 3/4 725,229,540 791,712,271 1.0922012 Dev. 3/4 634,602,288 671,193,200 1.058
2009 Dev. 2/3 569,353,608 683,073,439 1.2002010 Dev. 2/3 617,050,042 752,545,790 1.2202011 Dev. 2/3 600,712,288 725,229,540 1.2072012 Dev. 2/3 545,946,689 649,187,876 1.1892013 Dev. 2/3 535,482,897 623,836,347 1.165
2010 Dev. 1/2 408,888,419 617,169,540 1.5092011 Dev. 1/2 397,219,020 600,712,288 1.5122012 Dev. 1/2 365,741,279 545,946,689 1.4932013 Dev. 1/2 369,581,715 552,423,050 1.4952014 Dev. 1/2 397,470,470 575,527,963 1.448
1st/Ult. 2nd/Ult. 1st/2nd 2nd/3rd 3rd/4th 4th/5th 5th/6th 6th/7th 7th/8th 8th/9th 9th/10th
5 Year Average 2.439 1.636 1.491 1.196 1.095 1.048 1.035 1.021 1.017 1.015 1.0114 Year Average 2.381 1.601 1.487 1.195 1.090 1.047 1.027 1.020 1.016 1.013 1.0093 Year Average 2.285 1.545 1.479 1.187 1.081 1.047 1.021 1.017 1.013 1.009 1.0082 Year Average 2.232 1.516 1.472 1.177 1.075 1.053 1.019 1.020 1.011 1.008 1.006Latest Year 2.074 1.432 1.448 1.165 1.058 1.065 1.013 1.006 1.003 1.007 1.004Mid 3 of 5 2.467 1.646 1.499 1.199 1.100 1.046 1.031 1.022 1.019 1.015 1.011
Loss Development to Ultimate* 2.439 1.636
*Loss development based on 5 Year average
Note: Policy years 2000 and 2001 adjusted for Cat48 losses.
WORKERS' COMPENSATION - NEW YORK
Policy Year Development Factors - Indemnity Losses (Case Basis)
Private Carriers Excluding Large Deductible Experience
Page 40
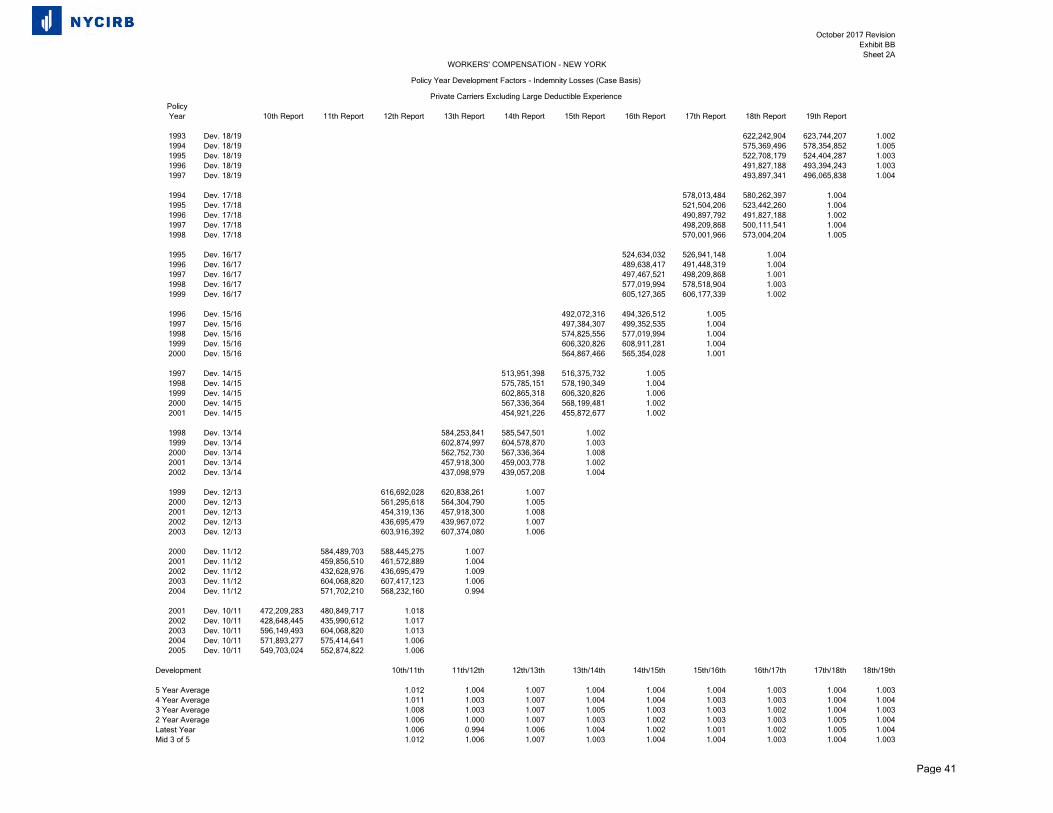
October 2017 RevisionExhibit BBSheet 2A
PolicyYear 10th Report 11th Report 12th Report 13th Report 14th Report 15th Report 16th Report 17th Report 18th Report 19th Report
1993 Dev. 18/19 622,242,904 623,744,207 1.0021994 Dev. 18/19 575,369,496 578,354,852 1.0051995 Dev. 18/19 522,708,179 524,404,287 1.0031996 Dev. 18/19 491,827,188 493,394,243 1.0031997 Dev. 18/19 493,897,341 496,065,838 1.004
1994 Dev. 17/18 578,013,484 580,262,397 1.0041995 Dev. 17/18 521,504,206 523,442,260 1.0041996 Dev. 17/18 490,897,792 491,827,188 1.0021997 Dev. 17/18 498,209,868 500,111,541 1.0041998 Dev. 17/18 570,001,966 573,004,204 1.005
1995 Dev. 16/17 524,634,032 526,941,148 1.0041996 Dev. 16/17 489,638,417 491,448,319 1.0041997 Dev. 16/17 497,467,521 498,209,868 1.0011998 Dev. 16/17 577,019,994 578,518,904 1.0031999 Dev. 16/17 605,127,365 606,177,339 1.002
1996 Dev. 15/16 492,072,316 494,326,512 1.0051997 Dev. 15/16 497,384,307 499,352,535 1.0041998 Dev. 15/16 574,825,556 577,019,994 1.0041999 Dev. 15/16 606,320,826 608,911,281 1.0042000 Dev. 15/16 564,867,466 565,354,028 1.001
1997 Dev. 14/15 513,951,398 516,375,732 1.0051998 Dev. 14/15 575,785,151 578,190,349 1.0041999 Dev. 14/15 602,865,318 606,320,826 1.0062000 Dev. 14/15 567,336,364 568,199,481 1.0022001 Dev. 14/15 454,921,226 455,872,677 1.002
1998 Dev. 13/14 584,253,841 585,547,501 1.0021999 Dev. 13/14 602,874,997 604,578,870 1.0032000 Dev. 13/14 562,752,730 567,336,364 1.0082001 Dev. 13/14 457,918,300 459,003,778 1.0022002 Dev. 13/14 437,098,979 439,057,208 1.004
1999 Dev. 12/13 616,692,028 620,838,261 1.0072000 Dev. 12/13 561,295,618 564,304,790 1.0052001 Dev. 12/13 454,319,136 457,918,300 1.0082002 Dev. 12/13 436,695,479 439,967,072 1.0072003 Dev. 12/13 603,916,392 607,374,080 1.006
2000 Dev. 11/12 584,489,703 588,445,275 1.0072001 Dev. 11/12 459,856,510 461,572,889 1.0042002 Dev. 11/12 432,628,976 436,695,479 1.0092003 Dev. 11/12 604,068,820 607,417,123 1.0062004 Dev. 11/12 571,702,210 568,232,160 0.994
2001 Dev. 10/11 472,209,283 480,849,717 1.0182002 Dev. 10/11 428,648,445 435,990,612 1.0172003 Dev. 10/11 596,149,493 604,068,820 1.0132004 Dev. 10/11 571,893,277 575,414,641 1.0062005 Dev. 10/11 549,703,024 552,874,822 1.006
Development 10th/11th 11th/12th 12th/13th 13th/14th 14th/15th 15th/16th 16th/17th 17th/18th 18th/19th
5 Year Average 1.012 1.004 1.007 1.004 1.004 1.004 1.003 1.004 1.0034 Year Average 1.011 1.003 1.007 1.004 1.004 1.003 1.003 1.004 1.0043 Year Average 1.008 1.003 1.007 1.005 1.003 1.003 1.002 1.004 1.0032 Year Average 1.006 1.000 1.007 1.003 1.002 1.003 1.003 1.005 1.004Latest Year 1.006 0.994 1.006 1.004 1.002 1.001 1.002 1.005 1.004Mid 3 of 5 1.012 1.006 1.007 1.003 1.004 1.004 1.003 1.004 1.003
WORKERS' COMPENSATION - NEW YORK
Policy Year Development Factors - Indemnity Losses (Case Basis)
Private Carriers Excluding Large Deductible Experience
Page 41
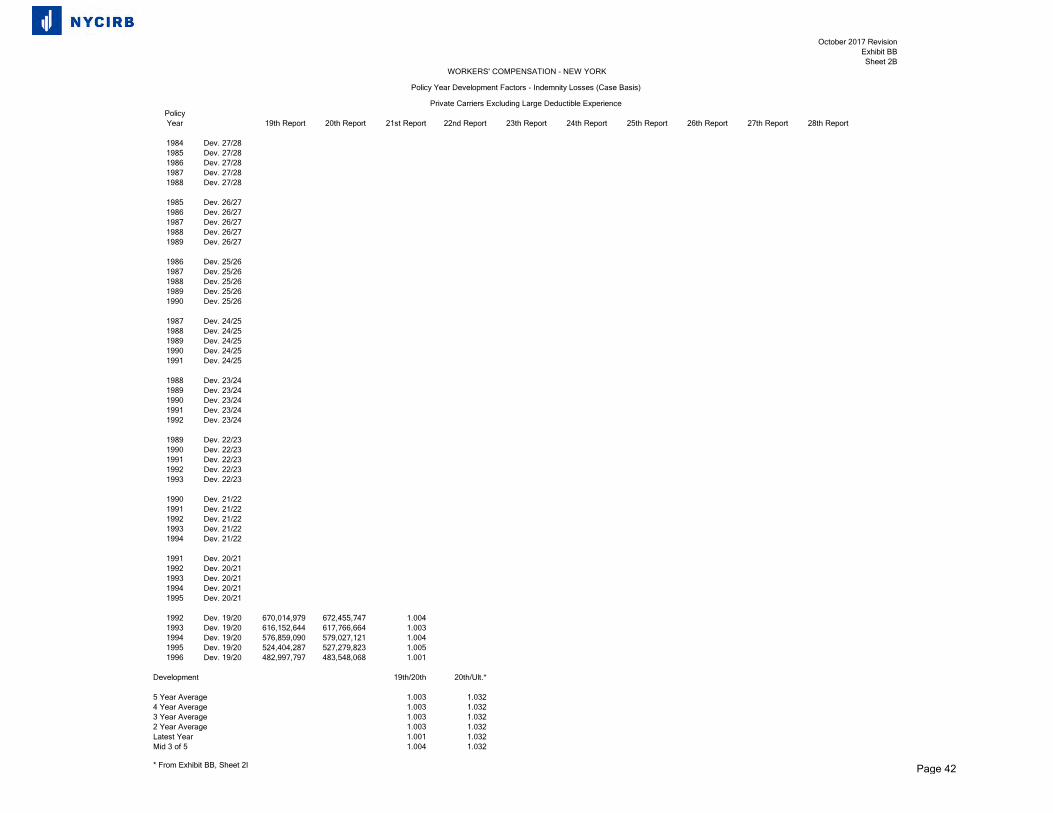
October 2017 RevisionExhibit BBSheet 2B
PolicyYear 19th Report 20th Report 21st Report 22nd Report 23th Report 24th Report 25th Report 26th Report 27th Report 28th Report
1984 Dev. 27/281985 Dev. 27/281986 Dev. 27/281987 Dev. 27/281988 Dev. 27/28
1985 Dev. 26/271986 Dev. 26/271987 Dev. 26/271988 Dev. 26/271989 Dev. 26/27
1986 Dev. 25/261987 Dev. 25/261988 Dev. 25/261989 Dev. 25/261990 Dev. 25/26
1987 Dev. 24/251988 Dev. 24/251989 Dev. 24/251990 Dev. 24/251991 Dev. 24/25
1988 Dev. 23/241989 Dev. 23/241990 Dev. 23/241991 Dev. 23/241992 Dev. 23/24
1989 Dev. 22/231990 Dev. 22/231991 Dev. 22/231992 Dev. 22/231993 Dev. 22/23
1990 Dev. 21/221991 Dev. 21/221992 Dev. 21/221993 Dev. 21/221994 Dev. 21/22
1991 Dev. 20/211992 Dev. 20/211993 Dev. 20/211994 Dev. 20/211995 Dev. 20/21
1992 Dev. 19/20 670,014,979 672,455,747 1.0041993 Dev. 19/20 616,152,644 617,766,664 1.0031994 Dev. 19/20 576,859,090 579,027,121 1.0041995 Dev. 19/20 524,404,287 527,279,823 1.0051996 Dev. 19/20 482,997,797 483,548,068 1.001
Development 19th/20th 20th/Ult.*
5 Year Average 1.003 1.0324 Year Average 1.003 1.0323 Year Average 1.003 1.0322 Year Average 1.003 1.032
1.001 1.0321.004 1.032
Latest YearMid 3 of 5
* From Exhibit BB, Sheet 2I
WORKERS' COMPENSATION - NEW YORK
Policy Year Development Factors - Indemnity Losses (Case Basis)
Private Carriers Excluding Large Deductible Experience
Page 42
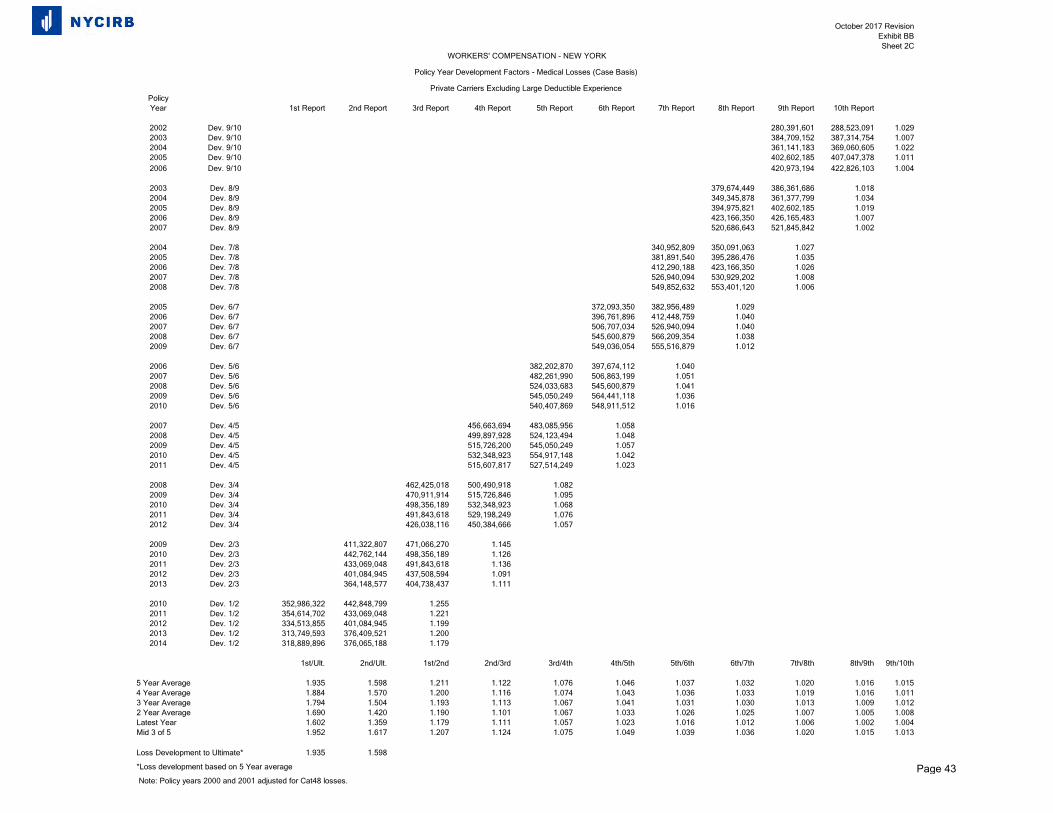
October 2017 RevisionExhibit BBSheet 2C
PolicyYear 1st Report 2nd Report 3rd Report 4th Report 5th Report 6th Report 7th Report 8th Report 9th Report 10th Report
2002 Dev. 9/10 280,391,601 288,523,091 1.0292003 Dev. 9/10 384,709,152 387,314,754 1.0072004 Dev. 9/10 361,141,183 369,060,605 1.0222005 Dev. 9/10 402,602,185 407,047,378 1.0112006 Dev. 9/10 420,973,194 422,826,103 1.004
2003 Dev. 8/9 379,674,449 386,361,686 1.0182004 Dev. 8/9 349,345,878 361,377,799 1.0342005 Dev. 8/9 394,975,821 402,602,185 1.0192006 Dev. 8/9 423,166,350 426,165,483 1.0072007 Dev. 8/9 520,686,643 521,845,842 1.002
2004 Dev. 7/8 340,952,809 350,091,063 1.0272005 Dev. 7/8 381,891,540 395,286,476 1.0352006 Dev. 7/8 412,290,188 423,166,350 1.0262007 Dev. 7/8 526,940,094 530,929,202 1.0082008 Dev. 7/8 549,852,632 553,401,120 1.006
2005 Dev. 6/7 372,093,350 382,956,489 1.0292006 Dev. 6/7 396,761,896 412,448,759 1.0402007 Dev. 6/7 506,707,034 526,940,094 1.0402008 Dev. 6/7 545,600,879 566,209,354 1.0382009 Dev. 6/7 549,036,054 555,516,879 1.012
2006 Dev. 5/6 382,202,870 397,674,112 1.0402007 Dev. 5/6 482,261,990 506,863,199 1.0512008 Dev. 5/6 524,033,683 545,600,879 1.0412009 Dev. 5/6 545,050,249 564,441,118 1.0362010 Dev. 5/6 540,407,869 548,911,512 1.016
2007 Dev. 4/5 456,663,694 483,085,956 1.0582008 Dev. 4/5 499,897,928 524,123,494 1.0482009 Dev. 4/5 515,726,200 545,050,249 1.0572010 Dev. 4/5 532,348,923 554,917,148 1.0422011 Dev. 4/5 515,607,817 527,514,249 1.023
2008 Dev. 3/4 462,425,018 500,490,918 1.0822009 Dev. 3/4 470,911,914 515,726,846 1.0952010 Dev. 3/4 498,356,189 532,348,923 1.0682011 Dev. 3/4 491,843,618 529,198,249 1.0762012 Dev. 3/4 426,038,116 450,384,666 1.057
2009 Dev. 2/3 411,322,807 471,066,270 1.1452010 Dev. 2/3 442,762,144 498,356,189 1.1262011 Dev. 2/3 433,069,048 491,843,618 1.1362012 Dev. 2/3 401,084,945 437,508,594 1.0912013 Dev. 2/3 364,148,577 404,738,437 1.111
2010 Dev. 1/2 352,986,322 442,848,799 1.2552011 Dev. 1/2 354,614,702 433,069,048 1.2212012 Dev. 1/2 334,513,855 401,084,945 1.1992013 Dev. 1/2 313,749,593 376,409,521 1.2002014 Dev. 1/2 318,889,896 376,065,188 1.179
1st/Ult. 2nd/Ult. 1st/2nd 2nd/3rd 3rd/4th 4th/5th 5th/6th 6th/7th 7th/8th 8th/9th 9th/10th
5 Year Average 1.935 1.598 1.211 1.122 1.076 1.046 1.037 1.032 1.020 1.016 1.0154 Year Average 1.884 1.570 1.200 1.116 1.074 1.043 1.036 1.033 1.019 1.016 1.0113 Year Average 1.794 1.504 1.193 1.113 1.067 1.041 1.031 1.030 1.013 1.009 1.0122 Year Average 1.690 1.420 1.190 1.101 1.067 1.033 1.026 1.025 1.007 1.005 1.008Latest Year 1.602 1.359 1.179 1.111 1.057 1.023 1.016 1.012 1.006 1.002 1.004Mid 3 of 5 1.952 1.617 1.207 1.124 1.075 1.049 1.039 1.036 1.020 1.015 1.013
Loss Development to Ultimate* 1.935 1.598
*Loss development based on 5 Year average
Note: Policy years 2000 and 2001 adjusted for Cat48 losses.
WORKERS' COMPENSATION - NEW YORK
Policy Year Development Factors - Medical Losses (Case Basis)
Private Carriers Excluding Large Deductible Experience
Page 43
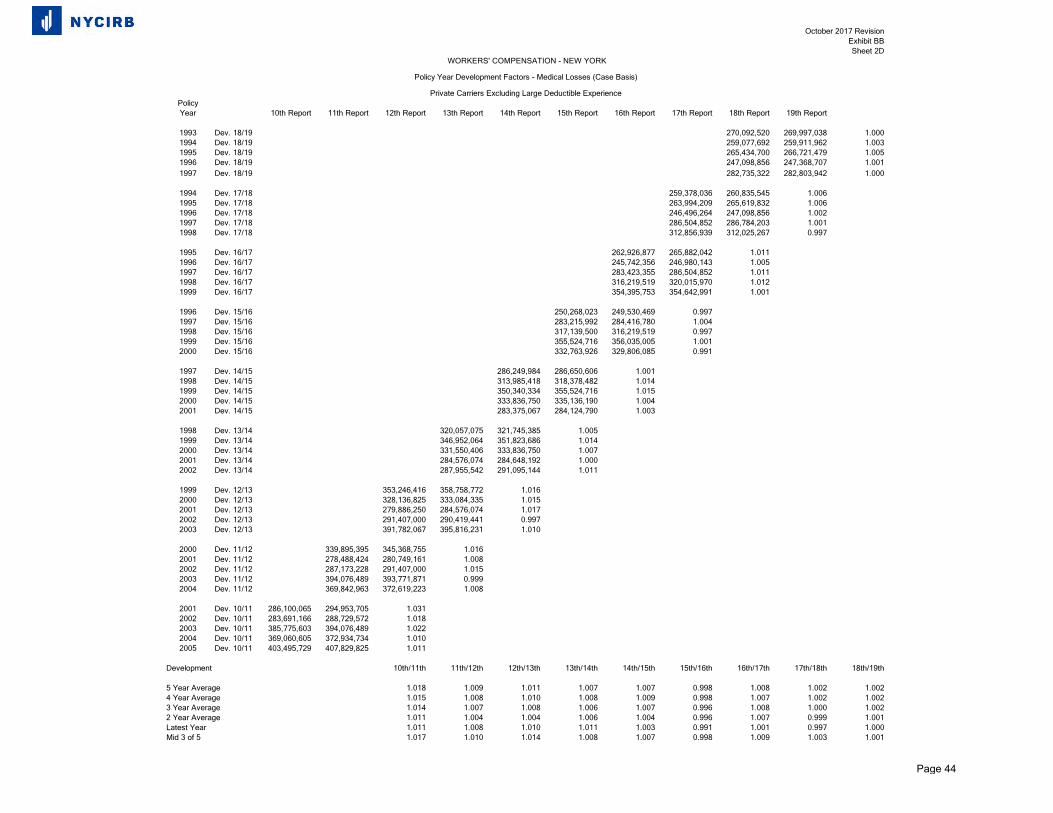
October 2017 RevisionExhibit BBSheet 2D
PolicyYear 10th Report 11th Report 12th Report 13th Report 14th Report 15th Report 16th Report 17th Report 18th Report 19th Report
1993 Dev. 18/19 270,092,520 269,997,038 1.0001994 Dev. 18/19 259,077,692 259,911,962 1.0031995 Dev. 18/19 265,434,700 266,721,479 1.0051996 Dev. 18/19 247,098,856 247,368,707 1.0011997 Dev. 18/19 282,735,322 282,803,942 1.000
1994 Dev. 17/18 259,378,036 260,835,545 1.0061995 Dev. 17/18 263,994,209 265,619,832 1.0061996 Dev. 17/18 246,496,264 247,098,856 1.0021997 Dev. 17/18 286,504,852 286,784,203 1.0011998 Dev. 17/18 312,856,939 312,025,267 0.997
1995 Dev. 16/17 262,926,877 265,882,042 1.0111996 Dev. 16/17 245,742,356 246,980,143 1.0051997 Dev. 16/17 283,423,355 286,504,852 1.0111998 Dev. 16/17 316,219,519 320,015,970 1.0121999 Dev. 16/17 354,395,753 354,642,991 1.001
1996 Dev. 15/16 250,268,023 249,530,469 0.9971997 Dev. 15/16 283,215,992 284,416,780 1.0041998 Dev. 15/16 317,139,500 316,219,519 0.9971999 Dev. 15/16 355,524,716 356,035,005 1.0012000 Dev. 15/16 332,763,926 329,806,085 0.991
1997 Dev. 14/15 286,249,984 286,650,606 1.0011998 Dev. 14/15 313,985,418 318,378,482 1.0141999 Dev. 14/15 350,340,334 355,524,716 1.0152000 Dev. 14/15 333,836,750 335,136,190 1.0042001 Dev. 14/15 283,375,067 284,124,790 1.003
1998 Dev. 13/14 320,057,075 321,745,385 1.0051999 Dev. 13/14 346,952,064 351,823,686 1.0142000 Dev. 13/14 331,550,406 333,836,750 1.0072001 Dev. 13/14 284,576,074 284,648,192 1.0002002 Dev. 13/14 287,955,542 291,095,144 1.011
1999 Dev. 12/13 353,246,416 358,758,772 1.0162000 Dev. 12/13 328,136,825 333,084,335 1.0152001 Dev. 12/13 279,886,250 284,576,074 1.0172002 Dev. 12/13 291,407,000 290,419,441 0.9972003 Dev. 12/13 391,782,067 395,816,231 1.010
2000 Dev. 11/12 339,895,395 345,368,755 1.0162001 Dev. 11/12 278,488,424 280,749,161 1.0082002 Dev. 11/12 287,173,228 291,407,000 1.0152003 Dev. 11/12 394,076,489 393,771,871 0.9992004 Dev. 11/12 369,842,963 372,619,223 1.008
2001 Dev. 10/11 286,100,065 294,953,705 1.0312002 Dev. 10/11 283,691,166 288,729,572 1.0182003 Dev. 10/11 385,775,603 394,076,489 1.0222004 Dev. 10/11 369,060,605 372,934,734 1.0102005 Dev. 10/11 403,495,729 407,829,825 1.011
Development 10th/11th 11th/12th 12th/13th 13th/14th 14th/15th 15th/16th 16th/17th 17th/18th 18th/19th
5 Year Average 1.018 1.009 1.011 1.007 1.007 0.998 1.008 1.002 1.0024 Year Average 1.015 1.008 1.010 1.008 1.009 0.998 1.007 1.002 1.0023 Year Average 1.014 1.007 1.008 1.006 1.007 0.996 1.008 1.000 1.0022 Year Average 1.011 1.004 1.004 1.006 1.004 0.996 1.007 0.999 1.001Latest Year 1.011 1.008 1.010 1.011 1.003 0.991 1.001 0.997 1.000Mid 3 of 5 1.017 1.010 1.014 1.008 1.007 0.998 1.009 1.003 1.001
WORKERS' COMPENSATION - NEW YORK
Policy Year Development Factors - Medical Losses (Case Basis)
Private Carriers Excluding Large Deductible Experience
Page 44
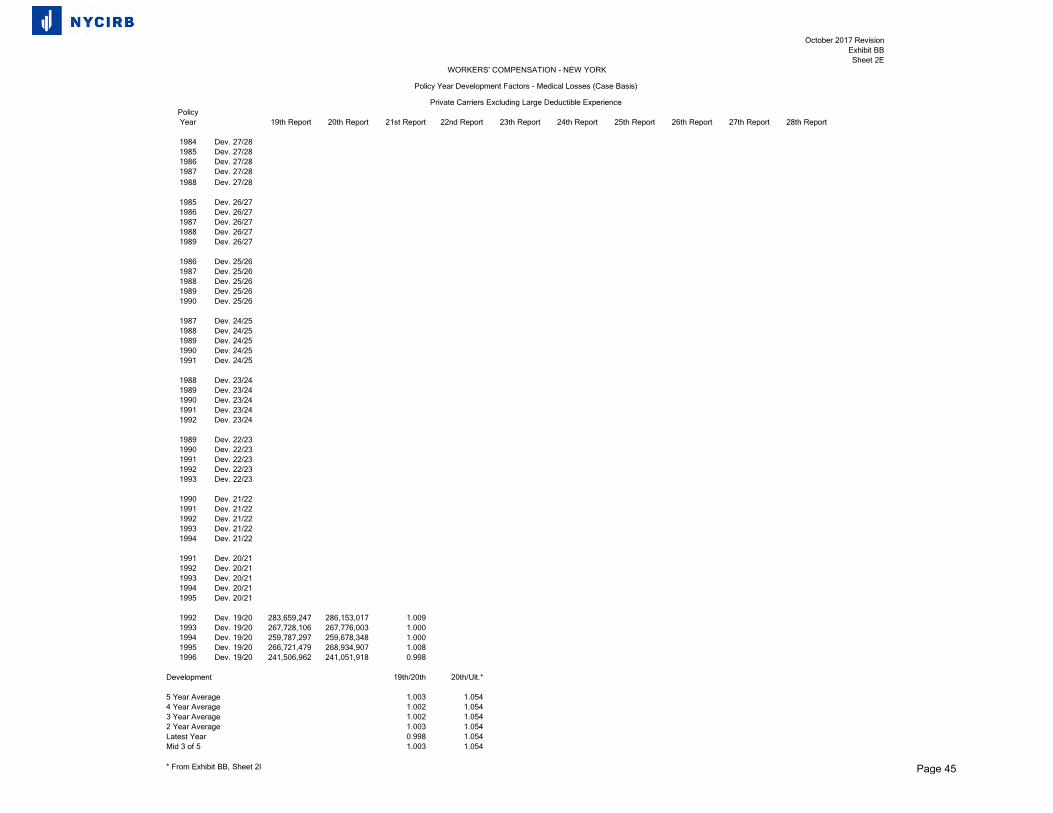
October 2017 RevisionExhibit BBSheet 2E
PolicyYear 19th Report 20th Report 21st Report 22nd Report 23th Report 24th Report 25th Report 26th Report 27th Report 28th Report
1984 Dev. 27/281985 Dev. 27/281986 Dev. 27/281987 Dev. 27/281988 Dev. 27/28
1985 Dev. 26/271986 Dev. 26/271987 Dev. 26/271988 Dev. 26/271989 Dev. 26/27
1986 Dev. 25/261987 Dev. 25/261988 Dev. 25/261989 Dev. 25/261990 Dev. 25/26
1987 Dev. 24/251988 Dev. 24/251989 Dev. 24/251990 Dev. 24/251991 Dev. 24/25
1988 Dev. 23/241989 Dev. 23/241990 Dev. 23/241991 Dev. 23/241992 Dev. 23/24
1989 Dev. 22/231990 Dev. 22/231991 Dev. 22/231992 Dev. 22/231993 Dev. 22/23
1990 Dev. 21/221991 Dev. 21/221992 Dev. 21/221993 Dev. 21/221994 Dev. 21/22
1991 Dev. 20/211992 Dev. 20/211993 Dev. 20/211994 Dev. 20/211995 Dev. 20/21
1992 Dev. 19/20 283,659,247 286,153,017 1.0091993 Dev. 19/20 267,728,106 267,776,003 1.0001994 Dev. 19/20 259,787,297 259,678,348 1.0001995 Dev. 19/20 266,721,479 268,934,907 1.0081996 Dev. 19/20 241,506,962 241,051,918 0.998
Development 19th/20th 20th/Ult.*
5 Year Average 1.003 1.0544 Year Average 1.002 1.0543 Year Average 1.002 1.0542 Year Average 1.003 1.054Latest Year 0.998 1.054Mid 3 of 5 1.003 1.054
* From Exhibit BB, Sheet 2I
WORKERS' COMPENSATION - NEW YORK
Policy Year Development Factors - Medical Losses (Case Basis)
Private Carriers Excluding Large Deductible Experience
Page 45
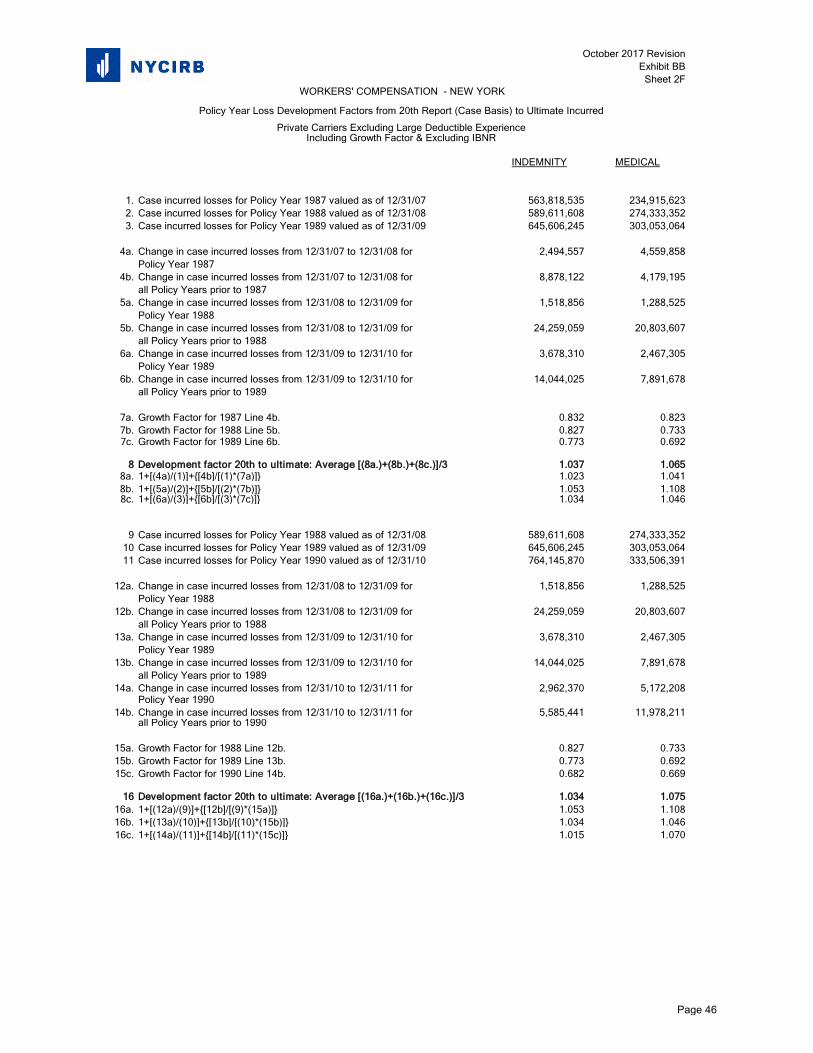
October 2017 RevisionExhibit BB
Sheet 2F
INDEMNITY MEDICAL
1. Case incurred losses for Policy Year 1987 valued as of 12/31/07 563,818,535 234,915,6232. Case incurred losses for Policy Year 1988 valued as of 12/31/08 589,611,608 274,333,3523. Case incurred losses for Policy Year 1989 valued as of 12/31/09 645,606,245 303,053,064
4a. Change in case incurred losses from 12/31/07 to 12/31/08 for 2,494,557 4,559,858Policy Year 1987
4b. Change in case incurred losses from 12/31/07 to 12/31/08 for 8,878,122 4,179,195all Policy Years prior to 1987
5a. Change in case incurred losses from 12/31/08 to 12/31/09 for 1,518,856 1,288,525Policy Year 1988
5b. Change in case incurred losses from 12/31/08 to 12/31/09 for 24,259,059 20,803,607all Policy Years prior to 1988
6a. Change in case incurred losses from 12/31/09 to 12/31/10 for 3,678,310 2,467,305Policy Year 1989
6b. Change in case incurred losses from 12/31/09 to 12/31/10 for 14,044,025 7,891,678all Policy Years prior to 1989
7a. Growth Factor for 1987 Line 4b. 0.832 0.8237b. Growth Factor for 1988 Line 5b. 0.827 0.7337c. Growth Factor for 1989 Line 6b. 0.773 0.692
8 Development factor 20th to ultimate: Average [(8a.)+(8b.)+(8c.)]/3 1.037 1.0658a. 1+[(4a)/(1)]+{[4b]/[(1)*(7a)]} 1.023 1.0418b. 1+[(5a)/(2)]+{[5b]/[(2)*(7b)]} 1.053 1.1088c. 1+[(6a)/(3)]+{[6b]/[(3)*(7c)]} 1.034 1.046
9 Case incurred losses for Policy Year 1988 valued as of 12/31/08 589,611,608 274,333,35210 Case incurred losses for Policy Year 1989 valued as of 12/31/09 645,606,245 303,053,06411 Case incurred losses for Policy Year 1990 valued as of 12/31/10 764,145,870 333,506,391
12a. Change in case incurred losses from 12/31/08 to 12/31/09 for 1,518,856 1,288,525Policy Year 1988
12b. Change in case incurred losses from 12/31/08 to 12/31/09 for 24,259,059 20,803,607all Policy Years prior to 1988
13a. Change in case incurred losses from 12/31/09 to 12/31/10 for 3,678,310 2,467,305Policy Year 1989
13b. Change in case incurred losses from 12/31/09 to 12/31/10 for 14,044,025 7,891,678all Policy Years prior to 1989
14a. Change in case incurred losses from 12/31/10 to 12/31/11 for 2,962,370 5,172,208Policy Year 1990
14b. Change in case incurred losses from 12/31/10 to 12/31/11 for 5,585,441 11,978,211all Policy Years prior to 1990
15a. Growth Factor for 1988 Line 12b. 0.827 0.73315b. Growth Factor for 1989 Line 13b. 0.773 0.69215c. Growth Factor for 1990 Line 14b. 0.682 0.669
16 Development factor 20th to ultimate: Average [(16a.)+(16b.)+(16c.)]/3 1.034 1.07516a. 1+[(12a)/(9)]+{[12b]/[(9)*(15a)]} 1.053 1.10816b. 1+[(13a)/(10)]+{[13b]/[(10)*(15b)]} 1.034 1.04616c. 1+[(14a)/(11)]+{[14b]/[(11)*(15c)]} 1.015 1.070
WORKERS' COMPENSATION - NEW YORK
Policy Year Loss Development Factors from 20th Report (Case Basis) to Ultimate Incurred
Private Carriers Excluding Large Deductible ExperienceIncluding Growth Factor & Excluding IBNR
Page 46
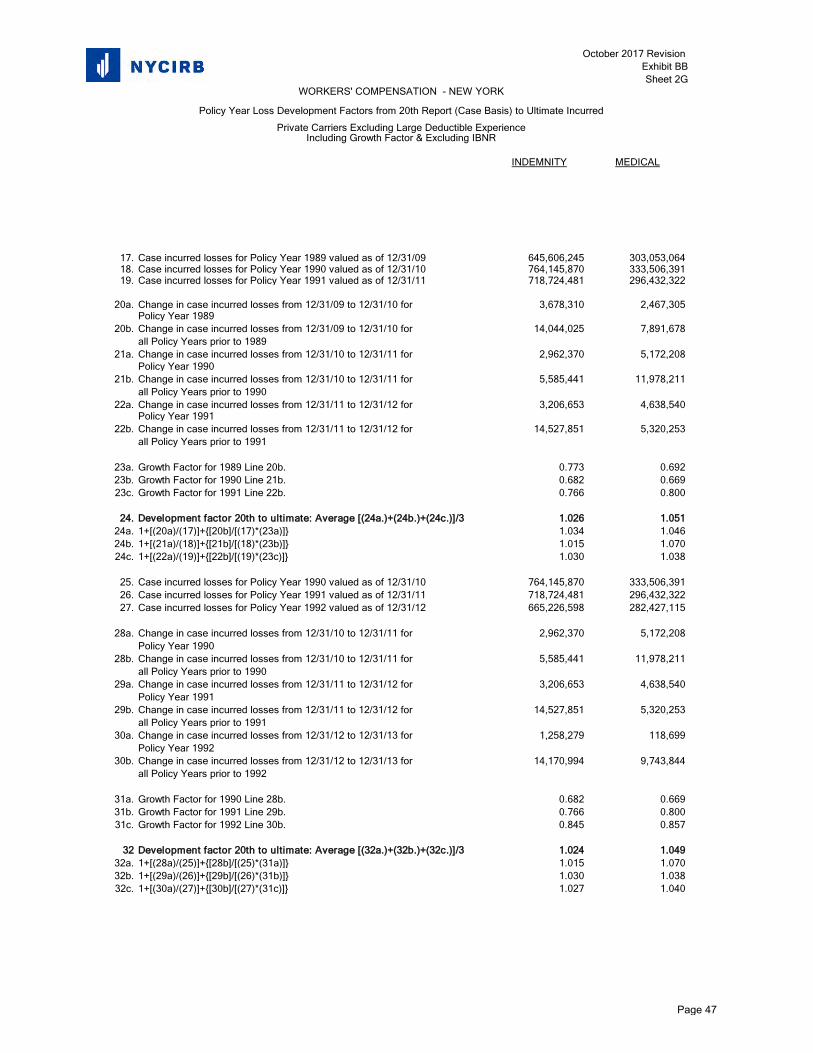
October 2017 Revision Exhibit BBSheet 2G
INDEMNITY MEDICAL
WORKERS' COMPENSATION - NEW YORK
Policy Year Loss Development Factors from 20th Report (Case Basis) to Ultimate Incurred
Private Carriers Excluding Large Deductible ExperienceIncluding Growth Factor & Excluding IBNR
17. Case incurred losses for Policy Year 1989 valued as of 12/31/09 645,606,245 303,053,06418. Case incurred losses for Policy Year 1990 valued as of 12/31/10 764,145,870 333,506,39119. Case incurred losses for Policy Year 1991 valued as of 12/31/11 718,724,481 296,432,322
20a. Change in case incurred losses from 12/31/09 to 12/31/10 for 3,678,310 2,467,305Policy Year 1989
20b. Change in case incurred losses from 12/31/09 to 12/31/10 for 14,044,025 7,891,678all Policy Years prior to 1989
21a. Change in case incurred losses from 12/31/10 to 12/31/11 for 2,962,370 5,172,208Policy Year 1990
21b. Change in case incurred losses from 12/31/10 to 12/31/11 for 5,585,441 11,978,211all Policy Years prior to 1990
22a. Change in case incurred losses from 12/31/11 to 12/31/12 for 3,206,653 4,638,540Policy Year 1991
22b. Change in case incurred losses from 12/31/11 to 12/31/12 for 14,527,851 5,320,253all Policy Years prior to 1991
23a. Growth Factor for 1989 Line 20b. 0.773 0.69223b. Growth Factor for 1990 Line 21b. 0.682 0.66923c. Growth Factor for 1991 Line 22b. 0.766 0.800
24. Development factor 20th to ultimate: Average [(24a.)+(24b.)+(24c.)]/3 1.026 1.05124a. 1+[(20a)/(17)]+{[20b]/[(17)*(23a)]} 1.034 1.04624b. 1+[(21a)/(18)]+{[21b]/[(18)*(23b)]} 1.015 1.07024c. 1+[(22a)/(19)]+{[22b]/[(19)*(23c)]} 1.030 1.038
25. Case incurred losses for Policy Year 1990 valued as of 12/31/10 764,145,870 333,506,39126. Case incurred losses for Policy Year 1991 valued as of 12/31/11 718,724,481 296,432,32227. Case incurred losses for Policy Year 1992 valued as of 12/31/12 665,226,598 282,427,115
28a. Change in case incurred losses from 12/31/10 to 12/31/11 for 2,962,370 5,172,208Policy Year 1990
28b. Change in case incurred losses from 12/31/10 to 12/31/11 for 5,585,441 11,978,211all Policy Years prior to 1990
29a. Change in case incurred losses from 12/31/11 to 12/31/12 for 3,206,653 4,638,540Policy Year 1991
29b. Change in case incurred losses from 12/31/11 to 12/31/12 for 14,527,851 5,320,253all Policy Years prior to 1991
30a. Change in case incurred losses from 12/31/12 to 12/31/13 for 1,258,279 118,699Policy Year 1992
30b. Change in case incurred losses from 12/31/12 to 12/31/13 for 14,170,994 9,743,844all Policy Years prior to 1992
31a. Growth Factor for 1990 Line 28b. 0.682 0.66931b. Growth Factor for 1991 Line 29b. 0.766 0.80031c. Growth Factor for 1992 Line 30b. 0.845 0.857
32 Development factor 20th to ultimate: Average [(32a.)+(32b.)+(32c.)]/3 1.024 1.04932a. 1+[(28a)/(25)]+{[28b]/[(25)*(31a)]} 1.015 1.07032b. 1+[(29a)/(26)]+{[29b]/[(26)*(31b)]} 1.030 1.03832c. 1+[(30a)/(27)]+{[30b]/[(27)*(31c)]} 1.027 1.040
Page 47
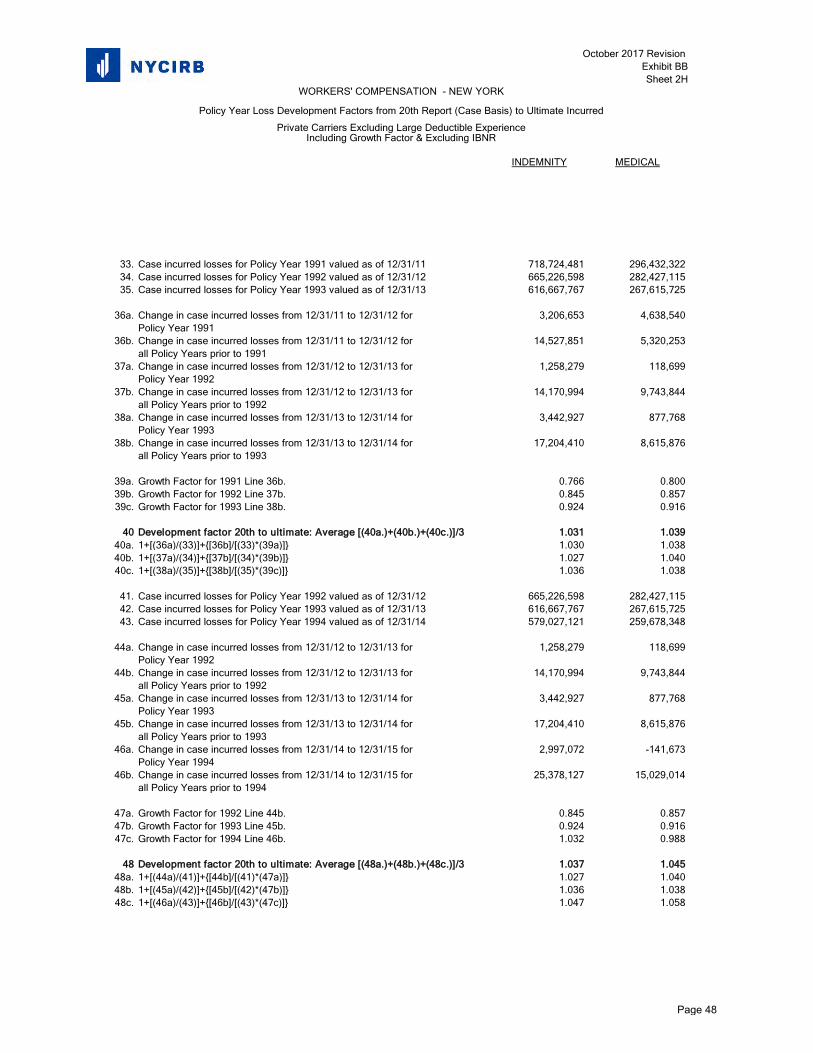
October 2017 Revision Exhibit BBSheet 2H
INDEMNITY MEDICAL
WORKERS' COMPENSATION - NEW YORK
Policy Year Loss Development Factors from 20th Report (Case Basis) to Ultimate Incurred
Private Carriers Excluding Large Deductible ExperienceIncluding Growth Factor & Excluding IBNR
33. Case incurred losses for Policy Year 1991 valued as of 12/31/11 718,724,481 296,432,32234. Case incurred losses for Policy Year 1992 valued as of 12/31/12 665,226,598 282,427,11535. Case incurred losses for Policy Year 1993 valued as of 12/31/13 616,667,767 267,615,725
36a. Change in case incurred losses from 12/31/11 to 12/31/12 for 3,206,653 4,638,540Policy Year 1991
36b. Change in case incurred losses from 12/31/11 to 12/31/12 for 14,527,851 5,320,253all Policy Years prior to 1991
37a. Change in case incurred losses from 12/31/12 to 12/31/13 for 1,258,279 118,699Policy Year 1992
37b. Change in case incurred losses from 12/31/12 to 12/31/13 for 14,170,994 9,743,844all Policy Years prior to 1992
38a. Change in case incurred losses from 12/31/13 to 12/31/14 for 3,442,927 877,768Policy Year 1993
38b. Change in case incurred losses from 12/31/13 to 12/31/14 for 17,204,410 8,615,876all Policy Years prior to 1993
39a. Growth Factor for 1991 Line 36b. 0.766 0.80039b. Growth Factor for 1992 Line 37b. 0.845 0.85739c. Growth Factor for 1993 Line 38b. 0.924 0.916
40 Development factor 20th to ultimate: Average [(40a.)+(40b.)+(40c.)]/3 1.031 1.03940a. 1+[(36a)/(33)]+{[36b]/[(33)*(39a)]} 1.030 1.03840b. 1+[(37a)/(34)]+{[37b]/[(34)*(39b)]} 1.027 1.04040c. 1+[(38a)/(35)]+{[38b]/[(35)*(39c)]} 1.036 1.038
41. Case incurred losses for Policy Year 1992 valued as of 12/31/12 665,226,598 282,427,11542. Case incurred losses for Policy Year 1993 valued as of 12/31/13 616,667,767 267,615,72543. Case incurred losses for Policy Year 1994 valued as of 12/31/14 579,027,121 259,678,348
44a. Change in case incurred losses from 12/31/12 to 12/31/13 for 1,258,279 118,699Policy Year 1992
44b. Change in case incurred losses from 12/31/12 to 12/31/13 for 14,170,994 9,743,844all Policy Years prior to 1992
45a. Change in case incurred losses from 12/31/13 to 12/31/14 for 3,442,927 877,768Policy Year 1993
45b. Change in case incurred losses from 12/31/13 to 12/31/14 for 17,204,410 8,615,876all Policy Years prior to 1993
46a. Change in case incurred losses from 12/31/14 to 12/31/15 for 2,997,072 -141,673Policy Year 1994
46b. Change in case incurred losses from 12/31/14 to 12/31/15 for 25,378,127 15,029,014all Policy Years prior to 1994
47a. Growth Factor for 1992 Line 44b. 0.845 0.85747b. Growth Factor for 1993 Line 45b. 0.924 0.91647c. Growth Factor for 1994 Line 46b. 1.032 0.988
48 Development factor 20th to ultimate: Average [(48a.)+(48b.)+(48c.)]/3 1.037 1.04548a. 1+[(44a)/(41)]+{[44b]/[(41)*(47a)]} 1.027 1.04048b. 1+[(45a)/(42)]+{[45b]/[(42)*(47b)]} 1.036 1.03848c. 1+[(46a)/(43)]+{[46b]/[(43)*(47c)]} 1.047 1.058
Page 48
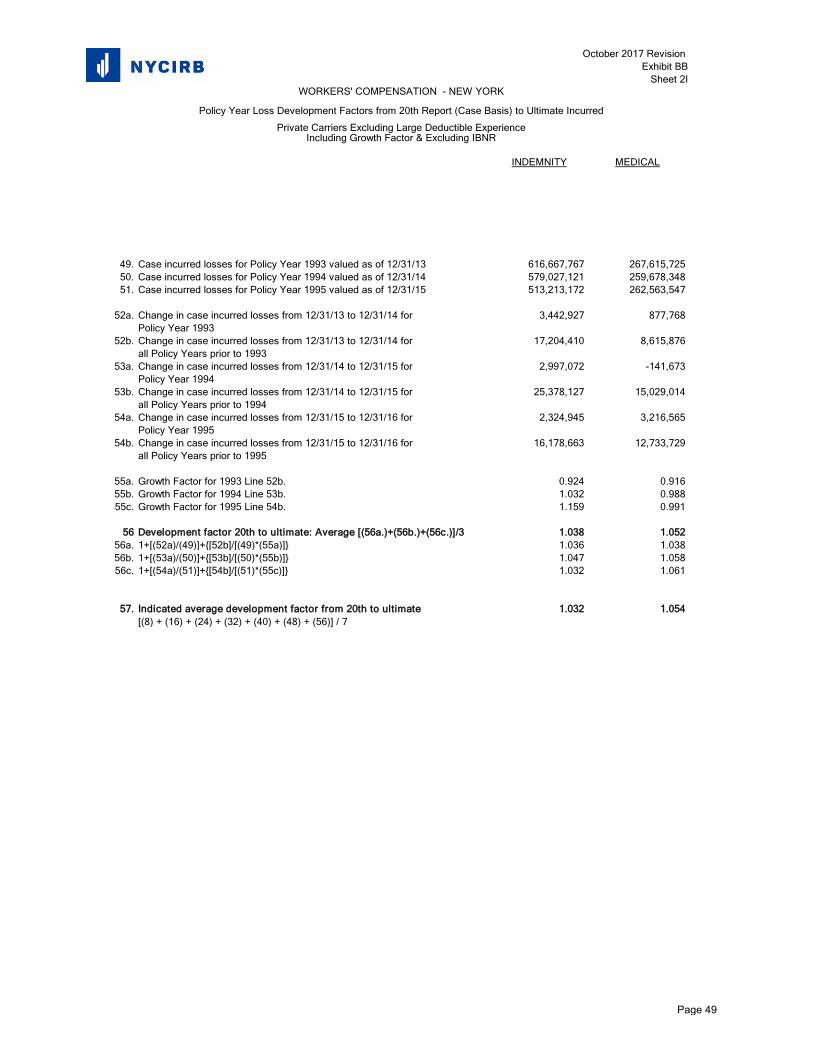
October 2017 Revision Exhibit BB
Sheet 2I
INDEMNITY MEDICAL
WORKERS' COMPENSATION - NEW YORK
Policy Year Loss Development Factors from 20th Report (Case Basis) to Ultimate Incurred
Private Carriers Excluding Large Deductible ExperienceIncluding Growth Factor & Excluding IBNR
49. Case incurred losses for Policy Year 1993 valued as of 12/31/13 616,667,767 267,615,72550. Case incurred losses for Policy Year 1994 valued as of 12/31/14 579,027,121 259,678,34851. Case incurred losses for Policy Year 1995 valued as of 12/31/15 513,213,172 262,563,547
52a. Change in case incurred losses from 12/31/13 to 12/31/14 for 3,442,927 877,768Policy Year 1993
52b. Change in case incurred losses from 12/31/13 to 12/31/14 for 17,204,410 8,615,876all Policy Years prior to 1993
53a. Change in case incurred losses from 12/31/14 to 12/31/15 for 2,997,072 -141,673Policy Year 1994
53b. Change in case incurred losses from 12/31/14 to 12/31/15 for 25,378,127 15,029,014all Policy Years prior to 1994
54a. Change in case incurred losses from 12/31/15 to 12/31/16 for 2,324,945 3,216,565Policy Year 1995
54b. Change in case incurred losses from 12/31/15 to 12/31/16 for 16,178,663 12,733,729all Policy Years prior to 1995
55a. Growth Factor for 1993 Line 52b. 0.924 0.91655b. Growth Factor for 1994 Line 53b. 1.032 0.98855c. Growth Factor for 1995 Line 54b. 1.159 0.991
56 Development factor 20th to ultimate: Average [(56a.)+(56b.)+(56c.)]/3 1.038 1.05256a. 1+[(52a)/(49)]+{[52b]/[(49)*(55a)]} 1.036 1.03856b. 1+[(53a)/(50)]+{[53b]/[(50)*(55b)]} 1.047 1.05856c. 1+[(54a)/(51)]+{[54b]/[(51)*(55c)]} 1.032 1.061
57. Indicated average development factor from 20th to ultimate 1.032 1.054[(8) + (16) + (24) + (32) + (40) + (48) + (56)] / 7
Page 49
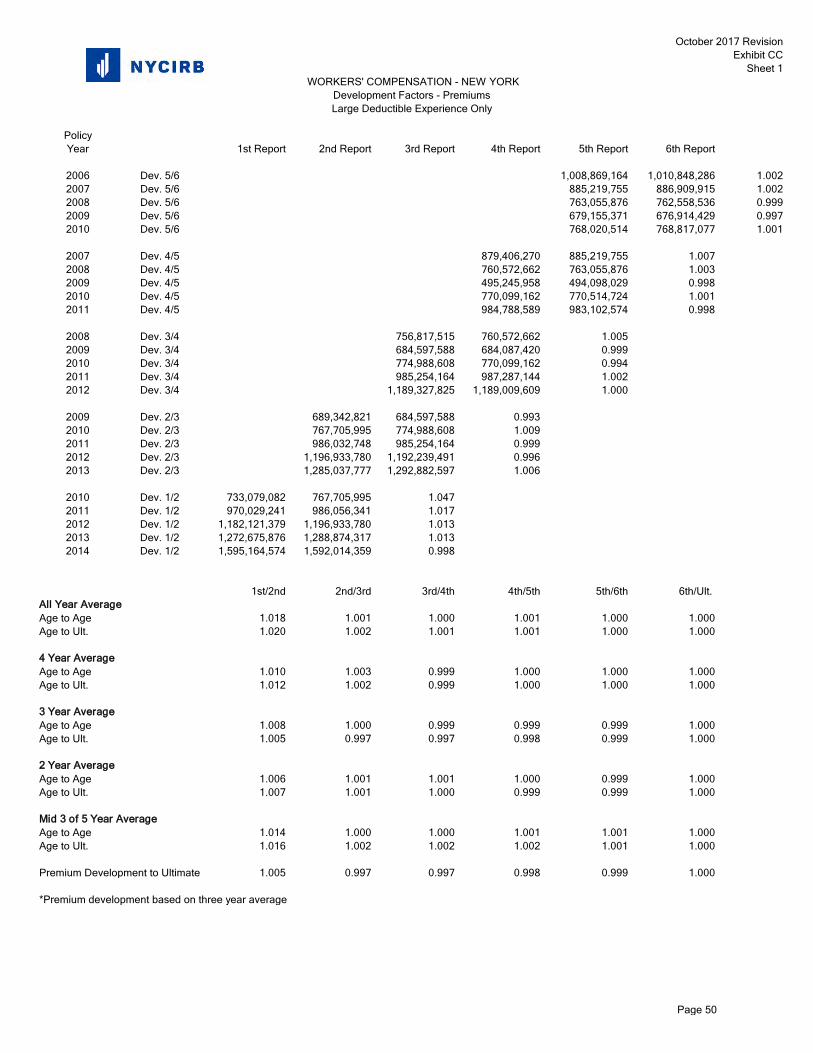
October 2017 RevisionExhibit CC
Sheet 1
PolicyYear 1st Report 2nd Report 3rd Report 4th Report 5th Report 6th Report
2006 Dev. 5/6 1,008,869,164 1,010,848,286 1.0022007 Dev. 5/6 885,219,755 886,909,915 1.0022008 Dev. 5/6 763,055,876 762,558,536 0.9992009 Dev. 5/6 679,155,371 676,914,429 0.9972010 Dev. 5/6 768,020,514 768,817,077 1.001
2007 Dev. 4/5 879,406,270 885,219,755 1.0072008 Dev. 4/5 760,572,662 763,055,876 1.0032009 Dev. 4/5 495,245,958 494,098,029 0.9982010 Dev. 4/5 770,099,162 770,514,724 1.0012011 Dev. 4/5 984,788,589 983,102,574 0.998
2008 Dev. 3/4 756,817,515 760,572,662 1.0052009 Dev. 3/4 684,597,588 684,087,420 0.9992010 Dev. 3/4 774,988,608 770,099,162 0.9942011 Dev. 3/4 985,254,164 987,287,144 1.0022012 Dev. 3/4 1,189,327,825 1,189,009,609 1.000
2009 Dev. 2/3 689,342,821 684,597,588 0.9932010 Dev. 2/3 767,705,995 774,988,608 1.0092011 Dev. 2/3 986,032,748 985,254,164 0.9992012 Dev. 2/3 1,196,933,780 1,192,239,491 0.9962013 Dev. 2/3 1,285,037,777 1,292,882,597 1.006
2010 Dev. 1/2 733,079,082 767,705,995 1.0472011 Dev. 1/2 970,029,241 986,056,341 1.0172012 Dev. 1/2 1,182,121,379 1,196,933,780 1.0132013 Dev. 1/2 1,272,675,876 1,288,874,317 1.0132014 Dev. 1/2 1,595,164,574 1,592,014,359 0.998
1st/2nd 2nd/3rd 3rd/4th 4th/5th 5th/6th 6th/Ult. All Year AverageAge to Age 1.018 1.001 1.000 1.001 1.000 1.000Age to Ult. 1.020 1.002 1.001 1.001 1.000 1.000
4 Year AverageAge to Age 1.010 1.003 0.999 1.000 1.000 1.000Age to Ult. 1.012 1.002 0.999 1.000 1.000 1.000
3 Year AverageAge to Age 1.008 1.000 0.999 0.999 0.999 1.000Age to Ult. 1.005 0.997 0.997 0.998 0.999 1.000
2 Year AverageAge to Age 1.006 1.001 1.001 1.000 0.999 1.000Age to Ult. 1.007 1.001 1.000 0.999 0.999 1.000
Mid 3 of 5 Year AverageAge to Age 1.014 1.000 1.000 1.001 1.001 1.000Age to Ult. 1.016 1.002 1.002 1.002 1.001 1.000
Premium Development to Ultimate 1.005 0.997 0.997 0.998 0.999 1.000
*Premium development based on three year average
WORKERS' COMPENSATION - NEW YORK Development Factors - PremiumsLarge Deductible Experience Only
Page 50

October 2017 RevisionExhibit CC
Sheet 2
PolicyYear 1st Report 2nd Report 3rd Report 4th Report 5th Report 6th Report 7th Report 8th Report 9th Report 10th Report
2002 Dev. 9/10 353,663,045 359,394,910 1.0162003 Dev. 9/10 392,326,364 398,097,022 1.0152004 Dev. 9/10 400,697,917 405,674,920 1.0122005 Dev. 9/10 358,225,565 365,292,937 1.0202006 Dev. 9/10 353,719,811 359,642,956 1.017
2003 Dev. 8/9 380,719,285 392,450,635 1.0312004 Dev. 8/9 390,994,401 400,697,917 1.0252005 Dev. 8/9 352,009,860 358,225,565 1.0182006 Dev. 8/9 345,714,555 353,969,631 1.0242007 Dev. 8/9 364,313,062 374,367,545 1.028
2004 Dev. 7/8 378,883,375 391,085,676 1.0322005 Dev. 7/8 340,689,610 352,009,860 1.0332006 Dev. 7/8 338,187,473 345,714,555 1.0222007 Dev. 7/8 361,138,975 365,939,485 1.0132008 Dev. 7/8 376,432,656 381,775,337 1.014
2005 Dev. 6/7 329,904,443 340,746,920 1.0332006 Dev. 6/7 325,719,528 338,187,473 1.0382007 Dev. 6/7 347,429,926 361,138,975 1.0392008 Dev. 6/7 370,358,593 378,692,300 1.0232009 Dev. 6/7 426,305,382 434,563,486 1.019
2006 Dev. 5/6 311,109,910 325,771,041 1.0472007 Dev. 5/6 330,235,491 347,429,926 1.0522008 Dev. 5/6 352,748,707 370,358,593 1.0502009 Dev. 5/6 415,121,418 428,595,496 1.0322010 Dev. 5/6 426,948,464 448,076,670 1.049
2007 Dev. 4/5 305,988,647 330,285,418 1.0792008 Dev. 4/5 326,198,063 352,748,707 1.0812009 Dev. 4/5 387,114,679 415,121,418 1.0722010 Dev. 4/5 409,112,925 428,914,793 1.0482011 Dev. 4/5 515,123,791 535,373,175 1.039
2008 Dev. 3/4 291,439,348 326,223,240 1.1192009 Dev. 3/4 346,943,796 387,114,679 1.1162010 Dev. 3/4 366,308,704 409,112,925 1.1172011 Dev. 3/4 472,908,262 517,114,398 1.0932012 Dev. 3/4 554,831,393 610,719,654 1.101
2009 Dev. 2/3 279,693,236 346,945,037 1.2402010 Dev. 2/3 293,386,414 366,308,704 1.2492011 Dev. 2/3 379,982,552 472,908,262 1.2452012 Dev. 2/3 459,925,611 556,890,935 1.2112013 Dev. 2/3 495,696,044 608,364,101 1.227
2010 Dev. 1/2 186,954,668 293,386,643 1.5692011 Dev. 1/2 234,347,991 379,982,552 1.6212012 Dev. 1/2 300,692,568 459,925,611 1.5302013 Dev. 1/2 331,860,186 498,786,482 1.5032014 Dev. 1/2 369,659,903 568,137,501 1.537
Development 1st/Ult. 2nd/Ult. 1st/2nd 2nd/3rd 3rd/4th 4th/5th 5th/6th 6th/7th 7th/8th 8th/9th 9th/10th
5 Year Average 2.848 1.835 1.552 1.234 1.109 1.064 1.046 1.030 1.023 1.025 1.0164 Year Average 2.802 1.810 1.548 1.233 1.107 1.060 1.046 1.030 1.021 1.024 1.0163 Year Average 2.706 1.777 1.523 1.228 1.104 1.053 1.044 1.027 1.016 1.023 1.0162 Year Average 2.614 1.720 1.520 1.219 1.097 1.044 1.041 1.021 1.014 1.026 1.019Latest Year 2.648 1.723 1.537 1.227 1.101 1.039 1.049 1.019 1.014 1.028 1.017Mid 3 of 5 2.855 1.848 1.545 1.237 1.111 1.066 1.049 1.031 1.023 1.026 1.016
Loss Development to Ultimate* 2.848 1.835
*Loss development to ultimate based on 5 Year average for 1st to 15th maturities and 5 Year average of non-deductible experience for 15th to ultimate.
WORKERS' COMPENSATION - NEW YORK
Policy Year Development Factors - Indemnity Losses (Case Basis)
Experience from Large Deductible Policies Only
Page 51
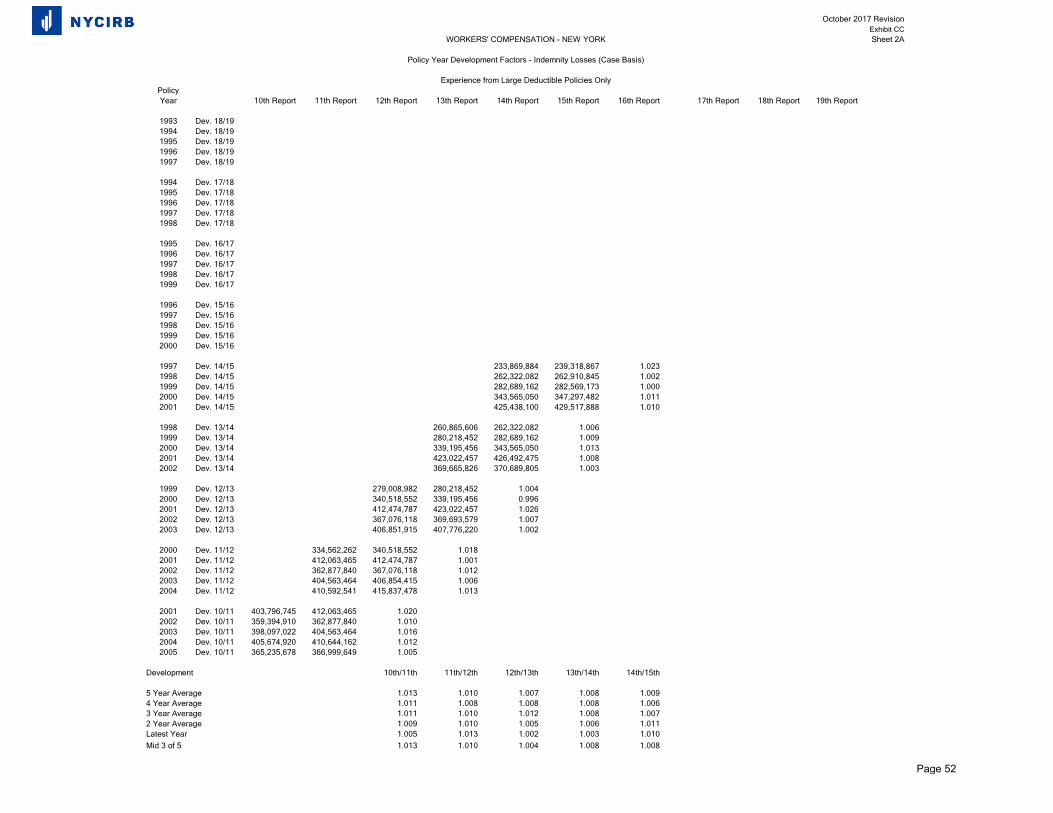
October 2017 RevisionExhibit CCSheet 2A
PolicyYear 10th Report 11th Report 12th Report 13th Report 14th Report 15th Report 16th Report 17th Report 18th Report 19th Report
1993 Dev. 18/191994 Dev. 18/191995 Dev. 18/191996 Dev. 18/191997 Dev. 18/19
1994 Dev. 17/181995 Dev. 17/181996 Dev. 17/181997 Dev. 17/181998 Dev. 17/18
1995 Dev. 16/171996 Dev. 16/171997 Dev. 16/171998 Dev. 16/171999 Dev. 16/17
1996 Dev. 15/161997 Dev. 15/161998 Dev. 15/161999 Dev. 15/162000 Dev. 15/16
1997 Dev. 14/15 233,869,884 239,318,867 1.0231998 Dev. 14/15 262,322,082 262,910,845 1.0021999 Dev. 14/15 282,689,162 282,569,173 1.0002000 Dev. 14/15 343,565,050 347,297,482 1.0112001 Dev. 14/15 425,438,100 429,517,888 1.010
1998 Dev. 13/14 260,865,606 262,322,082 1.0061999 Dev. 13/14 280,218,452 282,689,162 1.0092000 Dev. 13/14 339,195,456 343,565,050 1.0132001 Dev. 13/14 423,022,457 426,492,475 1.0082002 Dev. 13/14 369,665,826 370,689,805 1.003
1999 Dev. 12/13 279,008,982 280,218,452 1.0042000 Dev. 12/13 340,518,552 339,195,456 0.9962001 Dev. 12/13 412,474,787 423,022,457 1.0262002 Dev. 12/13 367,076,118 369,693,579 1.0072003 Dev. 12/13 406,851,915 407,776,220 1.002
2000 Dev. 11/12 334,562,262 340,518,552 1.0182001 Dev. 11/12 412,063,465 412,474,787 1.0012002 Dev. 11/12 362,877,840 367,076,118 1.0122003 Dev. 11/12 404,563,464 406,854,415 1.0062004 Dev. 11/12 410,592,541 415,837,478 1.013
2001 Dev. 10/11 403,796,745 412,063,465 1.0202002 Dev. 10/11 359,394,910 362,877,840 1.0102003 Dev. 10/11 398,097,022 404,563,464 1.0162004 Dev. 10/11 405,674,920 410,644,162 1.0122005 Dev. 10/11 365,235,678 366,999,649 1.005
Development 10th/11th 11th/12th 12th/13th 13th/14th 14th/15th
5 Year Average 1.013 1.010 1.007 1.008 1.0094 Year Average 1.011 1.008 1.008 1.008 1.0063 Year Average 1.011 1.010 1.012 1.008 1.0072 Year Average 1.009 1.010 1.005 1.006 1.011Latest Year 1.005 1.013 1.002 1.003 1.010Mid 3 of 5 1.013 1.010 1.004 1.008 1.008
WORKERS' COMPENSATION - NEW YORK
Policy Year Development Factors - Indemnity Losses (Case Basis)
Experience from Large Deductible Policies Only
Page 52
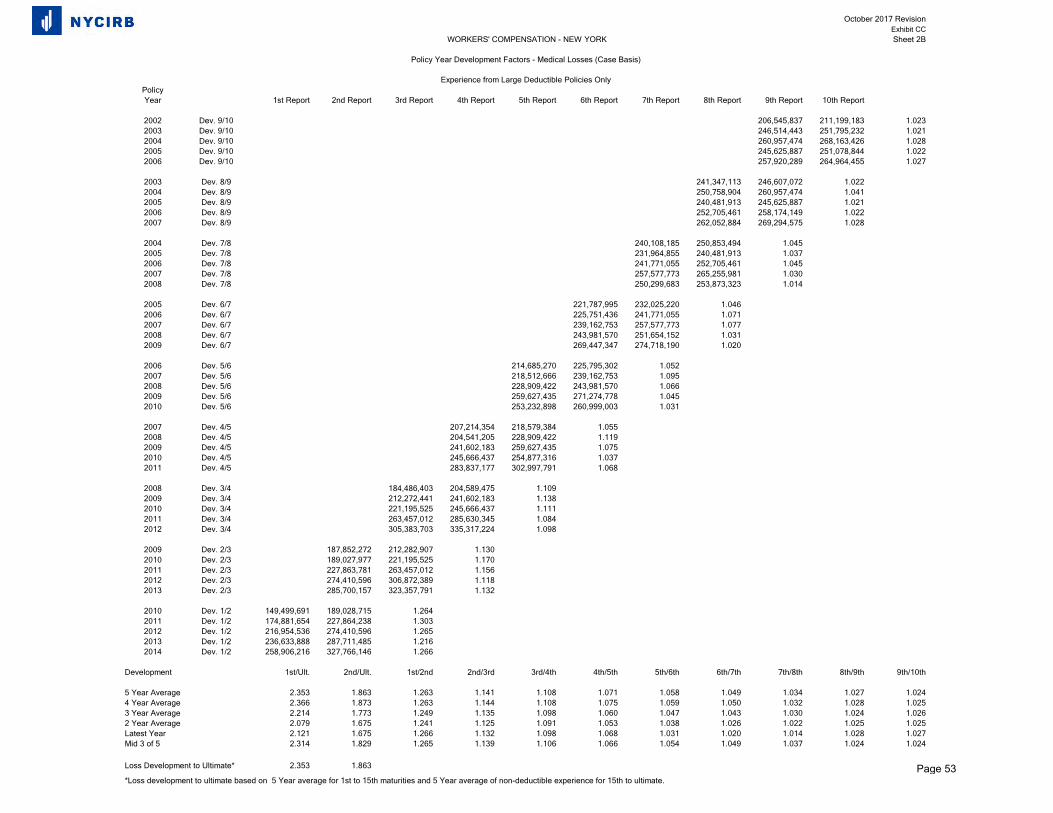
October 2017 RevisionExhibit CCSheet 2B
PolicyYear 1st Report 2nd Report 3rd Report 4th Report 5th Report 6th Report 7th Report 8th Report 9th Report 10th Report
2002 Dev. 9/10 206,545,837 211,199,183 1.0232003 Dev. 9/10 246,514,443 251,795,232 1.0212004 Dev. 9/10 260,957,474 268,163,426 1.0282005 Dev. 9/10 245,625,887 251,078,844 1.0222006 Dev. 9/10 257,920,289 264,964,455 1.027
2003 Dev. 8/9 241,347,113 246,607,072 1.0222004 Dev. 8/9 250,758,904 260,957,474 1.0412005 Dev. 8/9 240,481,913 245,625,887 1.0212006 Dev. 8/9 252,705,461 258,174,149 1.0222007 Dev. 8/9 262,052,884 269,294,575 1.028
2004 Dev. 7/8 240,108,185 250,853,494 1.0452005 Dev. 7/8 231,964,855 240,481,913 1.0372006 Dev. 7/8 241,771,055 252,705,461 1.0452007 Dev. 7/8 257,577,773 265,255,981 1.0302008 Dev. 7/8 250,299,683 253,873,323 1.014
2005 Dev. 6/7 221,787,995 232,025,220 1.0462006 Dev. 6/7 225,751,436 241,771,055 1.0712007 Dev. 6/7 239,162,753 257,577,773 1.0772008 Dev. 6/7 243,981,570 251,654,152 1.0312009 Dev. 6/7 269,447,347 274,718,190 1.020
2006 Dev. 5/6 214,685,270 225,795,302 1.0522007 Dev. 5/6 218,512,666 239,162,753 1.0952008 Dev. 5/6 228,909,422 243,981,570 1.0662009 Dev. 5/6 259,627,435 271,274,778 1.0452010 Dev. 5/6 253,232,898 260,999,003 1.031
2007 Dev. 4/5 207,214,354 218,579,384 1.0552008 Dev. 4/5 204,541,205 228,909,422 1.1192009 Dev. 4/5 241,602,183 259,627,435 1.0752010 Dev. 4/5 245,666,437 254,877,316 1.0372011 Dev. 4/5 283,837,177 302,997,791 1.068
2008 Dev. 3/4 184,486,403 204,589,475 1.1092009 Dev. 3/4 212,272,441 241,602,183 1.1382010 Dev. 3/4 221,195,525 245,666,437 1.1112011 Dev. 3/4 263,457,012 285,630,345 1.0842012 Dev. 3/4 305,383,703 335,317,224 1.098
2009 Dev. 2/3 187,852,272 212,282,907 1.1302010 Dev. 2/3 189,027,977 221,195,525 1.1702011 Dev. 2/3 227,863,781 263,457,012 1.1562012 Dev. 2/3 274,410,596 306,872,389 1.1182013 Dev. 2/3 285,700,157 323,357,791 1.132
2010 Dev. 1/2 149,499,691 189,028,715 1.2642011 Dev. 1/2 174,881,654 227,864,238 1.3032012 Dev. 1/2 216,954,536 274,410,596 1.2652013 Dev. 1/2 236,633,888 287,711,485 1.2162014 Dev. 1/2 258,906,216 327,766,146 1.266
Development 1st/Ult. 2nd/Ult. 1st/2nd 2nd/3rd 3rd/4th 4th/5th 5th/6th 6th/7th 7th/8th 8th/9th 9th/10th
5 Year Average 2.353 1.863 1.263 1.141 1.108 1.071 1.058 1.049 1.034 1.027 1.0244 Year Average 2.366 1.873 1.263 1.144 1.108 1.075 1.059 1.050 1.032 1.028 1.0253 Year Average 2.214 1.773 1.249 1.135 1.098 1.060 1.047 1.043 1.030 1.024 1.0262 Year Average 2.079 1.675 1.241 1.125 1.091 1.053 1.038 1.026 1.022 1.025 1.025Latest Year 2.121 1.675 1.266 1.132 1.098 1.068 1.031 1.020 1.014 1.028 1.027Mid 3 of 5 2.314 1.829 1.265 1.139 1.106 1.066 1.054 1.049 1.037 1.024 1.024
Loss Development to Ultimate* 2.353 1.863
*Loss development to ultimate based on 5 Year average for 1st to 15th maturities and 5 Year average of non-deductible experience for 15th to ultimate.
WORKERS' COMPENSATION - NEW YORK
Policy Year Development Factors - Medical Losses (Case Basis)
Experience from Large Deductible Policies Only
Page 53
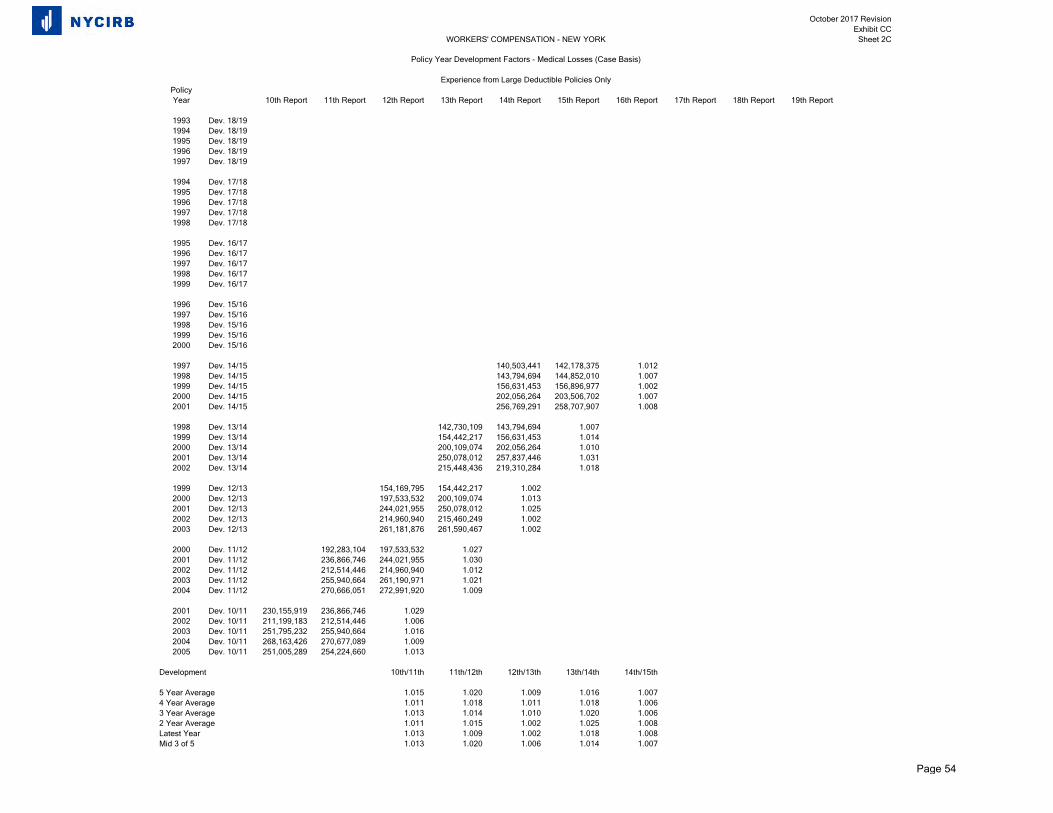
October 2017 RevisionExhibit CC
Sheet 2C
PolicyYear 10th Report 11th Report 12th Report 13th Report 14th Report 15th Report 16th Report 17th Report 18th Report 19th Report
1993 Dev. 18/191994 Dev. 18/191995 Dev. 18/191996 Dev. 18/191997 Dev. 18/19
1994 Dev. 17/181995 Dev. 17/181996 Dev. 17/181997 Dev. 17/181998 Dev. 17/18
1995 Dev. 16/171996 Dev. 16/171997 Dev. 16/171998 Dev. 16/171999 Dev. 16/17
1996 Dev. 15/161997 Dev. 15/161998 Dev. 15/161999 Dev. 15/162000 Dev. 15/16
1997 Dev. 14/15 140,503,441 142,178,375 1.0121998 Dev. 14/15 143,794,694 144,852,010 1.0071999 Dev. 14/15 156,631,453 156,896,977 1.0022000 Dev. 14/15 202,056,264 203,506,702 1.0072001 Dev. 14/15 256,769,291 258,707,907 1.008
1998 Dev. 13/14 142,730,109 143,794,694 1.0071999 Dev. 13/14 154,442,217 156,631,453 1.0142000 Dev. 13/14 200,109,074 202,056,264 1.0102001 Dev. 13/14 250,078,012 257,837,446 1.0312002 Dev. 13/14 215,448,436 219,310,284 1.018
1999 Dev. 12/13 154,169,795 154,442,217 1.0022000 Dev. 12/13 197,533,532 200,109,074 1.0132001 Dev. 12/13 244,021,955 250,078,012 1.0252002 Dev. 12/13 214,960,940 215,460,249 1.0022003 Dev. 12/13 261,181,876 261,590,467 1.002
2000 Dev. 11/12 192,283,104 197,533,532 1.0272001 Dev. 11/12 236,866,746 244,021,955 1.0302002 Dev. 11/12 212,514,446 214,960,940 1.0122003 Dev. 11/12 255,940,664 261,190,971 1.0212004 Dev. 11/12 270,666,051 272,991,920 1.009
2001 Dev. 10/11 230,155,919 236,866,746 1.0292002 Dev. 10/11 211,199,183 212,514,446 1.0062003 Dev. 10/11 251,795,232 255,940,664 1.0162004 Dev. 10/11 268,163,426 270,677,089 1.0092005 Dev. 10/11 251,005,289 254,224,660 1.013
Development 10th/11th 11th/12th 12th/13th 13th/14th 14th/15th
5 Year Average 1.015 1.020 1.009 1.016 1.0074 Year Average 1.011 1.018 1.011 1.018 1.0063 Year Average 1.013 1.014 1.010 1.020 1.0062 Year Average 1.011 1.015 1.002 1.025 1.008Latest Year 1.013 1.009 1.002 1.018 1.008Mid 3 of 5 1.013 1.020 1.006 1.014 1.007
WORKERS' COMPENSATION - NEW YORK
Policy Year Development Factors - Medical Losses (Case Basis)
Experience from Large Deductible Policies Only
Page 54
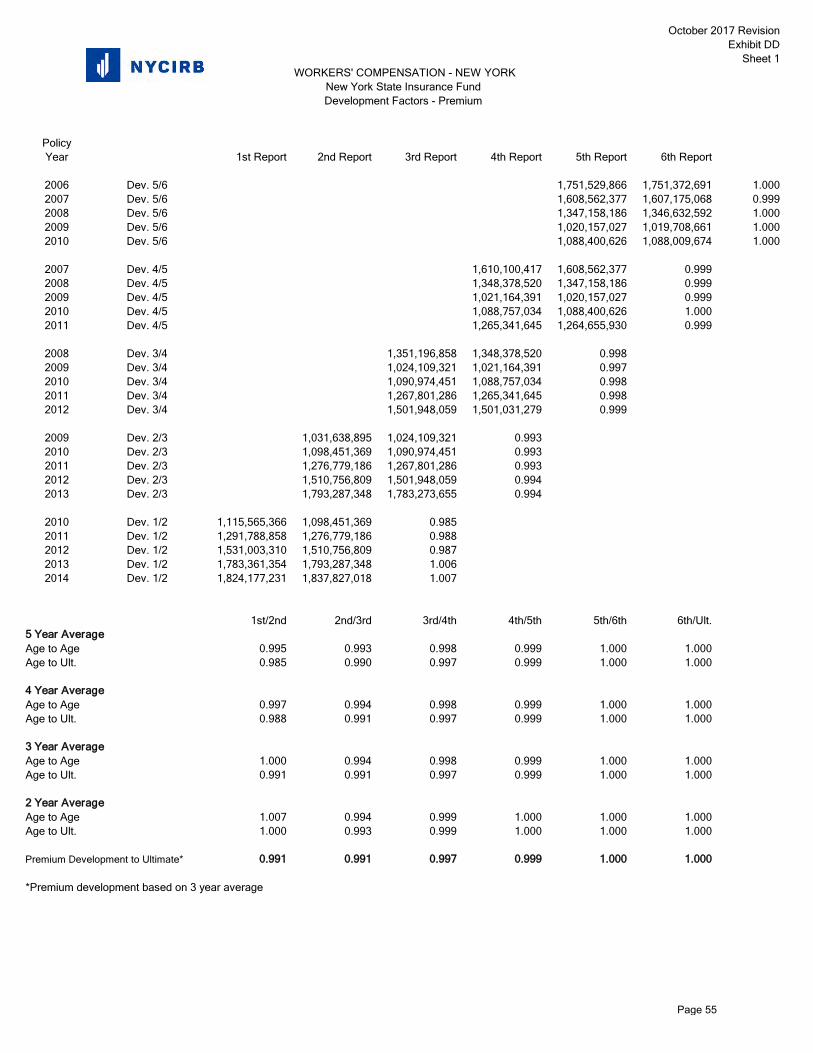
October 2017 RevisionExhibit DD
Sheet 1
PolicyYear 1st Report 2nd Report 3rd Report 4th Report 5th Report 6th Report
2006 Dev. 5/6 1,751,529,866 1,751,372,691 1.0002007 Dev. 5/6 1,608,562,377 1,607,175,068 0.9992008 Dev. 5/6 1,347,158,186 1,346,632,592 1.0002009 Dev. 5/6 1,020,157,027 1,019,708,661 1.0002010 Dev. 5/6 1,088,400,626 1,088,009,674 1.000
2007 Dev. 4/5 1,610,100,417 1,608,562,377 0.9992008 Dev. 4/5 1,348,378,520 1,347,158,186 0.9992009 Dev. 4/5 1,021,164,391 1,020,157,027 0.9992010 Dev. 4/5 1,088,757,034 1,088,400,626 1.0002011 Dev. 4/5 1,265,341,645 1,264,655,930 0.999
2008 Dev. 3/4 1,351,196,858 1,348,378,520 0.9982009 Dev. 3/4 1,024,109,321 1,021,164,391 0.9972010 Dev. 3/4 1,090,974,451 1,088,757,034 0.9982011 Dev. 3/4 1,267,801,286 1,265,341,645 0.9982012 Dev. 3/4 1,501,948,059 1,501,031,279 0.999
2009 Dev. 2/3 1,031,638,895 1,024,109,321 0.9932010 Dev. 2/3 1,098,451,369 1,090,974,451 0.9932011 Dev. 2/3 1,276,779,186 1,267,801,286 0.9932012 Dev. 2/3 1,510,756,809 1,501,948,059 0.9942013 Dev. 2/3 1,793,287,348 1,783,273,655 0.994
2010 Dev. 1/2 1,115,565,366 1,098,451,369 0.9852011 Dev. 1/2 1,291,788,858 1,276,779,186 0.9882012 Dev. 1/2 1,531,003,310 1,510,756,809 0.9872013 Dev. 1/2 1,783,361,354 1,793,287,348 1.0062014 Dev. 1/2 1,824,177,231 1,837,827,018 1.007
1st/2nd 2nd/3rd 3rd/4th 4th/5th 5th/6th 6th/Ult.5 Year AverageAge to Age 0.995 0.993 0.998 0.999 1.000 1.000Age to Ult. 0.985 0.990 0.997 0.999 1.000 1.000
4 Year AverageAge to Age 0.997 0.994 0.998 0.999 1.000 1.000Age to Ult. 0.988 0.991 0.997 0.999 1.000 1.000
3 Year AverageAge to Age 1.000 0.994 0.998 0.999 1.000 1.000Age to Ult. 0.991 0.991 0.997 0.999 1.000 1.000
2 Year AverageAge to Age 1.007 0.994 0.999 1.000 1.000 1.000Age to Ult. 1.000 0.993 0.999 1.000 1.000 1.000
Premium Development to Ultimate* 0.991 0.991 0.997 0.999 1.000 1.000
*Premium development based on 3 year average
WORKERS' COMPENSATION - NEW YORK New York State Insurance Fund Development Factors - Premium
Page 55
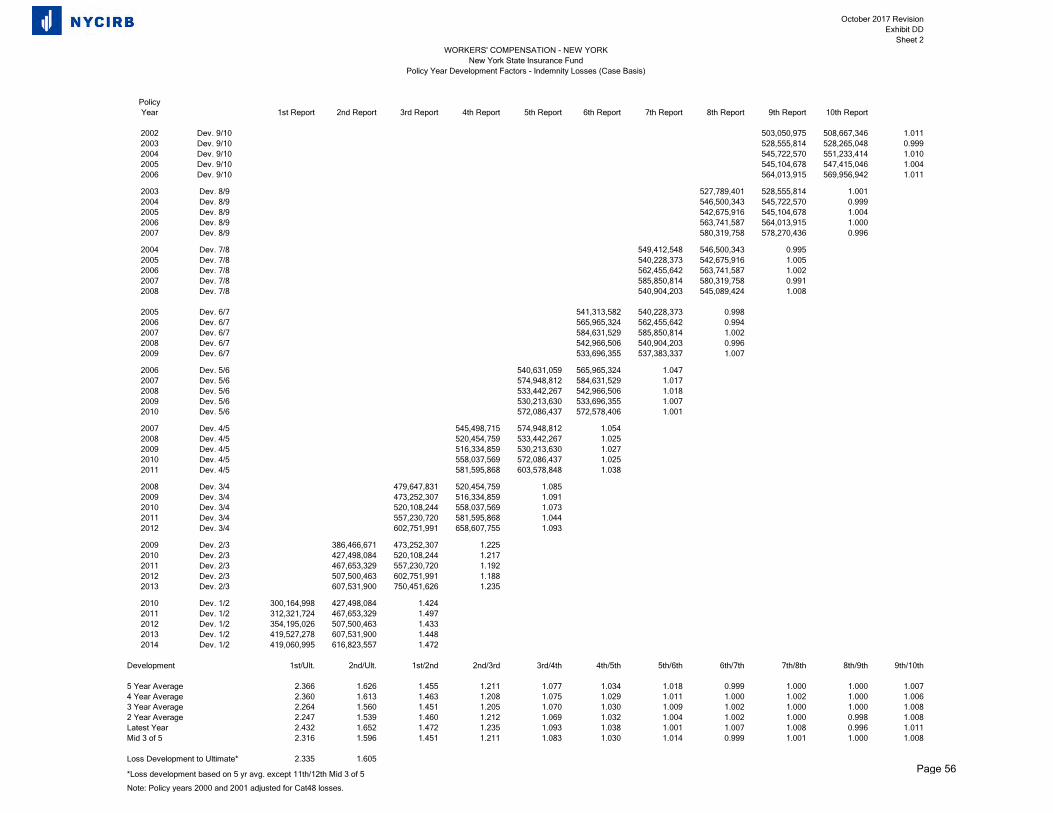
October 2017 RevisionExhibit DD
Sheet 2
PolicyYear 1st Report 2nd Report 3rd Report 4th Report 5th Report 6th Report 7th Report 8th Report 9th Report 10th Report
2002 Dev. 9/10 503,050,975 508,667,346 1.0112003 Dev. 9/10 528,555,814 528,265,048 0.9992004 Dev. 9/10 545,722,570 551,233,414 1.0102005 Dev. 9/10 545,104,678 547,415,046 1.0042006 Dev. 9/10 564,013,915 569,956,942 1.011
2003 Dev. 8/9 527,789,401 528,555,814 1.0012004 Dev. 8/9 546,500,343 545,722,570 0.9992005 Dev. 8/9 542,675,916 545,104,678 1.0042006 Dev. 8/9 563,741,587 564,013,915 1.0002007 Dev. 8/9 580,319,758 578,270,436 0.996
2004 Dev. 7/8 549,412,548 546,500,343 0.9952005 Dev. 7/8 540,228,373 542,675,916 1.0052006 Dev. 7/8 562,455,642 563,741,587 1.0022007 Dev. 7/8 585,850,814 580,319,758 0.9912008 Dev. 7/8 540,904,203 545,089,424 1.008
2005 Dev. 6/7 541,313,582 540,228,373 0.9982006 Dev. 6/7 565,965,324 562,455,642 0.9942007 Dev. 6/7 584,631,529 585,850,814 1.0022008 Dev. 6/7 542,966,506 540,904,203 0.9962009 Dev. 6/7 533,696,355 537,383,337 1.007
2006 Dev. 5/6 540,631,059 565,965,324 1.0472007 Dev. 5/6 574,948,812 584,631,529 1.0172008 Dev. 5/6 533,442,267 542,966,506 1.0182009 Dev. 5/6 530,213,630 533,696,355 1.0072010 Dev. 5/6 572,086,437 572,578,406 1.001
2007 Dev. 4/5 545,498,715 574,948,812 1.0542008 Dev. 4/5 520,454,759 533,442,267 1.0252009 Dev. 4/5 516,334,859 530,213,630 1.0272010 Dev. 4/5 558,037,569 572,086,437 1.0252011 Dev. 4/5 581,595,868 603,578,848 1.038
2008 Dev. 3/4 479,647,831 520,454,759 1.0852009 Dev. 3/4 473,252,307 516,334,859 1.0912010 Dev. 3/4 520,108,244 558,037,569 1.0732011 Dev. 3/4 557,230,720 581,595,868 1.0442012 Dev. 3/4 602,751,991 658,607,755 1.093
2009 Dev. 2/3 386,466,671 473,252,307 1.2252010 Dev. 2/3 427,498,084 520,108,244 1.2172011 Dev. 2/3 467,653,329 557,230,720 1.1922012 Dev. 2/3 507,500,463 602,751,991 1.1882013 Dev. 2/3 607,531,900 750,451,626 1.235
2010 Dev. 1/2 300,164,998 427,498,084 1.4242011 Dev. 1/2 312,321,724 467,653,329 1.4972012 Dev. 1/2 354,195,026 507,500,463 1.4332013 Dev. 1/2 419,527,278 607,531,900 1.4482014 Dev. 1/2 419,060,995 616,823,557 1.472
Development 1st/Ult. 2nd/Ult. 1st/2nd 2nd/3rd 3rd/4th 4th/5th 5th/6th 6th/7th 7th/8th 8th/9th 9th/10th
5 Year Average 2.366 1.626 1.455 1.211 1.077 1.034 1.018 0.999 1.000 1.000 1.0074 Year Average 2.360 1.613 1.463 1.208 1.075 1.029 1.011 1.000 1.002 1.000 1.0063 Year Average 2.264 1.560 1.451 1.205 1.070 1.030 1.009 1.002 1.000 1.000 1.0082 Year Average 2.247 1.539 1.460 1.212 1.069 1.032 1.004 1.002 1.000 0.998 1.008Latest Year 2.432 1.652 1.472 1.235 1.093 1.038 1.001 1.007 1.008 0.996 1.011Mid 3 of 5 2.316 1.596 1.451 1.211 1.083 1.030 1.014 0.999 1.001 1.000 1.008
Loss Development to Ultimate* 2.335 1.605
*Loss development based on 5 yr avg. except 11th/12th Mid 3 of 5
Note: Policy years 2000 and 2001 adjusted for Cat48 losses.
WORKERS' COMPENSATION - NEW YORKNew York State Insurance Fund
Policy Year Development Factors - Indemnity Losses (Case Basis)
Page 56
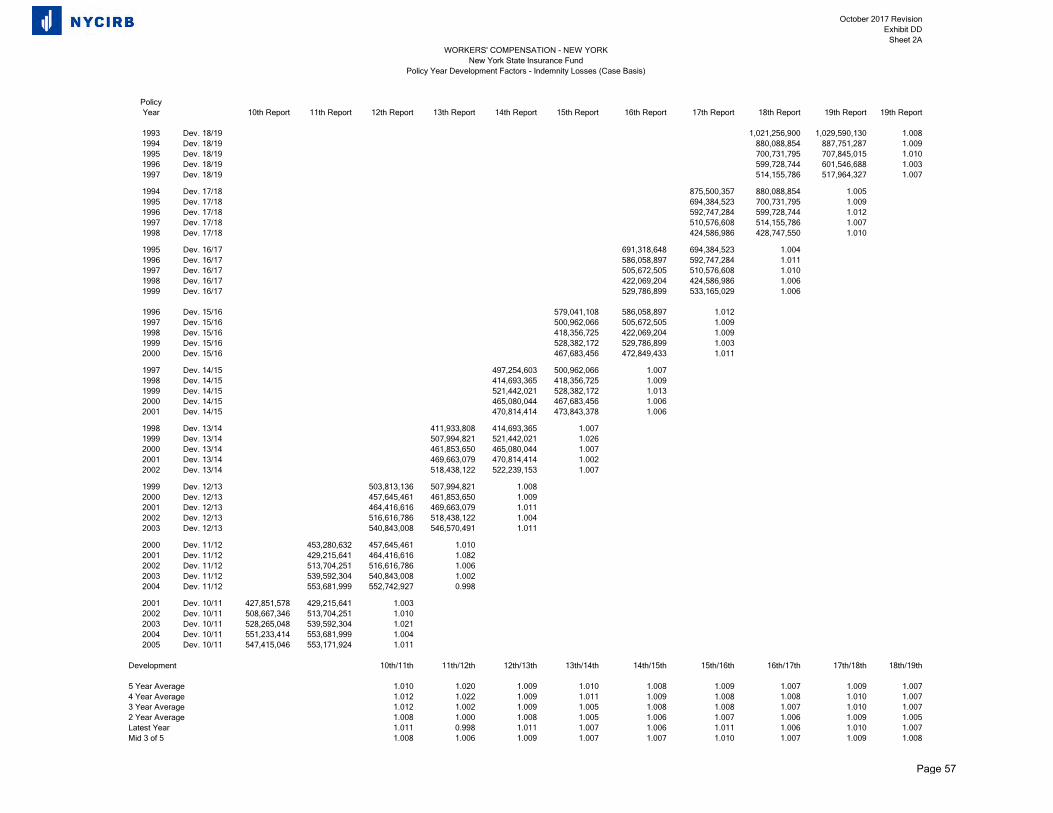
October 2017 RevisionExhibit DD
Sheet 2A
PolicyYear 10th Report 11th Report 12th Report 13th Report 14th Report 15th Report 16th Report 17th Report 18th Report 19th Report 19th Report
1993 Dev. 18/19 1,021,256,900 1,029,590,130 1.0081994 Dev. 18/19 880,088,854 887,751,287 1.0091995 Dev. 18/19 700,731,795 707,845,015 1.0101996 Dev. 18/19 599,728,744 601,546,688 1.0031997 Dev. 18/19 514,155,786 517,964,327 1.007
1994 Dev. 17/18 875,500,357 880,088,854 1.0051995 Dev. 17/18 694,384,523 700,731,795 1.0091996 Dev. 17/18 592,747,284 599,728,744 1.0121997 Dev. 17/18 510,576,608 514,155,786 1.0071998 Dev. 17/18 424,586,986 428,747,550 1.010
1995 Dev. 16/17 691,318,648 694,384,523 1.0041996 Dev. 16/17 586,058,897 592,747,284 1.0111997 Dev. 16/17 505,672,505 510,576,608 1.0101998 Dev. 16/17 422,069,204 424,586,986 1.0061999 Dev. 16/17 529,786,899 533,165,029 1.006
1996 Dev. 15/16 579,041,108 586,058,897 1.0121997 Dev. 15/16 500,962,066 505,672,505 1.0091998 Dev. 15/16 418,356,725 422,069,204 1.0091999 Dev. 15/16 528,382,172 529,786,899 1.0032000 Dev. 15/16 467,683,456 472,849,433 1.011
1997 Dev. 14/15 497,254,603 500,962,066 1.0071998 Dev. 14/15 414,693,365 418,356,725 1.0091999 Dev. 14/15 521,442,021 528,382,172 1.0132000 Dev. 14/15 465,080,044 467,683,456 1.0062001 Dev. 14/15 470,814,414 473,843,378 1.006
1998 Dev. 13/14 411,933,808 414,693,365 1.0071999 Dev. 13/14 507,994,821 521,442,021 1.0262000 Dev. 13/14 461,853,650 465,080,044 1.0072001 Dev. 13/14 469,663,079 470,814,414 1.0022002 Dev. 13/14 518,438,122 522,239,153 1.007
1999 Dev. 12/13 503,813,136 507,994,821 1.0082000 Dev. 12/13 457,645,461 461,853,650 1.0092001 Dev. 12/13 464,416,616 469,663,079 1.0112002 Dev. 12/13 516,616,786 518,438,122 1.0042003 Dev. 12/13 540,843,008 546,570,491 1.011
2000 Dev. 11/12 453,280,632 457,645,461 1.0102001 Dev. 11/12 429,215,641 464,416,616 1.0822002 Dev. 11/12 513,704,251 516,616,786 1.0062003 Dev. 11/12 539,592,304 540,843,008 1.0022004 Dev. 11/12 553,681,999 552,742,927 0.998
2001 Dev. 10/11 427,851,578 429,215,641 1.0032002 Dev. 10/11 508,667,346 513,704,251 1.0102003 Dev. 10/11 528,265,048 539,592,304 1.0212004 Dev. 10/11 551,233,414 553,681,999 1.0042005 Dev. 10/11 547,415,046 553,171,924 1.011
Development 10th/11th 11th/12th 12th/13th 13th/14th 14th/15th 15th/16th 16th/17th 17th/18th 18th/19th
5 Year Average 1.010 1.020 1.009 1.010 1.008 1.009 1.007 1.009 1.0074 Year Average 1.012 1.022 1.009 1.011 1.009 1.008 1.008 1.010 1.0073 Year Average 1.012 1.002 1.009 1.005 1.008 1.008 1.007 1.010 1.0072 Year Average 1.008 1.000 1.008 1.005 1.006 1.007 1.006 1.009 1.005Latest Year 1.011 0.998 1.011 1.007 1.006 1.011 1.006 1.010 1.007Mid 3 of 5 1.008 1.006 1.009 1.007 1.007 1.010 1.007 1.009 1.008
WORKERS' COMPENSATION - NEW YORKNew York State Insurance Fund
Policy Year Development Factors - Indemnity Losses (Case Basis)
Page 57
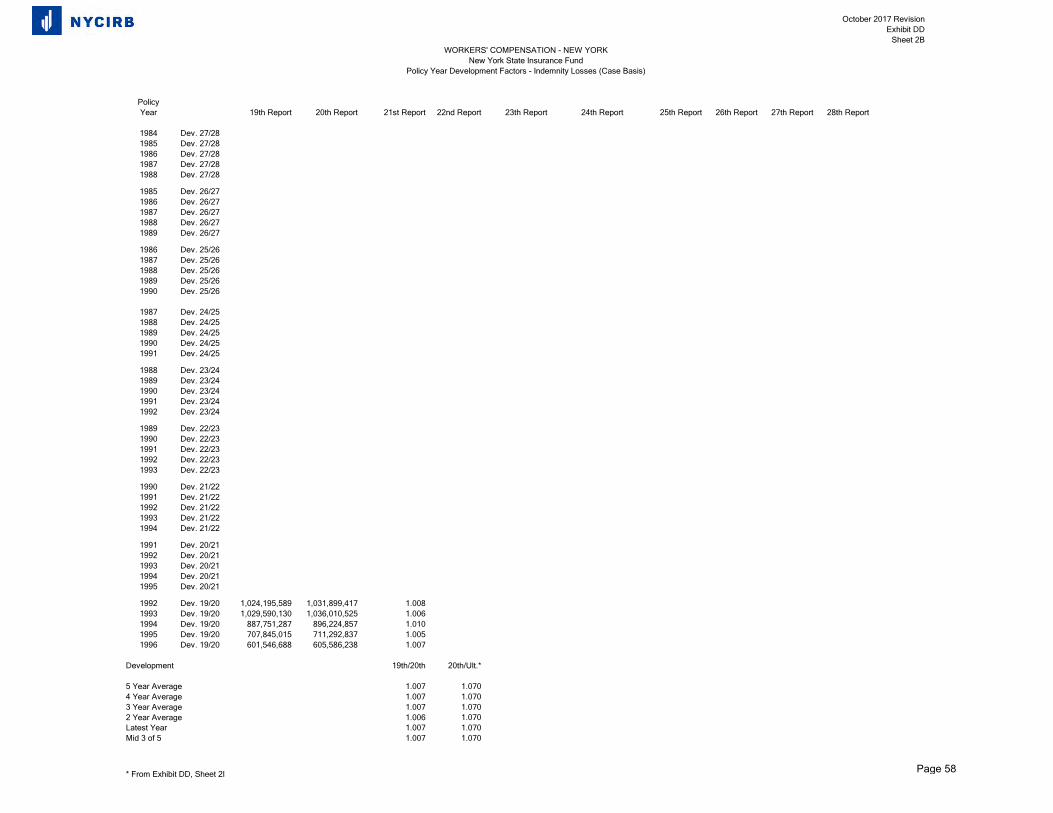
October 2017 RevisionExhibit DD
Sheet 2B
PolicyYear 19th Report 20th Report 21st Report 22nd Report 23th Report 24th Report 25th Report 26th Report 27th Report 28th Report
1984 Dev. 27/281985 Dev. 27/281986 Dev. 27/281987 Dev. 27/281988 Dev. 27/28
1985 Dev. 26/271986 Dev. 26/271987 Dev. 26/271988 Dev. 26/271989 Dev. 26/27
1986 Dev. 25/261987 Dev. 25/261988 Dev. 25/261989 Dev. 25/261990 Dev. 25/26
1987 Dev. 24/251988 Dev. 24/251989 Dev. 24/251990 Dev. 24/251991 Dev. 24/25
1988 Dev. 23/241989 Dev. 23/241990 Dev. 23/241991 Dev. 23/241992 Dev. 23/24
1989 Dev. 22/231990 Dev. 22/231991 Dev. 22/231992 Dev. 22/231993 Dev. 22/23
1990 Dev. 21/221991 Dev. 21/221992 Dev. 21/221993 Dev. 21/221994 Dev. 21/22
1991 Dev. 20/211992 Dev. 20/211993 Dev. 20/211994 Dev. 20/211995 Dev. 20/21
1992 Dev. 19/20 1,024,195,589 1,031,899,417 1.0081993 Dev. 19/20 1,029,590,130 1,036,010,525 1.0061994 Dev. 19/20 887,751,287 896,224,857 1.0101995 Dev. 19/20 707,845,015 711,292,837 1.0051996 Dev. 19/20 601,546,688 605,586,238 1.007
Development 19th/20th 20th/Ult.*
5 Year Average 1.007 1.0704 Year Average 1.007 1.0703 Year Average 1.007 1.0702 Year Average 1.006 1.070Latest Year 1.007 1.070Mid 3 of 5 1.007 1.070
* From Exhibit DD, Sheet 2I
WORKERS' COMPENSATION - NEW YORKNew York State Insurance Fund
Policy Year Development Factors - Indemnity Losses (Case Basis)
Page 58
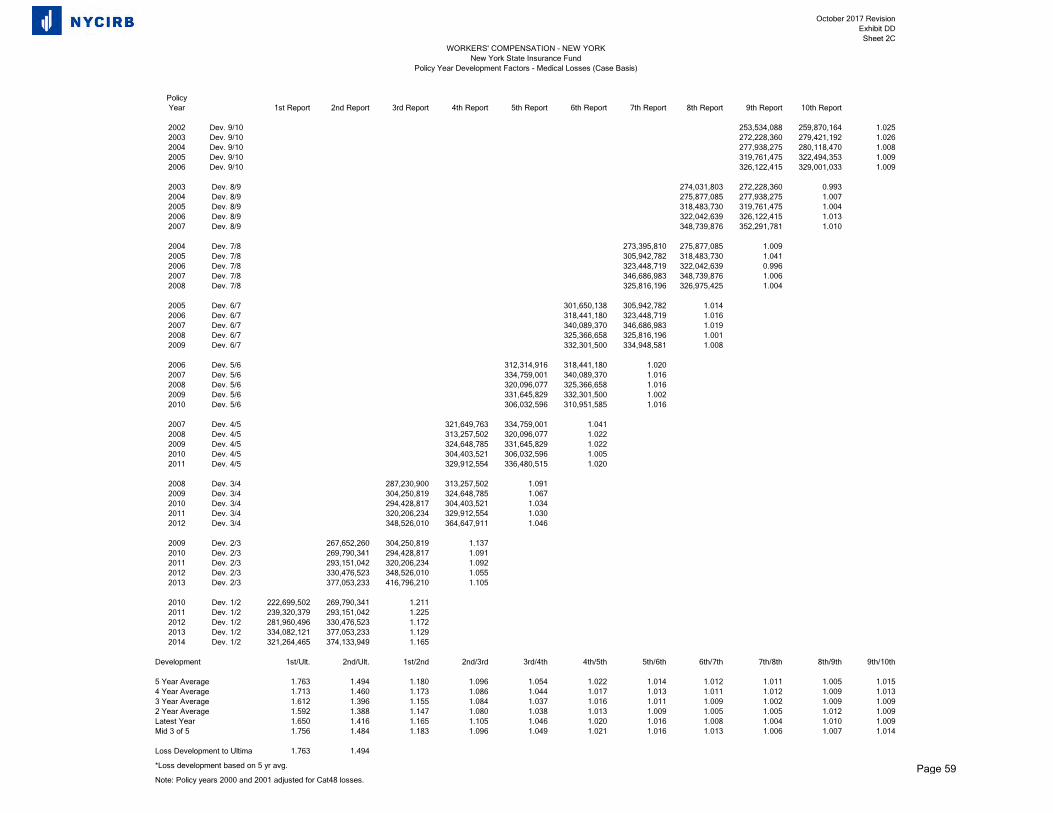
October 2017 RevisionExhibit DDSheet 2C
PolicyYear 1st Report 2nd Report 3rd Report 4th Report 5th Report 6th Report 7th Report 8th Report 9th Report 10th Report
2002 Dev. 9/10 253,534,088 259,870,164 1.0252003 Dev. 9/10 272,228,360 279,421,192 1.0262004 Dev. 9/10 277,938,275 280,118,470 1.0082005 Dev. 9/10 319,761,475 322,494,353 1.0092006 Dev. 9/10 326,122,415 329,001,033 1.009
2003 Dev. 8/9 274,031,803 272,228,360 0.9932004 Dev. 8/9 275,877,085 277,938,275 1.0072005 Dev. 8/9 318,483,730 319,761,475 1.0042006 Dev. 8/9 322,042,639 326,122,415 1.0132007 Dev. 8/9 348,739,876 352,291,781 1.010
2004 Dev. 7/8 273,395,810 275,877,085 1.0092005 Dev. 7/8 305,942,782 318,483,730 1.0412006 Dev. 7/8 323,448,719 322,042,639 0.9962007 Dev. 7/8 346,686,983 348,739,876 1.0062008 Dev. 7/8 325,816,196 326,975,425 1.004
2005 Dev. 6/7 301,650,138 305,942,782 1.0142006 Dev. 6/7 318,441,180 323,448,719 1.0162007 Dev. 6/7 340,089,370 346,686,983 1.0192008 Dev. 6/7 325,366,658 325,816,196 1.0012009 Dev. 6/7 332,301,500 334,948,581 1.008
2006 Dev. 5/6 312,314,916 318,441,180 1.0202007 Dev. 5/6 334,759,001 340,089,370 1.0162008 Dev. 5/6 320,096,077 325,366,658 1.0162009 Dev. 5/6 331,645,829 332,301,500 1.0022010 Dev. 5/6 306,032,596 310,951,585 1.016
2007 Dev. 4/5 321,649,763 334,759,001 1.0412008 Dev. 4/5 313,257,502 320,096,077 1.0222009 Dev. 4/5 324,648,785 331,645,829 1.0222010 Dev. 4/5 304,403,521 306,032,596 1.0052011 Dev. 4/5 329,912,554 336,480,515 1.020
2008 Dev. 3/4 287,230,900 313,257,502 1.0912009 Dev. 3/4 304,250,819 324,648,785 1.0672010 Dev. 3/4 294,428,817 304,403,521 1.0342011 Dev. 3/4 320,206,234 329,912,554 1.0302012 Dev. 3/4 348,526,010 364,647,911 1.046
2009 Dev. 2/3 267,652,260 304,250,819 1.1372010 Dev. 2/3 269,790,341 294,428,817 1.0912011 Dev. 2/3 293,151,042 320,206,234 1.0922012 Dev. 2/3 330,476,523 348,526,010 1.0552013 Dev. 2/3 377,053,233 416,796,210 1.105
2010 Dev. 1/2 222,699,502 269,790,341 1.2112011 Dev. 1/2 239,320,379 293,151,042 1.2252012 Dev. 1/2 281,960,496 330,476,523 1.1722013 Dev. 1/2 334,082,121 377,053,233 1.1292014 Dev. 1/2 321,264,465 374,133,949 1.165
Development 1st/Ult. 2nd/Ult. 1st/2nd 2nd/3rd 3rd/4th 4th/5th 5th/6th 6th/7th 7th/8th 8th/9th 9th/10th
5 Year Average 1.763 1.494 1.180 1.096 1.054 1.022 1.014 1.012 1.011 1.005 1.0154 Year Average 1.713 1.460 1.173 1.086 1.044 1.017 1.013 1.011 1.012 1.009 1.0133 Year Average 1.612 1.396 1.155 1.084 1.037 1.016 1.011 1.009 1.002 1.009 1.0092 Year Average 1.592 1.388 1.147 1.080 1.038 1.013 1.009 1.005 1.005 1.012 1.009Latest Year 1.650 1.416 1.165 1.105 1.046 1.020 1.016 1.008 1.004 1.010 1.009Mid 3 of 5 1.756 1.484 1.183 1.096 1.049 1.021 1.016 1.013 1.006 1.007 1.014
Loss Development to Ultima 1.763 1.494
*Loss development based on 5 yr avg.
Note: Policy years 2000 and 2001 adjusted for Cat48 losses.
WORKERS' COMPENSATION - NEW YORKNew York State Insurance Fund
Policy Year Development Factors - Medical Losses (Case Basis)
Page 59
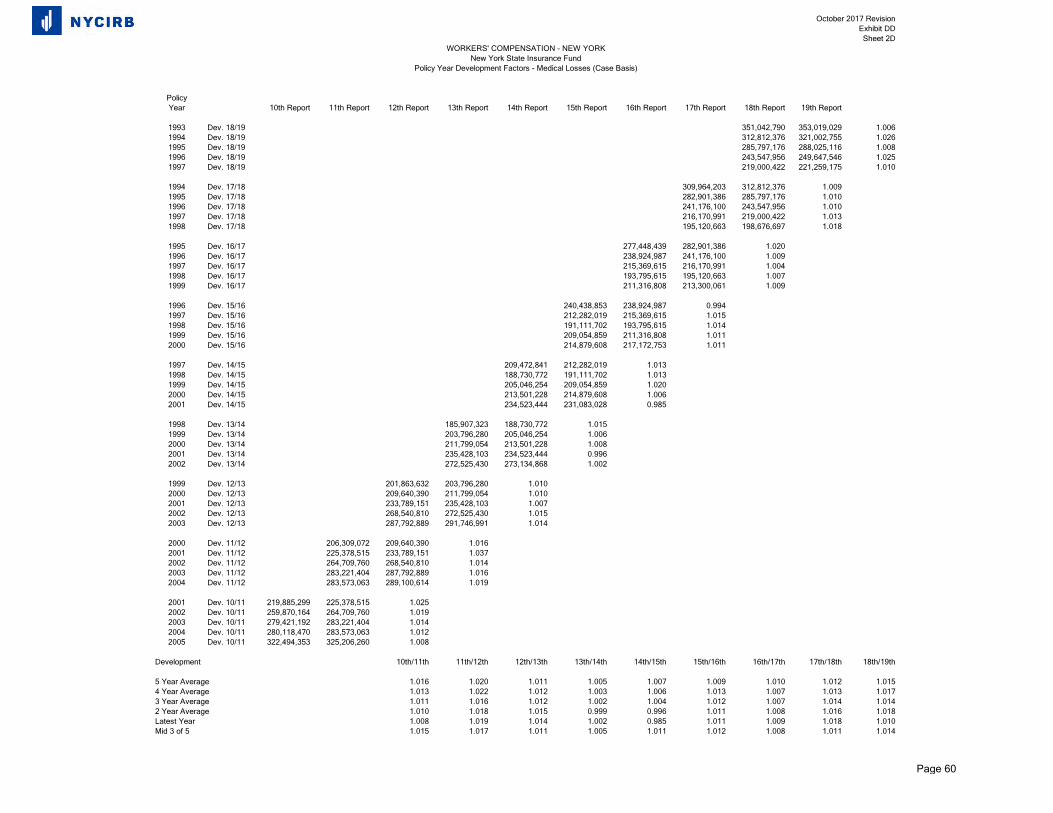
October 2017 RevisionExhibit DDSheet 2D
PolicyYear 10th Report 11th Report 12th Report 13th Report 14th Report 15th Report 16th Report 17th Report 18th Report 19th Report
1993 Dev. 18/19 351,042,790 353,019,029 1.0061994 Dev. 18/19 312,812,376 321,002,755 1.0261995 Dev. 18/19 285,797,176 288,025,116 1.0081996 Dev. 18/19 243,547,956 249,647,546 1.0251997 Dev. 18/19 219,000,422 221,259,175 1.010
1994 Dev. 17/18 309,964,203 312,812,376 1.0091995 Dev. 17/18 282,901,386 285,797,176 1.0101996 Dev. 17/18 241,176,100 243,547,956 1.0101997 Dev. 17/18 216,170,991 219,000,422 1.0131998 Dev. 17/18 195,120,663 198,676,697 1.018
1995 Dev. 16/17 277,448,439 282,901,386 1.0201996 Dev. 16/17 238,924,987 241,176,100 1.0091997 Dev. 16/17 215,369,615 216,170,991 1.0041998 Dev. 16/17 193,795,615 195,120,663 1.0071999 Dev. 16/17 211,316,808 213,300,061 1.009
1996 Dev. 15/16 240,438,853 238,924,987 0.9941997 Dev. 15/16 212,282,019 215,369,615 1.0151998 Dev. 15/16 191,111,702 193,795,615 1.0141999 Dev. 15/16 209,054,859 211,316,808 1.0112000 Dev. 15/16 214,879,608 217,172,753 1.011
1997 Dev. 14/15 209,472,841 212,282,019 1.0131998 Dev. 14/15 188,730,772 191,111,702 1.0131999 Dev. 14/15 205,046,254 209,054,859 1.0202000 Dev. 14/15 213,501,228 214,879,608 1.0062001 Dev. 14/15 234,523,444 231,083,028 0.985
1998 Dev. 13/14 185,907,323 188,730,772 1.0151999 Dev. 13/14 203,796,280 205,046,254 1.0062000 Dev. 13/14 211,799,054 213,501,228 1.0082001 Dev. 13/14 235,428,103 234,523,444 0.9962002 Dev. 13/14 272,525,430 273,134,868 1.002
1999 Dev. 12/13 201,863,632 203,796,280 1.0102000 Dev. 12/13 209,640,390 211,799,054 1.0102001 Dev. 12/13 233,789,151 235,428,103 1.0072002 Dev. 12/13 268,540,810 272,525,430 1.0152003 Dev. 12/13 287,792,889 291,746,991 1.014
2000 Dev. 11/12 206,309,072 209,640,390 1.0162001 Dev. 11/12 225,378,515 233,789,151 1.0372002 Dev. 11/12 264,709,760 268,540,810 1.0142003 Dev. 11/12 283,221,404 287,792,889 1.0162004 Dev. 11/12 283,573,063 289,100,614 1.019
2001 Dev. 10/11 219,885,299 225,378,515 1.0252002 Dev. 10/11 259,870,164 264,709,760 1.0192003 Dev. 10/11 279,421,192 283,221,404 1.0142004 Dev. 10/11 280,118,470 283,573,063 1.0122005 Dev. 10/11 322,494,353 325,206,260 1.008
Development 10th/11th 11th/12th 12th/13th 13th/14th 14th/15th 15th/16th 16th/17th 17th/18th 18th/19th
5 Year Average 1.016 1.020 1.011 1.005 1.007 1.009 1.010 1.012 1.0154 Year Average 1.013 1.022 1.012 1.003 1.006 1.013 1.007 1.013 1.0173 Year Average 1.011 1.016 1.012 1.002 1.004 1.012 1.007 1.014 1.0142 Year Average 1.010 1.018 1.015 0.999 0.996 1.011 1.008 1.016 1.018Latest Year 1.008 1.019 1.014 1.002 0.985 1.011 1.009 1.018 1.010Mid 3 of 5 1.015 1.017 1.011 1.005 1.011 1.012 1.008 1.011 1.014
WORKERS' COMPENSATION - NEW YORKNew York State Insurance Fund
Policy Year Development Factors - Medical Losses (Case Basis)
Page 60
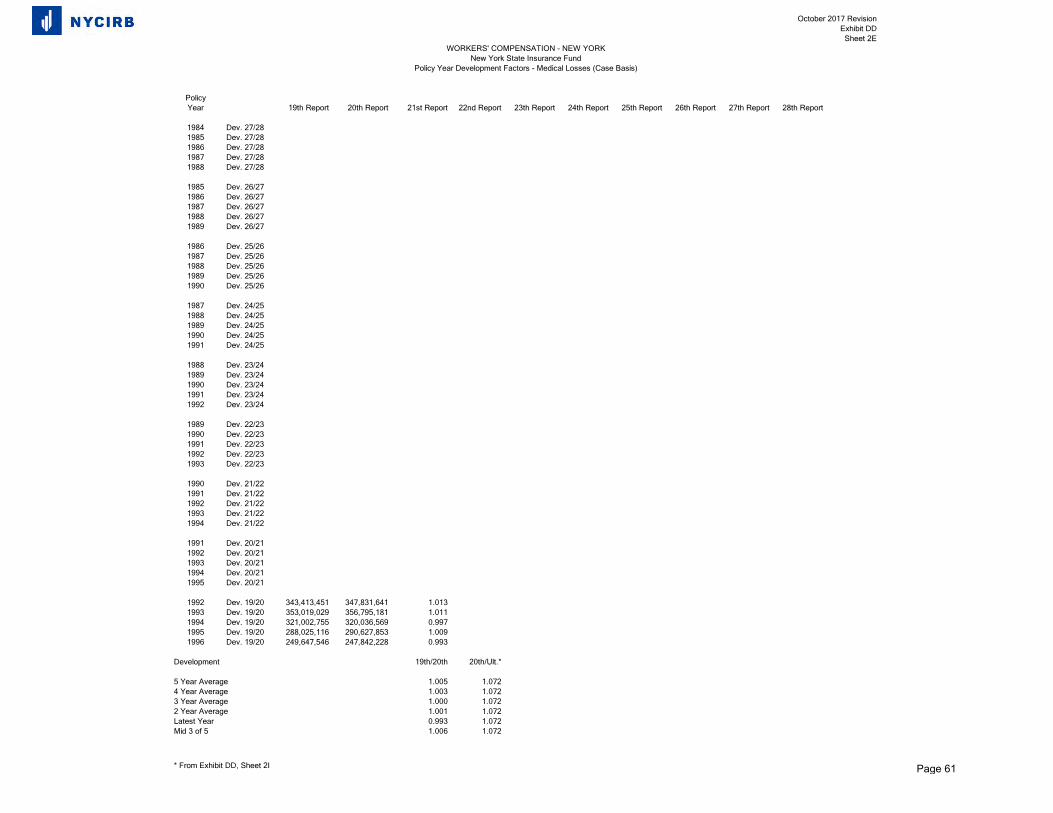
October 2017 RevisionExhibit DD
Sheet 2E
PolicyYear 19th Report 20th Report 21st Report 22nd Report 23th Report 24th Report 25th Report 26th Report 27th Report 28th Report
1984 Dev. 27/281985 Dev. 27/281986 Dev. 27/281987 Dev. 27/281988 Dev. 27/28
1985 Dev. 26/271986 Dev. 26/271987 Dev. 26/271988 Dev. 26/271989 Dev. 26/27
1986 Dev. 25/261987 Dev. 25/261988 Dev. 25/261989 Dev. 25/261990 Dev. 25/26
1987 Dev. 24/251988 Dev. 24/251989 Dev. 24/251990 Dev. 24/251991 Dev. 24/25
1988 Dev. 23/241989 Dev. 23/241990 Dev. 23/241991 Dev. 23/241992 Dev. 23/24
1989 Dev. 22/231990 Dev. 22/231991 Dev. 22/231992 Dev. 22/231993 Dev. 22/23
1990 Dev. 21/221991 Dev. 21/221992 Dev. 21/221993 Dev. 21/221994 Dev. 21/22
1991 Dev. 20/211992 Dev. 20/211993 Dev. 20/211994 Dev. 20/211995 Dev. 20/21
1992 Dev. 19/20 343,413,451 347,831,641 1.0131993 Dev. 19/20 353,019,029 356,795,181 1.0111994 Dev. 19/20 321,002,755 320,036,569 0.9971995 Dev. 19/20 288,025,116 290,627,853 1.0091996 Dev. 19/20 249,647,546 247,842,228 0.993
Development 19th/20th 20th/Ult.*
5 Year Average 1.005 1.0724 Year Average 1.003 1.0723 Year Average 1.000 1.0722 Year Average 1.001 1.072Latest Year 0.993 1.072Mid 3 of 5 1.006 1.072
* From Exhibit DD, Sheet 2I
WORKERS' COMPENSATION - NEW YORKNew York State Insurance Fund
Policy Year Development Factors - Medical Losses (Case Basis)
Page 61
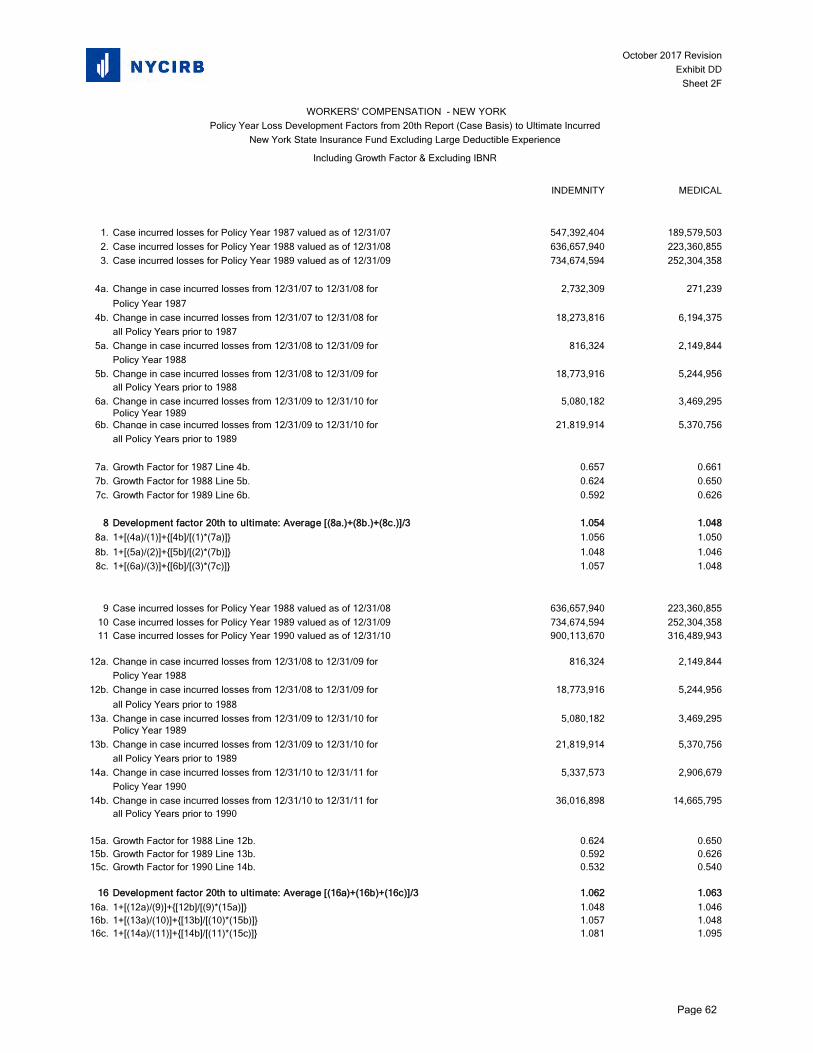
October 2017 RevisionExhibit DD
Sheet 2F
INDEMNITY MEDICAL
1. Case incurred losses for Policy Year 1987 valued as of 12/31/07 547,392,404 189,579,5032. Case incurred losses for Policy Year 1988 valued as of 12/31/08 636,657,940 223,360,8553. Case incurred losses for Policy Year 1989 valued as of 12/31/09 734,674,594 252,304,358
4a. Change in case incurred losses from 12/31/07 to 12/31/08 for 2,732,309 271,239Policy Year 1987
4b. Change in case incurred losses from 12/31/07 to 12/31/08 for 18,273,816 6,194,375all Policy Years prior to 1987
5a. Change in case incurred losses from 12/31/08 to 12/31/09 for 816,324 2,149,844Policy Year 1988
5b. Change in case incurred losses from 12/31/08 to 12/31/09 for 18,773,916 5,244,956all Policy Years prior to 1988
6a. Change in case incurred losses from 12/31/09 to 12/31/10 for 5,080,182 3,469,295Policy Year 1989
6b. Change in case incurred losses from 12/31/09 to 12/31/10 for 21,819,914 5,370,756all Policy Years prior to 1989
7a. Growth Factor for 1987 Line 4b. 0.657 0.6617b. Growth Factor for 1988 Line 5b. 0.624 0.6507c. Growth Factor for 1989 Line 6b. 0.592 0.626
8 Development factor 20th to ultimate: Average [(8a.)+(8b.)+(8c.)]/3 1.054 1.0488a. 1+[(4a)/(1)]+{[4b]/[(1)*(7a)]} 1.056 1.0508b. 1+[(5a)/(2)]+{[5b]/[(2)*(7b)]} 1.048 1.0468c. 1+[(6a)/(3)]+{[6b]/[(3)*(7c)]} 1.057 1.048
9 Case incurred losses for Policy Year 1988 valued as of 12/31/08 636,657,940 223,360,85510 Case incurred losses for Policy Year 1989 valued as of 12/31/09 734,674,594 252,304,35811 Case incurred losses for Policy Year 1990 valued as of 12/31/10 900,113,670 316,489,943
12a. Change in case incurred losses from 12/31/08 to 12/31/09 for 816,324 2,149,844Policy Year 1988
12b. Change in case incurred losses from 12/31/08 to 12/31/09 for 18,773,916 5,244,956all Policy Years prior to 1988
13a. Change in case incurred losses from 12/31/09 to 12/31/10 for 5,080,182 3,469,295Policy Year 1989
13b. Change in case incurred losses from 12/31/09 to 12/31/10 for 21,819,914 5,370,756all Policy Years prior to 1989
14a. Change in case incurred losses from 12/31/10 to 12/31/11 for 5,337,573 2,906,679Policy Year 1990
14b. Change in case incurred losses from 12/31/10 to 12/31/11 for 36,016,898 14,665,795all Policy Years prior to 1990
15a. Growth Factor for 1988 Line 12b. 0.624 0.65015b. Growth Factor for 1989 Line 13b. 0.592 0.62615c. Growth Factor for 1990 Line 14b. 0.532 0.540
16 Development factor 20th to ultimate: Average [(16a)+(16b)+(16c)]/3 1.062 1.06316a. 1+[(12a)/(9)]+{[12b]/[(9)*(15a)]} 1.048 1.04616b. 1+[(13a)/(10)]+{[13b]/[(10)*(15b)]} 1.057 1.04816c. 1+[(14a)/(11)]+{[14b]/[(11)*(15c)]} 1.081 1.095
WORKERS' COMPENSATION - NEW YORKPolicy Year Loss Development Factors from 20th Report (Case Basis) to Ultimate Incurred
New York State Insurance Fund Excluding Large Deductible Experience
Including Growth Factor & Excluding IBNR
Page 62
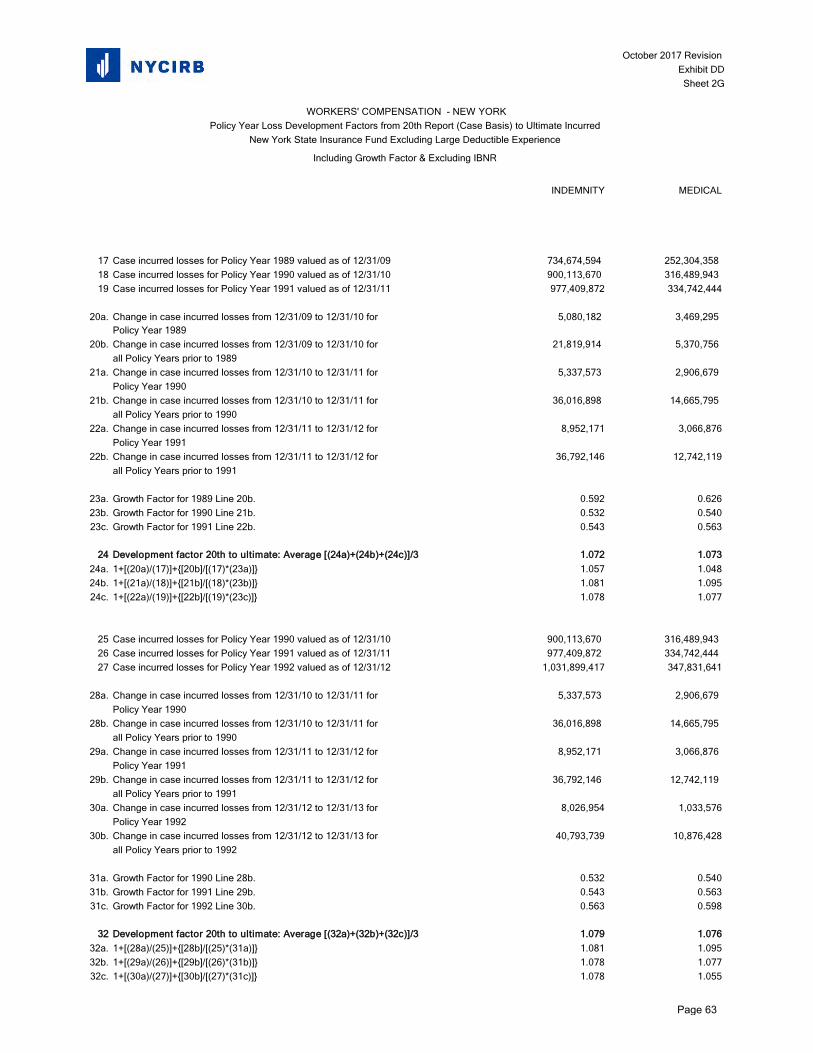
October 2017 Revision Exhibit DDSheet 2G
INDEMNITY MEDICAL
WORKERS' COMPENSATION - NEW YORKPolicy Year Loss Development Factors from 20th Report (Case Basis) to Ultimate Incurred
New York State Insurance Fund Excluding Large Deductible Experience
Including Growth Factor & Excluding IBNR
17 Case incurred losses for Policy Year 1989 valued as of 12/31/09 734,674,594 252,304,358 18 Case incurred losses for Policy Year 1990 valued as of 12/31/10 900,113,670 316,489,943 19 Case incurred losses for Policy Year 1991 valued as of 12/31/11 977,409,872 334,742,444
20a. Change in case incurred losses from 12/31/09 to 12/31/10 for 5,080,182 3,469,295 Policy Year 1989
20b. Change in case incurred losses from 12/31/09 to 12/31/10 for 21,819,914 5,370,756 all Policy Years prior to 1989
21a. Change in case incurred losses from 12/31/10 to 12/31/11 for 5,337,573 2,906,679 Policy Year 1990
21b. Change in case incurred losses from 12/31/10 to 12/31/11 for 36,016,898 14,665,795 all Policy Years prior to 1990
22a. Change in case incurred losses from 12/31/11 to 12/31/12 for 8,952,171 3,066,876Policy Year 1991
22b. Change in case incurred losses from 12/31/11 to 12/31/12 for 36,792,146 12,742,119all Policy Years prior to 1991
23a. Growth Factor for 1989 Line 20b. 0.592 0.62623b. Growth Factor for 1990 Line 21b. 0.532 0.54023c. Growth Factor for 1991 Line 22b. 0.543 0.563
24 Development factor 20th to ultimate: Average [(24a)+(24b)+(24c)]/3 1.072 1.07324a. 1+[(20a)/(17)]+{[20b]/[(17)*(23a)]} 1.057 1.04824b. 1+[(21a)/(18)]+{[21b]/[(18)*(23b)]} 1.081 1.09524c. 1+[(22a)/(19)]+{[22b]/[(19)*(23c)]} 1.078 1.077
25 Case incurred losses for Policy Year 1990 valued as of 12/31/10 900,113,670 316,489,943 26 Case incurred losses for Policy Year 1991 valued as of 12/31/11 977,409,872 334,742,444 27 Case incurred losses for Policy Year 1992 valued as of 12/31/12 1,031,899,417 347,831,641
28a. Change in case incurred losses from 12/31/10 to 12/31/11 for 5,337,573 2,906,679 Policy Year 1990
28b. Change in case incurred losses from 12/31/10 to 12/31/11 for 36,016,898 14,665,795 all Policy Years prior to 1990
29a. Change in case incurred losses from 12/31/11 to 12/31/12 for 8,952,171 3,066,876 Policy Year 1991
29b. Change in case incurred losses from 12/31/11 to 12/31/12 for 36,792,146 12,742,119 all Policy Years prior to 1991
30a. Change in case incurred losses from 12/31/12 to 12/31/13 for 8,026,954 1,033,576Policy Year 1992
30b. Change in case incurred losses from 12/31/12 to 12/31/13 for 40,793,739 10,876,428all Policy Years prior to 1992
31a. Growth Factor for 1990 Line 28b. 0.532 0.54031b. Growth Factor for 1991 Line 29b. 0.543 0.56331c. Growth Factor for 1992 Line 30b. 0.563 0.598
32 Development factor 20th to ultimate: Average [(32a)+(32b)+(32c)]/3 1.079 1.07632a. 1+[(28a)/(25)]+{[28b]/[(25)*(31a)]} 1.081 1.09532b. 1+[(29a)/(26)]+{[29b]/[(26)*(31b)]} 1.078 1.07732c. 1+[(30a)/(27)]+{[30b]/[(27)*(31c)]} 1.078 1.055
Page 63
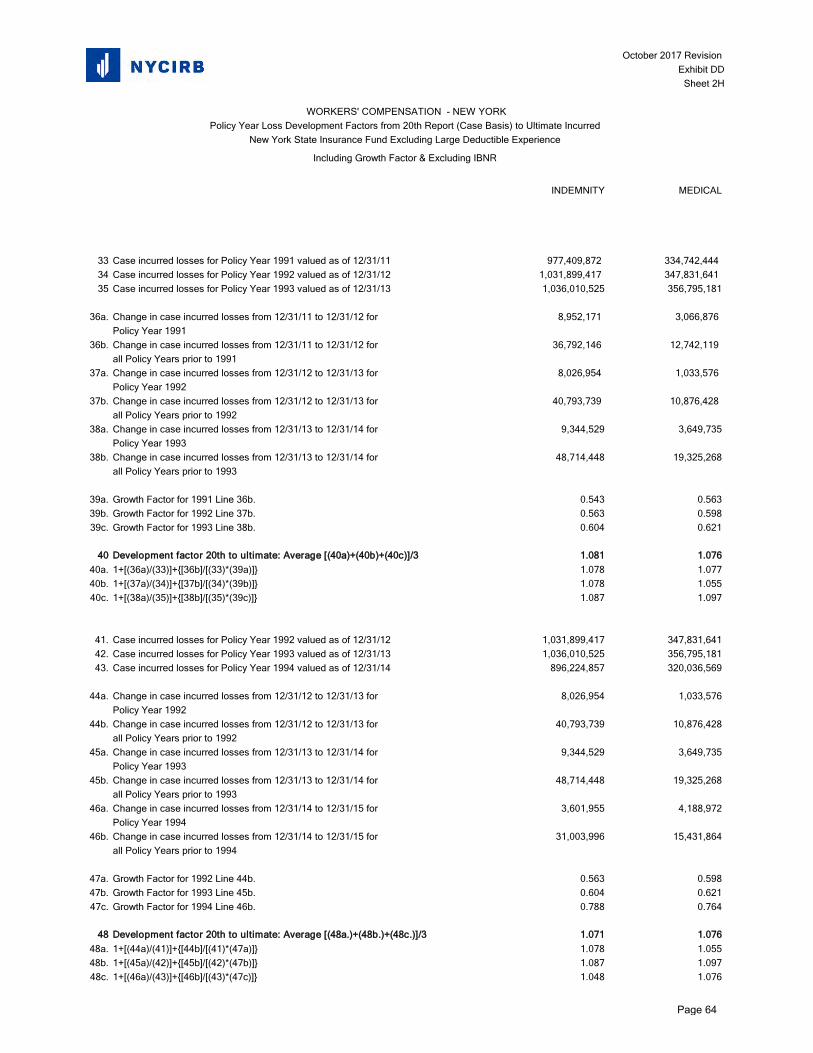
October 2017 Revision Exhibit DD
Sheet 2H
INDEMNITY MEDICAL
WORKERS' COMPENSATION - NEW YORKPolicy Year Loss Development Factors from 20th Report (Case Basis) to Ultimate Incurred
New York State Insurance Fund Excluding Large Deductible Experience
Including Growth Factor & Excluding IBNR
33 Case incurred losses for Policy Year 1991 valued as of 12/31/11 977,409,872 334,742,444 34 Case incurred losses for Policy Year 1992 valued as of 12/31/12 1,031,899,417 347,831,641 35 Case incurred losses for Policy Year 1993 valued as of 12/31/13 1,036,010,525 356,795,181
36a. Change in case incurred losses from 12/31/11 to 12/31/12 for 8,952,171 3,066,876 Policy Year 1991
36b. Change in case incurred losses from 12/31/11 to 12/31/12 for 36,792,146 12,742,119 all Policy Years prior to 1991
37a. Change in case incurred losses from 12/31/12 to 12/31/13 for 8,026,954 1,033,576 Policy Year 1992
37b. Change in case incurred losses from 12/31/12 to 12/31/13 for 40,793,739 10,876,428 all Policy Years prior to 1992
38a. Change in case incurred losses from 12/31/13 to 12/31/14 for 9,344,529 3,649,735Policy Year 1993
38b. Change in case incurred losses from 12/31/13 to 12/31/14 for 48,714,448 19,325,268all Policy Years prior to 1993
39a. Growth Factor for 1991 Line 36b. 0.543 0.56339b. Growth Factor for 1992 Line 37b. 0.563 0.59839c. Growth Factor for 1993 Line 38b. 0.604 0.621
40 Development factor 20th to ultimate: Average [(40a)+(40b)+(40c)]/3 1.081 1.07640a. 1+[(36a)/(33)]+{[36b]/[(33)*(39a)]} 1.078 1.07740b. 1+[(37a)/(34)]+{[37b]/[(34)*(39b)]} 1.078 1.05540c. 1+[(38a)/(35)]+{[38b]/[(35)*(39c)]} 1.087 1.097
41. Case incurred losses for Policy Year 1992 valued as of 12/31/12 1,031,899,417 347,831,64142. Case incurred losses for Policy Year 1993 valued as of 12/31/13 1,036,010,525 356,795,18143. Case incurred losses for Policy Year 1994 valued as of 12/31/14 896,224,857 320,036,569
44a. Change in case incurred losses from 12/31/12 to 12/31/13 for 8,026,954 1,033,576Policy Year 1992
44b. Change in case incurred losses from 12/31/12 to 12/31/13 for 40,793,739 10,876,428all Policy Years prior to 1992
45a. Change in case incurred losses from 12/31/13 to 12/31/14 for 9,344,529 3,649,735Policy Year 1993
45b. Change in case incurred losses from 12/31/13 to 12/31/14 for 48,714,448 19,325,268all Policy Years prior to 1993
46a. Change in case incurred losses from 12/31/14 to 12/31/15 for 3,601,955 4,188,972Policy Year 1994
46b. Change in case incurred losses from 12/31/14 to 12/31/15 for 31,003,996 15,431,864all Policy Years prior to 1994
47a. Growth Factor for 1992 Line 44b. 0.563 0.59847b. Growth Factor for 1993 Line 45b. 0.604 0.62147c. Growth Factor for 1994 Line 46b. 0.788 0.764
48 Development factor 20th to ultimate: Average [(48a.)+(48b.)+(48c.)]/3 1.071 1.07648a. 1+[(44a)/(41)]+{[44b]/[(41)*(47a)]} 1.078 1.05548b. 1+[(45a)/(42)]+{[45b]/[(42)*(47b)]} 1.087 1.09748c. 1+[(46a)/(43)]+{[46b]/[(43)*(47c)]} 1.048 1.076
Page 64
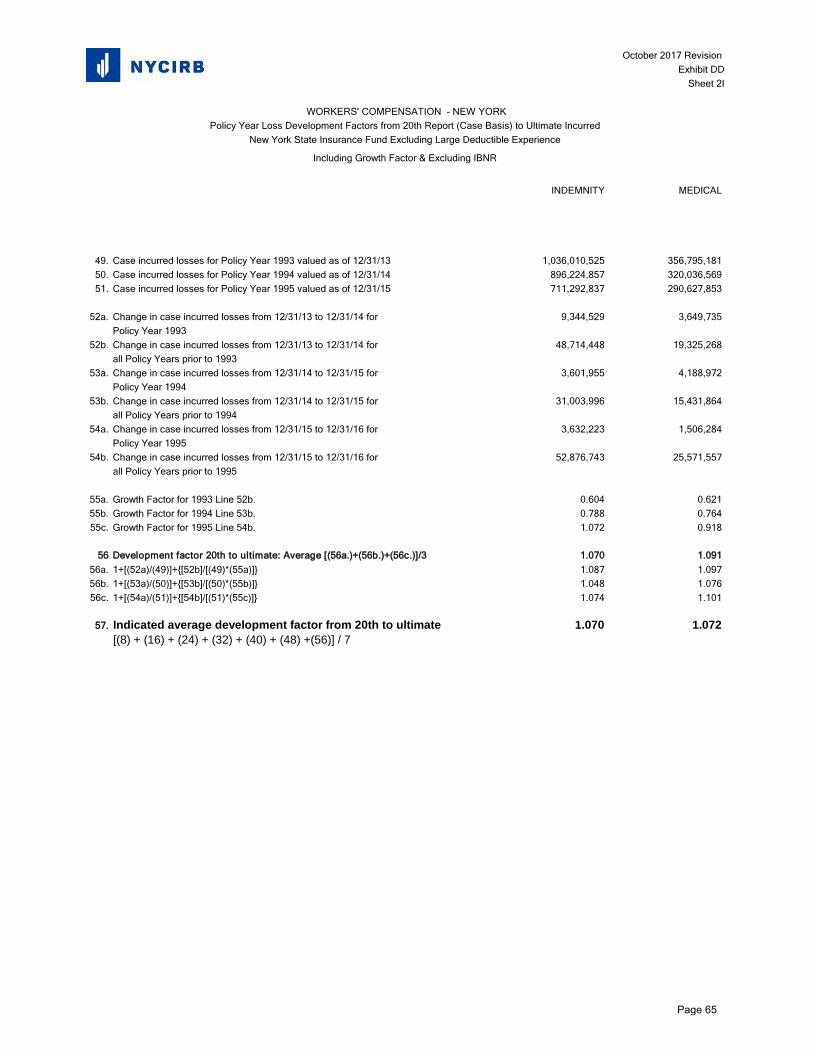
October 2017 Revision Exhibit DD
Sheet 2I
INDEMNITY MEDICAL
WORKERS' COMPENSATION - NEW YORKPolicy Year Loss Development Factors from 20th Report (Case Basis) to Ultimate Incurred
New York State Insurance Fund Excluding Large Deductible Experience
Including Growth Factor & Excluding IBNR
49. Case incurred losses for Policy Year 1993 valued as of 12/31/13 1,036,010,525 356,795,18150. Case incurred losses for Policy Year 1994 valued as of 12/31/14 896,224,857 320,036,56951. Case incurred losses for Policy Year 1995 valued as of 12/31/15 711,292,837 290,627,853
52a. Change in case incurred losses from 12/31/13 to 12/31/14 for 9,344,529 3,649,735Policy Year 1993
52b. Change in case incurred losses from 12/31/13 to 12/31/14 for 48,714,448 19,325,268all Policy Years prior to 1993
53a. Change in case incurred losses from 12/31/14 to 12/31/15 for 3,601,955 4,188,972Policy Year 1994
53b. Change in case incurred losses from 12/31/14 to 12/31/15 for 31,003,996 15,431,864all Policy Years prior to 1994
54a. Change in case incurred losses from 12/31/15 to 12/31/16 for 3,632,223 1,506,284Policy Year 1995
54b. Change in case incurred losses from 12/31/15 to 12/31/16 for 52,876,743 25,571,557all Policy Years prior to 1995
55a. Growth Factor for 1993 Line 52b. 0.604 0.62155b. Growth Factor for 1994 Line 53b. 0.788 0.76455c. Growth Factor for 1995 Line 54b. 1.072 0.918
56 Development factor 20th to ultimate: Average [(56a.)+(56b.)+(56c.)]/3 1.070 1.09156a. 1+[(52a)/(49)]+{[52b]/[(49)*(55a)]} 1.087 1.09756b. 1+[(53a)/(50)]+{[53b]/[(50)*(55b)]} 1.048 1.07656c. 1+[(54a)/(51)]+{[54b]/[(51)*(55c)]} 1.074 1.101
57. Indicated average development factor from 20th to ultimate 1.070 1.072[(8) + (16) + (24) + (32) + (40) + (48) +(56)] / 7
Page 65
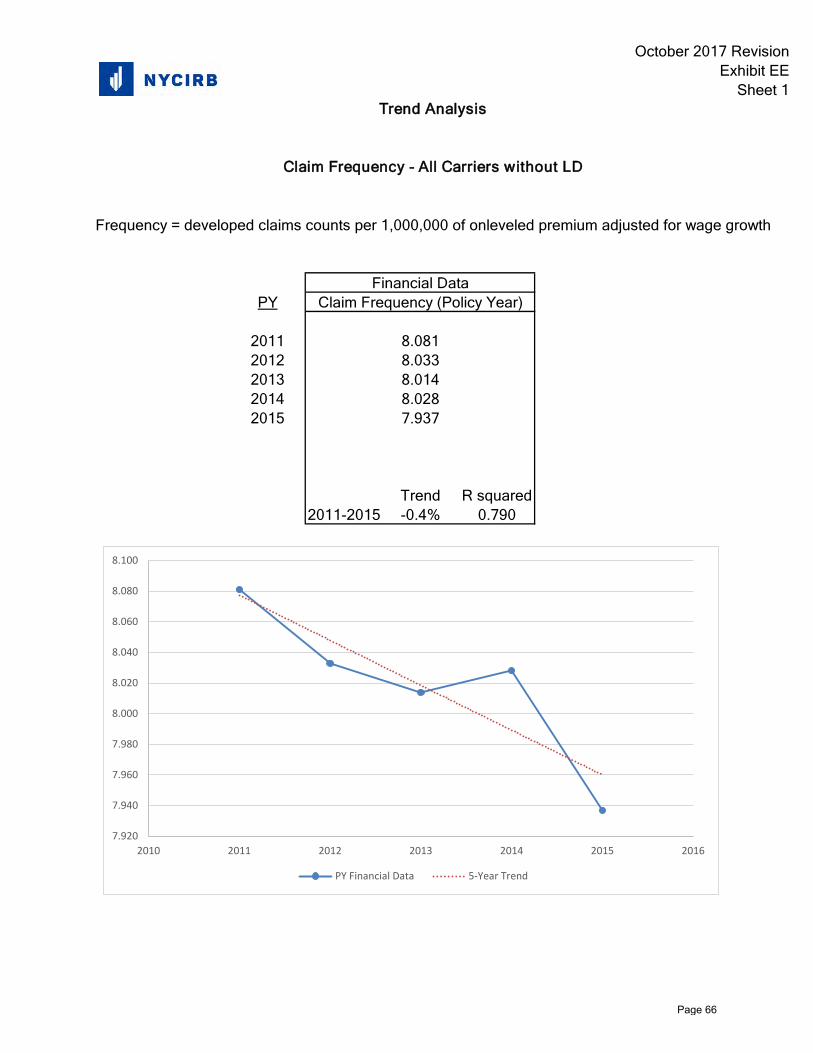
October 2017 RevisionExhibit EE
Sheet 1Trend Analysis
Claim Frequency - All Carriers without LD
Frequency = developed claims counts per 1,000,000 of onleveled premium adjusted for wage growth
PY
2011 8.0812012 8.0332013 8.0142014 8.0282015 7.937
Trend R squared2011-2015 -0.4% 0.790
Financial DataClaim Frequency (Policy Year)
7.920
7.940
7.960
7.980
8.000
8.020
8.040
8.060
8.080
8.100
2010 2011 2012 2013 2014 2015 2016
PY Financial Data 5-Year Trend
Page 66
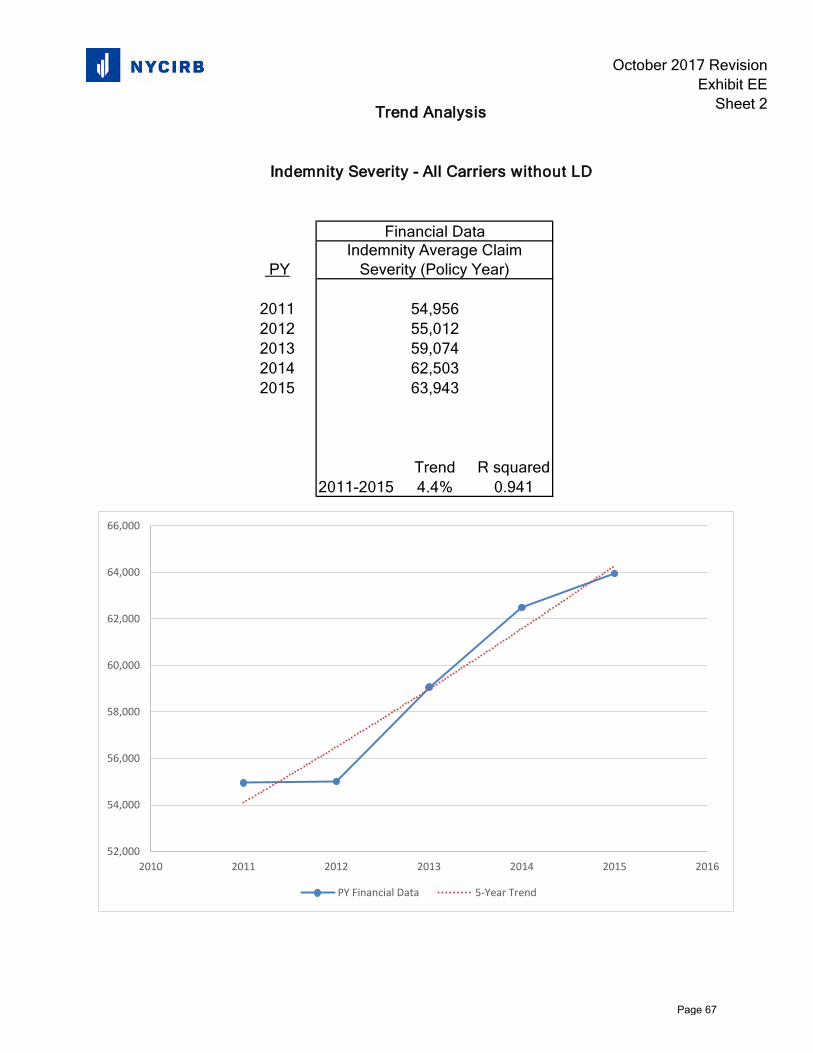
Trend Analysis
Indemnity Severity - All Carriers without LD
PY
2011 54,9562012 55,0122013 59,0742014 62,5032015 63,943
Trend R squared2011-2015 4.4% 0.941
Financial DataIndemnity Average Claim
Severity (Policy Year)
52,000
54,000
56,000
58,000
60,000
62,000
64,000
66,000
2010 2011 2012 2013 2014 2015 2016
PY Financial Data 5-Year Trend
October 2017 RevisionExhibit EE
Sheet 2
Page 67
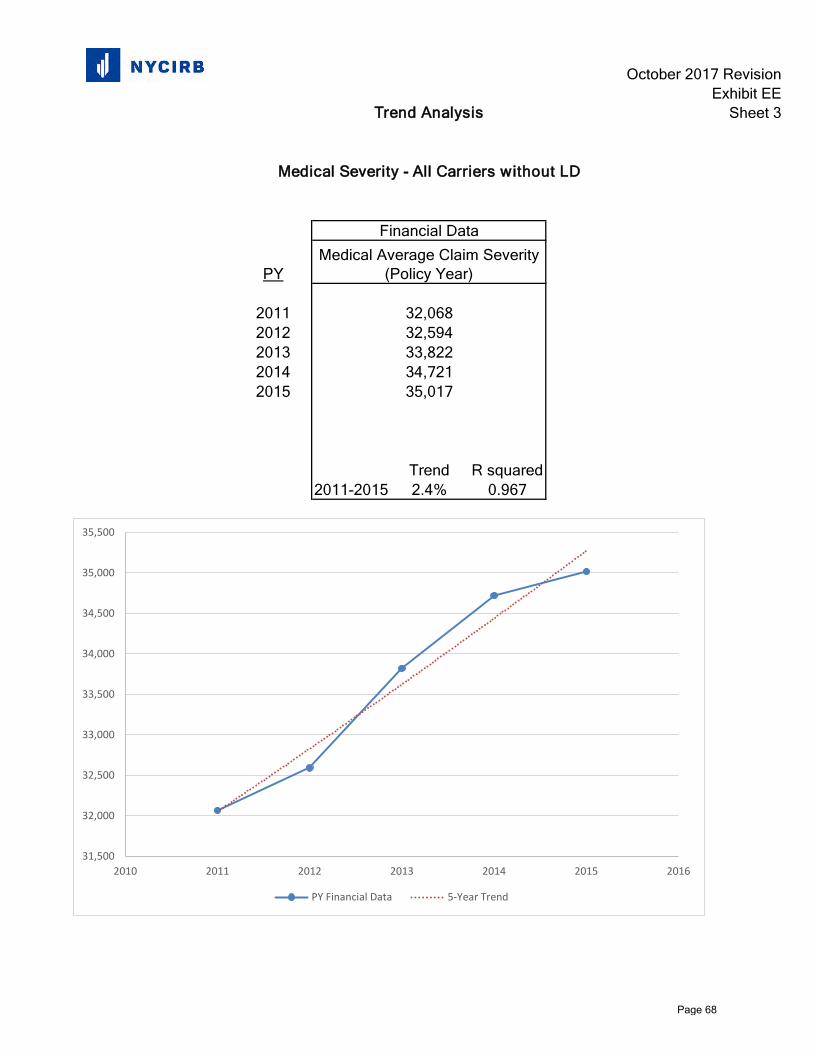
Trend Analysis
Medical Severity - All Carriers without LD
PY
2011 32,0682012 32,5942013 33,8222014 34,7212015 35,017
Trend R squared2011-2015 2.4% 0.967
Medical Average Claim Severity (Policy Year)
Financial Data
31,500
32,000
32,500
33,000
33,500
34,000
34,500
35,000
35,500
2010 2011 2012 2013 2014 2015 2016
PY Financial Data 5-Year Trend
October 2017 RevisionExhibit EE
Sheet 3
Page 68
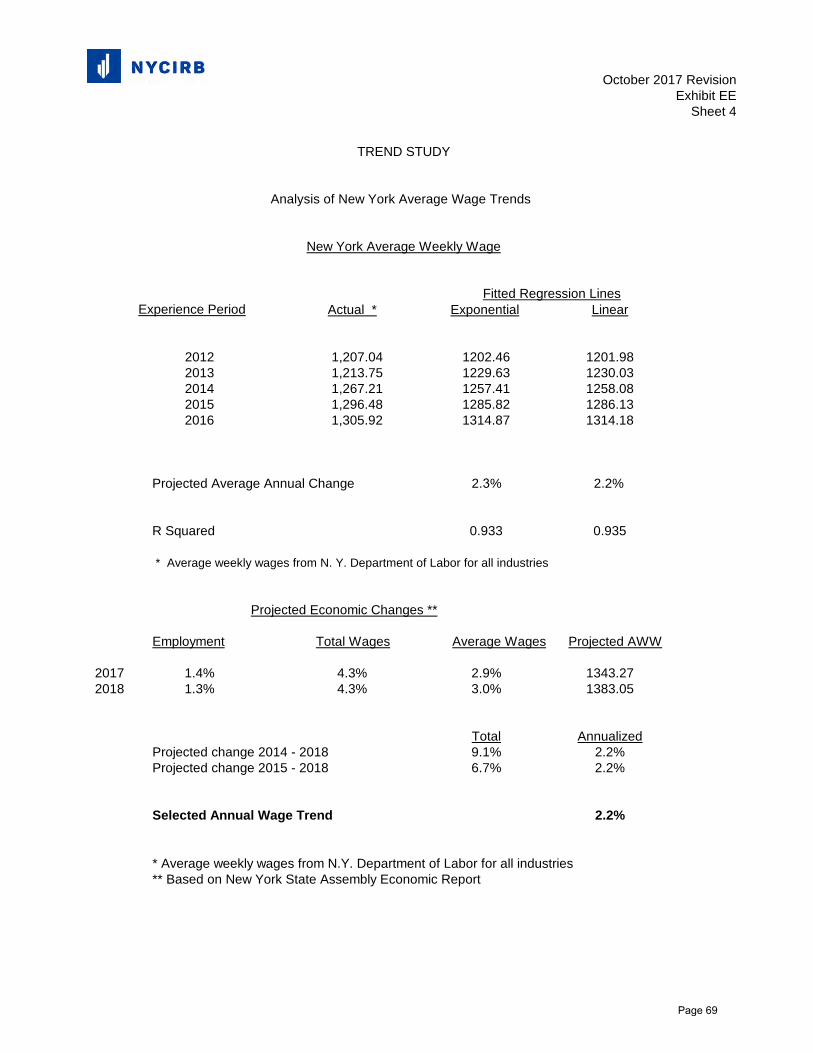
October 2017 RevisionExhibit EE
Sheet 4
TREND STUDY
Analysis of New York Average Wage Trends
New York Average Weekly Wage
Actual * Exponential Linear
2012 1,207.04 1202.46 1201.982013 1,213.75 1229.63 1230.032014 1,267.21 1257.41 1258.082015 1,296.48 1285.82 1286.132016 1,305.92 1314.87 1314.18
Projected Average Annual Change 2.3% 2.2%
R Squared 0.933 0.935
* Average weekly wages from N. Y. Department of Labor for all industries
Projected Economic Changes **
Employment Total Wages Average Wages Projected AWW
2017 1.4% 4.3% 2.9% 1343.272018 1.3% 4.3% 3.0% 1383.05
Total AnnualizedProjected change 2014 - 2018 9.1% 2.2%Projected change 2015 - 2018 6.7% 2.2%
Selected Annual Wage Trend 2.2%
* Average weekly wages from N.Y. Department of Labor for all industries** Based on New York State Assembly Economic Report
Fitted Regression LinesExperience Period
Page 69
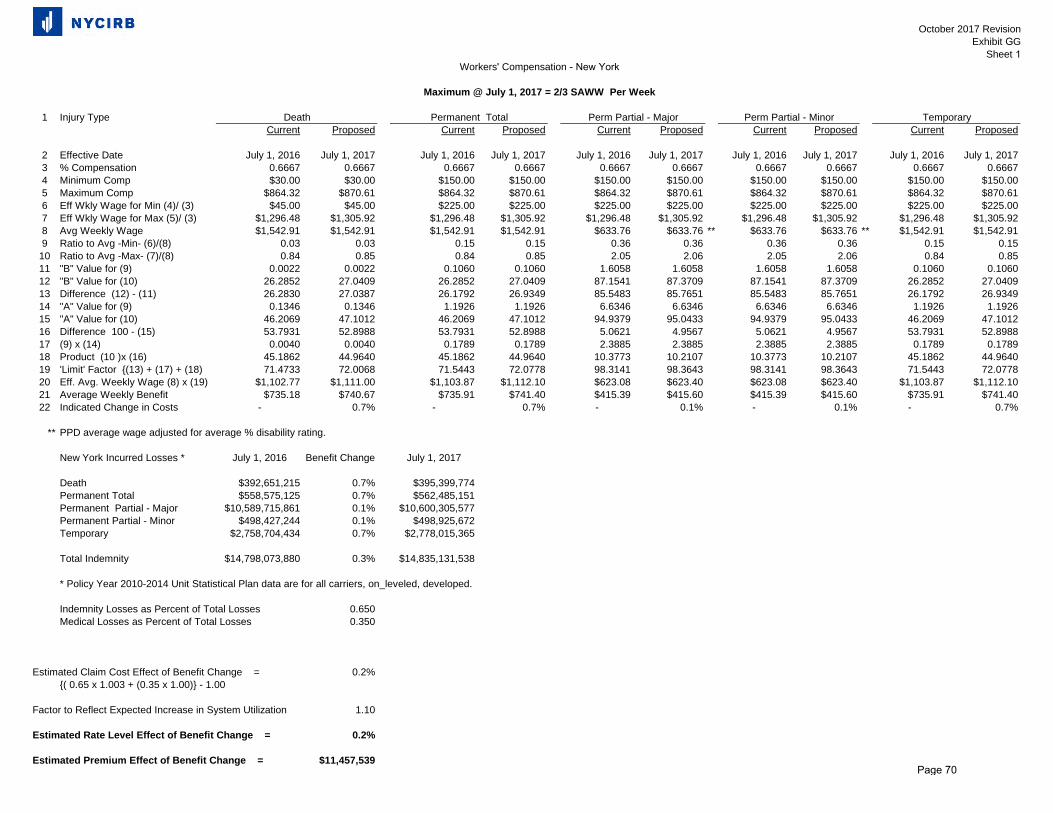
October 2017 Revision Exhibit GG
Sheet 1
1 Injury Type Permanent Total Perm Partial - Major Perm Partial - Minor TemporaryCurrent Proposed Current Proposed Current Proposed Current Proposed Current Proposed
2 Effective Date July 1, 2016 July 1, 2017 July 1, 2016 July 1, 2017 July 1, 2016 July 1, 2017 July 1, 2016 July 1, 2017 July 1, 2016 July 1, 20173 % Compensation 0.6667 0.6667 0.6667 0.6667 0.6667 0.6667 0.6667 0.6667 0.6667 0.66674 Minimum Comp $30.00 $30.00 $150.00 $150.00 $150.00 $150.00 $150.00 $150.00 $150.00 $150.005 Maximum Comp $864.32 $870.61 $864.32 $870.61 $864.32 $870.61 $864.32 $870.61 $864.32 $870.616 Eff Wkly Wage for Min (4)/ (3) $45.00 $45.00 $225.00 $225.00 $225.00 $225.00 $225.00 $225.00 $225.00 $225.007 Eff Wkly Wage for Max (5)/ (3) $1,296.48 $1,305.92 $1,296.48 $1,305.92 $1,296.48 $1,305.92 $1,296.48 $1,305.92 $1,296.48 $1,305.928 Avg Weekly Wage $1,542.91 $1,542.91 $1,542.91 $1,542.91 $633.76 $633.76 ** $633.76 $633.76 ** $1,542.91 $1,542.919 Ratio to Avg -Min- (6)/(8) 0.03 0.03 0.15 0.15 0.36 0.36 0.36 0.36 0.15 0.15
10 Ratio to Avg -Max- (7)/(8) 0.84 0.85 0.84 0.85 2.05 2.06 2.05 2.06 0.84 0.8511 "B" Value for (9) 0.0022 0.0022 0.1060 0.1060 1.6058 1.6058 1.6058 1.6058 0.1060 0.106012 "B" Value for (10) 26.2852 27.0409 26.2852 27.0409 87.1541 87.3709 87.1541 87.3709 26.2852 27.040913 Difference (12) - (11) 26.2830 27.0387 26.1792 26.9349 85.5483 85.7651 85.5483 85.7651 26.1792 26.934914 "A" Value for (9) 0.1346 0.1346 1.1926 1.1926 6.6346 6.6346 6.6346 6.6346 1.1926 1.192615 "A" Value for (10) 46.2069 47.1012 46.2069 47.1012 94.9379 95.0433 94.9379 95.0433 46.2069 47.101216 Difference 100 - (15) 53.7931 52.8988 53.7931 52.8988 5.0621 4.9567 5.0621 4.9567 53.7931 52.898817 (9) x (14) 0.0040 0.0040 0.1789 0.1789 2.3885 2.3885 2.3885 2.3885 0.1789 0.178918 Product (10 )x (16) 45.1862 44.9640 45.1862 44.9640 10.3773 10.2107 10.3773 10.2107 45.1862 44.964019 'Limit' Factor {(13) + (17) + (18) 71.4733 72.0068 71.5443 72.0778 98.3141 98.3643 98.3141 98.3643 71.5443 72.077820 Eff. Avg. Weekly Wage (8) x (19) $1,102.77 $1,111.00 $1,103.87 $1,112.10 $623.08 $623.40 $623.08 $623.40 $1,103.87 $1,112.1021 Average Weekly Benefit $735.18 $740.67 $735.91 $741.40 $415.39 $415.60 $415.39 $415.60 $735.91 $741.4022 Indicated Change in Costs - 0.7% - 0.7% - 0.1% - 0.1% - 0.7%
** PPD average wage adjusted for average % disability rating.
New York Incurred Losses * July 1, 2016 Benefit Change July 1, 2017
Death $392,651,215 0.7% $395,399,774Permanent Total $558,575,125 0.7% $562,485,151Permanent Partial - Major $10,589,715,861 0.1% $10,600,305,577Permanent Partial - Minor $498,427,244 0.1% $498,925,672Temporary $2,758,704,434 0.7% $2,778,015,365
Total Indemnity $14,798,073,880 0.3% $14,835,131,538
* Policy Year 2010-2014 Unit Statistical Plan data are for all carriers, on_leveled, developed.
0.650Indemnity Losses as Percent of Total Losses Medical Losses as Percent of Total Losses 0.350
Estimated Claim Cost Effect of Benefit Change = 0.2%{( 0.65 x 1.003 + (0.35 x 1.00)} - 1.00
Factor to Reflect Expected Increase in System Utilization 1.10
Estimated Rate Level Effect of Benefit Change = 0.2%
Estimated Premium Effect of Benefit Change = $11,457,539
Workers' Compensation - New York
Maximum @ July 1, 2017 = 2/3 SAWW Per Week
Death
Page 70
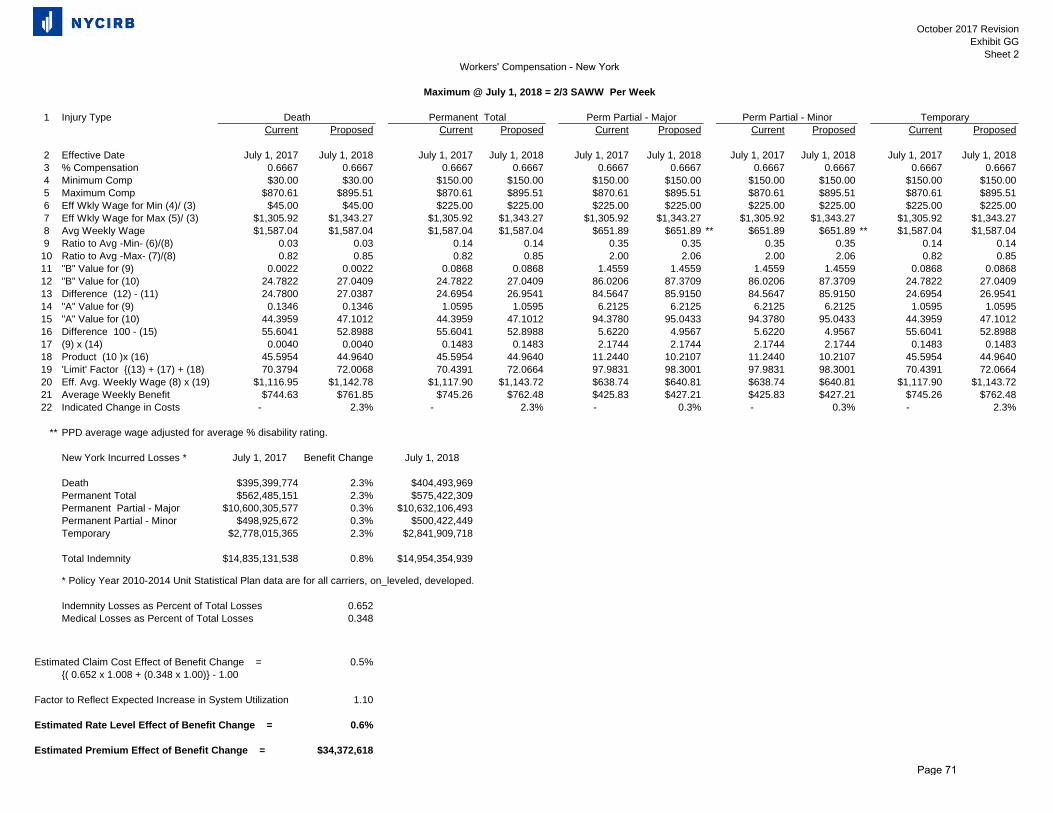
October 2017 Revision Exhibit GG
Sheet 2Workers' Compensation - New York
Maximum @ July 1, 2018 = 2/3 SAWW Per Week
1 Injury Type Permanent Total Perm Partial - Major Perm Partial - Minor TemporaryCurrent Proposed Current Proposed Current Proposed Current Proposed Current Proposed
2 Effective Date July 1, 2017 July 1, 2018 July 1, 2017 July 1, 2018 July 1, 2017 July 1, 2018 July 1, 2017 July 1, 2018 July 1, 2017 July 1, 20183 % Compensation 0.6667 0.6667 0.6667 0.6667 0.6667 0.6667 0.6667 0.6667 0.6667 0.66674 Minimum Comp $30.00 $30.00 $150.00 $150.00 $150.00 $150.00 $150.00 $150.00 $150.00 $150.005 Maximum Comp $870.61 $895.51 $870.61 $895.51 $870.61 $895.51 $870.61 $895.51 $870.61 $895.516 Eff Wkly Wage for Min (4)/ (3) $45.00 $45.00 $225.00 $225.00 $225.00 $225.00 $225.00 $225.00 $225.00 $225.007 Eff Wkly Wage for Max (5)/ (3) $1,305.92 $1,343.27 $1,305.92 $1,343.27 $1,305.92 $1,343.27 $1,305.92 $1,343.27 $1,305.92 $1,343.278 Avg Weekly Wage $1,587.04 $1,587.04 $1,587.04 $1,587.04 $651.89 $651.89 ** $651.89 $651.89 ** $1,587.04 $1,587.049 Ratio to Avg -Min- (6)/(8) 0.03 0.03 0.14 0.14 0.35 0.35 0.35 0.35 0.14 0.14
10 Ratio to Avg -Max- (7)/(8) 0.82 0.85 0.82 0.85 2.00 2.06 2.00 2.06 0.82 0.8511 "B" Value for (9) 0.0022 0.0022 0.0868 0.0868 1.4559 1.4559 1.4559 1.4559 0.0868 0.086812 "B" Value for (10) 24.7822 27.0409 24.7822 27.0409 86.0206 87.3709 86.0206 87.3709 24.7822 27.040913 Difference (12) - (11) 24.7800 27.0387 24.6954 26.9541 84.5647 85.9150 84.5647 85.9150 24.6954 26.954114 "A" Value for (9) 0.1346 0.1346 1.0595 1.0595 6.2125 6.2125 6.2125 6.2125 1.0595 1.059515 "A" Value for (10) 44.3959 47.1012 44.3959 47.1012 94.3780 95.0433 94.3780 95.0433 44.3959 47.101216 Difference 100 - (15) 55.6041 52.8988 55.6041 52.8988 5.6220 4.9567 5.6220 4.9567 55.6041 52.898817 (9) x (14) 0.0040 0.0040 0.1483 0.1483 2.1744 2.1744 2.1744 2.1744 0.1483 0.148318 Product (10 )x (16) 45.5954 44.9640 45.5954 44.9640 11.2440 10.2107 11.2440 10.2107 45.5954 44.964019 'Limit' Factor {(13) + (17) + (18) 70.3794 72.0068 70.4391 72.0664 97.9831 98.3001 97.9831 98.3001 70.4391 72.066420 Eff. Avg. Weekly Wage (8) x (19) $1,116.95 $1,142.78 $1,117.90 $1,143.72 $638.74 $640.81 $638.74 $640.81 $1,117.90 $1,143.7221 Average Weekly Benefit $744.63 $761.85 $745.26 $762.48 $425.83 $427.21 $425.83 $427.21 $745.26 $762.4822 Indicated Change in Costs - 2.3% - 2.3% - 0.3% - 0.3% - 2.3%
** PPD average wage adjusted for average % disability rating.
New York Incurred Losses * July 1, 2017 Benefit Change July 1, 2018
Death $395,399,774 2.3% $404,493,969Permanent Total $562,485,151 2.3% $575,422,309Permanent Partial - Major $10,600,305,577 0.3% $10,632,106,493Permanent Partial - Minor $498,925,672 0.3% $500,422,449Temporary $2,778,015,365 2.3% $2,841,909,718
Total Indemnity $14,835,131,538 0.8% $14,954,354,939
* Policy Year 2010-2014 Unit Statistical Plan data are for all carriers, on_leveled, developed.
0.6520.348
Indemnity Losses as Percent of Total Losses Medical Losses as Percent of Total Losses
Estimated Claim Cost Effect of Benefit Change = 0.5%{( 0.652 x 1.008 + (0.348 x 1.00)} - 1.00
Factor to Reflect Expected Increase in System Utilization 1.10
Estimated Rate Level Effect of Benefit Change = 0.6%
Estimated Premium Effect of Benefit Change = $34,372,618
Death
Page 71
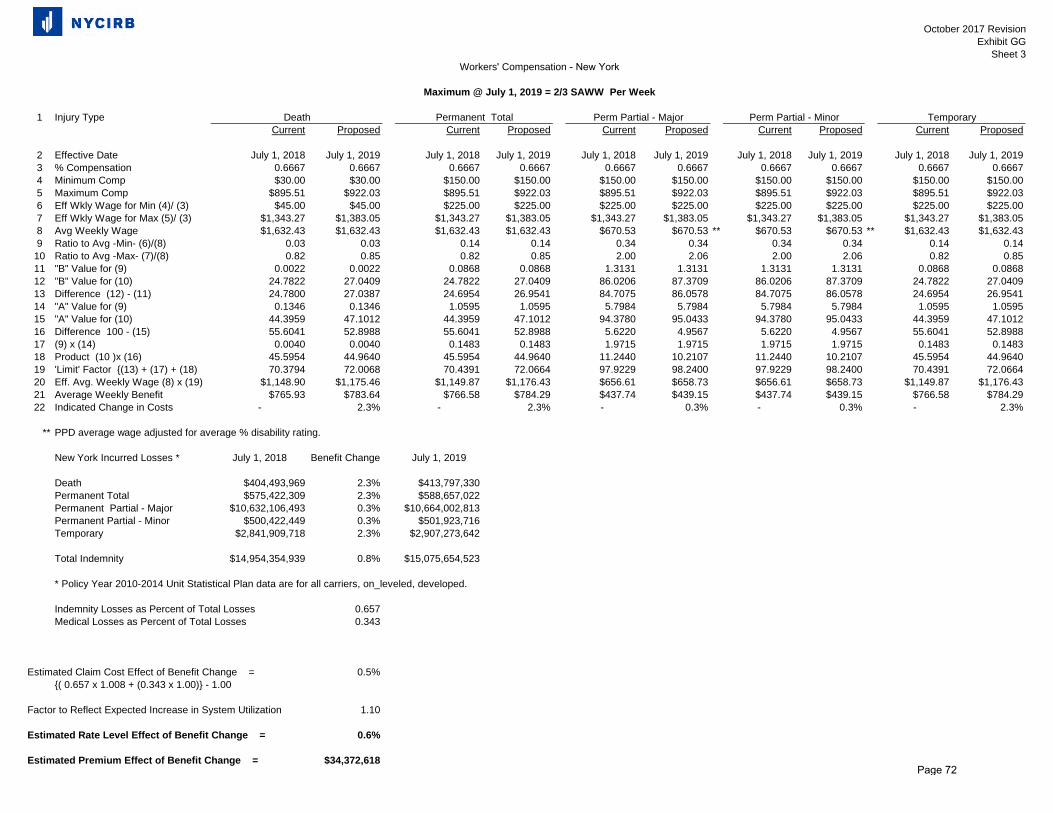
October 2017 Revision Exhibit GG
Sheet 3Workers' Compensation - New York
Maximum @ July 1, 2019 = 2/3 SAWW Per Week
1 Injury Type Permanent Total Perm Partial - Major Perm Partial - Minor TemporaryCurrent Proposed Current Proposed Current Proposed Current Proposed Current Proposed
2 Effective Date July 1, 2018 July 1, 2019 July 1, 2018 July 1, 2019 July 1, 2018 July 1, 2019 July 1, 2018 July 1, 2019 July 1, 2018 July 1, 20193 % Compensation 0.6667 0.6667 0.6667 0.6667 0.6667 0.6667 0.6667 0.6667 0.6667 0.66674 Minimum Comp $30.00 $30.00 $150.00 $150.00 $150.00 $150.00 $150.00 $150.00 $150.00 $150.005 Maximum Comp $895.51 $922.03 $895.51 $922.03 $895.51 $922.03 $895.51 $922.03 $895.51 $922.036 Eff Wkly Wage for Min (4)/ (3) $45.00 $45.00 $225.00 $225.00 $225.00 $225.00 $225.00 $225.00 $225.00 $225.007 Eff Wkly Wage for Max (5)/ (3) $1,343.27 $1,383.05 $1,343.27 $1,383.05 $1,343.27 $1,383.05 $1,343.27 $1,383.05 $1,343.27 $1,383.058 Avg Weekly Wage $1,632.43 $1,632.43 $1,632.43 $1,632.43 $670.53 $670.53 ** $670.53 $670.53 ** $1,632.43 $1,632.439 Ratio to Avg -Min- (6)/(8) 0.03 0.03 0.14 0.14 0.34 0.34 0.34 0.34 0.14 0.14
10 Ratio to Avg -Max- (7)/(8) 0.82 0.85 0.82 0.85 2.00 2.06 2.00 2.06 0.82 0.8511 "B" Value for (9) 0.0022 0.0022 0.0868 0.0868 1.3131 1.3131 1.3131 1.3131 0.0868 0.086812 "B" Value for (10) 24.7822 27.0409 24.7822 27.0409 86.0206 87.3709 86.0206 87.3709 24.7822 27.040913 Difference (12) - (11) 24.7800 27.0387 24.6954 26.9541 84.7075 86.0578 84.7075 86.0578 24.6954 26.954114 "A" Value for (9) 0.1346 0.1346 1.0595 1.0595 5.7984 5.7984 5.7984 5.7984 1.0595 1.059515 "A" Value for (10) 44.3959 47.1012 44.3959 47.1012 94.3780 95.0433 94.3780 95.0433 44.3959 47.101216 Difference 100 - (15) 55.6041 52.8988 55.6041 52.8988 5.6220 4.9567 5.6220 4.9567 55.6041 52.898817 (9) x (14) 0.0040 0.0040 0.1483 0.1483 1.9715 1.9715 1.9715 1.9715 0.1483 0.148318 Product (10 )x (16) 45.5954 44.9640 45.5954 44.9640 11.2440 10.2107 11.2440 10.2107 45.5954 44.964019 'Limit' Factor {(13) + (17) + (18) 70.3794 72.0068 70.4391 72.0664 97.9229 98.2400 97.9229 98.2400 70.4391 72.066420 Eff. Avg. Weekly Wage (8) x (19) $1,148.90 $1,175.46 $1,149.87 $1,176.43 $656.61 $658.73 $656.61 $658.73 $1,149.87 $1,176.4321 Average Weekly Benefit $765.93 $783.64 $766.58 $784.29 $437.74 $439.15 $437.74 $439.15 $766.58 $784.2922 Indicated Change in Costs - 2.3% - 2.3% - 0.3% - 0.3% - 2.3%
** PPD average wage adjusted for average % disability rating.
New York Incurred Losses * July 1, 2018 Benefit Change July 1, 2019
Death $404,493,969 2.3% $413,797,330Permanent Total $575,422,309 2.3% $588,657,022Permanent Partial - Major $10,632,106,493 0.3% $10,664,002,813Permanent Partial - Minor $500,422,449 0.3% $501,923,716Temporary $2,841,909,718 2.3% $2,907,273,642
Total Indemnity $14,954,354,939 0.8% $15,075,654,523
* Policy Year 2010-2014 Unit Statistical Plan data are for all carriers, on_leveled, developed.
0.6570.343
Indemnity Losses as Percent of Total Losses Medical Losses as Percent of Total Losses
Estimated Claim Cost Effect of Benefit Change = 0.5%{( 0.657 x 1.008 + (0.343 x 1.00)} - 1.00
Factor to Reflect Expected Increase in System Utilization 1.10
Estimated Rate Level Effect of Benefit Change = 0.6%
Estimated Premium Effect of Benefit Change = $34,372,618
Death
Page 72
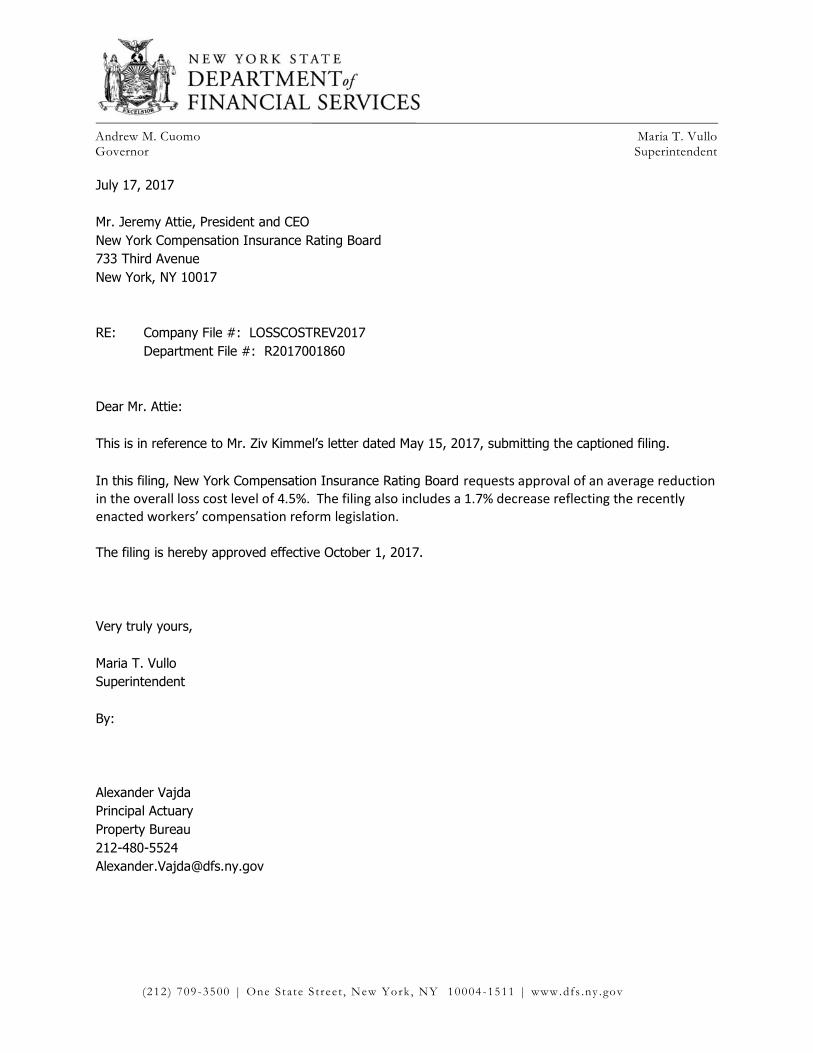
(212 ) 709 -3500 | One S t ate S t ree t , New York , NY 10004 -1511 | www.dfs .ny . gov
Maria T. VulloSuperintendent
Andrew M. CuomoGovernor
July 17, 2017
Mr. Jeremy Attie, President and CEONew York Compensation Insurance Rating Board733 Third AvenueNew York, NY 10017
RE: Company File #: LOSSCOSTREV2017Department File #: R2017001860
Dear Mr. Attie:
This is in reference to Mr. Ziv Kimmel’s letter dated May 15, 2017, submitting the captioned filing.
In this filing, New York Compensation Insurance Rating Board requests approval of an average reductionin the overall loss cost level of 4.5%. The filing also includes a 1.7% decrease reflecting the recently enacted workers’ compensation reform legislation.
The filing is hereby approved effective October 1, 2017.
Very truly yours,
Maria T. VulloSuperintendent
By:
Alexander VajdaPrincipal ActuaryProperty [email protected]