VSDP and Workers Compensation Kitty Hughes Workers Compensation Services.

ANALYSIS OF OHl WORKERS' COMPENSATION TRUST
UNPAID LOSS AND ALLOCATED LOSS ADJUSTMENT EXPENSE
AS OF DECEMBER 31, 2009
Prepared for:
Board of Trustees & David !. Harvey, Ph. D., Administrator OHl Workers' Compensation Trust
Prepared by:
Miiliman, Inc.
RECEJVED WORKERS' COMPENSATION
APR 2 8 2010
SELF INSURANCE OFFICE
Milliman

Milliman One Pennsylvania Plaza 38" Floor New York, NY 10119 USA
Tel +1 646 473 3000 • , ^ ^«,« Fax +16464733499
April 9, 2010 milllman.com
Board of Trustees & David I. Harvey, Ph.D. Administrator OHI Workers' Compensation Trust 357 Bay Road, Suite 4 Queensbury, NY 12804
Dear David and Board Members:
Milliman, Inc. has completed Its review of the loss and allocated loss adjustment expense claim liability, including unpaid assessments, of the OHI Workers' Compensation Trust as of December 31, 2009. This report discusses our conclusions, the data used in our analysis, the details of our analysis and the limitations on our results.
We appreciate the opportunity to be of continued assistance to the OHI Workers' Compensation Trust. Please feel free to call us if you have any questions or comments.
Sincerely,
Derek A. Jones, FCAS
k:\216ohi\corr\20IO 04 09 ohiwcl final report.docx
Milliman

TABLE OF CONTENTS
Page
Background and Scope 1
Disclosures 1
Conclusions 3
Data 4
Approach 4
Explanation of Exhibits 5
Excess Insurance 9
Potential Areas of Uncertainty in Our Analysis 9
Limitations 11
Distribution and Use 12
Use of Milliman Name 13
Milliman

a I
Background and Scope
The OHI Workers' Compensation Trust is comprised of employers in the heat, petroleum, gasoUne, plumbing, auto (including auto dealers and repair shops), and home supply and related industries. These businesses service both residential and commercial clientele.
In response to the increasing cost of workers compensation insurance, the OHI Workers' Compensation Trust (OHIWCT) was formed on October 21, 1997. Through OHIWCT, the members self-insure their collective workers compensation costs. OHIWCT retained the services of Cody Management Services, Inc. (CMS) to assist them in their efforts to develop the OHIWCT and to administer the operations of the OHIWCT on an ongoing basis. OHIWCT began self-insurance operations on January 1, 1998 with 16 Founding Members; 3 Charter Members joined subsequent to January 1, 1998. The Trust had 98 active members during 2009. Effective January 1, 2010, OHIWCT decided to begin a voluntary runoff of the trust's self-insurance claim liabilities. It will accept no claims related to accidents subsequent to December 31, 2009.
Milliman was retained by CMS on behalf of OHIWCT to perform an independent analysis of OHIWCT's unpaid loss, allocated loss adjustment expense (ALAE), and assessments as of December 31, 2009. Our analysis was performed based on data evaluated as of December 31, 2009 and other information provided through the date of this report. The purpose of this report is to assist OHIWCT management in its Hnancial reporting responsibilities. This report summarizes our findings.
Disclosures
Intended Measure
We produced an actuarial central estimate, as well as a range of reasonable claim estimates defined by a low estimate and a high estimate. The actuarial central estimate is not a statistically defined estimate (such as mean, median, n' percentile), but is intended to be an estimate that represents an expected value over the range of reasonably possible outcomes. Our low estimate is based on assumptions that we believe to be optimistic but reasonable. Our high estimate is based on assumptions that we believe to be pessimistic but reasonable. We note that these are not intended to represent the lowest or highest possible outcomes.
Page
Milliman

Discount for the Time Value of Money
We evaluated the unpaid loss and ALAE, as well as the unpaid assessments, on both a discounted and undiscounted basis with respect to the time value of money. OHIWCT does not reduce reserves to reflect discounting.
Recoveries
The data underlying our review are net of collected salvage and subrogation recoveries. The resulting unpaid claim estimates are, therefore, implicitly net of future salvage and subrogation recoveries.
The data underlying our review are gross of excess insurance recoveries. We have limited the claim data to reflect OHIWCT's per occurrence retention under its excess insurance program. The resulting unpaid claim estimates are, therefore, implicitly net of future excess insurance recoveries. OHIWCT's carried reserves reflect anticipated excess insurance recoveries.
Methodology
This review is an update to our year-end 2008 report dated April 22, 2009. There have been no other material changes in procedures, methodology or significant assumptions used to produce our estimates.
Loss Adjustment Expenses
The claim data underlying our analysis includes allocated loss adjustment expenses (ALAE), which typically reflects the cost of defense and claim adjusting costs that can be allocated to individual claims. Our analysis does not reflect a provision for unallocated loss adjustment expenses (ULAE), which reflect the costs of third party claim administration.
Qu alifications
This report may be considered a prescribed statement of actuarial opinion under guidelines promulgated by the American Academy of Actuaries. Derek Jones is a member of the American Academy of Actuaries and meets the Qualifications Standards of the American Academy of Actuaries to render the opinion contained herein.
Page 2
Milliman

Conclusions
Estimated Unpaid Claim and Assessment Liabilities as of December 31, 2009
Table 1 summarizes our low, central, and high estimates of the unpaid claim and assessment liabilities as of December 31, 2009 on an undiscounted basis.
Table 1 Estimated Undiscounted Unpaid Claim and Assessment Liabilities
as of December 31, 2009 Net of Excess Insurance
Loss and ALAE Assessments Total Unpaid
Low
$1,862,208 266,220
$2,128,428
Central
$2,805,220 266,220
$3,071,440
High
$3,969,850 266,220
$4,236,070
Table 2 summarizes our low, central, and high estimates of the unpaid claim and assessment liabilities as of December 31, 2009 on a discounted basis. The interest rate (4%) used to discount the unpaid amounts to present value as of December 31, 2009 was provided by CMS. We express no opinion on the reasonableness of the interest rate.
Table 2 Estimated Unpaid Claim and Assessment Liabilities as of December 31, 2009
Net of Excess Insurance Discounted to Present Value at 4%
Loss and ALAE Assessments Total Unpaid
Low
$1,628,025 223,625
$1,851,650
Central
$2,450,406 223,625
$2,674,03 1
High
$3,466,723 223,625
$3,690,348
Estimated Payments during Calendar Years 2010-2014
Table 3 summarizes our estimates of the future calendar year loss payments during 2010- 2014.
Page 3
Milliman

Table 3 Estimated Calendar Year Claim Payments - 2010-2014
Net of Excess Insurance
2010 2011 2012 2013 2014
$674,962 $499,013 $371,082 $297,272 $235,014
Data
Our analysis is based on the following data:
(1) Premium and loss data for fund years 1998 through 2009 at historical December 31 evaluations provided by CMS.
(2) Audited payroll for policy years 1998-2007 by employer and by classification code and initial estimates of total 2008 and 2009 payroll.
(3) State of New York Workers' Compensation Board (WCB) assessment invoices provided by CMS.
(4) Incurred and paid loss development factors for New York from the NYCIRB 2008 Financial Call Data.
(5) Assessment rates and average annual trends in New York wages, claim frequencies and claim severities from the October 1, 2008 NYCIRB loss cost filing.
(6) Excess loss and ALAE factors from the New York Retrospective Rating Plan Manual effective January 1, 2008.
Approach
The scope of our work was to estimate the unpaid claim and assessment liabilities as of December 31, 2009. Total unpaid loss and ALAE was estimated by subtracting cumulative paid losses and ALAE at December 31, 2009 from the estimated ultimate loss and ALAE amounts. In estimating OHIWCT's ultimate loss and ALAE, we reviewed the historical loss, ALAE, claim, and premium data as of December 31, 2009 provided by CMS. Unpaid assessments were estimated in a similar manner.
The methodology that underlies our estimates is discussed below.
Page 4
Milliman

Explanation of Exhibits
Summary
This exhibit summarizes the estimated unpaid claim and assessment liabilities as of December 31, 2009.
This exhibit summarizes the unpaid liabilities separately for loss and ALAE (from Exhibit 1, Sheet 1) versus assessments (from Exhibit 2). The summary shows our estimates on both an undiscounted and discounted basis with respect to the time value of money.
Exhibit 1
This exhibit summarizes the estimated unpaid loss and ALAE discounted to present value as of December 31, 2009.
We reflected the impact of the time value of money by discounting the estimated unpaid loss and ALAE to present value as of December 31, 2009 based on an interest rate of 4%.
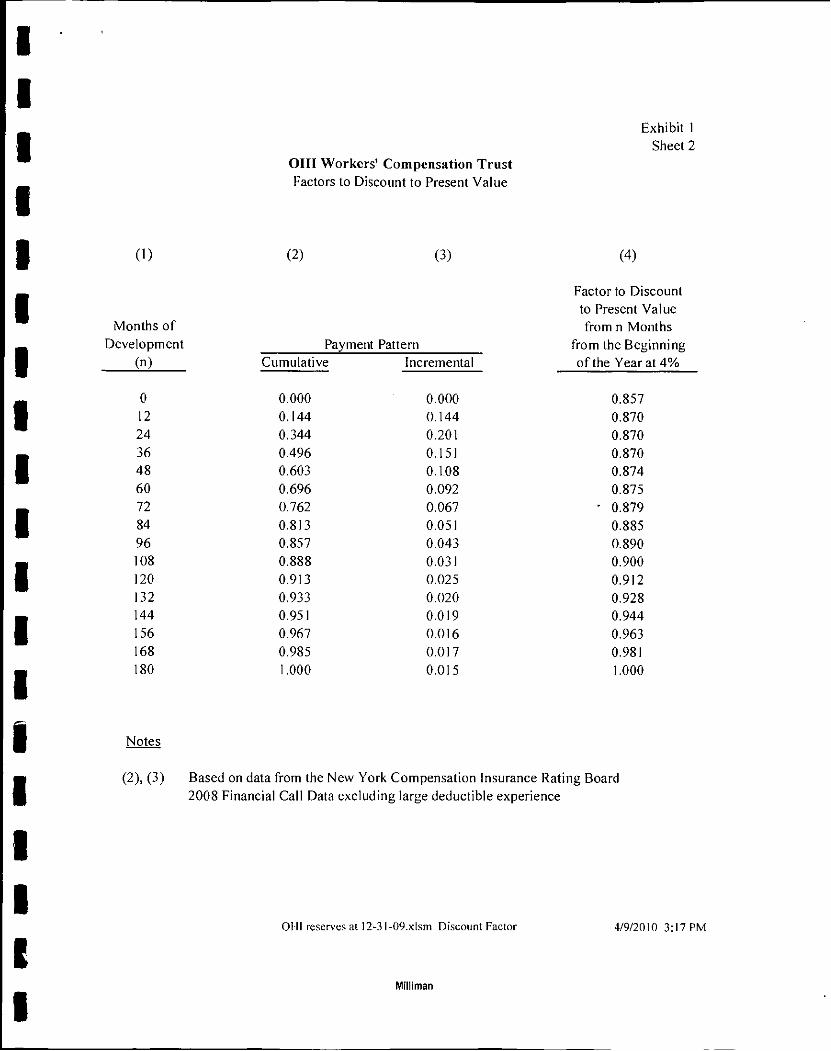
Sheet I shows the application of present value discount factors to the low, central, and high estimates of the undiscounted unpaid loss and ALAE.
Sheet 2 shows the estimated factors to discount unpaid loss and ALAE amounts to present value. The expected payment pattern that underlies these discount factors was based on statewide paid loss development patterns from the NYCIRB with an adjustment to reflect the estimated impact of OHlWCT's excess insurance.
Sheet 3 summarizes our estimates of the claim payments expected to be made during calendar years 2010-2014. Our estimates are based on: a) indications of the future payout of the case reserves as of December 31, 2009, provided by OHlWCT's accountant based on a review with the trust's claim administrator, and b) our estimated payout of the total unpaid loss as of December 3 1, 2009 using the payment pattern in Sheet 2.
Exhibit 2
This exhibit summarizes our estimated unpaid assessments as of 12/31/09.
To estimate OHlWCT's unpaid assessment for each fund, we applied the assessment rates from the most recent invoices from the WCB to the estimated 2009 pure premium.
Page 5
Milliman

Exhibit 3, Sheet 1
This exhibit summarizes our range of estimates of ultimate loss and ALAE, the resulting estimated unpaid amounts as of 12/31/09, and ultimate loss and ALAE ratios.
Column (2) summarizes the loss and ALAE paid as of December 31, 2009. This is subtracted from the estimated uhimate loss and ALAE amounts in columns (3) - (5) to produce our range of unpaid estimates in columns (6) - (8).
Columns (3) - (5) show our low, central, and high estimates of the uhimate loss and ALAE. The central estimate shown in column (4) is from Sheet 2 of this exhibit. Columns (3) and (5) are selected judgmentally based on optimistic and pessimistic assumptions that we believe to be reasonable.
Columns (10) - (12) show the low, central, and high estimates of the ultimate loss and ALAE ratio implied by our estimated ultimate loss and ALAE amounts in columns (3) - (5).
Exhibit 3, Sheet 2
This exhibit breaks down our selected ultimate loss into its paid and unpaid components, together with the average outstanding claim size implied by our unpaid loss estimates.
Exhibit 3, Sheets
This exhibit simvnarizes our ultimate loss indications with (he resulting selected ultimate and the implied ultimate loss ratios and ultimate claim severities.
Columns (2) - (4) summarize the ultimate loss and ALAE indications from our Bornhuetter-Ferguson (BF) and Cape Cod projection techniques from Sheets 4-6.
Column (5) shows our selection ultimate loss and ALAE based on the indications from columns (2) - (4). For the oldest accident years, we selected the case incurred losses because no additional development is expected.
Columns (8) and (9) show the ultimate loss ratios and claim severities implied by our selected ultimate loss and ALAE.
Page 6
Milliman

Exhibit 3, Sheet 4
This exhibit shows the Bornhuetter-Ferguson projection method used to estimate ultimate loss and ALAEfor accident years 2007-2009.
The Bomhuetter-Ferguson (BF) method is a common actuarial approach that estimates unpaid or unreported loss and ALAE based on an a priori expected loss estimate and the expected percentage of ultimate loss and ALAE that is currently unpaid or unreported. This is a generally accepted actuarial approach for estimating ultimate losses when loss experience is immature or volume is low; both of these issues affect OHIWCT. Additional details about this method are available upon request.
The expected ultimate loss is based on the product of an estimate of the ultimate number of reported claims (from Exhibit 5) and an expected ultimate average claim severity. The expected severity is based on OHIWCT's historical claim severities and statewide industry information from the NYCIRB, adjusted for trend. In projecting the ultimate loss and ALAE for 2007-2009, we also adjusted for the expected impact of legislative reform in New York based on information from the NYCIRB.
Exhibit 3, Sheets 5 and 6
777/5 exhibit shows the ''Cape Cod" methodology used to produce indications of ultimate loss and ALAE.
The Cape Cod method is a modified version of the BF method that relies on OHIWCT's own experience to determine the expected loss estimate. Additional details about this method are available upon request.
On Sheet 5, the expected uhimate loss is based on the product of earned premium and an expected loss ratio. On Sheet 6, the expected ultimate loss Is based on the product of an estimate of the ultimate number of reported claims and an expected ultimate average claim severity.
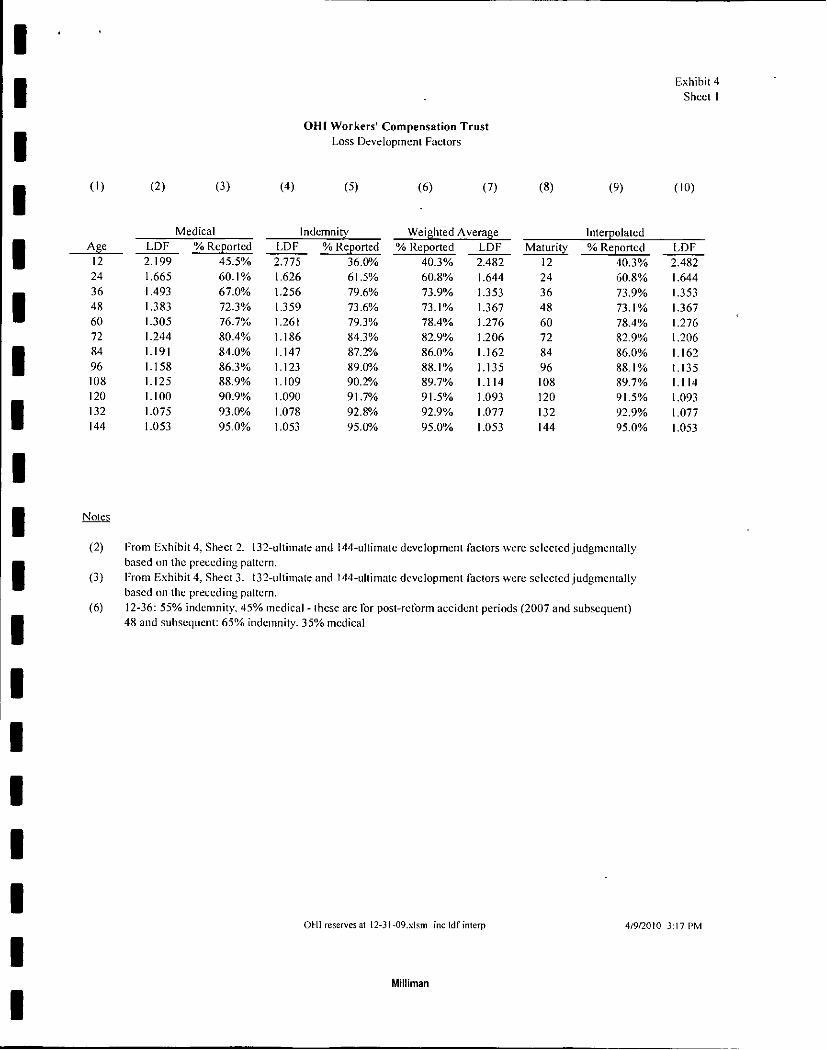
Exhibit 4
This exhibit shows the source oflhe loss development factors used in Exhibit 3.
The incurred loss and ALAE development pattern used in this analysis is based on data from the NYCIRB 2008 financial data call. The industry data excludes ALAE, but the omission of this data should have only a minor effect on the incurred loss development pattern.
Page 7
Milliman
Sheet 2 of this exhibit shows the percent change in the valuation of incurred medical losses from one calendar year to the next. For example, accident year 2001 incurred medical losses valued as of December 31, 2002 (24 months) are 39.4% larger than accident year 2001 incurred medical losses valued as of December 31, 2001 (12 months). The loss development factor is, therefore, expressed as 1.394. By looking at the loss development factors within a column, one can see several historical loss development factors that represent similar aging of the claims as they mature. Sheet 3 shows the development pattern for indemnity losses.
In each column, there are five historical factors shown. The two-year average factor and the five-year average factor are also shown. For both medical and indemnity, we selected the average of the latest five years. The cumulative products of the selected factors beginning with the tail factor at 120 months become the selected loss development factors to an ultimate loss level. We adjusted the tail factor at 120 months to reflect OHIWCT's self-insured retention. Also, we adjusted the 12-to-ultimate, 24-to-uhimate, and 36-ultimate factors for indemnity loss to reflect the expected impact of the recent workers compensation reform.
On Sheet 1 of Exhibit 4, we calculate the weighted average of the two development patterns to determine a development pattern for medical and indemnity loss combined. For 2006 and prior, which are not affected by the recent legislative reform, we used weights of 65% for indemnity and 35% for medical. For 2007-2009, which are expected to be impacted by the duration caps on indemnity losses, we used weights of 55%) for indemnity and 45% for medical. These loss development factors are used in Exhibit 3 for the calculation of the Cape Cod ultimate losses.
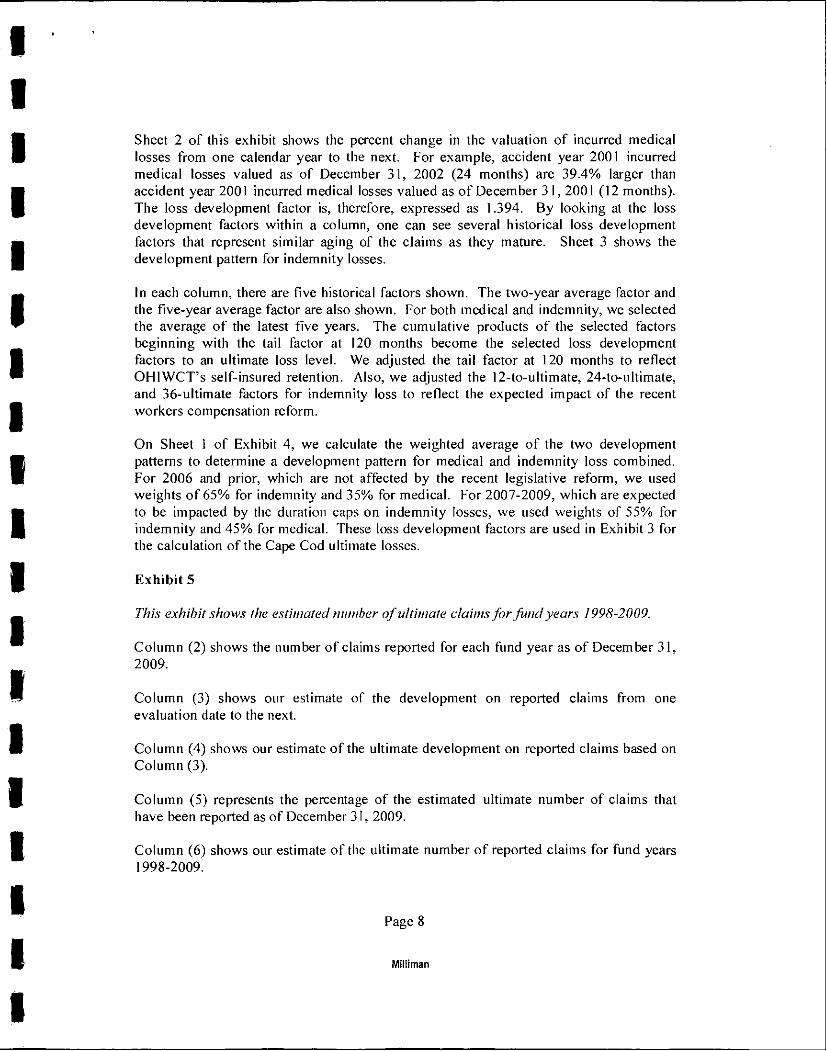
Exhibit 5
This exhibit shows (he estimated number of idtimate claims for fund years J 998-2009.
Column (2) shows the number of claims reported for each fund year as of December 31, 2009.
Column (3) shows our estimate of the development on reported claims from one evaluation date to the next.
Column (4) shows our estimate of the ultimate development on reported claims based on Column (3).
Column (5) represents the percentage of the estimated ultimate number of claims that have been reported as of December 31, 2009.
Column (6) shows our estimate of the ultimate number of reported claims for fund years 1998-2009.
Pages
Mtliiman

Column (7) shows the number of closed claims for each fund year as of December 31, 2009.
Column (8) shows our estimate of the number of outstanding claims implied by columns (6) and (7) for fund years 1998-2009.
Exhibit 6
This exhibit provides a summary of the paid and incurred loss and ALAE through December 31, 2009 both gross and net of excess insurance.
Excess Insurance
OHIWCT has historically purchased excess of loss insurance to protect itself from catastrophic claims. OHIWCT's per occurrence retention has increased over time, as shown in Table 4.
Table 4 Summary of Excess Insurance Program
Per Occurrence Fund Year Retention
1998 $250,000 1999 250,000 2000 200,000 2001 250,000
2002-2004 350,000 2005-2009 400,000
Our estimate of the unpaid loss and ALAE net of excess insurance assumes that all excess insurance is valid and collectible. We have not anticipated any contingent liabilities that could arise if the excess insurers do not meet their obligations to OHIWCT as reflected in the data and other information provided to us.
Potential Areas of Uncertainty in Our Analysis
There are several assumptions underlying our work that have potential to either overestimate or underestimate the unpaid claim liabilities as of December 31, 2009.
Page 9
Milliman

1. Incurred Loss Development Factor from 120 Months
Exhibit 4 shows the industry loss experience in the development of incurred losses from 120 months to their ultimate reported values. Over the most recently available six years, this factor has ranged from 1.068 to 1.216 for indemnity and from 1.282 to 1.308 for medical. When insurers report loss data to the NYCIRB, they are permitted to report losses on a discounted basis to reflect the time value of money for lifetime annuity claims such as permanent total cases or fatal cases involving weekly benefits to widows and children. As these cases move from the reserve status to the payment status, the amount of discount that underlies the case reserves is unwound, which creates artificially higher loss development factors.
The impact of this overstatement is expected to be minimal, however, since permanent total claims represent a small portion (less than 5% in New York) of the total ultimate losses. Further, many insurers report the undiscounted case reserve, rather than the discounted value, amounts on these claims.
2. Incurred Loss Development Factors in General
As stated above, the selected incurred loss development factors are based on NYCIRB data. Since the loss data underlying these development factors are prior to the limiting effect of excess of loss insurance, it includes the development of losses above OHlWCT's expected per occurrence retention of $400,000. Loss development factors from incurred loss data which had individual claim amounts capped at $400,000 per occurrence would be lower, albeit by a relatively small amount. We adjusted the industry tail for the $400,000 per occurrence limit.
Due to the relative lack of relevant historical experience for OHiWCT, we utilized incurred loss and ALAE development patterns based on statewide New York data representing a broad spectrum of employment activity. This pattern may or may not be representative of the expected incurred loss and ALAE development of the OHIWCT.
3. Impact of 2007 Workers Compensation Legislative Reform
In producing our estimates of the unpaid claim and assessment liabilities, it was necessary to reflect the impact of recent legislative reform of the New York workers compensation system. The main components of this reform were:
a) A cap has been placed on the duration of payments made for permanent partial claims occurring on or after March 13, 2007; this could decrease the future losses for OHIWCT.
b) The maximum weekly benefit has been increased from $400 to $500 for claims occurring on or after July 1, 2007, to $550 for claims occurring on or
Page 10
MJIliman

after July I, 2008, and to $600 for claims occurring on or after July I, 2009. This will increase the future loss for OHIWCT.
c) The second injury fund will no longer be available as a reimbursement mechanism for claims that occur on or after July 1, 2007. This could increase the OHIWCT payments.
We relied on the statewide average impact estimated by the NYCIRB in adjusting historical loss estimates to the 2007 fund year level, but it is premature to estimate whether the reform's impact on OHIWCT will be different from the NYCIRB's estimates for New York State overall.
4. Annual Wage Trend
The annual wage trend is based on changes in the aggregate level of statewide New York wages. This annual wage trend may or may not be representative of the expected annual wage trend of the OHIWCT.
5. Annual Loss Trend
The annual loss trend is based on the NYCIRB rate filing, which is based on statewide data for all class codes combined. This annual loss trend may or may not be representative of the expected annual loss cost trend of the OHIWCT.
Limitations
Data
In performing this analysis we have relied on data and other information provided to us by CMS. We have not audited or verified this data and other information. Such a review is beyond the scope of our assignment. If the underlying data or information is inaccurate or incomplete, the results of our analysis may likewise be inaccurate or incomplete.
We performed a limited review of the data used directly in our analysis for reasonableness and consistency and have not found material defects in the data. If there are material defects in the data, it is possible that they would be uncovered by a detailed, systematic review and comparison of the data to search for values that are questionable or relationships that are materially inconsistent. Such a review is beyond the scope of our assignment.
Uncertainty
The estimates contained in our report refiect our best professional judgment, based on our actuarial analysis of the available data. Our results refiect assumptions regarding loss
Page 11
Milliman
I

development, loss trend and wage trend. All unpaid claim estimates inherently contain uncertainty. Actual future payments may differ materially, and in either direction, from our estimate. This is particularly true for small insurance programs where actual results tend to vary considerably from year to year.
The causes of this inherent variability are numerous, and can include changes in the legal, social, or regulatory environment surrounding the claims process. Uncontrollable factors such as general economic conditions and random statistical variation also contribute to this variability. Factors such as changes in claim reserving or settlement practices, can also affect our estimates. Of course, uncontrollable factors such as general economic conditions and random statistical variation can also influence future claim amounts.
Our findings are based, in part, on assumptions we made with respect to the applicability of using industry data to estimate OHIWCT's loss and ALAE claim liability. To the extent that the risks faced by OHIWCT are different from those underlying the industry sources we used, there is additional uncertainty.
Variability
The sensitivity of key variables in the analysis was considered. Key variables include loss development factor selections, expected loss ratios and expected claim severities. The overall results are potentially sensitive to any of these items, and reasonable alternative selections could change the results either upward or downward.
The current and future financial position of the OHIWCT is the responsibility of OHIWCT and not Milliman.
Distribution and Use
Milliman's work is prepared solely for the internal use of OHIWCT. No portion of Milliman's work may be provided to any other party without Milliman's prior written consent. If Milliman does consent, additional work may be required at additional expense. Milliman does not intend to benefit or create a legal duty to any third party recipient of its work. Milliman's work may not be filed with the SEC or other securities regulatory bodies. In addition, references to Milliman or its estimates in securities filings, analyst meetings and press releases are not authorized.
Milliman's consent to release its work product to any third party may be conditioned on the third party signing a Third Party Release Agreement, subject to the following exceptions:
(a) OHIWCT may provide a copy of Milliman's work to the trust's administrator, Cody Management Services, Inc.
Page 12
Milliman

(b) OHIWCT may provide a copy of Milliman's work to its accountant, Fuller & LaFiura, to be used solely for accounting purposes.
(c) OHIWCT may provide a copy of Miliiman's work, in its entirety, to governmental entities, as required by law.
In the event Milliman consents to release its work product, it must be provided in its entirety. We recommend that any such party have its own actuary or other qualified professional review the work product to ensure that the party understands the assumptions and uncertainties inherent in our estimates. No third party recipient of Milliman's work product should rely upon Milliman's work product.
Use of Milliman Name
Milliman does not permit the use of Milliman's name, trademarks or service marks, or any reference to Milliman directly or indirectly in any media release, public announcement or public disclosure, including in any promotional or marketing materials, customer lists, referral lists, websites or business presentations without Milliman's prior written consent for each such use or release, which consent shall be given in Milliman's sole discretion.
RECEIVED WORKERS' COMPENSATION
APR 2 8 2010 Page 13
SELF INSURANCE OFFICE Milliman

Summary
OHI Workers' Compensation Trust Estimated Unpaid Loss, ALAE and Assessments as of December 31, 2009
Undiscounted Low Central High
(1) Estimated Unpaid Loss and ALAE 1,862,208 2,805,220 3,969,850
(2) Estimated Unpaid Assessments 266,220 266,220 266,220
(3) Estimated Total Unpaid = (I)+ (2) 2,128,428 3,071,440 4,236,070
Discounted to Present Value at 4% Low Central High
1,628,025 2,450.406 3,466,723
223,625 223,625 223,625
1,851,650 2,674,031 3.690,348
Notes
(1) (2)
From Exhibit 1, Sheet 1 From Exhibit 2
OHI reserves at 12-31-09.xlsm Summary 4/9/2010 3:17 PM
Milliman

Exhibit Sheet
OHI Workers' Compensation Trust
Estimated Unpaid Loss & ALAE - Discounted to Present Value as of 12/31/09
(2) (3) (4) (3) = (3)x(4)
(6) (7) = (3)x(6)
(8) (9) = (3)x(8)
Maiuritv as
Factor to Discount to
Present Value
Estimated Unpaid Loss & ALAE as of 12/31/09 Low Central High
Fund Discounted Discounted Discounted Year of 12/31/09
144
as of 12/31/09
0.944
Undiscounted
0
at 4% Undiscounted
0
at 4% Undiscounted
0
at 4%
1998 0 0 0 1999 132 0.928 0 0 0 0 0 0 2000 120 0.912 757 69! 757 691 5.757 5.253 2001 108 0.900 95,428 85.899 102.928 92,650 125.049 112.562 2002 96 0.890 21.432 19.084 30.612 27.258 45.911 40.882 2003 84 0.885 0 0 0 0 0 0 2004 72 0,879 269.766 237.090 331.572 291,410 405,739 356,593 2005 60 0,875 315,777 276,224 423,220 370,209 555,456 485,882 2006 48 0,874 189.413 165.463 335,489 293.069 518,085 452,577 2007 36 0.870 282398 245.676 504.406 438.815 770,815 670,582 2008 24 0.870 251.817 219.027 466.817 406,03! 724.817 630.435 2009 12 0.870 435,420 378,871 609.420 530,273 818,220 71L955
Total 1.862.208 1.628.025 2.805.220 2.450.406 3,969.850 3.466.723
Notes
(3) Based on Exhibit 1. Sheet 2 (4). (6). (8) From Exhibit 3. Sheet 1
OH! reserves at 12-31-09.xlsm PV reserves 4/9/2010 3:17 PM
liman
OHI Workers' Compensation Trust Factors to Discount to Present Value
Exhibit 1 Sheet 2
(1) (2) (3) (4)
Factor to Discount to Present Value
Months of from n Months Development Paym snt Pattern from the Beginning
(n) Cumulative
0.000
Incremental
0.000
ofthe Yearat4%
0 0.857 12 0.144 0.144 0.870 24 0.344 0.201 0.870 36 0.496 0.151 0.870 48 0.603 0.1.08 0.874 60 0.696 0.092 0.875 72 0.762 0.067 - 0.879 84 0.813 0.051 0.885 96 0.857 0.043 0.890 108 0.888 0.031 0.900 120 0.913 0.025 0.912 132 0.933 0.020 0.928 144 0.951 0.019 0.944 156 0.967 0.016 0.963 168 0.985 0.017 0.981 180 1.000 0.015 1.000
Notes
(2), (3) Based on data from the New York Compensation Insurance Rating Board 2008 Financial Call Data excluding large deductible experience
OMl reserves at 12-31-09.xlsm Discount Factor 4/9/2010 3:17 PM
Milliman

OHI Workers' Compensation Trust Estimated Payout - 2010 to 2014
Exhibit 1 Sheet 3
(1) (2) (3) (4)
Estimated Loss Payment Calendar Known Total
Year Open Claims
679,907
Unpaid
630,455
Selected
2010 674,962 2011 509,822 488,204 499,013 2012 352,748 377,193 371,082 2013 297,272 297,272 2014 235,014 235,014
Notes
(2) Based on projected payout of case reserves on known, open claims prepared by OHlWCT's accountant and claims administrator
(3) Based on estimated unpaid loss from Exhibit 3 and payment pattern from Exhibit 1, Sheet 2
(4) Selected judgmentally based on columns 2 and 3
K:\216OHI\2009\OHi reserves at 12-31-09.xlsm
Milliman

OHI Workers' Compensation Trust
Estimated Unpaid Assessments as of December 31, 2009
15-8 25A 151
(i) Assessment Base
(2) Assessment Rate
(3) Estimated Assessments
(4) Factor to Discount at 4% to Present Value as of 12/3 !/09
(5) Estimated Unpaid Assessments Discounted to Present Value as of 12/31/09
151-IDP 50-5
,740,000 1,740,000 1,740,000 1,740,000 1,740,000
6.6% 2.4% 2.1% 0.7%
14,840 41,760 36,540 12,180
1.5%
60,900
0.840 0.840 0.840 0.840 0.840
96,466 35,078 30,694 10,231 51,156
Exhibit 2
Total
266,220
223,625
Notes (1) Based on assessment reports to OHIWCT from the State of New York Workers' Compensation Board. The
assessment base is 2009 pure premium, estimated based on discussions with Cody Management. (2) Based on 2009 assessment reports from the State of New York Workers' Compensation Board. (3) [(l)>^{2)] (4) Based on Exhibit I, Sheet 1 (5) =(3)x(4)
K:\216OHI\2009\OHI reserves at 12-31-09.xlsm 4/9/2010 3:!7 PM
Milliman

Exhibit 3 Sheet I
Oni Workers' CompensHlioii I'rusl Estimated Unpaid Loss and ALAE as of December 31, 2009
Limited lo Self-Insured Reicnlion
(1) (2) (3) (4) (5) (6) (3) - (2)
(7) (4) - (2)
(8) (5) - (2)
Paid Loss Estimated Unpaid Loss &, ALAE Fund & ALAE as
of 12/31/09
64,689
Estimated Ultimate Loss & ALAE as of December 3 1. 2009 Year Low Central High Low Central High
1998 64,689 64,689 64,689 0 0 0 1999 79,162 79,162 79,162 79,162 0 0 0 2000 271,037 271,794 271,794 276,794 757 757 5,757 2001 388,977 484,405 491,905 514,026 95.428 102,928 125,049 2002 120,253 141,684 150,864 166,164 21,432 30,612 45,911 2003 199,651 199,651 199,651 199,651 0 0 0 2004 820,770 1,090,536 1,152,342 1,226,509 269.766 331,572 405,739 2005 892,850 1,208,628 1,316,070 1,448,307 315.777 423.220 555,456 2006 561,947 751,360 897,436 1,080,032 189.413 335,489 518,085 2007 638,391 920,789 1,142,797 1,409,206 282.398 504,406 770,815 2008 281,055 532,872 747,872 1,005,872 251,817 466,817 724,817 2009 141,978 577,398 751,398 960,198 435.420 609,420 818,220
Total 4.460,760 6,322,968 7,265,981 8,430,610 1.862.208 2,805.220 3,969,850
(9) (10) (3) -^ (9)
(11) (4) ^ (9)
(12) (5)^(9)
Fund Earned Estimated Ultimate Loss & ALAE Ratio Year Premium
220,347
Low Centra! High
1998 29.4% 29.4% 29.4% 1999 231,045 34.3% 34.3% 34.3% 2000 266,944 101.8% 101,8% 103-7% 2001 442,419 109.5% 111.2% 116.2% 2002 611,995 23.2% 24.7% 27.2% 2003 812,550 24,6% 24.6% 24.6% 2004 1.236,118 88,2% 93.2% 99.2% 2005 1,652,958 73.1% 79.6% 87.6% 2006 1,825,957 41.1% 49-1% 59.1% 2007 2,220,079 41.5% 51.5% 63.5% 2008 2.! 50,000 24,8% 34,8% 46.8% 2009 1,740,000 33.2% 43.2% 55.2%
Total 13,410,412 47.1% 54.2% 62.9%
Notes
(2) Rased on claim list provided by Cody Management (3), (5) Selected judgmentally based on column (4) and actual claim experience to date
(4) From Exhibit 3, Sheet 2 (9) Based on data provided by Cody Manageinent
OHI reserves at l2-31-09.xlsni range 4/9/2010 3:17 PM
Milliman

OHI Workers' Compensation Trust Estimaled Unpaid Loss and ALAE Limited to Self-Insured Retention
Exhibit 3 Sheet 2
(1) (2) (3) (4) (5) (6) (7) (8) (9)
Estimated Paid Loss Inc. Loss Estimaled Total Estimated Estimated Fund Ultimate & ALAE as & ALAE as Case IBNR as Unpaid as Number of 0/S Claim Year Loss & ALAE
64,689
ofl 2/31/09
64.689
ofl 2/3 1/09
64.689
Reserves
0
of 12/31/09
0
of 12/31/09
0
0/S Claims
0
Severity
1998 1999 79.162 79.162 79.162 0 0 0 0 — 2000 271,794 271.037 271.794 757 0 757 1 757 2001 49L905 388.977 484.405 95.428 7.500 102.928 2 51.464 2002 150,864 120.253 140.864 20.612 10.000 30.612 1 30,612 2003 199.651 199.651 199.651 0 0 0 0 — 2004 1,152,342 820.770 1,031.291 210,521 121,051 331,572 5 66,314 2005 1.316.070 892.850 1.102.121 209,271 213,949 423.220 5 84,644 2006 897.436 561.947 639.957 78.010 257.479 335.489 5 . 67,098 2007 1,142,797 638.391 823,218 184.827 319,579 504.406 7 72,058 2008 747,872 281.055 424.757 143.703 323.115 466.817 9 51.869 2009 751,398 141.978 387.995 246,016 363,404 609.420 17 35.848
Total 7,265,981 4,460,760 5,649.904 1,189,144 1,616,077 2,805,220 52
Notes
(2) From Exhibit 3, Sheet 3 (3), (4) Based on Exhibit 6
(5) (4)-(3) (6) (2)-(4)
(7) (5)+ (6) (8) From Exhibit 5 (9) (7)^(8)
Milliman

Exhibit 3 Sheet 3
OHI Workers' Compcnsiilton Trust Estimated Uhimaie Loss and ALAE Limiied to Self-Insured Retention
(1) (2) (3) (4) (5) (6) (7) (8) (5) - (6)
(9) (5) - (7)
Estimated Estimated Ullimale Estimated Estimated
Fund Bornhuclter- Loss Ratio Sever it\' Ultimate Earned Number Ultimate Loss & Ultimate Claim Year Ferpiison Cape Cod
70.783
Cape Cod
72.574
Loss & ALAE
64.689
Premium of Claims
11
ALAE Ratio Severit\'
1998 220.347 29,4% 5,881 1999 91.485 96.282 79.162 231,045 16 34.3% 4,948 2000 286,640 287.297 271,794 266,944 12 101.8% 22.650 2001 517,804 521,553 49L905 442.419 22 111.2% 22,359 2002 191.071 184.291 150.864 611.995 20 24.7% 7,543 2003 271,413 260.946 199.651 812,550 23 24.6% 8,680 2004 1,164,164 1,140,520 1,152.342 1.236,118 33 93.2% 34,919 2005 1,302,882 1,329,258 1,316.070 1,652,958 49 79,6% 26,859 2006 907,746 887,127 897,436 1,825,957 41 49.1% 21,889 2007 1J42,797 1,142.797 2,220,079 56 51.5% 20,407 2008 747.872 747.872 2,150,000 36 34,8% 20.774 2009 751,398 751.398 1,740.000 25 43.2% 30,056
Total 7,265.^ 13,410,412 344
Notes
(2) From Exhibit 3, Sheet 4
(3) From Exhibit 3, Sheet 5
(4) From Exhibit 3. Sheet 6
(3) Selected based on columns (2) - (4)
(6) Daln provided hy Cody Management
(7) From Exhibit 5
Mllliman

Exhibit 3 Sheet 4
Om Workers' Cflni|iens:itiun Triisl hKurred Claim Sevcrit;' Bonihuellci-Ferguson Method
Lijnited 1u Selt-lnsured Retention
(1) a) (3)
Estimated
(4) (2)-(3)
(5) (6) |4)M6|
(8)
|5|'|6)
m (10) (II) (12)
13)"(9)Min
(13) (14) (15) [(12) "(13)]
+ (14)
Estimated Ultimate Expected Estimated Selected Expected Case Estimated Fund Ultimate Number Indic. Ult. Claim Severitv On-Level Trended to AY 2007 Claim Severity Impact of Impact of Ultimate Estimated Inc. Loss Ultimate Year Loss & ALAE
64,689
of Claims
11
OHI Data
5,881
Industry Factor OHI Data
9,636
Industry IPre-Reform) Reform Reform Loss & ALAE Unreported % &ALAE Loss & ALAE
1998 1.639 1999 79,162 16 4,948 1,565 7,744
2000 271,794 12 22,650 12,798 1.554 35,207 19,894 2001 491,905 22 22,359 14,478 1.427 3l,89g 20,655 2002 150,864 20 7,543 16,298 1.288 9,717 20.995 2003 199,651 23 8,680 18,139 1.230 10,677 22,310 2004 1,152,342 33 34,919 20,111 1.174 41,000 23,613 2005 1.316.070 49 26,859 22.675 1.097 29,457 24,869 2006 S97.436 41 21,889 25,257 1.047 22,919 26,446 2007 56 25.000 0,834 0.875 1,225,455 0,261 823,218 1,142,797 2008 36 26.500 0,820 0.865 825.226 0,392 424,757 747,872 2009 25 28,000 0.826 0.869 608,556 0,597 387,995 751,398
Notes
(2) From Exhibit 3, Sheet 3 (3) From Exhibit 5 (5) Based on statewide industiy claim size information from NCCI (6) Reflects scverit\' trend of 5.7% (based on 2009 NYCIRB loss cost filing) and indexing to recognize changes in OHlWCT's self-insured retention. (9) AY 2007: Selected based on columns (7) and |8)
AY 2008, 2009: Trended forward from 2007 at 5.7% {10) Based on analysis of statewide data by NYCIRB in its review of the impact of 2007 workers compensation reform, (II) We judgmentally reduced the impact of the reform by 25%. (13) Based on E,x!iibit 4, Sheet I (14) Based on Exhibit 6
Milliman

Om Workers' Conipi-nsalioii Trust incurred Loss & ALAE Loss Ratio Cape Cod
Limited to Self-Insured Retention
Exhibits Sheet 5
(1) (2) (3) (4) (5) (6) (7) (8) (9) (10) (11) (12)
Premium Portion of at Current Ultimate Developed Expected Rates and Incurred Loss & Incurred Loss & Loss to Loss to Expected Expected Indicated
Fund 2009 Wage Loss Trend SIR Exposure ALAE as of ALAE as of Exposure Exposure Ultimate IBNR Ultimate Year Level Index Index Base 12/31/2009 12/31/2009 Ratio Ratio Loss & ALAE
121,883
Loss & ALAE
6,094
Loss & ALAE
365,018 0.779 0.996 283,295 0-950 64,689 0,430 1998 0.240 70,783 1999 506,592 0.804 0.986 401,697 0.929 79,162 0.212 0,430 172,824 12,322 91,485 2000 517,956 0.830 0.939 403,649 0.915 271.794 0,736 0.430 173,664 14,846 286,640 2001 913,427 0.856 0,968 756,999 0.897 484,405 0-713 0.430 325,687 33,399 517,804 2002 1,094,057 0.883 1.015 980,039 0.881 140.864 0.163 0,430 421,646 50,207 191,071 2003 1,305.426 0.911 1-005 1.195,339 0.860 199.651 0.194 0,430 514,276 71,762 271.413 2004 ♦ 1.933,530 0.940 0.996 1,810,169 0,829 660.220 0.440 0.430 778,797 132,873 1.164,164 2005 2.204,154 0.969 1.009 2,156,056 0,784 1.102.121 0.652 0,430 927.610 200.761 1.302.882 2006 2,316,250 1.000 1.000 2.316,250 0.731 639,957 0.378 0.430 996.530 267.789 907.746
1,! 56,410 10,303,492 3,642,864 4,432,916 790,052 4,803,987
* Fund Year 2004 excludes the Robert Harvey claim in (7): incurred loss limited to SIR and incurred ALAE for this claim added back in (12) (2) Premium at current rates trended to 2009 wage level at an annual wage trend of 2,9% (3) Reflects 5.7% severity trend and -2.4% frequency trend based on data from NYCIRB (4) Estimated based on historical self-insurance retentions (SlRs) and excess loss pure premium factors effective January 1,2008 (5) =(2)M3)^(4) (6) From E,\hibit 4, Sheet 1 (7) Based on claim list provided by Claim Services (8) =(7)-i(5)x{6)]
Values which are boxed are used to calculate the values in (9), (9) Weighted average of (8) with weights equal to (5) ^ (6) ^ LO^LAG where LAG = absolute value of difference in years,
9 years included in Column (9) calculation. (10) =(5)M9) (11) =(IO)MI.O-(6)] (12) =(7)+(ll)
Milliman

OHI Workers' Cunipcnsulion Trust Incurred Loss & ALAE Severity Cape Cod
Limited tu Self-Insured Retention
Exhibit 3 Sheet 6
(1) (2) (3) (4) (5) (6) (7) (8) (9) (10) (II) (12)
Portion of Ultimate Ultimate Developed Expected
Number of Incurred Loss & Incurred Loss & Loss to Loss lo Expected Expected Indicated Fund Reported Severit)' SIR Exposure ALAE as of ALAE as of Exposure Exposure Ultimate IBNR Ulliiuate Year Claims
11
Index Index Base 12/31/2009 12/31/2009 Ratio Ralio Loss & ALAE
157,698
Loss & ALAE
7,885
Loss & ALAE
0.642 0.996 7 0,950 64.689 22,434 1998 9,687 72,574 1999 16 0.678 0.986 11 0.929 79,162 7,964 22,434 240,114 17,120 96,282 2000 12 0.717 0.939 8 0.915 271.794 36,767 22,434 18L343 15,503 287,297 2001 22 0.758 0.96S 16 0.897 484,405 33,428 22,434 362,245 37,148 521,553 2002 20 0.801 1.015 16 0.881 140.864 9,836 22,434 , 364,705 43,426 184,291 2003 23 0.847 1,005 20 0,860 199.651 11.850 22.434 439,264 61.295 260,946 2004 * 32 0.895 0.996 29 0.829 660.220 27,894 22,434 640,217 109,229 1,140.520 2005 49 0,946 1,009 47 0.784 1.102.121 30,067 22.434 1.049,478 227,137 1.329,258 2006 41 1.000 1.000 4] 0.731 639.957 21.344 22,434 919,799 247,169 887,127
Total 226 194 3.642.864 4,354,862 765,912 4,779,847
Notes
* Fund Year 2004 excludes the Robert Harvey claim in (7); Incurred loss limited to SIR and incurred ALAE for this claim added back in (12) (2) From Exhibit 5 (3) Reflects 5.7% severity trend based on data from NYCIRB (4) Estimated based on historical self-insurance retentions (SIRs) and excess loss pure premium factors effective January' 1, 2008 (5) =(2)-<(3)-<(4) (6) From Exhibit 4, Sheet 1 (7) Based on claim list provided by Claim Services (8) =(7)^[(5)M6)]
Values which are boxed are used to calculate the values in (9). (9) Weighted average of (8) with weights equal !o (2) x (6) ^ l.C^LAG where LAG = absolute value of difference in years.
9 years included in Column (9) calculation (10) =(5)^(9) (11) -(I0)MI.0-(6)] (12) =(7) + (ll)
OHI lesenesal l2-3l-09.xlsni liicSevCC 4/9/2010 3:17 PM
Miiilman
OHI Workers' Compensation Trust Loss Developmenl Factors
Exhibit 4 Sheet I
(1) (2) (3) (4) (5) (6) (7) (8) (9) (10)
Medical Indemnity Weighted Average Interpolated Age LDF % Reported LDF % Reported % Reported LDF Maturity % Reported LDF
12 2.199 45.5% 2.775 36.0% 40.3% 2.482 12 40.3% 2.482 24 1.665 60.1% 1.626 61.5% 60.8% 1.644 24 60.8% i.644 36 1.493 67.0% 1.256 79.6% 73.9% 1.353 36 73.9% 1.353 48 1.383 72.3% 1.359 73.6% 73.1% 1.367 48 73.1 % 1.367 60 1.305 76.7% 1.261 79.3% 78.4% 1.276 60 78.4% 1.276 72 1.244 80.4% 1.186 84.3% 82.9% 1.206 72 82.9% 1.206 84 1.191 84.0% 1.147 87.2% 86.0% i.162 84 86.0% 1.162 96 1.158 86.3% 1.123 89.0% 88.1% 1.135 96 88.1 % 1.135 108 1.125 88.9% 1.109 90.2% 89.7% 1.114 108 89.7% 1.114 120 1.100 90.9% 1.090 91.7% 91.5% 1.093 120 91.5% 1.093 132 1.075 93.0% 1.078 92.8% 92.9% 1.077 132 92.9% 1.077 144 1.053 95.0% 1.053 95.0% 95.0% 1.053 144 95.0% 1.053
Notes
(2) From Exhibit 4, Sheet 2. 132-uiliniate and 144-ultimate development factors were selected Judgmentally based on the preceding pattern.
{3} From Exhibit 4, Sheet 3. 132-ultiniate and 144-ultimate development factors were selected judgmentally based on the preceding pattern.
(6) 12-36: 55% indemnity, 45% medical - these arc lor post-reform accident periods (2007 and subsequent) 48 and subsequenl: 65% indemnity. 35% medical
OH) reserves at l2-3l-09.\lsm incldfinlerp 4/9/2010 3:17 PM
Milliman

Iixhibil 4 Sheet 2
Notes
OHl Workers' Compensation Trust Case Incurred Loss Development*
Medical
Accident Evaluation Months Year 24:12 36:24 48:36 60:48 72:60 84:72 96:84 108:96 120:108 ULT:I20 1992 1.282 1993 1.023 1.308 1994 I.OIO 1.019 1.301 1995 1.019 1.017 1.031 1.306 1996 1.040 1.021 1.056 1.029 1.296 1997 1.035 1.022 1.037 1.026 1.018 1.290 1998 1.036 1.033 1.045 1.021 1.020 1.017 1999 1.083 1,061 1.071 1.068 1.036 1.028 2000 1.150 1.066 1.047 1.051 1.040 1.025 2001 1.394 I.II8 1.107 1.092 1.031 1.048 2002 1.328 1.096 1.048 1.033 1.059 2003 1.305 1.091 1.073 1.067 2004 1.202 1.161 1.104 2005 1.382 I.IIO 2006 1.386
24:12 36:24 48:36 60:48 72:60 84:72 96:84 ! 08:96 120:108 ULT:!20
2 year avg. 1.384 1.136 1.089 1.050 1.045 1.044 1.031 1.024 1.018 1.293 5 year avg. 1.321 I.1I5 1.080 1.060 1.049 1.045 1.028 1.029 1.023 1.300
Selected 1.321 1.115 1.080 1.060 1.049 1.045 1.028 1.029 1.023 1.100
Factor to Ultimate 2.199 1.665 1.493 1.383 1.305 1.244 1.191 1.158 1.125 1.100
* Statewide industry loss development from the New York Compensation Insurance Rating Board.
OHl reserves at 12-3l-09.\lsm inc industry loss 4/9/2010 3:17 PM
Milliman

[■xhibit 4 Sheet 3
Notes
0111 Workers' Compcnsalion Trust Case Incurred Loss Development*
Indemnity
Aecident Evaluation Months Year 24:12 36:24 48:36 60:48 72:60 84:72 96:84 108:96 120:108 ULT:120 1992 1.194 1993 1.019 1.179 1994 1.014 1.001 1.216 1995 1.026 0.999 1.018 1.200 1996 1.047 1.011 1.018 1.025 1.187 1997 1.050 1.015 1.033 1.018 1.017 1.068 1998 1.084 1.061 1.040 1.025 1.016 1.024 1999 1.170 1.081 1.062 1.036 1.007 1.015 2000 1.450 1.136 1.076 1.050 1.024 1.032 2001 1.739 1.300 1.202 1.097 1.084 1.054 2002 1.735 1.256 1.117 1.039 1.060 2003 1.694 1.289 1.099 1.095 2004 1.665 1.299 1.158 2005 1.769 1.329 2006 1.669
24:12 36:24 48:36 60:48 72:60 84:72 96:84 108:96 120:108 ULT:120
2 year avg. 1.719 1.314 1.129 1.067 1.072 1.039 1.020 1.016 1.021 1.127 5 year avg. 1.706 1.295 1.142 1.078 1.063 1.034 1.022 1.013 1.017 1.170
Scleeied 1.706 1.295 0.924 1.078 1.063 1.034 1.022 1.013 1.017 1.090
Faetor to Ultimate 2.775 1.626 1.256 1.359 1.261 1.186 1.147 1.123 1.109 1.090
* Statewide industry loss development from the New York Compensation Insuranee Rating Board, Note: the 36-48 loss development faetor has been adjusted to retleet the expected impact of the 2007 refonn
0111 reserves at 12-31 -09.xlsm ine industr>' loss 4/9/2010 3:17 PM
Milliman

Exhibit 5
OHI Workers' Compensation Trust Reported Claims Development Method
(1) (2) (3) (4) (5) (6) (7) (8)
Reported Cumulative Portion of Selected Number of Estimated Claims Age to Age Claim Ultimate Number of Closed Number of
Fund as 0 f Development Development Reported Reported Claims as Outstanding Year 12/31/2009
11
Factor Factor Claims Claims
1!
of 12/31/09
11
Claims
1998 1.000 1.000 1.000 0 1999 16 1.000 1.000 1.000 16 16 0 2000 12 1.000 1.000 1.000 12 11 1 2001 22 1.000 1.000 1.000 22 20 2 2002 20 1.000 1.000 1.000 20 19 1 2003 23 1.000 1.000 1.000 23 23 0 2004 33 1.000 1.000 1.000 33 28 5 2005 49 1.000 1.000 1.000 49 44 5 2006 41 1.000 1.000 1.000 41 36 5 2007 56 1.000 1.000 1.000 56 49 7 2008 36 1.000 1.000 1.000 36 27 9 2009 23 1.070 1.070 0.935 25 8 17
Total 342 344 292 52
Notes
(2), (7) Based on claim list provided by Claim Services, Inc. (3) Selected based on historical data (4) Cumulative of (3) (5) -1.0 ^{4) (6) = (2) X (4) (8) = (6) - (7)
RECEIVED WORKERS' COMPENSATION
APR 2 8 2010
SELF INSURANCE OFFICE
OIM reserves at l2-31-09.xlsm reported claims dev 4/9/2010 3:17 PM
Milliman

Exhibit 6
(1)
OHI Workers' Compensation Trust Data Summary
(2) (3) (4) (5) (6) (7) (8)
Paid Paid Incurred Incurred Limited Limited Loss ALAE Loss ALAE Paid Loss Incurred Loss
Fund as of as of as of as of as of as of Year 12/31/2009
62,403 12/31/2009
2,286 12/31/2009
62,403 12/31/2009
2,286 SIR 12/31/2009
62.403 12/31/2009
1998 250.000 62,403 1999 76,849 2,313 76,849 2,313 250,000 76,849 76,849 2000 274,747 11,482 337,431 14,154 200,000 259,555 257,640 2001 350,672 38,305 446,412 39,983 250,000 350,672 444,422 2002 111,323 8,930 130,750 10,114 350,000 111,323 130,750 2003 190,077 9,574 190,077 9,574 350,000 190,077 190,077 2004 811,091 71,480 1,013,517 79,574 350,000 749,290 951,717 2005 836.538 56,312 1,040,475 61,646 400,000 836,538 1,040,475 2006 528,058 33,889 598,238 41,719 400,000 528,058 598,238 2007 605,293 33,098 781,632 41,585 400,000 605.293 781,632 2008 271,356 9.698 403,424 21,333 400,000 271,356 403,424 2009 137,826 4,152 360,325 27,669 400,000 137,826 360,325
Total 4,256,233 281,520 5,441,534 351,952 4,1 79,24 1 5,297,953
Notes
(2)-(5) Based on claim ist provided by Cliiim Services. Inc. (6) Based on information provided by Cody Management (7) (2) limited by (6) on a per occurrence basis
(8) (4) limited by (6 ) on a per occurrence basis
RECEIVED WORKERS' COMPENSATION
m 2 8 2010
SELF INSURANCE OFFICE
Mllliman