
New Trends in Civil Aviation 2013 - cvut.czuldbeta.fd.cvut.cz/stazeni/NTCA_13.pdfLiquid penetrant...
112
UNIVERSITY OF ŢILINA The Faculty of Operation and Economics of Transport and Communications Air Transport Department & Air Training and Education Center CZECH TECHNICAL UNIVERSITY IN PRAGUE Faculty of Transportation Sciences Department of Air Transport BRNO UNIVERSITY OF TECHNOLOGY Faculty of Mechanical Engineering Institute of Aerospace Engineering New Trends in Civil Aviation 2013 Ţilina 21. - 22. June 2013 Under the patronage of the Rector of University Žilina Dr.h.c. Professor Tatiana Čorejová and under support of CEDESA Project (EU 7th Framework Programme)
Transcript of New Trends in Civil Aviation 2013 - cvut.czuldbeta.fd.cvut.cz/stazeni/NTCA_13.pdfLiquid penetrant...
UNIVERSITY OF ŢILINA
The Faculty of Operation and Economics of Transport and Communications
Air Transport Department & Air Training and Education Center
CZECH TECHNICAL UNIVERSITY IN PRAGUE
Faculty of Transportation Sciences
Department of Air Transport
BRNO UNIVERSITY OF TECHNOLOGY
Faculty of Mechanical Engineering
Institute of Aerospace Engineering
New Trends in Civil Aviation 2013
Ţilina
21. - 22. June 2013
Under the patronage of the Rector of University Žilina Dr.h.c. Professor Tatiana Čorejová
and
under support of CEDESA Project (EU 7th Framework Programme)
Conference Chair
Prof. Antonín Kazda
Assoc. prof. Jaroslav Juračka
Scientific and Program Committee
Chair:
Assoc. prof. Jaroslav Juračka (CZE)
Comittee:
Dr. Trevor Young (IRL)
Dr. Ladislav Smrcek (GBR)
Dr. József Rohács (HUN)
Prof. Zdobysław Goraj (POL)
Prof. Jonas Stankunas (LTU)
Prof. Yakov Karpov (UKR)
Prof. Antonín Kazda (CZE)
Dr. Vladimír Němec (CZE)
Assoc. prof. Daniel Hanus (CZE)
Assoc. prof. Vladimír Daněk (CZE)
Dr. Miroslav Šplíchal (CZE)
Dr. Jiří Chlebek (CZE)
Prof. Andrej Novák (SVK)
Assoc. prof. Martin Bugaj (SVK)
Assoc. prof. Ján Bálint (SVK)
All papers in these proceedings were subject to peer reviewer.
Organizing Committee
Dr. Peter Blaško
Dr. František Jůn
Dr. Roman Topolčány
Ing. Lukáš Palko
Juliana Blašková
© The Faculty of Operation and Economics of Transport and Communications,
Air Transport Department & Air Training and Education Center, 2013
ISBN 978-80-7204-843-4
NEW TRENDS IN CIVIL AVIATION 2013
FOREWORD
Professionals from the air transport industry and airspace meet every year to present their ideas on the ‗New trends‘
conference. When I looked back to the old proceedings from the former years I found that we did not defined what
the ‗New trends‘ are. Is a new trend the most recent decision of the European Parliament to cut down budget for the next Transport
Framework Programme – Horizon 2020 by 20%? Well nothing new for us. The budget cuts are very popular in all European
countries nowadays especially in the ‗useless‘ sectors like education, research and health services.
To give a floor to ‗young professionals‘ is also nothing new and the ‗young professionals‘ of the 1999, when this
conference took-off for the first time, become quite experienced.
What is new and quite different, comparing to former years, is the growing interest from the industry to participate in the
conference. New is also involvement of private sector in research and development. This new trend – supported by the infrastructural
EU funds projects, can partially replace insufficient financing on the state level. The new is also increased co-operation between the
academia and the industry resulting in shortening time between research, development and implementation of the research results.
However, these new trends should be further supported and enhanced from both sides – industry and academia.
Are there any threats to those tendencies? Well, both our nations, but more the Czechs than Slovaks are typical for constant
moaning, complaining, making it difficult to adversity. Certainly we are not able to compare our conditions for research with those in
Austria, Germany, France but even with the Czech republic. Nothing less we should consider the crisis more as opportunity and
challenge then handicap. More difficult conditions have always been the basis of natural selection in which they survive better. I have
no doubts that we will the winners.
Prof. Antonín Kazda
Head of Air Transport Department
University of Ţilina
4
TABLE OF CONTENTS
Bugaj M.
NON-DESTRUCTIVE TESTING IN AIRCRAFT MAINTENANCE .................................................................................................6
Daniel M.,Mihalides D.
PROPELLER DESIGN FOR ELECTRIC POWEREDLIGHT AIRCRAFTS ....................................................................................9
Dofek I.
THE SOFTWARE ENVIRONMENT FOR OPTIMIZATION AND ANALYSIS OF PROPELLERS ...................................... 12
Dvořák P., Pejchar J., Zikmund P.
OVERVIEW OF UNMANNED AERIAL SYSTEMS DEVELOPED AT THE INSTITUTE OF AEROSPACE
ENGINEERING .................................................................................................................................................................................. 16
Hradil J., Navrátil J.
FREE-FORM DEFORMATION PARAMETERIZATION FOR AERODYNAMIC SHAPE OPTIMIZATION ..................... 22
Hromádka M.
HUMAN FACTOR AND ITS ROLE WITHIN GROUND HANDLING SAFETY ISSUES ........................................................ 28
Chlebek J.
HUMAN FACTORS IN ACCIDENTS OF THE SMALL AIRCRAFT CATEGORY ................................................................. 33
Kaddour M.
USING CATALYST FOR REDUCING EMISSION IN AVIATION ............................................................................................. 37
Kandera B., Turiak M.
UTILIZATION OF THE PCAS (PORTABLE COLLISION AVOIDANCE SYSTEM) IN THE SLOVAK AIRSPACE ........ 41
Kraus J., Jeřábek K.
THE POSSIBILITY OF EVALUATING THE LEVEL OF APPROACH SAFETY GIVEN BY THE REGULATIONS ........ 44
Krollová S.
AIRCRAFT ICING CONDITIONS ................................................................................................................................................... 48
Letanovská M., Hromádka M.
COSTS CALLCULATION OF AIRSIDE OPERATIONAL ERRORS AND THEIR COSEQUENCES ................................... 52
Makkay I.
BEYOND VISUAL LINE OF SIGHT – FPV FLIGHT ................................................................................................................... 58

5
Mališ M.,.Urík T.
COMPARISON OF THREE TYPES OF IMPERFECTIONS APPLIED DURING BUCKLING ANALYSIS OF
CYLINDRICAL SHELL UNDER COMPRESSIVE LOAD ........................................................................................................... 63
Matuška Ľ.
APPLICATION OF GRADUATES OF UNIVERSITY OF ŢILINA,AIR TRANSPORT DEPARTMENT IN AIRLINE
TRAVEL SERVICE ............................................................................................................................................................................ 68
Moučka J.
FLIGHT OPTIMIZATION IS A NECESSITY ................................................................................................................................ 70
Pallag N., Vermes A.
THE CFD ANALYSIS OF MAGNETIC LEVITATION TAKE-OFF ........................................................................................... 73
Pitor J.
FLIGHT CHECKING OF GNSS APPROACH PROCEDURES ................................................................................................... 78
Ptáček P.
INTRODUCTION TO SOFTWARE DEVELOPMENT FOR GNSS INFRASTRUCTURE ASSESSMENT ........................... 81
Sabo J., Bálint J
POSSIBILITIES OF USING GNSS IN AIR NAVIGATION .......................................................................................................... 84
Smrž V., Tomášek P.
INFLUENCE OF THE FATIGUE ON THE TWO-MAN FLIGHT CREW PERFORMANCE ................................................. 87
Symonov V., Katrňák T.
FEM APPROACH TO ESTIMATE LARGE DEFORMATIONS OF STIFFENED FUSELAGE STRUCTURE .................... 90
Škultéty F.
A VISION OF THE FUTURE AEROSPACE .................................................................................................................................. 93
Šplíchal M., Hammer J.
SAFETY ASPECT OF ELECTRIC POWERED AIRPLANE ....................................................................................................... 96
Veselý P.
RNAV PROCEDURES COMPUTER VALIDATION .................................................................................................................. 102
Vondrášková V., Veselý J.
AVIATIONEXAMTEST PREP SOLUTIONS ............................................................................................................................... 105
Nieruch K.
PROGRESS OF FIBER COMPOSITE REPAIRS IN AIRCRAFT CONSTRUCTIONS .......................................................... 107

6
NON-DESTRUCTIVE TESTING IN AIRCRAFT MAINTENANCE
doc. Ing. Martin Bugaj, PhD.
Faculty of Transport and Communication, University of Ţilina, Slovakia
Abstract – Non-Destructive Testing (NDT) evaluates material
properties and quality of manufacture for expensive components
or assemblies without damaging the product or its function.
Instead of statistical sampling techniques that use only surface
measurements or require the destructive testing of selected
components from a production lot, NDT is used when these
testing techniques are cost prohibitive or ineffective. Typically,
NDT has been associated with the aircraft operation.
Key words – Non-Destructive Testing, Maintenance, Aircraft
I. INTRODUCTION
Management of maintenance activities at facilities on
aircraft is a complex and expensive task. This paper presents a
variety of techniques that can monitor equipment condition and
anticipate failure. For some noncritical, inexpensive, and easily
replaced components, run-to-failure method may be an
acceptable practice. For large, complicated, expensive, critical
items, run-to-failure may be unacceptable. Maintenance to
maximize service life of equipment or components and
surveillance of performance degradation can allow
repairs/replacement without interruption of critical activities.
For certain installations, it may be more economical to use
contract services to maintain infrequent, complex, and expensive
equipment and processes.
Nondestructive testing is defined as: ―The
determination of the physical condition of an object without
affecting that object‘s ability to fulfill its intended function.
Nondestructive testing techniques typically use a probing energy
form to determine material properties or to indicate the presence
of material discontinuities (surface, internal or concealed).‖[1].
II. NEW MATERIALS DEVELOPMENT
The implementation of new materials for fuselages
requires a large number of tests and validations. The spectrum
of investigations reaches from a simple material specimen over
coupons up to a complete fuselage. With all of the tests static
and dynamic properties are studied. Important for the security is
the damage tolerance behavior of the fuselage structures. The
design of further fuselages is strong influenced by new
innovative materials and joining technologies.
New aluminum alloys with lower density and welding
suitability are developed. Alloy systems Al-Mg-Si-Cu
(AA6013), Al-Mg-Li und Al-Mg-Sc, the extension of the
application of titanium alloys and the development of high-
strength magnesium alloys as well as the application of carbon
fiber reinforced plastic materials are important aspects for new
design, inspection and testing demands [2].
III. TEST PHILOSOPHY
The test pyramid for all mechanical structural tests
(static and fatigue) consider material tests at coupon level,
different levels of structural and component testing up to testing
of complete aircraft structures (major tests), fig. 1.
Figure 1 – Test pyramid
IV. NDT METHODS
There are seven common methods utilized for
nondestructive testing and the selection of the method depends
on the physical properties of the item being tested. These
methods are:
• Visual Inspection
• Liquid Penetration Inspection
• Acoustic Emission
• Magnetic Particle Inspection
• Eddy Current Inspection
• Ultrasonic Inspection
• Radiography
VISUAL INSPECTION
Visual scanning, inspection or testing can successfully
detect these unacceptable surface discontinuities without
applying expensive test methods. Despite advances in other
NDT technologies, visual inspection will likely remain the first
inspection method usedin many field applications. As new
mechanical and optical aids become available, the reliability of
visual inspection will increase to more acceptable levels. It is
expected that additional visual inspection standards will be
developed to provide guidance in applying visual inspection for

7
nondestructive testing. Visual inspection will continue to be an
important NDE inspection approach that will often identify
areas of structures or components where more advanced NDE
methods need to be applied.
LIQUID PENETRATION INSPECTION
Liquid penetrant testing is one of the oldest and
simpliest NDT methods where its earliest versions (using
kerosene and oil mixture) dates back to the 19th century. This
method is used to reveal surface discontinuities by bleedout of a
colored or fluorescent dye from the flaw. The technique is based
on the ability of a liquid to be drawn into a "clean" surface
discontinuity by capillary action. After a period of time called
the "dwell time", excess surface penetrant is removed and a
developer applied. This acts as a blotter that draws the penetrant
from the discontinuity to reveal its presence.
Penetrant inspection consists essentially of the
following sequence of operations:
The surface of components to be inspected is
prepared by cleaning, creating a clean drysurface.
Penetrant is applied to the prepared surface to be
inspected.
A period of time is allowed for it to enter any
discontinuity open to that surface.
The excess penetrant is removed in such a manner
that will ensure retention of penetrantinside of the
discontinuity.
A developer agent is applied to draw the penetrant
liquid from the discontinuities out to thesurface
and thereby give an enhanced indication of such
discontinuities.
The discontinuities are then visually examined and
assessed under appropriate viewingconditions.
The part is then cleaned and, as necessary, a
corrosion preventative is applied.[4]
ACOUSTIC EMISSION
Acoustic Emission (AE) refers to the generation of
transient elastic waves produced by a sudden redistribution of
stress in a material. When a structure is subjected to an external
stimulus (change in pressure, load, or temperature), localized
sources trigger the release of energy, in the form of stress waves,
which propagate to the surface and are recorded by sensors.
With the right equipment and setup, motions on the order of
picometers (10 -12 m) can be identified. In composites, matrix
cracking and fiber breakage and debonding contribute to
acoustic emissions. AE‘s have also been measured and recorded
in polymers, among other materials.
MAGNETIC PARTICLE INSPECTION
Magnetic particle inspection (MI) is a very popular,
low-cost method to perform nondestructive examination of
ferromagnetic material. Ferromagnetic is defined as ―a term
applied to materials that can be magnetized or strongly attracted
by a magnetic field.‖ MI is an NDT method that checks for
surface discontinuities but can also reveal discontinuities
slightly below the surface. magnetic particle examination can be
a useful nondestructive examination method during new
construction and in-service inspections. It can only be used on
ferromagnetic materials; therefore, it is not the best method for
all applications. For quick, low-cost inspections, MI is often the
best NDT method for detecting surface and slightly subsurface
discontinuities. [3]
EDDY CURRENT INSPECTION
Eddy Current Inspection (EI) method has a wide
usage in the field of Industry. Especially, aircraft maintenance
field has so many applicable areasforthis method. In addition, a
wide variety of inspections and measurements may be
performed with the eddy current methods that are beyond the
scope of other techniques. Measurements of non‐conductive
coating thickness and conductivity can be done. Conductivity is
related to the composition and heat treatment of the test
material. Therefore, the eddy current method can also be used to
distinguish between pure materials and alloy compositions and
to determine the hardness of test pieces after heat treatments. [5]
This method is widely used to detect surface flaws, to
sort materials, to measure thin walls from one surface only, to
measure thin coatings and in some applications to measure
casedepth. This method is applicable to electrically conductive
materials only. In the method eddy currents are produced in the
product by bringing it close to an alternating current carrying
coil. The alternating magnetic field of the coil is modified by the
magnetic fields of the eddy currents. This modification, which
depends on the condition of the part near to the coil, is then
shown as a meter reading or cathode ray tube presentation. [6]
ULTRASONIC INSPECTION
Ultrasonic inspection uses high frequency sound
waves (typically in the range between 0.5 and 15 MHz) to
conduct examinations and make measurements. In ultrasonic
inspection use is made of the basic physical property that sound
waves travel at known constant velocities through any
sympathetic medium. By measuring the time for a sound wave
to travel through a material it can be determined how far that
wave has travelled. In this way sound waves can be used to
measure distances. Use can also be made of the fact that sound
waves are reflected at an interface between two materials such
as steel and air to detect defects.
Aircraft have many systems that can be checked
ultrasonically. Some of the more common applications include:
Locate cabin pressure leaks
Locate leaks in oxygen systems
Locate tire leaks
Locate problems in hydraulic system, valves
and actuators
Locate leaks in cockpit windows & doors
Locate problems with bearings, pumps,
motors and gears

8
Locate leaks in floatation devices (seaplane
floats)
Locate leaks in fuel cells
Detect & locate corona affecting electronics
Detect & locate arcing & sparking in
electrical systems
RADIOGRAPHY
Radiography uses radiation energy to penetrate solid
objects in order to assess variations in thickness or density. The
second part of the process involves capturing a shadow image of
the component being inspected on film using procedures similar
to those that technicians used when the technology was first
developed. Identifying density differences on an X-ray, which
indicate flaws or cracks, is still the foundation of radiographic
analysis. Radiography basically involves the projection and
penetration of radiation energy through the sample being
inspected. The radiation energy is absorbed uniformly by the
material or component being inspected except where variations
in thickness or density occur. The energy not absorbed is passed
through to a sensing medium that captures an image of the
radiation pattern. The uniform absorption and any deviations in
uniformity are subsequently captured on the sensing material
and indicate the potential presence of a discontinuity.[7]
V. CONCLUSION
Non-Destructive Testing is the term given to the
process of inspection of either a component or structure in
which the item being tested is not changed or destroyed. This
means that after inspection the item being tested can be used for
its originally designed purpose should it not be found to have a
fault. As such NDT may be used for the purposes of monitoring
quality during manufacture of items such that they may be
checked for defects or imperfections, checking fatigue or
deterioration of items already in use such as cracking, and
assessment of defects where defects are analyzed to determine
the items suitability to performing the task it was designed for.
REFERENCES
[1] Forsyth, D. S.: A Brief Introduction to Nondestructive
Testing, The AMMTIAC Quarterly, Volume 1, Number 2,
2010
[2] Franke, R.; Ridzewski, J.; Goldbach, S.: Werkstoffe,
Fügeverfahren und Testmethodenin der
Passagierflugzeugentwicklung,2. Regionaltag der
sächsischenLuft- und Raumfahrt, November 2009
[3] Worman, J.: Magnetic Particle Examination, National
Board BULLETIN, 2011
[4] IAEA-TECDOC-628, Training Guidelines in Non-
destructive Testing Techniques, 2000
[5] J.G. Martin, J.G. Gil, E.V. Sanchez,‖ Non‐Destructive
Techniques Based On Eddy Current Testing‖ Sensors 2011
[6] Kushan, M.C., Unal T, Hakan E.: A New Design For
Wireless Eddy Current Testing Probe & Its Applications
For Aircrafts, ICMEM, 2012
[7] Brett J. A Selecting a Nondestructive Testing Method,
AMMTIAC Quarterly, Volume 2, Number 2, 2010
[8] ČERVINKA, M., TYKVA, T. The Relationship of the
Regional Economy and Aair Transport. InScientific Papers
of University of Pardubice, 2012, vol. 28, no. 24, p. 31–42.
ISSN 1211-555X.
9
PROPELLER DESIGN FOR ELECTRIC POWEREDLIGHT
AIRCRAFTS
Ing.Miloš Daniel, PhD.
Institute of Aerospace Engineering, Faculty of Mechanical Engineering, Brno University of Technology, Czech Rep.
Dušan Mihalides
DM-PROP Company, Šivetice 29, Slovak Republic, www.dm-prop.sk
Abstract – The recent years have witnessed a flurry of
exciting developments in the field of electric powered
aircraft.However, the energy capacity constraints with current
electrical power sources often limit the flight times of these
aircraft to little more than one hour. Consequently, there is
a big demand for efficiency increasing of whole propulsion
system with emphasis on propeller performance and noise
characteristics.
Key words – Propeller, electric powered aircraft, batteries
I. INTRODUCTION
In the following text, brief introduction into the
electric propulsion technology will be presented. In recent years
big emphasis is given to green technology and environment
noise reduction. The electric and hybrid propulsion systems are
subject to rapid development not only in automotive industry but
also in aerospace. Rapid development is remarkable in the field
of battery design, electric engine design which is pushed by
automotive industry. In the field of propeller design the
innovation are more conservative but goes also forward.
II. ELECTRIC MOTORS
More than 100 different electric motors can be found
in modern vehicles. The great variety of motor topologies and
the different specifications of EVs result in a segmented market
with DC, Induction (IM), Synchronous Permanent Magnet
(SPM) and Synchronous Brushed (SBM) motors already
commercially available. A fifth topology, the Reluctance Motor
(RM), has been proposed due to favourable characteristics but
has not yet been released commercially in EVs.
The efficiency of electric motors depends on the
working points that each driving cycle applies to the motor, as in
IC motors. There is no standard stand alone figure of the
efficiency rating for variable speed motors. If motors with the
same peak efficiency are compared, PM motors are more
efficient in overload transients at constant speed, while RM
motors have better performances at high speed overloads. RMs‘
control allows high speed operation but the efficiency decays
rapidly at low speed. SB motors have lower peak efficiency than
PM motors, but the efficiency remains high in a wide
operational range, and their control allows high speed operation.
The efficiency is also dependant on the voltage level. High
voltage rated drivelines are intrinsically more efficient. On the
other hand, the efficiency drops when the driveline is operated
below rated voltage. This happens at low State of Charge.
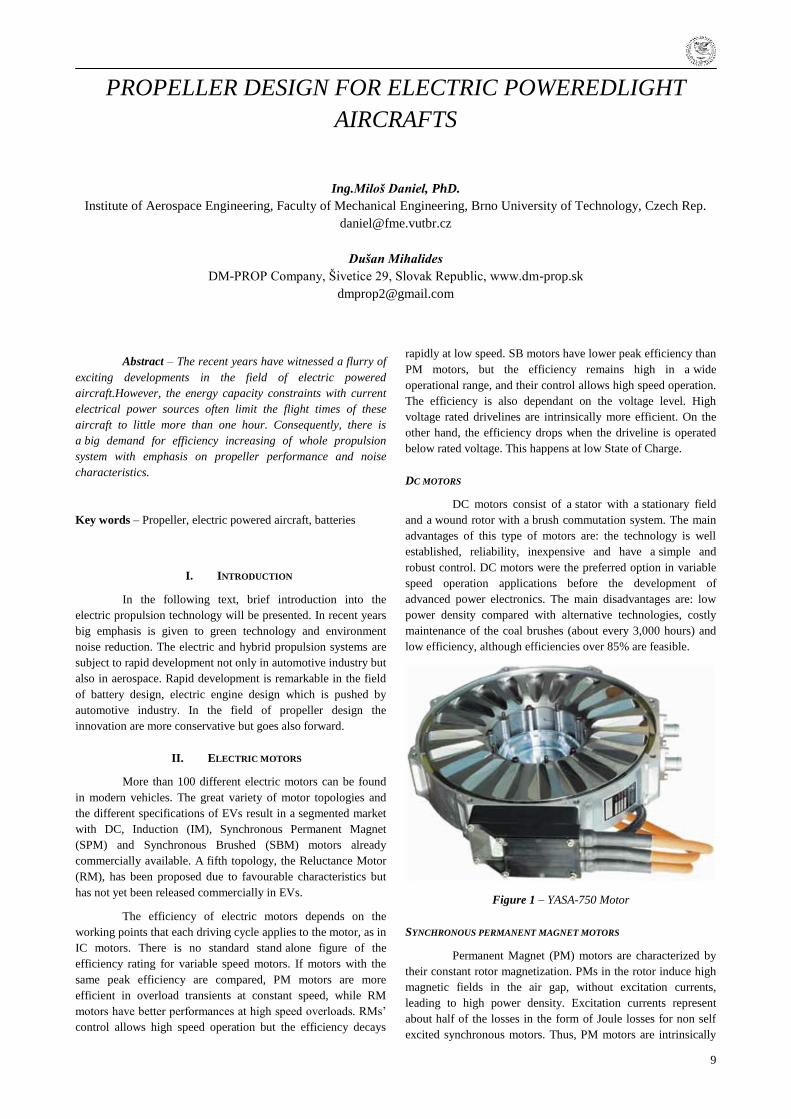
DC MOTORS
DC motors consist of a stator with a stationary field
and a wound rotor with a brush commutation system. The main
advantages of this type of motors are: the technology is well
established, reliability, inexpensive and have a simple and
robust control. DC motors were the preferred option in variable
speed operation applications before the development of
advanced power electronics. The main disadvantages are: low
power density compared with alternative technologies, costly
maintenance of the coal brushes (about every 3,000 hours) and
low efficiency, although efficiencies over 85% are feasible.
Figure 1 – YASA-750 Motor
SYNCHRONOUS PERMANENT MAGNET MOTORS
Permanent Magnet (PM) motors are characterized by
their constant rotor magnetization. PMs in the rotor induce high
magnetic fields in the air gap, without excitation currents,
leading to high power density. Excitation currents represent
about half of the losses in the form of Joule losses for non self
excited synchronous motors. Thus, PM motors are intrinsically
10
very efficient and require less cooling due to the lack of exciting
currents. This comes at the cost of a more complex control as
the excitation field may not be regulated. For historical reasons
Synchronous Permanent Magnet Motors (SPM) are also known
as Brushless Permanent Magnet (BPM).
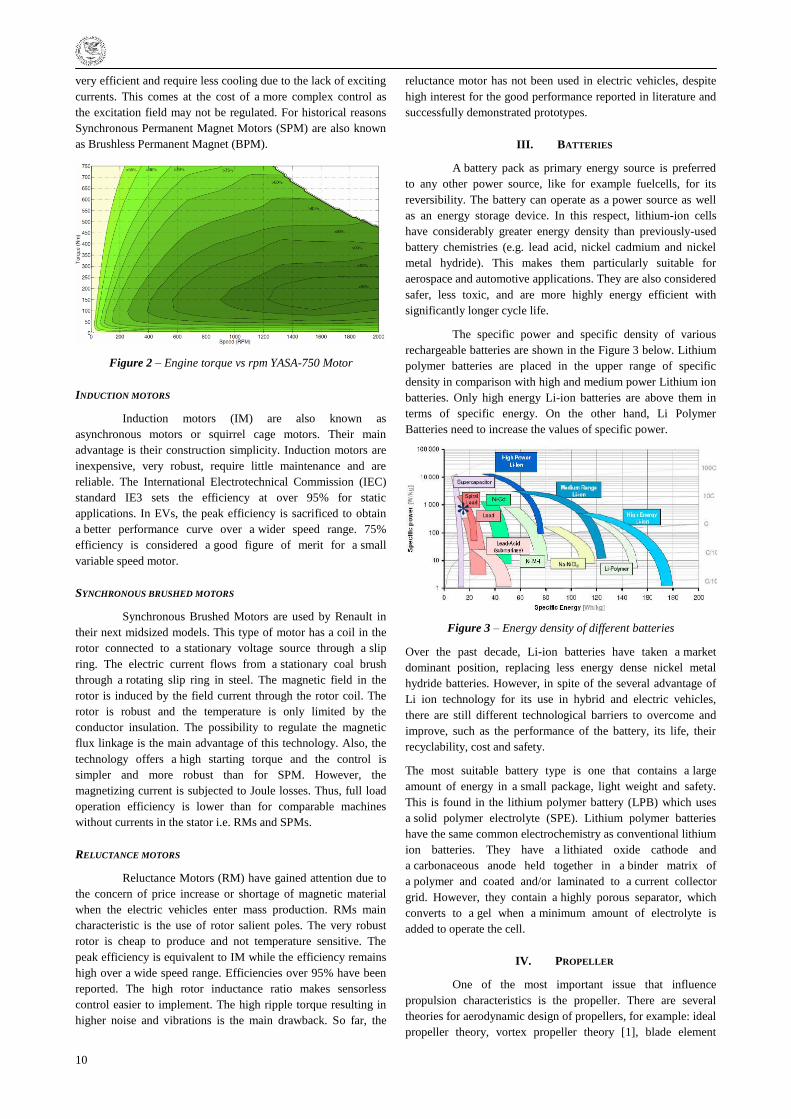
Figure 2 – Engine torque vs rpm YASA-750 Motor
INDUCTION MOTORS
Induction motors (IM) are also known as
asynchronous motors or squirrel cage motors. Their main
advantage is their construction simplicity. Induction motors are
inexpensive, very robust, require little maintenance and are
reliable. The International Electrotechnical Commission (IEC)
standard IE3 sets the efficiency at over 95% for static
applications. In EVs, the peak efficiency is sacrificed to obtain
a better performance curve over a wider speed range. 75%
efficiency is considered a good figure of merit for a small
variable speed motor.
SYNCHRONOUS BRUSHED MOTORS
Synchronous Brushed Motors are used by Renault in
their next midsized models. This type of motor has a coil in the
rotor connected to a stationary voltage source through a slip
ring. The electric current flows from a stationary coal brush
through a rotating slip ring in steel. The magnetic field in the
rotor is induced by the field current through the rotor coil. The
rotor is robust and the temperature is only limited by the
conductor insulation. The possibility to regulate the magnetic
flux linkage is the main advantage of this technology. Also, the
technology offers a high starting torque and the control is
simpler and more robust than for SPM. However, the
magnetizing current is subjected to Joule losses. Thus, full load
operation efficiency is lower than for comparable machines
without currents in the stator i.e. RMs and SPMs.
RELUCTANCE MOTORS
Reluctance Motors (RM) have gained attention due to
the concern of price increase or shortage of magnetic material
when the electric vehicles enter mass production. RMs main
characteristic is the use of rotor salient poles. The very robust
rotor is cheap to produce and not temperature sensitive. The
peak efficiency is equivalent to IM while the efficiency remains
high over a wide speed range. Efficiencies over 95% have been
reported. The high rotor inductance ratio makes sensorless
control easier to implement. The high ripple torque resulting in
higher noise and vibrations is the main drawback. So far, the
reluctance motor has not been used in electric vehicles, despite
high interest for the good performance reported in literature and
successfully demonstrated prototypes.
III. BATTERIES
A battery pack as primary energy source is preferred
to any other power source, like for example fuelcells, for its
reversibility. The battery can operate as a power source as well
as an energy storage device. In this respect, lithium-ion cells
have considerably greater energy density than previously-used
battery chemistries (e.g. lead acid, nickel cadmium and nickel
metal hydride). This makes them particularly suitable for
aerospace and automotive applications. They are also considered
safer, less toxic, and are more highly energy efficient with
significantly longer cycle life.
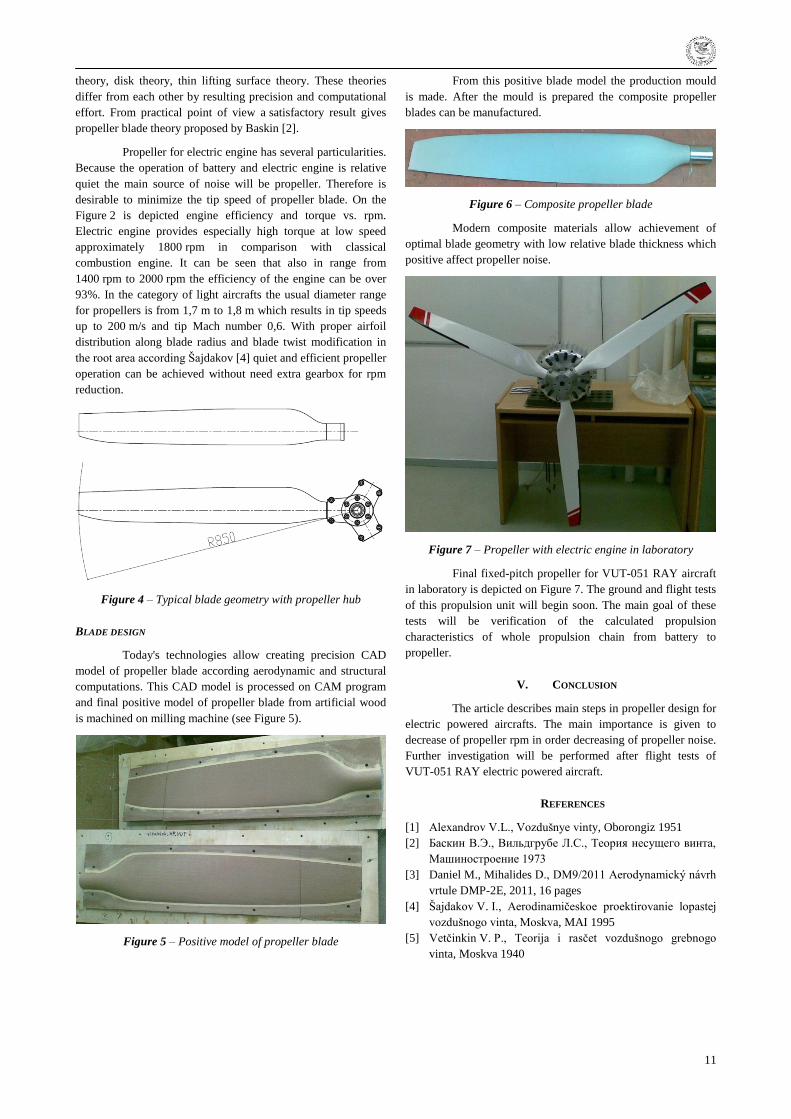
The specific power and specific density of various
rechargeable batteries are shown in the Figure 3 below. Lithium
polymer batteries are placed in the upper range of specific
density in comparison with high and medium power Lithium ion
batteries. Only high energy Li-ion batteries are above them in
terms of specific energy. On the other hand, Li Polymer
Batteries need to increase the values of specific power.
Figure 3 – Energy density of different batteries
Over the past decade, Li-ion batteries have taken a market
dominant position, replacing less energy dense nickel metal
hydride batteries. However, in spite of the several advantage of
Li ion technology for its use in hybrid and electric vehicles,
there are still different technological barriers to overcome and
improve, such as the performance of the battery, its life, their
recyclability, cost and safety.
The most suitable battery type is one that contains a large
amount of energy in a small package, light weight and safety.
This is found in the lithium polymer battery (LPB) which uses
a solid polymer electrolyte (SPE). Lithium polymer batteries
have the same common electrochemistry as conventional lithium
ion batteries. They have a lithiated oxide cathode and
a carbonaceous anode held together in a binder matrix of
a polymer and coated and/or laminated to a current collector
grid. However, they contain a highly porous separator, which
converts to a gel when a minimum amount of electrolyte is
added to operate the cell.
IV. PROPELLER
One of the most important issue that influence
propulsion characteristics is the propeller. There are several
theories for aerodynamic design of propellers, for example: ideal
propeller theory, vortex propeller theory [1], blade element
11
theory, disk theory, thin lifting surface theory. These theories
differ from each other by resulting precision and computational
effort. From practical point of view a satisfactory result gives
propeller blade theory proposed by Baskin [2].
Propeller for electric engine has several particularities.
Because the operation of battery and electric engine is relative
quiet the main source of noise will be propeller. Therefore is
desirable to minimize the tip speed of propeller blade. On the
Figure 2 is depicted engine efficiency and torque vs. rpm.
Electric engine provides especially high torque at low speed
approximately 1800 rpm in comparison with classical
combustion engine. It can be seen that also in range from
1400 rpm to 2000 rpm the efficiency of the engine can be over
93%. In the category of light aircrafts the usual diameter range
for propellers is from 1,7 m to 1,8 m which results in tip speeds
up to 200 m/s and tip Mach number 0,6. With proper airfoil
distribution along blade radius and blade twist modification in
the root area according Šajdakov [4] quiet and efficient propeller
operation can be achieved without need extra gearbox for rpm
reduction.
Figure 4 – Typical blade geometry with propeller hub
BLADE DESIGN
Today's technologies allow creating precision CAD
model of propeller blade according aerodynamic and structural
computations. This CAD model is processed on CAM program
and final positive model of propeller blade from artificial wood
is machined on milling machine (see Figure 5).
Figure 5 – Positive model of propeller blade
From this positive blade model the production mould
is made. After the mould is prepared the composite propeller
blades can be manufactured.
Figure 6 – Composite propeller blade
Modern composite materials allow achievement of
optimal blade geometry with low relative blade thickness which
positive affect propeller noise.
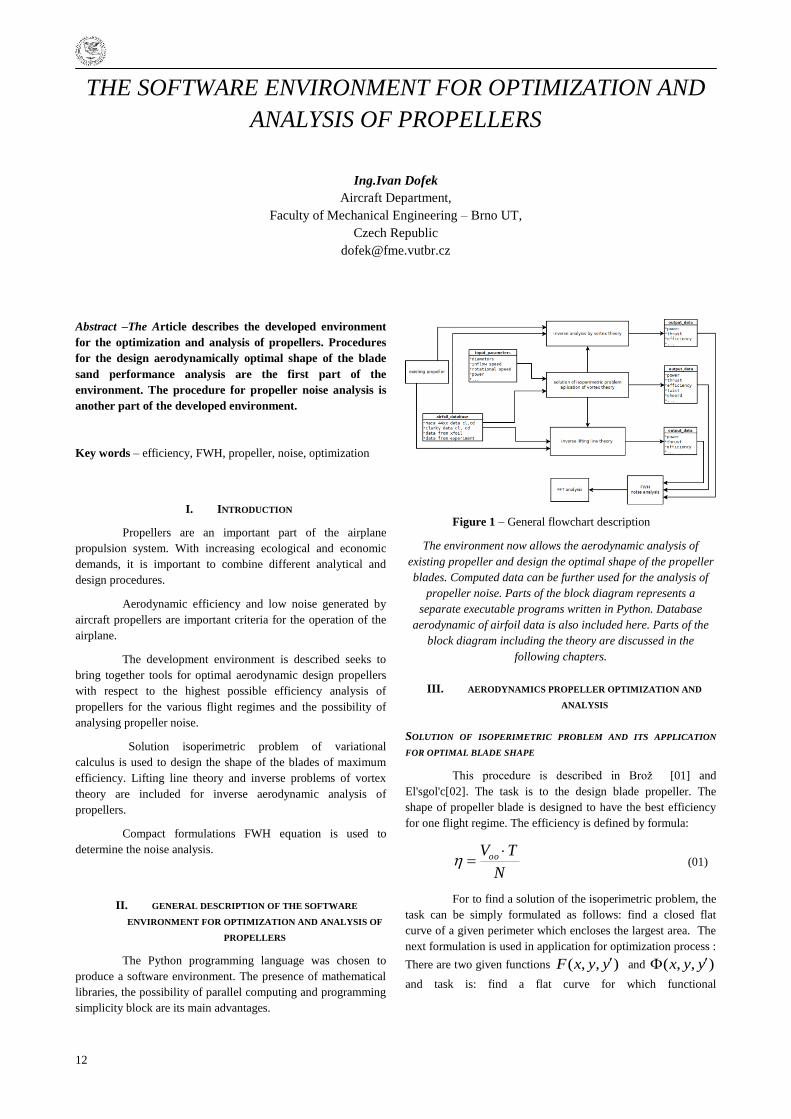
Figure 7 – Propeller with electric engine in laboratory
Final fixed-pitch propeller for VUT-051 RAY aircraft
in laboratory is depicted on Figure 7. The ground and flight tests
of this propulsion unit will begin soon. The main goal of these
tests will be verification of the calculated propulsion
characteristics of whole propulsion chain from battery to
propeller.
V. CONCLUSION
The article describes main steps in propeller design for
electric powered aircrafts. The main importance is given to
decrease of propeller rpm in order decreasing of propeller noise.
Further investigation will be performed after flight tests of
VUT-051 RAY electric powered aircraft.
REFERENCES
[1] Alexandrov V.L., Vozdušnye vinty, Oborongiz 1951
[2] Баскин В.Э., Вильдгрубе Л.С., Теория несущего винта,
Машиностроение 1973
[3] Daniel M., Mihalides D., DM9/2011 Aerodynamický návrh
vrtule DMP-2E, 2011, 16 pages
[4] Šajdakov V. I., Aerodinamičeskoe proektirovanie lopastej
vozdušnogo vinta, Moskva, MAI 1995
[5] Vetčinkin V. P., Teorija i rasčet vozdušnogo grebnogo
vinta, Moskva 1940
12
THE SOFTWARE ENVIRONMENT FOR OPTIMIZATION AND
ANALYSIS OF PROPELLERS
Ing.Ivan Dofek
Aircraft Department,
Faculty of Mechanical Engineering – Brno UT,
Czech Republic
Abstract –The Article describes the developed environment
for the optimization and analysis of propellers. Procedures
for the design aerodynamically optimal shape of the blade
sand performance analysis are the first part of the
environment. The procedure for propeller noise analysis is
another part of the developed environment.
Key words – efficiency, FWH, propeller, noise, optimization
I. INTRODUCTION
Propellers are an important part of the airplane
propulsion system. With increasing ecological and economic
demands, it is important to combine different analytical and
design procedures.
Aerodynamic efficiency and low noise generated by
aircraft propellers are important criteria for the operation of the
airplane.
The development environment is described seeks to
bring together tools for optimal aerodynamic design propellers
with respect to the highest possible efficiency analysis of
propellers for the various flight regimes and the possibility of
analysing propeller noise.
Solution isoperimetric problem of variational
calculus is used to design the shape of the blades of maximum
efficiency. Lifting line theory and inverse problems of vortex
theory are included for inverse aerodynamic analysis of
propellers.
Compact formulations FWH equation is used to
determine the noise analysis.
II. GENERAL DESCRIPTION OF THE SOFTWARE
ENVIRONMENT FOR OPTIMIZATION AND ANALYSIS OF
PROPELLERS
The Python programming language was chosen to
produce a software environment. The presence of mathematical
libraries, the possibility of parallel computing and programming
simplicity block are its main advantages.
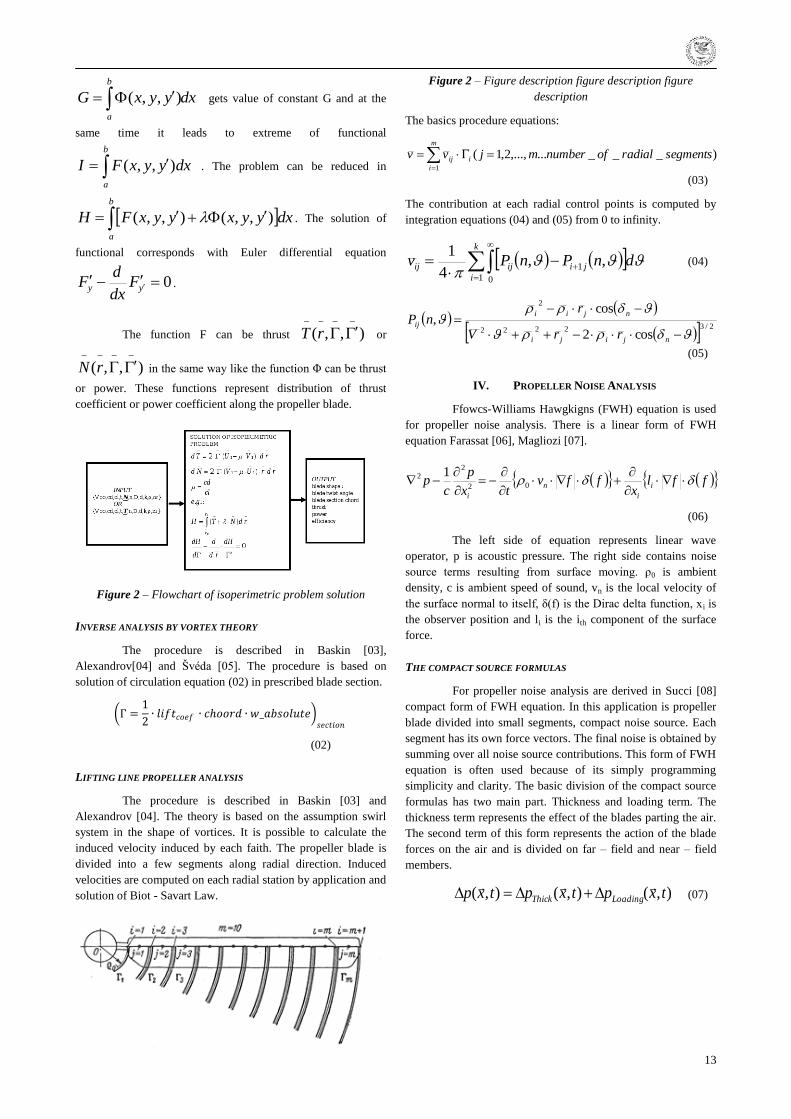
Figure 1 – General flowchart description
The environment now allows the aerodynamic analysis of
existing propeller and design the optimal shape of the propeller
blades. Computed data can be further used for the analysis of
propeller noise. Parts of the block diagram represents a
separate executable programs written in Python. Database
aerodynamic of airfoil data is also included here. Parts of the
block diagram including the theory are discussed in the
following chapters.
III. AERODYNAMICS PROPELLER OPTIMIZATION AND
ANALYSIS
SOLUTION OF ISOPERIMETRIC PROBLEM AND ITS APPLICATION
FOR OPTIMAL BLADE SHAPE
This procedure is described in Broţ [01] and
El'sgol'c[02]. The task is to the design blade propeller. The
shape of propeller blade is designed to have the best efficiency
for one flight regime. The efficiency is defined by formula:
N
TVoo (01)
For to find a solution of the isoperimetric problem, the
task can be simply formulated as follows: find a closed flat
curve of a given perimeter which encloses the largest area. The
next formulation is used in application for optimization process :
There are two given functions ),,( yyxF and ),,( yyx
and task is: find a flat curve for which functional
13
dxyyxG
b
a
),,( gets value of constant G and at the
same time it leads to extreme of functional
b
a
dxyyxFI ),,( . The problem can be reduced in
b
a
dxyyxyyxFH ),,(),,( . The solution of
functional corresponds with Euler differential equation
0 yy Fdx
dF .
The function F can be thrust ),,(
rT or
),,(
rN in the same way like the function Φ can be thrust
or power. These functions represent distribution of thrust
coefficient or power coefficient along the propeller blade.
Figure 2 – Flowchart of isoperimetric problem solution
INVERSE ANALYSIS BY VORTEX THEORY
The procedure is described in Baskin [03],
Alexandrov[04] and Švéda [05]. The procedure is based on
solution of circulation equation (02) in prescribed blade section.
Γ =1
2∙ 𝑙𝑖𝑓𝑡𝑐𝑜𝑒𝑓 ∙ 𝑐𝑜𝑜𝑟𝑑 ∙ 𝑤_𝑎𝑏𝑠𝑜𝑙𝑢𝑡𝑒
𝑠𝑒𝑐𝑡𝑖𝑜𝑛
(02)
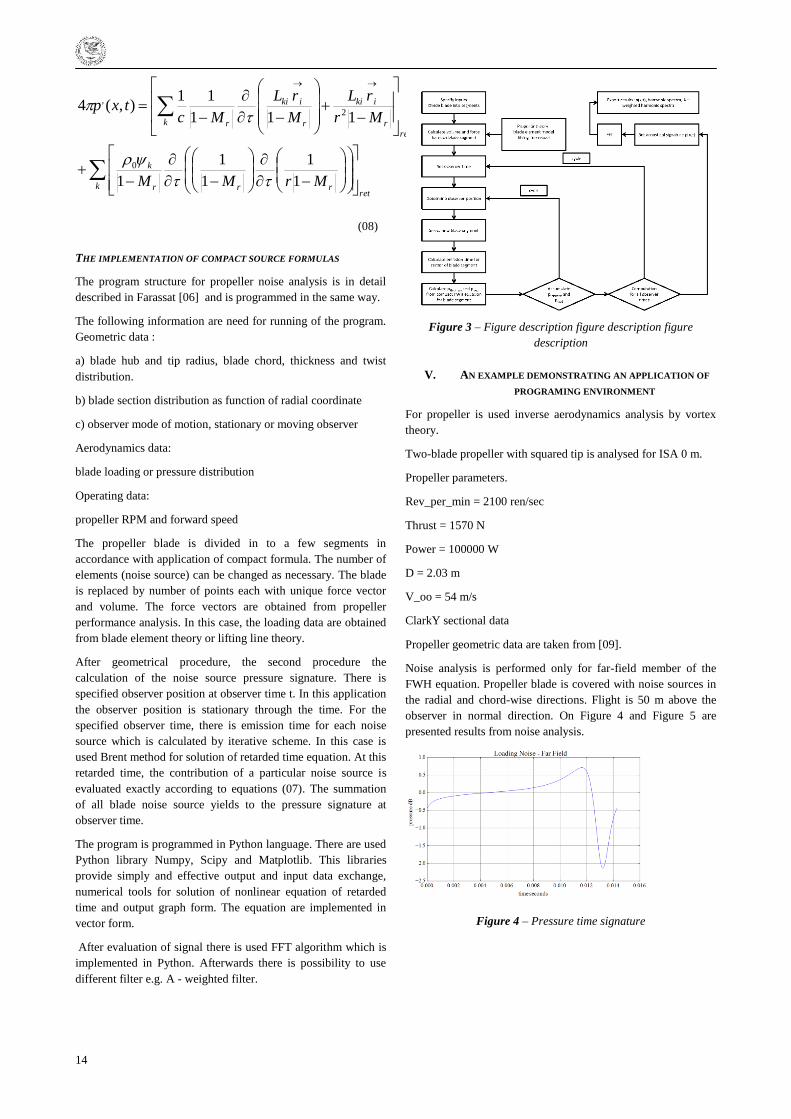
LIFTING LINE PROPELLER ANALYSIS
The procedure is described in Baskin [03] and
Alexandrov [04]. The theory is based on the assumption swirl
system in the shape of vortices. It is possible to calculate the
induced velocity induced by each faith. The propeller blade is
divided into a few segments along radial direction. Induced
velocities are computed on each radial station by application and
solution of Biot - Savart Law.
Figure 2 – Figure description figure description figure
description
The basics procedure equations:
m
i
iij segmentsradialofnumbermjvv1
)___...,...,2,1(
(03)
The contribution at each radial control points is computed by
integration equations (04) and (05) from 0 to infinity.
k
i
jiijij dnPnPv1 0
1 ,,4
1
(04)
2/32222
2
cos2
cos,
njiji
njii
ij
rrV
rnP
(05)
IV. PROPELLER NOISE ANALYSIS
Ffowcs-Williams Hawgkigns (FWH) equation is used
for propeller noise analysis. There is a linear form of FWH
equation Farassat [06], Magliozi [07].
(06)
The left side of equation represents linear wave
operator, p is acoustic pressure. The right side contains noise
source terms resulting from surface moving. ρ0 is ambient
density, c is ambient speed of sound, vn is the local velocity of
the surface normal to itself, δ(f) is the Dirac delta function, xi is
the observer position and li is the ith component of the surface
force.
THE COMPACT SOURCE FORMULAS
For propeller noise analysis are derived in Succi [08]
compact form of FWH equation. In this application is propeller
blade divided into small segments, compact noise source. Each
segment has its own force vectors. The final noise is obtained by
summing over all noise source contributions. This form of FWH
equation is often used because of its simply programming
simplicity and clarity. The basic division of the compact source
formulas has two main part. Thickness and loading term. The
thickness term represents the effect of the blades parting the air.
The second term of this form represents the action of the blade
forces on the air and is divided on far – field and near – field
members.
),(),(),( txptxptxp LoadingThick
(07)
fflx
ffvtx
p
cp i
i
n
i
02
22 1
14
retk rrr
k
ret
r
iki
k r
iki
r
MrMM
Mr
rL
M
rL
Mctxp
1
1
1
1
1
111
11),(4
0
2
,
(08)
THE IMPLEMENTATION OF COMPACT SOURCE FORMULAS
The program structure for propeller noise analysis is in detail
described in Farassat [06] and is programmed in the same way.
The following information are need for running of the program.
Geometric data :
a) blade hub and tip radius, blade chord, thickness and twist
distribution.
b) blade section distribution as function of radial coordinate
c) observer mode of motion, stationary or moving observer
Aerodynamics data:
blade loading or pressure distribution
Operating data:
propeller RPM and forward speed
The propeller blade is divided in to a few segments in
accordance with application of compact formula. The number of
elements (noise source) can be changed as necessary. The blade
is replaced by number of points each with unique force vector
and volume. The force vectors are obtained from propeller
performance analysis. In this case, the loading data are obtained
from blade element theory or lifting line theory.
After geometrical procedure, the second procedure the
calculation of the noise source pressure signature. There is
specified observer position at observer time t. In this application
the observer position is stationary through the time. For the
specified observer time, there is emission time for each noise
source which is calculated by iterative scheme. In this case is
used Brent method for solution of retarded time equation. At this
retarded time, the contribution of a particular noise source is
evaluated exactly according to equations (07). The summation
of all blade noise source yields to the pressure signature at
observer time.
The program is programmed in Python language. There are used
Python library Numpy, Scipy and Matplotlib. This libraries
provide simply and effective output and input data exchange,
numerical tools for solution of nonlinear equation of retarded
time and output graph form. The equation are implemented in
vector form.
After evaluation of signal there is used FFT algorithm which is
implemented in Python. Afterwards there is possibility to use
different filter e.g. A - weighted filter.
Figure 3 – Figure description figure description figure
description
V. AN EXAMPLE DEMONSTRATING AN APPLICATION OF
PROGRAMING ENVIRONMENT
For propeller is used inverse aerodynamics analysis by vortex
theory.
Two-blade propeller with squared tip is analysed for ISA 0 m.
Propeller parameters.
Rev_per_min = 2100 ren/sec
Thrust = 1570 N
Power = 100000 W
D = 2.03 m
V_oo = 54 m/s
ClarkY sectional data
Propeller geometric data are taken from [09].
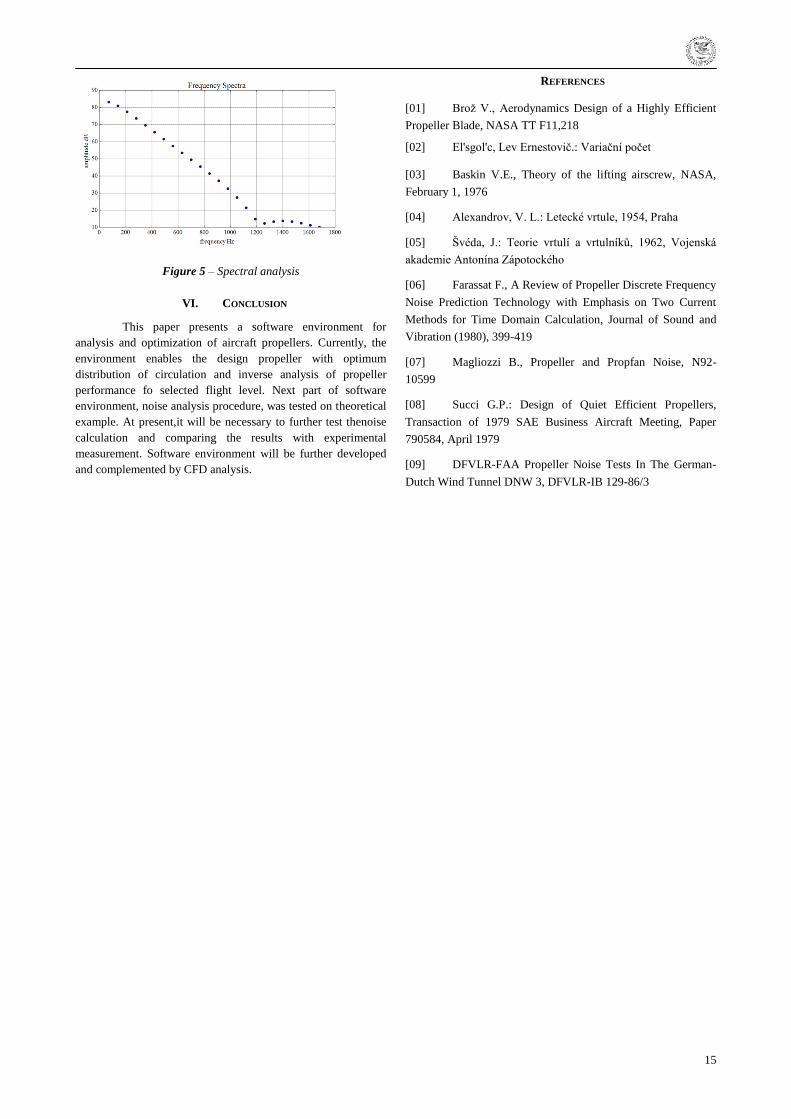
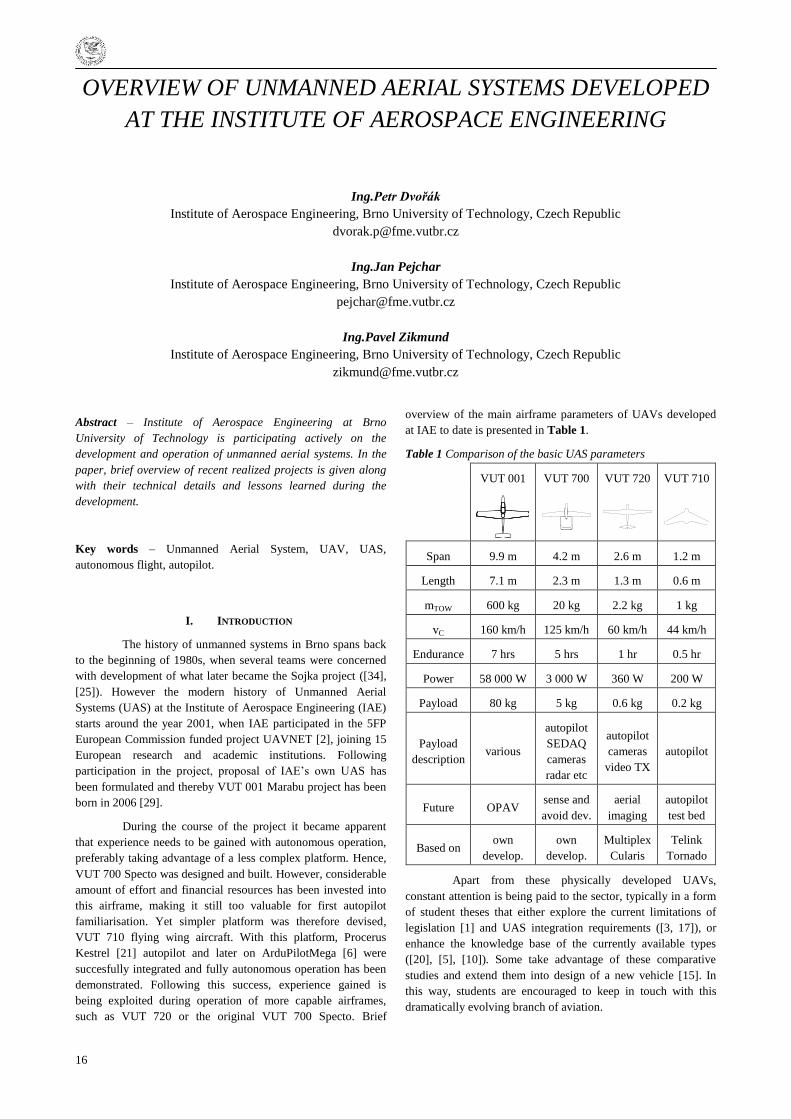
Noise analysis is performed only for far-field member of the
FWH equation. Propeller blade is covered with noise sources in
the radial and chord-wise directions. Flight is 50 m above the
observer in normal direction. On Figure 4 and Figure 5 are
presented results from noise analysis.
Figure 4 – Pressure time signature
15
Figure 5 – Spectral analysis
VI. CONCLUSION
This paper presents a software environment for
analysis and optimization of aircraft propellers. Currently, the
environment enables the design propeller with optimum
distribution of circulation and inverse analysis of propeller
performance fo selected flight level. Next part of software
environment, noise analysis procedure, was tested on theoretical
example. At present,it will be necessary to further test thenoise
calculation and comparing the results with experimental
measurement. Software environment will be further developed
and complemented by CFD analysis.
REFERENCES
[01] Broţ V., Aerodynamics Design of a Highly Efficient
Propeller Blade, NASA TT F11,218
[02] El'sgol'c, Lev Ernestovič.: Variační počet
[03] Baskin V.E., Theory of the lifting airscrew, NASA,
February 1, 1976
[04] Alexandrov, V. L.: Letecké vrtule, 1954, Praha
[05] Švéda, J.: Teorie vrtulí a vrtulníků, 1962, Vojenská
akademie Antonína Zápotockého
[06] Farassat F., A Review of Propeller Discrete Frequency
Noise Prediction Technology with Emphasis on Two Current
Methods for Time Domain Calculation, Journal of Sound and
Vibration (1980), 399-419
[07] Magliozzi B., Propeller and Propfan Noise, N92-
10599
[08] Succi G.P.: Design of Quiet Efficient Propellers,
Transaction of 1979 SAE Business Aircraft Meeting, Paper
790584, April 1979
[09] DFVLR-FAA Propeller Noise Tests In The German-
Dutch Wind Tunnel DNW 3, DFVLR-IB 129-86/3
16
OVERVIEW OF UNMANNED AERIAL SYSTEMS DEVELOPED
AT THE INSTITUTE OF AEROSPACE ENGINEERING
Ing.Petr Dvořák
Institute of Aerospace Engineering, Brno University of Technology, Czech Republic
Ing.Jan Pejchar
Institute of Aerospace Engineering, Brno University of Technology, Czech Republic
Ing.Pavel Zikmund
Institute of Aerospace Engineering, Brno University of Technology, Czech Republic
Abstract – Institute of Aerospace Engineering at Brno
University of Technology is participating actively on the
development and operation of unmanned aerial systems. In the
paper, brief overview of recent realized projects is given along
with their technical details and lessons learned during the
development.
Key words – Unmanned Aerial System, UAV, UAS,
autonomous flight, autopilot.
I. INTRODUCTION
The history of unmanned systems in Brno spans back
to the beginning of 1980s, when several teams were concerned
with development of what later became the Sojka project ([34],
[25]). However the modern history of Unmanned Aerial
Systems (UAS) at the Institute of Aerospace Engineering (IAE)
starts around the year 2001, when IAE participated in the 5FP
European Commission funded project UAVNET [2], joining 15
European research and academic institutions. Following
participation in the project, proposal of IAE‘s own UAS has
been formulated and thereby VUT 001 Marabu project has been
born in 2006 [29].
During the course of the project it became apparent
that experience needs to be gained with autonomous operation,
preferably taking advantage of a less complex platform. Hence,
VUT 700 Specto was designed and built. However, considerable
amount of effort and financial resources has been invested into
this airframe, making it still too valuable for first autopilot
familiarisation. Yet simpler platform was therefore devised,
VUT 710 flying wing aircraft. With this platform, Procerus
Kestrel [21] autopilot and later on ArduPilotMega [6] were
succesfully integrated and fully autonomous operation has been
demonstrated. Following this success, experience gained is
being exploited during operation of more capable airframes,
such as VUT 720 or the original VUT 700 Specto. Brief
overview of the main airframe parameters of UAVs developed
at IAE to date is presented in Table 1.
Table 1 Comparison of the basic UAS parameters
VUT 001 VUT 700 VUT 720 VUT 710
Span 9.9 m 4.2 m 2.6 m 1.2 m
Length 7.1 m 2.3 m 1.3 m 0.6 m
mTOW 600 kg 20 kg 2.2 kg 1 kg
vC 160 km/h 125 km/h 60 km/h 44 km/h
Endurance 7 hrs 5 hrs 1 hr 0.5 hr
Power 58 000 W 3 000 W 360 W 200 W
Payload 80 kg 5 kg 0.6 kg 0.2 kg
Payload
description various
autopilot
SEDAQ
cameras
radar etc
autopilot
cameras
video TX
autopilot
Future OPAV sense and
avoid dev.
aerial
imaging
autopilot
test bed
Based on own
develop.
own
develop.
Multiplex
Cularis
Telink
Tornado
Apart from these physically developed UAVs,
constant attention is being paid to the sector, typically in a form
of student theses that either explore the current limitations of
legislation [1] and UAS integration requirements ([3, 17]), or
enhance the knowledge base of the currently available types
([20], [5], [10]). Some take advantage of these comparative
studies and extend them into design of a new vehicle [15]. In
this way, students are encouraged to keep in touch with this
dramatically evolving branch of aviation.
17
II. VUT001 MARABU
The Marabu aircraft was conceived by prof. Antonín
Píštěk in the wake of the UAVNET initiative, with the project
being started officially in the year 2006. The original idea of the
aircraft was to facilitate UAS development and operation in non-
segregated airspace in an environment where regulatory base for
civil unmanned aircraft is not established. Hence, the aircraft
was designed as an Optionally Piloted Air Vehicle (OPAV)
([11], [12]). Such a concept is capable of performing a normal
piloted flight with a pilot on board. Pilot presence on board
makes OPAV status fully legal even if the pilot does not
participate at the actual control of the aircraft ([31], [32], [13]).
Hence, OPAV is ideally suited for integration of new avionics
equipment, its testing and certification – with the pilot always
being readily available on board to step in should the situation
require it. The OPAV concept also brings the possibility of
gradual transition into the fully autonomous operation mode as
the new avionics modules and functionalities are being
developed or acquired during the course of the project.
The aims of the Marabu project could be described as follows:
- Create a platform for instrument development and
integration testing
- Enable smooth transition to More Electric Aircraft, so
that fully autonomous operation can be achieved later
on without any problems
- Develop a dedicated flight data acquisition system in
order to characterize the airframe thoroughly
- Develop a sense and avoid capability test platform –
hence the nose of the aircraft was designed to provide
unobscured front view.
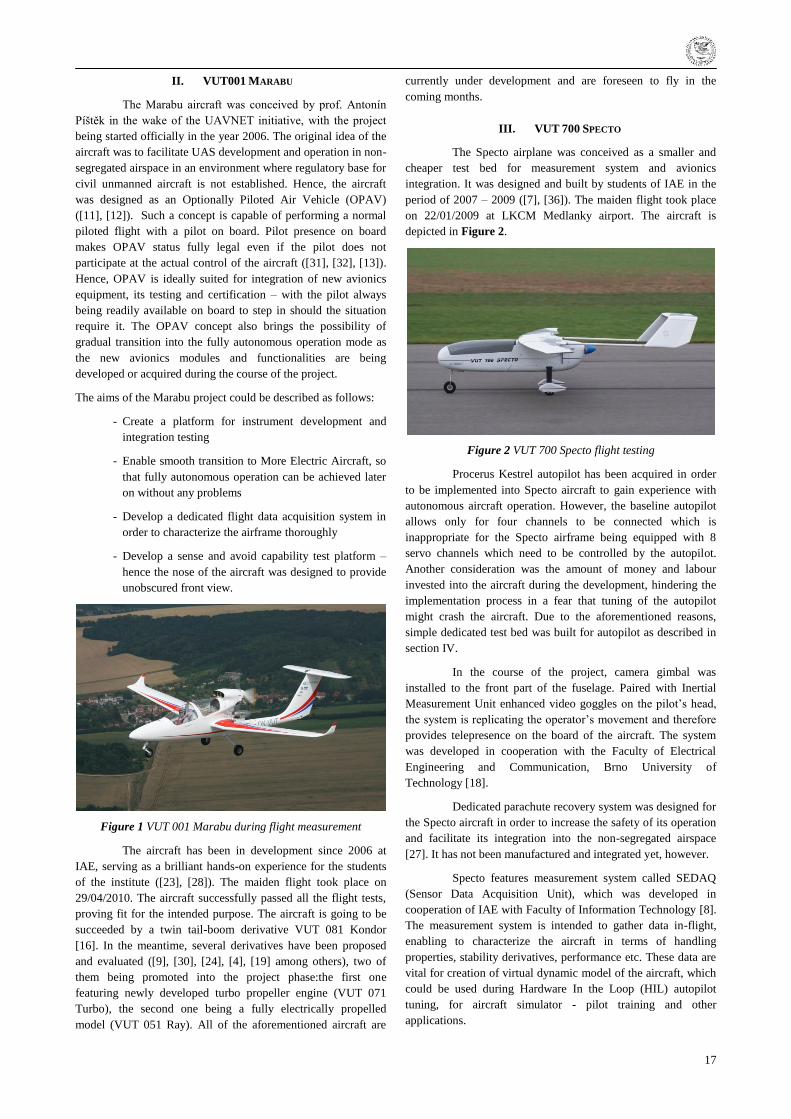
Figure 1 VUT 001 Marabu during flight measurement
The aircraft has been in development since 2006 at
IAE, serving as a brilliant hands-on experience for the students
of the institute ([23], [28]). The maiden flight took place on
29/04/2010. The aircraft successfully passed all the flight tests,
proving fit for the intended purpose. The aircraft is going to be
succeeded by a twin tail-boom derivative VUT 081 Kondor
[16]. In the meantime, several derivatives have been proposed
and evaluated ([9], [30], [24], [4], [19] among others), two of
them being promoted into the project phase:the first one
featuring newly developed turbo propeller engine (VUT 071
Turbo), the second one being a fully electrically propelled
model (VUT 051 Ray). All of the aforementioned aircraft are
currently under development and are foreseen to fly in the
coming months.
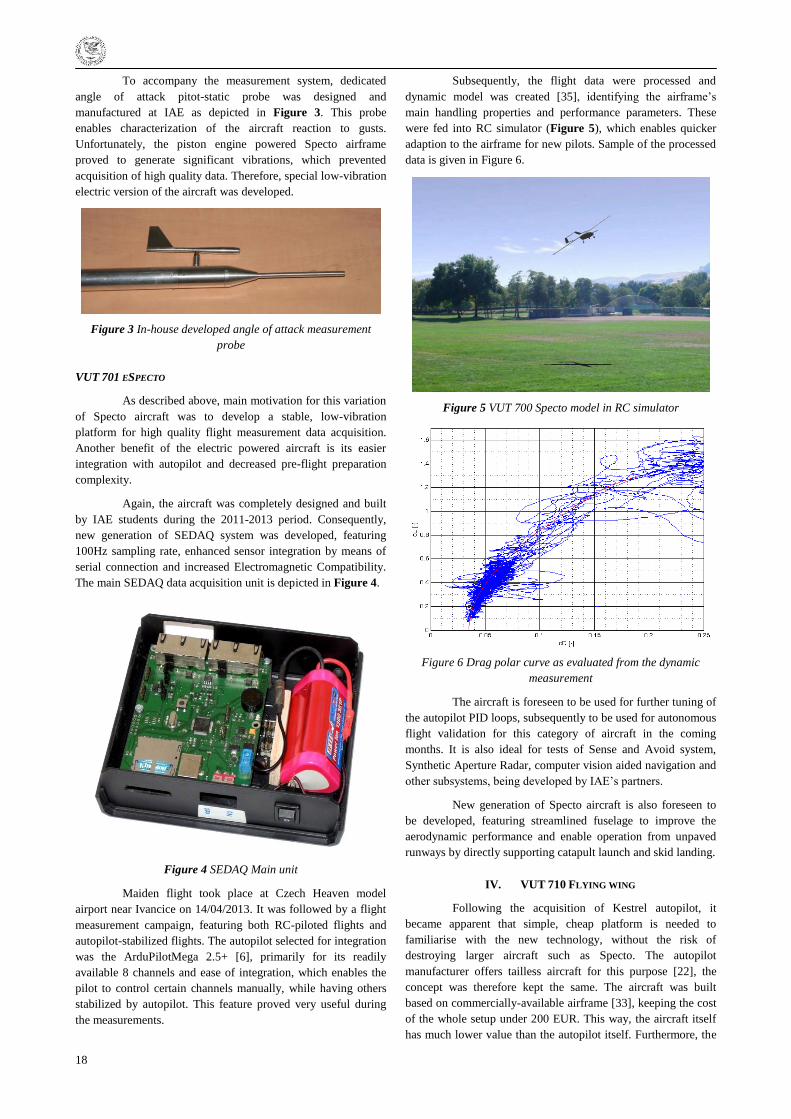
III. VUT 700 SPECTO
The Specto airplane was conceived as a smaller and
cheaper test bed for measurement system and avionics
integration. It was designed and built by students of IAE in the
period of 2007 – 2009 ([7], [36]). The maiden flight took place
on 22/01/2009 at LKCM Medlanky airport. The aircraft is
depicted in Figure 2.
Figure 2 VUT 700 Specto flight testing
Procerus Kestrel autopilot has been acquired in order
to be implemented into Specto aircraft to gain experience with
autonomous aircraft operation. However, the baseline autopilot
allows only for four channels to be connected which is
inappropriate for the Specto airframe being equipped with 8
servo channels which need to be controlled by the autopilot.
Another consideration was the amount of money and labour
invested into the aircraft during the development, hindering the
implementation process in a fear that tuning of the autopilot
might crash the aircraft. Due to the aforementioned reasons,
simple dedicated test bed was built for autopilot as described in
section IV.
In the course of the project, camera gimbal was
installed to the front part of the fuselage. Paired with Inertial
Measurement Unit enhanced video goggles on the pilot‘s head,
the system is replicating the operator‘s movement and therefore
provides telepresence on the board of the aircraft. The system
was developed in cooperation with the Faculty of Electrical
Engineering and Communication, Brno University of
Technology [18].
Dedicated parachute recovery system was designed for
the Specto aircraft in order to increase the safety of its operation
and facilitate its integration into the non-segregated airspace
[27]. It has not been manufactured and integrated yet, however.
Specto features measurement system called SEDAQ
(Sensor Data Acquisition Unit), which was developed in
cooperation of IAE with Faculty of Information Technology [8].
The measurement system is intended to gather data in-flight,
enabling to characterize the aircraft in terms of handling
properties, stability derivatives, performance etc. These data are
vital for creation of virtual dynamic model of the aircraft, which
could be used during Hardware In the Loop (HIL) autopilot
tuning, for aircraft simulator - pilot training and other
applications.
18
To accompany the measurement system, dedicated
angle of attack pitot-static probe was designed and
manufactured at IAE as depicted in Figure 3. This probe
enables characterization of the aircraft reaction to gusts.
Unfortunately, the piston engine powered Specto airframe
proved to generate significant vibrations, which prevented
acquisition of high quality data. Therefore, special low-vibration
electric version of the aircraft was developed.
Figure 3 In-house developed angle of attack measurement
probe
VUT 701 ESPECTO
As described above, main motivation for this variation
of Specto aircraft was to develop a stable, low-vibration
platform for high quality flight measurement data acquisition.
Another benefit of the electric powered aircraft is its easier
integration with autopilot and decreased pre-flight preparation
complexity.
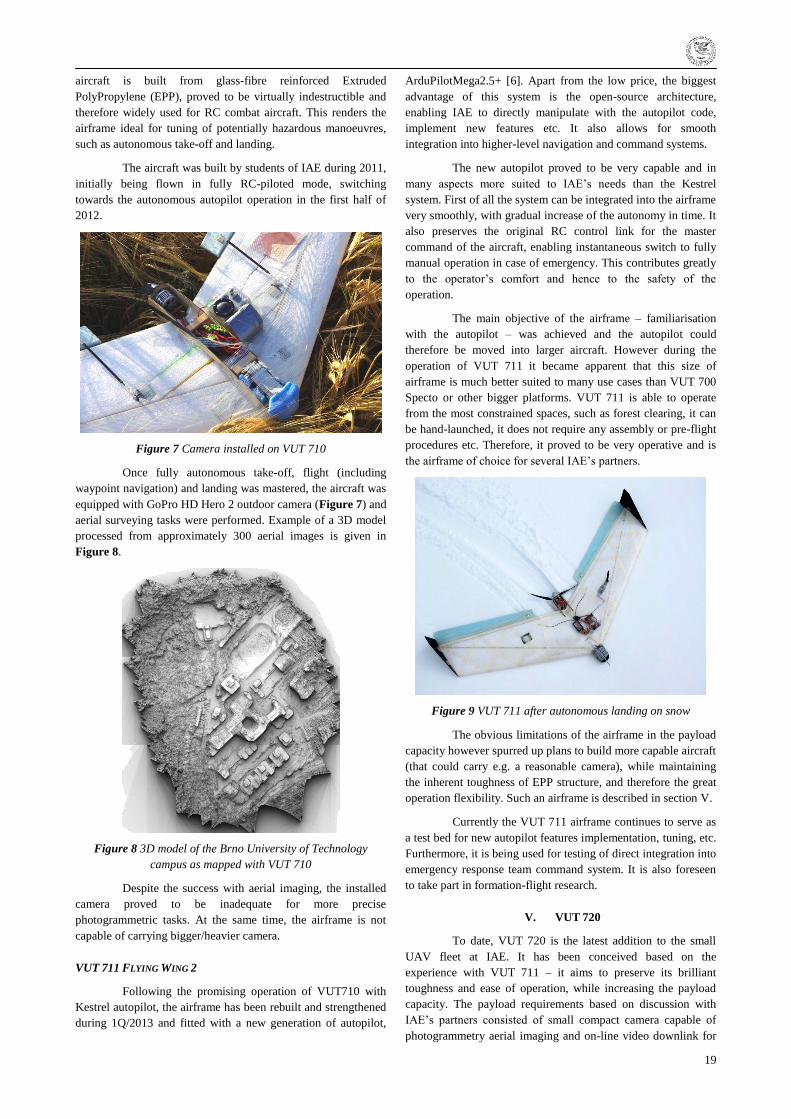
Again, the aircraft was completely designed and built
by IAE students during the 2011-2013 period. Consequently,
new generation of SEDAQ system was developed, featuring
100Hz sampling rate, enhanced sensor integration by means of
serial connection and increased Electromagnetic Compatibility.
The main SEDAQ data acquisition unit is depicted in Figure 4.
Figure 4 SEDAQ Main unit
Maiden flight took place at Czech Heaven model
airport near Ivancice on 14/04/2013. It was followed by a flight
measurement campaign, featuring both RC-piloted flights and
autopilot-stabilized flights. The autopilot selected for integration
was the ArduPilotMega 2.5+ [6], primarily for its readily
available 8 channels and ease of integration, which enables the
pilot to control certain channels manually, while having others
stabilized by autopilot. This feature proved very useful during
the measurements.
Subsequently, the flight data were processed and
dynamic model was created [35], identifying the airframe‘s
main handling properties and performance parameters. These
were fed into RC simulator (Figure 5), which enables quicker
adaption to the airframe for new pilots. Sample of the processed
data is given in Figure 6.
Figure 5 VUT 700 Specto model in RC simulator
Figure 6 Drag polar curve as evaluated from the dynamic
measurement
The aircraft is foreseen to be used for further tuning of
the autopilot PID loops, subsequently to be used for autonomous
flight validation for this category of aircraft in the coming
months. It is also ideal for tests of Sense and Avoid system,
Synthetic Aperture Radar, computer vision aided navigation and
other subsystems, being developed by IAE‘s partners.
New generation of Specto aircraft is also foreseen to
be developed, featuring streamlined fuselage to improve the
aerodynamic performance and enable operation from unpaved
runways by directly supporting catapult launch and skid landing.
IV. VUT 710 FLYING WING
Following the acquisition of Kestrel autopilot, it
became apparent that simple, cheap platform is needed to
familiarise with the new technology, without the risk of
destroying larger aircraft such as Specto. The autopilot
manufacturer offers tailless aircraft for this purpose [22], the
concept was therefore kept the same. The aircraft was built
based on commercially-available airframe [33], keeping the cost
of the whole setup under 200 EUR. This way, the aircraft itself
has much lower value than the autopilot itself. Furthermore, the
19
aircraft is built from glass-fibre reinforced Extruded
PolyPropylene (EPP), proved to be virtually indestructible and
therefore widely used for RC combat aircraft. This renders the
airframe ideal for tuning of potentially hazardous manoeuvres,
such as autonomous take-off and landing.
The aircraft was built by students of IAE during 2011,
initially being flown in fully RC-piloted mode, switching
towards the autonomous autopilot operation in the first half of
2012.
Figure 7 Camera installed on VUT 710
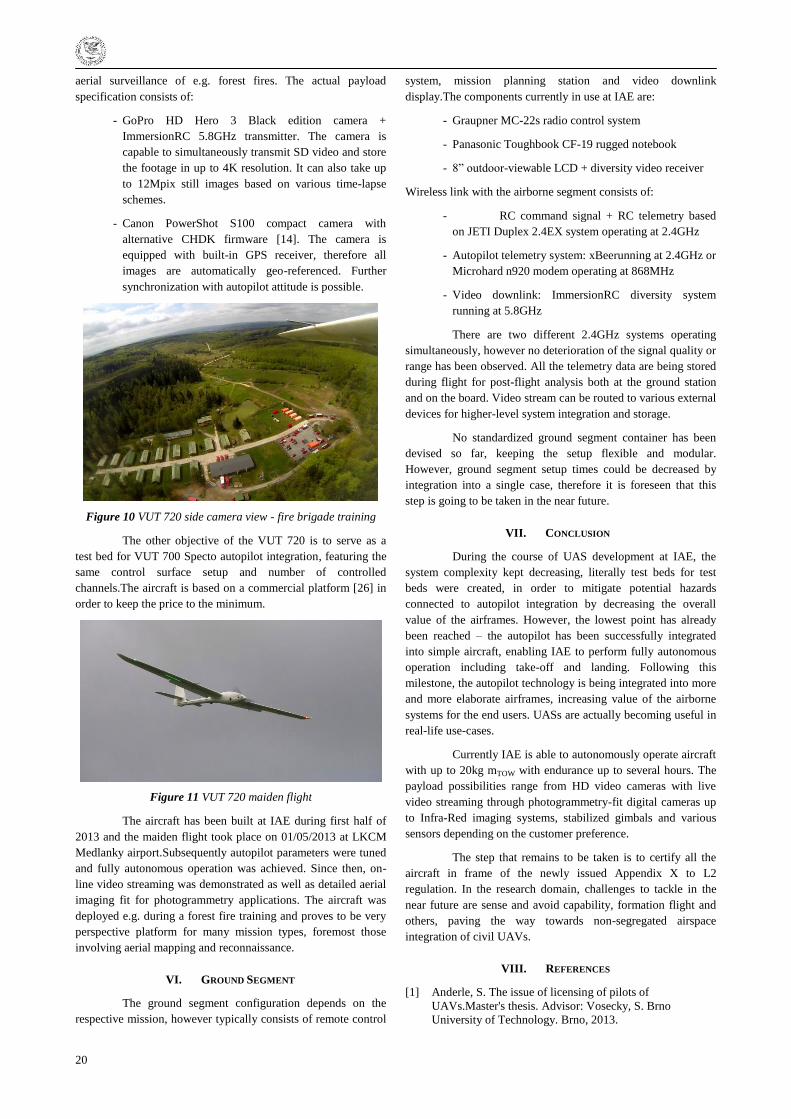
Once fully autonomous take-off, flight (including
waypoint navigation) and landing was mastered, the aircraft was
equipped with GoPro HD Hero 2 outdoor camera (Figure 7) and
aerial surveying tasks were performed. Example of a 3D model
processed from approximately 300 aerial images is given in
Figure 8.
Figure 8 3D model of the Brno University of Technology
campus as mapped with VUT 710
Despite the success with aerial imaging, the installed
camera proved to be inadequate for more precise
photogrammetric tasks. At the same time, the airframe is not
capable of carrying bigger/heavier camera.
VUT 711 FLYING WING 2
Following the promising operation of VUT710 with
Kestrel autopilot, the airframe has been rebuilt and strengthened
during 1Q/2013 and fitted with a new generation of autopilot,
ArduPilotMega2.5+ [6]. Apart from the low price, the biggest
advantage of this system is the open-source architecture,
enabling IAE to directly manipulate with the autopilot code,
implement new features etc. It also allows for smooth
integration into higher-level navigation and command systems.
The new autopilot proved to be very capable and in
many aspects more suited to IAE‘s needs than the Kestrel
system. First of all the system can be integrated into the airframe
very smoothly, with gradual increase of the autonomy in time. It
also preserves the original RC control link for the master
command of the aircraft, enabling instantaneous switch to fully
manual operation in case of emergency. This contributes greatly
to the operator‘s comfort and hence to the safety of the
operation.
The main objective of the airframe – familiarisation
with the autopilot – was achieved and the autopilot could
therefore be moved into larger aircraft. However during the
operation of VUT 711 it became apparent that this size of
airframe is much better suited to many use cases than VUT 700
Specto or other bigger platforms. VUT 711 is able to operate
from the most constrained spaces, such as forest clearing, it can
be hand-launched, it does not require any assembly or pre-flight
procedures etc. Therefore, it proved to be very operative and is
the airframe of choice for several IAE‘s partners.
Figure 9 VUT 711 after autonomous landing on snow
The obvious limitations of the airframe in the payload
capacity however spurred up plans to build more capable aircraft
(that could carry e.g. a reasonable camera), while maintaining
the inherent toughness of EPP structure, and therefore the great
operation flexibility. Such an airframe is described in section V.
Currently the VUT 711 airframe continues to serve as
a test bed for new autopilot features implementation, tuning, etc.
Furthermore, it is being used for testing of direct integration into
emergency response team command system. It is also foreseen
to take part in formation-flight research.
V. VUT 720
To date, VUT 720 is the latest addition to the small
UAV fleet at IAE. It has been conceived based on the
experience with VUT 711 – it aims to preserve its brilliant
toughness and ease of operation, while increasing the payload
capacity. The payload requirements based on discussion with
IAE‘s partners consisted of small compact camera capable of
photogrammetry aerial imaging and on-line video downlink for
20
aerial surveillance of e.g. forest fires. The actual payload
specification consists of:
- GoPro HD Hero 3 Black edition camera +
ImmersionRC 5.8GHz transmitter. The camera is
capable to simultaneously transmit SD video and store
the footage in up to 4K resolution. It can also take up
to 12Mpix still images based on various time-lapse
schemes.
- Canon PowerShot S100 compact camera with
alternative CHDK firmware [14]. The camera is
equipped with built-in GPS receiver, therefore all
images are automatically geo-referenced. Further
synchronization with autopilot attitude is possible.
Figure 10 VUT 720 side camera view - fire brigade training
The other objective of the VUT 720 is to serve as a
test bed for VUT 700 Specto autopilot integration, featuring the
same control surface setup and number of controlled
channels.The aircraft is based on a commercial platform [26] in
order to keep the price to the minimum.
Figure 11 VUT 720 maiden flight
The aircraft has been built at IAE during first half of
2013 and the maiden flight took place on 01/05/2013 at LKCM
Medlanky airport.Subsequently autopilot parameters were tuned
and fully autonomous operation was achieved. Since then, on-
line video streaming was demonstrated as well as detailed aerial
imaging fit for photogrammetry applications. The aircraft was
deployed e.g. during a forest fire training and proves to be very
perspective platform for many mission types, foremost those
involving aerial mapping and reconnaissance.
VI. GROUND SEGMENT
The ground segment configuration depends on the
respective mission, however typically consists of remote control
system, mission planning station and video downlink
display.The components currently in use at IAE are:
- Graupner MC-22s radio control system
- Panasonic Toughbook CF-19 rugged notebook
- 8‖ outdoor-viewable LCD + diversity video receiver
Wireless link with the airborne segment consists of:
- RC command signal + RC telemetry based
on JETI Duplex 2.4EX system operating at 2.4GHz
- Autopilot telemetry system: xBeerunning at 2.4GHz or
Microhard n920 modem operating at 868MHz
- Video downlink: ImmersionRC diversity system
running at 5.8GHz
There are two different 2.4GHz systems operating
simultaneously, however no deterioration of the signal quality or
range has been observed. All the telemetry data are being stored
during flight for post-flight analysis both at the ground station
and on the board. Video stream can be routed to various external
devices for higher-level system integration and storage.
No standardized ground segment container has been
devised so far, keeping the setup flexible and modular.
However, ground segment setup times could be decreased by
integration into a single case, therefore it is foreseen that this
step is going to be taken in the near future.
VII. CONCLUSION
During the course of UAS development at IAE, the
system complexity kept decreasing, literally test beds for test
beds were created, in order to mitigate potential hazards
connected to autopilot integration by decreasing the overall
value of the airframes. However, the lowest point has already
been reached – the autopilot has been successfully integrated
into simple aircraft, enabling IAE to perform fully autonomous
operation including take-off and landing. Following this
milestone, the autopilot technology is being integrated into more
and more elaborate airframes, increasing value of the airborne
systems for the end users. UASs are actually becoming useful in
real-life use-cases.
Currently IAE is able to autonomously operate aircraft
with up to 20kg mTOW with endurance up to several hours. The
payload possibilities range from HD video cameras with live
video streaming through photogrammetry-fit digital cameras up
to Infra-Red imaging systems, stabilized gimbals and various
sensors depending on the customer preference.
The step that remains to be taken is to certify all the
aircraft in frame of the newly issued Appendix X to L2
regulation. In the research domain, challenges to tackle in the
near future are sense and avoid capability, formation flight and
others, paving the way towards non-segregated airspace
integration of civil UAVs.
VIII. REFERENCES
[1] Anderle, S. The issue of licensing of pilots of
UAVs.Master's thesis. Advisor: Vosecky, S. Brno
University of Technology. Brno, 2013.

21
[2] Arazi, Z. UAV-NET: Civilian UAV thematic network:
technologies, applications, certification [online]. FP5-
Growth funded programme: project reference G4RT-CT-
2001-05053. Available from: http://www.uavnet.org/.
[3] Batelka, M. Utilizability of civil aircraft anti-collision
systems by unmanned aircraft. Master's thesis. Advisor:
Vosecky, S. Brno University of Technology. Brno, 2011.
[4] Bencalik, K. Design of the aircraft VUT 001 Marabu
modification powered by hydrogen fuel cells and batteries.
Master's thesis. Advisor: Hlinka, J. Brno University of
Technology. Brno, 2009.
[5] Cihlar, M. Analysis and comparison of technical -
operational parameters of aircrafts and UAVs used for
aerial works. Master's thesis. Advisor: Chlebek, J. Brno
University of Technology. Brno, 2011.
[6] DIY Drones. The APM 2.5 Board Overview [online].
Available from: http://code.google.com/p/ardupilot-
mega/wiki/APM25board.
[7] Doupnik, P., Urik, T., Kripal, L. Návrh, aerodynamická
optimalizace a výroba křídla pro malý bezpilotní
prostředek. FSI Junior konference 2007.Brno, 2008, pp.
43-50.
[8] Drahansky, M., Popela, R., Marvan, A. SEDAQ - Ústředna
pro sběr dat ze senzorů v UAV. Sborník příspěvků
9.mezinárodní vědecké konference MDS-PSL 2009. Brno,
2009, pp. 28-31.
[9] Dycka, J. Design of trainer aircraft with tandem seats.
Master's thesis. Advisor: Juracka, J. Brno University of
Technology. Brno, 2008.
[10] Haman, T. Summary of unmanned aerial vehicle.
Bachelor's thesis. Advisor: Dofek, I. Brno University of
Technology. Brno, 2010.
[11] Hlinka, J., Pistek, A. Development and Realization of
VUT 001 Marabu Aircraft for Experimental Verification
of UAV Systems. Sborník 1. Národní konference Civilní
bezpilotní systémy: Ústav letadlové techniky, ČVUT v
Praze, 2008, pp. 1-16.
[12] Hlinka, J., Pistek, A., Urik, T., Splichal, M. VUT 001
Marabu: Design philosophy and realization of an
experimental aircraft supporting UAV applications in civil
sector. Unmanned Air Vehicle Systems.Bristol, UK:
University of Bristol, 2009, pp. 37.11-37.11.
[13] Hlinka, J., Splichal, M., Finda, J. Equipment, systems and
installations for experimental aircraft supporting UAV
applications (VUT 001 MARABU). Light Weight
Unmanned Aerial Vehicle Systems and Subsystems
Proceedings. Ostende, Belgium, 2009, pp. 1-9.
[14] CHDK community. Canon Hack Development Kit Wiki
[online]. Available from:
http://chdk.wikia.com/wiki/CHDK.
[15] Kadidlo, M. Design of light unmanned reconnaissance
aircraft. Master's thesis. Advisor: Doupnik, P. Brno
University of Technology. Brno, 2010.
[16] Kanak, O. Conceptual study of light two-seater
surveillance aircraft. Master's thesis. Advisor: Popela, R.
Brno University of Technology. Brno, 2012.
[17] Kohoutek, J. Integration of unmanned air vehicles to
uncontrolled airspace. Master's thesis. Advisor: Vosecky,
S. Brno University of Technology. Brno, 2011.
[18] Kopecny, L., Zalud, L. Head tracking - sensors and test
bed requierements. In: Václavek, P. and Beneš, P., eds.
Workshop Perspektivní projekty vývoje řídicích a
senzorických technologií 2011. Brno: Vysoké učení
technické v Brně, Fakulta elektrotechniky a
komunikačních technologií, 2011, pp. 176-180.
[19] Kostial, R. Design of hydrogen pressure tank installation
on the VUT 001 Marabu wing. Master's thesis. Advisor:
Pistek, A. Brno University of Technology. Brno, 2010.
[20] Krejci, J. Summary of micro unmanned aerial vehicle.
Bachelor's thesis. Advisor: Dofek, I. Brno University of
Technology. Brno, 2012.
[21] Lockeed Martin Procerus Technologies. Kestrel Flight
Systems [online]. Available from:
http://www.lockheedmartin.com/us/products/procerus/kest
rel.html.
[22] Lockeed Martin Procerus Technologies. UAV Test
Platforms [online]. EPP foam Unicorn wing. Available
from:
http://www.lockheedmartin.com/content/dam/lockheed/dat
a/ms2/documents/procerus/UAV_Platform_04_18_2008.p
df.
[23] Maresova, E. Stability and manoeuvrability of
experimental aircraft VUT 001 Marabu. Master's thesis.
Advisor: Kouril, M. Brno University of Technology. Brno,
2009.
[24] Matejak, V. Design VUT 022 aircraft with jet engine
according to CS-22 regulation. Master's thesis. Advisor:
Juracka, J. Brno University of Technology. Brno, 2009.
[25] Ministry of Defence. History: Sojka III [online].
Decommissioned in December 2011. Available from:
http://www.army.cz/scripts/detail.php?id=6312.
[26] Multiplex. Cularis [online]. Available from:
http://www.multiplexusa.com/model-kits/cularis.html.
[27] Pejchar, J. Small UAV parachute recovery system design.
Master's thesis. Advisor: Popela, R. Brno University of
Technology. Brno, 2011.
[28] Pistek, A., Hlinka, J. Design philosophy and realization of
VUT 001 Marabu experimental aircraft and its influence
on education of students in aerospace engineering. Read
2010 Proceedings Research Bulletin. Warszaw, Poland,
2010, pp. 1-11.
[29] Pistek, A., Hlinka, J. VUT 001 Marabu: Universal
Experimental Aircraft. In: Grant, I., ed. ICAS 2010: 27th
Congress of the International Council of the Aeronautical
Sciences. Edinburgh: Optimage, 2010.
[30] Prokop, V. Design of amphibia airdraft based on VUT 001
Marabu. Masters's thesis. Advisor: Pistek, A. Brno
University of Technology. Brno, 2012.
[31] Splichal, M. Integration of unmanned vehicles into non
segregated airspace, requirements of airborne equipment.
Nové trendy v civilním letectví 2009.Brno: CERM, 2009,
pp. 103-112.
[32] Splichal, M., Finda, J. Design and equipment of VUT 001
Marabu unmanned aerial vehicle for operation in non-
segregated airspace. Aviation.2010, (14), 24-32.
[33] Telink. Tornado XX [online] [viewed 3 June 2013, 12:00].
Available from: http://www.telink.eu/cz-detail-99899-
tornado-xx.html.
[34] Tretina, K. History of UAV development in Brno. Private
communication. 31 May 2013, 12:00.
[35] Zikmund, P. Aerodynamic Characteristics Identification of
Atmospheric Airplane from Flight Measurement Results.
PhD thesis. Advisor: Danek, V. Brno University of
Technology. Brno, 2013.
[36] Zikmund, P., Doupnik, P. VUT „SPECTO― Mini-UAV
Aerodynamic Design. Czech Aerospace Proceedings.2008,
17-19.
22
FREE-FORM DEFORMATION PARAMETERIZATION FOR
AERODYNAMIC SHAPE OPTIMIZATION
Jiří Hradil
Institute of Aerospace Engineering, Brno University of Technology, Czech Republic
(free line)
Jan Navrátil
Institute of Aerospace Engineering, Brno University of Technology, Czech Republic
(free line) (For the next author use the same style as for author 2)
Abstract –An Activity in the European project CEDESA focused
on aerodynamic shape optimization in the context of aircraft
design is the main subject of cooperation between Swedish
defense research institute FOI and Brno University of
Technology. We present here developed optimization procedure
consisting of Free-Form Deformation parameterization method
and gradient-based optimization algorithms,tested in
aerodynamic shape optimization of transonic swept wing.
(free line)
Key words – FFD, Aerodynamic shape optimization, CFD,
gradient-based, adjoint.
(free line)
I. INTRODUCTION
Current global situation highlight the role of the
optimization procedures. The competition on the markets forces
the manufacturers to accelerate the design phase of new
products. It will be very hard if not impossible to fulfil the rising
demands on development and operational cost reductions
without the help of modern optimization tools. That is especially
true in the aircraft industry, where is the use of modern
optimizations tools becoming standard.
One of the key steps in optimization process is
parameterization of the geometry. Parameterization defines
possible object shapes and shape changes by a set of parameters
which are used as design variables during the optimization
process. The number of optimization parameters has major
influence on the computational time cost. It is crucial to have
suitable parameterization for each specific task. Wrong
parameterization can slow down the optimization process or
even prevent the optimization algorithm from finding the
optimum solution, since the parameterization could not be able
to generate optimum shape. FFD parameterization method was
chosen to deal with all of these problems.
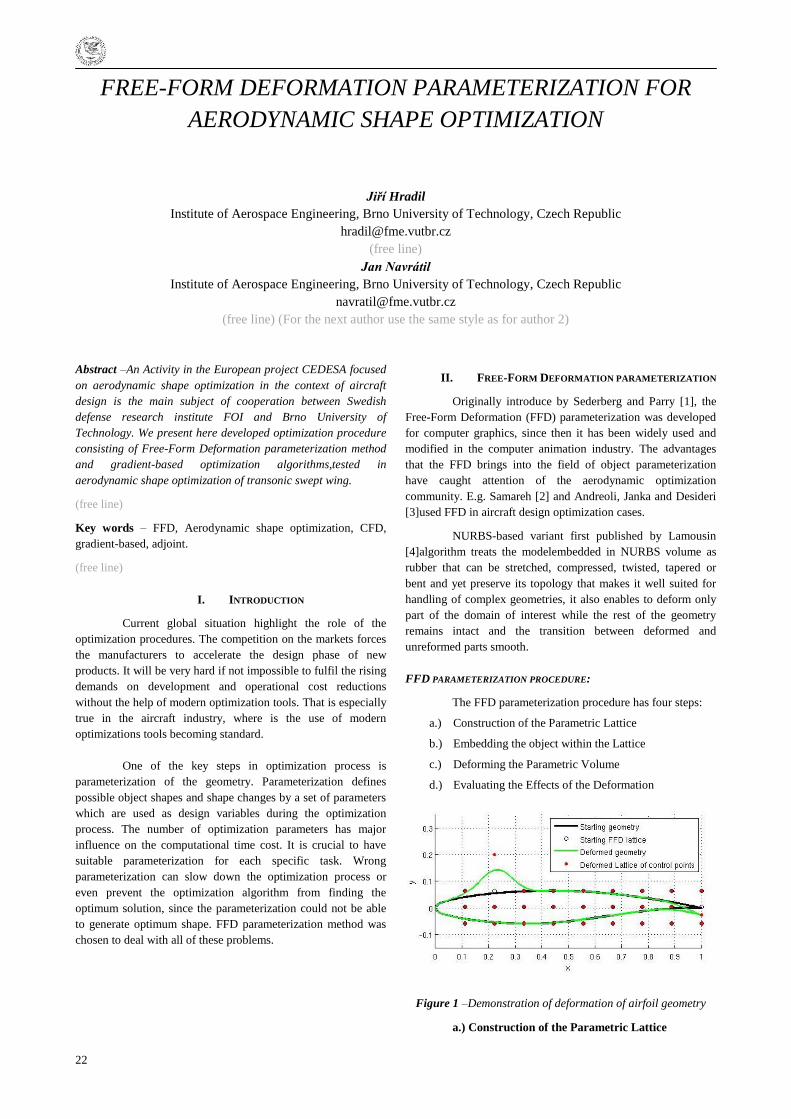
II. FREE-FORM DEFORMATION PARAMETERIZATION
Originally introduce by Sederberg and Parry [1], the
Free-Form Deformation (FFD) parameterization was developed
for computer graphics, since then it has been widely used and
modified in the computer animation industry. The advantages
that the FFD brings into the field of object parameterization
have caught attention of the aerodynamic optimization
community. E.g. Samareh [2] and Andreoli, Janka and Desideri
[3]used FFD in aircraft design optimization cases.
NURBS-based variant first published by Lamousin
[4]algorithm treats the modelembedded in NURBS volume as
rubber that can be stretched, compressed, twisted, tapered or
bent and yet preserve its topology that makes it well suited for
handling of complex geometries, it also enables to deform only
part of the domain of interest while the rest of the geometry
remains intact and the transition between deformed and
unreformed parts smooth.
FFD PARAMETERIZATION PROCEDURE:
The FFD parameterization procedure has four steps:
a.) Construction of the Parametric Lattice
b.) Embedding the object within the Lattice
c.) Deforming the Parametric Volume
d.) Evaluating the Effects of the Deformation
Figure 1 –Demonstration of deformation of airfoil geometry
a.) Construction of the Parametric Lattice
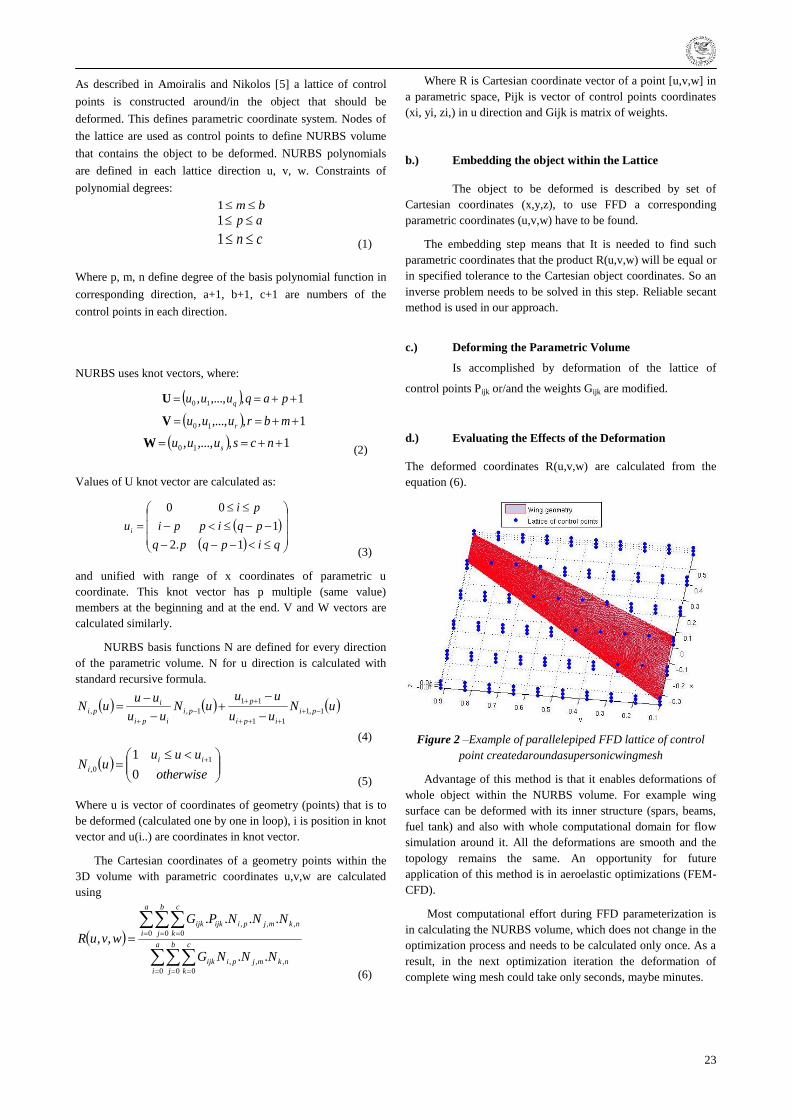
23
As described in Amoiralis and Nikolos [5] a lattice of control
points is constructed around/in the object that should be
deformed. This defines parametric coordinate system. Nodes of
the lattice are used as control points to define NURBS volume
that contains the object to be deformed. NURBS polynomials
are defined in each lattice direction u, v, w. Constraints of
polynomial degrees:
bm 1 ap 1
cn 1 (1)
Where p, m, n define degree of the basis polynomial function in
corresponding direction, a+1, b+1, c+1 are numbers of the
control points in each direction.
NURBS uses knot vectors, where:
1,,...,, 10 paquuu qU
1,,...,, 10 mbruuu rV
1,,...,, 10 ncsuuu sW (2)
Values of U knot vector are calculated as:
qipqpq
pqippi
pi
ui
1.2
1
00
(3)
and unified with range of x coordinates of parametric u
coordinate. This knot vector has p multiple (same value)
members at the beginning and at the end. V and W vectors are
calculated similarly.
NURBS basis functions N are defined for every direction
of the parametric volume. N for u direction is calculated with
standard recursive formula.
uNuu
uuuN
uu
uuuN pi
ipi
p
pi
ipi
ipi 1,1
11
11
1,,
(4)
otherwise
uuuuN
ii
i0
1 1
0,
(5)
Where u is vector of coordinates of geometry (points) that is to
be deformed (calculated one by one in loop), i is position in knot
vector and u(i..) are coordinates in knot vector.
The Cartesian coordinates of a geometry points within the
3D volume with parametric coordinates u,v,w are calculated
using
a
i
b
j
c
k
nkmjpiijk
a
i
b
j
c
k
nkmjpiijkijk
NNNG
NNNPG
wvuR
0 0 0
,,,
0 0 0
,,,
..
....
,,
(6)
Where R is Cartesian coordinate vector of a point [u,v,w] in
a parametric space, Pijk is vector of control points coordinates
(xi, yi, zi,) in u direction and Gijk is matrix of weights.
b.) Embedding the object within the Lattice
The object to be deformed is described by set of
Cartesian coordinates (x,y,z), to use FFD a corresponding
parametric coordinates (u,v,w) have to be found.
The embedding step means that It is needed to find such
parametric coordinates that the product R(u,v,w) will be equal or
in specified tolerance to the Cartesian object coordinates. So an
inverse problem needs to be solved in this step. Reliable secant
method is used in our approach.
c.) Deforming the Parametric Volume
Is accomplished by deformation of the lattice of
control points Pijk or/and the weights Gijk are modified.
d.) Evaluating the Effects of the Deformation
The deformed coordinates R(u,v,w) are calculated from the
equation (6).
Figure 2 –Example of parallelepiped FFD lattice of control
point createdaroundasupersonicwingmesh
Advantage of this method is that it enables deformations of
whole object within the NURBS volume. For example wing
surface can be deformed with its inner structure (spars, beams,
fuel tank) and also with whole computational domain for flow
simulation around it. All the deformations are smooth and the
topology remains the same. An opportunity for future
application of this method is in aeroelastic optimizations (FEM-
CFD).
Most computational effort during FFD parameterization is
in calculating the NURBS volume, which does not change in the
optimization process and needs to be calculated only once. As a
result, in the next optimization iteration the deformation of
complete wing mesh could take only seconds, maybe minutes.
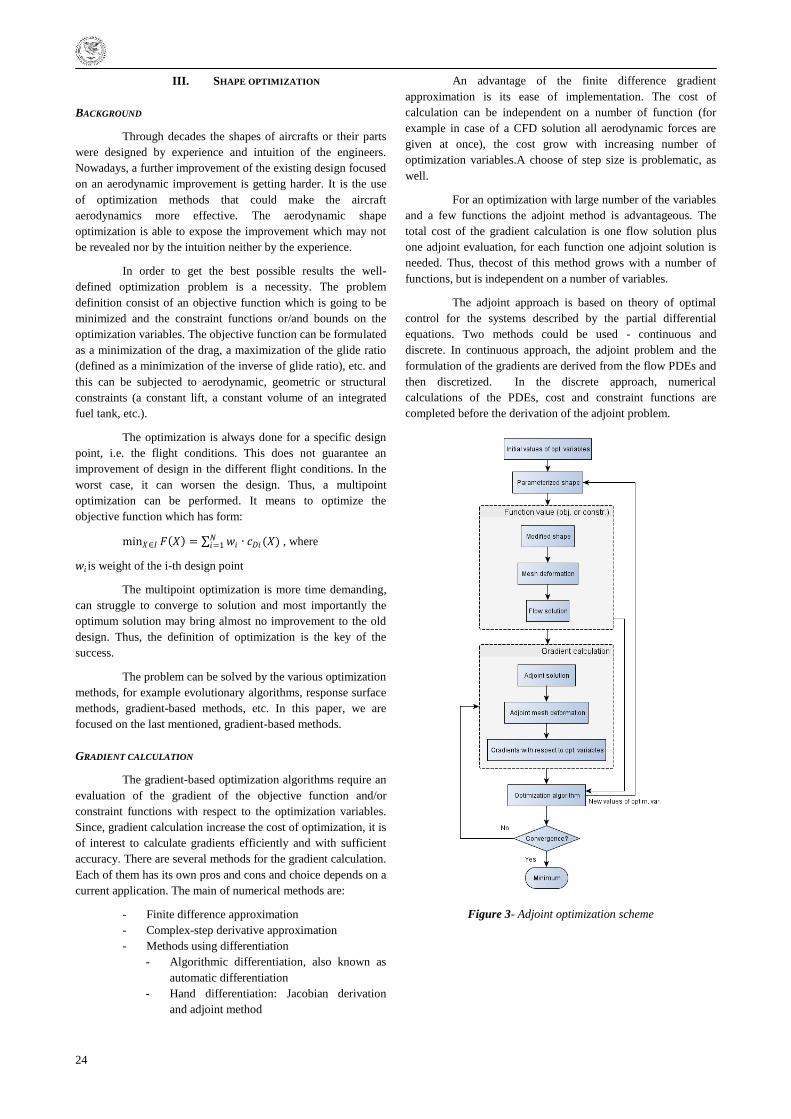
24
III. SHAPE OPTIMIZATION
BACKGROUND
Through decades the shapes of aircrafts or their parts
were designed by experience and intuition of the engineers.
Nowadays, a further improvement of the existing design focused
on an aerodynamic improvement is getting harder. It is the use
of optimization methods that could make the aircraft
aerodynamics more effective. The aerodynamic shape
optimization is able to expose the improvement which may not
be revealed nor by the intuition neither by the experience.
In order to get the best possible results the well-
defined optimization problem is a necessity. The problem
definition consist of an objective function which is going to be
minimized and the constraint functions or/and bounds on the
optimization variables. The objective function can be formulated
as a minimization of the drag, a maximization of the glide ratio
(defined as a minimization of the inverse of glide ratio), etc. and
this can be subjected to aerodynamic, geometric or structural
constraints (a constant lift, a constant volume of an integrated
fuel tank, etc.).
The optimization is always done for a specific design
point, i.e. the flight conditions. This does not guarantee an
improvement of design in the different flight conditions. In the
worst case, it can worsen the design. Thus, a multipoint
optimization can be performed. It means to optimize the
objective function which has form:
min𝑋∈𝐼 𝐹 𝑋 = 𝑤𝑖 ∙ 𝑐𝐷𝑖(𝑋)𝑁𝑖=1 , where
𝑤𝑖 is weight of the i-th design point
The multipoint optimization is more time demanding,
can struggle to converge to solution and most importantly the
optimum solution may bring almost no improvement to the old
design. Thus, the definition of optimization is the key of the
success.
The problem can be solved by the various optimization
methods, for example evolutionary algorithms, response surface
methods, gradient-based methods, etc. In this paper, we are
focused on the last mentioned, gradient-based methods.
GRADIENT CALCULATION
The gradient-based optimization algorithms require an
evaluation of the gradient of the objective function and/or
constraint functions with respect to the optimization variables.
Since, gradient calculation increase the cost of optimization, it is
of interest to calculate gradients efficiently and with sufficient
accuracy. There are several methods for the gradient calculation.
Each of them has its own pros and cons and choice depends on a
current application. The main of numerical methods are:
- Finite difference approximation
- Complex-step derivative approximation
- Methods using differentiation
- Algorithmic differentiation, also known as
automatic differentiation
- Hand differentiation: Jacobian derivation
and adjoint method
An advantage of the finite difference gradient
approximation is its ease of implementation. The cost of
calculation can be independent on a number of function (for
example in case of a CFD solution all aerodynamic forces are
given at once), the cost grow with increasing number of
optimization variables.A choose of step size is problematic, as
well.
For an optimization with large number of the variables
and a few functions the adjoint method is advantageous. The
total cost of the gradient calculation is one flow solution plus
one adjoint evaluation, for each function one adjoint solution is
needed. Thus, thecost of this method grows with a number of
functions, but is independent on a number of variables.
The adjoint approach is based on theory of optimal
control for the systems described by the partial differential
equations. Two methods could be used - continuous and
discrete. In continuous approach, the adjoint problem and the
formulation of the gradients are derived from the flow PDEs and
then discretized. In the discrete approach, numerical
calculations of the PDEs, cost and constraint functions are
completed before the derivation of the adjoint problem.
Figure 3- Adjoint optimization scheme
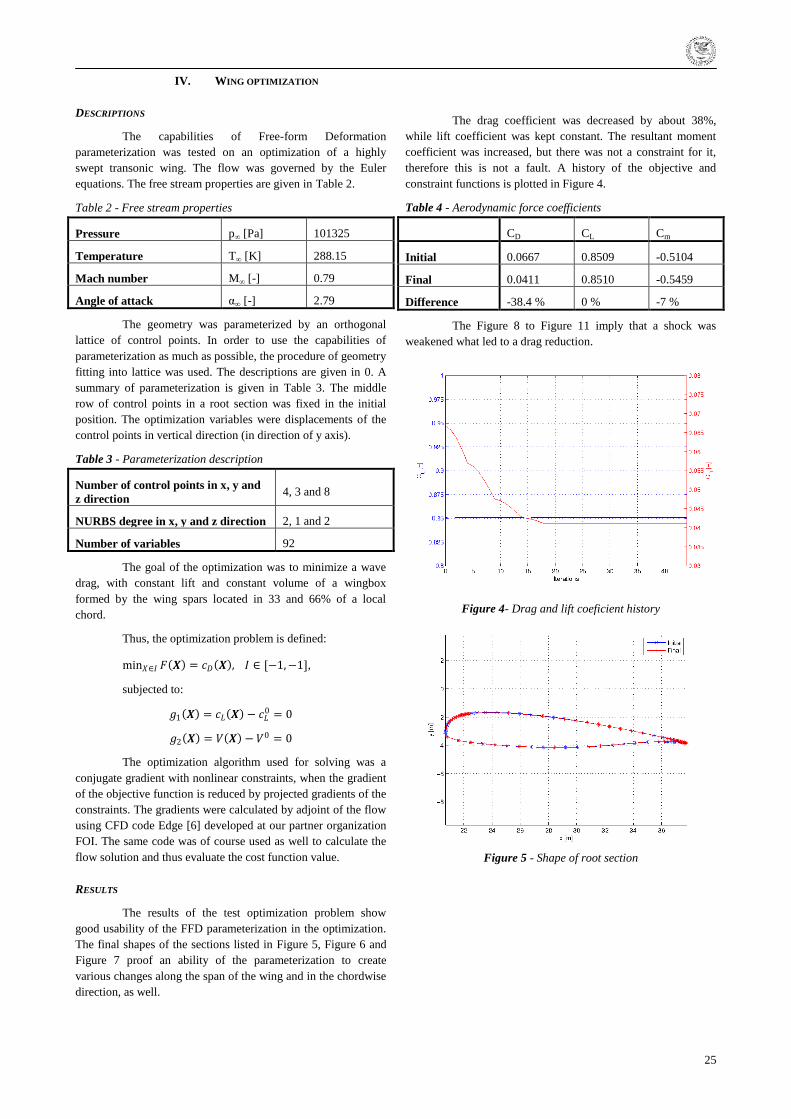
25
IV. WING OPTIMIZATION
DESCRIPTIONS
The capabilities of Free-form Deformation
parameterization was tested on an optimization of a highly
swept transonic wing. The flow was governed by the Euler
equations. The free stream properties are given in Table 2.
Table 2 - Free stream properties
Pressure p∞ [Pa] 101325
Temperature T∞ [K] 288.15
Mach number M∞ [-] 0.79
Angle of attack α∞ [-] 2.79
The geometry was parameterized by an orthogonal
lattice of control points. In order to use the capabilities of
parameterization as much as possible, the procedure of geometry
fitting into lattice was used. The descriptions are given in 0. A
summary of parameterization is given in Table 3. The middle
row of control points in a root section was fixed in the initial
position. The optimization variables were displacements of the
control points in vertical direction (in direction of y axis).
Table 3 - Parameterization description
Number of control points in x, y and
z direction 4, 3 and 8
NURBS degree in x, y and z direction 2, 1 and 2
Number of variables 92
The goal of the optimization was to minimize a wave
drag, with constant lift and constant volume of a wingbox
formed by the wing spars located in 33 and 66% of a local
chord.
Thus, the optimization problem is defined:
min𝑋∈𝐼 𝐹 𝑿 = 𝑐𝐷 𝑿 , 𝐼 ∈ [−1,−1],
subjected to:
𝑔1 𝑿 = 𝑐𝐿 𝑿 − 𝑐𝐿0 = 0
𝑔2 𝑿 = 𝑉 𝑿 − 𝑉0 = 0
The optimization algorithm used for solving was a
conjugate gradient with nonlinear constraints, when the gradient
of the objective function is reduced by projected gradients of the
constraints. The gradients were calculated by adjoint of the flow
using CFD code Edge [6] developed at our partner organization
FOI. The same code was of course used as well to calculate the
flow solution and thus evaluate the cost function value.
RESULTS
The results of the test optimization problem show
good usability of the FFD parameterization in the optimization.
The final shapes of the sections listed in Figure 5, Figure 6 and
Figure 7 proof an ability of the parameterization to create
various changes along the span of the wing and in the chordwise
direction, as well.
The drag coefficient was decreased by about 38%,
while lift coefficient was kept constant. The resultant moment
coefficient was increased, but there was not a constraint for it,
therefore this is not a fault. A history of the objective and
constraint functions is plotted in Figure 4.
Table 4 - Aerodynamic force coefficients
CD CL Cm
Initial 0.0667 0.8509 -0.5104
Final 0.0411 0.8510 -0.5459
Difference -38.4 % 0 % -7 %
The Figure 8 to Figure 11 imply that a shock was
weakened what led to a drag reduction.
Figure 4- Drag and lift coeficient history
Figure 5 - Shape of root section
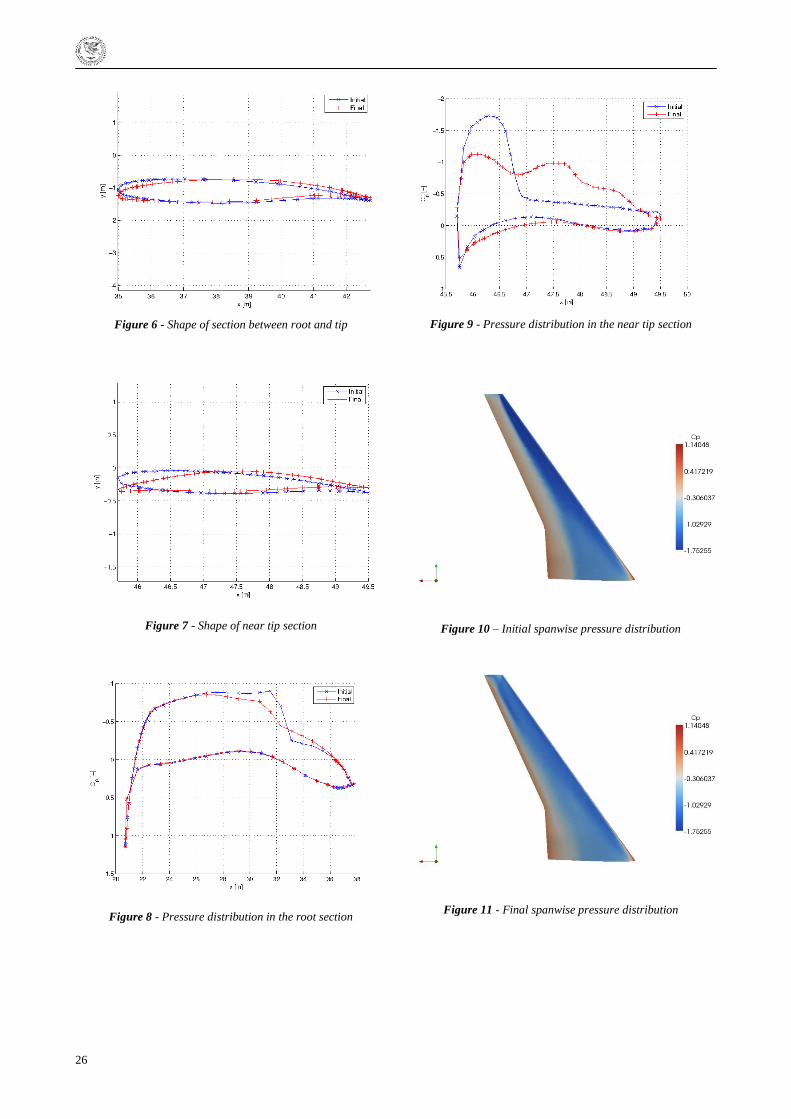
26
Figure 6 - Shape of section between root and tip
Figure 7 - Shape of near tip section
Figure 8 - Pressure distribution in the root section
Figure 9 - Pressure distribution in the near tip section
Figure 10 – Initial spanwise pressure distribution
Figure 11 - Final spanwise pressure distribution

27
V. CONCLUSION
Developed optimization procedures proved to be
useful in practical aerodynamic shape optimization tasks. The
FFD parameterization is well suited of handling the geometry
and in the combination with gradient-based optimization method
capable of generating interesting improvements in aerodynamic
design.
Further investigation of FFD parameterization and its
modifications is currently being carried out in order to enable
adaptivity of the FFD lattice of control points to the complex
aircraft geometry.
REFERENCES
[1] Sederberg T. W., and Parry S. R., Free-Form Deformation
of Solid Geometric Models. ACM 0-89791-196-
2/86/008/015,1986.
[2] Samareh J. A., Aerodynamic Shape Optimization Based on
Free-Form Deformation. AIAA paper 2004-4630, 2004.
[3] Andreoli M., Janka A., and Desideri J-A., Free-form-
deformation parameterization for multilevel 3D shape
optimization in aerodynamics. INRIA Rapport de
recherche no 5019, 2003.
[4] Lamousin H. J., and Waggenspack W. N., NURBS-Based
Free-Form Deformations. IEEE Computer Graphics and
Applications, Vol. 14, No. 6, 95-108, 1994
[5] Amoiralis E. I., and Nikolos I. K., Freeform Deformation
Versus B-Spline Representation in Inverse Airfoil Design.
Journal of Computing and Information Science in
Engineering. 2008.
[6] Eliasson P., Edge, ANavier-Stokes Solver, for Unstructured
Grids. Tech. Rep. FOI-R-0298-SE, Swedish Defence
Agency, Stockholm, 2001
28
HUMAN FACTOR AND ITS ROLE WITHIN GROUND
HANDLING SAFETY ISSUES
Ing.Martin Hromádka
Air Transport Department, University of Zilina
Abstract – As the traffic is constantly growing, apron safety is a
very important and actual topic these days. Ground handling
accidents cause huge losses of few billions to the airlines all
over the world each year. However, most of these accidents are
caused by human errors and it can be very easy to prevent them.
The article provides the human factor questionnaire results
which were collected from seven different ground handling
companies in Netherlands. Moreover, it brings the safety
regulations overview.
Key words – safety, human factor, airports, case study.
I. INTRODUCTION
In the area of commercial aviation worldwide, airlines
suffer high costs from damage resulting from ground-related
occurrences. The Flight Safety Foundation (FSF) provided a
report stating that 7 500 000 000 EUR a year are being spent
because of ground accidents all over the world and these
numbers are increasing every year. Apart from the economic
consequences, increased safety risks are also of concern to the
personnel involved.
Most of the errors are caused by human factor. It is a
common knowledge that human factors may negatively
influence the performance of operational personnel at work.
Also, it is proved that proper attention to human factors can
positively influence behaviour of personnel at work. This is
considered as the manifestation of an organization‘s safety
culture. In a positive safety culture, the human factors are
acknowledged and training is provided in order to manage these
human factors and preserve the safe organizational environment.
Safety culture of a group is the set of enduring values
and attitudes regarding safety issues, share among the members
of the group. It refers to the extent to which the members of the
group are positively committed to safety; consistently evaluate
safety related behaviour; are willing to communicate safety
issues; are willing and able to adopt themselves when facing
safety issues; and are continuously behaving so as to preserve
and enhance safety.
II. GROUND HANDLING SAFETY REGULATIONS
First off, it is necessary to get to know with the
regulatory framework of ground handling activities. There are
various organizations creating this framework, hence there is
wide bunch of the rules to be followed. In this section, the
overview will be presented.
It is natural that safe operation during ground handling
is desired by all parties involved. This is why the international
ground handling regulations were introduced to aviation.
However, these regulations are devoted just to airports and
operators.
Ground operators are partially responsible for safe
operation since JAR-OPS 1 regulations were established.
According to that regulation procedures for ground handling
staff were created and ground staffs have to be trained that no
person will endanger the operation. Also each operator has to
nominate a person who will be responsible for safety
management and supervision of ground procedures. Other
practices like flight safety programme, incident reporting system
and accident prevention required by JAR-OPS 1 are more
specifically described for some procedures like fuelling,
pushback, towing and loading of the aircraft. JAR-OPS 1
regulations have to be signed by all operators responsible for
handling aircraft and contract arrangements should include
training of ground staff as well.
Airports, on the other hand, are also partially
responsible for safe operation during ground handling as is
stated in International Civil Aviation Organization (ICAO)
Annex 14. This annex mainly concerns airport facilities but
some operation procedures for ground handlers like driving on
the apron are included. An overlap with JAR-OPS1 and Annex
14 is in procedures for fuelling while passengers are still on
board of an aircraft.
ICAO Annex 14 – 1.4 requires states to evaluate and
certify airports that are used for international operation
according to the requirements of this Annex from 27th of
November 2003. According to the Regeling Toezicht Luchtvaart
(RTL - Aviation Supervision Regulations) in Netherlands RTL -
Aviation Supervision Regulations is this certification done on a
voluntary basis. Schiphol Airport was initially certified by RTL
in 2004 and later in 2007 this certificate was extended for
another three years.
Apron operators and safety regulators list can be seen
in Table 1 (next page).
29
Table 1 – Apron operators and regulators [Source: ACRP, Ramp Safety Practices]
Organization Shortcut Standards Description
Air Charter Safety
Foundation ASCF ACSF Industry Audit Standard
Operator Documents
Provides safety standards for ground
handling and services
Air Transport Association ATA Recommended Guidelines for
Preventing and Investigating Aircraft
Ground Damage
Multiple documents including safety of
ramp operation
Airport Council
International ACI Airside Safety Handbook and Apron
Markings and Signs Handbook
Set of guidelines for safety and markings
managers
Australian Aviation Ground
Safety Council AAGSC Ground safety practices and training
material
Computer and video resources for
standard practices of apron safety
Boeing Boeing Ramp Error Decision Aid (REDA)
Users Guide
Structured process used to investigate
errors made by ramp personnel
Civil Aviation Authority CAA CAP 642 Airside Safety
Management
U.K. ramp operation and practices
including risk analysis
Flight Safety Foundation FSF Ground Accident Prevention
e-tools on apron operation and practices
International Air Transport
Association IATA
IATA Safety Audit for Ground
Operators (ISAGO) Airport Handling
Manual (AHM
Field publication containing industry
standards and procedures safety
International Civil Aviation
Organization ICAO Annexes Safety Management Manual
(SMM)
Annex 14 - Aerodrome operation and
Annex 13 - Investigation
National Air Transport
Association NATA
Safety 1st and Fueling Training programs material and best
management practices to enhance safety
Occupational Safety and
Health Administration
Voluntary Protection
Program
OSHA
VPP Safety management Program
Performance based criteria for managed
safety and health system
U.S. National Safety
Council NSC Aviation Ground Operations Safety
Handbook
The handbook set with four guidelines
for safety of ground operation
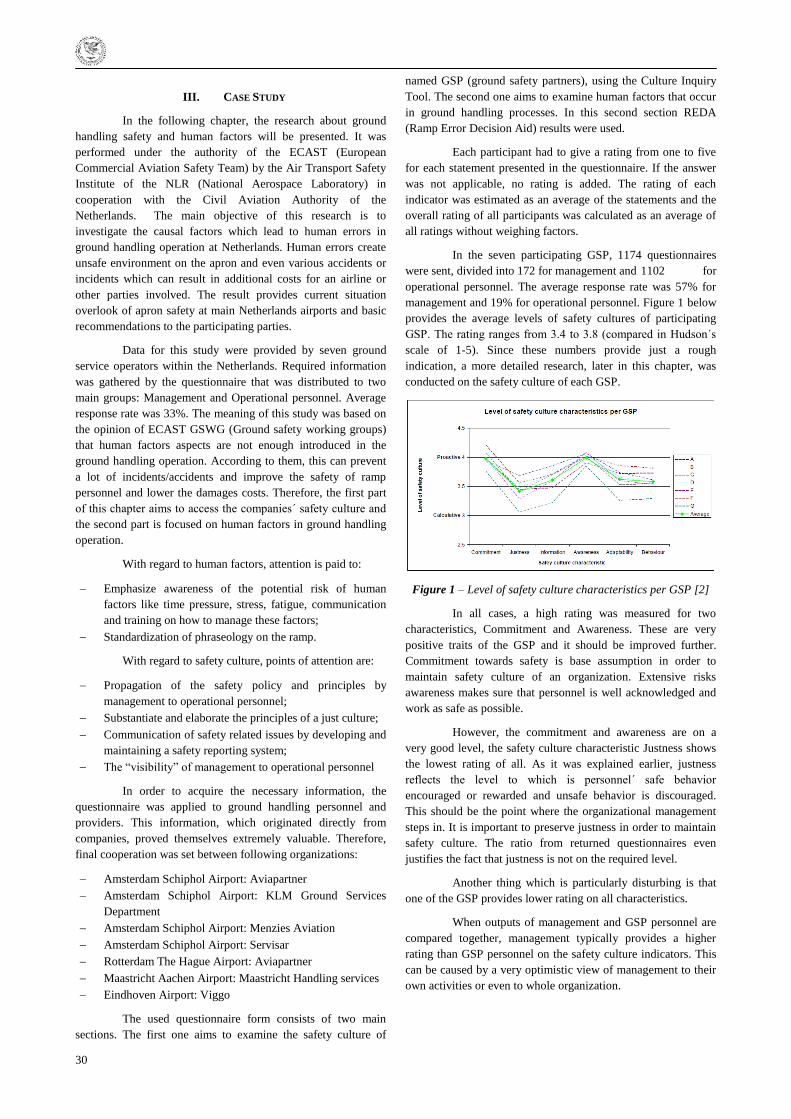
30
III. CASE STUDY
In the following chapter, the research about ground
handling safety and human factors will be presented. It was
performed under the authority of the ECAST (European
Commercial Aviation Safety Team) by the Air Transport Safety
Institute of the NLR (National Aerospace Laboratory) in
cooperation with the Civil Aviation Authority of the
Netherlands. The main objective of this research is to
investigate the causal factors which lead to human errors in
ground handling operation at Netherlands. Human errors create
unsafe environment on the apron and even various accidents or
incidents which can result in additional costs for an airline or
other parties involved. The result provides current situation
overlook of apron safety at main Netherlands airports and basic
recommendations to the participating parties.
Data for this study were provided by seven ground
service operators within the Netherlands. Required information
was gathered by the questionnaire that was distributed to two
main groups: Management and Operational personnel. Average
response rate was 33%. The meaning of this study was based on
the opinion of ECAST GSWG (Ground safety working groups)
that human factors aspects are not enough introduced in the
ground handling operation. According to them, this can prevent
a lot of incidents/accidents and improve the safety of ramp
personnel and lower the damages costs. Therefore, the first part
of this chapter aims to access the companies´ safety culture and
the second part is focused on human factors in ground handling
operation.
With regard to human factors, attention is paid to:
Emphasize awareness of the potential risk of human
factors like time pressure, stress, fatigue, communication
and training on how to manage these factors;
Standardization of phraseology on the ramp.
With regard to safety culture, points of attention are:
Propagation of the safety policy and principles by
management to operational personnel;
Substantiate and elaborate the principles of a just culture;
Communication of safety related issues by developing and
maintaining a safety reporting system;
The ―visibility‖ of management to operational personnel
In order to acquire the necessary information, the
questionnaire was applied to ground handling personnel and
providers. This information, which originated directly from
companies, proved themselves extremely valuable. Therefore,
final cooperation was set between following organizations:
Amsterdam Schiphol Airport: Aviapartner
Amsterdam Schiphol Airport: KLM Ground Services
Department
Amsterdam Schiphol Airport: Menzies Aviation
Amsterdam Schiphol Airport: Servisar
Rotterdam The Hague Airport: Aviapartner
Maastricht Aachen Airport: Maastricht Handling services
Eindhoven Airport: Viggo
The used questionnaire form consists of two main
sections. The first one aims to examine the safety culture of
named GSP (ground safety partners), using the Culture Inquiry
Tool. The second one aims to examine human factors that occur
in ground handling processes. In this second section REDA
(Ramp Error Decision Aid) results were used.
Each participant had to give a rating from one to five
for each statement presented in the questionnaire. If the answer
was not applicable, no rating is added. The rating of each
indicator was estimated as an average of the statements and the
overall rating of all participants was calculated as an average of
all ratings without weighing factors.
In the seven participating GSP, 1174 questionnaires
were sent, divided into 172 for management and 1102 for
operational personnel. The average response rate was 57% for
management and 19% for operational personnel. Figure 1 below
provides the average levels of safety cultures of participating
GSP. The rating ranges from 3.4 to 3.8 (compared in Hudson´s
scale of 1-5). Since these numbers provide just a rough
indication, a more detailed research, later in this chapter, was
conducted on the safety culture of each GSP.
Figure 1 – Level of safety culture characteristics per GSP [2]
In all cases, a high rating was measured for two
characteristics, Commitment and Awareness. These are very
positive traits of the GSP and it should be improved further.
Commitment towards safety is base assumption in order to
maintain safety culture of an organization. Extensive risks
awareness makes sure that personnel is well acknowledged and
work as safe as possible.
However, the commitment and awareness are on a
very good level, the safety culture characteristic Justness shows
the lowest rating of all. As it was explained earlier, justness
reflects the level to which is personnel´ safe behavior
encouraged or rewarded and unsafe behavior is discouraged.
This should be the point where the organizational management
steps in. It is important to preserve justness in order to maintain
safety culture. The ratio from returned questionnaires even
justifies the fact that justness is not on the required level.
Another thing which is particularly disturbing is that
one of the GSP provides lower rating on all characteristics.
When outputs of management and GSP personnel are
compared together, management typically provides a higher
rating than GSP personnel on the safety culture indicators. This
can be caused by a very optimistic view of management to their
own activities or even to whole organization.
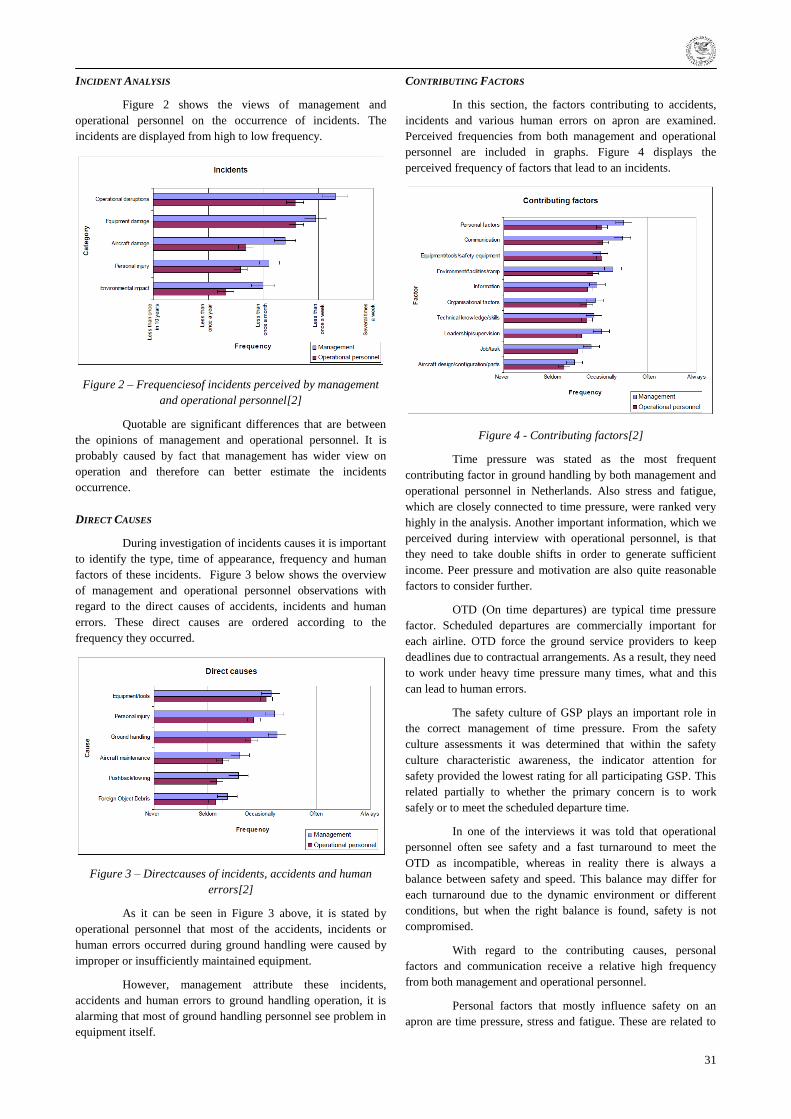
31
INCIDENT ANALYSIS
Figure 2 shows the views of management and
operational personnel on the occurrence of incidents. The
incidents are displayed from high to low frequency.
Figure 2 – Frequenciesof incidents perceived by management
and operational personnel[2]
Quotable are significant differences that are between
the opinions of management and operational personnel. It is
probably caused by fact that management has wider view on
operation and therefore can better estimate the incidents
occurrence.
DIRECT CAUSES
During investigation of incidents causes it is important
to identify the type, time of appearance, frequency and human
factors of these incidents. Figure 3 below shows the overview
of management and operational personnel observations with
regard to the direct causes of accidents, incidents and human
errors. These direct causes are ordered according to the
frequency they occurred.
Figure 3 – Directcauses of incidents, accidents and human
errors[2]
As it can be seen in Figure 3 above, it is stated by
operational personnel that most of the accidents, incidents or
human errors occurred during ground handling were caused by
improper or insufficiently maintained equipment.
However, management attribute these incidents,
accidents and human errors to ground handling operation, it is
alarming that most of ground handling personnel see problem in
equipment itself.
CONTRIBUTING FACTORS
In this section, the factors contributing to accidents,
incidents and various human errors on apron are examined.
Perceived frequencies from both management and operational
personnel are included in graphs. Figure 4 displays the
perceived frequency of factors that lead to an incidents.
Figure 4 - Contributing factors[2]
Time pressure was stated as the most frequent
contributing factor in ground handling by both management and
operational personnel in Netherlands. Also stress and fatigue,
which are closely connected to time pressure, were ranked very
highly in the analysis. Another important information, which we
perceived during interview with operational personnel, is that
they need to take double shifts in order to generate sufficient
income. Peer pressure and motivation are also quite reasonable
factors to consider further.
OTD (On time departures) are typical time pressure
factor. Scheduled departures are commercially important for
each airline. OTD force the ground service providers to keep
deadlines due to contractual arrangements. As a result, they need
to work under heavy time pressure many times, what and this
can lead to human errors.
The safety culture of GSP plays an important role in
the correct management of time pressure. From the safety
culture assessments it was determined that within the safety
culture characteristic awareness, the indicator attention for
safety provided the lowest rating for all participating GSP. This
related partially to whether the primary concern is to work
safely or to meet the scheduled departure time.
In one of the interviews it was told that operational
personnel often see safety and a fast turnaround to meet the
OTD as incompatible, whereas in reality there is always a
balance between safety and speed. This balance may differ for
each turnaround due to the dynamic environment or different
conditions, but when the right balance is found, safety is not
compromised.
With regard to the contributing causes, personal
factors and communication receive a relative high frequency
from both management and operational personnel.
Personal factors that mostly influence safety on an
apron are time pressure, stress and fatigue. These are related to
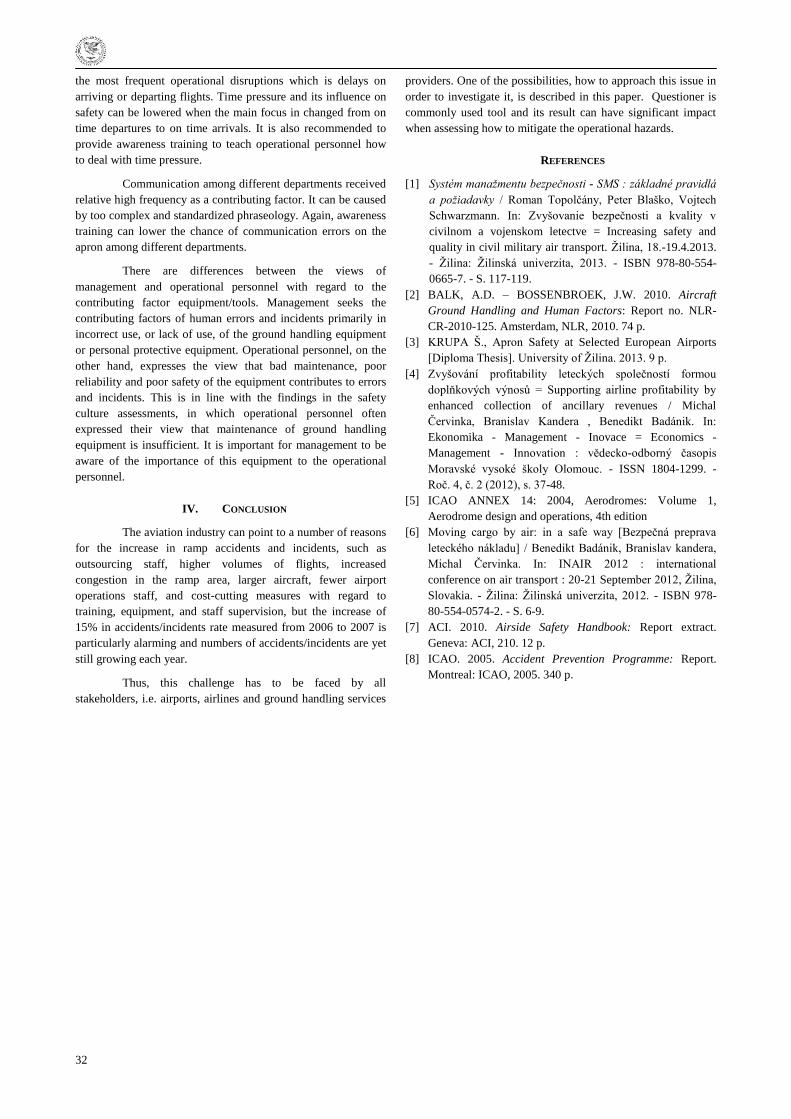
32
the most frequent operational disruptions which is delays on
arriving or departing flights. Time pressure and its influence on
safety can be lowered when the main focus in changed from on
time departures to on time arrivals. It is also recommended to
provide awareness training to teach operational personnel how
to deal with time pressure.
Communication among different departments received
relative high frequency as a contributing factor. It can be caused
by too complex and standardized phraseology. Again, awareness
training can lower the chance of communication errors on the
apron among different departments.
There are differences between the views of
management and operational personnel with regard to the
contributing factor equipment/tools. Management seeks the
contributing factors of human errors and incidents primarily in
incorrect use, or lack of use, of the ground handling equipment
or personal protective equipment. Operational personnel, on the
other hand, expresses the view that bad maintenance, poor
reliability and poor safety of the equipment contributes to errors
and incidents. This is in line with the findings in the safety
culture assessments, in which operational personnel often
expressed their view that maintenance of ground handling
equipment is insufficient. It is important for management to be
aware of the importance of this equipment to the operational
personnel.
IV. CONCLUSION
The aviation industry can point to a number of reasons
for the increase in ramp accidents and incidents, such as
outsourcing staff, higher volumes of flights, increased
congestion in the ramp area, larger aircraft, fewer airport
operations staff, and cost-cutting measures with regard to
training, equipment, and staff supervision, but the increase of
15% in accidents/incidents rate measured from 2006 to 2007 is
particularly alarming and numbers of accidents/incidents are yet
still growing each year.
Thus, this challenge has to be faced by all
stakeholders, i.e. airports, airlines and ground handling services
providers. One of the possibilities, how to approach this issue in
order to investigate it, is described in this paper. Questioner is
commonly used tool and its result can have significant impact
when assessing how to mitigate the operational hazards.
REFERENCES
[1] Systém manažmentu bezpečnosti - SMS : základné pravidlá
a požiadavky / Roman Topolčány, Peter Blaško, Vojtech
Schwarzmann. In: Zvyšovanie bezpečnosti a kvality v
civilnom a vojenskom letectve = Increasing safety and
quality in civil military air transport. Ţilina, 18.-19.4.2013.
- Ţilina: Ţilinská univerzita, 2013. - ISBN 978-80-554-
0665-7. - S. 117-119.
[2] BALK, A.D. – BOSSENBROEK, J.W. 2010. Aircraft
Ground Handling and Human Factors: Report no. NLR-
CR-2010-125. Amsterdam, NLR, 2010. 74 p.
[3] KRUPA Š., Apron Safety at Selected European Airports
[Diploma Thesis]. University of Ţilina. 2013. 9 p.
[4] Zvyšování profitability leteckých společností formou
doplňkových výnosů = Supporting airline profitability by
enhanced collection of ancillary revenues / Michal
Červinka, Branislav Kandera , Benedikt Badánik. In:
Ekonomika - Management - Inovace = Economics -
Management - Innovation : vědecko-odborný časopis
Moravské vysoké školy Olomouc. - ISSN 1804-1299. -
Roč. 4, č. 2 (2012), s. 37-48.
[5] ICAO ANNEX 14: 2004, Aerodromes: Volume 1,
Aerodrome design and operations, 4th edition
[6] Moving cargo by air: in a safe way [Bezpečná preprava
leteckého nákladu] / Benedikt Badánik, Branislav kandera,
Michal Červinka. In: INAIR 2012 : international
conference on air transport : 20-21 September 2012, Ţilina,
Slovakia. - Ţilina: Ţilinská univerzita, 2012. - ISBN 978-
80-554-0574-2. - S. 6-9.
[7] ACI. 2010. Airside Safety Handbook: Report extract.
Geneva: ACI, 210. 12 p.
[8] ICAO. 2005. Accident Prevention Programme: Report.
Montreal: ICAO, 2005. 340 p.
33
HUMAN FACTORS IN ACCIDENTS OF THE SMALL
AIRCRAFT CATEGORY
Ing. Jiří Chlebek, Ph.D.
Institute of Aerospace Engineering, Faculty of mechanical engineering, Brno University of Technology
Abstract – The article focuses on the safety of civil aviation,
which is in 80% of the accidents caused by Human Factor,
Human Error or just Pilot Error. The main goal of this text is
evaluation and assessment of the causes of aircraft accidents of
general civil aviation operations of the Czech Republic. The
paper analyzed accidents of aircrafts in the category with
maximum take of mass to 2250 kg and ultra light aircrafts
incurred in the Czech Republic from 2006 to 2012. In the
conclusion were analyzed main causes of the aircraft accidents
and were proposed further measures to reduced accidents
caused by Human Factor..
Key words – Aircraft, accident, human factor, occurence.
I. INTRODUCTION
The article discusses the safety of civil aviation, which
is, according to statistics FAA in 80% as the main culprit of the
accident or incident marked the human factor, human factors,
human error or pilot error only. Problems of study and
elimination of negative human impact on accident rates in
aviation has become increasingly examined until 70 the last
century, especially after biggest fatal accident on the island of
Tenerife, in which 583 people died. It is therefore a relatively
new scientific discipline primaly concerned on commercial air
transport only.Unlike the technical causes of accidents and
incidents are unfortunately unable to adequately eliminate the
number of aviation accidents and incidents caused by just the
human factor. Despite the very high aviation safety in the event
of any safety extensively publicized and monitored. This has
subsequently large impact, including economic losses airlines,
especially on passenger confidence in air transport, which is
according to statistics safest way of collective or personal travel
at all.
Negative effects of human factors also cause problems
in general and sports aviation. The issue of human factors in the
general aviation receives only gradually and still he does not
pay so much attention what it would be needed.
It is a positive fact that aviation regulations dealing
with of aviation personnel also contain requirements for
theoretical training pilots in the field of human performance and
limitations.
II. THE REQUIREMENTS FOR KNOWLEDGE OF HUMAN
PERFORMANCE AND LIMITATIONS
The JAR - FCL 1 clearly defines the areas of
theoretical knowledge required the necessary pilot practice. For
the aviation physiology Some of the basic concepts such as
atmospheric composition, respiration and blood circulation,
effects of altitude change to partial pressure physiology of sight,
then hearing, motion sickness and the effect of flying on the
health of the organism, and the risk of toxic substances. From
the category of basic psychology regulation includes areas such
as processinginformation, the central decision channel, and
stress assessment and decision making.
PROGRESSION OF HUMAN FACTOR
The actual human behavior and performance are a
total of about 80% cause all aviation accidents and incidents,
compared to 20% of air emergency event of technical or other
reasons. To reduce accidents and safety in aviation you need to
just focus on the best possible understanding of issues of human
performance, human limitations and human errors and
theoretical knowledge was subsequently bring education on how
to pilot or other training into practice.
Impulse directing air and professionals on the
importance of addressing questions dealing with the decline in
performance and failure pilots brought in 1975 by technical
Conference of the International Air Transport Association
(IATA) in Istanbul and symposium International Federation of
airline pilot in 1977 in Washington.
MODEL OF THE HUMAN FACTOR
The human cell is throughout the aviation system the
most flexible, most adaptable components system. But it is also
vulnerable to various disturbances and other influences affecting
its performance. Also, the reliability and quality of work are
perhaps Human factors weakest in civil aviation as a whole.
Use of the term pilot error does not significantly help
for the prevention of accidents, on the other hand has a rather
negative. Pilot error because it refers only to that place in the
system, where you went wrong. It is therefore not clear why
there was this error never happened. it is In principle, the main
aim of the interview itself causes accidents and subsequent
prevention due to known causes.
For understanding the needs of people with different
backgrounds, different education for different positions was
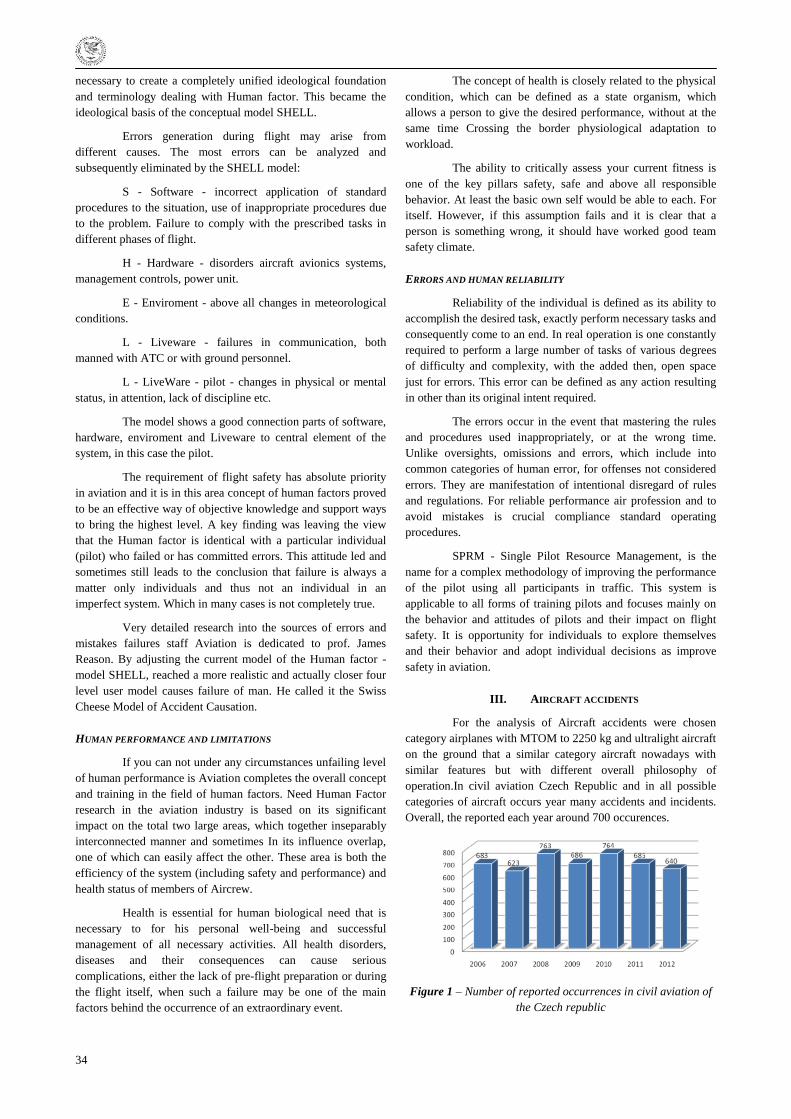
34
necessary to create a completely unified ideological foundation
and terminology dealing with Human factor. This became the
ideological basis of the conceptual model SHELL.
Errors generation during flight may arise from
different causes. The most errors can be analyzed and
subsequently eliminated by the SHELL model:
S - Software - incorrect application of standard
procedures to the situation, use of inappropriate procedures due
to the problem. Failure to comply with the prescribed tasks in
different phases of flight.
H - Hardware - disorders aircraft avionics systems,
management controls, power unit.
E - Enviroment - above all changes in meteorological
conditions.
L - Liveware - failures in communication, both
manned with ATC or with ground personnel.
L - LiveWare - pilot - changes in physical or mental
status, in attention, lack of discipline etc.
The model shows a good connection parts of software,
hardware, enviroment and Liveware to central element of the
system, in this case the pilot.
The requirement of flight safety has absolute priority
in aviation and it is in this area concept of human factors proved
to be an effective way of objective knowledge and support ways
to bring the highest level. A key finding was leaving the view
that the Human factor is identical with a particular individual
(pilot) who failed or has committed errors. This attitude led and
sometimes still leads to the conclusion that failure is always a
matter only individuals and thus not an individual in an
imperfect system. Which in many cases is not completely true.
Very detailed research into the sources of errors and
mistakes failures staff Aviation is dedicated to prof. James
Reason. By adjusting the current model of the Human factor -
model SHELL, reached a more realistic and actually closer four
level user model causes failure of man. He called it the Swiss
Cheese Model of Accident Causation.
HUMAN PERFORMANCE AND LIMITATIONS
If you can not under any circumstances unfailing level
of human performance is Aviation completes the overall concept
and training in the field of human factors. Need Human Factor
research in the aviation industry is based on its significant
impact on the total two large areas, which together inseparably
interconnected manner and sometimes In its influence overlap,
one of which can easily affect the other. These area is both the
efficiency of the system (including safety and performance) and
health status of members of Aircrew.
Health is essential for human biological need that is
necessary to for his personal well-being and successful
management of all necessary activities. All health disorders,
diseases and their consequences can cause serious
complications, either the lack of pre-flight preparation or during
the flight itself, when such a failure may be one of the main
factors behind the occurrence of an extraordinary event.
The concept of health is closely related to the physical
condition, which can be defined as a state organism, which
allows a person to give the desired performance, without at the
same time Crossing the border physiological adaptation to
workload.
The ability to critically assess your current fitness is
one of the key pillars safety, safe and above all responsible
behavior. At least the basic own self would be able to each. For
itself. However, if this assumption fails and it is clear that a
person is something wrong, it should have worked good team
safety climate.
ERRORS AND HUMAN RELIABILITY
Reliability of the individual is defined as its ability to
accomplish the desired task, exactly perform necessary tasks and
consequently come to an end. In real operation is one constantly
required to perform a large number of tasks of various degrees
of difficulty and complexity, with the added then, open space
just for errors. This error can be defined as any action resulting
in other than its original intent required.
The errors occur in the event that mastering the rules
and procedures used inappropriately, or at the wrong time.
Unlike oversights, omissions and errors, which include into
common categories of human error, for offenses not considered
errors. They are manifestation of intentional disregard of rules
and regulations. For reliable performance air profession and to
avoid mistakes is crucial compliance standard operating
procedures.
SPRM - Single Pilot Resource Management, is the
name for a complex methodology of improving the performance
of the pilot using all participants in traffic. This system is
applicable to all forms of training pilots and focuses mainly on
the behavior and attitudes of pilots and their impact on flight
safety. It is opportunity for individuals to explore themselves
and their behavior and adopt individual decisions as improve
safety in aviation.
III. AIRCRAFT ACCIDENTS
For the analysis of Aircraft accidents were chosen
category airplanes with MTOM to 2250 kg and ultralight aircraft
on the ground that a similar category aircraft nowadays with
similar features but with different overall philosophy of
operation.In civil aviation Czech Republic and in all possible
categories of aircraft occurs year many accidents and incidents.
Overall, the reported each year around 700 occurences.
Figure 1 – Number of reported occurrences in civil aviation of
the Czech republic
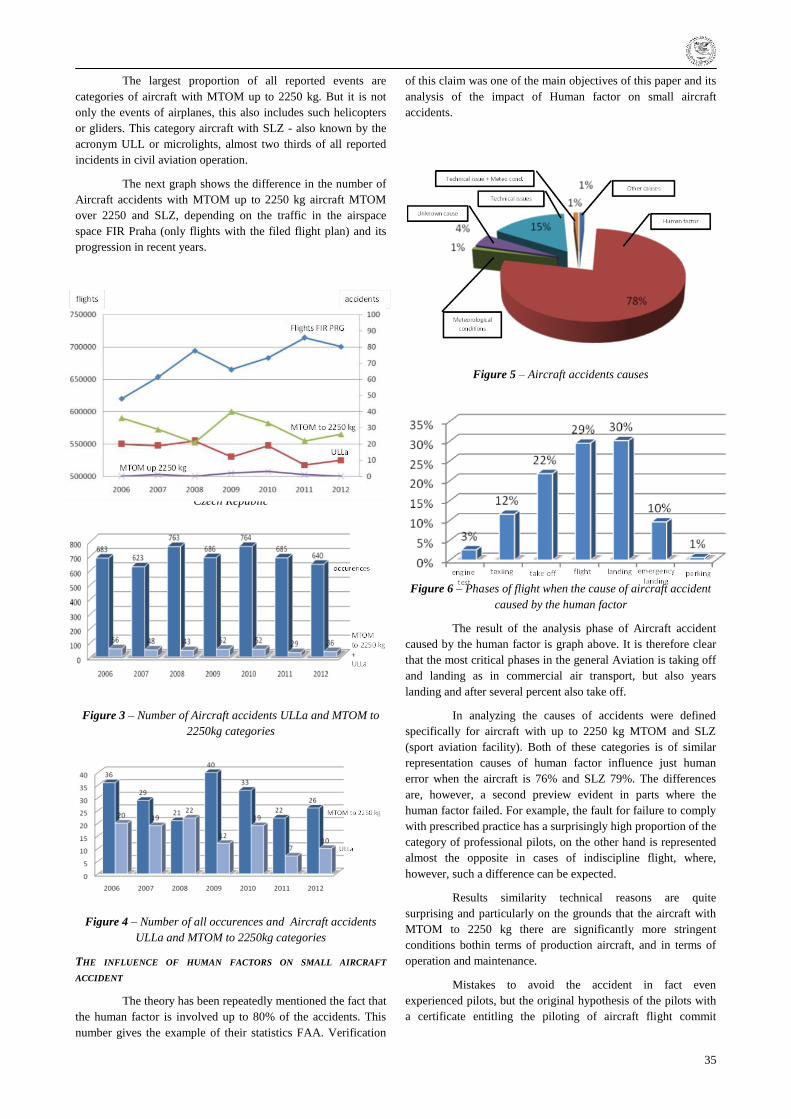
35
The largest proportion of all reported events are
categories of aircraft with MTOM up to 2250 kg. But it is not
only the events of airplanes, this also includes such helicopters
or gliders. This category aircraft with SLZ - also known by the
acronym ULL or microlights, almost two thirds of all reported
incidents in civil aviation operation.
The next graph shows the difference in the number of
Aircraft accidents with MTOM up to 2250 kg aircraft MTOM
over 2250 and SLZ, depending on the traffic in the airspace
space FIR Praha (only flights with the filed flight plan) and its
progression in recent years.
Figure 2 – Number of Aircraft accidents in civil aviation of the
Czech Republic
Figure 3 – Number of Aircraft accidents ULLa and MTOM to
2250kg categories
Figure 4 – Number of all occurences and Aircraft accidents
ULLa and MTOM to 2250kg categories
THE INFLUENCE OF HUMAN FACTORS ON SMALL AIRCRAFT
ACCIDENT
The theory has been repeatedly mentioned the fact that
the human factor is involved up to 80% of the accidents. This
number gives the example of their statistics FAA. Verification
of this claim was one of the main objectives of this paper and its
analysis of the impact of Human factor on small aircraft
accidents.
Figure 5 – Aircraft accidents causes
Figure 6 – Phases of flight when the cause of aircraft accident
caused by the human factor
The result of the analysis phase of Aircraft accident
caused by the human factor is graph above. It is therefore clear
that the most critical phases in the general Aviation is taking off
and landing as in commercial air transport, but also years
landing and after several percent also take off.
In analyzing the causes of accidents were defined
specifically for aircraft with up to 2250 kg MTOM and SLZ
(sport aviation facility). Both of these categories is of similar
representation causes of human factor influence just human
error when the aircraft is 76% and SLZ 79%. The differences
are, however, a second preview evident in parts where the
human factor failed. For example, the fault for failure to comply
with prescribed practice has a surprisingly high proportion of the
category of professional pilots, on the other hand is represented
almost the opposite in cases of indiscipline flight, where,
however, such a difference can be expected.
Results similarity technical reasons are quite
surprising and particularly on the grounds that the aircraft with
MTOM to 2250 kg there are significantly more stringent
conditions bothin terms of production aircraft, and in terms of
operation and maintenance.
Mistakes to avoid the accident in fact even
experienced pilots, but the original hypothesis of the pilots with
a certificate entitling the piloting of aircraft flight commit
36
indiscipline to SLZ, causing accidents in this category has not
been confirmed.
IV. CONCLUSION
The analysis showed that the man, a human factor
involved for all Aircraft accidents generally from 78%. This
confirmed the hypothesis FAA long-term stabilization causes of
accidents due to human error on the values of around 80%. The
remaining share is from the top of the technical causes that
contribute to the occurrence of accidents of 15%. The rest of the
causes is negligible .
When applying the results of the analysis of accidents
that category of aircraft using the SHELL model, as the riskiest
showed interactions between cells L – H showing the pilot and
the aircraft itself, thus failing to piloting techniques primarily at
the stage of take-off, flight and landing. Furthermore, the critical
interaction between cells L - S, by failure to comply with
required actions in a limited number on the interface L - E,
which reflected the lack of pre-and underestimation of the
potential of weather.
It is also confirmed by the fact that the central point of
the system, in this case, the pilot is weakest and riskiest article at
all. Generating there are a number of both unintentional errors,
mistakes and carelessness, but also a number of violations, like
flight indiscipline.
REFERENCES
[1] ŠULC, J. a L. KULČÁK. 2011. Lidská výkonnost (040 00):
[učebnice pro teoretickou přípravu pilotů ATPL, CPL a
IR]. Brno: Akademické nakladatelství CERM, 119 s. ISBN
978-80-7204-688-1.
[2] ŠULC, J. 2004. Lidský činitel: studijní modul 9. Brno:
Akademické nakladatelství CERM, 112 s. ISBN 80-7204-
364-1
[3] HÁČIK, Ľ. 2002. Lidská výkonnost a omezení. Brno:
CERM, 33 s. Učební texty pro teoretickou přípravu
dopravních pilotů ATPL(A) dle předpisu JAR-FCL 1.
ISBN 80-720-4236-X
[4] ŠULC, J. 2006. Učebnice pilota: Letecká psychofyziologie.
Cheb: Svět křídel, 589 - 695. ISBN 80-86808-28-9.
[5] VAŠINA, B. 2009. Základy psychologie zdraví. Ostrava:
Pedagogická fakulta Ostravské univerzity v Ostravě. 124 s.
ISBN: 978-80-7368-1
[6] WIENER, Earl L a David C NAGEL. Human factors in
aviation. San Diego: Academic Press, c1988, xxi, 684 p.
ISBN 01-275-0030-8
[7] BISSELICHES, F. a spol. 1995. L´alcotest en tant qu´outil
de rédaptation. 43rd ICASM, London
[8] WIEGMANN, D. A., SHAPPEL, S.A. 2003. A human
error approach to aviation accident analysis: the human
factors analysis and classification system. Aldershot:
Ashgate, 165 s. ISBN 07-546-1875-7
[9] HÁČIK, Ľ. 2006. Lidská výkonnost a omezení (040 00):
dočasná učebnice : [učební texty dle předpisu JAR-FCL 1].
Brno: Akademické nakladatelství CERM, 96 s. ISBN 80-
720-4471-0
[10] ÚCL. Úřad pro civilní letectví. [cit. 2012-10-11].
http://www.caa.cz
[11] ÚZPLN. Ústav pro odborné zjišťování příčin leteckých
nehod. [cit. 2013-03-01]. http://www.uzpln.cz
37
USING CATALYST FOR REDUCING EMISSION IN AVIATION
Ing. Mirvat Kaddour
University of technology in Brno, Institute of aerospace engineering, Czech Republic
Abstract‒ as the aircraft contribute in producing gases that
cause pollution and global warming, it become necessary to find
solution to reduce aircraft emissions. In this paper I wrote about
aviation fuel, emission produced by aircraft and how it can be
reduced by changing some of motors design or using catalytic
converter (two or three ways).
Key words‒ pollution, emission, aircraft, fuel, catalyst.
INTRODUCTION
The increase in aircraft pollution is largely due to the
rapid growth in air traffic which has been expanding at nearly
two and half times average economic growth rates since 1960. It
is expected that, the number of people flying will virtually be
doubled over the next 15 years. This means increasing airport
capacity, more flights, more pollution and increasingly crowded
airspace.
Emissions from aircraft flying at cruising altitudes (8
to 13 km) affect atmospheric composition in a height region
where there might be significant climate impact through changes
in the chemical and physical processes that have climate change
consequences.
Future emissions from aircraft are expected to increase
much more rapidly than emissions in general, with global
aviation annual growth currently estimated between 4 to 5%.
Aviation emissions are relatively small compared to
emissions from other transport (automobile). These emissions
are gradually reduced, because of changes in fuel composition,
using alternative fuel, engines modification, and emission
controls on motors during technical controls.
In the other hand, the aviation fuel is always the same.
It contains lead which has harmful effect on environmental, and
incompatible with catalytic converters.
The aimof this presentpaper isto focus onways to
reduceemissions of smallandultra-lightaircraft.
AVIATION FUEL
Aviation fuels are classified into two groups,
aviation gasoline (Avgas) and aviation turbine fuels (Jet
fuel). Avgas is an aviation gasoline that is suitable for use in
aircraft that have piston engines. Jet fuel is an aviation turbine
fuel suitable for use in aircraft with turbine engines.
AVGAS (AVIATION GASOLINE)
Avgas is used in small piston engine powered aircraft,
within the General Aviation community. Predominately
activities such as private pilots, flight training, flying clubs and
crop spraying. Piston engines operate using the same basic
principles as spark ignition engines of cars, but they have a
much higher performance requirement.
In today's General Aviation community there are only
two main Avgas grades (100 and 100LL low lead) – a
rationalization that has enabled fuel companies to continue
supplying a market that would otherwise have become
uneconomic. Worldwide, total Avgas volumes are low, since
Avgas-fuelled aircraft, although they outnumber jet-fuelled
aircraft, are generally much smaller.
AVGAS GRADE
Avgas 100 is standard high octane fuel (100-130) for
aviation piston engines. It has a high lead content (2.11 g/kg)
and is dyed green.
Avgas 100LL is low lead version of Avgas 100 (0.75
g/kg). Its octane number is 100 and it is dyed blue.
Avgas 82UL this is a relatively new grade aimed at the
low compression ratio engines which don't need the high octane
of Avgas 100 and could be designed to run on unleaded fuel.
Avgas 82UL is dyed purple, its octane number is 85 and lead
content is 0,41g/kg.
BA 95 natural is unleaded automotive gasoline.
The following table shows the energy content of avgas
and other fuel.
Table 1- energy content of fuel
fuel Energy content
[Btu/gallon]
Energy content
[MJ/dm3]
Biodiesel 120000 33,42
Gasoline 117249 32,66
Avgas 112500 31.33
LPG 84000 23.39
Ethanol 80000 22.28
CNG (3000 psi) 38000 10.58
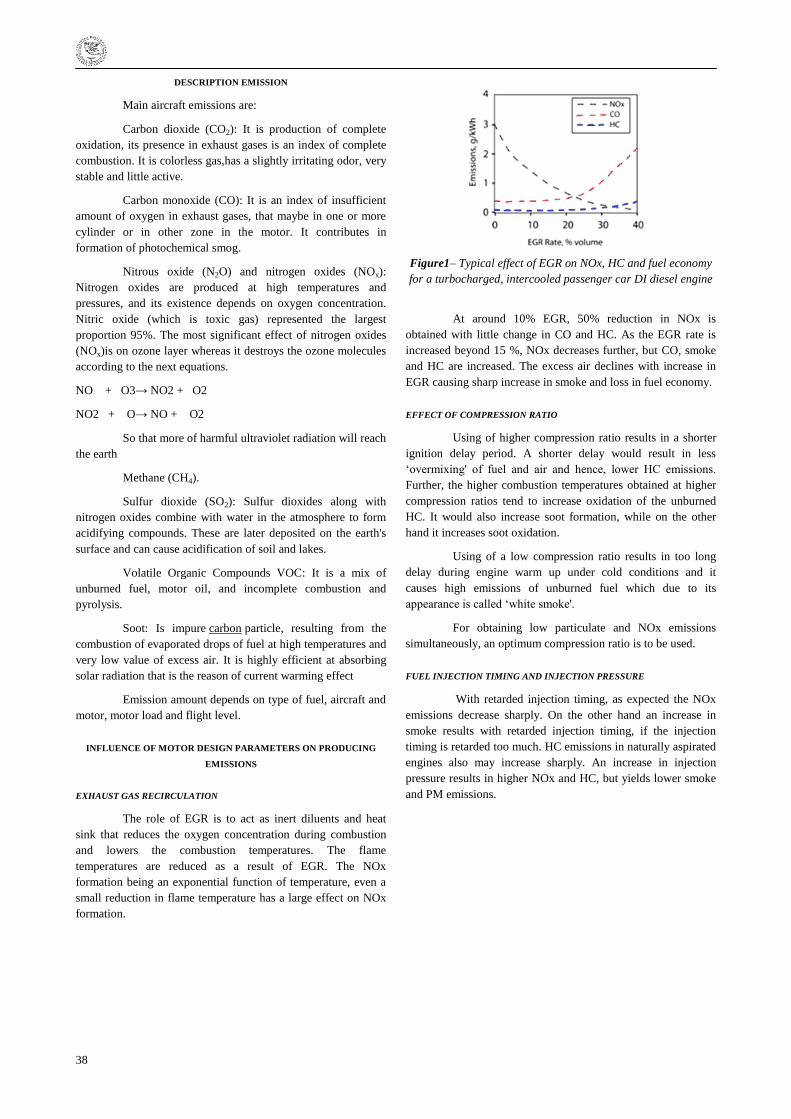
38
DESCRIPTION EMISSION
Main aircraft emissions are:
Carbon dioxide (CO2): It is production of complete
oxidation, its presence in exhaust gases is an index of complete
combustion. It is colorless gas,has a slightly irritating odor, very
stable and little active.
Carbon monoxide (CO): It is an index of insufficient
amount of oxygen in exhaust gases, that maybe in one or more
cylinder or in other zone in the motor. It contributes in
formation of photochemical smog.
Nitrous oxide (N2O) and nitrogen oxides (NOx):
Nitrogen oxides are produced at high temperatures and
pressures, and its existence depends on oxygen concentration.
Nitric oxide (which is toxic gas) represented the largest
proportion 95%. The most significant effect of nitrogen oxides
(NOx)is on ozone layer whereas it destroys the ozone molecules
according to the next equations.
NO + O3→ NO2 + O2
NO2 + O→ NO + O2
So that more of harmful ultraviolet radiation will reach
the earth
Methane (CH4).
Sulfur dioxide (SO2): Sulfur dioxides along with
nitrogen oxides combine with water in the atmosphere to form
acidifying compounds. These are later deposited on the earth's
surface and can cause acidification of soil and lakes.
Volatile Organic Compounds VOC: It is a mix of
unburned fuel, motor oil, and incomplete combustion and
pyrolysis.
Soot: Is impure carbon particle, resulting from the
combustion of evaporated drops of fuel at high temperatures and
very low value of excess air. It is highly efficient at absorbing
solar radiation that is the reason of current warming effect
Emission amount depends on type of fuel, aircraft and
motor, motor load and flight level.
INFLUENCE OF MOTOR DESIGN PARAMETERS ON PRODUCING
EMISSIONS
EXHAUST GAS RECIRCULATION
The role of EGR is to act as inert diluents and heat
sink that reduces the oxygen concentration during combustion
and lowers the combustion temperatures. The flame
temperatures are reduced as a result of EGR. The NOx
formation being an exponential function of temperature, even a
small reduction in flame temperature has a large effect on NOx
formation.
Figure1– Typical effect of EGR on NOx, HC and fuel economy
for a turbocharged, intercooled passenger car DI diesel engine
At around 10% EGR, 50% reduction in NOx is
obtained with little change in CO and HC. As the EGR rate is
increased beyond 15 %, NOx decreases further, but CO, smoke
and HC are increased. The excess air declines with increase in
EGR causing sharp increase in smoke and loss in fuel economy.
EFFECT OF COMPRESSION RATIO
Using of higher compression ratio results in a shorter
ignition delay period. A shorter delay would result in less
‗overmixing' of fuel and air and hence, lower HC emissions.
Further, the higher combustion temperatures obtained at higher
compression ratios tend to increase oxidation of the unburned
HC. It would also increase soot formation, while on the other
hand it increases soot oxidation.
Using of a low compression ratio results in too long
delay during engine warm up under cold conditions and it
causes high emissions of unburned fuel which due to its
appearance is called ‗white smoke'.
For obtaining low particulate and NOx emissions
simultaneously, an optimum compression ratio is to be used.
FUEL INJECTION TIMING AND INJECTION PRESSURE
With retarded injection timing, as expected the NOx
emissions decrease sharply. On the other hand an increase in
smoke results with retarded injection timing, if the injection
timing is retarded too much. HC emissions in naturally aspirated
engines also may increase sharply. An increase in injection
pressure results in higher NOx and HC, but yields lower smoke
and PM emissions.
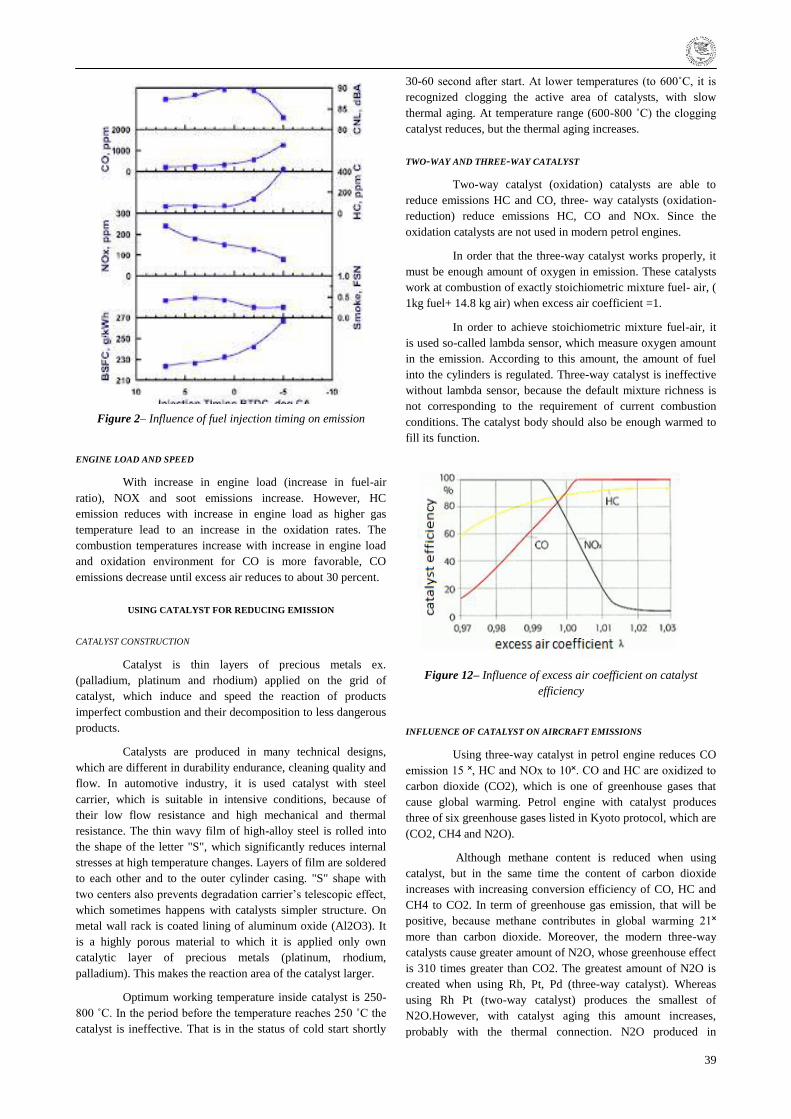
39
Figure 2– Influence of fuel injection timing on emission
ENGINE LOAD AND SPEED
With increase in engine load (increase in fuel-air
ratio), NOX and soot emissions increase. However, HC
emission reduces with increase in engine load as higher gas
temperature lead to an increase in the oxidation rates. The
combustion temperatures increase with increase in engine load
and oxidation environment for CO is more favorable, CO
emissions decrease until excess air reduces to about 30 percent.
USING CATALYST FOR REDUCING EMISSION
CATALYST CONSTRUCTION
Catalyst is thin layers of precious metals ex.
(palladium, platinum and rhodium) applied on the grid of
catalyst, which induce and speed the reaction of products
imperfect combustion and their decomposition to less dangerous
products.
Catalysts are produced in many technical designs,
which are different in durability endurance, cleaning quality and
flow. In automotive industry, it is used catalyst with steel
carrier, which is suitable in intensive conditions, because of
their low flow resistance and high mechanical and thermal
resistance. The thin wavy film of high-alloy steel is rolled into
the shape of the letter "S", which significantly reduces internal
stresses at high temperature changes. Layers of film are soldered
to each other and to the outer cylinder casing. "S" shape with
two centers also prevents degradation carrier‘s telescopic effect,
which sometimes happens with catalysts simpler structure. On
metal wall rack is coated lining of aluminum oxide (Al2O3). It
is a highly porous material to which it is applied only own
catalytic layer of precious metals (platinum, rhodium,
palladium). This makes the reaction area of the catalyst larger.
Optimum working temperature inside catalyst is 250-
800 ˚C. In the period before the temperature reaches 250 ˚C the
catalyst is ineffective. That is in the status of cold start shortly
30-60 second after start. At lower temperatures (to 600˚C, it is
recognized clogging the active area of catalysts, with slow
thermal aging. At temperature range (600-800 ˚C) the clogging
catalyst reduces, but the thermal aging increases.
TWO-WAY AND THREE-WAY CATALYST
Two-way catalyst (oxidation) catalysts are able to
reduce emissions HC and CO, three- way catalysts (oxidation-
reduction) reduce emissions HC, CO and NOx. Since the
oxidation catalysts are not used in modern petrol engines.
In order that the three-way catalyst works properly, it
must be enough amount of oxygen in emission. These catalysts
work at combustion of exactly stoichiometric mixture fuel- air, (
1kg fuel+ 14.8 kg air) when excess air coefficient =1.
In order to achieve stoichiometric mixture fuel-air, it
is used so-called lambda sensor, which measure oxygen amount
in the emission. According to this amount, the amount of fuel
into the cylinders is regulated. Three-way catalyst is ineffective
without lambda sensor, because the default mixture richness is
not corresponding to the requirement of current combustion
conditions. The catalyst body should also be enough warmed to
fill its function.
Figure 12– Influence of excess air coefficient on catalyst
efficiency
INFLUENCE OF CATALYST ON AIRCRAFT EMISSIONS
Using three-way catalyst in petrol engine reduces CO
emission 15 ˟, HC and NOx to 10˟. CO and HC are oxidized to
carbon dioxide (CO2), which is one of greenhouse gases that
cause global warming. Petrol engine with catalyst produces
three of six greenhouse gases listed in Kyoto protocol, which are
(CO2, CH4 and N2O).
Although methane content is reduced when using
catalyst, but in the same time the content of carbon dioxide
increases with increasing conversion efficiency of CO, HC and
CH4 to CO2. In term of greenhouse gas emission, that will be
positive, because methane contributes in global warming 21˟
more than carbon dioxide. Moreover, the modern three-way
catalysts cause greater amount of N2O, whose greenhouse effect
is 310 times greater than CO2. The greatest amount of N2O is
created when using Rh, Pt, Pd (three-way catalyst). Whereas
using Rh Pt (two-way catalyst) produces the smallest of
N2O.However, with catalyst aging this amount increases,
probably with the thermal connection. N2O produced in

40
presence of Pd catalyst persists even at high temperatures above
500 ° C.
Using catalytic converter in engines working on
leaded fuel (avgas 100, 100LL) is not possible, because the lead
deactivate the main catalyst elements (platinum). Therefore,
catalyst can be used in aircraft engines that work or may work
on unleaded avgas (UL91) or automotive unleaded fuel
(Mogas).
To the motors working on unleaded Mogas belongs
Rotax 912 IS, 912 S/ ULS. All engines already approved to use
unleaded Mogas RON 95 (MON 85) in accordance with
Standard EN228:2008 are deemed as suitable for operation with
UL 91.[2] To the motors that can work on motor gasoline
belong Lycoming O-290/ O-320 and others. [2] Aircrafts
permitting to use motor gasoline are listed by UK Civil Aviation
Authority CAA. [2]
CONCLUSION
Aircrafts supplied with catalytic converter produce
less greenhouse emission HC and NOx, in case of achieving
optimum excess air coefficient and working temperature in
catalyst. However, it is important to note, that using catalyst
must be combined with using unleaded fuel. Therefore, we
recommend using unleaded automotive fuel. Application of
catalyst for engines type Textron, -Lycoming, Rotax and Sabaru
with power 70-140 kW requires processing of design weight
analysis.
REFERENCES
[1] Adamec, V. et al. vliv katalyzátorů na produkci emisí
CO2, N2O a CH4. [online].Centrum dopravního výzkumu.
[2] CIVIL AVIATION AUTHORITY. Mandatory
Requirements for Airworthiness [online]. 2012. ISBN 978
0 11792 799 5.
[3] HROMÁDKO, Jan. et al. Spalovací motory: komplexní
přehled problematiky pro všechny typy technických
automobilních škol. 1. ed. Prague: Grada, 2011. ISBN 978-
80-247-3475-0.
[4] http://www.hondaclub.cz/default.aspx?a=610
[5] http://americanfuels.blogspot.cz/2010/08/effects-of-soot-
on-global-climate.html
[6] http://wiki.answers.com/Q/What_negative_effects_do_sulf
ur_dioxide_have_on_the_environment
[7] http://www.nptel.iitm.ac.in/courses/112104033/pdf_lecture
/lecture15.pdf
[8] http://www.lycoming.com/support/tips-advice/unleaded-
fuels/
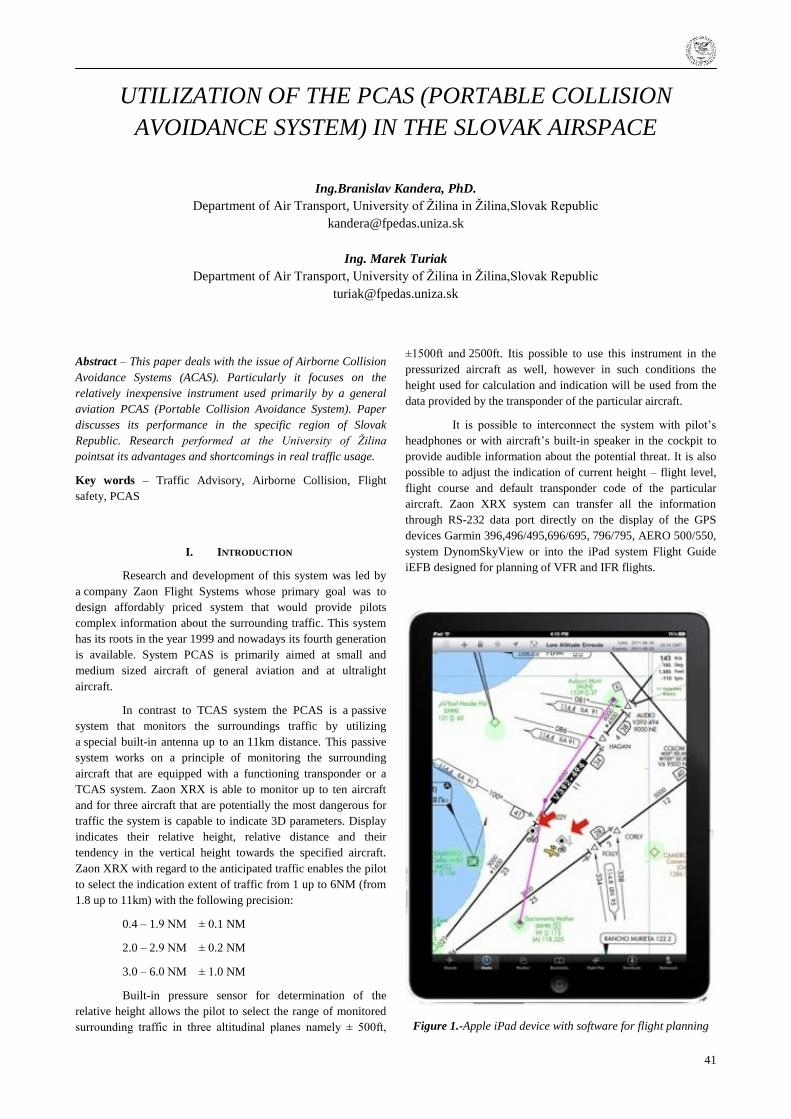
41
UTILIZATION OF THE PCAS (PORTABLE COLLISION
AVOIDANCE SYSTEM) IN THE SLOVAK AIRSPACE
Ing.Branislav Kandera, PhD.
Department of Air Transport, University of Ţilina in Ţilina,Slovak Republic
Ing. Marek Turiak
Department of Air Transport, University of Ţilina in Ţilina,Slovak Republic
Abstract – This paper deals with the issue of Airborne Collision
Avoidance Systems (ACAS). Particularly it focuses on the
relatively inexpensive instrument used primarily by a general
aviation PCAS (Portable Collision Avoidance System). Paper
discusses its performance in the specific region of Slovak
Republic. Research performed at the University of Žilina
pointsat its advantages and shortcomings in real traffic usage.
Key words – Traffic Advisory, Airborne Collision, Flight
safety, PCAS
I. INTRODUCTION
Research and development of this system was led by
a company Zaon Flight Systems whose primary goal was to
design affordably priced system that would provide pilots
complex information about the surrounding traffic. This system
has its roots in the year 1999 and nowadays its fourth generation
is available. System PCAS is primarily aimed at small and
medium sized aircraft of general aviation and at ultralight
aircraft.
In contrast to TCAS system the PCAS is a passive
system that monitors the surroundings traffic by utilizing
a special built-in antenna up to an 11km distance. This passive
system works on a principle of monitoring the surrounding
aircraft that are equipped with a functioning transponder or a
TCAS system. Zaon XRX is able to monitor up to ten aircraft
and for three aircraft that are potentially the most dangerous for
traffic the system is capable to indicate 3D parameters. Display
indicates their relative height, relative distance and their
tendency in the vertical height towards the specified aircraft.
Zaon XRX with regard to the anticipated traffic enables the pilot
to select the indication extent of traffic from 1 up to 6NM (from
1.8 up to 11km) with the following precision:
0.4 – 1.9 NM ± 0.1 NM
2.0 – 2.9 NM ± 0.2 NM
3.0 – 6.0 NM ± 1.0 NM
Built-in pressure sensor for determination of the
relative height allows the pilot to select the range of monitored
surrounding traffic in three altitudinal planes namely ± 500ft,
±1500ft and 2500ft. Itis possible to use this instrument in the
pressurized aircraft as well, however in such conditions the
height used for calculation and indication will be used from the
data provided by the transponder of the particular aircraft.
It is possible to interconnect the system with pilot‘s
headphones or with aircraft‘s built-in speaker in the cockpit to
provide audible information about the potential threat. It is also
possible to adjust the indication of current height – flight level,
flight course and default transponder code of the particular
aircraft. Zaon XRX system can transfer all the information
through RS-232 data port directly on the display of the GPS
devices Garmin 396,496/495,696/695, 796/795, AERO 500/550,
system DynomSkyView or into the iPad system Flight Guide
iEFB designed for planning of VFR and IFR flights.
Figure 1.-Apple iPad device with software for flight planning
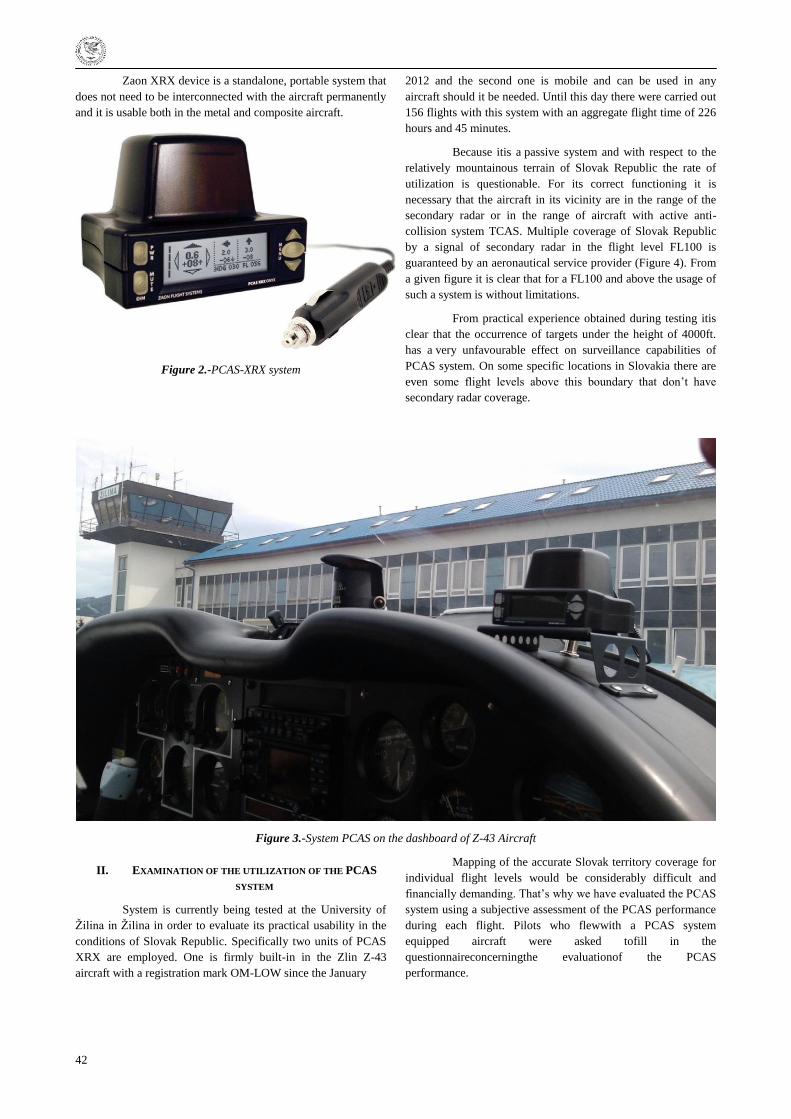
42
Zaon XRX device is a standalone, portable system that
does not need to be interconnected with the aircraft permanently
and it is usable both in the metal and composite aircraft.
Figure 2.-PCAS-XRX system
2012 and the second one is mobile and can be used in any
aircraft should it be needed. Until this day there were carried out
156 flights with this system with an aggregate flight time of 226
hours and 45 minutes.
Because itis a passive system and with respect to the
relatively mountainous terrain of Slovak Republic the rate of
utilization is questionable. For its correct functioning it is
necessary that the aircraft in its vicinity are in the range of the
secondary radar or in the range of aircraft with active anti-
collision system TCAS. Multiple coverage of Slovak Republic
by a signal of secondary radar in the flight level FL100 is
guaranteed by an aeronautical service provider (Figure 4). From
a given figure it is clear that for a FL100 and above the usage of
such a system is without limitations.
From practical experience obtained during testing itis
clear that the occurrence of targets under the height of 4000ft.
has a very unfavourable effect on surveillance capabilities of
PCAS system. On some specific locations in Slovakia there are
even some flight levels above this boundary that don‘t have
secondary radar coverage.
Figure 3.-System PCAS on the dashboard of Z-43 Aircraft
II. EXAMINATION OF THE UTILIZATION OF THE PCAS
SYSTEM
System is currently being tested at the University of
Ţilina in Ţilina in order to evaluate its practical usability in the
conditions of Slovak Republic. Specifically two units of PCAS
XRX are employed. One is firmly built-in in the Zlin Z-43
aircraft with a registration mark OM-LOW since the January
Mapping of the accurate Slovak territory coverage for
individual flight levels would be considerably difficult and
financially demanding. That‘s why we have evaluated the PCAS
system using a subjective assessment of the PCAS performance
during each flight. Pilots who flewwith a PCAS system
equipped aircraft were asked tofill in the
questionnaireconcerningthe evaluationof the PCAS
performance.
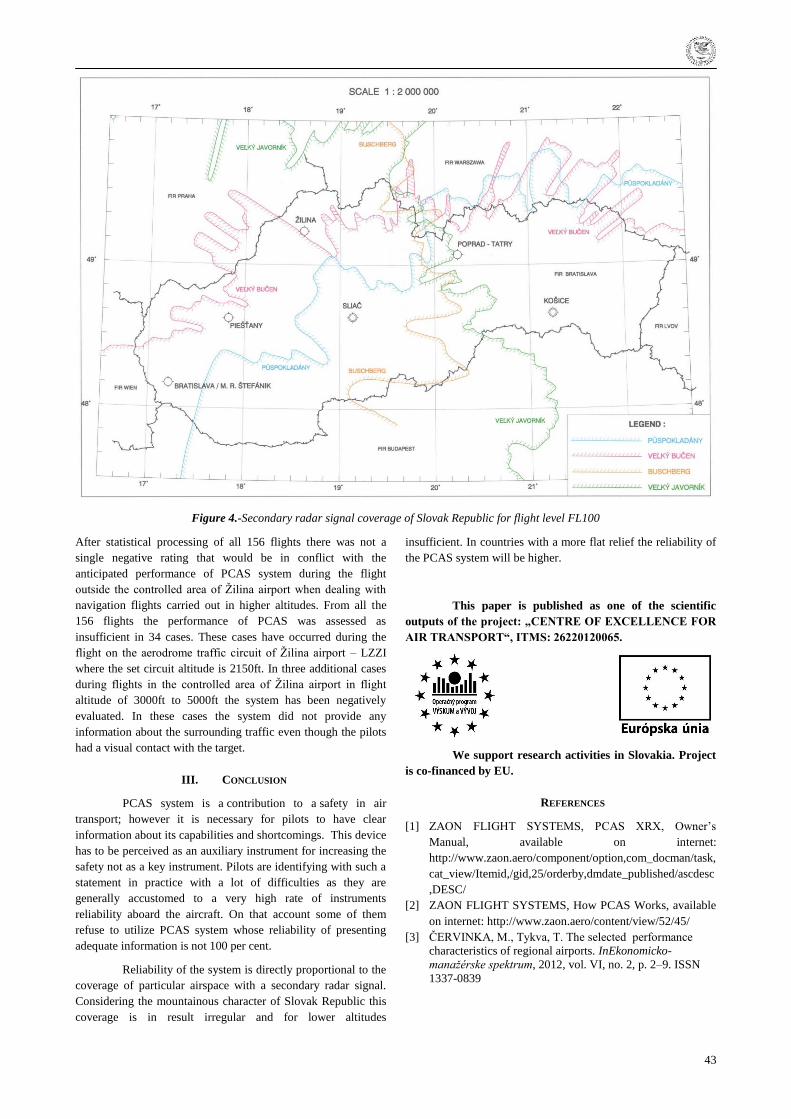
43
Figure 4.-Secondary radar signal coverage of Slovak Republic for flight level FL100
After statistical processing of all 156 flights there was not a
single negative rating that would be in conflict with the
anticipated performance of PCAS system during the flight
outside the controlled area of Ţilina airport when dealing with
navigation flights carried out in higher altitudes. From all the
156 flights the performance of PCAS was assessed as
insufficient in 34 cases. These cases have occurred during the
flight on the aerodrome traffic circuit of Ţilina airport – LZZI
where the set circuit altitude is 2150ft. In three additional cases
during flights in the controlled area of Ţilina airport in flight
altitude of 3000ft to 5000ft the system has been negatively
evaluated. In these cases the system did not provide any
information about the surrounding traffic even though the pilots
had a visual contact with the target.
III. CONCLUSION
PCAS system is a contribution to a safety in air
transport; however it is necessary for pilots to have clear
information about its capabilities and shortcomings. This device
has to be perceived as an auxiliary instrument for increasing the
safety not as a key instrument. Pilots are identifying with such a
statement in practice with a lot of difficulties as they are
generally accustomed to a very high rate of instruments
reliability aboard the aircraft. On that account some of them
refuse to utilize PCAS system whose reliability of presenting
adequate information is not 100 per cent.
Reliability of the system is directly proportional to the
coverage of particular airspace with a secondary radar signal.
Considering the mountainous character of Slovak Republic this
coverage is in result irregular and for lower altitudes
insufficient. In countries with a more flat relief the reliability of
the PCAS system will be higher.
This paper is published as one of the scientific
outputs of the project: „CENTRE OF EXCELLENCE FOR
AIR TRANSPORT“, ITMS: 26220120065.
We support research activities in Slovakia. Project
is co-financed by EU.
REFERENCES
[1] ZAON FLIGHT SYSTEMS, PCAS XRX, Owner‘s
Manual, available on internet:
http://www.zaon.aero/component/option,com_docman/task,
cat_view/Itemid,/gid,25/orderby,dmdate_published/ascdesc
,DESC/
[2] ZAON FLIGHT SYSTEMS, How PCAS Works, available
on internet: http://www.zaon.aero/content/view/52/45/
[3] ČERVINKA, M., Tykva, T. The selected performance
characteristics of regional airports. InEkonomicko-
manažérske spektrum, 2012, vol. VI, no. 2, p. 2–9. ISSN
1337-0839
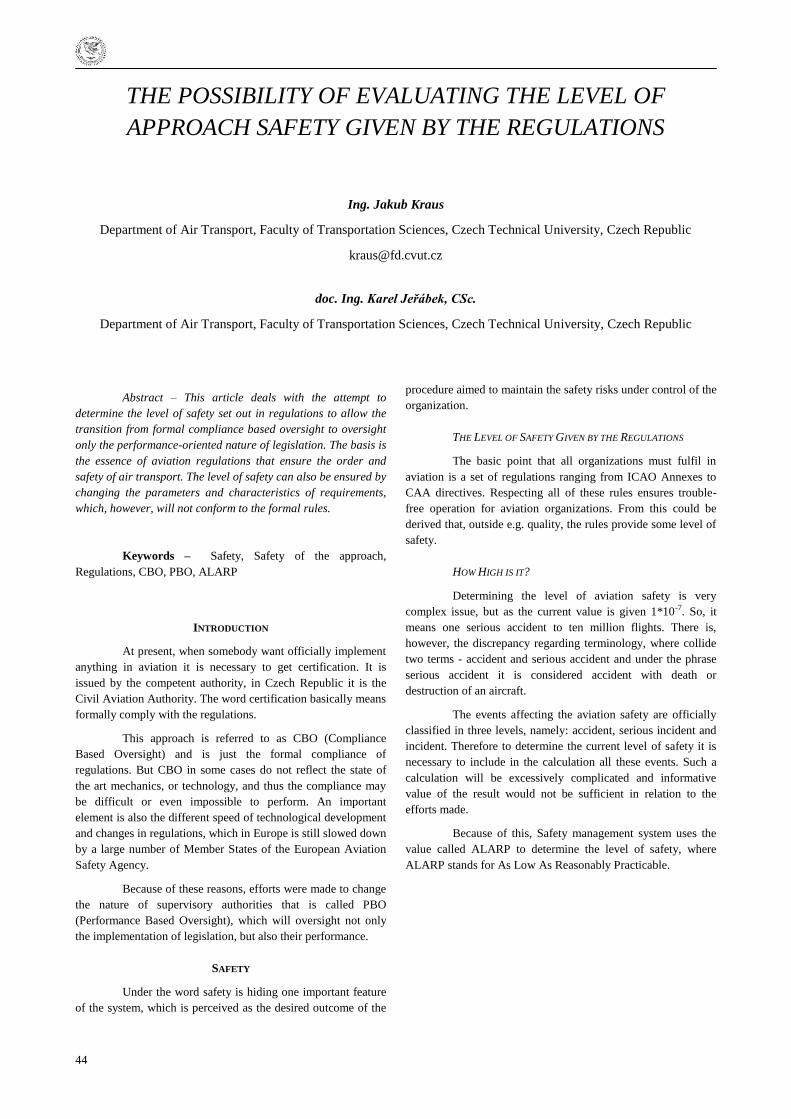
44
THE POSSIBILITY OF EVALUATING THE LEVEL OF
APPROACH SAFETY GIVEN BY THE REGULATIONS
Ing. Jakub Kraus
Department of Air Transport, Faculty of Transportation Sciences, Czech Technical University, Czech Republic
doc. Ing. Karel Jeřábek, CSc.
Department of Air Transport, Faculty of Transportation Sciences, Czech Technical University, Czech Republic
Abstract – This article deals with the attempt to
determine the level of safety set out in regulations to allow the
transition from formal compliance based oversight to oversight
only the performance-oriented nature of legislation. The basis is
the essence of aviation regulations that ensure the order and
safety of air transport. The level of safety can also be ensured by
changing the parameters and characteristics of requirements,
which, however, will not conform to the formal rules.
Keywords – Safety, Safety of the approach,
Regulations, CBO, PBO, ALARP
INTRODUCTION
At present, when somebody want officially implement
anything in aviation it is necessary to get certification. It is
issued by the competent authority, in Czech Republic it is the
Civil Aviation Authority. The word certification basically means
formally comply with the regulations.
This approach is referred to as CBO (Compliance
Based Oversight) and is just the formal compliance of
regulations. But CBO in some cases do not reflect the state of
the art mechanics, or technology, and thus the compliance may
be difficult or even impossible to perform. An important
element is also the different speed of technological development
and changes in regulations, which in Europe is still slowed down
by a large number of Member States of the European Aviation
Safety Agency.
Because of these reasons, efforts were made to change
the nature of supervisory authorities that is called PBO
(Performance Based Oversight), which will oversight not only
the implementation of legislation, but also their performance.
SAFETY
Under the word safety is hiding one important feature
of the system, which is perceived as the desired outcome of the
procedure aimed to maintain the safety risks under control of the
organization.
THE LEVEL OF SAFETY GIVEN BY THE REGULATIONS
The basic point that all organizations must fulfil in
aviation is a set of regulations ranging from ICAO Annexes to
CAA directives. Respecting all of these rules ensures trouble-
free operation for aviation organizations. From this could be
derived that, outside e.g. quality, the rules provide some level of
safety.
HOW HIGH IS IT?
Determining the level of aviation safety is very
complex issue, but as the current value is given 1*10-7. So, it
means one serious accident to ten million flights. There is,
however, the discrepancy regarding terminology, where collide
two terms - accident and serious accident and under the phrase
serious accident it is considered accident with death or
destruction of an aircraft.
The events affecting the aviation safety are officially
classified in three levels, namely: accident, serious incident and
incident. Therefore to determine the current level of safety it is
necessary to include in the calculation all these events. Such a
calculation will be excessively complicated and informative
value of the result would not be sufficient in relation to the
efforts made.
Because of this, Safety management system uses the
value called ALARP to determine the level of safety, where
ALARP stands for As Low As Reasonably Practicable.
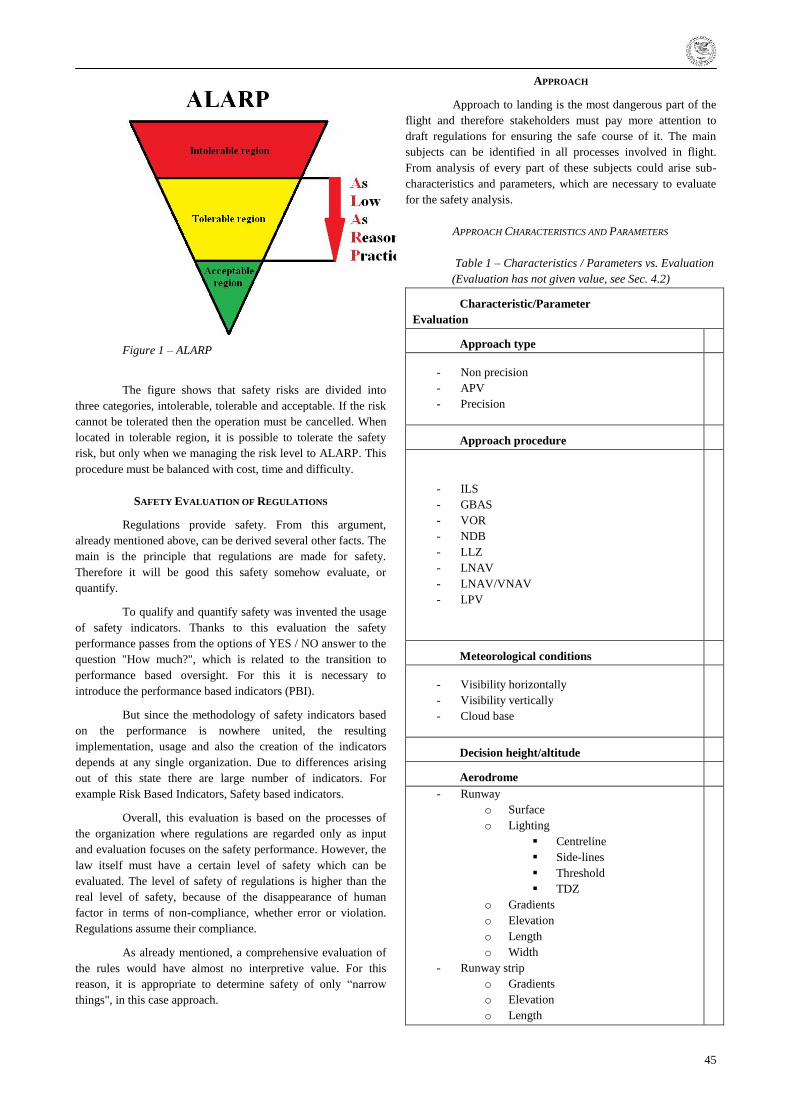
45
Figure 1 – ALARP
The figure shows that safety risks are divided into
three categories, intolerable, tolerable and acceptable. If the risk
cannot be tolerated then the operation must be cancelled. When
located in tolerable region, it is possible to tolerate the safety
risk, but only when we managing the risk level to ALARP. This
procedure must be balanced with cost, time and difficulty.
SAFETY EVALUATION OF REGULATIONS
Regulations provide safety. From this argument,
already mentioned above, can be derived several other facts. The
main is the principle that regulations are made for safety.
Therefore it will be good this safety somehow evaluate, or
quantify.
To qualify and quantify safety was invented the usage
of safety indicators. Thanks to this evaluation the safety
performance passes from the options of YES / NO answer to the
question "How much?", which is related to the transition to
performance based oversight. For this it is necessary to
introduce the performance based indicators (PBI).
But since the methodology of safety indicators based
on the performance is nowhere united, the resulting
implementation, usage and also the creation of the indicators
depends at any single organization. Due to differences arising
out of this state there are large number of indicators. For
example Risk Based Indicators, Safety based indicators.
Overall, this evaluation is based on the processes of
the organization where regulations are regarded only as input
and evaluation focuses on the safety performance. However, the
law itself must have a certain level of safety which can be
evaluated. The level of safety of regulations is higher than the
real level of safety, because of the disappearance of human
factor in terms of non-compliance, whether error or violation.
Regulations assume their compliance.
As already mentioned, a comprehensive evaluation of
the rules would have almost no interpretive value. For this
reason, it is appropriate to determine safety of only ―narrow
things", in this case approach.
APPROACH
Approach to landing is the most dangerous part of the
flight and therefore stakeholders must pay more attention to
draft regulations for ensuring the safe course of it. The main
subjects can be identified in all processes involved in flight.
From analysis of every part of these subjects could arise sub-
characteristics and parameters, which are necessary to evaluate
for the safety analysis.
APPROACH CHARACTERISTICS AND PARAMETERS
Table 1 – Characteristics / Parameters vs. Evaluation
(Evaluation has not given value, see Sec. 4.2)
Characteristic/Parameter
Evaluation
Approach type x
- Non precision
- APV
- Precision
x
x
x
Approach procedure x
- ILS
- GBAS
- VOR
- NDB
- LLZ
- LNAV
- LNAV/VNAV
- LPV
x
x
x
x
x
x
x
x
Meteorological conditions x
- Visibility horizontally
- Visibility vertically
- Cloud base
x
x
x
Decision height/altitude x
Aerodrome x
- Runway
o Surface
o Lighting
Centreline
Side-lines
Threshold
TDZ
o Gradients
o Elevation
o Length
o Width
- Runway strip
o Gradients
o Elevation
o Length
x
x
x
x
x
x
x
x
x
x
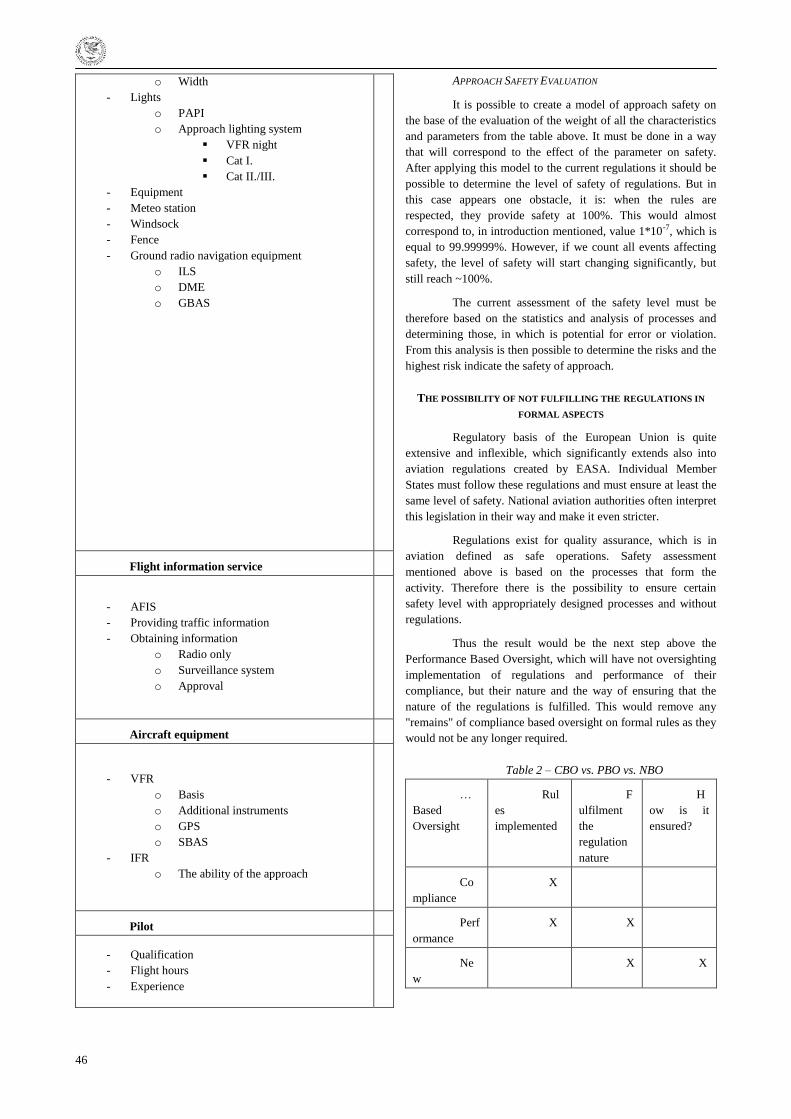
46
o Width
- Lights
o PAPI
o Approach lighting system
VFR night
Cat I.
Cat II./III.
- Equipment
- Meteo station
- Windsock
- Fence
- Ground radio navigation equipment
o ILS
o DME
o GBAS
x
x
x
x
x
x
x
x
x
x
x
x
x
x
x
x
x
x
x
x
Flight information service x
- AFIS
- Providing traffic information
- Obtaining information
o Radio only
o Surveillance system
o Approval
x
x
x
x
x
x
Aircraft equipment x
- VFR
o Basis
o Additional instruments
o GPS
o SBAS
- IFR
o The ability of the approach
x
x
x
x
x
x
x
Pilot x
- Qualification
- Flight hours
- Experience
x
x
x
APPROACH SAFETY EVALUATION
It is possible to create a model of approach safety on
the base of the evaluation of the weight of all the characteristics
and parameters from the table above. It must be done in a way
that will correspond to the effect of the parameter on safety.
After applying this model to the current regulations it should be
possible to determine the level of safety of regulations. But in
this case appears one obstacle, it is: when the rules are
respected, they provide safety at 100%. This would almost
correspond to, in introduction mentioned, value 1*10-7, which is
equal to 99.99999%. However, if we count all events affecting
safety, the level of safety will start changing significantly, but
still reach ~100%.
The current assessment of the safety level must be
therefore based on the statistics and analysis of processes and
determining those, in which is potential for error or violation.
From this analysis is then possible to determine the risks and the
highest risk indicate the safety of approach.
THE POSSIBILITY OF NOT FULFILLING THE REGULATIONS IN
FORMAL ASPECTS
Regulatory basis of the European Union is quite
extensive and inflexible, which significantly extends also into
aviation regulations created by EASA. Individual Member
States must follow these regulations and must ensure at least the
same level of safety. National aviation authorities often interpret
this legislation in their way and make it even stricter.
Regulations exist for quality assurance, which is in
aviation defined as safe operations. Safety assessment
mentioned above is based on the processes that form the
activity. Therefore there is the possibility to ensure certain
safety level with appropriately designed processes and without
regulations.
Thus the result would be the next step above the
Performance Based Oversight, which will have not oversighting
implementation of regulations and performance of their
compliance, but their nature and the way of ensuring that the
nature of the regulations is fulfilled. This would remove any
"remains" of compliance based oversight on formal rules as they
would not be any longer required.
Table 2 – CBO vs. PBO vs. NBO
…
Based
Oversight
Rul
es
implemented
F
ulfilment
the
regulation
nature
H
ow is it
ensured?
Co
mpliance
X
Perf
ormance
X X
Ne
w
X X

47
CONCLUSION
In this article is pointed out the challenge of
determining the safety of regulations with regard to the human
factor. The result of such evaluation would be able to change the
way of aviation authorities‘ supervision, and thus create space
for radical progress. This challenge is to change the type of
supervising of aviation organizations. Already now the oversight
moves from Compliance based to Performance based, which
will certainly have a positive impact on safety, but it still means
"strengthen oversight", which contains in itself the compliance.
Move to the next level of supervision (no longer CBO) would
allow greater flexibility of rules and automatic costs reduction.
With this is related another challenge for organizations, which
must ensure the safety, although legislation falls into the soft
category. Also described in this article are two methods of
evaluating the safety and is expected the permanent use of
methods based on statistics of accidents and incidents.
ACKNOWLEDGEMENTS
This paper was supported by the Grant Agency of the
Czech Technical University in Prague, grant No.
SGS13/090/OHK2/1T/16.
REFERENCES
[1] AIP ČR [online]. Available at
<http://lis.rlp.cz/ais_data/www_main_control/frm_
cz_aip.htm>
[2] INTERNATIONAL CIVIL AVIATION ORGANIZATION:
Doc 9859 – Safety Management Manual. Third Edition.
2012
[3] EASA: Proceeding from EASA Safety Conference, Cologne,
2012
[4] INTERNATIONAL CIVIL AVIATION ORGANIZATION:
Global Aviation Safety Plan (GASP).Montreal, 2007
[5] L standards - ICAO Annexes [online]. Available at
<http://lis.rlp.cz/predpisy/predpisy/index.htm>
48
AIRCRAFT ICING CONDITIONS
Dr. Sandra Krollová
Air Transport Department, University of Ţilina, Faculty of Operation and Economics of Transport and
Communications, Slovakia
Abstract – Modern transport aircraft have efficient anti-icing
and de-icing systems. However, there can be occasions when the
ice build-up is so severe that a system becomes less effective in
keeping the skin clear of ice. Additionally there are instances
where systems become inoperative. Knowledge of airframe icing
characteristics can reduce possible hazards.
Key words – icing accretion conditions, icing types, effects on
aircraft, in-flight occurrence probability
I. INTRODUCTION
Icing is a meteorological phenomenon affecting flight
of most aircraft. Even small deposits can have major effects on
performance. The National Transportation Safety Board of the
United States lists 4054 accidents/incidents between 1963 and
2006 with icing as a factor, causing a total of 2975 fatalities.
90% of these accidents involved general aviation. EASA
between 1999 and 2008 reported 8 icing- related accidents
resulting in 5 fatalities. Commercial aircraft have access to de-
icing facilities and tend to climb through icing conditions
regions in a relatively short time. In contrast, general aviation
aircraft more often remain in cloud layers for a longer time
resulting in ice accumulation on aircraft.
II. ICING CONDITIONS
Water in its liquid state is necessary for ice to form on
an airframe. True airframe icing can only occur in cloud
precipitation or fog. There will be no icing in the cirriform
clouds as they are composed of ice crystals which will not
adhere to an aircraft skin. Frost, which is ice crystals, can form
by sublimation. The ambient temperature should be below 0 °C
for ice to form and the same condition should apply to the
airframe itself. However, instances have occurred where an
aircraft has been flying at 9 km or more for some hours allowing
a low fuel surface. In these circumstances ice can form at a
lower level despite the ambient temperature being below 0 °C.
This can also cause ice formation on the aircraft on the ground
when there is rain, drizzle or fog and the aircraft has been on the
ground for a short time.
The second essential condition for ice formation is
presence of super-cooled water droplets. These water droplets
stay liquid at temperatures as low as -45 °C. If an aircraft comes
into contact with these droplets, the surface tension breaks down
and the droplets start to freeze. The severity of the icing will
partly depend on the size of the droplets. This is controlled by
the cloud type and the temperature. Large super-cooled water
droplets cannot occur in the general run of layered clouds such
as Stratus because the basic cloud droplets are small. In Cu, Cb
and Ns large basic cloud droplets can be expected. The
temperature effects are governed by the fact that the lower the
temperature the smaller the droplet that can exist in a super-
cooled form. Therefore as the temperature in the cloud reduces
from below 0 °C so the larger droplets progressively become ice
crystals and thus cannot cause airframe icing. Different types of
icing occur in dependence on the cloud type and the ambient
temperature.
III. ICING TYPES
In-flight icing occurs when an aircraft flies through
visible moisture, such as rain or cloud droplets, and the aircraft
structure is below the freezing temperature of water. Three types
of in-flight icing are clear, rime and mixed. A fourth type of
icing, frost, accumulates when aircraft is on the ground.
CLEAR ICE
Clear ice occurs when the temperature is close the
freezing (from 5 °C or 0 °C to -10 °C) , quite often in Cu and Cb
clouds that are generating large raindrops. Clear ice looks as
clear as glass; it is transparent and has a smooth surface. It is
very tough and adheres strongly to the aircraft skin. After impact
with a cold surface, the liquid portion of the super-cooled
droplets flows out over the surface and gradually freezes into a
smooth sheet of ice. Subsequent drops freeze on top of the ice
and similarly flow over the surface, following the shape of the
structure. Clear ice will only form in clouds where the basic
droplets are large and thus it occurs in Cu, Cb or Ns clouds.
Clear ice can build up quickly, adding weight and
disrupting the aerodynamic efficiency of the aircraft. Clear ice
changes the shape of the wing and disrupts the airflow over and
under the wing. Lift decreases and drag increase. As little as one
centimeter of ice on the leading edge of a wing can reduce lift
by 50%. Although clear ice is not as common as rime ice, clear
ice that forms due to freezing rain or drizzle can build to
hazardous amount in just a few minutes.
Rain ice is a type of clear ice which forms outside the
cloud in rain. It can form ahead of a warm front or occlusion at
low level and covers only a narrow range of altitudes. If rain is
falling from Ns and there is an inversion with temperatures
below 0 °C at the front, then the rain can become cooled. If an

49
aircraft has been flying in this cold air for some time and
therefore has a skin temperature below zero, the rain impacting
on the airframe will cause clear ice to form. This can build up
very rapidly causing the most dangerous form of icing. It is
likely to occur on climb-out or on the approach and is therefore
particularly hazardous. The rain ice conditions frequently occur
in winter in Europe, particularly when the air ahead of the front
is polar continental providing the low temperature air under the
frontal surface.
Figure 12.2 Clear ice (source:
NASA Lewis Research centre)
Figure 12.3 Rime ice (source:
Météo France)
Figure 12.4 Mixed ice (source
NASA-Lewis research Centre)
Figure 12.5 Hoar frost (source
NASA-Lewis research Centre)
RIME ICE
Rime ice occurs at lower temperatures than clear ice,
usually in the range from -10 °C to -45°C and is common in
Stratus cloud and in freezing fog. Because the water droplets
that create rime ice are colder than droplets that form clear ice,
they contain less water; therefore the droplets freeze rapidly and
have little liquid to spread over the aircraft surface. The rapid
freezing of the small droplets gives rime ice its characteristic
milky-white, almost opaque appearance with a light texture. It
actually looks very much like a coating of light snow or frost,
but is much harder and clings tenaciously to the surface.
Rime ice rarely adds much weight to an aircraft, but it
can also cause aerodynamic problems for the wings. Although it
does not spread all over the wing like clear ice, rime ice can be
very difficult to melt off because it forms at such low
temperatures. It can also cause some loss of aerofoil shape and
air intakes can be affected.
MIXED ICE
Mixed ice is defined as a combination of rime and
clear ice. It results when flying through area with temperatures
around -10 °C and precipitation with varying droplet sizes. It
can also form when icing occurs with wet snow. Mixed ice
combines the worst of rime and clear ice and is often associated
with Sc and Cb clouds.
HOAR FROST
Hoar frost is frost which can completely cover an
airframe. It is a minor hazard compared with clear and rime ice.
The frost forms in clear air due to sublimation when
air in contact with a cold airframe is cooled below dew point
temperature and below 0 °C. The water vapour in the contact air
then changes immediately to ice crystals. It is necessary for this
frost to be cleared before take-off so that windscreens and
canopies are clear, to obviate skin friction and a longer take-off
run and also to stop radio interference which can occur with
frost on aerials.
Hoar frost can form in flight if an aircraft has to make
a sudden descent from a high level to a warm moist layer. The
very cold airframe can then be in contact with a large amount of
water vapor at the lower level and sublimation and frost results.
It can also occur if an aircraft has been outside for the whole of
a winter night and then early the next morning does a steep
climb out through an inversion. The effects are not severe and
the hoar frost can be cleared quickly.
PACK SNOW
This is icing due to a mixture of snow and super-
cooled water droplets. It can block air intakes, undercarriage
wells and any other aircraft openings. Generally, the wetter the
snow, the more chance it has to stick to an aircraft. Wet snow
has higher water content than dry snow (because it is not as
cold) and will stick to almost everything. Wet snowflakes are
also usually bigger than dry ones.
Wet snow will build up on things protruding into the
air flow, such as pitot tubes, windshields, handles, wheel pants.
It can even stick to the wings. Usually the major problem with
an accumulation of wet snow on an airplane is weight. It is
possible for an airplane to accumulate so much snow that it can
no longer maintain level flight. The real danger when flying in
snow is that, it can easily change into true icing conditions when
a slightly colder temperature occurs.
CONDITIONS FOR ICING ACCRETION
The following forecast rules will help interpret the
possibility of icing:
In general, the colder the air temperature and wider the dew
point spread, the less chance of icing,
If the temperature is 0 °C to -7 °C and the dew point spread
is greater than 2 °C, there is an 80% probability of no icing,
If the temperature is from -8 °C to -15 °C and the dew point
spread is greater than 3 °C, there is an 80% chance of no
icing,
If the temperature is below -22 °C, there is a 90% chance of
no icing,
Cumulus cloud created by solar heating have a 90% chance
of light icing and icing will usually occur in the upper
portion of the clouds,
Moderate icing can be expected in freezing drizzle, when
clouds are in a deep low-pressure area and in clouds within
100 km of a cold front,
Severe icing can be expected in freezing rain.
50
If clouds are formed orographically, or if a cloud
passes close to or over hills or mountains, then additional
upcurrents can be caused by the wind against the hills. The
result is larger droplets creation and heavier concentration of
droplets. Cloud formed orographically in stable air will have a
lowered freezing level which can be a few thousand feet below
the forecast freezing level for the area, therefore lower than
anticipated.
Icing intensity levels are relative because various
aircraft accumulate and handle icing differently. Different types
of aircraft accrete ice at different rates, depending on their
airframe shapes and speed differences. For example,
temperature rises with airspeed. High airspeeds create surface
friction on the aerofoils, thus preventing ice accumulation.
Consequently, pilots of high-performance jet airplanes might not
reporting icing, but slower-moving aircraft flying through the
same area might experience heavy ice accumulation. The main
factor affecting the icing intensity is the amount of free water.
The size of droplets is dependent on the cloud type and the
temperature in cloud. Icing types intensity in dependence on
droplets size and cloud type is defined as:
Moderate/severe clear ice occurs in large Cu and Cb,
smaller Cu, Ns with heap type characteristics and Ac
castellanus. Super-cooled water droplets can only be large in
Cu, Cb, and Ns and then only in the cloud temperature range
0 °C to – 20 °C.
Light/moderate rime iceoccurs in layer clouds but light to
moderate is observed in Sc. In layer clouds small super-
cooled water droplets are present from 0 °C to -10 °C.
Light rime ice is usually present in layer clouds at
temperatures from -10 °C to -45 °C, where super-cooled
water droplets are very small.
Rime ice – super-cooled water droplets are small in Cu, Cb,
and Ns from -20 °C to -45 °C.
Nil icing conditions are typical for Ci, Cs, Cc, where ice
crystals will not adhere to the airframe.
EFFECTS OF ICING
Airframe icing can cause a serious loss of
performance, control and safety. The effects include the
following:
Aerodynamic - Ice tends to form in the greatest depth, on the
leading edges of wings and tailplanes. The result is reduced
lift and increased drag, weight, stalling speed and fuel
consumption. Control surfaces can similarly be affected and
thus control suffers. It is possible for pieces of ice to break
off other fuselage surfaces and to jam between the control
surface and the wing or tail.
Weight of ice - In its severest form ice can adhere at a rate
of 2.5 cm in 2 minutes. The weight plus the rate of
formation will not be constant over an airframe. This will
cause a wandering centre of gravity, instability and
subsequent control difficulties. Ice on a propeller will
inevitably form unevenly causing a weight differential on
the blades. This leads to the engine rocking on its mountings
and producing severe vibration.
Pitot/Static icing - Ice can block pitot and static inlets
causing readings of pressure instruments to be grossly in
error. The instruments include altimeter, ASI, VSI and
Machmeter.
Piston engine icing - This icing occurs in the intake area
and can restrict the flow of air to an engine. There is fuel
icing which is caused by water in the fuel freezing in pipe
bends thus reducing fuel flow to an engine. ―Coring‖ can
occur when very low temperatures cause oil in the oil cooler
lines to become viscous and even to congeal. This results in
only a small flow of oil along a pipe core which can cause
engine seizure.
Carburettor icing - This is caused by a lowering of the
temperature inside the carburettor so that ice can form. The
temperature can be reduced due to two causes: the
evaporation of fuel which involves the absorption of latent
heat from the metal internal parts and the cooling of the air
by adiabatic expansion as it passes through the venture in
the carburettor. Thus the inside of the carburettor can
become very cold and any water droplets from cloud or fog
in the inducted air can quickly form ice. The total reduction
in temperature can be excess of 30 °C and therefore icing
can occur in clear air at high temperatures if the relative
humidity is 30% or more.
Turbine/Jet engine icing - Ice in the first stage compressor
blade area can form in the presence of super-cooled water
droplets and generally the greater the engine revolutions the
greater the icing. An accompanying high airspeed increases
the mass of air entering the engine and the water thus
droplet content. Another effect related to high engine
revolutions is a pressure reduction inside the intake which
can cause an adiabatic temperature fall of some 5 °C. Hence
icing can occur at temperatures up to 5 °C. The clear air
icing can occur with the aircraft on the ground if engines are
run at high revolutions. Fuel inlet filters can be subject to
icing when the fuel temperature is below 0 °C after long
periods of flight. Engine power indications on the flight
deck can be in error if there is ice on engine inlet pressure
probes.
General - A thin film of ice or ice crystals can cause skin
friction resulting in a need for a longer take-off run.
Windscreens and canopies can be obscured. Undercarriage
doors can be iced up in the closed position causing delay in
gear deployment. Ice on aerials can cause radio interference
and the weight may cause a fixed aerial to break off.
Aircraft with tail mounted engines can be damaged by
ingress of ice breaking away from the wings.
IV. CONCLUSION
Severity of airframe icing is dependent on
temperature, liquid water content, droplet size and vertical
motion.The concentration of water droplets is higher in
cumuliform clouds because of the stronger upcurrents, thus
causing greater severity of icing. There should always be a
greater concentration of droplets near the base of a cloud
because of proximity of condensation level.
For icing to occur super-cooled water must be present
in the atmosphere (liquid water droplets with a temperature
below 0° C).The more super-cooled water there is present
(Super-Cooled Liquid Water Content), the more significant is
the icing risk. SLWC decreases with decreasing temperature.The
larger the super-cooled water droplet, the more significant the
51
risk.Only very small droplets seem to remain super-cooled
below -20° C, hence the worst icing is likely between 0 C and -
15 C.Super-cooled water droplets cannot exist with temperatures
below -40° C.To determine the aircraft icing probability, it is
necessary to interpret actual and forecast vertical profiles of the
atmosphere, rainfall radar and satellite imagery together with
knowledge and understanding of the characteristics of different
types of cloud.
Airframe icing is a serious aviation hazard. The
possible range of effects on an aircraft is reduction in the
aerodynamic properties, change in flight performance, increase
in weight and uneven loading, engine intakes become blocked,
undercarriage retraction/extension problems, control surfaces
jam or become stiff, pitot tubes become blocked,
communications affected, vision impaired. Engine or piston
icing occurs under conditions of high relative humidity close to
freezing when the underpressure in a piston causes the humidity
to condensate and freeze within the engine.
Aside from meteorological factors, the rate of ice
build-up on the airframe also depends on the characteristics of
the aircraft. Fast aircraft with thin wing cross-sections are more
susceptible to deteriorating aerodynamics, and hence are more
susceptible to ice accretion.
This paper is published as one of the scientific
outputs of the project: „CENTRE OF EXCELLENCE FOR
AIR TRANSPORT“, ITMS: 26220120065.
We support research activities in Slovakia. Project
is co-financed by EU.
REFERENCES
[1] Forecasters´ reference book. Meteorological Office
College, December 1996The Met. Office, Bracknell ISBN
0861803213.
[2] AVIATION HAZARDS EDUCATION AND TRAINING
PROGRAMME ETR-20. Reference 2 WMO/TD-No. 1390.
Secretariat of the World Meteorological Organization.
Geneva, Switzerland´. June 2007.
[3] Lankford T. T.: Aircraft Icing. McGraw-Hill, New York.
2000.
[4] Newton D.: Severe Weather Flying. Third edition. Aviation
Supplies and Academics, Inc. Newcastle, Washington. 2002.
[5] Rogers R. R. and Yau K. M.: A short course in cloud
physics. Third edition. Butterworth Heinemann, Elsevier
Science. 1996.
[6] Santurette P., Georgiev Ch.: Weather analysis and
forecasting. Elsevier Academic Press. 2005.
52
COSTS CALLCULATION OF AIRSIDE OPERATIONAL ERRORS
AND THEIR COSEQUENCES
Ing. Mária Letanovská
Air Transport Department, University of Zilina
Ing. Martin Hromádka
Air Transport Department, University of Zilina
Abstract – The paper discusses cost structure of airside
operational errors with focus on ramp handling processes.
Costs can be spited into primary and secondary and calculation
of both sub-groups is presented. Especially secondary costs are
difficult to figure out as they comprise of various sub-categories
that need to be taken into account.
Key words – repair costs, delay costs, operational errors, costs
calculation.
I. INTRODUCTION
Airlines spend billions of euros as consequences of
operational errors every year. With air traffic constantly
growing, this issue deserves more attention than ever.
Since it would be very difficult to figure out costs of
operational errors of the whole aviation operation, this paper
will focus on ground handling process, i.e. ramp operation hence
the consequences of ramp operational errors. Even a little
damage on aircraft (few square centimeters for instance) can
cause significant financial costs, not just in terms of repair costs.
In this case, cost structure is much more comprehensive. This
issue will be discussed and presented later on.
Airlines pay high amount of attention to mitigating the
safety operational risks. In order to decide whether the risk that
caused particular error is worth of spending scares resources to
mitigation effort, it is necessary to calculate the costs of
particular ground handling errors as well as its consequences on
the airline operation. The example of such a calculation will be
provided within this paper.
II. DEFINITIONS
First off, it is necessary to define generic terms that
will be used in this paper.
Enerror is the circumstance in which planned action
fails to achieve the desired outcome.
An incident is an occurrence or event that interrupts
normal procedure or precipitates a crisis.
An accident is an unexpected or undesirable event,
especially one resulting in damage or harm.
III. COST STRUCTURE
As it was stated at the beginning, error consequences
consist of few sub-groups. They can be divided into the primary
(repair) costs and secondary (delays) costs. The sum of these
two categories creates the total costs of certain error. The source
of the repair costs will be explained as well as delay cost
calculation.
PRIMARY COSTS – REPAIR COSTS
Each airline should have the database at its disposal
which contains all repairs costs of the particular year. With this,
there are no more difficulties in repair costs estimation. These
costs could be very easily matched with database errors
according to the date, type of aircraft and damage description.
Labor costs were also involved in the final price.
SECONDARY COSTS – DELAY COSTS
The unavailability of an aircraft is a tough situation for
an airline. When damage occurs on the aircraft and the damage
leads to a situation where the aircraft is grounded, the damaged
aircraft must be replaced by another aircraft to continue the
flight. If not, the flight might be cancelled.In order to prevent
such situations, most airlines maintain a stand-by aircraft to
replace the grounded aircraft. The costs to maintain a stand-by
aircraft is estimated, according to the rule of thumb, 35 000
Euros per day for one narrow body aircraft cancellation and 125
000 Euros per day for wide body aircraft cancellation (together
with indirect costs). While indirect costs are not claimed by the
insurance, the cost for the repair of the damage is claimed via
the insurance (direct costs).
On the top of that, there are another costs arising when
the flight is delayed due to aircraft damage. In order to calculate
the costs of time, the 2011 figures approved and issued by
EUROCONTROL are presented. These are designed as a
reference model for European delay costs that were incurred by
airlines. We can split these costs into two basic stages. Delay
costs can be represented as strategic (or planning costs), tactical
(operational costs) and reactionary (or network costs).
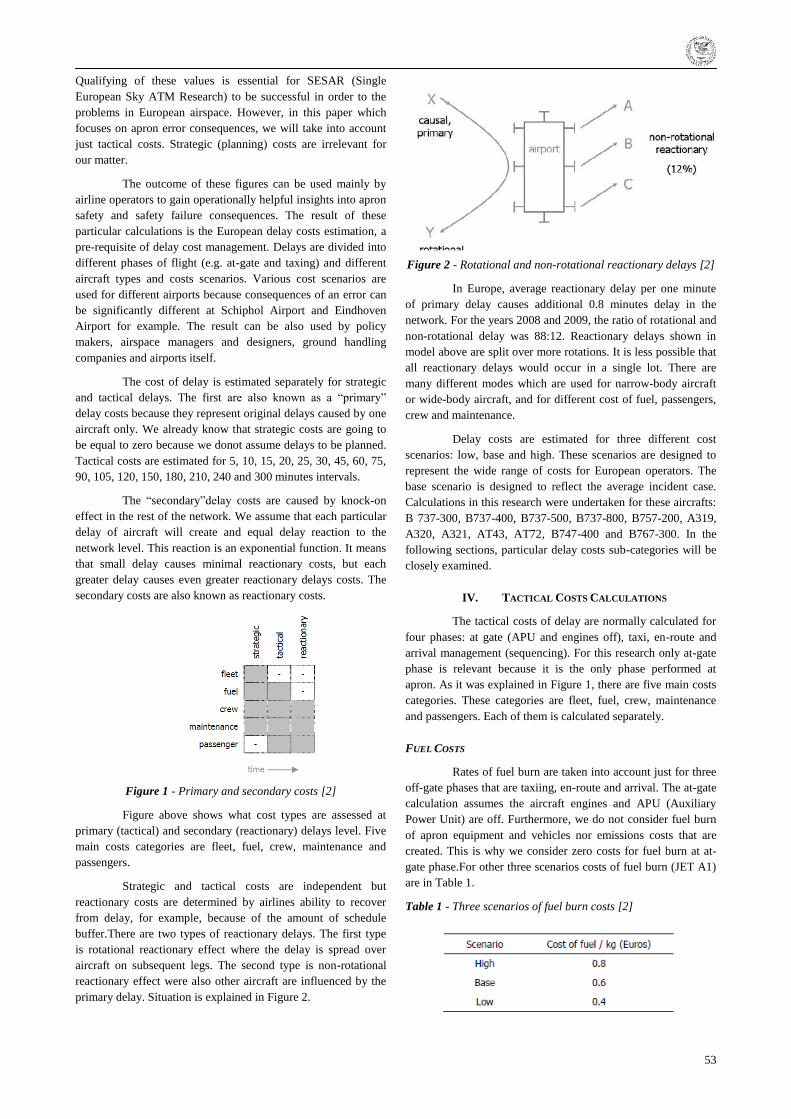
53
Qualifying of these values is essential for SESAR (Single
European Sky ATM Research) to be successful in order to the
problems in European airspace. However, in this paper which
focuses on apron error consequences, we will take into account
just tactical costs. Strategic (planning) costs are irrelevant for
our matter.
The outcome of these figures can be used mainly by
airline operators to gain operationally helpful insights into apron
safety and safety failure consequences. The result of these
particular calculations is the European delay costs estimation, a
pre-requisite of delay cost management. Delays are divided into
different phases of flight (e.g. at-gate and taxing) and different
aircraft types and costs scenarios. Various cost scenarios are
used for different airports because consequences of an error can
be significantly different at Schiphol Airport and Eindhoven
Airport for example. The result can be also used by policy
makers, airspace managers and designers, ground handling
companies and airports itself.
The cost of delay is estimated separately for strategic
and tactical delays. The first are also known as a ―primary‖
delay costs because they represent original delays caused by one
aircraft only. We already know that strategic costs are going to
be equal to zero because we donot assume delays to be planned.
Tactical costs are estimated for 5, 10, 15, 20, 25, 30, 45, 60, 75,
90, 105, 120, 150, 180, 210, 240 and 300 minutes intervals.
The ―secondary‖delay costs are caused by knock-on
effect in the rest of the network. We assume that each particular
delay of aircraft will create and equal delay reaction to the
network level. This reaction is an exponential function. It means
that small delay causes minimal reactionary costs, but each
greater delay causes even greater reactionary delays costs. The
secondary costs are also known as reactionary costs.
Figure 1 - Primary and secondary costs [2]
Figure above shows what cost types are assessed at
primary (tactical) and secondary (reactionary) delays level. Five
main costs categories are fleet, fuel, crew, maintenance and
passengers.
Strategic and tactical costs are independent but
reactionary costs are determined by airlines ability to recover
from delay, for example, because of the amount of schedule
buffer.There are two types of reactionary delays. The first type
is rotational reactionary effect where the delay is spread over
aircraft on subsequent legs. The second type is non-rotational
reactionary effect were also other aircraft are influenced by the
primary delay. Situation is explained in Figure 2.
Figure 2 - Rotational and non-rotational reactionary delays [2]
In Europe, average reactionary delay per one minute
of primary delay causes additional 0.8 minutes delay in the
network. For the years 2008 and 2009, the ratio of rotational and
non-rotational delay was 88:12. Reactionary delays shown in
model above are split over more rotations. It is less possible that
all reactionary delays would occur in a single lot. There are
many different modes which are used for narrow-body aircraft
or wide-body aircraft, and for different cost of fuel, passengers,
crew and maintenance.
Delay costs are estimated for three different cost
scenarios: low, base and high. These scenarios are designed to
represent the wide range of costs for European operators. The
base scenario is designed to reflect the average incident case.
Calculations in this research were undertaken for these aircrafts:
B 737-300, B737-400, B737-500, B737-800, B757-200, A319,
A320, A321, AT43, AT72, B747-400 and B767-300. In the
following sections, particular delay costs sub-categories will be
closely examined.
IV. TACTICAL COSTS CALCULATIONS
The tactical costs of delay are normally calculated for
four phases: at gate (APU and engines off), taxi, en-route and
arrival management (sequencing). For this research only at-gate
phase is relevant because it is the only phase performed at
apron. As it was explained in Figure 1, there are five main costs
categories. These categories are fleet, fuel, crew, maintenance
and passengers. Each of them is calculated separately.
FUEL COSTS
Rates of fuel burn are taken into account just for three
off-gate phases that are taxiing, en-route and arrival. The at-gate
calculation assumes the aircraft engines and APU (Auxiliary
Power Unit) are off. Furthermore, we do not consider fuel burn
of apron equipment and vehicles nor emissions costs that are
created. This is why we consider zero costs for fuel burn at at-
gate phase.For other three scenarios costs of fuel burn (JET A1)
are in Table 1.
Table 1 - Three scenarios of fuel burn costs [2]
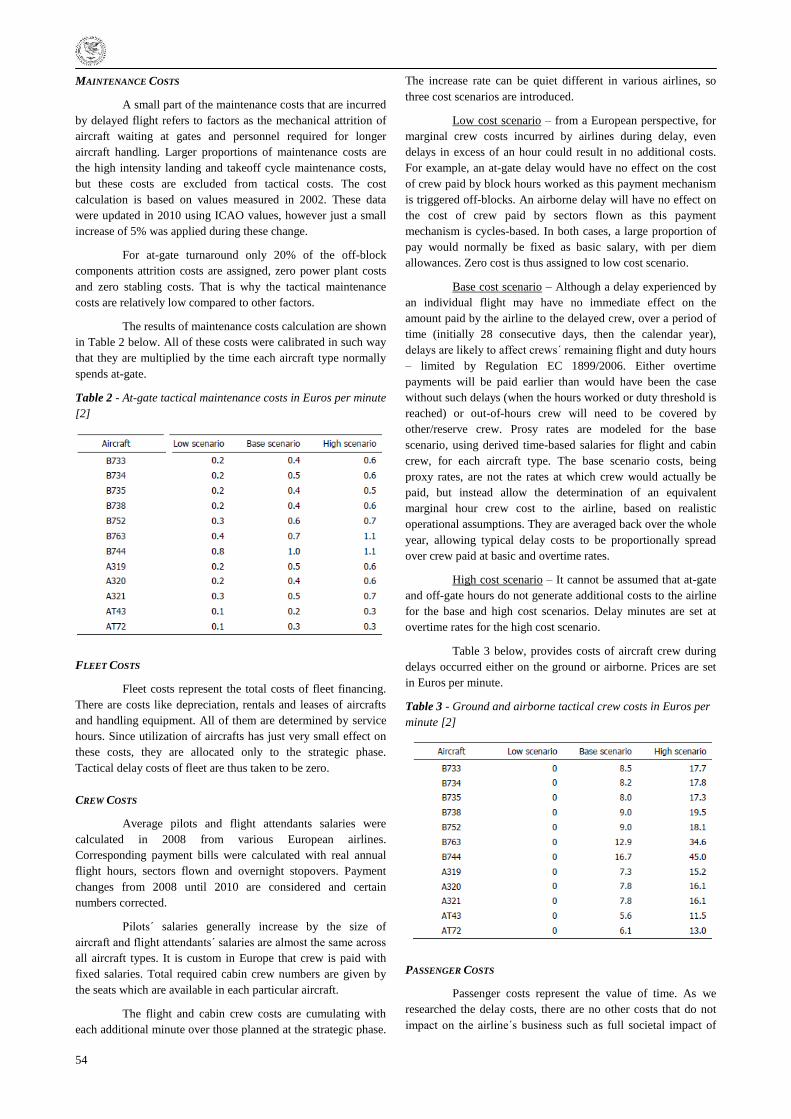
54
MAINTENANCE COSTS
A small part of the maintenance costs that are incurred
by delayed flight refers to factors as the mechanical attrition of
aircraft waiting at gates and personnel required for longer
aircraft handling. Larger proportions of maintenance costs are
the high intensity landing and takeoff cycle maintenance costs,
but these costs are excluded from tactical costs. The cost
calculation is based on values measured in 2002. These data
were updated in 2010 using ICAO values, however just a small
increase of 5% was applied during these change.
For at-gate turnaround only 20% of the off-block
components attrition costs are assigned, zero power plant costs
and zero stabling costs. That is why the tactical maintenance
costs are relatively low compared to other factors.
The results of maintenance costs calculation are shown
in Table 2 below. All of these costs were calibrated in such way
that they are multiplied by the time each aircraft type normally
spends at-gate.
Table 2 - At-gate tactical maintenance costs in Euros per minute
[2]
FLEET COSTS
Fleet costs represent the total costs of fleet financing.
There are costs like depreciation, rentals and leases of aircrafts
and handling equipment. All of them are determined by service
hours. Since utilization of aircrafts has just very small effect on
these costs, they are allocated only to the strategic phase.
Tactical delay costs of fleet are thus taken to be zero.
CREW COSTS
Average pilots and flight attendants salaries were
calculated in 2008 from various European airlines.
Corresponding payment bills were calculated with real annual
flight hours, sectors flown and overnight stopovers. Payment
changes from 2008 until 2010 are considered and certain
numbers corrected.
Pilots´ salaries generally increase by the size of
aircraft and flight attendants´ salaries are almost the same across
all aircraft types. It is custom in Europe that crew is paid with
fixed salaries. Total required cabin crew numbers are given by
the seats which are available in each particular aircraft.
The flight and cabin crew costs are cumulating with
each additional minute over those planned at the strategic phase.
The increase rate can be quiet different in various airlines, so
three cost scenarios are introduced.
Low cost scenario – from a European perspective, for
marginal crew costs incurred by airlines during delay, even
delays in excess of an hour could result in no additional costs.
For example, an at-gate delay would have no effect on the cost
of crew paid by block hours worked as this payment mechanism
is triggered off-blocks. An airborne delay will have no effect on
the cost of crew paid by sectors flown as this payment
mechanism is cycles-based. In both cases, a large proportion of
pay would normally be fixed as basic salary, with per diem
allowances. Zero cost is thus assigned to low cost scenario.
Base cost scenario – Although a delay experienced by
an individual flight may have no immediate effect on the
amount paid by the airline to the delayed crew, over a period of
time (initially 28 consecutive days, then the calendar year),
delays are likely to affect crews´ remaining flight and duty hours
– limited by Regulation EC 1899/2006. Either overtime
payments will be paid earlier than would have been the case
without such delays (when the hours worked or duty threshold is
reached) or out-of-hours crew will need to be covered by
other/reserve crew. Prosy rates are modeled for the base
scenario, using derived time-based salaries for flight and cabin
crew, for each aircraft type. The base scenario costs, being
proxy rates, are not the rates at which crew would actually be
paid, but instead allow the determination of an equivalent
marginal hour crew cost to the airline, based on realistic
operational assumptions. They are averaged back over the whole
year, allowing typical delay costs to be proportionally spread
over crew paid at basic and overtime rates.
High cost scenario – It cannot be assumed that at-gate
and off-gate hours do not generate additional costs to the airline
for the base and high cost scenarios. Delay minutes are set at
overtime rates for the high cost scenario.
Table 3 below, provides costs of aircraft crew during
delays occurred either on the ground or airborne. Prices are set
in Euros per minute.
Table 3 - Ground and airborne tactical crew costs in Euros per
minute [2]
PASSENGER COSTS
Passenger costs represent the value of time. As we
researched the delay costs, there are no other costs that do not
impact on the airline´s business such as full societal impact of
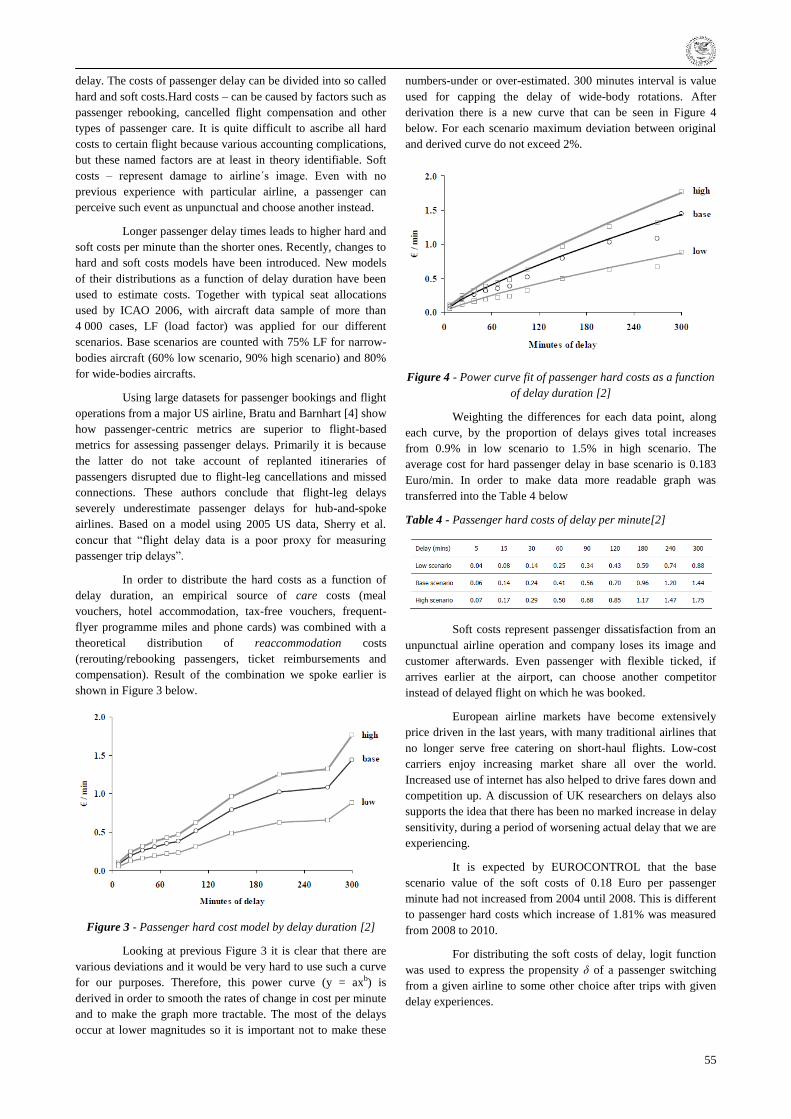
55
delay. The costs of passenger delay can be divided into so called
hard and soft costs.Hard costs – can be caused by factors such as
passenger rebooking, cancelled flight compensation and other
types of passenger care. It is quite difficult to ascribe all hard
costs to certain flight because various accounting complications,
but these named factors are at least in theory identifiable. Soft
costs – represent damage to airline´s image. Even with no
previous experience with particular airline, a passenger can
perceive such event as unpunctual and choose another instead.
Longer passenger delay times leads to higher hard and
soft costs per minute than the shorter ones. Recently, changes to
hard and soft costs models have been introduced. New models
of their distributions as a function of delay duration have been
used to estimate costs. Together with typical seat allocations
used by ICAO 2006, with aircraft data sample of more than
4 000 cases, LF (load factor) was applied for our different
scenarios. Base scenarios are counted with 75% LF for narrow-
bodies aircraft (60% low scenario, 90% high scenario) and 80%
for wide-bodies aircrafts.
Using large datasets for passenger bookings and flight
operations from a major US airline, Bratu and Barnhart [4] show
how passenger-centric metrics are superior to flight-based
metrics for assessing passenger delays. Primarily it is because
the latter do not take account of replanted itineraries of
passengers disrupted due to flight-leg cancellations and missed
connections. These authors conclude that flight-leg delays
severely underestimate passenger delays for hub-and-spoke
airlines. Based on a model using 2005 US data, Sherry et al.
concur that ―flight delay data is a poor proxy for measuring
passenger trip delays‖.
In order to distribute the hard costs as a function of
delay duration, an empirical source of care costs (meal
vouchers, hotel accommodation, tax-free vouchers, frequent-
flyer programme miles and phone cards) was combined with a
theoretical distribution of reaccommodation costs
(rerouting/rebooking passengers, ticket reimbursements and
compensation). Result of the combination we spoke earlier is
shown in Figure 3 below.
Figure 3 - Passenger hard cost model by delay duration [2]
Looking at previous Figure 3 it is clear that there are
various deviations and it would be very hard to use such a curve
for our purposes. Therefore, this power curve (y = axb) is
derived in order to smooth the rates of change in cost per minute
and to make the graph more tractable. The most of the delays
occur at lower magnitudes so it is important not to make these
numbers-under or over-estimated. 300 minutes interval is value
used for capping the delay of wide-body rotations. After
derivation there is a new curve that can be seen in Figure 4
below. For each scenario maximum deviation between original
and derived curve do not exceed 2%.
Figure 4 - Power curve fit of passenger hard costs as a function
of delay duration [2]
Weighting the differences for each data point, along
each curve, by the proportion of delays gives total increases
from 0.9% in low scenario to 1.5% in high scenario. The
average cost for hard passenger delay in base scenario is 0.183
Euro/min. In order to make data more readable graph was
transferred into the Table 4 below
Table 4 - Passenger hard costs of delay per minute[2]
Soft costs represent passenger dissatisfaction from an
unpunctual airline operation and company loses its image and
customer afterwards. Even passenger with flexible ticked, if
arrives earlier at the airport, can choose another competitor
instead of delayed flight on which he was booked.
European airline markets have become extensively
price driven in the last years, with many traditional airlines that
no longer serve free catering on short-haul flights. Low-cost
carriers enjoy increasing market share all over the world.
Increased use of internet has also helped to drive fares down and
competition up. A discussion of UK researchers on delays also
supports the idea that there has been no marked increase in delay
sensitivity, during a period of worsening actual delay that we are
experiencing.
It is expected by EUROCONTROL that the base
scenario value of the soft costs of 0.18 Euro per passenger
minute had not increased from 2004 until 2008. This is different
to passenger hard costs which increase of 1.81% was measured
from 2008 to 2010.
For distributing the soft costs of delay, logit function
was used to express the propensity δ of a passenger switching
from a given airline to some other choice after trips with given
delay experiences.
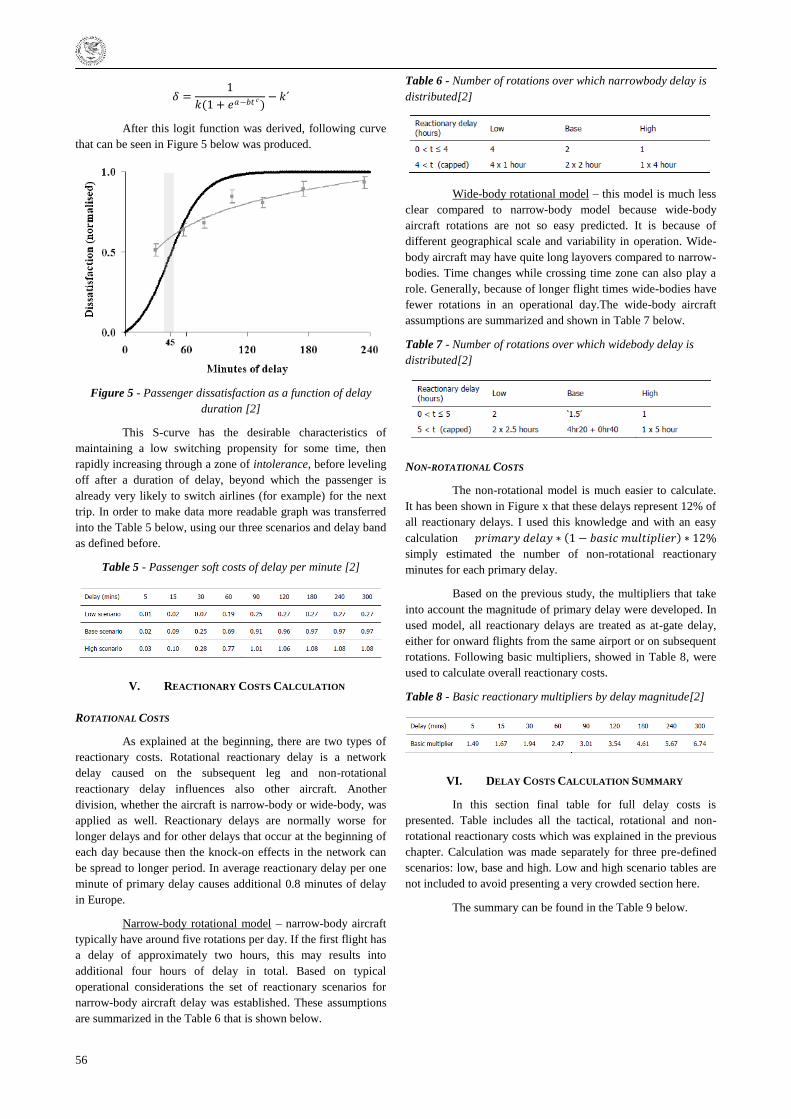
56
𝛿 =1
𝑘(1 + 𝑒𝑎−𝑏𝑡 𝑐)− 𝑘´
After this logit function was derived, following curve
that can be seen in Figure 5 below was produced.
Figure 5 - Passenger dissatisfaction as a function of delay
duration [2]
This S-curve has the desirable characteristics of
maintaining a low switching propensity for some time, then
rapidly increasing through a zone of intolerance, before leveling
off after a duration of delay, beyond which the passenger is
already very likely to switch airlines (for example) for the next
trip. In order to make data more readable graph was transferred
into the Table 5 below, using our three scenarios and delay band
as defined before.
Table 5 - Passenger soft costs of delay per minute [2]
V. REACTIONARY COSTS CALCULATION
ROTATIONAL COSTS
As explained at the beginning, there are two types of
reactionary costs. Rotational reactionary delay is a network
delay caused on the subsequent leg and non-rotational
reactionary delay influences also other aircraft. Another
division, whether the aircraft is narrow-body or wide-body, was
applied as well. Reactionary delays are normally worse for
longer delays and for other delays that occur at the beginning of
each day because then the knock-on effects in the network can
be spread to longer period. In average reactionary delay per one
minute of primary delay causes additional 0.8 minutes of delay
in Europe.
Narrow-body rotational model – narrow-body aircraft
typically have around five rotations per day. If the first flight has
a delay of approximately two hours, this may results into
additional four hours of delay in total. Based on typical
operational considerations the set of reactionary scenarios for
narrow-body aircraft delay was established. These assumptions
are summarized in the Table 6 that is shown below.
Table 6 - Number of rotations over which narrowbody delay is
distributed[2]
Wide-body rotational model – this model is much less
clear compared to narrow-body model because wide-body
aircraft rotations are not so easy predicted. It is because of
different geographical scale and variability in operation. Wide-
body aircraft may have quite long layovers compared to narrow-
bodies. Time changes while crossing time zone can also play a
role. Generally, because of longer flight times wide-bodies have
fewer rotations in an operational day.The wide-body aircraft
assumptions are summarized and shown in Table 7 below.
Table 7 - Number of rotations over which widebody delay is
distributed[2]
NON-ROTATIONAL COSTS
The non-rotational model is much easier to calculate.
It has been shown in Figure x that these delays represent 12% of
all reactionary delays. I used this knowledge and with an easy
calculation 𝑝𝑟𝑖𝑚𝑎𝑟𝑦 𝑑𝑒𝑙𝑎𝑦 ∗ 1 − 𝑏𝑎𝑠𝑖𝑐 𝑚𝑢𝑙𝑡𝑖𝑝𝑙𝑖𝑒𝑟 ∗ 12%
simply estimated the number of non-rotational reactionary
minutes for each primary delay.
Based on the previous study, the multipliers that take
into account the magnitude of primary delay were developed. In
used model, all reactionary delays are treated as at-gate delay,
either for onward flights from the same airport or on subsequent
rotations. Following basic multipliers, showed in Table 8, were
used to calculate overall reactionary costs.
Table 8 - Basic reactionary multipliers by delay magnitude[2]
VI. DELAY COSTS CALCULATION SUMMARY
In this section final table for full delay costs is
presented. Table includes all the tactical, rotational and non-
rotational reactionary costs which was explained in the previous
chapter. Calculation was made separately for three pre-defined
scenarios: low, base and high. Low and high scenario tables are
not included to avoid presenting a very crowded section here.
The summary can be found in the Table 9 below.
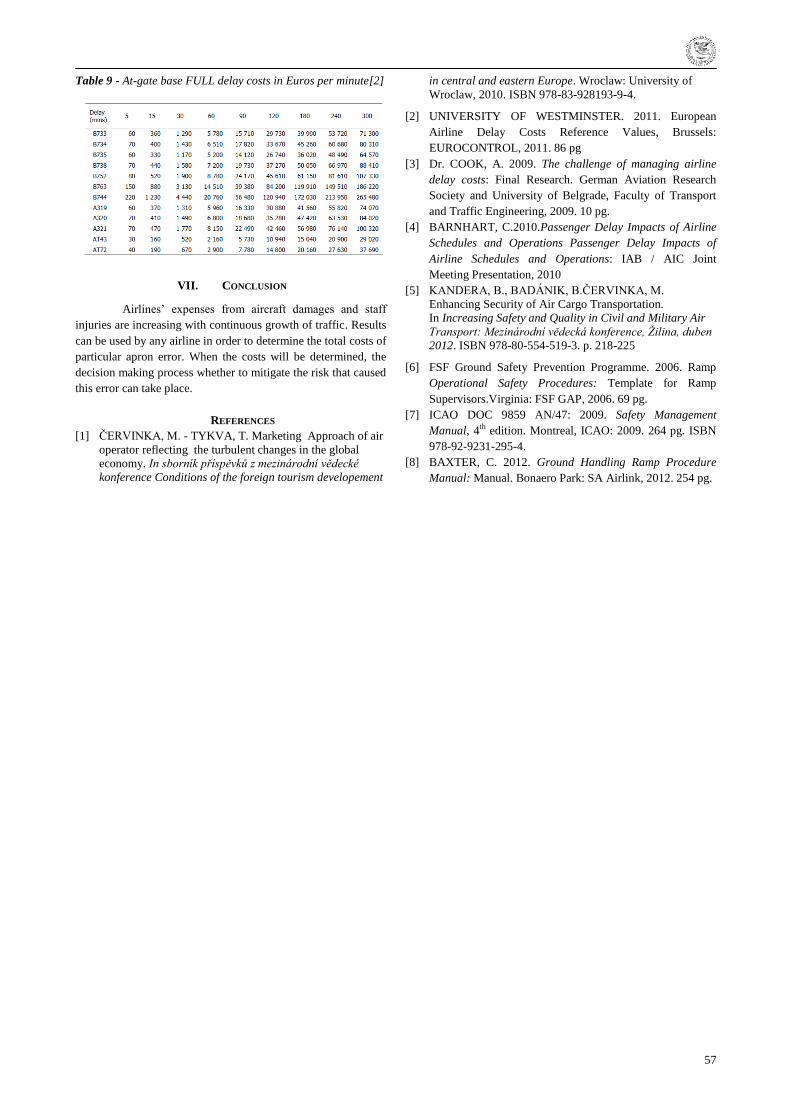
57
Table 9 - At-gate base FULL delay costs in Euros per minute[2]
VII. CONCLUSION
Airlines‘ expenses from aircraft damages and staff
injuries are increasing with continuous growth of traffic. Results
can be used by any airline in order to determine the total costs of
particular apron error. When the costs will be determined, the
decision making process whether to mitigate the risk that caused
this error can take place.
REFERENCES
[1] ČERVINKA, M. - TYKVA, T. Marketing Approach of air
operator reflecting the turbulent changes in the global
economy. In sborník příspěvků z mezinárodní vědecké
konference Conditions of the foreign tourism developement
in central and eastern Europe. Wroclaw: University of
Wroclaw, 2010. ISBN 978-83-928193-9-4.
[2] UNIVERSITY OF WESTMINSTER. 2011. European
Airline Delay Costs Reference Values, Brussels:
EUROCONTROL, 2011. 86 pg
[3] Dr. COOK, A. 2009. The challenge of managing airline
delay costs: Final Research. German Aviation Research
Society and University of Belgrade, Faculty of Transport
and Traffic Engineering, 2009. 10 pg.
[4] BARNHART, C.2010.Passenger Delay Impacts of Airline
Schedules and Operations Passenger Delay Impacts of
Airline Schedules and Operations: IAB / AIC Joint
Meeting Presentation, 2010
[5] KANDERA, B., BADÁNIK, B.ČERVINKA, M.
Enhancing Security of Air Cargo Transportation.
In Increasing Safety and Quality in Civil and Military Air
Transport: Mezinárodní vědecká konference, Žilina, duben
2012. ISBN 978-80-554-519-3. p. 218-225
[6] FSF Ground Safety Prevention Programme. 2006. Ramp
Operational Safety Procedures: Template for Ramp
Supervisors.Virginia: FSF GAP, 2006. 69 pg.
[7] ICAO DOC 9859 AN/47: 2009. Safety Management
Manual, 4th edition. Montreal, ICAO: 2009. 264 pg. ISBN
978-92-9231-295-4.
[8] BAXTER, C. 2012. Ground Handling Ramp Procedure
Manual: Manual. Bonaero Park: SA Airlink, 2012. 254 pg.
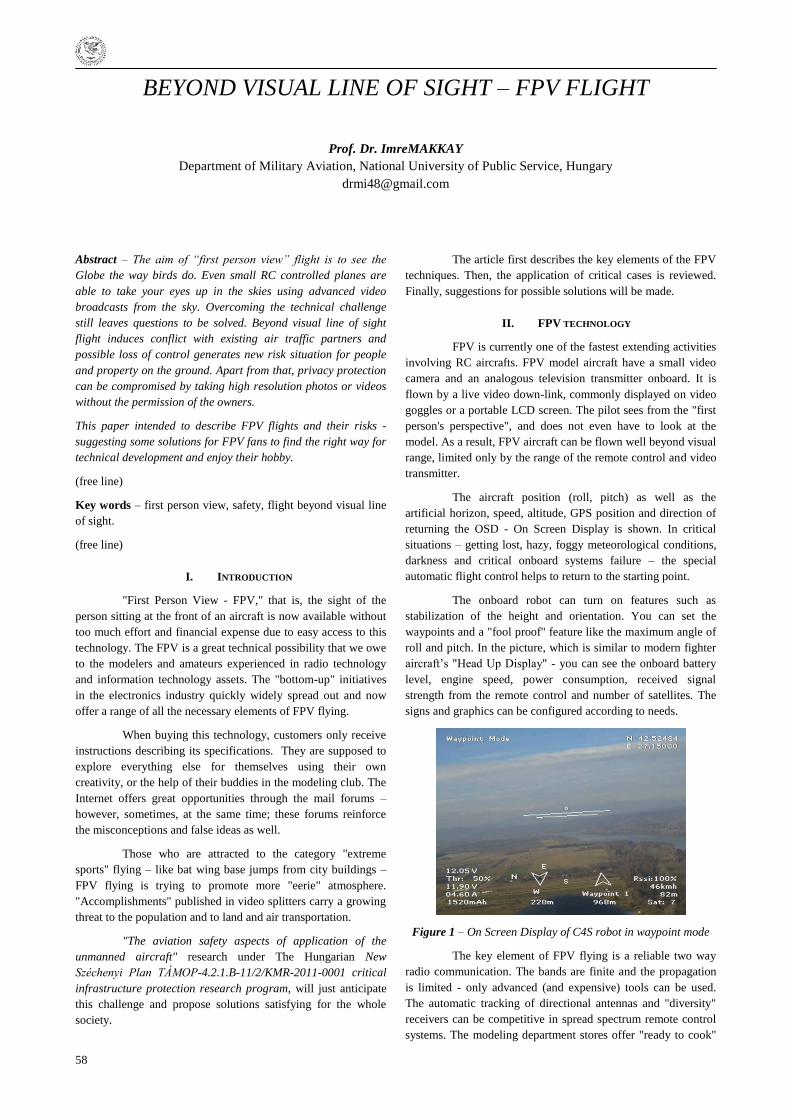
58
BEYOND VISUAL LINE OF SIGHT – FPV FLIGHT
Prof. Dr. ImreMAKKAY
Department of Military Aviation, National University of Public Service, Hungary
Abstract – The aim of ―first person view‖ flight is to see the
Globe the way birds do. Even small RC controlled planes are
able to take your eyes up in the skies using advanced video
broadcasts from the sky. Overcoming the technical challenge
still leaves questions to be solved. Beyond visual line of sight
flight induces conflict with existing air traffic partners and
possible loss of control generates new risk situation for people
and property on the ground. Apart from that, privacy protection
can be compromised by taking high resolution photos or videos
without the permission of the owners.
This paper intended to describe FPV flights and their risks -
suggesting some solutions for FPV fans to find the right way for
technical development and enjoy their hobby.
(free line)
Key words – first person view, safety, flight beyond visual line
of sight.
(free line)
I. INTRODUCTION
"First Person View - FPV," that is, the sight of the
person sitting at the front of an aircraft is now available without
too much effort and financial expense due to easy access to this
technology. The FPV is a great technical possibility that we owe
to the modelers and amateurs experienced in radio technology
and information technology assets. The "bottom-up" initiatives
in the electronics industry quickly widely spread out and now
offer a range of all the necessary elements of FPV flying.
When buying this technology, customers only receive
instructions describing its specifications. They are supposed to
explore everything else for themselves using their own
creativity, or the help of their buddies in the modeling club. The
Internet offers great opportunities through the mail forums –
however, sometimes, at the same time; these forums reinforce
the misconceptions and false ideas as well.
Those who are attracted to the category "extreme
sports" flying – like bat wing base jumps from city buildings –
FPV flying is trying to promote more "eerie" atmosphere.
"Accomplishments" published in video splitters carry a growing
threat to the population and to land and air transportation.
"The aviation safety aspects of application of the
unmanned aircraft" research under The Hungarian New
Széchenyi Plan TÁMOP-4.2.1.B-11/2/KMR-2011-0001 critical
infrastructure protection research program, will just anticipate
this challenge and propose solutions satisfying for the whole
society.
The article first describes the key elements of the FPV
techniques. Then, the application of critical cases is reviewed.
Finally, suggestions for possible solutions will be made.
II. FPV TECHNOLOGY
FPV is currently one of the fastest extending activities
involving RC aircrafts. FPV model aircraft have a small video
camera and an analogous television transmitter onboard. It is
flown by a live video down-link, commonly displayed on video
goggles or a portable LCD screen. The pilot sees from the "first
person's perspective", and does not even have to look at the
model. As a result, FPV aircraft can be flown well beyond visual
range, limited only by the range of the remote control and video
transmitter.
The aircraft position (roll, pitch) as well as the
artificial horizon, speed, altitude, GPS position and direction of
returning the OSD - On Screen Display is shown. In critical
situations – getting lost, hazy, foggy meteorological conditions,
darkness and critical onboard systems failure – the special
automatic flight control helps to return to the starting point.
The onboard robot can turn on features such as
stabilization of the height and orientation. You can set the
waypoints and a "fool proof" feature like the maximum angle of
roll and pitch. In the picture, which is similar to modern fighter
aircraft‘s "Head Up Display" - you can see the onboard battery
level, engine speed, power consumption, received signal
strength from the remote control and number of satellites. The
signs and graphics can be configured according to needs.
Figure 1 – On Screen Display of C4S robot in waypoint mode
The key element of FPV flying is a reliable two way
radio communication. The bands are finite and the propagation
is limited - only advanced (and expensive) tools can be used.
The automatic tracking of directional antennas and "diversity"
receivers can be competitive in spread spectrum remote control
systems. The modeling department stores offer "ready to cook"
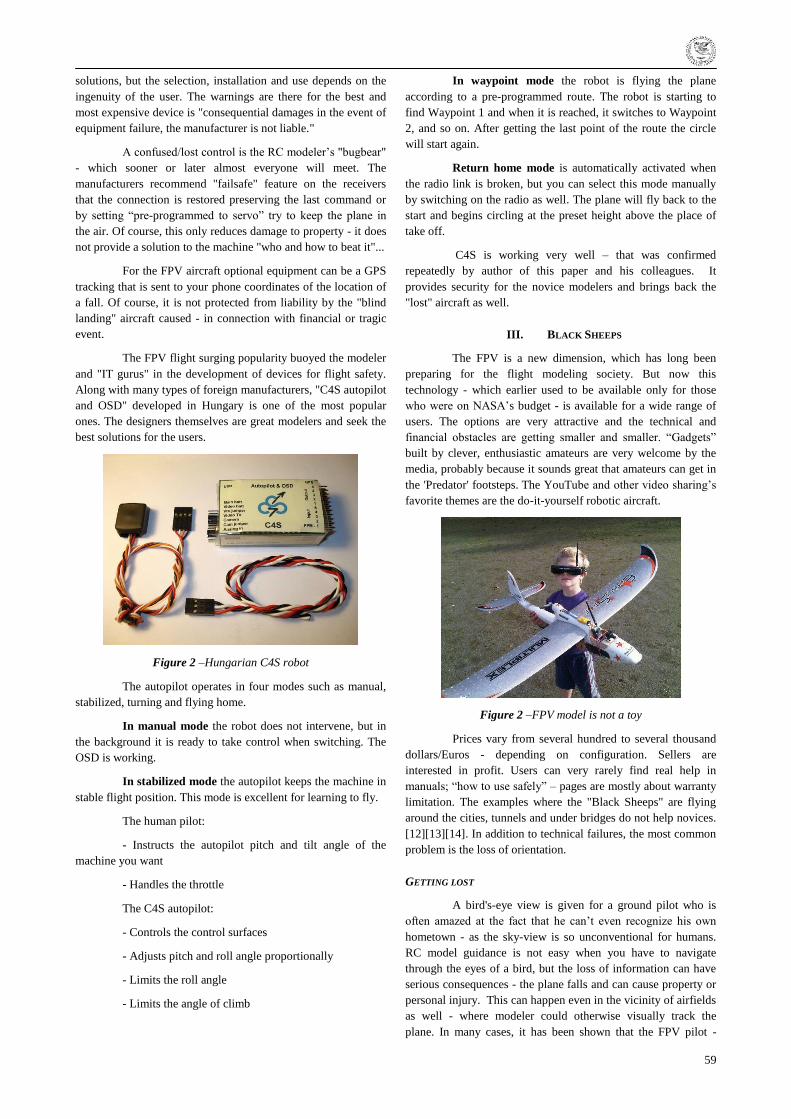
59
solutions, but the selection, installation and use depends on the
ingenuity of the user. The warnings are there for the best and
most expensive device is "consequential damages in the event of
equipment failure, the manufacturer is not liable."
A confused/lost control is the RC modeler‘s "bugbear"
- which sooner or later almost everyone will meet. The
manufacturers recommend "failsafe" feature on the receivers
that the connection is restored preserving the last command or
by setting ―pre-programmed to servo‖ try to keep the plane in
the air. Of course, this only reduces damage to property - it does
not provide a solution to the machine "who and how to beat it"...
For the FPV aircraft optional equipment can be a GPS
tracking that is sent to your phone coordinates of the location of
a fall. Of course, it is not protected from liability by the "blind
landing" aircraft caused - in connection with financial or tragic
event.
The FPV flight surging popularity buoyed the modeler
and "IT gurus" in the development of devices for flight safety.
Along with many types of foreign manufacturers, "C4S autopilot
and OSD" developed in Hungary is one of the most popular
ones. The designers themselves are great modelers and seek the
best solutions for the users.
Figure 2 –Hungarian C4S robot
The autopilot operates in four modes such as manual,
stabilized, turning and flying home.
In manual mode the robot does not intervene, but in
the background it is ready to take control when switching. The
OSD is working.
In stabilized mode the autopilot keeps the machine in
stable flight position. This mode is excellent for learning to fly.
The human pilot:
- Instructs the autopilot pitch and tilt angle of the
machine you want
- Handles the throttle
The C4S autopilot:
- Controls the control surfaces
- Adjusts pitch and roll angle proportionally
- Limits the roll angle
- Limits the angle of climb
In waypoint mode the robot is flying the plane
according to a pre-programmed route. The robot is starting to
find Waypoint 1 and when it is reached, it switches to Waypoint
2, and so on. After getting the last point of the route the circle
will start again.
Return home mode is automatically activated when
the radio link is broken, but you can select this mode manually
by switching on the radio as well. The plane will fly back to the
start and begins circling at the preset height above the place of
take off.
C4S is working very well – that was confirmed
repeatedly by author of this paper and his colleagues. It
provides security for the novice modelers and brings back the
"lost" aircraft as well.
III. BLACK SHEEPS
The FPV is a new dimension, which has long been
preparing for the flight modeling society. But now this
technology - which earlier used to be available only for those
who were on NASA‘s budget - is available for a wide range of
users. The options are very attractive and the technical and
financial obstacles are getting smaller and smaller. ―Gadgets‖
built by clever, enthusiastic amateurs are very welcome by the
media, probably because it sounds great that amateurs can get in
the 'Predator' footsteps. The YouTube and other video sharing‘s
favorite themes are the do-it-yourself robotic aircraft.
Figure 2 –FPV model is not a toy
Prices vary from several hundred to several thousand
dollars/Euros - depending on configuration. Sellers are
interested in profit. Users can very rarely find real help in
manuals; ―how to use safely‖ – pages are mostly about warranty
limitation. The examples where the "Black Sheeps" are flying
around the cities, tunnels and under bridges do not help novices.
[12][13][14]. In addition to technical failures, the most common
problem is the loss of orientation.
GETTING LOST
A bird's-eye view is given for a ground pilot who is
often amazed at the fact that he can‘t even recognize his own
hometown - as the sky-view is so unconventional for humans.
RC model guidance is not easy when you have to navigate
through the eyes of a bird, but the loss of information can have
serious consequences - the plane falls and can cause property or
personal injury. This can happen even in the vicinity of airfields
as well - where modeler could otherwise visually track the
plane. In many cases, it has been shown that the FPV pilot -
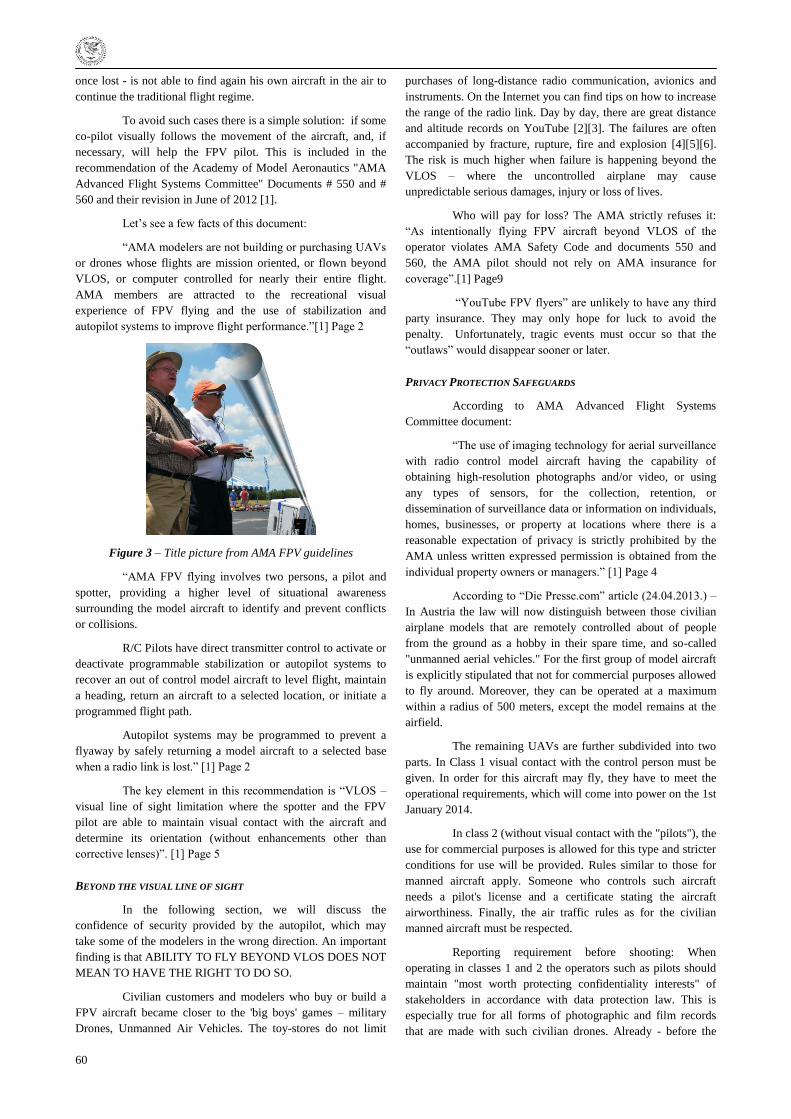
60
once lost - is not able to find again his own aircraft in the air to
continue the traditional flight regime.
To avoid such cases there is a simple solution: if some
co-pilot visually follows the movement of the aircraft, and, if
necessary, will help the FPV pilot. This is included in the
recommendation of the Academy of Model Aeronautics "AMA
Advanced Flight Systems Committee" Documents # 550 and #
560 and their revision in June of 2012 [1].
Let‘s see a few facts of this document:
―AMA modelers are not building or purchasing UAVs
or drones whose flights are mission oriented, or flown beyond
VLOS, or computer controlled for nearly their entire flight.
AMA members are attracted to the recreational visual
experience of FPV flying and the use of stabilization and
autopilot systems to improve flight performance.‖[1] Page 2
Figure 3 – Title picture from AMA FPV guidelines
―AMA FPV flying involves two persons, a pilot and
spotter, providing a higher level of situational awareness
surrounding the model aircraft to identify and prevent conflicts
or collisions.
R/C Pilots have direct transmitter control to activate or
deactivate programmable stabilization or autopilot systems to
recover an out of control model aircraft to level flight, maintain
a heading, return an aircraft to a selected location, or initiate a
programmed flight path.
Autopilot systems may be programmed to prevent a
flyaway by safely returning a model aircraft to a selected base
when a radio link is lost.‖ [1] Page 2
The key element in this recommendation is ―VLOS –
visual line of sight limitation where the spotter and the FPV
pilot are able to maintain visual contact with the aircraft and
determine its orientation (without enhancements other than
corrective lenses)‖. [1] Page 5
BEYOND THE VISUAL LINE OF SIGHT
In the following section, we will discuss the
confidence of security provided by the autopilot, which may
take some of the modelers in the wrong direction. An important
finding is that ABILITY TO FLY BEYOND VLOS DOES NOT
MEAN TO HAVE THE RIGHT TO DO SO.
Civilian customers and modelers who buy or build a
FPV aircraft became closer to the 'big boys' games – military
Drones, Unmanned Air Vehicles. The toy-stores do not limit
purchases of long-distance radio communication, avionics and
instruments. On the Internet you can find tips on how to increase
the range of the radio link. Day by day, there are great distance
and altitude records on YouTube [2][3]. The failures are often
accompanied by fracture, rupture, fire and explosion [4][5][6].
The risk is much higher when failure is happening beyond the
VLOS – where the uncontrolled airplane may cause
unpredictable serious damages, injury or loss of lives.
Who will pay for loss? The AMA strictly refuses it:
―As intentionally flying FPV aircraft beyond VLOS of the
operator violates AMA Safety Code and documents 550 and
560, the AMA pilot should not rely on AMA insurance for
coverage‖.[1] Page9
―YouTube FPV flyers‖ are unlikely to have any third
party insurance. They may only hope for luck to avoid the
penalty. Unfortunately, tragic events must occur so that the
―outlaws‖ would disappear sooner or later.
PRIVACY PROTECTION SAFEGUARDS
According to AMA Advanced Flight Systems
Committee document:
―The use of imaging technology for aerial surveillance
with radio control model aircraft having the capability of
obtaining high-resolution photographs and/or video, or using
any types of sensors, for the collection, retention, or
dissemination of surveillance data or information on individuals,
homes, businesses, or property at locations where there is a
reasonable expectation of privacy is strictly prohibited by the
AMA unless written expressed permission is obtained from the
individual property owners or managers.‖ [1] Page 4
According to ―Die Presse.com‖ article (24.04.2013.) –
In Austria the law will now distinguish between those civilian
airplane models that are remotely controlled about of people
from the ground as a hobby in their spare time, and so-called
"unmanned aerial vehicles." For the first group of model aircraft
is explicitly stipulated that not for commercial purposes allowed
to fly around. Moreover, they can be operated at a maximum
within a radius of 500 meters, except the model remains at the
airfield.
The remaining UAVs are further subdivided into two
parts. In Class 1 visual contact with the control person must be
given. In order for this aircraft may fly, they have to meet the
operational requirements, which will come into power on the 1st
January 2014.
In class 2 (without visual contact with the "pilots"), the
use for commercial purposes is allowed for this type and stricter
conditions for use will be provided. Rules similar to those for
manned aircraft apply. Someone who controls such aircraft
needs a pilot's license and a certificate stating the aircraft
airworthiness. Finally, the air traffic rules as for the civilian
manned aircraft must be respected.
Reporting requirement before shooting: When
operating in classes 1 and 2 the operators such as pilots should
maintain "most worth protecting confidentiality interests" of
stakeholders in accordance with data protection law. This is
especially true for all forms of photographic and film records
that are made with such civilian drones. Already - before the
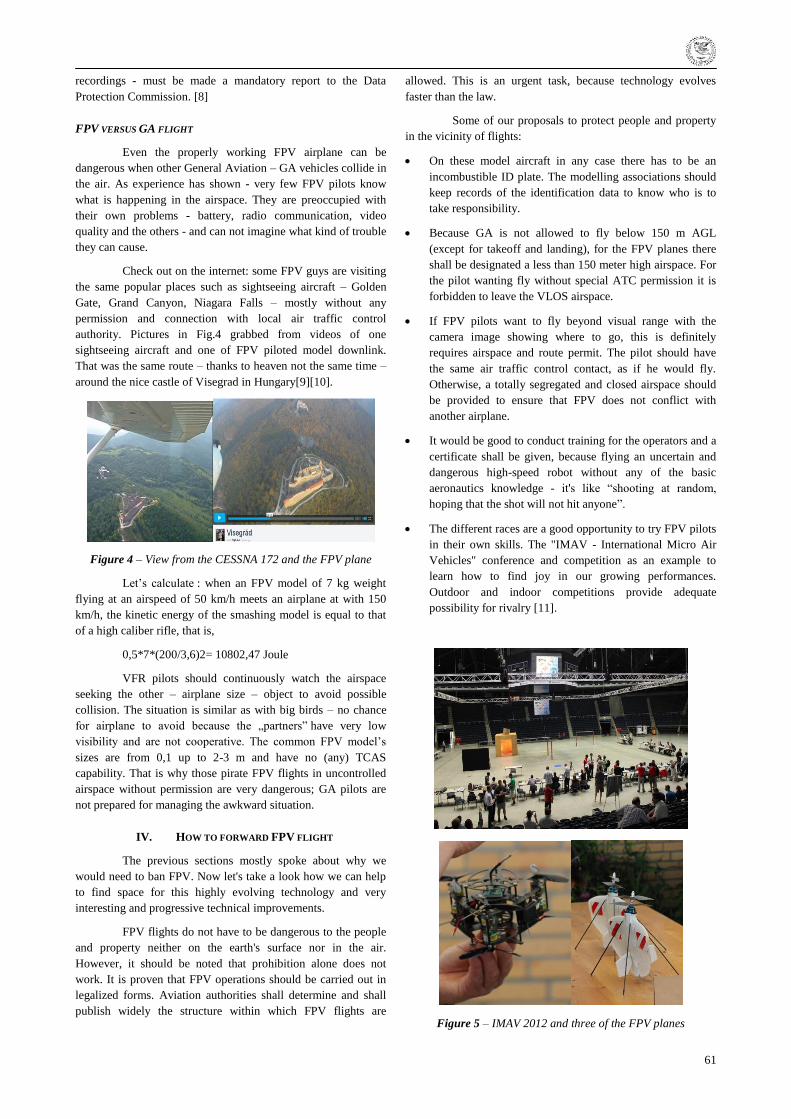
61
recordings - must be made a mandatory report to the Data
Protection Commission. [8]
FPV VERSUS GA FLIGHT
Even the properly working FPV airplane can be
dangerous when other General Aviation – GA vehicles collide in
the air. As experience has shown - very few FPV pilots know
what is happening in the airspace. They are preoccupied with
their own problems - battery, radio communication, video
quality and the others - and can not imagine what kind of trouble
they can cause.
Check out on the internet: some FPV guys are visiting
the same popular places such as sightseeing aircraft – Golden
Gate, Grand Canyon, Niagara Falls – mostly without any
permission and connection with local air traffic control
authority. Pictures in Fig.4 grabbed from videos of one
sightseeing aircraft and one of FPV piloted model downlink.
That was the same route – thanks to heaven not the same time –
around the nice castle of Visegrad in Hungary[9][10].
Figure 4 – View from the CESSNA 172 and the FPV plane
Let‘s calculate : when an FPV model of 7 kg weight
flying at an airspeed of 50 km/h meets an airplane at with 150
km/h, the kinetic energy of the smashing model is equal to that
of a high caliber rifle, that is,
0,5*7*(200/3,6)2= 10802,47 Joule
VFR pilots should continuously watch the airspace
seeking the other – airplane size – object to avoid possible
collision. The situation is similar as with big birds – no chance
for airplane to avoid because the „partners‖ have very low
visibility and are not cooperative. The common FPV model‘s
sizes are from 0,1 up to 2-3 m and have no (any) TCAS
capability. That is why those pirate FPV flights in uncontrolled
airspace without permission are very dangerous; GA pilots are
not prepared for managing the awkward situation.
IV. HOW TO FORWARD FPV FLIGHT
The previous sections mostly spoke about why we
would need to ban FPV. Now let's take a look how we can help
to find space for this highly evolving technology and very
interesting and progressive technical improvements.
FPV flights do not have to be dangerous to the people
and property neither on the earth's surface nor in the air.
However, it should be noted that prohibition alone does not
work. It is proven that FPV operations should be carried out in
legalized forms. Aviation authorities shall determine and shall
publish widely the structure within which FPV flights are
allowed. This is an urgent task, because technology evolves
faster than the law.
Some of our proposals to protect people and property
in the vicinity of flights:
On these model aircraft in any case there has to be an
incombustible ID plate. The modelling associations should
keep records of the identification data to know who is to
take responsibility.
Because GA is not allowed to fly below 150 m AGL
(except for takeoff and landing), for the FPV planes there
shall be designated a less than 150 meter high airspace. For
the pilot wanting fly without special ATC permission it is
forbidden to leave the VLOS airspace.
If FPV pilots want to fly beyond visual range with the
camera image showing where to go, this is definitely
requires airspace and route permit. The pilot should have
the same air traffic control contact, as if he would fly.
Otherwise, a totally segregated and closed airspace should
be provided to ensure that FPV does not conflict with
another airplane.
It would be good to conduct training for the operators and a
certificate shall be given, because flying an uncertain and
dangerous high-speed robot without any of the basic
aeronautics knowledge - it's like ―shooting at random,
hoping that the shot will not hit anyone‖.
The different races are a good opportunity to try FPV pilots
in their own skills. The "IMAV - International Micro Air
Vehicles" conference and competition as an example to
learn how to find joy in our growing performances.
Outdoor and indoor competitions provide adequate
possibility for rivalry [11].
Figure 5 – IMAV 2012 and three of the FPV planes
62
"IMAV 2012" and similar events are not to show only
the knowledge, but the industry and the military spheres have a
keen interest in them. The observer‘s close eye follows the
events and successful productions. Outstanding competitors can
hope to be selected as a future employee.
V. CONCLUSION
This paper meant to present the problem and at the
same time provide some solution - if it is possible. FPV
modelling is a great opportunity for technical progress for
amateurs, it should be supported. Many modellers - the best in
its field - will later become professionals.
Now high-quality video cameras have small sizes.
FPV models have a great opportunity to carry them. This is to be
supported, but it should not cause hazard to others at the same
time.
Negligence regarding observing the rules, which is
now being present with some of the FPV–unit owners (I
intentionally did NOT say pilot) – probably just a lack of
knowledge and awareness – is alarming and needs to be change.
Our task is not only to show the limitations, but also what is
permitted - to help find the right path.
The modellers are required to better understand the
"big planes" living space and needs. The different size, speed,
and visibility of VFR flight may be a direct threat to life of GA
pilots and passengers. However, GA pilots should be informed
that recently small air vehicles may also occur in the air – their
movement and behaviour is unpredictable.
FPV flying is a worldwide phenomenon - which is
necessary to solve an international effort. The Internet can be an
effective solution - if the instructional videos can be posted on
the net - not just the ―Black Sheep‘s‖.
"The aviation safety aspects of application of the
unmanned aircraft" area of research at the Hungarian National
University of Public Service covers the safety of complete
unmanned aviation - including FPV planes. We explore the
technical and organizational issues that lead to more safe and
reliable systems.
The project was realized through the assistance of the
European Union, with the co-financing of the European Social
Fund. "Critical Infrastructure Protection Research TÁMOP-
4.2.1.B-11/2/KMR-2011-0001" it enjoys the support.
The author likes both FPV and GA flying and wishes
to
PRESERVE THE SKY BLUE – for EVERYONE!
VI. REFERENCES
[1] http://www.modelaircraft.org/files/REPORT_ON_REVISE
D-550-560-OCT-8-2012.pdf
[2] http://www.youtube.com/watch?v=z_PxhU9i9Ng
[3] http://www.youtube.com/watch?v=ir_vfBTXM8E
[4] http://www.rcgroups.com/forums/showthread.php?t=12028
05
[5] http://www.youtube.com/watch?v=f7FLPzJvsCk
[6] http://www.rcgroups.com/forums/showthread.php?t=13703
81
[7] http://www.popsci.com/technology/article/2013-
02/privacy-and-drones
[8] http://diepresse.com/home/politik/innenpolitik/1393589/Bu
res-laesst-Drohnen-nicht-mehr-frei-herumfliegen
[9] http://www.youtube.com/watch?v=UF-yODIdyXY
[10] http://vimeo.com/15979344
[11] http://www.imav2012.org/3.0.html
[12] http://www.youtube.com/watch?v=ghDXBIy_BSM
[13] http://www.youtube.com/watch?v=W-QJLOVLg7M
[14] http://www.youtube.com/watch?v=Ce4uESM1thQ
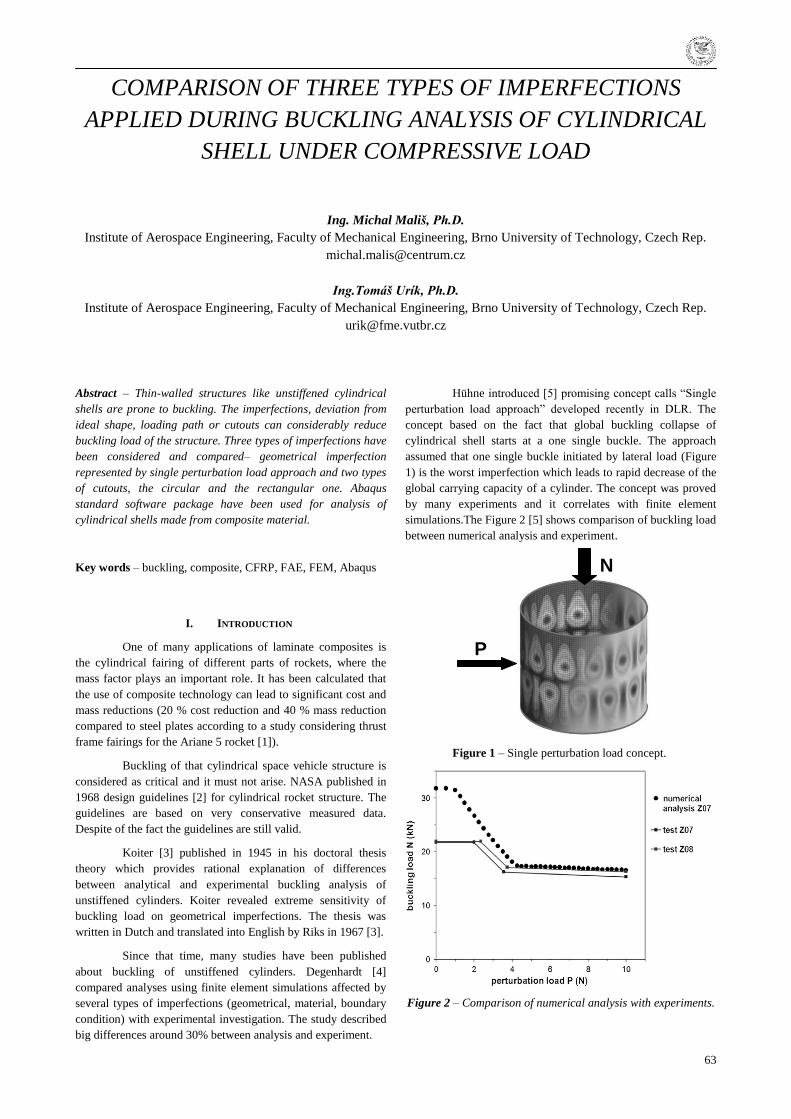
63
COMPARISON OF THREE TYPES OF IMPERFECTIONS
APPLIED DURING BUCKLING ANALYSIS OF CYLINDRICAL
SHELL UNDER COMPRESSIVE LOAD
Ing. Michal Mališ, Ph.D.
Institute of Aerospace Engineering, Faculty of Mechanical Engineering, Brno University of Technology, Czech Rep.
Ing.Tomáš Urík, Ph.D.
Institute of Aerospace Engineering, Faculty of Mechanical Engineering, Brno University of Technology, Czech Rep.
Abstract – Thin-walled structures like unstiffened cylindrical
shells are prone to buckling. The imperfections, deviation from
ideal shape, loading path or cutouts can considerably reduce
buckling load of the structure. Three types of imperfections have
been considered and compared– geometrical imperfection
represented by single perturbation load approach and two types
of cutouts, the circular and the rectangular one. Abaqus
standard software package have been used for analysis of
cylindrical shells made from composite material.
Key words – buckling, composite, CFRP, FAE, FEM, Abaqus
I. INTRODUCTION
One of many applications of laminate composites is
the cylindrical fairing of different parts of rockets, where the
mass factor plays an important role. It has been calculated that
the use of composite technology can lead to significant cost and
mass reductions (20 % cost reduction and 40 % mass reduction
compared to steel plates according to a study considering thrust
frame fairings for the Ariane 5 rocket [1]).
Buckling of that cylindrical space vehicle structure is
considered as critical and it must not arise. NASA published in
1968 design guidelines [2] for cylindrical rocket structure. The
guidelines are based on very conservative measured data.
Despite of the fact the guidelines are still valid.
Koiter [3] published in 1945 in his doctoral thesis
theory which provides rational explanation of differences
between analytical and experimental buckling analysis of
unstiffened cylinders. Koiter revealed extreme sensitivity of
buckling load on geometrical imperfections. The thesis was
written in Dutch and translated into English by Riks in 1967 [3].
Since that time, many studies have been published
about buckling of unstiffened cylinders. Degenhardt [4]
compared analyses using finite element simulations affected by
several types of imperfections (geometrical, material, boundary
condition) with experimental investigation. The study described
big differences around 30% between analysis and experiment.
Hühne introduced [5] promising concept calls ―Single
perturbation load approach‖ developed recently in DLR. The
concept based on the fact that global buckling collapse of
cylindrical shell starts at a one single buckle. The approach
assumed that one single buckle initiated by lateral load (Figure
1) is the worst imperfection which leads to rapid decrease of the
global carrying capacity of a cylinder. The concept was proved
by many experiments and it correlates with finite element
simulations.The Figure 2 [5] shows comparison of buckling load
between numerical analysis and experiment.
Figure 1 – Single perturbation load concept.
Figure 2 – Comparison of numerical analysis with experiments.
N
P
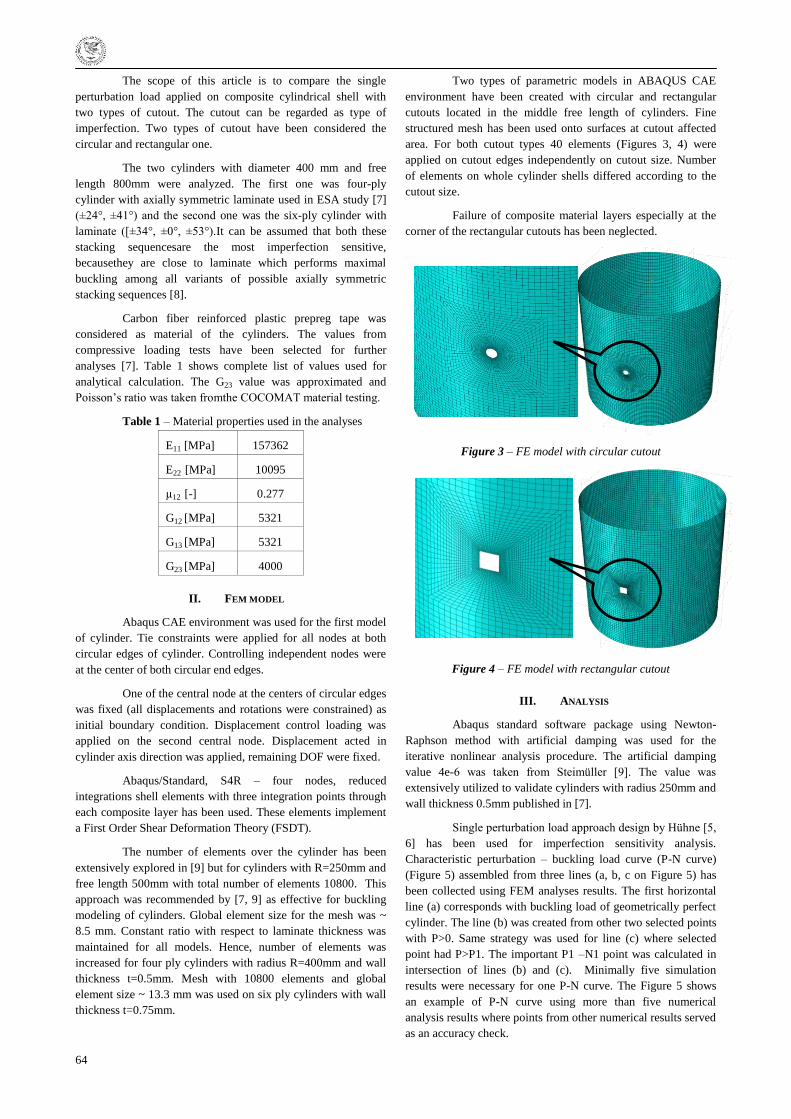
64
The scope of this article is to compare the single
perturbation load applied on composite cylindrical shell with
two types of cutout. The cutout can be regarded as type of
imperfection. Two types of cutout have been considered the
circular and rectangular one.
The two cylinders with diameter 400 mm and free
length 800mm were analyzed. The first one was four-ply
cylinder with axially symmetric laminate used in ESA study [7]
(±24°, ±41°) and the second one was the six-ply cylinder with
laminate ([±34°, ±0°, ±53°).It can be assumed that both these
stacking sequencesare the most imperfection sensitive,
becausethey are close to laminate which performs maximal
buckling among all variants of possible axially symmetric
stacking sequences [8].
Carbon fiber reinforced plastic prepreg tape was
considered as material of the cylinders. The values from
compressive loading tests have been selected for further
analyses [7]. Table 1 shows complete list of values used for
analytical calculation. The G23 value was approximated and
Poisson‘s ratio was taken fromthe COCOMAT material testing.
Table 1 – Material properties used in the analyses
E11 [MPa] 157362
E22 [MPa] 10095
µ12 [-] 0.277
G12 [MPa] 5321
G13 [MPa] 5321
G23 [MPa] 4000
II. FEM MODEL
Abaqus CAE environment was used for the first model
of cylinder. Tie constraints were applied for all nodes at both
circular edges of cylinder. Controlling independent nodes were
at the center of both circular end edges.
One of the central node at the centers of circular edges
was fixed (all displacements and rotations were constrained) as
initial boundary condition. Displacement control loading was
applied on the second central node. Displacement acted in
cylinder axis direction was applied, remaining DOF were fixed.
Abaqus/Standard, S4R – four nodes, reduced
integrations shell elements with three integration points through
each composite layer has been used. These elements implement
a First Order Shear Deformation Theory (FSDT).
The number of elements over the cylinder has been
extensively explored in [9] but for cylinders with R=250mm and
free length 500mm with total number of elements 10800. This
approach was recommended by [7, 9] as effective for buckling
modeling of cylinders. Global element size for the mesh was ~
8.5 mm. Constant ratio with respect to laminate thickness was
maintained for all models. Hence, number of elements was
increased for four ply cylinders with radius R=400mm and wall
thickness t=0.5mm. Mesh with 10800 elements and global
element size ~ 13.3 mm was used on six ply cylinders with wall
thickness t=0.75mm.
Two types of parametric models in ABAQUS CAE
environment have been created with circular and rectangular
cutouts located in the middle free length of cylinders. Fine
structured mesh has been used onto surfaces at cutout affected
area. For both cutout types 40 elements (Figures 3, 4) were
applied on cutout edges independently on cutout size. Number
of elements on whole cylinder shells differed according to the
cutout size.
Failure of composite material layers especially at the
corner of the rectangular cutouts has been neglected.
Figure 3 – FE model with circular cutout
Figure 4 – FE model with rectangular cutout
III. ANALYSIS
Abaqus standard software package using Newton-
Raphson method with artificial damping was used for the
iterative nonlinear analysis procedure. The artificial damping
value 4e-6 was taken from Steimüller [9]. The value was
extensively utilized to validate cylinders with radius 250mm and
wall thickness 0.5mm published in [7].
Single perturbation load approach design by Hühne [5,
6] has been used for imperfection sensitivity analysis.
Characteristic perturbation – buckling load curve (P-N curve)
(Figure 5) assembled from three lines (a, b, c on Figure 5) has
been collected using FEM analyses results. The first horizontal
line (a) corresponds with buckling load of geometrically perfect
cylinder. The line (b) was created from other two selected points
with P>0. Same strategy was used for line (c) where selected
point had P>P1. The important P1 –N1 point was calculated in
intersection of lines (b) and (c). Minimally five simulation
results were necessary for one P-N curve. The Figure 5 shows
an example of P-N curve using more than five numerical
analysis results where points from other numerical results served
as an accuracy check.
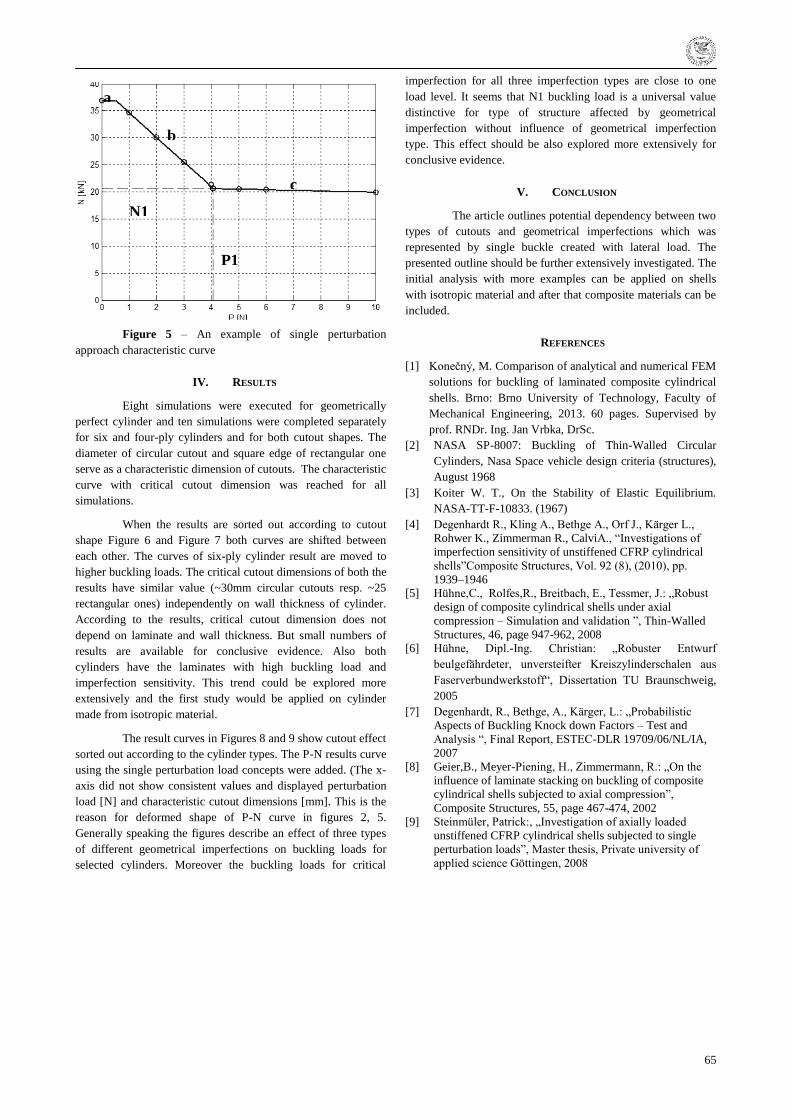
65
Figure 5 – An example of single perturbation
approach characteristic curve
IV. RESULTS
Eight simulations were executed for geometrically
perfect cylinder and ten simulations were completed separately
for six and four-ply cylinders and for both cutout shapes. The
diameter of circular cutout and square edge of rectangular one
serve as a characteristic dimension of cutouts. The characteristic
curve with critical cutout dimension was reached for all
simulations.
When the results are sorted out according to cutout
shape Figure 6 and Figure 7 both curves are shifted between
each other. The curves of six-ply cylinder result are moved to
higher buckling loads. The critical cutout dimensions of both the
results have similar value (~30mm circular cutouts resp. ~25
rectangular ones) independently on wall thickness of cylinder.
According to the results, critical cutout dimension does not
depend on laminate and wall thickness. But small numbers of
results are available for conclusive evidence. Also both
cylinders have the laminates with high buckling load and
imperfection sensitivity. This trend could be explored more
extensively and the first study would be applied on cylinder
made from isotropic material.
The result curves in Figures 8 and 9 show cutout effect
sorted out according to the cylinder types. The P-N results curve
using the single perturbation load concepts were added. (The x-
axis did not show consistent values and displayed perturbation
load [N] and characteristic cutout dimensions [mm]. This is the
reason for deformed shape of P-N curve in figures 2, 5.
Generally speaking the figures describe an effect of three types
of different geometrical imperfections on buckling loads for
selected cylinders. Moreover the buckling loads for critical
imperfection for all three imperfection types are close to one
load level. It seems that N1 buckling load is a universal value
distinctive for type of structure affected by geometrical
imperfection without influence of geometrical imperfection
type. This effect should be also explored more extensively for
conclusive evidence.
V. CONCLUSION
The article outlines potential dependency between two
types of cutouts and geometrical imperfections which was
represented by single buckle created with lateral load. The
presented outline should be further extensively investigated. The
initial analysis with more examples can be applied on shells
with isotropic material and after that composite materials can be
included.
REFERENCES
[1] Konečný, M. Comparison of analytical and numerical FEM
solutions for buckling of laminated composite cylindrical
shells. Brno: Brno University of Technology, Faculty of
Mechanical Engineering, 2013. 60 pages. Supervised by
prof. RNDr. Ing. Jan Vrbka, DrSc.
[2] NASA SP-8007: Buckling of Thin-Walled Circular
Cylinders, Nasa Space vehicle design criteria (structures),
August 1968
[3] Koiter W. T., On the Stability of Elastic Equilibrium.
NASA-TT-F-10833. (1967)
[4] Degenhardt R., Kling A., Bethge A., Orf J., Kärger L.,
Rohwer K., Zimmerman R., CalviA., ―Investigations of
imperfection sensitivity of unstiffened CFRP cylindrical
shells‖Composite Structures, Vol. 92 (8), (2010), pp.
1939–1946
[5] Hühne,C., Rolfes,R., Breitbach, E., Tessmer, J.: „Robust
design of composite cylindrical shells under axial
compression – Simulation and validation ‖, Thin-Walled
Structures, 46, page 947-962, 2008
[6] Hühne, Dipl.-Ing. Christian: „Robuster Entwurf
beulgefährdeter, unversteifter Kreiszylinderschalen aus
Faserverbundwerkstoff―, Dissertation TU Braunschweig,
2005
[7] Degenhardt, R., Bethge, A., Kärger, L.: „Probabilistic
Aspects of Buckling Knock down Factors – Test and
Analysis ―, Final Report, ESTEC-DLR 19709/06/NL/IA,
2007
[8] Geier,B., Meyer-Piening, H., Zimmermann, R.: „On the
influence of laminate stacking on buckling of composite
cylindrical shells subjected to axial compression‖,
Composite Structures, 55, page 467-474, 2002
[9] Steinmüler, Patrick:, „Investigation of axially loaded
unstiffened CFRP cylindrical shells subjected to single
perturbation loads‖, Master thesis, Private university of
applied science Göttingen, 2008
a
b
c
N1
P1

66
Figure 6 – Effect of circular cutout on buckling load
0 20 40 60 80 1000
10
20
30
40
50
60
70
80
90
100
Cutouts diameter [mm]
Bucklin
g load [
kN
]
Single perturbation load: N - P
R400 L800 stq24 41
R400 L800 stq34 0 53
Figure 7 – Effect of rectangular cutout on buckling load
0 20 40 60 80 1000
10
20
30
40
50
60
70
80
90
100
Rectangular cutout edge [mm]
Bucklin
g load [
kN
]
Single perturbation load: N - P
R400 L800 stq24 41
R400 L800 stq34 0 53
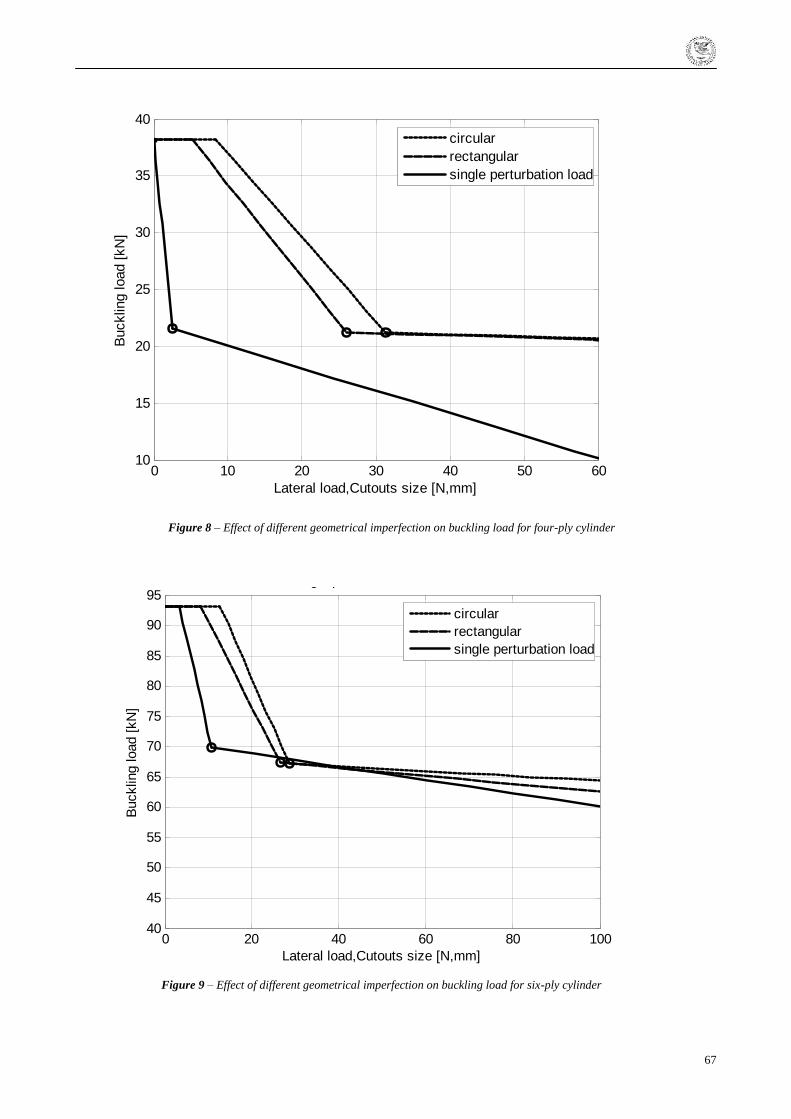
67
Figure 8 – Effect of different geometrical imperfection on buckling load for four-ply cylinder
0 10 20 30 40 50 6010
15
20
25
30
35
40
Lateral load,Cutouts size [N,mm]
Bucklin
g load [
kN
]Single perturbation load: N - P
circular
rectangular
single perturbation load
Figure 9 – Effect of different geometrical imperfection on buckling load for six-ply cylinder
0 20 40 60 80 10040
45
50
55
60
65
70
75
80
85
90
95
Lateral load,Cutouts size [N,mm]
Bucklin
g load [
kN
]
Single perturbation load: N - P
circular
rectangular
single perturbation load
68
APPLICATION OF GRADUATES OF UNIVERSITY OF
ŽILINA,AIR TRANSPORT DEPARTMENT IN AIRLINE TRAVEL
SERVICE
Ing.Ľubomír Matuška, PhD.
The flight director for the Slovak Republic, Travel Service, a.s.
Abstract – The paper deals with application of Air Transport
Department’s alumni in the Travel Servise airline.
Key words – Air Transport Department, Alumni, Travel
Service.
I. THE AIRLINE COMPANY TRAVEL SERVICE
Airline Travel Service was established in 1997.
Travel Service a.s. is leader on the charter market in
Czech Republic, Slovakia, Hungary and has a significant share
in Poland.
In 2001 was established a subsidiary Travel Service
Kft. in Hungary.
Outside the charter flights, since 2004 the regular lines
are operated by Travel Service a.s. under the brand name Smart
Wings and since 2007 aerotaxi category Business Jet are
operated by Travel Service a.s. too.
In 2010 the company entered the Slovak market - the
emergence of Travel Service a.s., Slovakia branch.
In 2012 was established Travel Service Poland.
The number of transported passengers in 2012: more
than 3.5 million.
II. FLEET OF TRAVEL SERVICE
In 1997: the first commerce flight – type of aircraft
Tu - 154 M.
Next year, the company entered Boeing 737-400 into
the fleet.
Aircraft type Tu - 154 M ended in 1999.
In 2000, Travel Service included into the fleet Boeing
737-800.
Six years later, the company had 10 aircrafts - Boeing
737s.
In 2007, the company began with the private flights
with the type Cessna 680 Citation Sovereign.
This year the company announced an order for the
type Boeing 787 Dreamliner.
In 2008, the airline Travel Service uses for charter
flights Boeing 767-300 ER.
In 2011, the overall condition of the fleet is 29
aircraft.
The current status of the fleet of the company Travel
Service:
29 x Boeing 737-800
2 x Boeing 737-700
7 x Airbus A 320
3 x Cessna 680 Citation Sovereign.
III. NETWORK FLIGHTS AIRLINE TRAVEL SERVICE
The network of regular and charter lines of Travel
Service a.s. covers the most important and popular destinations.
Network of lines of Smart Wings: Paris, Nice, Rome,
Cagliari, Olbia, Catania, Lamezia Terme, Barcelona, Valencia,
Malaga, Bilbao, Palma de Mallorca, Ibiza, Tenerife, Las Palmas,
Heraklion, Chania, Corfu, Thesssaloniki, Kavala, Zakynthos ,
Kos, Kalamata, Preveza, Burgas, Split, Dubrovnik, Larnaca,
Antalya, Dubai, Tel Aviv, etc.
Charter Lines:
- Long-haul destination: Bangkok, Varadero, Cancun,
Punta Cana, Isla Margarita, Samana, Mombasa, Zanzibar,
Colombo, Goa, Mauritius, etc.
-Medium- haul destinations : Egypt, Tunisia,
Morocco, Israel, the Canary Islands, UAE, etc.
- Short-haul destinations: Italy, Spain, Greece, Turkey,
Bulgaria, Croatia, France, Ireland, Portugal, etc.
The interesting thing is the annual exclusive flights
under the name ,,Around the world―, which the airline operates
with the type of aircraft Boeing 737-800.
In accordance with the contract, the airline operates in
the winter part with the fleet in Canada, in 2012 it was 10
Boeing 737-800. Also our crew and aircraft operating in the
69
long term with Sunwing airlines, Oman Air, Jet 2 and in the past
TUI, Ryanair, Singapore Airlines, Tajik Air, etc.
The airline Travel Service carry on charter flights not
only clients of tour operators, flights are also ordered by
renowned international companies, global, humanitarian and
sports organizations. Travel Service is the official carrier of
Czech national football team. Travel service provides air
transportation of soldiers of different countries ( the Nordic
countries, Slovakia, Hungary ) in foreign peacekeeping
missions.
Travel Service, a.s. yearly travels to more than 250
destinatiaon worldwide..
Part of the flights are operated on airways where
special proceedings (for example ETOPS) are required and
many aerodromes have limited ground equipment and is located
in broken relief with many obstacles. These destinations are
categorized to category C –(for example Madeira, Insbruck,
Samos).
This of course includes high requirements for flight
crew training. Part of flight crew training are flights in
conditions in low visibility ( low visibility operations).
IV. APPLICATION OF GRADUATES OF UNIVERSITY OF
ŢILINA, THE DEPARTMENT OF AIR TRANSPORT IN
AIRLINE TRAVEL SERVICE
Aplication of graduates of University of Ţilina,
Deparment of air transport, is on flight operative and commerce
technical department of our airline company.
Overall our airline company on B 737 : 266 pilots
- 131 captains and 135 co-pilots
- 10 pilots have qualification for TRE ( type raiting
examiner) – 6 of them are graduates of ZU ( 60%)
- 5 pilots have qualification TRI ( type rating
instructor) - 1of them is graduates of ZU (20%)
- 14 pilots have qualification LTI (line training
instructor) – 9 of them are graduates of ZU (64%)
Actual state on base Bratislava ( Slovak republic):
From overall number of captains are 80% graduates
of ZU, 16% co-pilots are graduates of ZU.
Above written data shows that ŢU was and still
remains important source of pilots for company Travel Service
a.s..Another sources are graduates ČVUT, VVLŠ, and aviaton
schools. Todays graduates of ŢU are forming significant part of
management (Flight operations manager Ing. Pavel Veselý,
Deputy flight operations manager Ing. Tomáš Nevole, Crew
training Jaroslav Valigura) and instructor´s team of company.
V. CONCLUSION
University of Ţilina is important source of flight
crew for Travel Service. Practical pilot´s training is
perfomed by stabile and experienced instructor´s team
and according to it is possible to continue with next
training in cases of chosen graduates. Bilateral
cooperation of both subjects in upbringing future experts
of civil aviation is rising by specialized lectures (
observer´s flights for students and by enabling specialized
practice in airline company. Department of air transport
belongs to the oldest educational institutions of civil
aviation of the world. Aplication of many graduates in
practice is avidance that pedagogists are doing their work
responsibly.
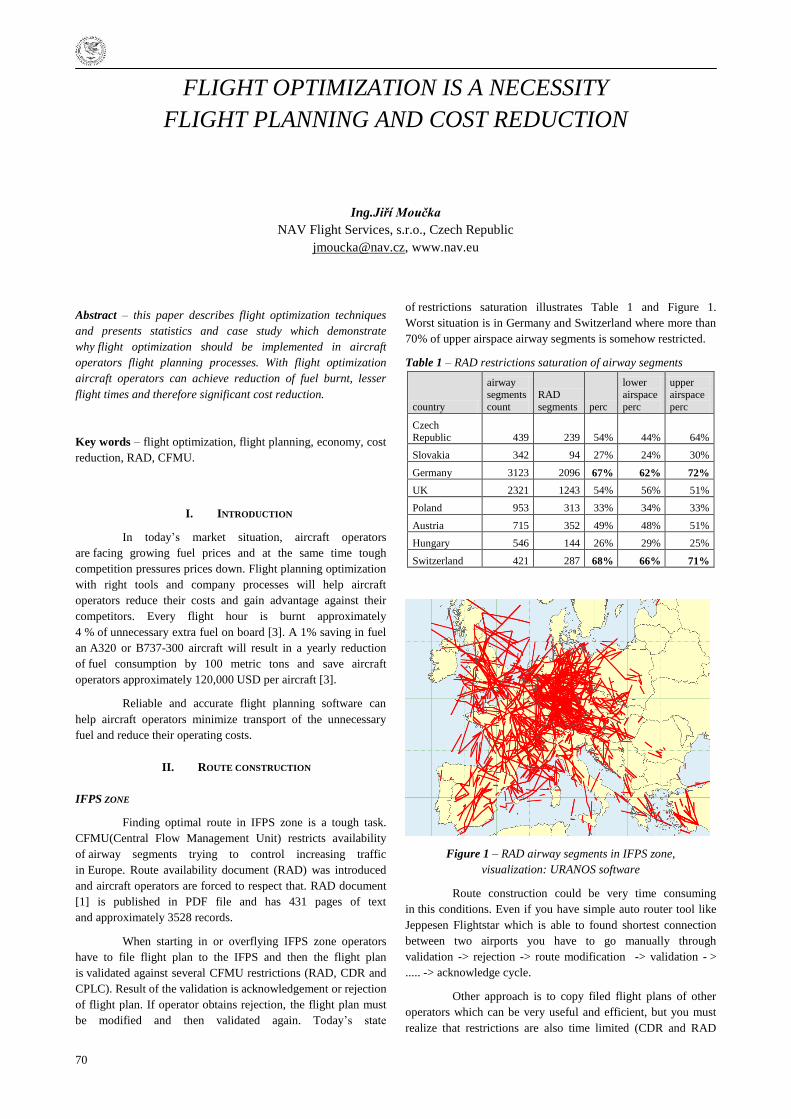
70
FLIGHT OPTIMIZATION IS A NECESSITY
FLIGHT PLANNING AND COST REDUCTION
Ing.Jiří Moučka
NAV Flight Services, s.r.o., Czech Republic
[email protected], www.nav.eu
Abstract – this paper describes flight optimization techniques
and presents statistics and case study which demonstrate
why flight optimization should be implemented in aircraft
operators flight planning processes. With flight optimization
aircraft operators can achieve reduction of fuel burnt, lesser
flight times and therefore significant cost reduction.
Key words – flight optimization, flight planning, economy, cost
reduction, RAD, CFMU.
I. INTRODUCTION
In today‘s market situation, aircraft operators
are facing growing fuel prices and at the same time tough
competition pressures prices down. Flight planning optimization
with right tools and company processes will help aircraft
operators reduce their costs and gain advantage against their
competitors. Every flight hour is burnt approximately
4 % of unnecessary extra fuel on board [3]. A 1% saving in fuel
an A320 or B737-300 aircraft will result in a yearly reduction
of fuel consumption by 100 metric tons and save aircraft
operators approximately 120,000 USD per aircraft [3].
Reliable and accurate flight planning software can
help aircraft operators minimize transport of the unnecessary
fuel and reduce their operating costs.
II. ROUTE CONSTRUCTION
IFPS ZONE
Finding optimal route in IFPS zone is a tough task.
CFMU(Central Flow Management Unit) restricts availability
of airway segments trying to control increasing traffic
in Europe. Route availability document (RAD) was introduced
and aircraft operators are forced to respect that. RAD document
[1] is published in PDF file and has 431 pages of text
and approximately 3528 records.
When starting in or overflying IFPS zone operators
have to file flight plan to the IFPS and then the flight plan
is validated against several CFMU restrictions (RAD, CDR and
CPLC). Result of the validation is acknowledgement or rejection
of flight plan. If operator obtains rejection, the flight plan must
be modified and then validated again. Today‘s state
of restrictions saturation illustrates Table 1 and Figure 1.
Worst situation is in Germany and Switzerland where more than
70% of upper airspace airway segments is somehow restricted.
Table 1 – RAD restrictions saturation of airway segments
country
airway segments
count
RAD
segments perc
lower airspace
perc
upper airspace
perc
Czech
Republic 439 239 54% 44% 64%
Slovakia 342 94 27% 24% 30%
Germany 3123 2096 67% 62% 72%
UK 2321 1243 54% 56% 51%
Poland 953 313 33% 34% 33%
Austria 715 352 49% 48% 51%
Hungary 546 144 26% 29% 25%
Switzerland 421 287 68% 66% 71%
Figure 1 – RAD airway segments in IFPS zone,
visualization: URANOS software
Route construction could be very time consuming
in this conditions. Even if you have simple auto router tool like
Jeppesen Flightstar which is able to found shortest connection
between two airports you have to go manually through
validation -> rejection -> route modification -> validation - >
..... -> acknowledge cycle.
Other approach is to copy filed flight plans of other
operators which can be very useful and efficient, but you must
realize that restrictions are also time limited (CDR and RAD
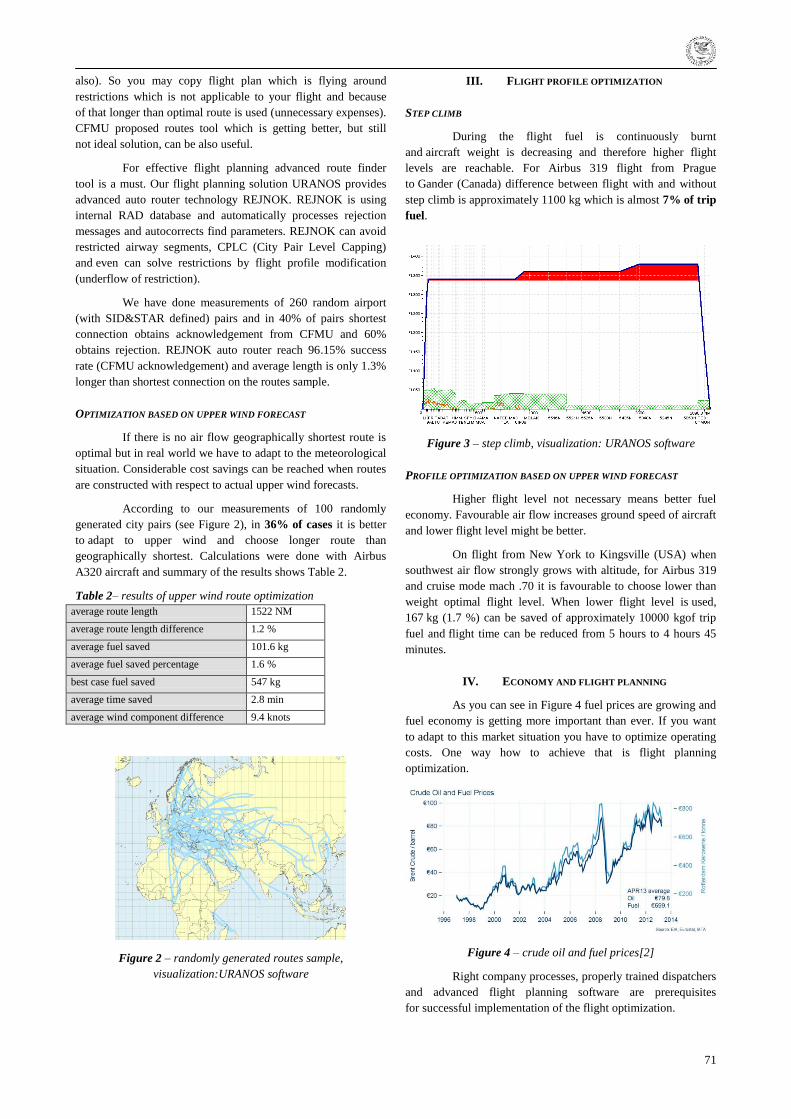
71
also). So you may copy flight plan which is flying around
restrictions which is not applicable to your flight and because
of that longer than optimal route is used (unnecessary expenses).
CFMU proposed routes tool which is getting better, but still
not ideal solution, can be also useful.
For effective flight planning advanced route finder
tool is a must. Our flight planning solution URANOS provides
advanced auto router technology REJNOK. REJNOK is using
internal RAD database and automatically processes rejection
messages and autocorrects find parameters. REJNOK can avoid
restricted airway segments, CPLC (City Pair Level Capping)
and even can solve restrictions by flight profile modification
(underflow of restriction).
We have done measurements of 260 random airport
(with SID&STAR defined) pairs and in 40% of pairs shortest
connection obtains acknowledgement from CFMU and 60%
obtains rejection. REJNOK auto router reach 96.15% success
rate (CFMU acknowledgement) and average length is only 1.3%
longer than shortest connection on the routes sample.
OPTIMIZATION BASED ON UPPER WIND FORECAST
If there is no air flow geographically shortest route is
optimal but in real world we have to adapt to the meteorological
situation. Considerable cost savings can be reached when routes
are constructed with respect to actual upper wind forecasts.
According to our measurements of 100 randomly
generated city pairs (see Figure 2), in 36% of cases it is better
to adapt to upper wind and choose longer route than
geographically shortest. Calculations were done with Airbus
A320 aircraft and summary of the results shows Table 2.
Table 2– results of upper wind route optimization
average route length 1522 NM
average route length difference 1.2 %
average fuel saved 101.6 kg
average fuel saved percentage 1.6 %
best case fuel saved 547 kg
average time saved 2.8 min
average wind component difference 9.4 knots
Figure 2 – randomly generated routes sample,
visualization:URANOS software
III. FLIGHT PROFILE OPTIMIZATION
STEP CLIMB
During the flight fuel is continuously burnt
and aircraft weight is decreasing and therefore higher flight
levels are reachable. For Airbus 319 flight from Prague
to Gander (Canada) difference between flight with and without
step climb is approximately 1100 kg which is almost 7% of trip
fuel.
Figure 3 – step climb, visualization: URANOS software
PROFILE OPTIMIZATION BASED ON UPPER WIND FORECAST
Higher flight level not necessary means better fuel
economy. Favourable air flow increases ground speed of aircraft
and lower flight level might be better.
On flight from New York to Kingsville (USA) when
southwest air flow strongly grows with altitude, for Airbus 319
and cruise mode mach .70 it is favourable to choose lower than
weight optimal flight level. When lower flight level is used,
167 kg (1.7 %) can be saved of approximately 10000 kgof trip
fuel and flight time can be reduced from 5 hours to 4 hours 45
minutes.
IV. ECONOMY AND FLIGHT PLANNING
As you can see in Figure 4 fuel prices are growing and
fuel economy is getting more important than ever. If you want
to adapt to this market situation you have to optimize operating
costs. One way how to achieve that is flight planning
optimization.
Figure 4 – crude oil and fuel prices[2]
Right company processes, properly trained dispatchers
and advanced flight planning software are prerequisites
for successful implementation of the flight optimization.
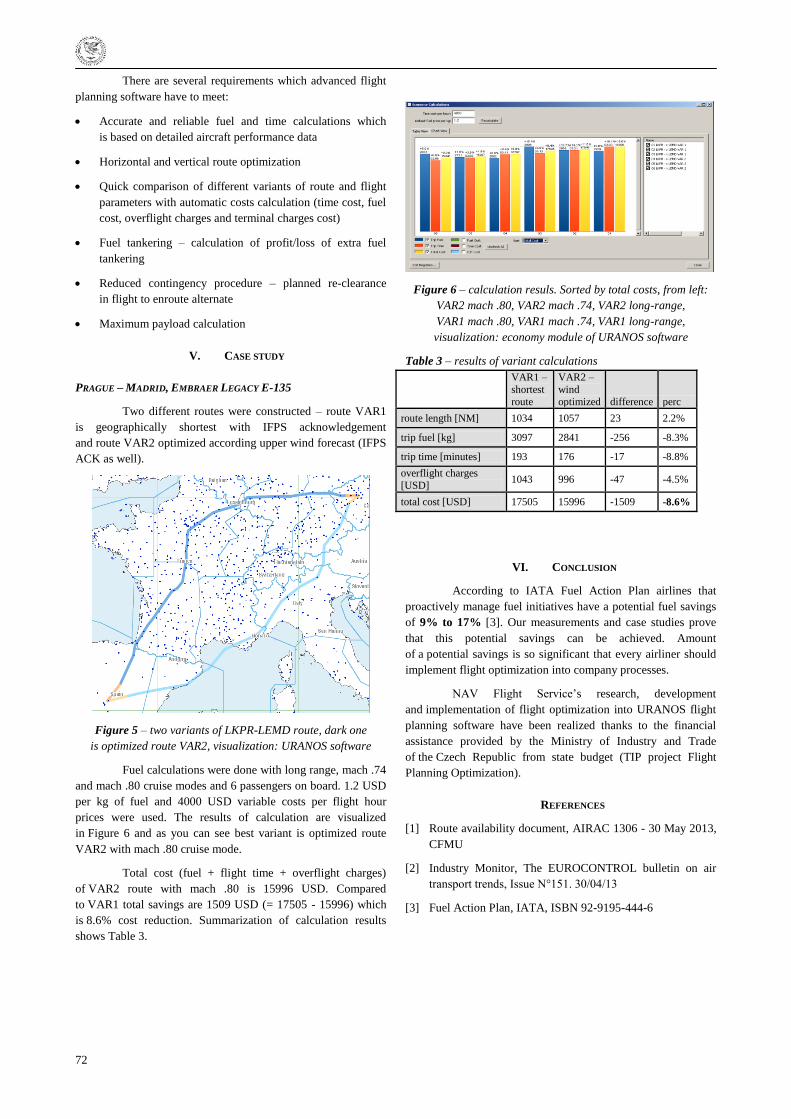
72
There are several requirements which advanced flight
planning software have to meet:
Accurate and reliable fuel and time calculations which
is based on detailed aircraft performance data
Horizontal and vertical route optimization
Quick comparison of different variants of route and flight
parameters with automatic costs calculation (time cost, fuel
cost, overflight charges and terminal charges cost)
Fuel tankering – calculation of profit/loss of extra fuel
tankering
Reduced contingency procedure – planned re-clearance
in flight to enroute alternate
Maximum payload calculation
V. CASE STUDY
PRAGUE – MADRID, EMBRAER LEGACY E-135
Two different routes were constructed – route VAR1
is geographically shortest with IFPS acknowledgement
and route VAR2 optimized according upper wind forecast (IFPS
ACK as well).
Figure 5 – two variants of LKPR-LEMD route, dark one
is optimized route VAR2, visualization: URANOS software
Fuel calculations were done with long range, mach .74
and mach .80 cruise modes and 6 passengers on board. 1.2 USD
per kg of fuel and 4000 USD variable costs per flight hour
prices were used. The results of calculation are visualized
in Figure 6 and as you can see best variant is optimized route
VAR2 with mach .80 cruise mode.
Total cost (fuel + flight time + overflight charges)
of VAR2 route with mach .80 is 15996 USD. Compared
to VAR1 total savings are 1509 USD (= 17505 - 15996) which
is 8.6% cost reduction. Summarization of calculation results
shows Table 3.
Figure 6 – calculation resuls. Sorted by total costs, from left:
VAR2 mach .80, VAR2 mach .74, VAR2 long-range,
VAR1 mach .80, VAR1 mach .74, VAR1 long-range,
visualization: economy module of URANOS software
Table 3 – results of variant calculations
VAR1 –
shortest
route
VAR2 –
wind
optimized difference perc
route length [NM] 1034 1057 23 2.2%
trip fuel [kg] 3097 2841 -256 -8.3%
trip time [minutes] 193 176 -17 -8.8%
overflight charges
[USD] 1043 996 -47 -4.5%
total cost [USD] 17505 15996 -1509 -8.6%
VI. CONCLUSION
According to IATA Fuel Action Plan airlines that
proactively manage fuel initiatives have a potential fuel savings
of 9% to 17% [3]. Our measurements and case studies prove
that this potential savings can be achieved. Amount
of a potential savings is so significant that every airliner should
implement flight optimization into company processes.
NAV Flight Service‘s research, development
and implementation of flight optimization into URANOS flight
planning software have been realized thanks to the financial
assistance provided by the Ministry of Industry and Trade
of the Czech Republic from state budget (TIP project Flight
Planning Optimization).
REFERENCES
[1] Route availability document, AIRAC 1306 - 30 May 2013,
CFMU
[2] Industry Monitor, The EUROCONTROL bulletin on air
transport trends, Issue N°151. 30/04/13
[3] Fuel Action Plan, IATA, ISBN 92-9195-444-6
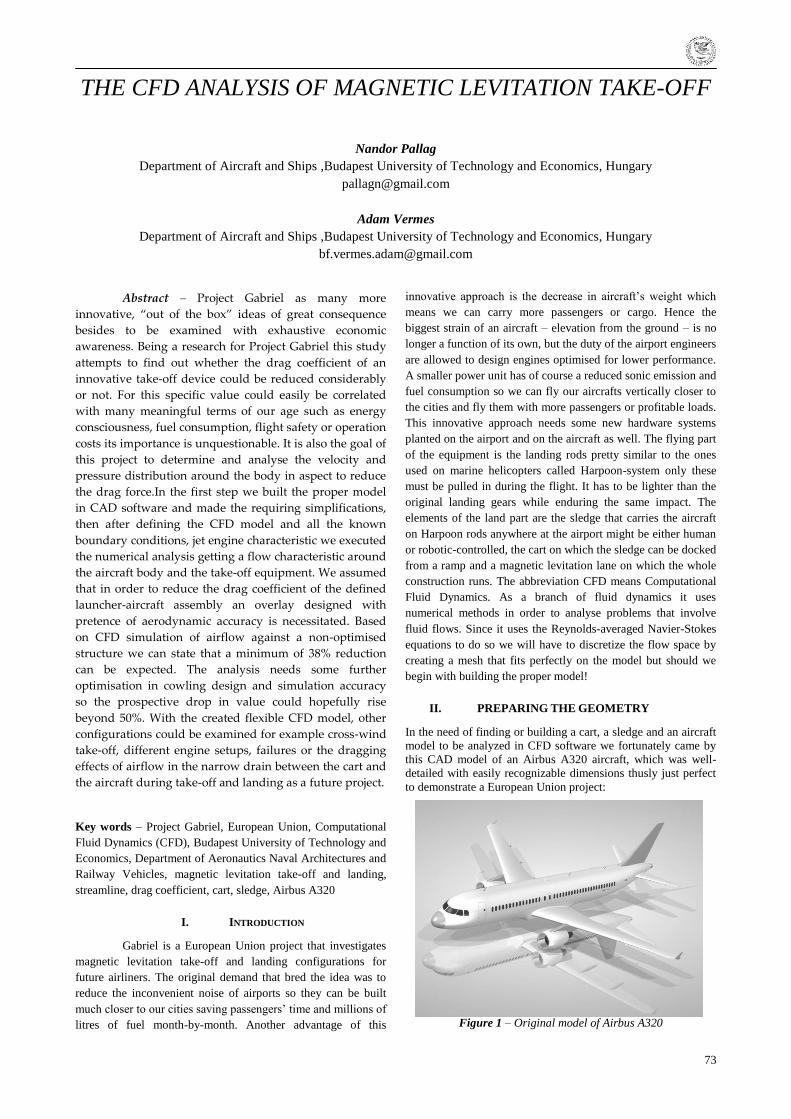
73
THE CFD ANALYSIS OF MAGNETIC LEVITATION TAKE-OFF
Nandor Pallag
Department of Aircraft and Ships ,Budapest University of Technology and Economics, Hungary
Adam Vermes
Department of Aircraft and Ships ,Budapest University of Technology and Economics, Hungary
Abstract – Project Gabriel as many more
innovative, “out of the box” ideas of great consequence
besides to be examined with exhaustive economic
awareness. Being a research for Project Gabriel this study
attempts to find out whether the drag coefficient of an
innovative take-off device could be reduced considerably
or not. For this specific value could easily be correlated
with many meaningful terms of our age such as energy
consciousness, fuel consumption, flight safety or operation
costs its importance is unquestionable. It is also the goal of
this project to determine and analyse the velocity and
pressure distribution around the body in aspect to reduce
the drag force.In the first step we built the proper model
in CAD software and made the requiring simplifications,
then after defining the CFD model and all the known
boundary conditions, jet engine characteristic we executed
the numerical analysis getting a flow characteristic around
the aircraft body and the take-off equipment. We assumed
that in order to reduce the drag coefficient of the defined
launcher-aircraft assembly an overlay designed with
pretence of aerodynamic accuracy is necessitated. Based
on CFD simulation of airflow against a non-optimised
structure we can state that a minimum of 38% reduction
can be expected. The analysis needs some further
optimisation in cowling design and simulation accuracy
so the prospective drop in value could hopefully rise
beyond 50%. With the created flexible CFD model, other
configurations could be examined for example cross-wind
take-off, different engine setups, failures or the dragging
effects of airflow in the narrow drain between the cart and
the aircraft during take-off and landing as a future project.
Key words – Project Gabriel, European Union, Computational
Fluid Dynamics (CFD), Budapest University of Technology and
Economics, Department of Aeronautics Naval Architectures and
Railway Vehicles, magnetic levitation take-off and landing,
streamline, drag coefficient, cart, sledge, Airbus A320
I. INTRODUCTION
Gabriel is a European Union project that investigates
magnetic levitation take-off and landing configurations for
future airliners. The original demand that bred the idea was to
reduce the inconvenient noise of airports so they can be built
much closer to our cities saving passengers‘ time and millions of
litres of fuel month-by-month. Another advantage of this
innovative approach is the decrease in aircraft‘s weight which
means we can carry more passengers or cargo. Hence the
biggest strain of an aircraft – elevation from the ground – is no
longer a function of its own, but the duty of the airport engineers
are allowed to design engines optimised for lower performance.
A smaller power unit has of course a reduced sonic emission and
fuel consumption so we can fly our aircrafts vertically closer to
the cities and fly them with more passengers or profitable loads.
This innovative approach needs some new hardware systems
planted on the airport and on the aircraft as well. The flying part
of the equipment is the landing rods pretty similar to the ones
used on marine helicopters called Harpoon-system only these
must be pulled in during the flight. It has to be lighter than the
original landing gears while enduring the same impact. The
elements of the land part are the sledge that carries the aircraft
on Harpoon rods anywhere at the airport might be either human
or robotic-controlled, the cart on which the sledge can be docked
from a ramp and a magnetic levitation lane on which the whole
construction runs. The abbreviation CFD means Computational
Fluid Dynamics. As a branch of fluid dynamics it uses
numerical methods in order to analyse problems that involve
fluid flows. Since it uses the Reynolds-averaged Navier-Stokes
equations to do so we will have to discretize the flow space by
creating a mesh that fits perfectly on the model but should we
begin with building the proper model!
II. PREPARING THE GEOMETRY
In the need of finding or building a cart, a sledge and an aircraft
model to be analyzed in CFD software we fortunately came by
this CAD model of an Airbus A320 aircraft, which was well-
detailed with easily recognizable dimensions thusly just perfect
to demonstrate a European Union project:
Figure 1 – Original model of Airbus A320
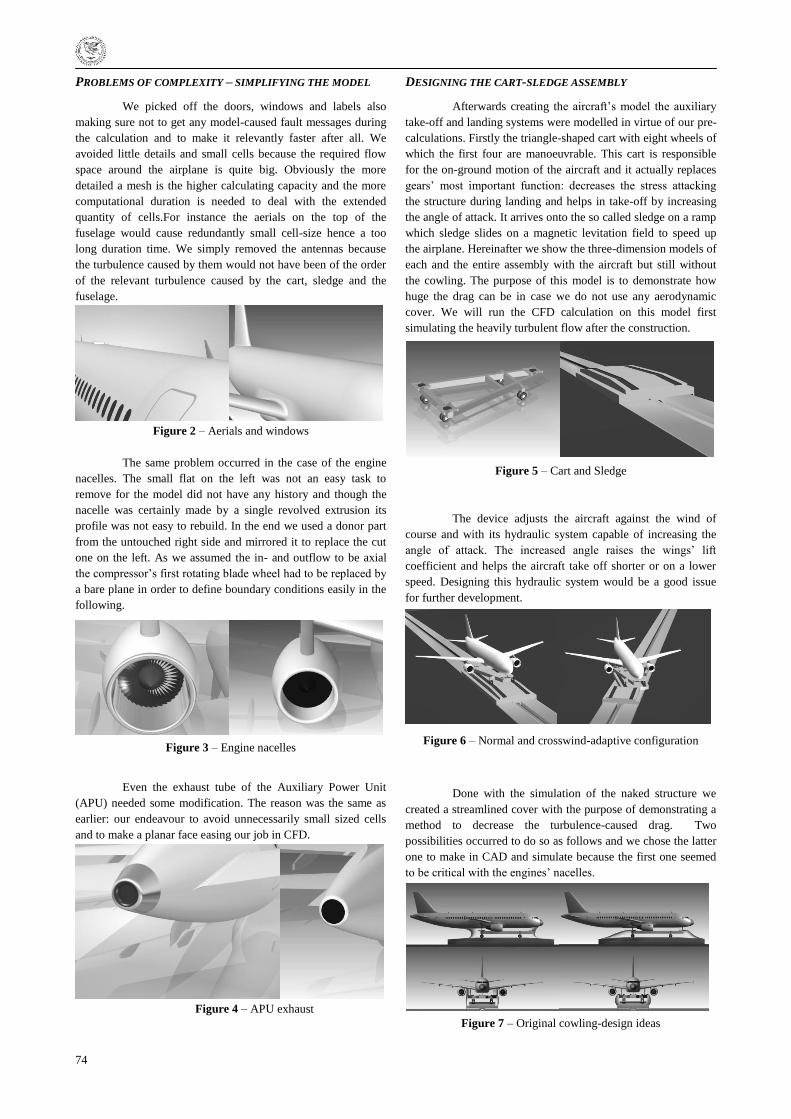
74
PROBLEMS OF COMPLEXITY – SIMPLIFYING THE MODEL
We picked off the doors, windows and labels also
making sure not to get any model-caused fault messages during
the calculation and to make it relevantly faster after all. We
avoided little details and small cells because the required flow
space around the airplane is quite big. Obviously the more
detailed a mesh is the higher calculating capacity and the more
computational duration is needed to deal with the extended
quantity of cells.For instance the aerials on the top of the
fuselage would cause redundantly small cell-size hence a too
long duration time. We simply removed the antennas because
the turbulence caused by them would not have been of the order
of the relevant turbulence caused by the cart, sledge and the
fuselage.
Figure 2 – Aerials and windows
The same problem occurred in the case of the engine
nacelles. The small flat on the left was not an easy task to
remove for the model did not have any history and though the
nacelle was certainly made by a single revolved extrusion its
profile was not easy to rebuild. In the end we used a donor part
from the untouched right side and mirrored it to replace the cut
one on the left. As we assumed the in- and outflow to be axial
the compressor‘s first rotating blade wheel had to be replaced by
a bare plane in order to define boundary conditions easily in the
following.
Figure 3 – Engine nacelles
Even the exhaust tube of the Auxiliary Power Unit
(APU) needed some modification. The reason was the same as
earlier: our endeavour to avoid unnecessarily small sized cells
and to make a planar face easing our job in CFD.
Figure 4 – APU exhaust
DESIGNING THE CART-SLEDGE ASSEMBLY
Afterwards creating the aircraft‘s model the auxiliary
take-off and landing systems were modelled in virtue of our pre-
calculations. Firstly the triangle-shaped cart with eight wheels of
which the first four are manoeuvrable. This cart is responsible
for the on-ground motion of the aircraft and it actually replaces
gears‘ most important function: decreases the stress attacking
the structure during landing and helps in take-off by increasing
the angle of attack. It arrives onto the so called sledge on a ramp
which sledge slides on a magnetic levitation field to speed up
the airplane. Hereinafter we show the three-dimension models of
each and the entire assembly with the aircraft but still without
the cowling. The purpose of this model is to demonstrate how
huge the drag can be in case we do not use any aerodynamic
cover. We will run the CFD calculation on this model first
simulating the heavily turbulent flow after the construction.
Figure 5 – Cart and Sledge
The device adjusts the aircraft against the wind of
course and with its hydraulic system capable of increasing the
angle of attack. The increased angle raises the wings‘ lift
coefficient and helps the aircraft take off shorter or on a lower
speed. Designing this hydraulic system would be a good issue
for further development.
Figure 6 – Normal and crosswind-adaptive configuration
Done with the simulation of the naked structure we
created a streamlined cover with the purpose of demonstrating a
method to decrease the turbulence-caused drag. Two
possibilities occurred to do so as follows and we chose the latter
one to make in CAD and simulate because the first one seemed
to be critical with the engines‘ nacelles.
Figure 7 – Original cowling-design ideas
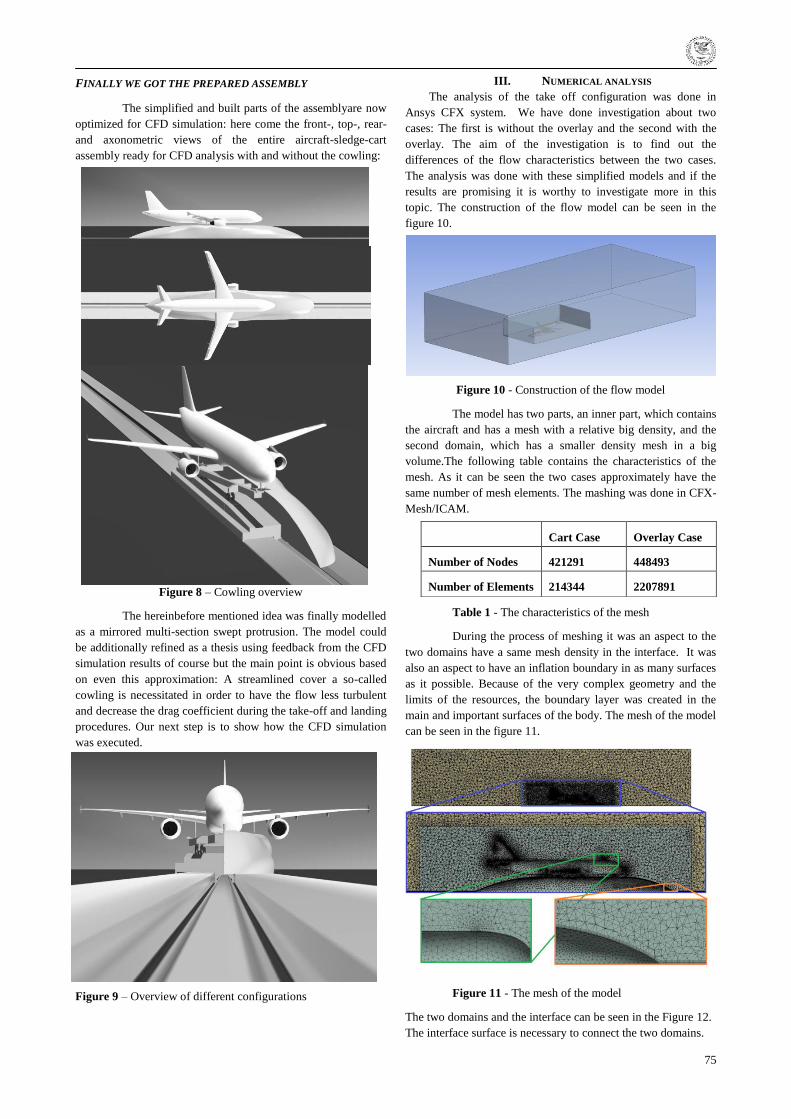
75
FINALLY WE GOT THE PREPARED ASSEMBLY
The simplified and built parts of the assemblyare now
optimized for CFD simulation: here come the front-, top-, rear-
and axonometric views of the entire aircraft-sledge-cart
assembly ready for CFD analysis with and without the cowling:
Figure 8 – Cowling overview
The hereinbefore mentioned idea was finally modelled
as a mirrored multi-section swept protrusion. The model could
be additionally refined as a thesis using feedback from the CFD
simulation results of course but the main point is obvious based
on even this approximation: A streamlined cover a so-called
cowling is necessitated in order to have the flow less turbulent
and decrease the drag coefficient during the take-off and landing
procedures. Our next step is to show how the CFD simulation
was executed.
Figure 9 – Overview of different configurations
III. NUMERICAL ANALYSIS
The analysis of the take off configuration was done in
Ansys CFX system. We have done investigation about two
cases: The first is without the overlay and the second with the
overlay. The aim of the investigation is to find out the
differences of the flow characteristics between the two cases.
The analysis was done with these simplified models and if the
results are promising it is worthy to investigate more in this
topic. The construction of the flow model can be seen in the
figure 10.
Figure 10 - Construction of the flow model
The model has two parts, an inner part, which contains
the aircraft and has a mesh with a relative big density, and the
second domain, which has a smaller density mesh in a big
volume.The following table contains the characteristics of the
mesh. As it can be seen the two cases approximately have the
same number of mesh elements. The mashing was done in CFX-
Mesh/ICAM.
Table 1 - The characteristics of the mesh
During the process of meshing it was an aspect to the
two domains have a same mesh density in the interface. It was
also an aspect to have an inflation boundary in as many surfaces
as it possible. Because of the very complex geometry and the
limits of the resources, the boundary layer was created in the
main and important surfaces of the body. The mesh of the model
can be seen in the figure 11.
Figure 11 - The mesh of the model
The two domains and the interface can be seen in the Figure 12.
The interface surface is necessary to connect the two domains.
Cart Case Overlay Case
Number of Nodes 421291 448493
Number of Elements 214344 2207891
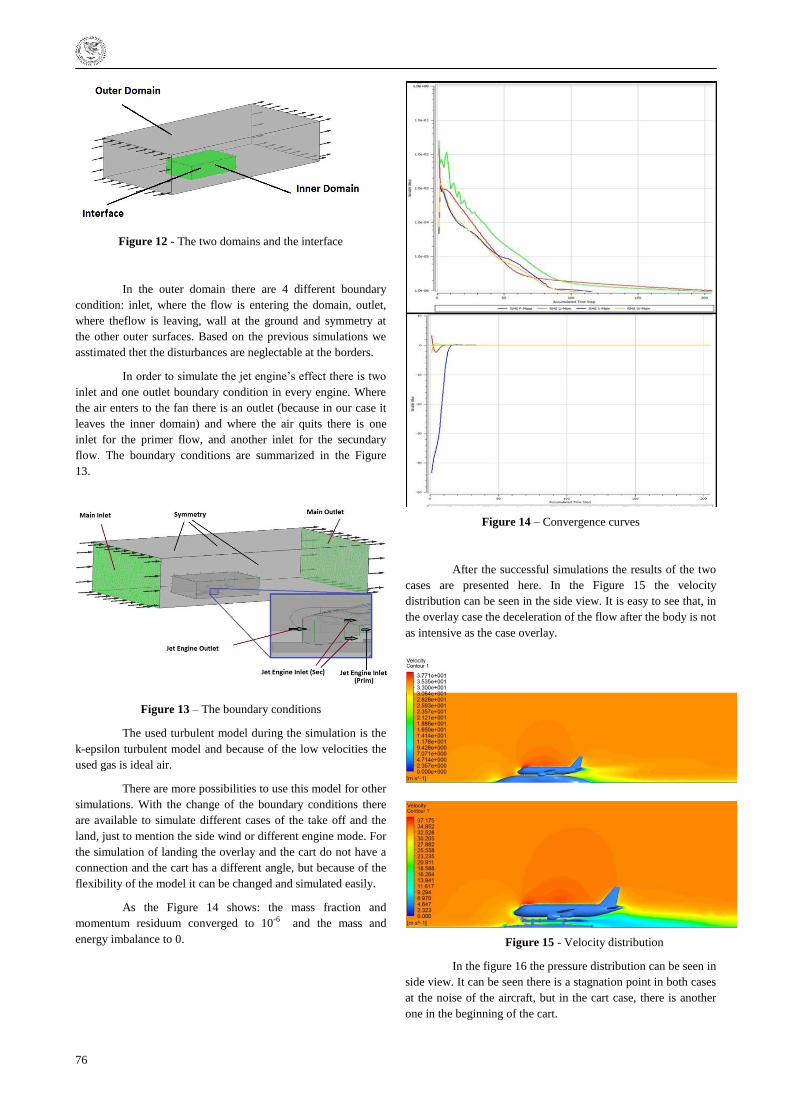
76
Figure 12 - The two domains and the interface
In the outer domain there are 4 different boundary
condition: inlet, where the flow is entering the domain, outlet,
where theflow is leaving, wall at the ground and symmetry at
the other outer surfaces. Based on the previous simulations we
asstimated thet the disturbances are neglectable at the borders.
In order to simulate the jet engine‘s effect there is two
inlet and one outlet boundary condition in every engine. Where
the air enters to the fan there is an outlet (because in our case it
leaves the inner domain) and where the air quits there is one
inlet for the primer flow, and another inlet for the secundary
flow. The boundary conditions are summarized in the Figure
13.
Figure 13 – The boundary conditions
The used turbulent model during the simulation is the
k-epsilon turbulent model and because of the low velocities the
used gas is ideal air.
There are more possibilities to use this model for other
simulations. With the change of the boundary conditions there
are available to simulate different cases of the take off and the
land, just to mention the side wind or different engine mode. For
the simulation of landing the overlay and the cart do not have a
connection and the cart has a different angle, but because of the
flexibility of the model it can be changed and simulated easily.
As the Figure 14 shows: the mass fraction and
momentum residuum converged to 10-6 and the mass and
energy imbalance to 0.
Figure 14 – Convergence curves
After the successful simulations the results of the two
cases are presented here. In the Figure 15 the velocity
distribution can be seen in the side view. It is easy to see that, in
the overlay case the deceleration of the flow after the body is not
as intensive as the case overlay.
Figure 15 - Velocity distribution
In the figure 16 the pressure distribution can be seen in
side view. It can be seen there is a stagnation point in both cases
at the noise of the aircraft, but in the cart case, there is another
one in the beginning of the cart.
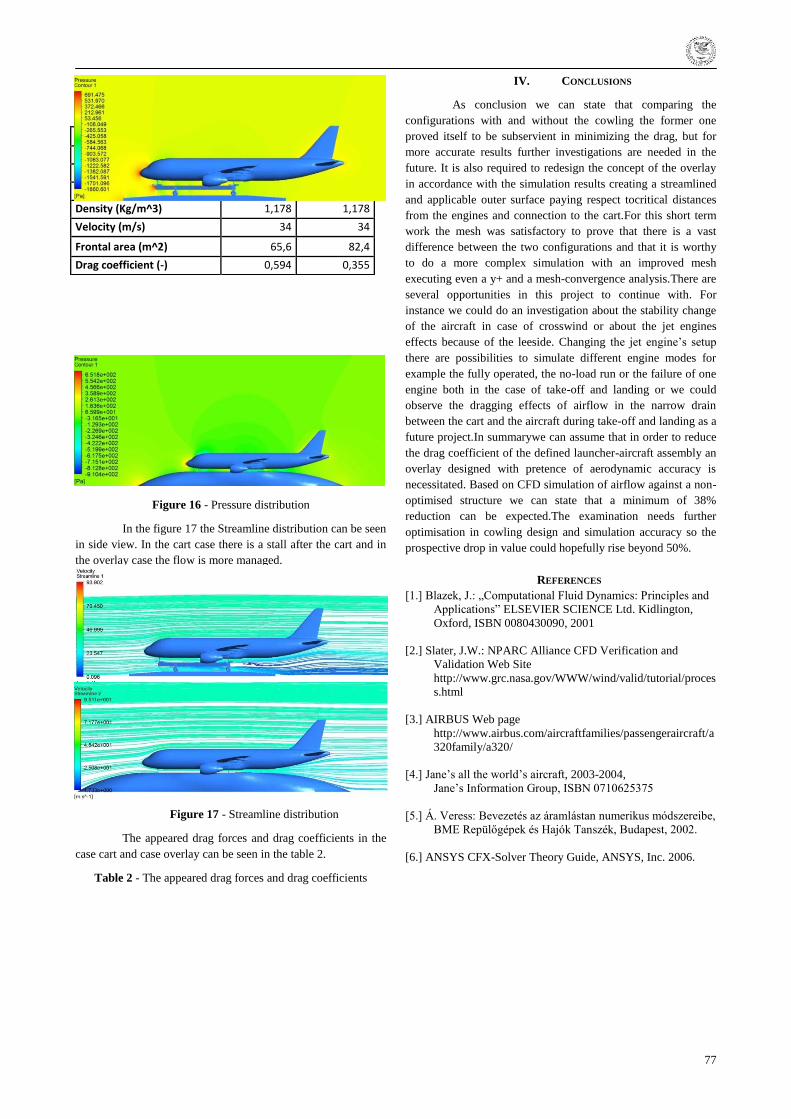
77
Figure 16 - Pressure distribution
In the figure 17 the Streamline distribution can be seen
in side view. In the cart case there is a stall after the cart and in
the overlay case the flow is more managed.
Figure 17 - Streamline distribution
The appeared drag forces and drag coefficients in the
case cart and case overlay can be seen in the table 2.
Table 2 - The appeared drag forces and drag coefficients
IV. CONCLUSIONS
As conclusion we can state that comparing the
configurations with and without the cowling the former one
proved itself to be subservient in minimizing the drag, but for
more accurate results further investigations are needed in the
future. It is also required to redesign the concept of the overlay
in accordance with the simulation results creating a streamlined
and applicable outer surface paying respect tocritical distances
from the engines and connection to the cart.For this short term
work the mesh was satisfactory to prove that there is a vast
difference between the two configurations and that it is worthy
to do a more complex simulation with an improved mesh
executing even a y+ and a mesh-convergence analysis.There are
several opportunities in this project to continue with. For
instance we could do an investigation about the stability change
of the aircraft in case of crosswind or about the jet engines
effects because of the leeside. Changing the jet engine‘s setup
there are possibilities to simulate different engine modes for
example the fully operated, the no-load run or the failure of one
engine both in the case of take-off and landing or we could
observe the dragging effects of airflow in the narrow drain
between the cart and the aircraft during take-off and landing as a
future project.In summarywe can assume that in order to reduce
the drag coefficient of the defined launcher-aircraft assembly an
overlay designed with pretence of aerodynamic accuracy is
necessitated. Based on CFD simulation of airflow against a non-
optimised structure we can state that a minimum of 38%
reduction can be expected.The examination needs further
optimisation in cowling design and simulation accuracy so the
prospective drop in value could hopefully rise beyond 50%.
REFERENCES
[1.] Blazek, J.: „Computational Fluid Dynamics: Principles and
Applications‖ ELSEVIER SCIENCE Ltd. Kidlington,
Oxford, ISBN 0080430090, 2001
[2.] Slater, J.W.: NPARC Alliance CFD Verification and
Validation Web Site
http://www.grc.nasa.gov/WWW/wind/valid/tutorial/proces
s.html
[3.] AIRBUS Web page
http://www.airbus.com/aircraftfamilies/passengeraircraft/a
320family/a320/
[4.] Jane‘s all the world‘s aircraft, 2003-2004,
Jane‘s Information Group, ISBN 0710625375
[5.] Á. Veress: Bevezetés az áramlástan numerikus módszereibe,
BME Repülőgépek és Hajók Tanszék, Budapest, 2002.
[6.] ANSYS CFX-Solver Theory Guide, ANSYS, Inc. 2006.
Case cart Case overlay
Forces in the X direction (N) 17295 10688
Thrust (N) 9220 9220
Drag (N) 26515 19908
Density (Kg/m^3) 1,178 1,178
Velocity (m/s) 34 34
Frontal area (m^2) 65,6 82,4
Drag coefficient (-) 0,594 0,355
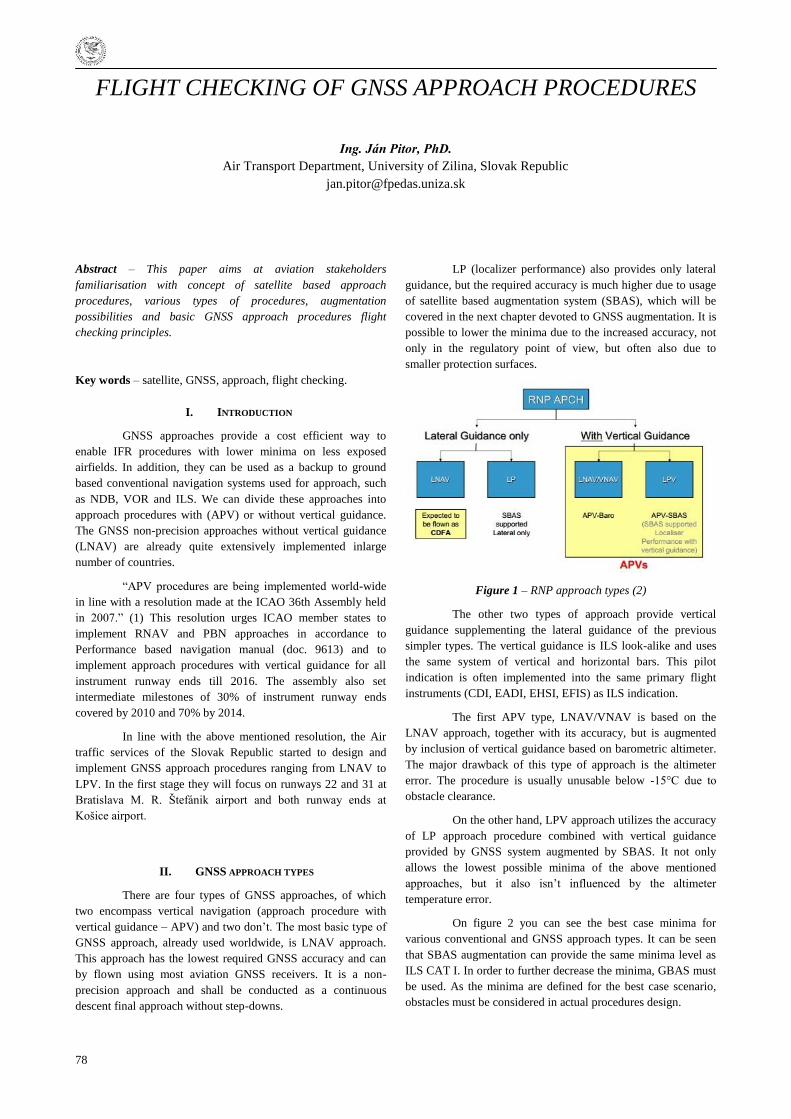
78
FLIGHT CHECKING OF GNSS APPROACH PROCEDURES
Ing. Ján Pitor, PhD.
Air Transport Department, University of Zilina, Slovak Republic
Abstract – This paper aims at aviation stakeholders
familiarisation with concept of satellite based approach
procedures, various types of procedures, augmentation
possibilities and basic GNSS approach procedures flight
checking principles.
Key words – satellite, GNSS, approach, flight checking.
I. INTRODUCTION
GNSS approaches provide a cost efficient way to
enable IFR procedures with lower minima on less exposed
airfields. In addition, they can be used as a backup to ground
based conventional navigation systems used for approach, such
as NDB, VOR and ILS. We can divide these approaches into
approach procedures with (APV) or without vertical guidance.
The GNSS non-precision approaches without vertical guidance
(LNAV) are already quite extensively implemented inlarge
number of countries.
―APV procedures are being implemented world-wide
in line with a resolution made at the ICAO 36th Assembly held
in 2007.‖ (1) This resolution urges ICAO member states to
implement RNAV and PBN approaches in accordance to
Performance based navigation manual (doc. 9613) and to
implement approach procedures with vertical guidance for all
instrument runway ends till 2016. The assembly also set
intermediate milestones of 30% of instrument runway ends
covered by 2010 and 70% by 2014.
In line with the above mentioned resolution, the Air
traffic services of the Slovak Republic started to design and
implement GNSS approach procedures ranging from LNAV to
LPV. In the first stage they will focus on runways 22 and 31 at
Bratislava M. R. Štefánik airport and both runway ends at
Košice airport.
II. GNSS APPROACH TYPES
There are four types of GNSS approaches, of which
two encompass vertical navigation (approach procedure with
vertical guidance – APV) and two don‘t. The most basic type of
GNSS approach, already used worldwide, is LNAV approach.
This approach has the lowest required GNSS accuracy and can
by flown using most aviation GNSS receivers. It is a non-
precision approach and shall be conducted as a continuous
descent final approach without step-downs.
LP (localizer performance) also provides only lateral
guidance, but the required accuracy is much higher due to usage
of satellite based augmentation system (SBAS), which will be
covered in the next chapter devoted to GNSS augmentation. It is
possible to lower the minima due to the increased accuracy, not
only in the regulatory point of view, but often also due to
smaller protection surfaces.
Figure 1 – RNP approach types (2)
The other two types of approach provide vertical
guidance supplementing the lateral guidance of the previous
simpler types. The vertical guidance is ILS look-alike and uses
the same system of vertical and horizontal bars. This pilot
indication is often implemented into the same primary flight
instruments (CDI, EADI, EHSI, EFIS) as ILS indication.
The first APV type, LNAV/VNAV is based on the
LNAV approach, together with its accuracy, but is augmented
by inclusion of vertical guidance based on barometric altimeter.
The major drawback of this type of approach is the altimeter
error. The procedure is usually unusable below -15°C due to
obstacle clearance.
On the other hand, LPV approach utilizes the accuracy
of LP approach procedure combined with vertical guidance
provided by GNSS system augmented by SBAS. It not only
allows the lowest possible minima of the above mentioned
approaches, but it also isn‘t influenced by the altimeter
temperature error.
On figure 2 you can see the best case minima for
various conventional and GNSS approach types. It can be seen
that SBAS augmentation can provide the same minima level as
ILS CAT I. In order to further decrease the minima, GBAS must
be used. As the minima are defined for the best case scenario,
obstacles must be considered in actual procedures design.
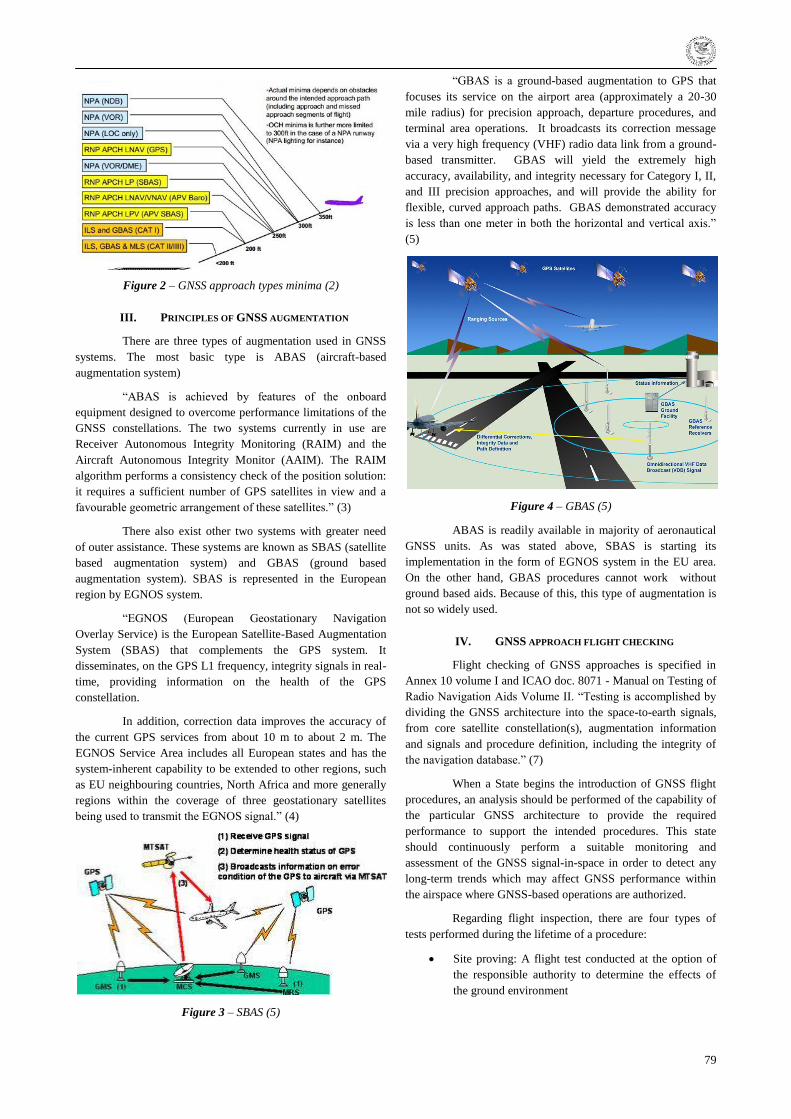
79
Figure 2 – GNSS approach types minima (2)
III. PRINCIPLES OF GNSS AUGMENTATION
There are three types of augmentation used in GNSS
systems. The most basic type is ABAS (aircraft-based
augmentation system)
―ABAS is achieved by features of the onboard
equipment designed to overcome performance limitations of the
GNSS constellations. The two systems currently in use are
Receiver Autonomous Integrity Monitoring (RAIM) and the
Aircraft Autonomous Integrity Monitor (AAIM). The RAIM
algorithm performs a consistency check of the position solution:
it requires a sufficient number of GPS satellites in view and a
favourable geometric arrangement of these satellites.‖ (3)
There also exist other two systems with greater need
of outer assistance. These systems are known as SBAS (satellite
based augmentation system) and GBAS (ground based
augmentation system). SBAS is represented in the European
region by EGNOS system.
―EGNOS (European Geostationary Navigation
Overlay Service) is the European Satellite-Based Augmentation
System (SBAS) that complements the GPS system. It
disseminates, on the GPS L1 frequency, integrity signals in real-
time, providing information on the health of the GPS
constellation.
In addition, correction data improves the accuracy of
the current GPS services from about 10 m to about 2 m. The
EGNOS Service Area includes all European states and has the
system-inherent capability to be extended to other regions, such
as EU neighbouring countries, North Africa and more generally
regions within the coverage of three geostationary satellites
being used to transmit the EGNOS signal.‖ (4)
Figure 3 – SBAS (5)
―GBAS is a ground-based augmentation to GPS that
focuses its service on the airport area (approximately a 20-30
mile radius) for precision approach, departure procedures, and
terminal area operations. It broadcasts its correction message
via a very high frequency (VHF) radio data link from a ground-
based transmitter. GBAS will yield the extremely high
accuracy, availability, and integrity necessary for Category I, II,
and III precision approaches, and will provide the ability for
flexible, curved approach paths. GBAS demonstrated accuracy
is less than one meter in both the horizontal and vertical axis.‖
(5)
Figure 4 – GBAS (5)
ABAS is readily available in majority of aeronautical
GNSS units. As was stated above, SBAS is starting its
implementation in the form of EGNOS system in the EU area.
On the other hand, GBAS procedures cannot work without
ground based aids. Because of this, this type of augmentation is
not so widely used.
IV. GNSS APPROACH FLIGHT CHECKING
Flight checking of GNSS approaches is specified in
Annex 10 volume I and ICAO doc. 8071 - Manual on Testing of
Radio Navigation Aids Volume II. ―Testing is accomplished by
dividing the GNSS architecture into the space-to-earth signals,
from core satellite constellation(s), augmentation information
and signals and procedure definition, including the integrity of
the navigation database.‖ (7)
When a State begins the introduction of GNSS flight
procedures, an analysis should be performed of the capability of
the particular GNSS architecture to provide the required
performance to support the intended procedures. This state
should continuously perform a suitable monitoring and
assessment of the GNSS signal-in-space in order to detect any
long-term trends which may affect GNSS performance within
the airspace where GNSS-based operations are authorized.
Regarding flight inspection, there are four types of
tests performed during the lifetime of a procedure:
Site proving: A flight test conducted at the option of
the responsible authority to determine the effects of
the ground environment
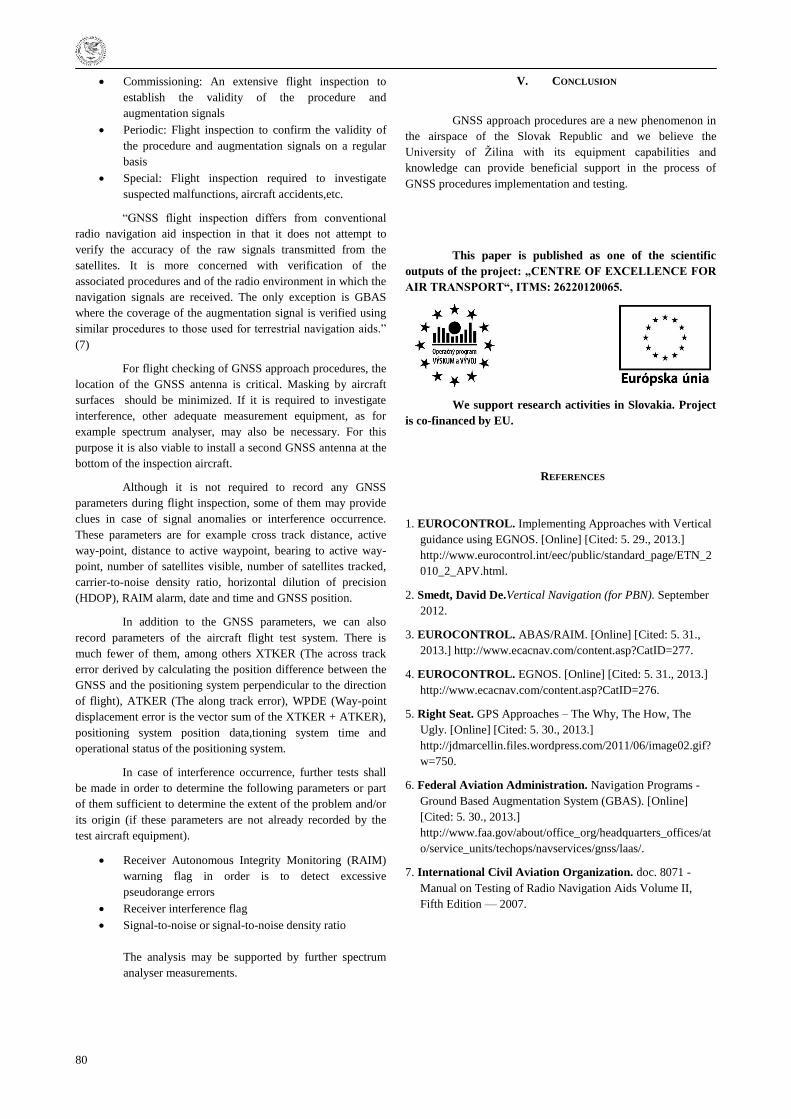
80
Commissioning: An extensive flight inspection to
establish the validity of the procedure and
augmentation signals
Periodic: Flight inspection to confirm the validity of
the procedure and augmentation signals on a regular
basis
Special: Flight inspection required to investigate
suspected malfunctions, aircraft accidents,etc.
―GNSS flight inspection differs from conventional
radio navigation aid inspection in that it does not attempt to
verify the accuracy of the raw signals transmitted from the
satellites. It is more concerned with verification of the
associated procedures and of the radio environment in which the
navigation signals are received. The only exception is GBAS
where the coverage of the augmentation signal is verified using
similar procedures to those used for terrestrial navigation aids.‖
(7)
For flight checking of GNSS approach procedures, the
location of the GNSS antenna is critical. Masking by aircraft
surfaces should be minimized. If it is required to investigate
interference, other adequate measurement equipment, as for
example spectrum analyser, may also be necessary. For this
purpose it is also viable to install a second GNSS antenna at the
bottom of the inspection aircraft.
Although it is not required to record any GNSS
parameters during flight inspection, some of them may provide
clues in case of signal anomalies or interference occurrence.
These parameters are for example cross track distance, active
way-point, distance to active waypoint, bearing to active way-
point, number of satellites visible, number of satellites tracked,
carrier-to-noise density ratio, horizontal dilution of precision
(HDOP), RAIM alarm, date and time and GNSS position.
In addition to the GNSS parameters, we can also
record parameters of the aircraft flight test system. There is
much fewer of them, among others XTKER (The across track
error derived by calculating the position difference between the
GNSS and the positioning system perpendicular to the direction
of flight), ATKER (The along track error), WPDE (Way-point
displacement error is the vector sum of the XTKER + ATKER),
positioning system position data,tioning system time and
operational status of the positioning system.
In case of interference occurrence, further tests shall
be made in order to determine the following parameters or part
of them sufficient to determine the extent of the problem and/or
its origin (if these parameters are not already recorded by the
test aircraft equipment).
Receiver Autonomous Integrity Monitoring (RAIM)
warning flag in order is to detect excessive
pseudorange errors
Receiver interference flag
Signal-to-noise or signal-to-noise density ratio
The analysis may be supported by further spectrum
analyser measurements.
V. CONCLUSION
GNSS approach procedures are a new phenomenon in
the airspace of the Slovak Republic and we believe the
University of Ţilina with its equipment capabilities and
knowledge can provide beneficial support in the process of
GNSS procedures implementation and testing.
This paper is published as one of the scientific
outputs of the project: „CENTRE OF EXCELLENCE FOR
AIR TRANSPORT“, ITMS: 26220120065.
We support research activities in Slovakia. Project
is co-financed by EU.
REFERENCES
1. EUROCONTROL. Implementing Approaches with Vertical
guidance using EGNOS. [Online] [Cited: 5. 29., 2013.]
http://www.eurocontrol.int/eec/public/standard_page/ETN_2
010_2_APV.html.
2. Smedt, David De.Vertical Navigation (for PBN). September
2012.
3. EUROCONTROL. ABAS/RAIM. [Online] [Cited: 5. 31.,
2013.] http://www.ecacnav.com/content.asp?CatID=277.
4. EUROCONTROL. EGNOS. [Online] [Cited: 5. 31., 2013.]
http://www.ecacnav.com/content.asp?CatID=276.
5. Right Seat. GPS Approaches – The Why, The How, The
Ugly. [Online] [Cited: 5. 30., 2013.]
http://jdmarcellin.files.wordpress.com/2011/06/image02.gif?
w=750.
6. Federal Aviation Administration. Navigation Programs -
Ground Based Augmentation System (GBAS). [Online]
[Cited: 5. 30., 2013.]
http://www.faa.gov/about/office_org/headquarters_offices/at
o/service_units/techops/navservices/gnss/laas/.
7. International Civil Aviation Organization. doc. 8071 -
Manual on Testing of Radio Navigation Aids Volume II,
Fifth Edition — 2007.
81
INTRODUCTION TO SOFTWARE DEVELOPMENT FOR GNSS
INFRASTRUCTURE ASSESSMENT
SAFETY OF AIR NAVIGATION SERVICES
Ing. Pavel Ptáček
Institute of Aerospace Engineering, Brno University of Technology, Czech Republic
Abstract – Article presents introduction to software development
background of GNSS infrastructure assessment. Primary
objective is to support new final approach navigation
applications and PBN implementation goals, which should be
subjectof adequate planning by national ANSP responsible
authority, national navigation strategy design in cooperation
with all stakeholders, extensive pre-operational and operational
GNSS service evaluation deployment.
Key words – software, quality,GNSS, GPS, EGNOS, SIS,
navigation
I. INTRODUCTION
Safety and effectiveness of air transport system are its
primary quality parameters against which the system should be
assessed. Within the context of these two attributes this article
deals with one emerging issue of GNSS application operations
under responsibility of national air navigation services.
In line with the recommendations in ICAO Annex 10
SARPs as well as the ICAO GNSS Manual, it is expected to
cover GNSS infrastructure service verification by establishment
of signal monitoring and evaluation. In general, ICAO Global
Safety plan requires member states to effectively reporting and
analysing of errors and incidents. Research in navigation
infrastructure assessment is fast developing with the emerging
GNSS system and applications.
Safety critical applications of any transport system are
part of corresponding navigation services, wheatear in the air or
on the sea. Evaluation of system operational performance for
navigation applications and the design of the evaluation
procedures is part of authors‘ long term research on the Institute
of Aerospace Engineering, Brno University of Technology.
Approach to the design of software for GNSS signal in space
assessment is further presented in the article.
MOTIVATION
EUROCONTROL recognized advantage of research
and development in GNSS monitoring several years ago. Today
manages a network of around 30 GNSS receivers in Europe,
none of which are deployed and operated in Czech or Slovak
Republic. Its Navigation Steering Group remind on its 17
Meeting (19 April 2013, Brussels) the need ―of GNSS
monitoring, whether it be for performance verification purposes
to support GNSS approvals, for compliance with ICAO Annex
10/I recommendations on monitoring or for interference and
anomaly detection‖. NSG meeting still aims to clarify
objectives, roles and responsibilities for GNSS monitoring even
though very familiar with Single European Sky legislation.
EUROCONTROL also foresees iteration with DG MOVE
(Directorate-General for Mobility and Transport) aiming at
having the adequate legal provisions agreed by the Single Sky.
EGNOS Performance Reporting Software proposes solution for
GPS and EGNOS data analysis and navigation service levels
evaluation in the area of FIR Praha.
II. THEORETICAL AND PRACTICAL ASPECTS
OF SOFTWARE DEVELOPMENT
As the name of the article itself implies, the software
for evaluation of the GPS and EGNOS supplied navigation
quality for navigation applications it the application type of
software. This means, it is type that is considered as ―stand-
alone‖, solving specific aviation needs. Its name is EGNOS
Performance Reporting Software (EPRS).
SOFTWARE DEVELOPMENT PROCESS
As the requirements for avionic and navigation
systems are documented, stable and author made a broad
analysis of these, which enables reasonable schedules and
definition of necessary resources, a Waterfall model for
developmentprocess of the observation data evaluation tool. It
has been used primarily as linear model that exists for a long
time. It is build up on structured approach that contains four
well explainable steps that are rigorously followed. That is
requirements analysis, design, system test and operation. Today,
same as in the article, combination with the other models is
usual. Sever iterations in development have been done. As
previously mentioned, a structured progression between defined
phases is baseline. Each phase consists of a definite set of
activities and deliverables that must be accomplished before the
following phase can begin.
Author indentified four system engineering methods
as practicable to be aware of for EPRS development
specification and performance evaluation. These are the
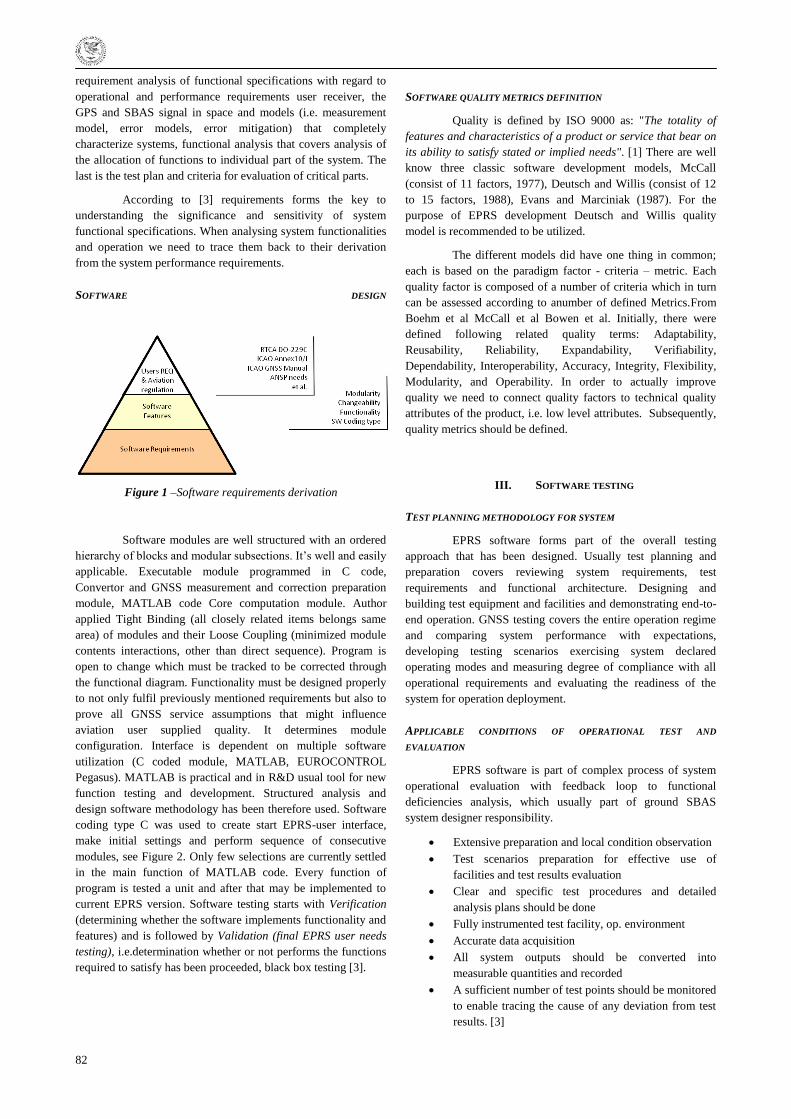
82
requirement analysis of functional specifications with regard to
operational and performance requirements user receiver, the
GPS and SBAS signal in space and models (i.e. measurement
model, error models, error mitigation) that completely
characterize systems, functional analysis that covers analysis of
the allocation of functions to individual part of the system. The
last is the test plan and criteria for evaluation of critical parts.
According to [3] requirements forms the key to
understanding the significance and sensitivity of system
functional specifications. When analysing system functionalities
and operation we need to trace them back to their derivation
from the system performance requirements.
SOFTWARE DESIGN
Figure 1 –Software requirements derivation
Software modules are well structured with an ordered
hierarchy of blocks and modular subsections. It‘s well and easily
applicable. Executable module programmed in C code,
Convertor and GNSS measurement and correction preparation
module, MATLAB code Core computation module. Author
applied Tight Binding (all closely related items belongs same
area) of modules and their Loose Coupling (minimized module
contents interactions, other than direct sequence). Program is
open to change which must be tracked to be corrected through
the functional diagram. Functionality must be designed properly
to not only fulfil previously mentioned requirements but also to
prove all GNSS service assumptions that might influence
aviation user supplied quality. It determines module
configuration. Interface is dependent on multiple software
utilization (C coded module, MATLAB, EUROCONTROL
Pegasus). MATLAB is practical and in R&D usual tool for new
function testing and development. Structured analysis and
design software methodology has been therefore used. Software
coding type C was used to create start EPRS-user interface,
make initial settings and perform sequence of consecutive
modules, see Figure 2. Only few selections are currently settled
in the main function of MATLAB code. Every function of
program is tested a unit and after that may be implemented to
current EPRS version. Software testing starts with Verification
(determining whether the software implements functionality and
features) and is followed by Validation (final EPRS user needs
testing), i.e.determination whether or not performs the functions
required to satisfy has been proceeded, black box testing [3].
SOFTWARE QUALITY METRICS DEFINITION
Quality is defined by ISO 9000 as: "The totality of
features and characteristics of a product or service that bear on
its ability to satisfy stated or implied needs". [1] There are well
know three classic software development models, McCall
(consist of 11 factors, 1977), Deutsch and Willis (consist of 12
to 15 factors, 1988), Evans and Marciniak (1987). For the
purpose of EPRS development Deutsch and Willis quality
model is recommended to be utilized.
The different models did have one thing in common;
each is based on the paradigm factor - criteria – metric. Each
quality factor is composed of a number of criteria which in turn
can be assessed according to anumber of defined Metrics.From
Boehm et al McCall et al Bowen et al. Initially, there were
defined following related quality terms: Adaptability,
Reusability, Reliability, Expandability, Verifiability,
Dependability, Interoperability, Accuracy, Integrity, Flexibility,
Modularity, and Operability. In order to actually improve
quality we need to connect quality factors to technical quality
attributes of the product, i.e. low level attributes. Subsequently,
quality metrics should be defined.
III. SOFTWARE TESTING
TEST PLANNING METHODOLOGY FOR SYSTEM
EPRS software forms part of the overall testing
approach that has been designed. Usually test planning and
preparation covers reviewing system requirements, test
requirements and functional architecture. Designing and
building test equipment and facilities and demonstrating end-to-
end operation. GNSS testing covers the entire operation regime
and comparing system performance with expectations,
developing testing scenarios exercising system declared
operating modes and measuring degree of compliance with all
operational requirements and evaluating the readiness of the
system for operation deployment.
APPLICABLE CONDITIONS OF OPERATIONAL TEST AND
EVALUATION
EPRS software is part of complex process of system
operational evaluation with feedback loop to functional
deficiencies analysis, which usually part of ground SBAS
system designer responsibility.
Extensive preparation and local condition observation
Test scenarios preparation for effective use of
facilities and test results evaluation
Clear and specific test procedures and detailed
analysis plans should be done
Fully instrumented test facility, op. environment
Accurate data acquisition
All system outputs should be converted into
measurable quantities and recorded
A sufficient number of test points should be monitored
to enable tracing the cause of any deviation from test
results. [3]

83
Timely and accurate test reports.
IV. SOFTWARE ARCHITECTURE
Position accuracy, time series figures, satellite
availability, Dilution of Precision (DOP) factors, accuracy (e.g.
HPE, VPE, HNSE, VNSE, ellipse of concentration, ACF, PSD,
worst ionosphere case NPA) and integrity performance figures
(e.g. HPL, VPL, HMI, MI, URA), number of satellite vehicles
(SVN) used, record of all received messages, identification of
faults/failures and further functionalities, which description is
beyond the scope of this article
Figure 2 – EPRS Architecture Design
Figure 3 –Flowchart of the Main Algorithm
For any subject that will use the software or design
new capabilities, functional system diagrams are designed, see
example of the main EPRS algorithm flowchart on Figure 3.
Modules are organized to enable multiple tasks to be completed,
whether it is related to receiver simulation settings, range
domain outputs or position domain output in report.
Figure 4 – EPRS Start Window
V. CONCLUSION
Contribution presents short introduction to procedures
of EPRS software development and utilization for observed data
evaluation from different station (covering all geographic region
of FIR Praha) is ongoing software capabilities (see Figure 2).
When finished, database of EGNOS characteristics with
procedures for the assessment will become available.
VI. ACKNOWLEDGEMENT
Activity has been supported in the frame of the project
―New Technologies and Procedures for the Sustainability of IFR
Air Traffic on Regional Airports‖, FSI-J-12-1758, Specific
University Research at the Brno University of Technology.
VII. REFERENCES
[1] ISO 9001, 'Quality Systems - Model for Quality Assurance
for Design/Development, Production, Installation and
Servicing.
[2] Kossiakoff, A. et al. Systems Engineering : Principles and
Practice. John Wiley & Sons, Inc., Hoboken, New Jersey.
2011, pp. 531. ISBN 978-0-470-40548-2
[3] Attaway, S. Matlab : Introduction to Programming and
Problem Solving. Elsevier USA, 2012, pp.518. ISBN 978-
0-12-385081-2.
[4] Ptáček, P.: EGNOS Performance Reporting Software
Documentation.
84
POSSIBILITIES OF USING GNSS IN AIR NAVIGATION
Ing. Jozef SABO
Technical University Košice, Faculty of Aeronautics, Rampová, 7 041 21 Košice
doc. Ing Ján BÁLINT, CSc.
Technical University Košice, Faculty of Aeronautics, Rampová, 7 041 21 Košice
Abstract – The issue of global navigation satellite systems
(GNSS) is the number of potential uses in navigation and
management of aircraft. The paper should be a description of
the design possibilities replacement of approach navigation
using conventional ground based GNSS systems especially at
airports used mainly occasional commercial traffic and private
businesses, the pros and cons of using these methods.
Key words – GNSS, navigation, radionavigation, approach,
RNAV
I. INTRODUCTION
Current satellite navigation system meant a qualitative
leap in precision navigation, which reaches several meters, using
special techniques differential is achieved accuracy within one
meter. Thus arose the possibility of using GNSS for accurate
navigation in the air and replace older ground-based systems.
Currently operating three satellite navigation systems,
the American GPS and Russian GLONASS, European Galileo
system, which can provide the basis for a new navigation system
not only in aviation.
Article refers mainly to the use of a system of air
navigation units mainly in phase approach to the runway.
They are also described in the article specifically satellite
systems and the possibility of their use. In article authors
discussed detailed questions about systems like WAAS, GBAS,
EGNOS, ABAS, GAGAN, MSAS, SBAS and GRAS,
composition of their advantages and disadvantages, operations,
differences and the identity of specific systems and equipment.
II. HISTORY OF GNSS
Satellite-based radio positioning means in comparison with
conventional methods radionavigation significant progress.
Their main advantage is accuracy and allows you to work in a
single coordinate system anywhere on earth. Despite the long-
term development to a fully operational satellite-based radio
navigation systems treated very cautiously and more recently,
these systems have not been on in the wider professional
community almost no information. At the beginning it should be
pointed out that often come across the abbreviation GPS, which
stands the English name of Global Positioning System (Global
Positioning System). This shortcut is actually another name
American NAVSTAR system. It is therefore not appropriate for
use? GPS is not a common name for all satellite navigation
systems. Currently becoming increasingly important two main
satellite radio-navigation systems:
• American system NAVSTAR (Navigation Satellite
Timing and Ranging)
• Russian system GLONASS (Globalnaja
navigacionnaja sputnikovaja sistema).
The origin of satellite navigation systems to look for in
1957, when it was in the former Soviet Union launched into
orbit the first artificial satellite. Extensive research in the field of
navigation in this period took place in the USA as well as in the
USSR (launched in the year 1967 the first Soviet satellite
navigation called CYKLON). This foundation was laid
construction of two famous satellite navigation systems.
In the first half of the 80th years, was built the
American system NAVSTAR. [20]. For a breakthrough in the
use of satellite navigation systems can be considered as the year
1983 when the U.S. decided to establish two subs under the
NAVSTAR system. The first subsystem is the Standard
Positioning Service (SPS), designed for casual navigation needs.
This subsystem is characterized mainly by "faking" the error of
determining the horizontal coordinates of about 100 ms
probability 0.95. The second partition labeled Precise
Positioning Service (PPS) is intended solely for the needs of the
U.S. military and is much more accurate.
[1] [5].
III. AVAILABLE TECHNOLOGIES IN GNSS
The 21st century cannot even imagine the existence of
civilization without the use of available satellite systems. The
need to use them is palpable in many industries, in different
modes, in governance, not least in geodesy. World powers to
built for military and civilian use their own multilateral regional,
global satellite systems and invest in their development of
considerable funds. Systems that have been put into operation
the first to continually review, refine and complement the new
satellites. The current state of existence and operation of satellite
systems is shown in the following table:
85
Table 1- types of navigation systems
GLOBAL NAVIGATION SYSTEMS
NAVSTAR (GPS)
The first navigation system called Transit launched the United
States in the 60th Years. Was formed six satellites, obiehajúcimi
the polar orbit of about 1075 km and three observation stations
located in the United States. This system allows the use of
Doppler observations to determine the relative position with an
accuracy better than 1 m. The aim was to build a U.S. satellite
system that would allow determining the location to the nearest
mm. The final decision to build a new system for determining
the position and exact time NAVSTAR GPS fell 17 decembra
1973rd Later the name was shortened to just GPS. First satellite
of the system was launched in 1978, along with ten other is for
testing and training system. In 1995 was completed operational
phase system consisting of 24 satellites. It is stipulated that at
any time and at any place be receiving signals from at least four
satellites.
GPS was originally developed as a military system, but in 1981
was made available to a limited extent, to the public. In 1983
was used to solve the first geodetic problems. Selective
aviability was restricted to the civilian sector, no 2 May 2005,
however, this function has been canceled. Since then it is
possible to fully use the GPS signal. The structure of the GPS
consists of three main segments:
Cosmic,
Management,
User.
Developed since the late 70 - ties of the former Soviet Union in
response to the development of GPS. Today, development
continues in the Russian Federation. For full and continuous
operation of the system throughout the territory of the Russian
Federation is required 18 satellites that operate in orbit for a
long time. The other two satellites for the GLONASS system
enabled the commissioning of the system for the provision of
navigational signals worldwide, making it the second country
the Russian Federation with its own satellite navigation system.
Russian rocket Proton-M 14 December 2009 successfully earned
the Baikonur cosmodrome orbital speed of three new navigation
satellites Glonass-M. Thanks to the orbit is already 23
navigation satellites, of which 21 are fully functional. [15]
By the end of 2010 was planned to place the orbital speed of the
other seven satellites. Like the U.S. GPS is also GLONAS
divided into space, control and user segments. A detailed
description of each segment systems GLONASS, GPS, as well
as newly constructed European GALILEO provides many
authors in their publications and amount of information is
available on the web portals.
GALILEO
GALILEO navigation system is built cosmic system, which
should become an alternative to the U.S., the military controlled
GPS system and the Russian GLONASS. Its construction is
carried out by the European Union and other services would be
provided by 2014. GALILEO will be completely independent of
the other navigation systems, but when it will be compatible
with them and the measurement will be able to use these
systems. It will offer services intended for public use, especially
for determining the position service for commercial use, with
higher quality and accuracy services of life-saving services for
government use - eg. for police, customs, in crisis situations, the
search and rescue use.
The system should consist of 27 operational and three backup
satellites orbiting of 23,616 km above the Earth's surface along a
path inclined 56 ° to the Earth's equator, in three dimensions
against each other shifted by 60 ° (nodal lines). The other three satellites, one in each plane will form a backup operation in
orbit, the system can be in technical failure of any satellite
immediately by the full number.
COMPASS
China as the next superpower unveiled the latest plans for
building your own global navigation satellite system (GNSS),
which is the forerunner of a regional system Beidou 1 When
finished, the Chinese Beidou 2 system (COMPASS) becomes
the fourth global satellite navigation system, independent from
the American GPS, the Russian GLONASS and European
Galileo, allowing Chinese civilian and military sector use its
own technology. The first satellite of this system was to track
geostationary earth placed in October 2000 in order to mark the
third satellite Compass-G1, also known as Beidou-2 G1, was the
orbital speed of the Earth successfully placed 17 January 2010.
China plans in the future to delete the orbital path for global
coverage of the Earth five geostationary and non-geostationary
satellites 30. By unveiling plans initial phase of COMPASS will
cover the Asia-Pacific region with navigation services, a
synchronization (timing) services and communication services,
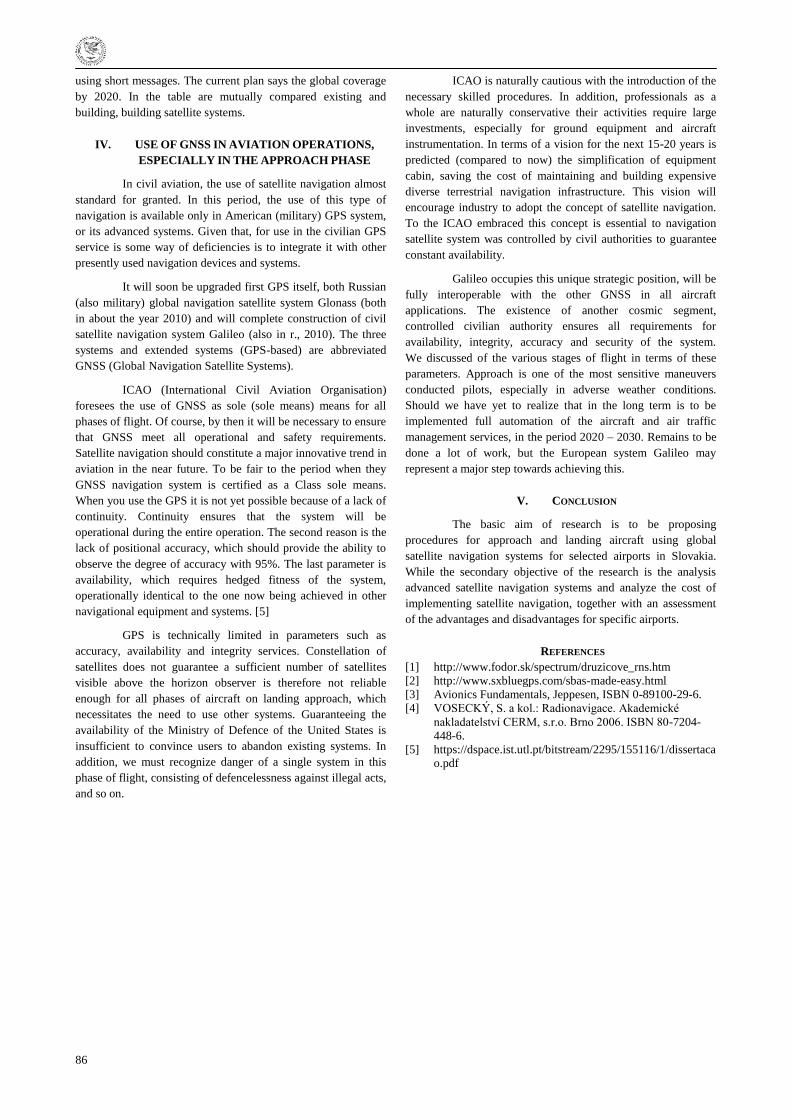
86
using short messages. The current plan says the global coverage
by 2020. In the table are mutually compared existing and
building, building satellite systems.
IV. USE OF GNSS IN AVIATION OPERATIONS,
ESPECIALLY IN THE APPROACH PHASE
In civil aviation, the use of satellite navigation almost
standard for granted. In this period, the use of this type of
navigation is available only in American (military) GPS system,
or its advanced systems. Given that, for use in the civilian GPS
service is some way of deficiencies is to integrate it with other
presently used navigation devices and systems.
It will soon be upgraded first GPS itself, both Russian
(also military) global navigation satellite system Glonass (both
in about the year 2010) and will complete construction of civil
satellite navigation system Galileo (also in r., 2010). The three
systems and extended systems (GPS-based) are abbreviated
GNSS (Global Navigation Satellite Systems).
ICAO (International Civil Aviation Organisation)
foresees the use of GNSS as sole (sole means) means for all
phases of flight. Of course, by then it will be necessary to ensure
that GNSS meet all operational and safety requirements.
Satellite navigation should constitute a major innovative trend in
aviation in the near future. To be fair to the period when they
GNSS navigation system is certified as a Class sole means.
When you use the GPS it is not yet possible because of a lack of
continuity. Continuity ensures that the system will be
operational during the entire operation. The second reason is the
lack of positional accuracy, which should provide the ability to
observe the degree of accuracy with 95%. The last parameter is
availability, which requires hedged fitness of the system,
operationally identical to the one now being achieved in other
navigational equipment and systems. [5]
GPS is technically limited in parameters such as
accuracy, availability and integrity services. Constellation of
satellites does not guarantee a sufficient number of satellites
visible above the horizon observer is therefore not reliable
enough for all phases of aircraft on landing approach, which
necessitates the need to use other systems. Guaranteeing the
availability of the Ministry of Defence of the United States is
insufficient to convince users to abandon existing systems. In
addition, we must recognize danger of a single system in this
phase of flight, consisting of defencelessness against illegal acts,
and so on.
ICAO is naturally cautious with the introduction of the
necessary skilled procedures. In addition, professionals as a
whole are naturally conservative their activities require large
investments, especially for ground equipment and aircraft
instrumentation. In terms of a vision for the next 15-20 years is
predicted (compared to now) the simplification of equipment
cabin, saving the cost of maintaining and building expensive
diverse terrestrial navigation infrastructure. This vision will
encourage industry to adopt the concept of satellite navigation.
To the ICAO embraced this concept is essential to navigation
satellite system was controlled by civil authorities to guarantee
constant availability.
Galileo occupies this unique strategic position, will be
fully interoperable with the other GNSS in all aircraft
applications. The existence of another cosmic segment,
controlled civilian authority ensures all requirements for
availability, integrity, accuracy and security of the system.
We discussed of the various stages of flight in terms of these
parameters. Approach is one of the most sensitive maneuvers
conducted pilots, especially in adverse weather conditions.
Should we have yet to realize that in the long term is to be
implemented full automation of the aircraft and air traffic
management services, in the period 2020 – 2030. Remains to be
done a lot of work, but the European system Galileo may
represent a major step towards achieving this.
V. CONCLUSION
The basic aim of research is to be proposing
procedures for approach and landing aircraft using global
satellite navigation systems for selected airports in Slovakia.
While the secondary objective of the research is the analysis
advanced satellite navigation systems and analyze the cost of
implementing satellite navigation, together with an assessment
of the advantages and disadvantages for specific airports.
REFERENCES
[1] http://www.fodor.sk/spectrum/druzicove_rns.htm
[2] http://www.sxbluegps.com/sbas-made-easy.html
[3] Avionics Fundamentals, Jeppesen, ISBN 0-89100-29-6.
[4] VOSECKÝ, S. a kol.: Radionavigace. Akademické
nakladatelství CERM, s.r.o. Brno 2006. ISBN 80-7204-
448-6.
[5] https://dspace.ist.utl.pt/bitstream/2295/155116/1/dissertaca
o.pdf
87
INFLUENCE OF THE FATIGUE ON THE TWO-MAN FLIGHT
CREW PERFORMANCE
doc. Ing. Vladimír Smrž, Ph.D.
Air Transport Department, VŠB - TU Ostrava, Faculty of Mechanical Engineering, Czech Republic
Ing. Petr Tomášek
Air Transport Department, VŠB - TU Ostrava, Faculty of Mechanical Engineering, Czech Republic
Abstract – The paper deals with the issue of the research on the
fatigueeffect on the flight crew performance. One of the ways to
carry out such research within the technical university is to use
of available technical (flight simulator) and human (pilot
student) sources. The purpose of this paper is to show the results
of one of experiments using the example of curves showing the
dependence of fatigue symptoms and errors on the experiment
time run.
Key words – Flight crew performance, fatigue, mistakes, flight
simulator
I. INTRODUCTION
The main objective of the airlines is to carry a
maximum number of passengers and their needs for the target
destination. This, of course, with the highest profit, the safety is
generally maintained at a minimum level of aviation regulations.
Operators are trying to increase profits and reduce costs, and it
would ideally need to have their planes constantly in operation
and minimize the time spent on the ground. For this scenario,
they need greater number of pilots, or their greater workload.
Without adequate rest there may appear a fatigue
which influences the functioning of the human body. An
accident investigation revealed that 70% of all aviation incidents
and accidents resulting from a human error, where 15-20% of
accidents were caused by the crewfatigue [4]. In 2012, the
European Pilots Association conducted a study which found that
one third of European pilots already once fell asleep in flight. A
third of them admitted that on waking found that the second
pilot was asleep too. Also research of the Portuguese Institute of
Civil Aviation (INAC) concluded that the flight crew is very
often too tired.
To prevent errors is always cheaper and safer than to
learn from their results. For prevention there is possible to use
different models, complex systems or simulation. The purpose
of this paper is to present one of the experiments which use a
flight simulator to determine the dependence of the flight crew
to its level of fatigue during simulated flights.
II. FLIGHT CREW PERFORMANCE IN TERMS OF CREW FATIGUE
There are many types of flights, which are divided into
different categories. One possible division of flights is the
duration of the flight including the briefing end debriefing time.
After a rest or sleep, the body is able to function again until it
exhausts energy, which must be regenerated. The time between
relaxations can be called flight crew endurance. It is the ability
to maintain performance within safe limits when performing
physical and mental activities, and each individual is different
this time. There are many factors that can affect the crew
endurance. They can be divided into four basic groups:
Factors associated with physiology and psychology
(mental and physical condition)
Factors related to lifestyle (quality of sleep, food, drinks)
Factors associated with the environment (temperature,
humidity, noise ...)
Factors associated with long-term workload (accumulated
fatigue)
III. EXPERIMENT CONCERNING THE IMPACT OF THE FATIGUE
ON THE FLIGHT CREW PERFORMANCE
There are various mechanisms to predict the
technology and human behaviour, from a theoretical research to
a practical experiments and simulations. In all sectors of the
aviation industry operates a large number of scientists who in
the framework of cost try to verify the theoretical limits in
which the safe operation of aircrafts is still possible.
Unlike technology is human being receptive, and it is
therefore necessary to examine also his psychological traits,
where every individual is different. Each human is defined by
his attitude, personality profile, patterns of behaviour,
psychological conditions, etc. There are studies of human
behaviour in specific situations, and descriptions of behaviours
that are based on long-term observations of a large number of
individuals, but cannot yet say exactly how a particular person
will in particular situation behave.
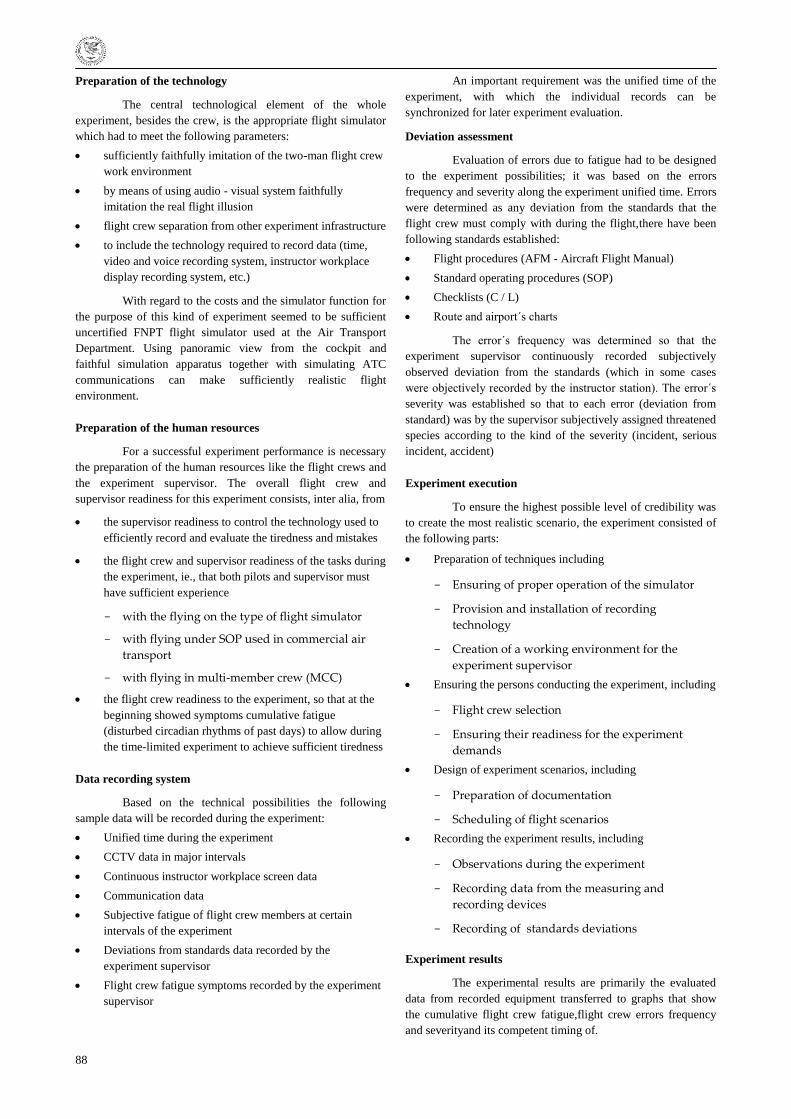
88
Preparation of the technology
The central technological element of the whole
experiment, besides the crew, is the appropriate flight simulator
which had to meet the following parameters:
sufficiently faithfully imitation of the two-man flight crew
work environment
by means of using audio - visual system faithfully
imitation the real flight illusion
flight crew separation from other experiment infrastructure
to include the technology required to record data (time,
video and voice recording system, instructor workplace
display recording system, etc.)
With regard to the costs and the simulator function for
the purpose of this kind of experiment seemed to be sufficient
uncertified FNPT flight simulator used at the Air Transport
Department. Using panoramic view from the cockpit and
faithful simulation apparatus together with simulating ATC
communications can make sufficiently realistic flight
environment.
Preparation of the human resources
For a successful experiment performance is necessary
the preparation of the human resources like the flight crews and
the experiment supervisor. The overall flight crew and
supervisor readiness for this experiment consists, inter alia, from
the supervisor readiness to control the technology used to
efficiently record and evaluate the tiredness and mistakes
the flight crew and supervisor readiness of the tasks during
the experiment, ie., that both pilots and supervisor must
have sufficient experience
with the flying on the type of flight simulator
with flying under SOP used in commercial air
transport
with flying in multi-member crew (MCC)
the flight crew readiness to the experiment, so that at the
beginning showed symptoms cumulative fatigue
(disturbed circadian rhythms of past days) to allow during
the time-limited experiment to achieve sufficient tiredness
Data recording system
Based on the technical possibilities the following
sample data will be recorded during the experiment:
Unified time during the experiment
CCTV data in major intervals
Continuous instructor workplace screen data
Communication data
Subjective fatigue of flight crew members at certain
intervals of the experiment
Deviations from standards data recorded by the
experiment supervisor
Flight crew fatigue symptoms recorded by the experiment
supervisor
An important requirement was the unified time of the
experiment, with which the individual records can be
synchronized for later experiment evaluation.
Deviation assessment
Evaluation of errors due to fatigue had to be designed
to the experiment possibilities; it was based on the errors
frequency and severity along the experiment unified time. Errors
were determined as any deviation from the standards that the
flight crew must comply with during the flight,there have been
following standards established:
Flight procedures (AFM - Aircraft Flight Manual)
Standard operating procedures (SOP)
Checklists (C / L)
Route and airport´s charts
The error´s frequency was determined so that the
experiment supervisor continuously recorded subjectively
observed deviation from the standards (which in some cases
were objectively recorded by the instructor station). The error´s
severity was established so that to each error (deviation from
standard) was by the supervisor subjectively assigned threatened
species according to the kind of the severity (incident, serious
incident, accident)
Experiment execution
To ensure the highest possible level of credibility was
to create the most realistic scenario, the experiment consisted of
the following parts:
Preparation of techniques including
Ensuring of proper operation of the simulator
Provision and installation of recording
technology
Creation of a working environment for the
experiment supervisor
Ensuring the persons conducting the experiment, including
Flight crew selection
Ensuring their readiness for the experiment
demands
Design of experiment scenarios, including
Preparation of documentation
Scheduling of flight scenarios
Recording the experiment results, including
Observations during the experiment
Recording data from the measuring and
recording devices
Recording of standards deviations
Experiment results
The experimental results are primarily the evaluated
data from recorded equipment transferred to graphs that show
the cumulative flight crew fatigue,flight crew errors frequency
and severityand its competent timing of.
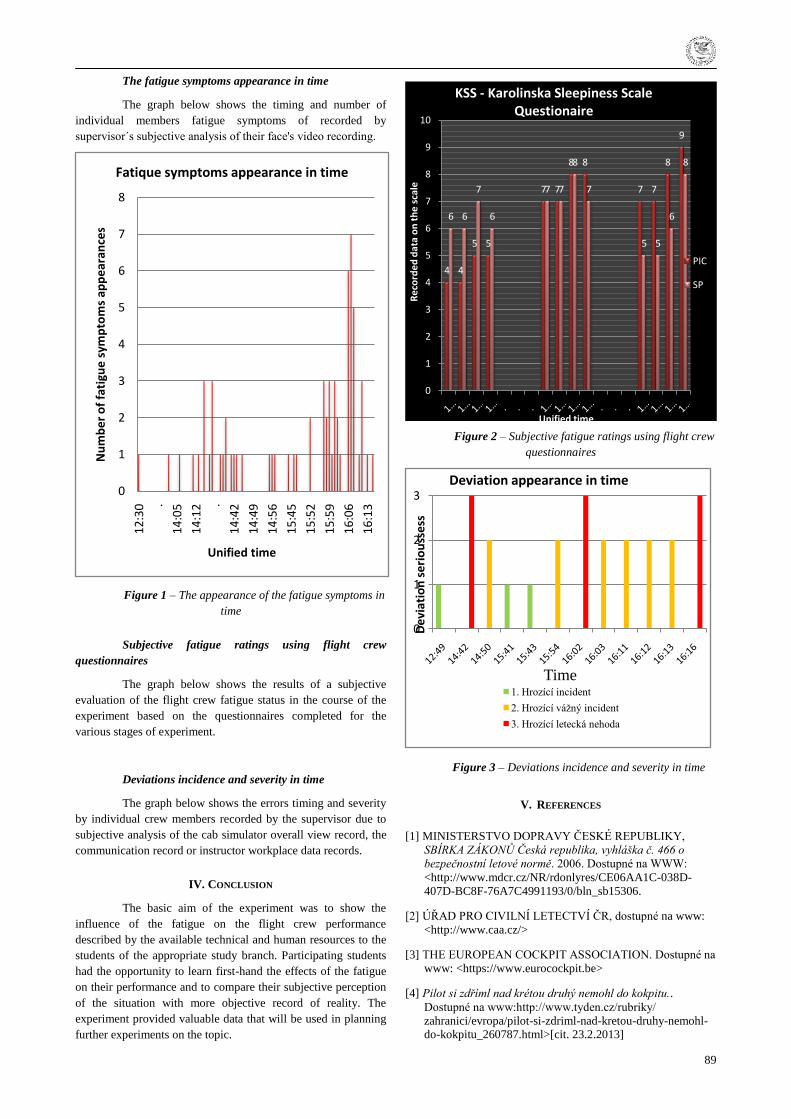
89
The fatigue symptoms appearance in time
The graph below shows the timing and number of
individual members fatigue symptoms of recorded by
supervisor´s subjective analysis of their face's video recording.
Figure 1 – The appearance of the fatigue symptoms in
time
Subjective fatigue ratings using flight crew
questionnaires
The graph below shows the results of a subjective
evaluation of the flight crew fatigue status in the course of the
experiment based on the questionnaires completed for the
various stages of experiment.
Deviations incidence and severity in time
The graph below shows the errors timing and severity
by individual crew members recorded by the supervisor due to
subjective analysis of the cab simulator overall view record, the
communication record or instructor workplace data records.
IV. CONCLUSION
The basic aim of the experiment was to show the
influence of the fatigue on the flight crew performance
described by the available technical and human resources to the
students of the appropriate study branch. Participating students
had the opportunity to learn first-hand the effects of the fatigue
on their performance and to compare their subjective perception
of the situation with more objective record of reality. The
experiment provided valuable data that will be used in planning
further experiments on the topic.
Figure 2 – Subjective fatigue ratings using flight crew
questionnaires
Figure 3 – Deviations incidence and severity in time
V. REFERENCES
[1] MINISTERSTVO DOPRAVY ČESKÉ REPUBLIKY,
SBÍRKA ZÁKONŮ Česká republika, vyhláška č. 466 o
bezpečnostní letové normě. 2006. Dostupné na WWW:
<http://www.mdcr.cz/NR/rdonlyres/CE06AA1C-038D-
407D-BC8F-76A7C4991193/0/bln_sb15306.
[2] ÚŘAD PRO CIVILNÍ LETECTVÍ ČR, dostupné na www:
<http://www.caa.cz/>
[3] THE EUROPEAN COCKPIT ASSOCIATION. Dostupné na
www: <https://www.eurocockpit.be>
[4] Pilot si zdříml nad krétou druhý nemohl do kokpitu..
Dostupné na www:http://www.tyden.cz/rubriky/
zahranici/evropa/pilot-si-zdriml-nad-kretou-druhy-nemohl-do-kokpitu_260787.html>[cit. 23.2.2013]
0
1
2
3
4
5
6
7
8
12
:30 .
14
:05
14
:12 .
14
:42
14
:49
14
:56
15
:45
15
:52
15
:59
16
:06
16
:13
Nu
mb
er
of
fati
gue
sym
pto
ms
app
ear
ance
s
Unified time
Fatique symptoms appearance in time
4 4
5 5
7 7
8 8
7 7
8
9
6 6
7
6
7 7
8
7
5 5
6
8
0
1
2
3
4
5
6
7
8
9
10
Re
cord
ed
dat
a o
n t
he
sca
leUnified time
KSS - Karolinska Sleepiness Scale Questionaire
PIC
SP
0
1
2
3
De
viat
ion
se
rio
uss
ess
Time
Deviation appearance in time
1. Hrozící incident
2. Hrozící váţný incident
3. Hrozící letecká nehoda
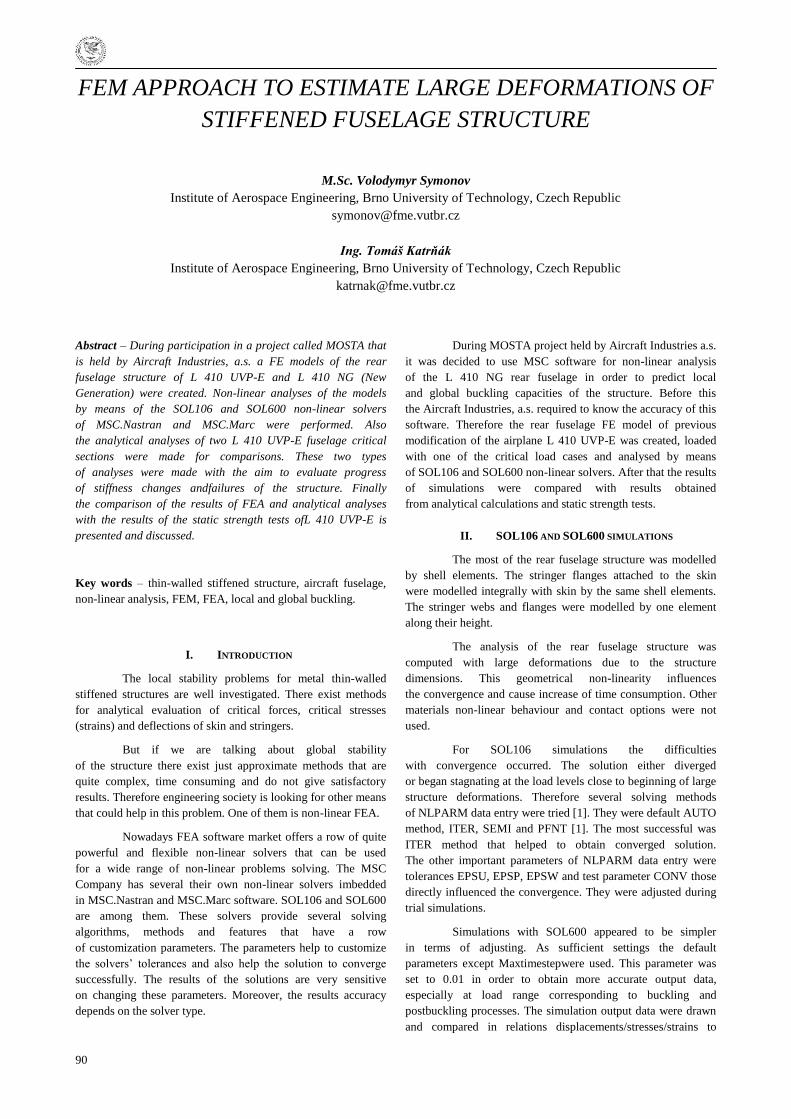
90
FEM APPROACH TO ESTIMATE LARGE DEFORMATIONS OF
STIFFENED FUSELAGE STRUCTURE
M.Sc. Volodymyr Symonov
Institute of Aerospace Engineering, Brno University of Technology, Czech Republic
Ing. Tomáš Katrňák
Institute of Aerospace Engineering, Brno University of Technology, Czech Republic
Abstract – During participation in a project called MOSTA that
is held by Aircraft Industries, a.s. a FE models of the rear
fuselage structure of L 410 UVP-E and L 410 NG (New
Generation) were created. Non-linear analyses of the models
by means of the SOL106 and SOL600 non-linear solvers
of MSC.Nastran and MSC.Marc were performed. Also
the analytical analyses of two L 410 UVP-E fuselage critical
sections were made for comparisons. These two types
of analyses were made with the aim to evaluate progress
of stiffness changes andfailures of the structure. Finally
the comparison of the results of FEA and analytical analyses
with the results of the static strength tests ofL 410 UVP-E is
presented and discussed.
Key words – thin-walled stiffened structure, aircraft fuselage,
non-linear analysis, FEM, FEA, local and global buckling.
I. INTRODUCTION
The local stability problems for metal thin-walled
stiffened structures are well investigated. There exist methods
for analytical evaluation of critical forces, critical stresses
(strains) and deflections of skin and stringers.
But if we are talking about global stability
of the structure there exist just approximate methods that are
quite complex, time consuming and do not give satisfactory
results. Therefore engineering society is looking for other means
that could help in this problem. One of them is non-linear FEA.
Nowadays FEA software market offers a row of quite
powerful and flexible non-linear solvers that can be used
for a wide range of non-linear problems solving. The MSC
Company has several their own non-linear solvers imbedded
in MSC.Nastran and MSC.Marc software. SOL106 and SOL600
are among them. These solvers provide several solving
algorithms, methods and features that have a row
of customization parameters. The parameters help to customize
the solvers‘ tolerances and also help the solution to converge
successfully. The results of the solutions are very sensitive
on changing these parameters. Moreover, the results accuracy
depends on the solver type.
During MOSTA project held by Aircraft Industries a.s.
it was decided to use MSC software for non-linear analysis
of the L 410 NG rear fuselage in order to predict local
and global buckling capacities of the structure. Before this
the Aircraft Industries, a.s. required to know the accuracy of this
software. Therefore the rear fuselage FE model of previous
modification of the airplane L 410 UVP-E was created, loaded
with one of the critical load cases and analysed by means
of SOL106 and SOL600 non-linear solvers. After that the results
of simulations were compared with results obtained
from analytical calculations and static strength tests.
II. SOL106 AND SOL600 SIMULATIONS
The most of the rear fuselage structure was modelled
by shell elements. The stringer flanges attached to the skin
were modelled integrally with skin by the same shell elements.
The stringer webs and flanges were modelled by one element
along their height.
The analysis of the rear fuselage structure was
computed with large deformations due to the structure
dimensions. This geometrical non-linearity influences
the convergence and cause increase of time consumption. Other
materials non-linear behaviour and contact options were not
used.
For SOL106 simulations the difficulties
with convergence occurred. The solution either diverged
or began stagnating at the load levels close to beginning of large
structure deformations. Therefore several solving methods
of NLPARM data entry were tried [1]. They were default AUTO
method, ITER, SEMI and PFNT [1]. The most successful was
ITER method that helped to obtain converged solution.
The other important parameters of NLPARM data entry were
tolerances EPSU, EPSP, EPSW and test parameter CONV those
directly influenced the convergence. They were adjusted during
trial simulations.
Simulations with SOL600 appeared to be simpler
in terms of adjusting. As sufficient settings the default
parameters except Maxtimestepwere used. This parameter was
set to 0.01 in order to obtain more accurate output data,
especially at load range corresponding to buckling and
postbuckling processes. The simulation output data were drawn
and compared in relations displacements/stresses/strains to
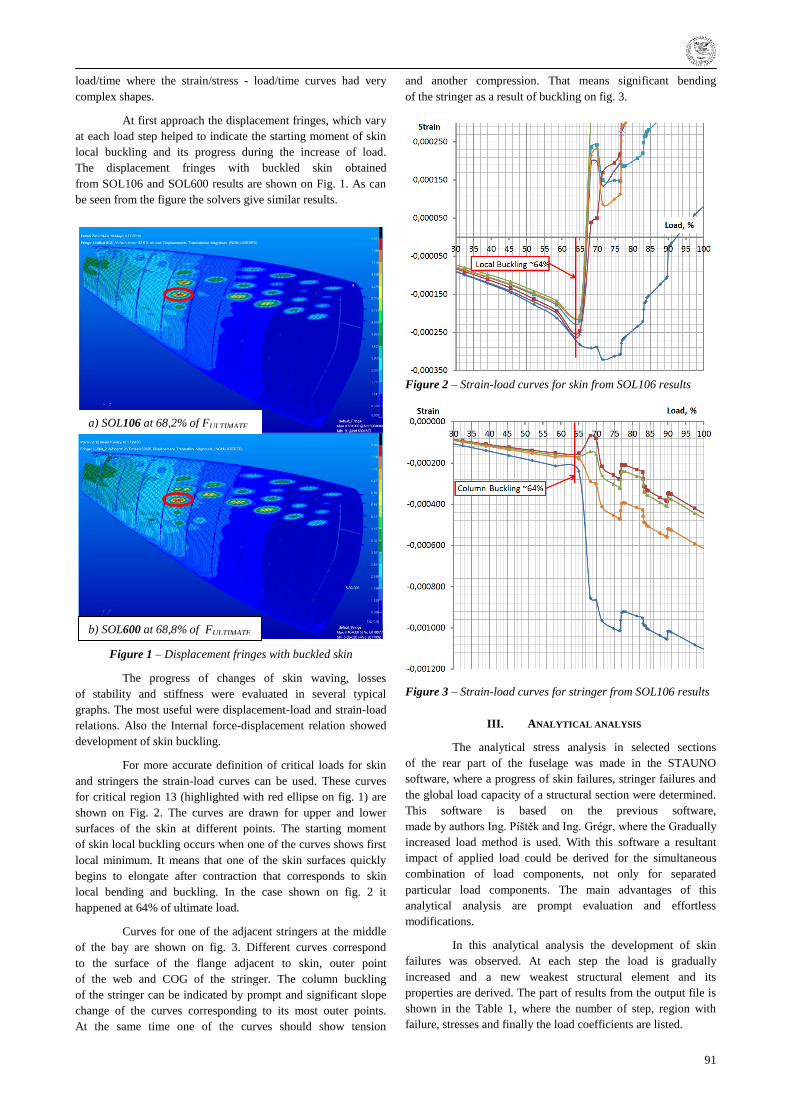
91
load/time where the strain/stress - load/time curves had very
complex shapes.
At first approach the displacement fringes, which vary
at each load step helped to indicate the starting moment of skin
local buckling and its progress during the increase of load.
The displacement fringes with buckled skin obtained
from SOL106 and SOL600 results are shown on Fig. 1. As can
be seen from the figure the solvers give similar results.
Figure 1 – Displacement fringes with buckled skin
The progress of changes of skin waving, losses
of stability and stiffness were evaluated in several typical
graphs. The most useful were displacement-load and strain-load
relations. Also the Internal force-displacement relation showed
development of skin buckling.
For more accurate definition of critical loads for skin
and stringers the strain-load curves can be used. These curves
for critical region 13 (highlighted with red ellipse on fig. 1) are
shown on Fig. 2. The curves are drawn for upper and lower
surfaces of the skin at different points. The starting moment
of skin local buckling occurs when one of the curves shows first
local minimum. It means that one of the skin surfaces quickly
begins to elongate after contraction that corresponds to skin
local bending and buckling. In the case shown on fig. 2 it
happened at 64% of ultimate load.
Curves for one of the adjacent stringers at the middle
of the bay are shown on fig. 3. Different curves correspond
to the surface of the flange adjacent to skin, outer point
of the web and COG of the stringer. The column buckling
of the stringer can be indicated by prompt and significant slope
change of the curves corresponding to its most outer points.
At the same time one of the curves should show tension
and another compression. That means significant bending
of the stringer as a result of buckling on fig. 3.
Figure 2 – Strain-load curves for skin from SOL106 results
Figure 3 – Strain-load curves for stringer from SOL106 results
III. ANALYTICAL ANALYSIS
The analytical stress analysis in selected sections
of the rear part of the fuselage was made in the STAUNO
software, where a progress of skin failures, stringer failures and
the global load capacity of a structural section were determined.
This software is based on the previous software,
made by authors Ing. Píštěk and Ing. Grégr, where the Gradually
increased load method is used. With this software a resultant
impact of applied load could be derived for the simultaneous
combination of load components, not only for separated
particular load components. The main advantages of this
analytical analysis are prompt evaluation and effortless
modifications.
In this analytical analysis the development of skin
failures was observed. At each step the load is gradually
increased and a new weakest structural element and its
properties are derived. The part of results from the output file is
shown in the Table 1, where the number of step, region with
failure, stresses and finally the load coefficients are listed.
a) SOL106 at 68,2% of FULTIMATE
b) SOL600 at 68,8% of FULTIMATE
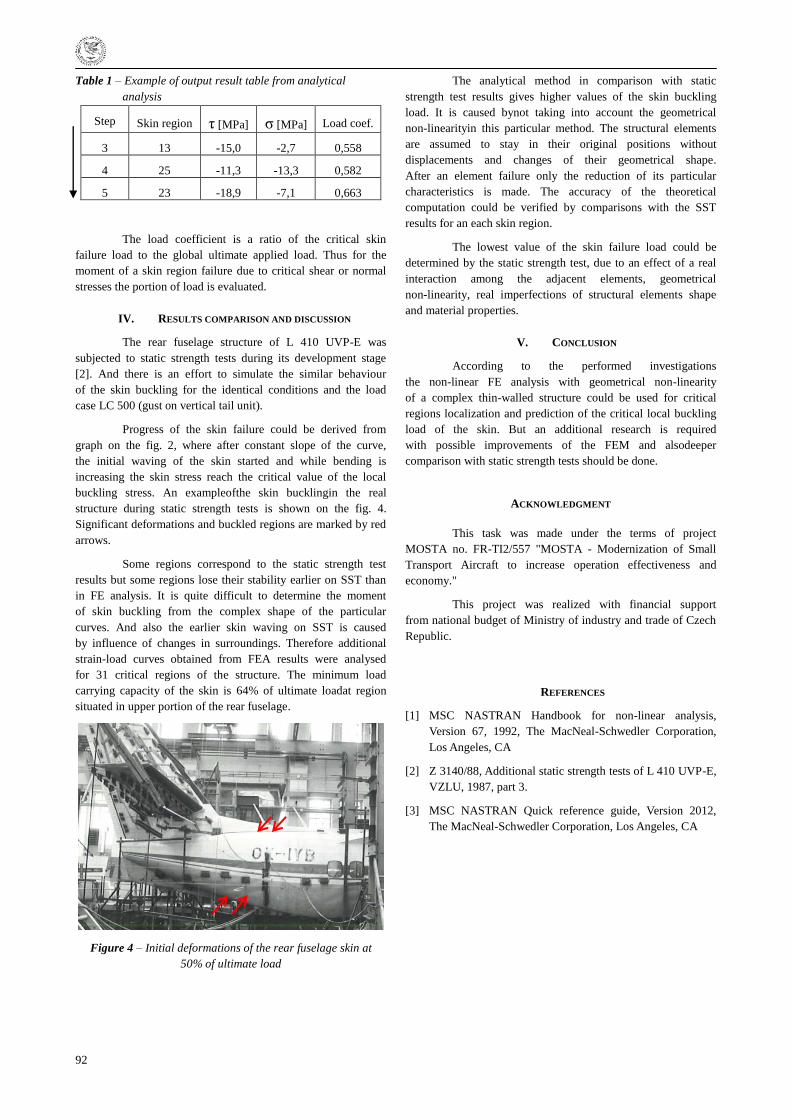
92
Table 1 – Example of output result table from analytical
analysis
Step Skin region τ [MPa] σ [MPa] Load coef.
3 13 -15,0 -2,7 0,558
4 25 -11,3 -13,3 0,582
5 23 -18,9 -7,1 0,663
The load coefficient is a ratio of the critical skin
failure load to the global ultimate applied load. Thus for the
moment of a skin region failure due to critical shear or normal
stresses the portion of load is evaluated.
IV. RESULTS COMPARISON AND DISCUSSION
The rear fuselage structure of L 410 UVP-E was
subjected to static strength tests during its development stage
[2]. And there is an effort to simulate the similar behaviour
of the skin buckling for the identical conditions and the load
case LC 500 (gust on vertical tail unit).
Progress of the skin failure could be derived from
graph on the fig. 2, where after constant slope of the curve,
the initial waving of the skin started and while bending is
increasing the skin stress reach the critical value of the local
buckling stress. An exampleofthe skin bucklingin the real
structure during static strength tests is shown on the fig. 4.
Significant deformations and buckled regions are marked by red
arrows.
Some regions correspond to the static strength test
results but some regions lose their stability earlier on SST than
in FE analysis. It is quite difficult to determine the moment
of skin buckling from the complex shape of the particular
curves. And also the earlier skin waving on SST is caused
by influence of changes in surroundings. Therefore additional
strain-load curves obtained from FEA results were analysed
for 31 critical regions of the structure. The minimum load
carrying capacity of the skin is 64% of ultimate loadat region
situated in upper portion of the rear fuselage.
Figure 4 – Initial deformations of the rear fuselage skin at
50% of ultimate load
The analytical method in comparison with static
strength test results gives higher values of the skin buckling
load. It is caused bynot taking into account the geometrical
non-linearityin this particular method. The structural elements
are assumed to stay in their original positions without
displacements and changes of their geometrical shape.
After an element failure only the reduction of its particular
characteristics is made. The accuracy of the theoretical
computation could be verified by comparisons with the SST
results for an each skin region.
The lowest value of the skin failure load could be
determined by the static strength test, due to an effect of a real
interaction among the adjacent elements, geometrical
non-linearity, real imperfections of structural elements shape
and material properties.
V. CONCLUSION
According to the performed investigations
the non-linear FE analysis with geometrical non-linearity
of a complex thin-walled structure could be used for critical
regions localization and prediction of the critical local buckling
load of the skin. But an additional research is required
with possible improvements of the FEM and alsodeeper
comparison with static strength tests should be done.
ACKNOWLEDGMENT
This task was made under the terms of project
MOSTA no. FR-TI2/557 "MOSTA - Modernization of Small
Transport Aircraft to increase operation effectiveness and
economy."
This project was realized with financial support
from national budget of Ministry of industry and trade of Czech
Republic.
REFERENCES
[1] MSC NASTRAN Handbook for non-linear analysis,
Version 67, 1992, The MacNeal-Schwedler Corporation,
Los Angeles, CA
[2] Z 3140/88, Additional static strength tests of L 410 UVP-E,
VZLU, 1987, part 3.
[3] MSC NASTRAN Quick reference guide, Version 2012,
The MacNeal-Schwedler Corporation, Los Angeles, CA
93
A VISION OF THE FUTURE AEROSPACE
Filip Škultéty
Air Transport Department, University of Ţilina, Slovakia
Abstract – The paper is focused on the quite new ICAO’s
approach to Air Traffic Management. The aim of this paper is to
introduce the Aviation System Block Upgrades as an inherent
part of the future aerospace. It provides a basis for further
analysis of individual modulestheir and resemblance with
NextGen and SESAR — the key players in delivery of a
coherent, performance-based global air navigation system to
achieve an International Civil Aviation Organization’s One Sky
vision.
Key words – Aviation System Block Upgrades, ASBU, ICAO,
GANIS, GANP.
I. INTRODUCTION
Air traffic growth expands two-.fold once 15 years but
it could be ―double edge sword‖ and the stakes are high. The
challenge is how to achieve both safety and operational
improvements which are environmentally responsible and cost-
effective. The increasing pressure on infrastructure and facilities
which are already stretched to the limit in many parts of the
world and the potential lack of global harmonization will restrict
air transportation if we continue along the same path. As a
result, the future ATM programmes simply have to work and
must be interoperable. International Civil Aviation Organization
has adopted the name One Sky for its vision to achieve a
harmonized global air navigation system. The One Sky approach
is intended to be progressive, cost-effective and co-operative.
The approach consists of three levels of activity: global
conception, regional implementation planning and national
implementation of infrastructure. At the heart of the One Sky
approach is the ―Block Upgrades‖ architecture – the framework
to deliver a global interoperability.
These issues were first-time introduced to the
international community at the Global Air Navigation Industry
Symposium in 2011. The meeting recalled the Global Air Traffic
Management (ATM) Operational Concept contained in Doc.
9854. Consequently, ICAO organized the 12th Air Navigation
Conference in Montréal, from 19 to 30 November 2012 with
participation of its Member States and invited international
organizations. The main topic of the conference were block
upgrades which comprise various operational improvements
aimed at harmonizing and improving the efficiency of the
Global Air Navigation System. To aid in the harmonization the
block upgrades were supported by a roadmaps for
communications, navigation and surveillance as well as an
information management and avionics.
II. AVIATION SYSTEM BLOCK UPGRADES
The Aviation System Block Upgrades (ASBU) is a
methodology to implement the ATM system based on
operational concepts extracted from the NextGen (USA),
SESAR (Europe) and CARATS (Japan).
It designates a set of improvements that can be
implemented globally from a defined point in time to enhance
the performance of the Air Traffic Management system. Each
module is a deployable package (performance) or capability. A
module will offer an understandable performance benefit related
to a change in operations, which is supported by procedures,
technology, regulation/standards, as necessary, and a business
case. A module will also be characterized by the operating
environment within which it may be applied. In turn, a block is
made up of modules that, when combined, enable significant
improvements and provide access to benefits. The whole
framework consist from 47 modules which are positioned into a
matrix. (Fig.1)
The ASBU Matrix:
• Block (horizontals)
• Performance Improvement Areas (verticals)
A block is made up of several modules. A
combination of Modules within a Block represents a fully
functional and cohesive ATM system at a certain point in time –
in this case, over 5-yearly increments. There are four ‗Vertical‘
components grouped together to represent a cohesive and
functional end-to-end ATM system. These ‗verticals‘ are also
individually characterized as Performance Improvement Areas
which can be base-lined on a global basis as a mature and
available performance improvement, supported by the requisite
ICAO Provisions and Standards for implementation worldwide.
[2]
PERFORMANCE IMPROVEMENT AREAS
1. Greener Airports
2. Globally Interoperable Systems and Data through
Globally Interoperable SWIM
3. Optimum Capacity and Flexible Flights through
Global Collaborative ATM
4. Efficient Flight Path through Trajectory Based
Operations
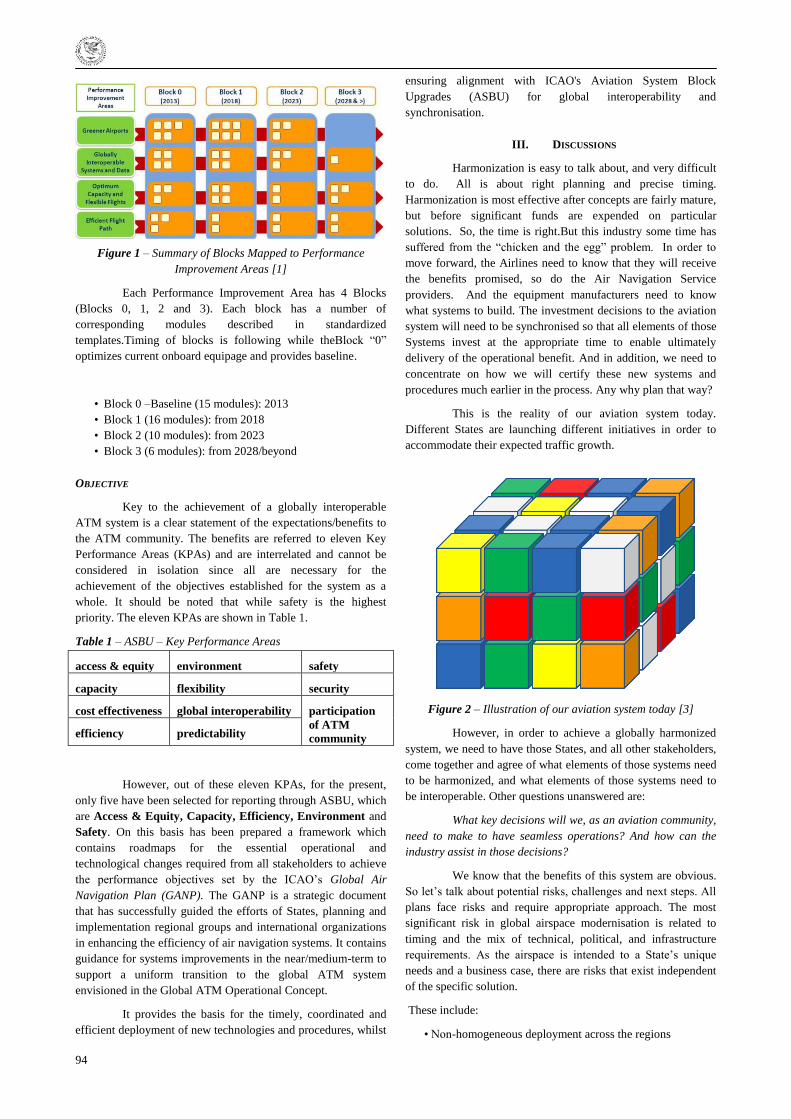
94
Figure 1 – Summary of Blocks Mapped to Performance
Improvement Areas [1]
Each Performance Improvement Area has 4 Blocks
(Blocks 0, 1, 2 and 3). Each block has a number of
corresponding modules described in standardized
templates.Timing of blocks is following while theBlock ―0‖
optimizes current onboard equipage and provides baseline.
• Block 0 –Baseline (15 modules): 2013
• Block 1 (16 modules): from 2018
• Block 2 (10 modules): from 2023
• Block 3 (6 modules): from 2028/beyond
OBJECTIVE
Key to the achievement of a globally interoperable
ATM system is a clear statement of the expectations/benefits to
the ATM community. The benefits are referred to eleven Key
Performance Areas (KPAs) and are interrelated and cannot be
considered in isolation since all are necessary for the
achievement of the objectives established for the system as a
whole. It should be noted that while safety is the highest
priority. The eleven KPAs are shown in Table 1.
Table 1 – ASBU – Key Performance Areas
access & equity environment safety
capacity flexibility security
cost effectiveness global interoperability participation
of ATM
community efficiency predictability
However, out of these eleven KPAs, for the present,
only five have been selected for reporting through ASBU, which
are Access & Equity, Capacity, Efficiency, Environment and
Safety. On this basis has been prepared a framework which
contains roadmaps for the essential operational and
technological changes required from all stakeholders to achieve
the performance objectives set by the ICAO‘s Global Air
Navigation Plan (GANP). The GANP is a strategic document
that has successfully guided the efforts of States, planning and
implementation regional groups and international organizations
in enhancing the efficiency of air navigation systems. It contains
guidance for systems improvements in the near/medium-term to
support a uniform transition to the global ATM system
envisioned in the Global ATM Operational Concept.
It provides the basis for the timely, coordinated and
efficient deployment of new technologies and procedures, whilst
ensuring alignment with ICAO's Aviation System Block
Upgrades (ASBU) for global interoperability and
synchronisation.
III. DISCUSSIONS
Harmonization is easy to talk about, and very difficult
to do. All is about right planning and precise timing.
Harmonization is most effective after concepts are fairly mature,
but before significant funds are expended on particular
solutions. So, the time is right.But this industry some time has
suffered from the ―chicken and the egg‖ problem. In order to
move forward, the Airlines need to know that they will receive
the benefits promised, so do the Air Navigation Service
providers. And the equipment manufacturers need to know
what systems to build. The investment decisions to the aviation
system will need to be synchronised so that all elements of those
Systems invest at the appropriate time to enable ultimately
delivery of the operational benefit. And in addition, we need to
concentrate on how we will certify these new systems and
procedures much earlier in the process. Any why plan that way?
This is the reality of our aviation system today.
Different States are launching different initiatives in order to
accommodate their expected traffic growth.
Figure 2 – Illustration of our aviation system today [3]
However, in order to achieve a globally harmonized
system, we need to have those States, and all other stakeholders,
come together and agree of what elements of those systems need
to be harmonized, and what elements of those systems need to
be interoperable. Other questions unanswered are:
What key decisions will we, as an aviation community,
need to make to have seamless operations? And how can the
industry assist in those decisions?
We know that the benefits of this system are obvious.
So let‘s talk about potential risks, challenges and next steps. All
plans face risks and require appropriate approach. The most
significant risk in global airspace modernisation is related to
timing and the mix of technical, political, and infrastructure
requirements. As the airspace is intended to a State‘s unique
needs and a business case, there are risks that exist independent
of the specific solution.
These include:
• Non-homogeneous deployment across the regions
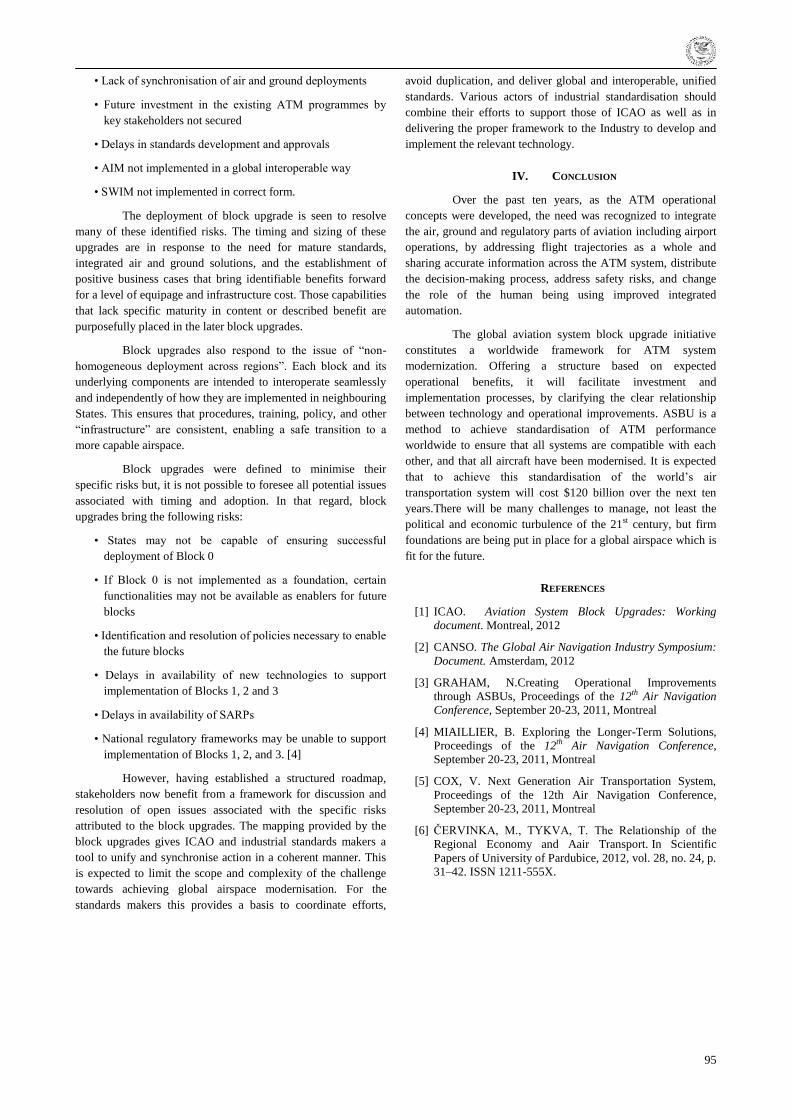
95
• Lack of synchronisation of air and ground deployments
• Future investment in the existing ATM programmes by
key stakeholders not secured
• Delays in standards development and approvals
• AIM not implemented in a global interoperable way
• SWIM not implemented in correct form.
The deployment of block upgrade is seen to resolve
many of these identified risks. The timing and sizing of these
upgrades are in response to the need for mature standards,
integrated air and ground solutions, and the establishment of
positive business cases that bring identifiable benefits forward
for a level of equipage and infrastructure cost. Those capabilities
that lack specific maturity in content or described benefit are
purposefully placed in the later block upgrades.
Block upgrades also respond to the issue of ―non-
homogeneous deployment across regions‖. Each block and its
underlying components are intended to interoperate seamlessly
and independently of how they are implemented in neighbouring
States. This ensures that procedures, training, policy, and other
―infrastructure‖ are consistent, enabling a safe transition to a
more capable airspace.
Block upgrades were defined to minimise their
specific risks but, it is not possible to foresee all potential issues
associated with timing and adoption. In that regard, block
upgrades bring the following risks:
• States may not be capable of ensuring successful
deployment of Block 0
• If Block 0 is not implemented as a foundation, certain
functionalities may not be available as enablers for future
blocks
• Identification and resolution of policies necessary to enable
the future blocks
• Delays in availability of new technologies to support
implementation of Blocks 1, 2 and 3
• Delays in availability of SARPs
• National regulatory frameworks may be unable to support
implementation of Blocks 1, 2, and 3. [4]
However, having established a structured roadmap,
stakeholders now benefit from a framework for discussion and
resolution of open issues associated with the specific risks
attributed to the block upgrades. The mapping provided by the
block upgrades gives ICAO and industrial standards makers a
tool to unify and synchronise action in a coherent manner. This
is expected to limit the scope and complexity of the challenge
towards achieving global airspace modernisation. For the
standards makers this provides a basis to coordinate efforts,
avoid duplication, and deliver global and interoperable, unified
standards. Various actors of industrial standardisation should
combine their efforts to support those of ICAO as well as in
delivering the proper framework to the Industry to develop and
implement the relevant technology.
IV. CONCLUSION
Over the past ten years, as the ATM operational
concepts were developed, the need was recognized to integrate
the air, ground and regulatory parts of aviation including airport
operations, by addressing flight trajectories as a whole and
sharing accurate information across the ATM system, distribute
the decision-making process, address safety risks, and change
the role of the human being using improved integrated
automation.
The global aviation system block upgrade initiative
constitutes a worldwide framework for ATM system
modernization. Offering a structure based on expected
operational benefits, it will facilitate investment and
implementation processes, by clarifying the clear relationship
between technology and operational improvements. ASBU is a
method to achieve standardisation of ATM performance
worldwide to ensure that all systems are compatible with each
other, and that all aircraft have been modernised. It is expected
that to achieve this standardisation of the world‘s air
transportation system will cost $120 billion over the next ten
years.There will be many challenges to manage, not least the
political and economic turbulence of the 21st century, but firm
foundations are being put in place for a global airspace which is
fit for the future.
REFERENCES
[1] ICAO. Aviation System Block Upgrades: Working
document. Montreal, 2012
[2] CANSO. The Global Air Navigation Industry Symposium:
Document. Amsterdam, 2012
[3] GRAHAM, N.Creating Operational Improvements
through ASBUs, Proceedings of the 12th Air Navigation
Conference, September 20-23, 2011, Montreal
[4] MIAILLIER, B. Exploring the Longer-Term Solutions,
Proceedings of the 12th Air Navigation Conference,
September 20-23, 2011, Montreal
[5] COX, V. Next Generation Air Transportation System,
Proceedings of the 12th Air Navigation Conference,
September 20-23, 2011, Montreal
[6] ČERVINKA, M., TYKVA, T. The Relationship of the
Regional Economy and Aair Transport. In Scientific
Papers of University of Pardubice, 2012, vol. 28, no. 24, p.
31–42. ISSN 1211-555X.
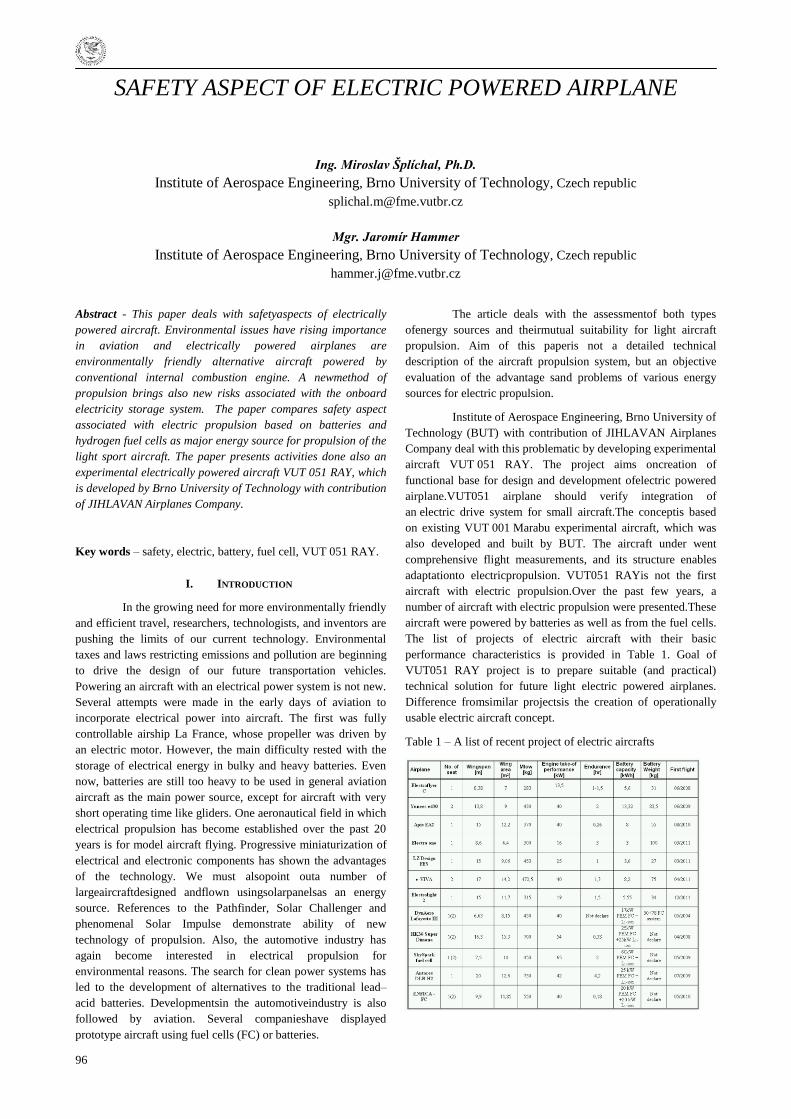
96
SAFETY ASPECT OF ELECTRIC POWERED AIRPLANE
Ing. Miroslav Šplíchal, Ph.D.
Institute of Aerospace Engineering, Brno University of Technology, Czech republic
Mgr. Jaromír Hammer
Institute of Aerospace Engineering, Brno University of Technology, Czech republic
Abstract - This paper deals with safetyaspects of electrically
powered aircraft. Environmental issues have rising importance
in aviation and electrically powered airplanes are
environmentally friendly alternative aircraft powered by
conventional internal combustion engine. A newmethod of
propulsion brings also new risks associated with the onboard
electricity storage system. The paper compares safety aspect
associated with electric propulsion based on batteries and
hydrogen fuel cells as major energy source for propulsion of the
light sport aircraft. The paper presents activities done also an
experimental electrically powered aircraft VUT 051 RAY, which
is developed by Brno University of Technology with contribution
of JIHLAVAN Airplanes Company.
Key words – safety, electric, battery, fuel cell, VUT 051 RAY.
I. INTRODUCTION
In the growing need for more environmentally friendly
and efficient travel, researchers, technologists, and inventors are
pushing the limits of our current technology. Environmental
taxes and laws restricting emissions and pollution are beginning
to drive the design of our future transportation vehicles.
Powering an aircraft with an electrical power system is not new.
Several attempts were made in the early days of aviation to
incorporate electrical power into aircraft. The first was fully
controllable airship La France, whose propeller was driven by
an electric motor. However, the main difficulty rested with the
storage of electrical energy in bulky and heavy batteries. Even
now, batteries are still too heavy to be used in general aviation
aircraft as the main power source, except for aircraft with very
short operating time like gliders. One aeronautical field in which
electrical propulsion has become established over the past 20
years is for model aircraft flying. Progressive miniaturization of
electrical and electronic components has shown the advantages
of the technology. We must alsopoint outa number of
largeaircraftdesigned andflown usingsolarpanelsas an energy
source. References to the Pathfinder, Solar Challenger and
phenomenal Solar Impulse demonstrate ability of new
technology of propulsion. Also, the automotive industry has
again become interested in electrical propulsion for
environmental reasons. The search for clean power systems has
led to the development of alternatives to the traditional lead–
acid batteries. Developmentsin the automotiveindustry is also
followed by aviation. Several companieshave displayed
prototype aircraft using fuel cells (FC) or batteries.
The article deals with the assessmentof both types
ofenergy sources and theirmutual suitability for light aircraft
propulsion. Aim of this paperis not a detailed technical
description of the aircraft propulsion system, but an objective
evaluation of the advantage sand problems of various energy
sources for electric propulsion.
Institute of Aerospace Engineering, Brno University of
Technology (BUT) with contribution of JIHLAVAN Airplanes
Company deal with this problematic by developing experimental
aircraft VUT 051 RAY. The project aims oncreation of
functional base for design and development ofelectric powered
airplane.VUT051 airplane should verify integration of
an electric drive system for small aircraft.The conceptis based
on existing VUT 001 Marabu experimental aircraft, which was
also developed and built by BUT. The aircraft under went
comprehensive flight measurements, and its structure enables
adaptationto electricpropulsion. VUT051 RAYis not the first
aircraft with electric propulsion.Over the past few years, a
number of aircraft with electric propulsion were presented.These
aircraft were powered by batteries as well as from the fuel cells.
The list of projects of electric aircraft with their basic
performance characteristics is provided in Table 1. Goal of
VUT051 RAY project is to prepare suitable (and practical)
technical solution for future light electric powered airplanes.
Difference fromsimilar projectsis the creation of operationally
usable electric aircraft concept.
Table 1 – A list of recent project of electric aircrafts
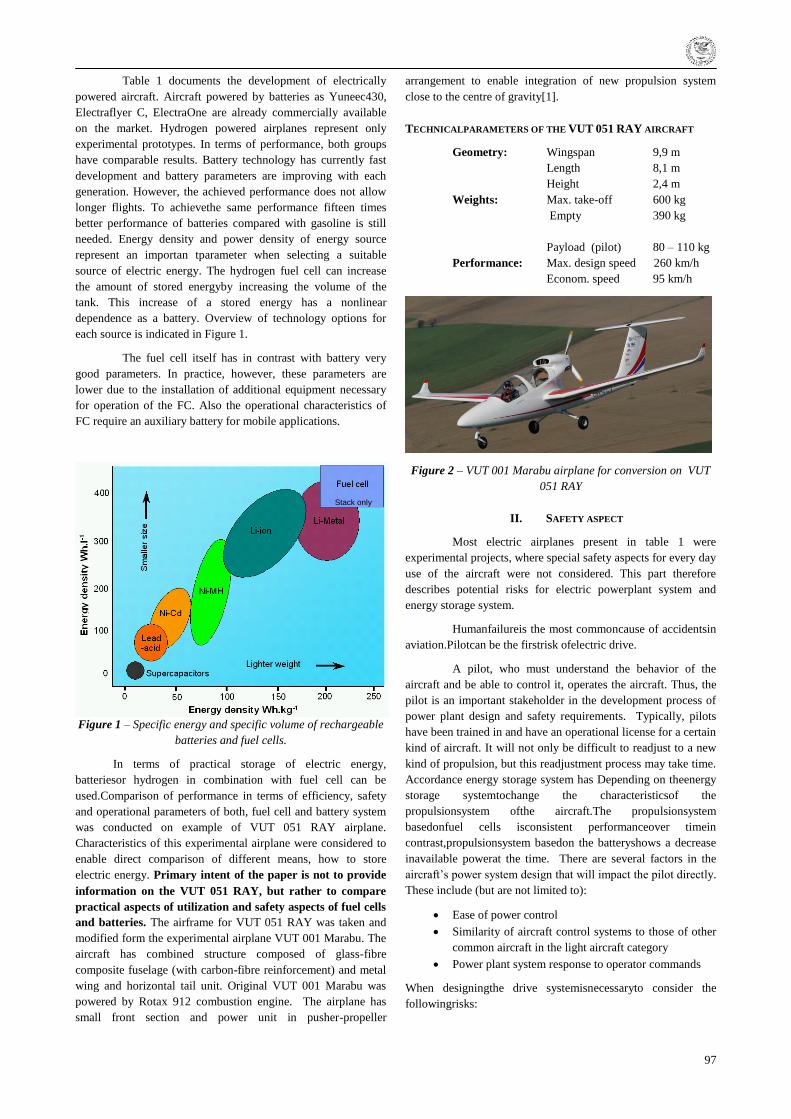
97
Table 1 documents the development of electrically
powered aircraft. Aircraft powered by batteries as Yuneec430,
Electraflyer C, ElectraOne are already commercially available
on the market. Hydrogen powered airplanes represent only
experimental prototypes. In terms of performance, both groups
have comparable results. Battery technology has currently fast
development and battery parameters are improving with each
generation. However, the achieved performance does not allow
longer flights. To achievethe same performance fifteen times
better performance of batteries compared with gasoline is still
needed. Energy density and power density of energy source
represent an importan tparameter when selecting a suitable
source of electric energy. The hydrogen fuel cell can increase
the amount of stored energyby increasing the volume of the
tank. This increase of a stored energy has a nonlinear
dependence as a battery. Overview of technology options for
each source is indicated in Figure 1.
The fuel cell itself has in contrast with battery very
good parameters. In practice, however, these parameters are
lower due to the installation of additional equipment necessary
for operation of the FC. Also the operational characteristics of
FC require an auxiliary battery for mobile applications.
Figure 1 – Specific energy and specific volume of rechargeable
batteries and fuel cells.
In terms of practical storage of electric energy,
batteriesor hydrogen in combination with fuel cell can be
used.Comparison of performance in terms of efficiency, safety
and operational parameters of both, fuel cell and battery system
was conducted on example of VUT 051 RAY airplane.
Characteristics of this experimental airplane were considered to
enable direct comparison of different means, how to store
electric energy. Primary intent of the paper is not to provide
information on the VUT 051 RAY, but rather to compare
practical aspects of utilization and safety aspects of fuel cells
and batteries. The airframe for VUT 051 RAY was taken and
modified form the experimental airplane VUT 001 Marabu. The
aircraft has combined structure composed of glass-fibre
composite fuselage (with carbon-fibre reinforcement) and metal
wing and horizontal tail unit. Original VUT 001 Marabu was
powered by Rotax 912 combustion engine. The airplane has
small front section and power unit in pusher-propeller
arrangement to enable integration of new propulsion system
close to the centre of gravity[1].
TECHNICALPARAMETERS OF THE VUT 051 RAY AIRCRAFT
Geometry: Wingspan 9,9 m
Length 8,1 m
Height 2,4 m
Weights: Max. take-off 600 kg
Empty 390 kg
Payload (pilot) 80 – 110 kg
Performance: Max. design speed 260 km/h
Econom. speed 95 km/h
Figure 2 – VUT 001 Marabu airplane for conversion on VUT
051 RAY
II. SAFETY ASPECT
Most electric airplanes present in table 1 were
experimental projects, where special safety aspects for every day
use of the aircraft were not considered. This part therefore
describes potential risks for electric powerplant system and
energy storage system.
Humanfailureis the most commoncause of accidentsin
aviation.Pilotcan be the firstrisk ofelectric drive.
A pilot, who must understand the behavior of the
aircraft and be able to control it, operates the aircraft. Thus, the
pilot is an important stakeholder in the development process of
power plant design and safety requirements. Typically, pilots
have been trained in and have an operational license for a certain
kind of aircraft. It will not only be difficult to readjust to a new
kind of propulsion, but this readjustment process may take time.
Accordance energy storage system has Depending on theenergy
storage systemtochange the characteristicsof the
propulsionsystem ofthe aircraft.The propulsionsystem
basedonfuel cells isconsistent performanceover timein
contrast,propulsionsystem basedon the batteryshows a decrease
inavailable powerat the time. There are several factors in the
aircraft‘s power system design that will impact the pilot directly.
These include (but are not limited to):
Ease of power control
Similarity of aircraft control systems to those of other
common aircraft in the light aircraft category
Power plant system response to operator commands
When designingthe drive systemisnecessaryto consider the
followingrisks:
Stack only
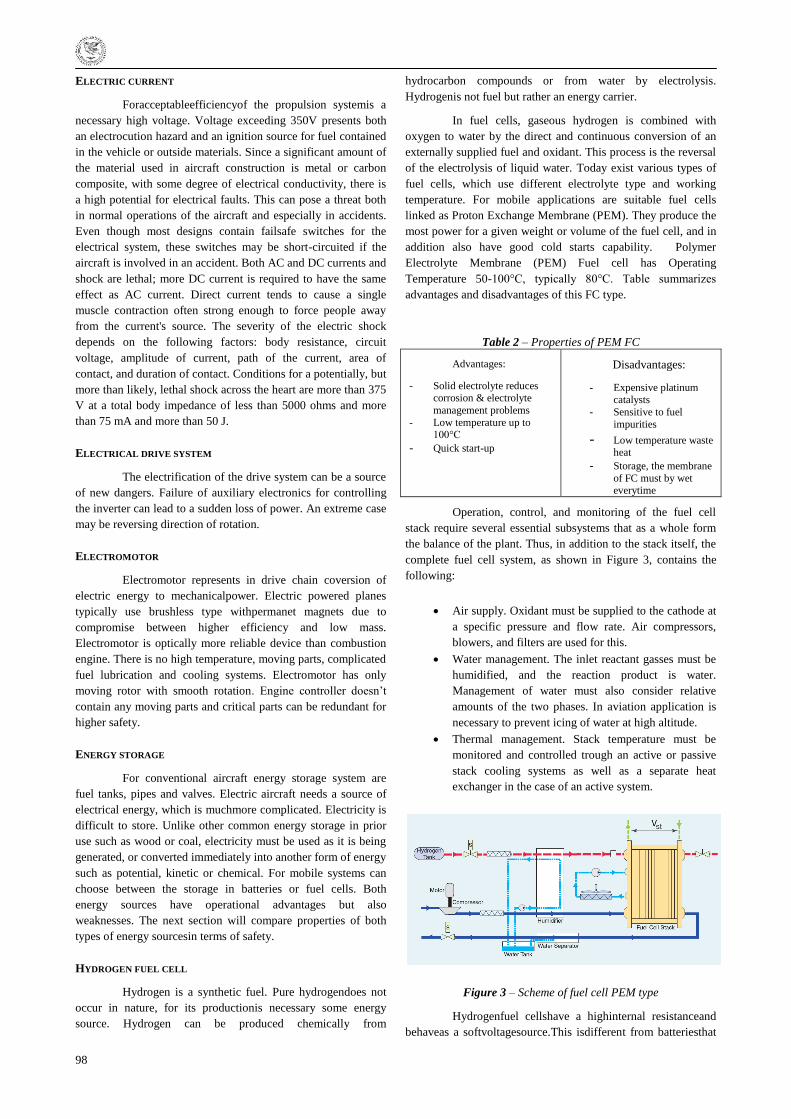
98
ELECTRIC CURRENT
Foracceptableefficiencyof the propulsion systemis a
necessary high voltage. Voltage exceeding 350V presents both
an electrocution hazard and an ignition source for fuel contained
in the vehicle or outside materials. Since a significant amount of
the material used in aircraft construction is metal or carbon
composite, with some degree of electrical conductivity, there is
a high potential for electrical faults. This can pose a threat both
in normal operations of the aircraft and especially in accidents.
Even though most designs contain failsafe switches for the
electrical system, these switches may be short-circuited if the
aircraft is involved in an accident. Both AC and DC currents and
shock are lethal; more DC current is required to have the same
effect as AC current. Direct current tends to cause a single
muscle contraction often strong enough to force people away
from the current's source. The severity of the electric shock
depends on the following factors: body resistance, circuit
voltage, amplitude of current, path of the current, area of
contact, and duration of contact. Conditions for a potentially, but
more than likely, lethal shock across the heart are more than 375
V at a total body impedance of less than 5000 ohms and more
than 75 mA and more than 50 J.
ELECTRICAL DRIVE SYSTEM
The electrification of the drive system can be a source
of new dangers. Failure of auxiliary electronics for controlling
the inverter can lead to a sudden loss of power. An extreme case
may be reversing direction of rotation.
ELECTROMOTOR
Electromotor represents in drive chain coversion of
electric energy to mechanicalpower. Electric powered planes
typically use brushless type withpermanet magnets due to
compromise between higher efficiency and low mass.
Electromotor is optically more reliable device than combustion
engine. There is no high temperature, moving parts, complicated
fuel lubrication and cooling systems. Electromotor has only
moving rotor with smooth rotation. Engine controller doesn‘t
contain any moving parts and critical parts can be redundant for
higher safety.
ENERGY STORAGE
For conventional aircraft energy storage system are
fuel tanks, pipes and valves. Electric aircraft needs a source of
electrical energy, which is muchmore complicated. Electricity is
difficult to store. Unlike other common energy storage in prior
use such as wood or coal, electricity must be used as it is being
generated, or converted immediately into another form of energy
such as potential, kinetic or chemical. For mobile systems can
choose between the storage in batteries or fuel cells. Both
energy sources have operational advantages but also
weaknesses. The next section will compare properties of both
types of energy sourcesin terms of safety.
HYDROGEN FUEL CELL
Hydrogen is a synthetic fuel. Pure hydrogendoes not
occur in nature, for its productionis necessary some energy
source. Hydrogen can be produced chemically from
hydrocarbon compounds or from water by electrolysis.
Hydrogenis not fuel but rather an energy carrier.
In fuel cells, gaseous hydrogen is combined with
oxygen to water by the direct and continuous conversion of an
externally supplied fuel and oxidant. This process is the reversal
of the electrolysis of liquid water. Today exist various types of
fuel cells, which use different electrolyte type and working
temperature. For mobile applications are suitable fuel cells
linked as Proton Exchange Membrane (PEM). They produce the
most power for a given weight or volume of the fuel cell, and in
addition also have good cold starts capability. Polymer
Electrolyte Membrane (PEM) Fuel cell has Operating
Temperature 50-100°C, typically 80°C. Table summarizes
advantages and disadvantages of this FC type.
Table 2 – Properties of PEM FC
Advantages:
- Solid electrolyte reduces corrosion & electrolyte
management problems
- Low temperature up to 100°C
- Quick start-up
Disadvantages:
- Expensive platinum catalysts
- Sensitive to fuel
impurities
- Low temperature waste heat
- Storage, the membrane
of FC must by wet everytime
Operation, control, and monitoring of the fuel cell
stack require several essential subsystems that as a whole form
the balance of the plant. Thus, in addition to the stack itself, the
complete fuel cell system, as shown in Figure 3, contains the
following:
Air supply. Oxidant must be supplied to the cathode at
a specific pressure and flow rate. Air compressors,
blowers, and filters are used for this.
Water management. The inlet reactant gasses must be
humidified, and the reaction product is water.
Management of water must also consider relative
amounts of the two phases. In aviation application is
necessary to prevent icing of water at high altitude.
Thermal management. Stack temperature must be
monitored and controlled trough an active or passive
stack cooling systems as well as a separate heat
exchanger in the case of an active system.
Figure 3 – Scheme of fuel cell PEM type
Hydrogenfuel cellshave a highinternal resistanceand
behaveas a softvoltagesource.This isdifferent from batteriesthat
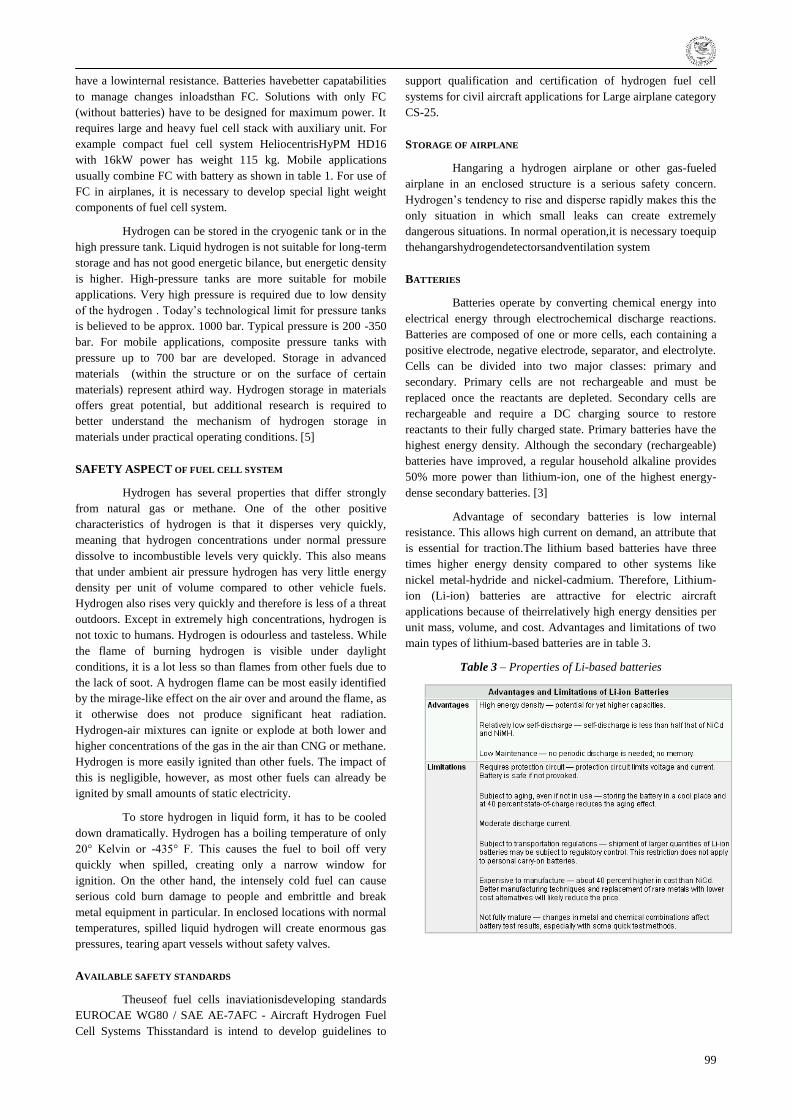
99
have a lowinternal resistance. Batteries havebetter capatabilities
to manage changes inloadsthan FC. Solutions with only FC
(without batteries) have to be designed for maximum power. It
requires large and heavy fuel cell stack with auxiliary unit. For
example compact fuel cell system HeliocentrisHyPM HD16
with 16kW power has weight 115 kg. Mobile applications
usually combine FC with battery as shown in table 1. For use of
FC in airplanes, it is necessary to develop special light weight
components of fuel cell system.
Hydrogen can be stored in the cryogenic tank or in the
high pressure tank. Liquid hydrogen is not suitable for long-term
storage and has not good energetic bilance, but energetic density
is higher. High-pressure tanks are more suitable for mobile
applications. Very high pressure is required due to low density
of the hydrogen . Today‘s technological limit for pressure tanks
is believed to be approx. 1000 bar. Typical pressure is 200 -350
bar. For mobile applications, composite pressure tanks with
pressure up to 700 bar are developed. Storage in advanced
materials (within the structure or on the surface of certain
materials) represent athird way. Hydrogen storage in materials
offers great potential, but additional research is required to
better understand the mechanism of hydrogen storage in
materials under practical operating conditions. [5]
SAFETY ASPECT OF FUEL CELL SYSTEM
Hydrogen has several properties that differ strongly
from natural gas or methane. One of the other positive
characteristics of hydrogen is that it disperses very quickly,
meaning that hydrogen concentrations under normal pressure
dissolve to incombustible levels very quickly. This also means
that under ambient air pressure hydrogen has very little energy
density per unit of volume compared to other vehicle fuels.
Hydrogen also rises very quickly and therefore is less of a threat
outdoors. Except in extremely high concentrations, hydrogen is
not toxic to humans. Hydrogen is odourless and tasteless. While
the flame of burning hydrogen is visible under daylight
conditions, it is a lot less so than flames from other fuels due to
the lack of soot. A hydrogen flame can be most easily identified
by the mirage-like effect on the air over and around the flame, as
it otherwise does not produce significant heat radiation.
Hydrogen-air mixtures can ignite or explode at both lower and
higher concentrations of the gas in the air than CNG or methane.
Hydrogen is more easily ignited than other fuels. The impact of
this is negligible, however, as most other fuels can already be
ignited by small amounts of static electricity.
To store hydrogen in liquid form, it has to be cooled
down dramatically. Hydrogen has a boiling temperature of only
20° Kelvin or -435° F. This causes the fuel to boil off very
quickly when spilled, creating only a narrow window for
ignition. On the other hand, the intensely cold fuel can cause
serious cold burn damage to people and embrittle and break
metal equipment in particular. In enclosed locations with normal
temperatures, spilled liquid hydrogen will create enormous gas
pressures, tearing apart vessels without safety valves.
AVAILABLE SAFETY STANDARDS
Theuseof fuel cells inaviationisdeveloping standards
EUROCAE WG80 / SAE AE-7AFC - Aircraft Hydrogen Fuel
Cell Systems Thisstandard is intend to develop guidelines to
support qualification and certification of hydrogen fuel cell
systems for civil aircraft applications for Large airplane category
CS-25.
STORAGE OF AIRPLANE
Hangaring a hydrogen airplane or other gas-fueled
airplane in an enclosed structure is a serious safety concern.
Hydrogen‘s tendency to rise and disperse rapidly makes this the
only situation in which small leaks can create extremely
dangerous situations. In normal operation,it is necessary toequip
thehangarshydrogendetectorsandventilation system
BATTERIES
Batteries operate by converting chemical energy into
electrical energy through electrochemical discharge reactions.
Batteries are composed of one or more cells, each containing a
positive electrode, negative electrode, separator, and electrolyte.
Cells can be divided into two major classes: primary and
secondary. Primary cells are not rechargeable and must be
replaced once the reactants are depleted. Secondary cells are
rechargeable and require a DC charging source to restore
reactants to their fully charged state. Primary batteries have the
highest energy density. Although the secondary (rechargeable)
batteries have improved, a regular household alkaline provides
50% more power than lithium-ion, one of the highest energy-
dense secondary batteries. [3]
Advantage of secondary batteries is low internal
resistance. This allows high current on demand, an attribute that
is essential for traction.The lithium based batteries have three
times higher energy density compared to other systems like
nickel metal-hydride and nickel-cadmium. Therefore, Lithium-
ion (Li-ion) batteries are attractive for electric aircraft
applications because of theirrelatively high energy densities per
unit mass, volume, and cost. Advantages and limitations of two
main types of lithium-based batteries are in table 3.
Table 3 – Properties of Li-based batteries

100
Li-pol secondary batteries are currently the best
energy storage devices for portable consumer electronics, in
comparison with other conventional batteries, because of the
high energy density as shown in Fig. 3. They were first
developed and commercialized by Sony in 1990. Since market
introduction, there was 3-times the increase in capacity (until
today). This remarkable increase in capacity was realized
through engineering improvements in the manufacturing
processes and the introduction of new separator, cathode and
anode materials and still exists potential for further
improvement.
Major problem of Lithium-ion (Li-ion) batteries is
charging process sensitivity. Exothermic chemical reaction can
start in the cell when its terminal voltage is overcome. This is
very dangerous due to the risk of fire. Lithium based batteries
are classified as dangerous stock for air transport. Therefore
batteries need special protection circuit (battery management
system) for balancing voltage on each battery cell.
SAFETY ASPECT OF BATTERY SYSTEM
Batteries are generally safe. Modern lithium based
batteries contain highly reactive chemicals that will react at
elevated temperature by default. Li-ion batteries using
conventional metal oxides are nearing its theoretical limit on
specific energy. Rather than optimising runtime, battery makers
are improving manufacturing methods to enhance safety and
increase the lifecycle. Overheating of cell can cause an
exothermic reaction and explosion. Hot gases and chemicals can
hazards to human health. With regard to throat and stomach
issues, ingestion of the solution in the battery's cells along with
ingesting cobalt itself, which is a known carcinogen, can be
harmful to the delicate tissues of the throat and stomach as well
as become a cause for cancer in the affected areas. Skin issues
can also be a result of exploding lithium ion batteries.
Additionally, handling of batteries that are leaking the material
from the cells can cause both allergic reactions and severe burns
to the skin.A fire with batteries containing lithium metal
requires a special extinguishing method.
AVAILABLE SAFETYSTANDARDS
To address some of the safety risks associated with the
use of lithium-ion batteries, a number of standards and testing
protocols have been developed to provide manufacturers with
guidance on how to more safely construct and use lithium-ion
batteries. Product safety standards are typically developed
through a consensus process, which relies on participation by
representatives from regulatory bodies, manufacturers, industry
groups, consumer advocacy organizations, insurance companies
and other key safety stakeholders. The technical committees
developing requirements for product safety standards rely less
on prescriptive requirements and more on performance tests
simulating reasonable situations that may cause a defective
product to react. The following standards and testing protocols
are currently used to assess some of the safety aspects of
secondary lithium batteries:
Underwriters Laboratories
• UL 1642: Lithium Batteries
• UL 2054: Household and Commercial Batteries
• UL Subject 2271: Batteries For Use in Light Electric Vehicle Applications
• UL Subject 2580: Batteries For Use in Electric Vehicles
• UL 2575: Lithium-Ion Battery Systems for Use in
Electric Power Tool and Motor Operated, Heating and
Lighting Appliances
Institute of Electrical and Electronics Engineers
- IEEE 1625: Rechargeable Batteries for Multi-Cell
Mobile Computing Devices
- IEEE 1725: Rechargeable Batteries for Cellular Telephones
Society of Automotive Engineers
- J2464: Electric and Hybrid Electric Vehicle
Rechargeable Energy Storage Systems (RESS), Safety
and Abuse Testing (revised 2009) [10] which adopted
test procedures from the Sandia National Laboratories
Electrochemical Storage System Abuse Test
Procedure Manual as a basis for a body of tests which
may be useful for abuse testing of electric or hybrid
electric vehicle batteries
- J2929: Electric and Hybrid Vehicle Propulsion Battery
System Safety Standard — Lithium-based
Rechargeable Cells[11] published In February 2011
and describes performance criteria for some of the
tests described in SAE J2464.
International Electrotechnical Commission
- IEC 62133: Secondary Cells and Batteries Containing
Alkaline or Other Non-acid Electrolytes — Safety
Requirements for Portable Sealed Secondary Cells,
and for Batteries Made from Them, for Use in Portable Applications
- IEC 62281: Safety of Primary and Secondary Lithium
Cells and Batteries During Transportation
Battery Safety Organization
- BATSO 01: (Proposed) Manual for Evaluation of
Energy Systems for Light Electric Vehicle (LEV) —
Secondary Lithium Batteries
The most common product safety tests for lithium-ion
batteries are typically intended to assess specific risk from
electrical, mechanical and environmental conditions. These
standardscan be usedas a basisfor evaluatingthe suitabilityof
101
batteriesfor aircraft propulsion systems.Table2comparesavariety
ofstandard and testprotocol.Testcriteriawere chosenwithregard
to theuse of batterieson board ofaircraft.
STORAGE OF AIRPLANE
Storage of airplane with high capacity batteries should
not pose ahigherriskthan conventional aircraft. Slow charge the
battery during hangaring will have to be monitored and will
have to be made suitable fire precautions. The airport will have
to been sure dextinguishing media appropriate for th ehigh-
voltage battery.
III. CONCLUSION
In the case of electrically powered aircraft, the system
energy storage limit of defending their operational expansion.
Currently, exploring two main ways of storing energy: hydrogen
or batteries. Both solutions have their advantages and
disadvantages. Aim of this article was to compare both ways
from safety operation aspects.
The propulsion system using only the fuel cell can be
safer than a system using batteries as energy storage. Most
electrically powered aircraft with fuel cell also uses the auxiliary
battery to overcome energy peak demand. A system based only
on the fuel cellsis difficult to realizefortheir characteristics.
Therefore, this energy storage system contain more risky
components that connect the disadvantages of both examined
solution of storing energy. Fuel cell system also has a number of
moving mechanical components that can reduce overall system
reliability. The advantage ofthe fuel cellisa quick and safe
release of stored energy.
Energy storage system using only battery is much
easier, but to replace combustion engines by electric motors
powered by batteries with similar weight and performance of
overall propulsion system, ten fold higher energy density of
batteries would be required. There are not moving mechanical
components that can fail. The battery consists from a large
number of articles, and incase of failure ofone cell does not
occur failure of the battery pack. The main problem is the
sensitivity of cell stoover voltage or intensive discharge which
may lead to an explosion cell. This problem can be solved by
battery management. The advantage is simplicity without the
use of mechanical components such as a compressor or a
pressure vessel. The disadvantage is the inability to quickly and
safely release the stored energy.
Despite the certain benefits of energy storage system
based on fuel cell, are these system operationally expensive. In
the future is expected to use a new type of battery working on a
similar principle as the fuel cell. The practical application of this
concept is expected in the longterm. By this time, it is necessary
to work on the new safety standards and gain operational
experience with electrically driven aircraft like the VUT 51Ray.
REFERENCES
[1] Benclik, K.: Předběţný koncepční návrh letounu VUT 051
RAY (Preliminary conceptual design of the airplane, VUT
RAY 051), internal report LU66-2009-RAY.AS, 2009, 19
pages
[2] Benclik, K.:Předběţný návrh koncepce vodíkového pohonu
letounu VUT 051RAY (Preliminary conceptual design
of hydrogen propulsion system for VUT RAY 051
airplane), internal report LU33-2011-RAY.AS, 2011, 21
pages
[3] J.M. Tarascan, M. Armand, Issues and challenges facing
rechargeable lithium batterie, J Nat, 414 (November)
(2001), pp. 359–367
[4] Comparison of Fuel Cell Technologies". U.S. Department
of Energy, Energy Efficiency and Fuel Cell Technologies
Program, February 2011, accessed August 4, 2011
[5] Hydrogen Composite Tank Program, Proceedings of the
2002 U.S. DOE Hydrogen Program Review NREL/CP-
610-32405
[6] US. Department of Energy (DOE), 2009b: Hydrogen
Production Model
(H2A),http://www.hydrogen.energy.gov/h2a_production.ht
ml
[7] IEA Energy Technology
Essentialshttp://www.iea.org/techno/essentials6.pdf
[8] (http://www.avweb.com/blogs/insider/AvWebInsider_Avga
sPrices_199000-1.html)
[9] Buchi F.M. ―Small-size PEM systems for special
applications― Handbook of Fuel Cells – Fundamentals,
Technology and Applications Volume 4, Part 10, pp 1152–
1161.
[10] The Society of Automotive Engineers, 400 Commonwealth
Drive Warrendale, PA 15096-0001 USA SAE J2464
Electric and Hybrid Electric Vehicle Rechargeable Energy
Storage System (RESS) Safety and Abuse Testing
(http://www.sae.org/)
[11] The Society of Automotive Engineers, 400 Commonwealth
Drive Warrendale, PA 15096-0001 USA SAE J2929
Electric and Hybrid Electric Propulsion Battery System
Safety Standard – Lithium Based Rechargeable Cells
(http://www.sae.org/)
[12] ŠPLÍCHAL, M. Perspectives of electric powered airplane.
In INAIR 2012. 1. Ţilina, EDIS-Zilina University
publishers. 2012. p. 119 - 124. ISBN 978-80-554-0574-2.
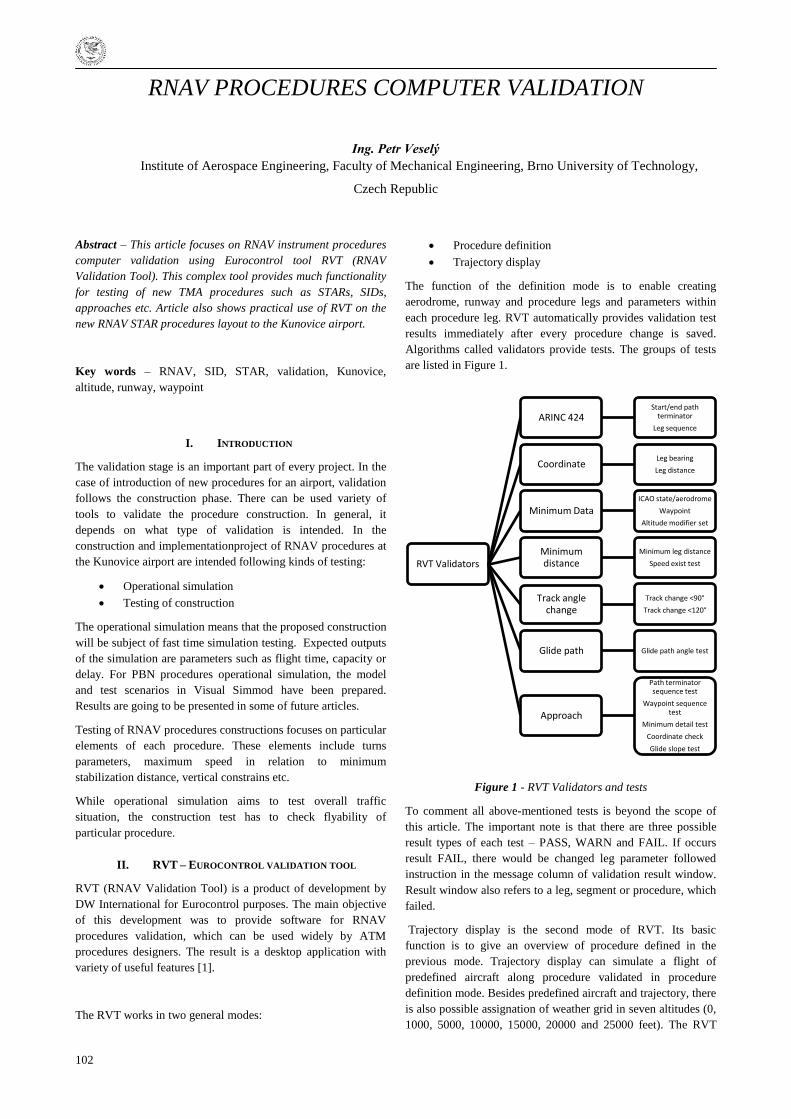
102
RNAV PROCEDURES COMPUTER VALIDATION
Ing. Petr Veselý
Institute of Aerospace Engineering, Faculty of Mechanical Engineering, Brno University of Technology,
Czech Republic
Abstract – This article focuses on RNAV instrument procedures
computer validation using Eurocontrol tool RVT (RNAV
Validation Tool). This complex tool provides much functionality
for testing of new TMA procedures such as STARs, SIDs,
approaches etc. Article also shows practical use of RVT on the
new RNAV STAR procedures layout to the Kunovice airport.
Key words – RNAV, SID, STAR, validation, Kunovice,
altitude, runway, waypoint
I. INTRODUCTION
The validation stage is an important part of every project. In the
case of introduction of new procedures for an airport, validation
follows the construction phase. There can be used variety of
tools to validate the procedure construction. In general, it
depends on what type of validation is intended. In the
construction and implementationproject of RNAV procedures at
the Kunovice airport are intended following kinds of testing:
Operational simulation
Testing of construction
The operational simulation means that the proposed construction
will be subject of fast time simulation testing. Expected outputs
of the simulation are parameters such as flight time, capacity or
delay. For PBN procedures operational simulation, the model
and test scenarios in Visual Simmod have been prepared.
Results are going to be presented in some of future articles.
Testing of RNAV procedures constructions focuses on particular
elements of each procedure. These elements include turns
parameters, maximum speed in relation to minimum
stabilization distance, vertical constrains etc.
While operational simulation aims to test overall traffic
situation, the construction test has to check flyability of
particular procedure.
II. RVT – EUROCONTROL VALIDATION TOOL
RVT (RNAV Validation Tool) is a product of development by
DW International for Eurocontrol purposes. The main objective
of this development was to provide software for RNAV
procedures validation, which can be used widely by ATM
procedures designers. The result is a desktop application with
variety of useful features [1].
The RVT works in two general modes:
Procedure definition
Trajectory display
The function of the definition mode is to enable creating
aerodrome, runway and procedure legs and parameters within
each procedure leg. RVT automatically provides validation test
results immediately after every procedure change is saved.
Algorithms called validators provide tests. The groups of tests
are listed in Figure 1.
Figure 1 - RVT Validators and tests
To comment all above-mentioned tests is beyond the scope of
this article. The important note is that there are three possible
result types of each test – PASS, WARN and FAIL. If occurs
result FAIL, there would be changed leg parameter followed
instruction in the message column of validation result window.
Result window also refers to a leg, segment or procedure, which
failed.
Trajectory display is the second mode of RVT. Its basic
function is to give an overview of procedure defined in the
previous mode. Trajectory display can simulate a flight of
predefined aircraft along procedure validated in procedure
definition mode. Besides predefined aircraft and trajectory, there
is also possible assignation of weather grid in seven altitudes (0,
1000, 5000, 10000, 15000, 20000 and 25000 feet). The RVT
RVT Validators
ARINC 424Start/end path
terminator
Leg sequence
CoordinateLeg bearing
Leg distance
Minimum DataICAO state/aerodrome
Waypoint
Altitude modifier set
Minimum distance
Minimum leg distance
Speed exist test
Track angle change
Track change <90°
Track change <120°
Glide path Glide path angle test
Approach
Path terminator sequence test
Waypoint sequence test
Minimum detail test
Coordinate check
Glide slope test
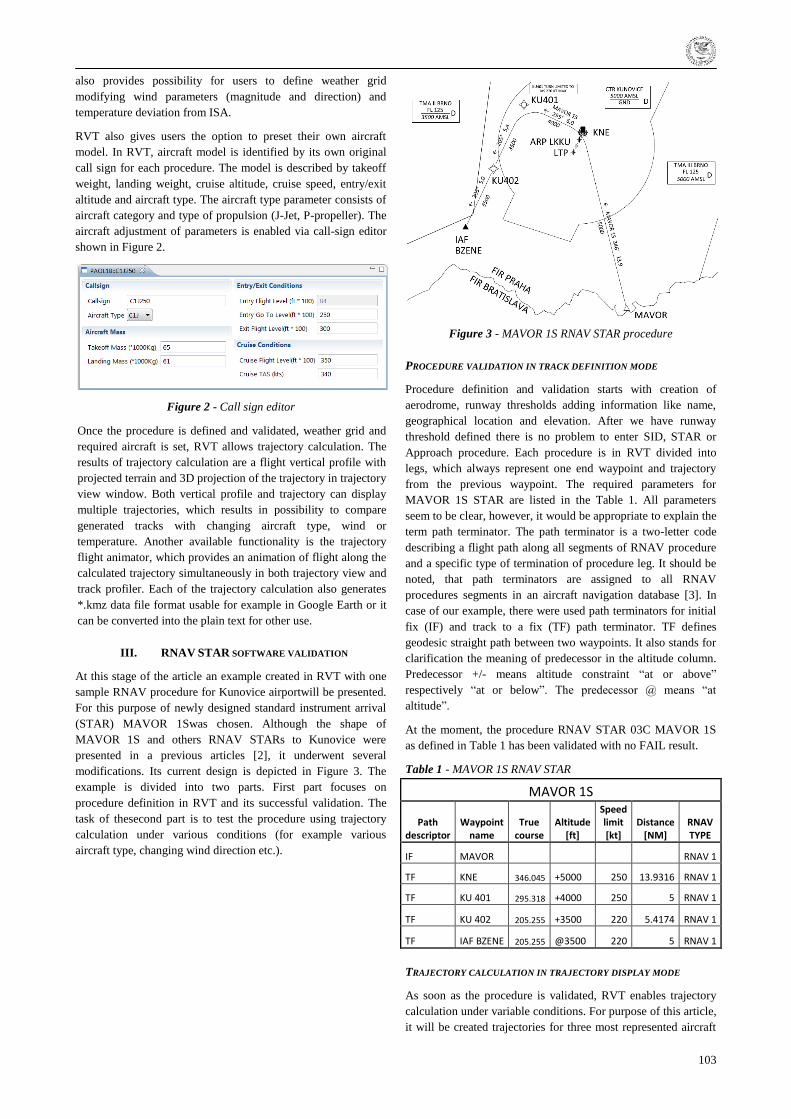
103
also provides possibility for users to define weather grid
modifying wind parameters (magnitude and direction) and
temperature deviation from ISA.
RVT also gives users the option to preset their own aircraft
model. In RVT, aircraft model is identified by its own original
call sign for each procedure. The model is described by takeoff
weight, landing weight, cruise altitude, cruise speed, entry/exit
altitude and aircraft type. The aircraft type parameter consists of
aircraft category and type of propulsion (J-Jet, P-propeller). The
aircraft adjustment of parameters is enabled via call-sign editor
shown in Figure 2.
Figure 2 - Call sign editor
Once the procedure is defined and validated, weather grid and
required aircraft is set, RVT allows trajectory calculation. The
results of trajectory calculation are a flight vertical profile with
projected terrain and 3D projection of the trajectory in trajectory
view window. Both vertical profile and trajectory can display
multiple trajectories, which results in possibility to compare
generated tracks with changing aircraft type, wind or
temperature. Another available functionality is the trajectory
flight animator, which provides an animation of flight along the
calculated trajectory simultaneously in both trajectory view and
track profiler. Each of the trajectory calculation also generates
*.kmz data file format usable for example in Google Earth or it
can be converted into the plain text for other use.
III. RNAV STAR SOFTWARE VALIDATION
At this stage of the article an example created in RVT with one
sample RNAV procedure for Kunovice airportwill be presented.
For this purpose of newly designed standard instrument arrival
(STAR) MAVOR 1Swas chosen. Although the shape of
MAVOR 1S and others RNAV STARs to Kunovice were
presented in a previous articles [2], it underwent several
modifications. Its current design is depicted in Figure 3. The
example is divided into two parts. First part focuses on
procedure definition in RVT and its successful validation. The
task of thesecond part is to test the procedure using trajectory
calculation under various conditions (for example various
aircraft type, changing wind direction etc.).
Figure 3 - MAVOR 1S RNAV STAR procedure
PROCEDURE VALIDATION IN TRACK DEFINITION MODE
Procedure definition and validation starts with creation of
aerodrome, runway thresholds adding information like name,
geographical location and elevation. After we have runway
threshold defined there is no problem to enter SID, STAR or
Approach procedure. Each procedure is in RVT divided into
legs, which always represent one end waypoint and trajectory
from the previous waypoint. The required parameters for
MAVOR 1S STAR are listed in the Table 1. All parameters
seem to be clear, however, it would be appropriate to explain the
term path terminator. The path terminator is a two-letter code
describing a flight path along all segments of RNAV procedure
and a specific type of termination of procedure leg. It should be
noted, that path terminators are assigned to all RNAV
procedures segments in an aircraft navigation database [3]. In
case of our example, there were used path terminators for initial
fix (IF) and track to a fix (TF) path terminator. TF defines
geodesic straight path between two waypoints. It also stands for
clarification the meaning of predecessor in the altitude column.
Predecessor +/- means altitude constraint ―at or above‖
respectively ―at or below‖. The predecessor @ means ―at
altitude‖.
At the moment, the procedure RNAV STAR 03C MAVOR 1S
as defined in Table 1 has been validated with no FAIL result.
Table 1 - MAVOR 1S RNAV STAR
MAVOR 1S
Path descriptor
Waypoint name
True course
Altitude [ft]
Speed limit [kt]
Distance [NM]
RNAV TYPE
IF MAVOR RNAV 1
TF KNE 346.045 +5000 250 13.9316 RNAV 1
TF KU 401 295.318 +4000 250 5 RNAV 1
TF KU 402 205.255 +3500 220 5.4174 RNAV 1
TF IAF BZENE 205.255 @3500 220 5 RNAV 1
TRAJECTORY CALCULATION IN TRAJECTORY DISPLAY MODE
As soon as the procedure is validated, RVT enables trajectory
calculation under variable conditions. For purpose of this article,
it will be created trajectories for three most represented aircraft
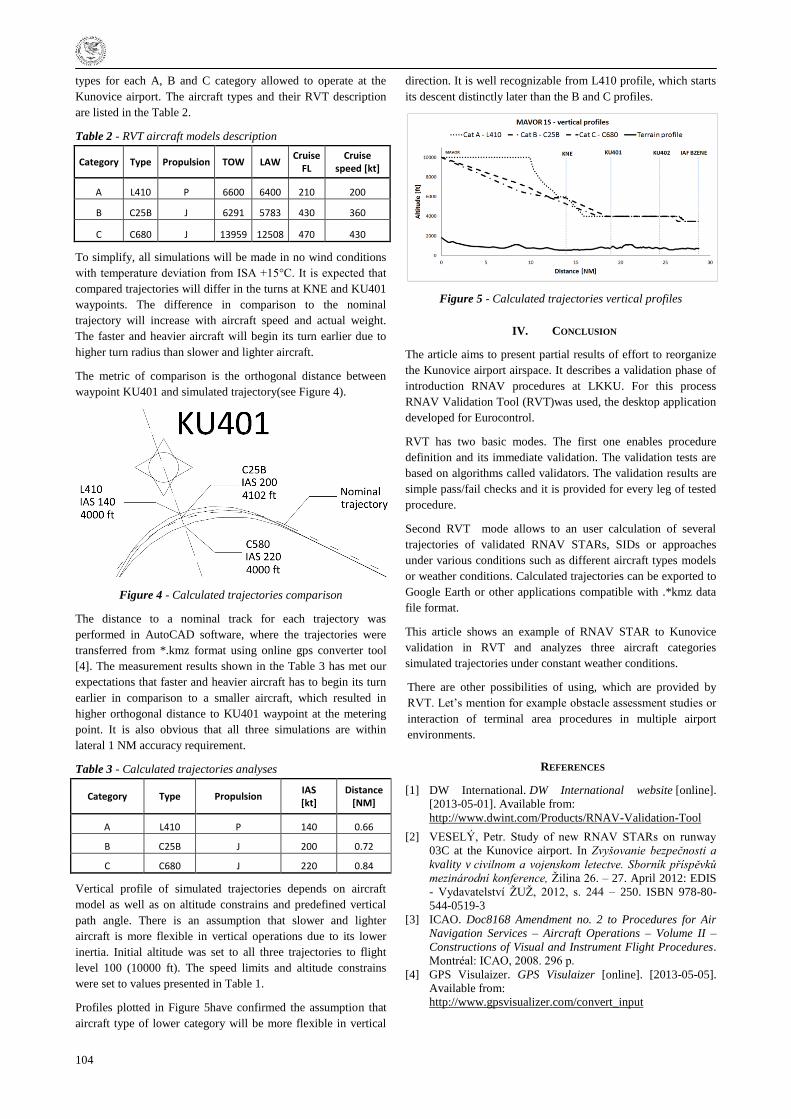
104
types for each A, B and C category allowed to operate at the
Kunovice airport. The aircraft types and their RVT description
are listed in the Table 2.
Table 2 - RVT aircraft models description
Category Type Propulsion TOW LAW Cruise
FL Cruise
speed [kt]
A L410 P 6600 6400 210 200
B C25B J 6291 5783 430 360
C C680 J 13959 12508 470 430
To simplify, all simulations will be made in no wind conditions
with temperature deviation from ISA +15°C. It is expected that
compared trajectories will differ in the turns at KNE and KU401
waypoints. The difference in comparison to the nominal
trajectory will increase with aircraft speed and actual weight.
The faster and heavier aircraft will begin its turn earlier due to
higher turn radius than slower and lighter aircraft.
The metric of comparison is the orthogonal distance between
waypoint KU401 and simulated trajectory(see Figure 4).
Figure 4 - Calculated trajectories comparison
The distance to a nominal track for each trajectory was
performed in AutoCAD software, where the trajectories were
transferred from *.kmz format using online gps converter tool
[4]. The measurement results shown in the Table 3 has met our
expectations that faster and heavier aircraft has to begin its turn
earlier in comparison to a smaller aircraft, which resulted in
higher orthogonal distance to KU401 waypoint at the metering
point. It is also obvious that all three simulations are within
lateral 1 NM accuracy requirement.
Table 3 - Calculated trajectories analyses
Category Type Propulsion IAS [kt]
Distance [NM]
A L410 P 140 0.66
B C25B J 200 0.72
C C680 J 220 0.84
Vertical profile of simulated trajectories depends on aircraft
model as well as on altitude constrains and predefined vertical
path angle. There is an assumption that slower and lighter
aircraft is more flexible in vertical operations due to its lower
inertia. Initial altitude was set to all three trajectories to flight
level 100 (10000 ft). The speed limits and altitude constrains
were set to values presented in Table 1.
Profiles plotted in Figure 5have confirmed the assumption that
aircraft type of lower category will be more flexible in vertical
direction. It is well recognizable from L410 profile, which starts
its descent distinctly later than the B and C profiles.
Figure 5 - Calculated trajectories vertical profiles
IV. CONCLUSION
The article aims to present partial results of effort to reorganize
the Kunovice airport airspace. It describes a validation phase of
introduction RNAV procedures at LKKU. For this process
RNAV Validation Tool (RVT)was used, the desktop application
developed for Eurocontrol.
RVT has two basic modes. The first one enables procedure
definition and its immediate validation. The validation tests are
based on algorithms called validators. The validation results are
simple pass/fail checks and it is provided for every leg of tested
procedure.
Second RVT mode allows to an user calculation of several
trajectories of validated RNAV STARs, SIDs or approaches
under various conditions such as different aircraft types models
or weather conditions. Calculated trajectories can be exported to
Google Earth or other applications compatible with .*kmz data
file format.
This article shows an example of RNAV STAR to Kunovice
validation in RVT and analyzes three aircraft categories
simulated trajectories under constant weather conditions.
There are other possibilities of using, which are provided by
RVT. Let‘s mention for example obstacle assessment studies or
interaction of terminal area procedures in multiple airport
environments.
REFERENCES
[1] DW International. DW International website [online].
[2013-05-01]. Available from:
http://www.dwint.com/Products/RNAV-Validation-Tool
[2] VESELÝ, Petr. Study of new RNAV STARs on runway
03C at the Kunovice airport. In Zvyšovanie bezpečnosti a
kvality v civilnom a vojenskom letectve. Sborník příspěvků
mezinárodní konference, Ţilina 26. – 27. April 2012: EDIS
- Vydavatelství ŢUŢ, 2012, s. 244 – 250. ISBN 978-80-
544-0519-3
[3] ICAO. Doc8168 Amendment no. 2 to Procedures for Air
Navigation Services – Aircraft Operations – Volume II –
Constructions of Visual and Instrument Flight Procedures.
Montréal: ICAO, 2008. 296 p.
[4] GPS Visulaizer. GPS Visulaizer [online]. [2013-05-05].
Available from:
http://www.gpsvisualizer.com/convert_input
105
AVIATIONEXAMTEST PREP SOLUTIONS
Věra Vondrášková
Aviationexam s. r. o., Czech Republic
Jan Veselý
Aviationexam s. r. o., Czech Republic
Abstract – Aviationexam offers a solution to fill the gap between
pilot ground preparation and the official exams by linking the
theory with a realistic simulation of the exam environment
through the interactive Test Prep system. Variability of the
system, which can be used online and also offline through
proprietary applications for most smart phone and tablet
platforms, provides a significant freedom while studying. The
system provides an option to evaluate the student’s knowledge
and verify if the student is ready to sit the official exams. The
explanations and comments, which are provided for each
question, turn the system into a very effective study tool, which
can be used by individual users or Training Organizations.
Key words – Aviationexam, application, exam, ATO (FTO),
preparation, Test Prep system, theory, training, study, student
I. INTRODUCTION
When learning to fly, the flying part is the attractive
one to most future pilots. The theory has the same importance,
but students usually prefer the cockpit over the classroom. Even
for those students, who put an extra additional effort into
mastering all of the theoretical aspects of their training, there is
usually a large gap between their theoretical preparation and the
knowledge they are expected to demonstrate during the official
written exams. The reasons for this gap may be multi-fold:
arising from situations such as large fragmentation of training
materials; failure of some training materials to cover the entire
syllabus down to the required detail or the student‘s
unfamiliarity with the scope of the Learning Objectives for the
exams from given subjects.
Aviationexam offers a solution to fill the gap between
the theoretical preparation and the scope of the official exams by
linking the theory with a realistic simulation of the exam
environment through the interactive Test Prep system. Bringing
the theory closer to the practical application and evaluation of
the student‘s knowledge are the great benefits of the Test Prep
system, while the brief explanations of each test question
together with comments from other students turn the system into
a well respected study tool.
II. TEST PREP SYSTEM
The Test Prep system of Aviationexam offers:
• ATPL, CPL, IR Question Database
• Possible Answers with Key
• Explanations
• Picture Supplements (Questions)
• Picture Supplements (Explanations)
Using question banks in the process of a pilot‘s
theoretical preparation appears to be a somewhat controversial
topic. At this place, it should be clearly stressed, that the
Aviationexam Test Prep system is not intended to serve as the
only means of student preparation and source of essential
information for the EASA examinations. Instead, its purpose is
to serve as a very effective tool to assist in getting familiar with
the content of the examinations and to verify if the student is
ready to sit the official exams. The Test Prep system should be
used in conjunction with other training materials, ground
training courses or instructor guidance.
The Test Prep system was intended and developed as a
study tool:
All questions in the database contain an explanation why the
respective answer is the correct one.
Commenting on a specific question in the database is another
educational feature of the Test Prep system. Comments are
primarily intended for users to discuss anything concerning the
specific question amongst themselves (users <=> users).
Aviationexam is doing their best to monitor the student
comments and provide responses where able.
The extensive ―Reports and Statistics‖ module helps to identify
the weak areas of individual students and allows the students or
their instructors focus on these specific areas at a greater depth.
Marking questions with flags ―For review‖, ―Keep testing‖,
―Show 1x in the next test‖, ―Don‘t test― helps with navigation
between the questions.
The absence of the possibility to display a concise list of all
questions together with the correct answers (like a ―cheat sheet‖
format) and advanced features allowing shuffling the answer
possibilities, prevent the students from plain rote memorizing of
the correct answers.
DIFFERENT PLATFORMS
The system is available as an online system and also
through applications, which don‘t require constant internet
connection.
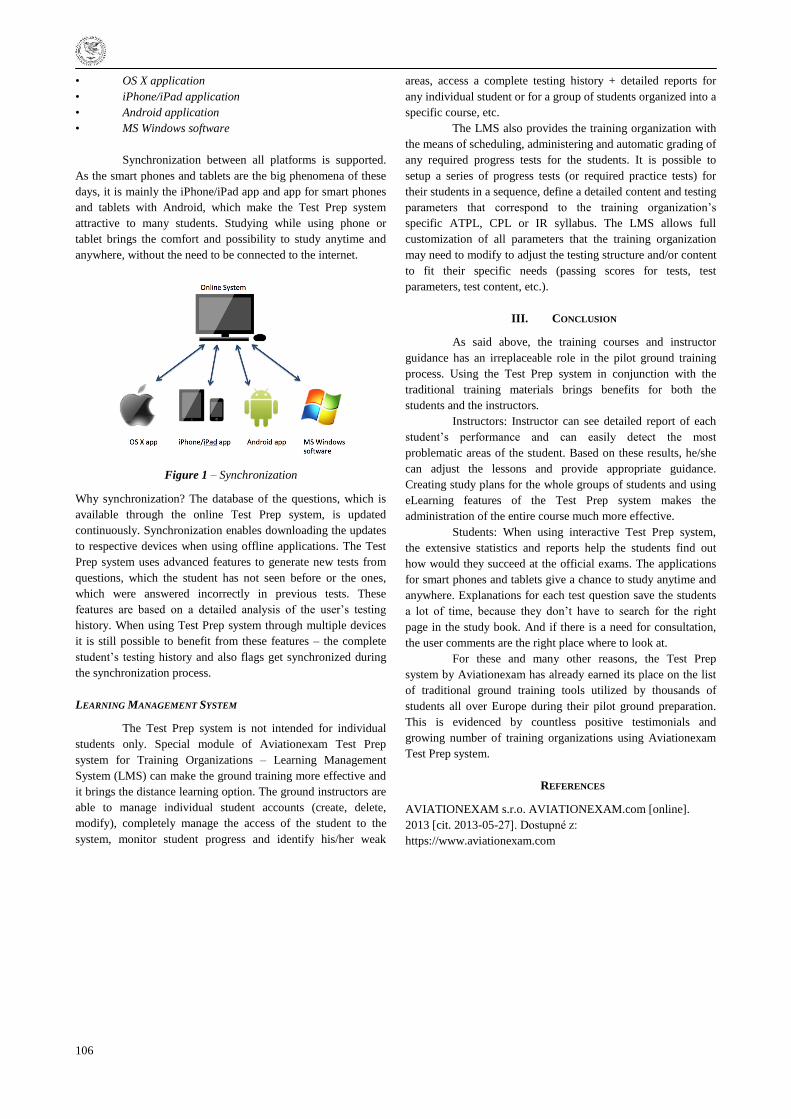
106
• OS X application
• iPhone/iPad application
• Android application
• MS Windows software
Synchronization between all platforms is supported.
As the smart phones and tablets are the big phenomena of these
days, it is mainly the iPhone/iPad app and app for smart phones
and tablets with Android, which make the Test Prep system
attractive to many students. Studying while using phone or
tablet brings the comfort and possibility to study anytime and
anywhere, without the need to be connected to the internet.
Figure 1 – Synchronization
Why synchronization? The database of the questions, which is
available through the online Test Prep system, is updated
continuously. Synchronization enables downloading the updates
to respective devices when using offline applications. The Test
Prep system uses advanced features to generate new tests from
questions, which the student has not seen before or the ones,
which were answered incorrectly in previous tests. These
features are based on a detailed analysis of the user‘s testing
history. When using Test Prep system through multiple devices
it is still possible to benefit from these features – the complete
student‘s testing history and also flags get synchronized during
the synchronization process.
LEARNING MANAGEMENT SYSTEM
The Test Prep system is not intended for individual
students only. Special module of Aviationexam Test Prep
system for Training Organizations – Learning Management
System (LMS) can make the ground training more effective and
it brings the distance learning option. The ground instructors are
able to manage individual student accounts (create, delete,
modify), completely manage the access of the student to the
system, monitor student progress and identify his/her weak
areas, access a complete testing history + detailed reports for
any individual student or for a group of students organized into a
specific course, etc.
The LMS also provides the training organization with
the means of scheduling, administering and automatic grading of
any required progress tests for the students. It is possible to
setup a series of progress tests (or required practice tests) for
their students in a sequence, define a detailed content and testing
parameters that correspond to the training organization‘s
specific ATPL, CPL or IR syllabus. The LMS allows full
customization of all parameters that the training organization
may need to modify to adjust the testing structure and/or content
to fit their specific needs (passing scores for tests, test
parameters, test content, etc.).
III. CONCLUSION
As said above, the training courses and instructor
guidance has an irreplaceable role in the pilot ground training
process. Using the Test Prep system in conjunction with the
traditional training materials brings benefits for both the
students and the instructors.
Instructors: Instructor can see detailed report of each
student‘s performance and can easily detect the most
problematic areas of the student. Based on these results, he/she
can adjust the lessons and provide appropriate guidance.
Creating study plans for the whole groups of students and using
eLearning features of the Test Prep system makes the
administration of the entire course much more effective.
Students: When using interactive Test Prep system,
the extensive statistics and reports help the students find out
how would they succeed at the official exams. The applications
for smart phones and tablets give a chance to study anytime and
anywhere. Explanations for each test question save the students
a lot of time, because they don‘t have to search for the right
page in the study book. And if there is a need for consultation,
the user comments are the right place where to look at.
For these and many other reasons, the Test Prep
system by Aviationexam has already earned its place on the list
of traditional ground training tools utilized by thousands of
students all over Europe during their pilot ground preparation.
This is evidenced by countless positive testimonials and
growing number of training organizations using Aviationexam
Test Prep system.
REFERENCES
AVIATIONEXAM s.r.o. AVIATIONEXAM.com [online].
2013 [cit. 2013-05-27]. Dostupné z:
https://www.aviationexam.com
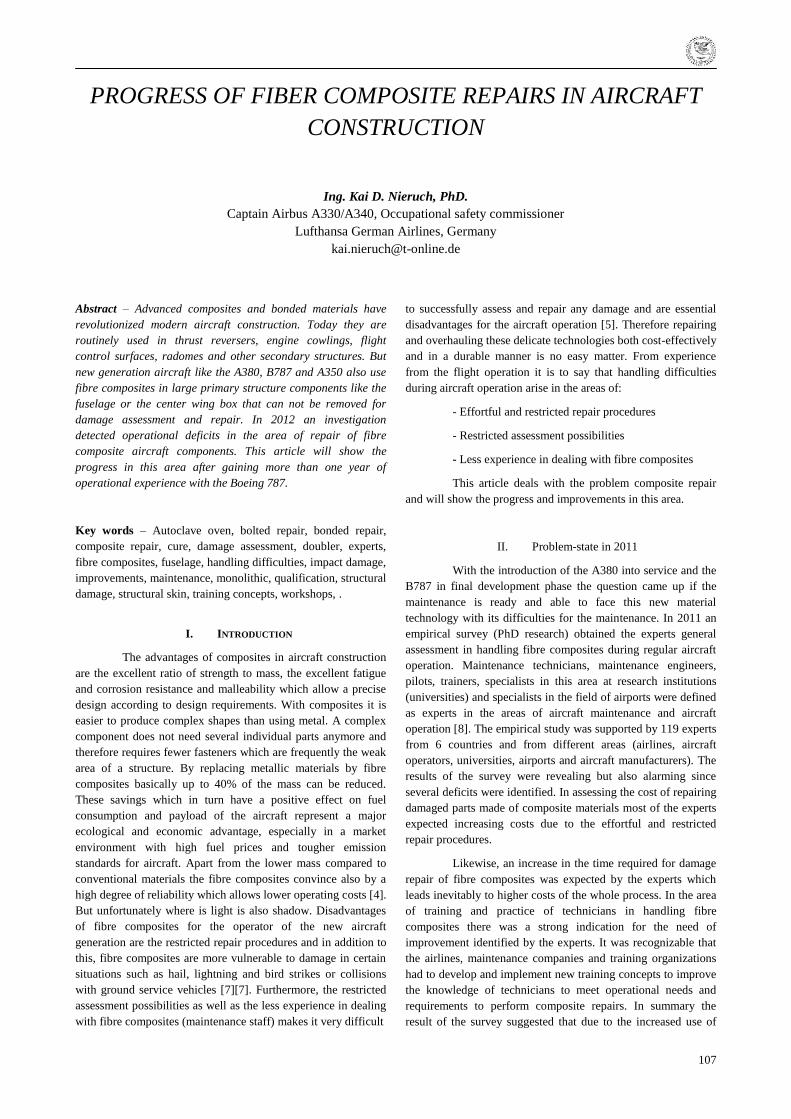
107
PROGRESS OF FIBER COMPOSITE REPAIRS IN AIRCRAFT
CONSTRUCTION
Ing. Kai D. Nieruch, PhD.
Captain Airbus A330/A340, Occupational safety commissioner
Lufthansa German Airlines, Germany
Abstract – Advanced composites and bonded materials have
revolutionized modern aircraft construction. Today they are
routinely used in thrust reversers, engine cowlings, flight
control surfaces, radomes and other secondary structures. But
new generation aircraft like the A380, B787 and A350 also use
fibre composites in large primary structure components like the
fuselage or the center wing box that can not be removed for
damage assessment and repair. In 2012 an investigation
detected operational deficits in the area of repair of fibre
composite aircraft components. This article will show the
progress in this area after gaining more than one year of
operational experience with the Boeing 787.
Key words – Autoclave oven, bolted repair, bonded repair,
composite repair, cure, damage assessment, doubler, experts,
fibre composites, fuselage, handling difficulties, impact damage,
improvements, maintenance, monolithic, qualification, structural
damage, structural skin, training concepts, workshops, .
I. INTRODUCTION
The advantages of composites in aircraft construction
are the excellent ratio of strength to mass, the excellent fatigue
and corrosion resistance and malleability which allow a precise
design according to design requirements. With composites it is
easier to produce complex shapes than using metal. A complex
component does not need several individual parts anymore and
therefore requires fewer fasteners which are frequently the weak
area of a structure. By replacing metallic materials by fibre
composites basically up to 40% of the mass can be reduced.
These savings which in turn have a positive effect on fuel
consumption and payload of the aircraft represent a major
ecological and economic advantage, especially in a market
environment with high fuel prices and tougher emission
standards for aircraft. Apart from the lower mass compared to
conventional materials the fibre composites convince also by a
high degree of reliability which allows lower operating costs [4].
But unfortunately where is light is also shadow. Disadvantages
of fibre composites for the operator of the new aircraft
generation are the restricted repair procedures and in addition to
this, fibre composites are more vulnerable to damage in certain
situations such as hail, lightning and bird strikes or collisions
with ground service vehicles [7][7]. Furthermore, the restricted
assessment possibilities as well as the less experience in dealing
with fibre composites (maintenance staff) makes it very difficult
to successfully assess and repair any damage and are essential
disadvantages for the aircraft operation [5]. Therefore repairing
and overhauling these delicate technologies both cost-effectively
and in a durable manner is no easy matter. From experience
from the flight operation it is to say that handling difficulties
during aircraft operation arise in the areas of:
- Effortful and restricted repair procedures
- Restricted assessment possibilities
- Less experience in dealing with fibre composites
This article deals with the problem composite repair
and will show the progress and improvements in this area.
II. Problem-state in 2011
With the introduction of the A380 into service and the
B787 in final development phase the question came up if the
maintenance is ready and able to face this new material
technology with its difficulties for the maintenance. In 2011 an
empirical survey (PhD research) obtained the experts general
assessment in handling fibre composites during regular aircraft
operation. Maintenance technicians, maintenance engineers,
pilots, trainers, specialists in this area at research institutions
(universities) and specialists in the field of airports were defined
as experts in the areas of aircraft maintenance and aircraft
operation [8]. The empirical study was supported by 119 experts
from 6 countries and from different areas (airlines, aircraft
operators, universities, airports and aircraft manufacturers). The
results of the survey were revealing but also alarming since
several deficits were identified. In assessing the cost of repairing
damaged parts made of composite materials most of the experts
expected increasing costs due to the effortful and restricted
repair procedures.
Likewise, an increase in the time required for damage
repair of fibre composites was expected by the experts which
leads inevitably to higher costs of the whole process. In the area
of training and practice of technicians in handling fibre
composites there was a strong indication for the need of
improvement identified by the experts. It was recognizable that
the airlines, maintenance companies and training organizations
had to develop and implement new training concepts to improve
the knowledge of technicians to meet operational needs and
requirements to perform composite repairs. In summary the
result of the survey suggested that due to the increased use of
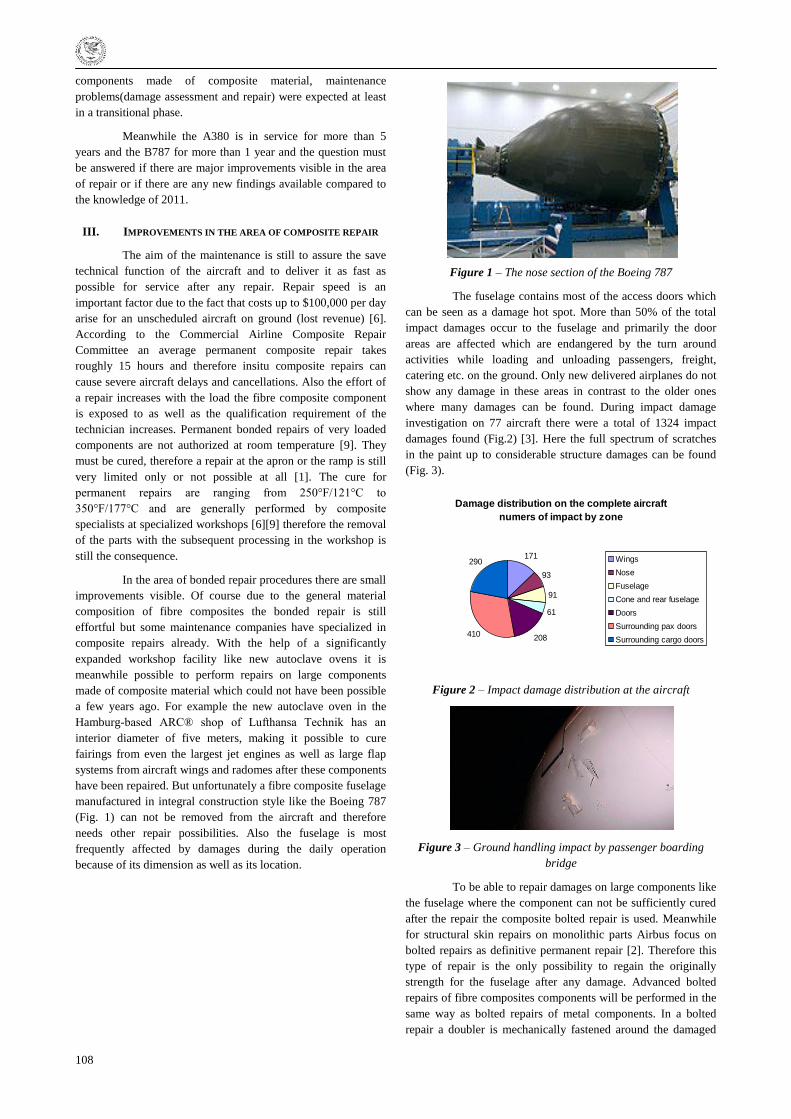
108
components made of composite material, maintenance
problems(damage assessment and repair) were expected at least
in a transitional phase.
Meanwhile the A380 is in service for more than 5
years and the B787 for more than 1 year and the question must
be answered if there are major improvements visible in the area
of repair or if there are any new findings available compared to
the knowledge of 2011.
III. IMPROVEMENTS IN THE AREA OF COMPOSITE REPAIR
The aim of the maintenance is still to assure the save
technical function of the aircraft and to deliver it as fast as
possible for service after any repair. Repair speed is an
important factor due to the fact that costs up to $100,000 per day
arise for an unscheduled aircraft on ground (lost revenue) [6].
According to the Commercial Airline Composite Repair
Committee an average permanent composite repair takes
roughly 15 hours and therefore insitu composite repairs can
cause severe aircraft delays and cancellations. Also the effort of
a repair increases with the load the fibre composite component
is exposed to as well as the qualification requirement of the
technician increases. Permanent bonded repairs of very loaded
components are not authorized at room temperature [9]. They
must be cured, therefore a repair at the apron or the ramp is still
very limited only or not possible at all [1]. The cure for
permanent repairs are ranging from 250°F/121°C to
350°F/177°C and are generally performed by composite
specialists at specialized workshops [6][9] therefore the removal
of the parts with the subsequent processing in the workshop is
still the consequence.
In the area of bonded repair procedures there are small
improvements visible. Of course due to the general material
composition of fibre composites the bonded repair is still
effortful but some maintenance companies have specialized in
composite repairs already. With the help of a significantly
expanded workshop facility like new autoclave ovens it is
meanwhile possible to perform repairs on large components
made of composite material which could not have been possible
a few years ago. For example the new autoclave oven in the
Hamburg-based ARC® shop of Lufthansa Technik has an
interior diameter of five meters, making it possible to cure
fairings from even the largest jet engines as well as large flap
systems from aircraft wings and radomes after these components
have been repaired. But unfortunately a fibre composite fuselage
manufactured in integral construction style like the Boeing 787
(Fig. 1) can not be removed from the aircraft and therefore
needs other repair possibilities. Also the fuselage is most
frequently affected by damages during the daily operation
because of its dimension as well as its location.
Figure 1 – The nose section of the Boeing 787
The fuselage contains most of the access doors which
can be seen as a damage hot spot. More than 50% of the total
impact damages occur to the fuselage and primarily the door
areas are affected which are endangered by the turn around
activities while loading and unloading passengers, freight,
catering etc. on the ground. Only new delivered airplanes do not
show any damage in these areas in contrast to the older ones
where many damages can be found. During impact damage
investigation on 77 aircraft there were a total of 1324 impact
damages found (Fig.2) [3]. Here the full spectrum of scratches
in the paint up to considerable structure damages can be found
(Fig. 3).
Figure 2 – Impact damage distribution at the aircraft
Figure 3 – Ground handling impact by passenger boarding
bridge
To be able to repair damages on large components like
the fuselage where the component can not be sufficiently cured
after the repair the composite bolted repair is used. Meanwhile
for structural skin repairs on monolithic parts Airbus focus on
bolted repairs as definitive permanent repair [2]. Therefore this
type of repair is the only possibility to regain the originally
strength for the fuselage after any damage. Advanced bolted
repairs of fibre composites components will be performed in the
same way as bolted repairs of metal components. In a bolted
repair a doubler is mechanically fastened around the damaged
Damage distribution on the complete aircraft
numers of impact by zone
171
93
91
61
208410
290 Wings
Nose
Fuselage
Cone and rear fuselage
Doors
Surrounding pax doors
Surrounding cargo doors

109
area (Fig.4+5). But fasteners will also create stress
concentrations that can degrade the performance of the structure.
Today fibre composite bolted repair has already been service
proven on most aircraft types. Bolted repairs are damage
tolerant, permanent repairs and these repairs typically would be
carried out using a titanium doubler. The aircraft manufacturers
have also successfully tested carbon fibre patch materials and
specifying aluminum as an additional option. But with
aluminum additional steps have to be taken to inhibit a galvanic
connection between the aluminum and carbon fibre material [6]
therefore aluminum is only the second choice.
Figure 4 – Bolted fuselage stringer repair
Figure 5 – Fuselage skin repair with large external doubler
As an important improvement the further development
and certification of repair kits built from fibre composites
material has to be named and will be in future an important
choice for most of the bolted composite repairs. This is partly
because both the damaged component and the repair doubler is
build from the same material with corresponding similar
material behavior like the coefficient of expansion for example
and also because it is possible to produce doubler also for
concave or convex curved surfaces. The major improvement of
this repair type is to provide exactly prefabricated repair kits for
different areas of the aircraft. This results in a decisive time
advantage and delivers the aircraft more quickly for service after
a composite repair. The prefabrication process also assures the
best fit of the repair doubler. Through the resulting simplified
assembly cost savings can be achieved and the quality of the
repair is increased. The bolted repair method is in contrast to the
cure repair applicable outside the specialized workshops and far
away from the maintenance bases which is a major advantage
for the aircraft operation. Also a bolted repair requires less
repair equipment compared to a cure repair and also the skills
that are required to perform the repair are less extensive as those
that are required for the cure repair. Therefore also less qualified
technicians fare away from the specialized workshops of the
maintenance bases are able to successfully perform a composite
repair. Unfortunately the storage effort for the maintenance
repair organizations will increase due to the many different
specially formed repair kits but this is an acceptable
disadvantage compared to the many advantages.
IV. CONCLUSION
Summarized it can be said that in the area of
composite repairs a level has been reached, which allows to
successfully perform repairs on high loaded large aircraft
composite components in a reasonable time. On the one hand
this is possible today due to the specialization of the
maintenance organizations in fibre composite repairs
accompanied by significantly expanded workshop facility like
new autoclave ovens and additional training for some
technicians. On the other hand this is possible because of
improvements in the area of bolted repairs and the provision of
prefabricated repair kits. A few years ago this was still very
uncertain and therefore the scepticism of experts was high. Of
course it will take some more time to gain the same level of
knowledge and to reach a similar routine in performing
composite repairs as performing repairs to conventional
materials like aluminum for example but we have to consider
that this new material technology is a quantum leap similar to
the change from wood to aluminum nearly 100 years ago. An
important next step to improve the situation is to transfer the
necessary knowledge in dealing with fiber composite materials
from the well trained technicians in the specialized workshops to
the maintenance technicians working on airports far away from
the main maintenance bases. Unfortunately in this area there are
still deficits visible. Thus, the downtime of a damaged aircraft
can be reduced to an acceptable value and will increase the
operational reliability and thereby ensures the economy of the
new generation aircraft.
REFERENCES
[1] Baker A. A., Rose L. R. F., Jones R., Advances in the
Bonded Composite Repair of Metallic Aircraft, Elsevier
2002
[2] Calligaris A., Reparability, A350 XWB Structure CFG, 24-
26th September 2008
[3] Calligaris A., Robustness by design, A350 XWB Structure
CFG, 24-26th September 2008
[4] EADS, Verbundwerkstoffe in Luft- und Raumfahrt,
http://www.eads.com/1024/de/
madebyeads/endurance//composites.html, October 2008
[5] Ehrenstein (Hrsg.), Faserverbund-Kunststoffe – Werkstoffe,
Verarbeitung, Eigenschaften, Hanser 2006
[6] High Performance Composites, In-situ composite repair
builds on basics, October 2008
[7] http://www.fodnews.com/, Issues, information and actions
to help prevent foreign object damage, November 2007
[8] Nieruch K. D., Operational inspection methods of fibre
composite airframe structures used for maintenance, PhD
thesis, April 2012
[9] Structural Repair Manual Boeing B747, Repairs to
Composite Structures, Chapter 51-70-03 until 51-70-08

New Trends in Civil Aviation 2013
UNIVERSITY OF ŢILINA
The Faculty of Operation and Economics of Transport and Communications
Air Transport Department & Air Training and Education Center
CZECH TECHNICAL UNIVERSITY IN PRAGUE
Faculty of Transportation Sciences
Department of Air Transport
BRNO UNIVERSITY OF TECHNOLOGY
Faculty of Mechanical Engineering
Institute of Aerospace Engineering
Ţilina 21. – 22. June 2013
Authors Assoc. prof. Jaroslav Juračka, Prof. Antonín Kazda, Prof. Andrej Novák
Publisher AKADEMICKÉ NAKLADATELSTVÍ CERM, s. r. o. Brno
www.cerm.cz
Print FINAL TISK s. r. o. Olomučany
Published 2013
First edition
Number of issue 150
ISBN 978-80-7204-843-4