Rating Snowstorms Based on Travel Impacts Ernie Ostuno National Weather Service, GRR.
Upload
mandy-hancockCategory
view
220download
1description

©Texas Institute 2011
Impact of Nuclear Power Projects on Credit Ratings and
Creditor Recoveries Following Default of Investor Owned
Utilities Sponsoring Nuclear Projects
Assessing credit rating impact of nuclear power projects and recoveries by
creditors following default for United States investor owned utilities operating
nuclear power projects from 1960 to present
A Research Study by
September 1st, 2011
www.TexasInstitute.org

1
Table of Contents Introduction .................................................................................................................................................. 3
Acknowledgements ....................................................................................................................................... 3
Executive Summary ....................................................................................................................................... 3
Methodology ................................................................................................................................................. 4
Analysis of Credit Rating Impact of Nuclear Plant Development ................................................................. 6
Significance and Definition ....................................................................................................................... 6
Conclusion ................................................................................................................................................. 6
Technical Summary and Charts ................................................................................................................. 6
Default Events of Nuclear Power Sponsors .................................................................................................. 8
Significance and Definition ....................................................................................................................... 8
Conclusion ................................................................................................................................................. 9
Technical Summary and Charts ................................................................................................................. 9
Rating Transition Rates for Nuclear Power Investor Owned Utilities ......................................................... 12
Significance and Definition ..................................................................................................................... 12
Conclusion ............................................................................................................................................... 12
Technical Summary and Charts ............................................................................................................... 13
Historical Default Rates for Investor Owned Utilities ................................................................................. 14
Significance and Definition ..................................................................................................................... 14
Conclusion ............................................................................................................................................... 14
Technical Summary and Charts ............................................................................................................... 14
Rating Dynamics of Nuclear Power Defaulters ........................................................................................... 17
Significance and Definition ..................................................................................................................... 17
Conclusion ............................................................................................................................................... 17
Technical Summary and Charts ............................................................................................................... 17
Default Experience for Preferred Stock ...................................................................................................... 18
Significance and Definition ..................................................................................................................... 18
Conclusion ............................................................................................................................................... 18
Technical Summary and Charts ............................................................................................................... 18
Risk of Loss to Creditors .............................................................................................................................. 19
Significance and Definition ..................................................................................................................... 19

2
Conclusion ............................................................................................................................................... 19
Technical Summary and Discussion ........................................................................................................ 19
Value-Weighted Ultimate Recovery Rates.................................................................................................. 20
Significance and Definition ..................................................................................................................... 20
Conclusion ............................................................................................................................................... 20
Technical Summary and Charts ............................................................................................................... 20
Creditor Loss Using 30 Days Post Default Trading Price ............................................................................. 22
Significance and Definition ..................................................................................................................... 22
Conclusion ............................................................................................................................................... 22
Technical Summary and Charts ............................................................................................................... 22
Discussion Regarding Risk of Loss to Creditors ........................................................................................... 24
Condensed Information Regarding Specific Default Events of US Utilities with Nuclear Operations ........ 25
1) El Paso Electric Company, January 8, 1992 ......................................................................................... 25
2) Energy Future Holdings Corp., August 17, 2010 ................................................................................. 26
3) Pacific Gas & Electric Company, April 6, 2001 .................................................................................... 26
4) Public Service Company of New Hampshire, January 28, 1988.......................................................... 27
5) Southern California Edison Company, January 16, 2001 .................................................................... 27
6) Yankee Companies, Incorporated, June 30, 1987 .............................................................................. 28
Summary of Findings................................................................................................................................... 28
Appendices .................................................................................................................................................. 30
Table 1 Precedent Rating Actions for Utilities Attempted to Build Reactors .......................................... 30
Table 2 Precedent Rating Actions for Utilities Involved in Nuclear Construction ................................... 31
Table 3 Utilities Received Their Lowest Rating While Building Nuclear Plants ....................................... 32
Table 4 Rating Criteria of Agencies and Banks ....................................................................................... 33
Table 5 Moody's Rating Methodology for Electric Utilities ..................................................................... 34
Table 6 Moody’s Ratings Explanation for Long Term Obligation............................................................ 35
Table 7 The Average Cumulative Default Rates for Moody's Credit Ratings in 2007 by % ..................... 36
Definition of Terms ..................................................................................................................................... 37
References .................................................................................................................................................. 38

3
Introduction Recent controversy regarding the credit scores assigned by the Office of Management and Budget to
certain proposed nuclear power projects under the Loan Guarantee program of the Department of
Energy under Title XVII of the Energy Policy Act of 2005 (Title XVII) led us to review the literature
regarding credit risks associated with the announcement, construction, and operation of nuclear power
plants in the United States. We found recent white papers issued by the Nuclear Energy Institute (NEI),
the Congressional Budget Office and the Union of Concerned Scientists, but did not find any significant
academic literature on the subject1. Further, the white papers did not appear to be based upon an
analysis of the experience of investor owned utilities that announced construction of nuclear power
plants in the United States from 1960 to present, but rather seemed to be based upon statistical
information regarding the utility industry as a whole. We felt that we could add to the discussion
underway by providing an analysis based on the credit impact of nuclear plant development on investor
owned utilities in the United States during the period from 1960 to present as represented by a
database provided by Moody’s Investors Service.
Acknowledgements The Texas Institute in partnership with The University of Texas at Dallas would like to thank our
reviewers for their comments: Peter Bradford, Adjunct Professor at Vermont Law School; Mark Cooper,
Director of Research at Consumers Federation of America; and Kenneth Marks, Executive Vice President
at Coalition for Green Capital. A special thanks as well to our authors Monty Humble, Managing Director
of The Texas Institute and Yan Zhang as well as our research team of Dr. Feng Zhao, University of Texas
at Dallas and Jeremy Vickers Program Director of The Texas Institute.
Executive Summary In summary, based upon our examination of the Moody’s database for investor owned utilities that
announced plans to construct nuclear power projects, we found that:
The announcement of an intention to construct a new nuclear facility did not, by itself, result in
credit rating impact or increase risk of default for investor owned utilities operating in the
United States.
Commencement of construction of a new nuclear plant by an investor owned utility operating in
the United States carried an almost 70% probability that the utility would experience a rating
downgrade of uncertain magnitude.
1 Nuclear Energy Institute, Credit Subsidy Costs for New Nuclear Power Projects Receiving Department of Energy (DOE) Loan
Guarantees: An Analysis of DOE’s Methodology and Major Assumptions, NEI White Paper (Washington, D.C.: NEI, September
2010), available at www.nei.org/filefolder/CreditSubsidyCostWhitePaper.pdf. Congressional Budget Office, Federal Loan
Guarantees for the Construction of Nuclear Power Plants (August 2011); and David Schlissel, Michael Mullett, and Robert
Alvarez, Nuclear Loan Guarantees: Another Taxpayer Bailout Ahead? (Cambridge, Mass.: Union of Concerned Scientists
Publications, March 2009).

4
Three (5.8%) of 52 investor owned utilities operating nuclear plants in the United States
defaulted soon after completion of construction as a result of disallowance of construction costs
as imprudently incurred by their state regulators.
Senior secured creditors of defaulting investor owned utilities that operated nuclear facilities in
the United States recovered an average of 83.9% of the amounts owed, considering only the
three nuclear plant operators that defaulted soon after completion of construction.
Based upon the three defaults, the indicated expected cumulative loss to a creditor from a
portfolio of 20 year maturity senior bonds of nuclear plant sponsors would be $1.15 per $1000
in credit extended (using value of principal to calculate percentages, assuming the creditor held
to ultimate resolution of the default, and including only the three described defaults).
Three other utilities that operated nuclear facilities defaulted many years after completion of
construction of the nuclear plants as a result of events unrelated to nuclear plant ownership and
operations.
Senior secured creditors of the six defaulting investor owned utilities that operated nuclear
facilities in the United States recovered a substantial portion of the amounts owed, depending
upon the specific factors taken into account, up to 97.8% (using value of principal to calculate
percentages, assuming the creditor held to ultimate resolution of the default, and including
strategic defaults).
Based upon the six defaults, the indicated expected cumulative loss to a creditor from a
portfolio of 20 year maturity senior bonds of nuclear plant sponsors would be $0.221 per $1000
in credit extended (again, using value of principal to calculate percentages, assuming the
creditor held to ultimate resolution of the default, and including all six defaults).
Based upon these findings, an investor would have been well advised to avoid owning debt of
investor owned utilities during the period immediately following completion of a nuclear power
project.
Methodology Based on historical data supplied by Moody’s Investor Service and additional research from other
sources, we reviewed default events, default rates, and recovery rates for all U.S. investor owned
utilities that were nuclear plant sponsors from 1960 to the present time. We identified all changes in
credit ratings assigned to investor owned nuclear plant sponsors to determine whether there was a
correlation between nuclear plant announcements, construction or operation and rating changes.
Further, we analyzed each of the default events of investor owned nuclear plant sponsors and provide a
brief description of the default event. We studied all default and other negative credit rating events
affecting investor owned nuclear plant sponsors, and examined whether those negative events had
been forecast by Moody’s ratings.
We excluded from our analysis rating events and defaults by federal, state and local government owned
utilities and electric cooperative owned utilities. In the case of government owned utilities, the single

5
default by the Washington Public Power Supply System, although financially significant, was not
statistically significant2. In the case of electric cooperatives, there does not appear to be a publicly
available source that provides sufficiently detailed information regarding total credit extended or credit
losses to permit meaningful analysis, despite that fact that it appears from GAO reports3 that this class
of borrower produced the largest creditor losses of any nuclear plant sponsor class, based upon changes
in balances owed to the United States’ Rural Utilities Service by electric cooperatives during the 1990s.
We also excluded from our analysis debt that had not been assigned a public rating by Moody’s, a factor
that could have had a significant impact on the percentage calculations with respect to probability of
default and recovery because of the large amount of privately placed debt of Energy Future Holdings.
However, we were not able to obtain comparable information regarding privately placed debt with
respect to other nuclear plant sponsors and thus were not able to make meaningful calculations using
the information regarding privately placed debt with respect to Energy Future Holdings alone.
Finally, the significant changes in the structure of the United States wholesale and retail power markets
since the enactment of the Energy Policy Act of 1992, and the adoption of Federal Energy Regulatory
Commission Order 888, and individual state restructuring of electric markets may have implications for
the credit risk associated with nuclear plant development in the future, particularly for entities seeking
to build new reactors in deregulated markets, but we are not aware of any nuclear plants constructed in
the past in the United States that commenced operation in a deregulated power market and thus could
not assess possible ratings impacts, default risks or potential creditor losses in markets where nuclear
power plants would be exposed to wholesale power market competition.
Under the regulatory regime in effect when the previous generation of nuclear plant construction was
undertaken, investor owned utilities were monopolies that controlled generation, transmission,
distribution, and customer services within defined, legally protected, service areas. As a consequence of
dedicating their property to public service, the utilities were required to provide reliable service to all
customers, but were entitled to a rate of return on property prudently acquired that was used or useful
in providing the public service. This rate of return, plus a captive customer base, virtually assured that a
utility would earn enough to repay its creditors, unless it incurred costs imprudently or acquired
unnecessary property. Three of the defaults by owners of nuclear plants that are discussed below
resulted from determinations by regulators that nuclear plant costs had not been prudently incurred.
The remaining three, more recent, defaults all occurred in unregulated markets where utilities are no
longer granted monopolies for generation assets. The absence of regulated monopoly status would be a
significant change in the conditions surrounding a nuclear plant, and we would hesitate to apply our
findings discussed herein to such a changed environment without further research. We believe that our
research continues to be applicable to traditionally regulated utility markets.
2 in at least one case, a municipal utility was relieved of its obligations with respect to a nuclear power plant through an
agreement with the investor owned utility sponsor of the plant during the investor owned utility’s bankruptcy proceedings.
3 Federal Electricity Activities: The Federal Government’s Net Cost and Potential for Future Losses (GAO/Al&ID-97-110,
September 19,1997).

6
Analysis of Credit Rating Impact of Nuclear Plant Development
Significance and Definition A credit rating is a formal opinion given by a rating agency of the potential default risk faced by investing
in a particular issue of debt securities. Moody's is one of the three general purpose nationally
recognized statistical rating organizations in the U.S. (See Table 7 for Moody's definition of rating scale).
The rating process begins when a rating agency receives a formal request from an entity planning to
issue a bond. The request for a rating is made because without one, it would be difficult for the entity to
market a bond issue to the public. Once a credit rating is assigned, the rating agency monitors the credit
quality of the issuer and can reassign a different credit rating to the bond. An "upgrade" occurs when
there is an improvement in the credit quality of an issue; a "downgrade" occurs then there is
deterioration in the credit quality of an issue. A downgrade of an issue or issuer may increase the credit
spread and result in a decline in the market price of the issuer's bonds.
Conclusion From a credit perspective, the risks of building new nuclear plants are notable, entailing significantly
higher operating risk, with very high capital costs, and vulnerability to potential shifts in energy policy.
Historically, 69% nuclear power project sponsoring utilities suffered rating downgrades while building
these facilities and 52% of the nuclear power sponsors received their lowest rating during the
construction period.
Technical Summary and Charts As shown in Exhibit 1, 69% of investor-owned utilities suffered rating downgrades while constructing
nuclear power plants. Of 52 utilities that completed nuclear plants (operating and shutdown, but not
including test sites) during their construction period, seven utilities received rating upgrades, nine
utilities were unchanged and the other 36 suffered downgrades.
Exhibit 1: Rating migrations for IOUs while constructing nuclear power plants
The issuers on average fell 3 credit rating notches and the issuer with the greatest rating change, Long
Island Lighting Company, fell 12 notches, from Aa2 in 1972 to B2 in 1984. All of these ratings were
evaluated on Moody’s assigned issuer rating, which is the issuer’s senior long term debt rating using the
update algorithm.
Upgraded No change Downgraded
7 9 36
13% 17% 69%

7
We define a utility’s nuclear plant construction period as from the date a construction permit was issued
to the date of commercial operation. We examined the data from 1960 to February 2011 and discovered
that half (52%) of the nuclear power sponsors received their lowest rating during their nuclear plant
construction period. The average length of time needed to build a nuclear power facility is 104.6
months, which is approximately 17% of the time period reviewed.
Exhibit 3: Half of IOUs received their lowest rating during nuclear plant construction period
There were 46 utilities that eventually canceled at least one of their planned nuclear reactors. Eight of
those utilities canceled their only planned reactor. That is, these 8 utilities merely announced plans to
build nuclear plants but did not receive a construction license to begin any nuclear plant construction.
The credit rating trend for these 8 utilities is normal, although the small sample size prevents statistically
meaningful conclusions.
Exhibit 4: Rating trends for utilities which announced nuclear power plant construction
0
2
4
6
8
10
12
Exhibit 2: Rating changes during last nuclear building cycle
Average Construction length 105 Months Lowest Rating Received 27
Data scope from 1960 to 2011 615 Months Total Utilities 52
17% 52%

8
Historical data suggests that nuclear power announcements did not necessarily bring negative rating
impact on sponsors, but the actual construction activities did increase ratings pressure on sponsors.
This is consistent with the hypothesis that very large capital expenditures required for nuclear power
plant construction combined with the uncertainty associated with the last nuclear plant construction
cycle would materially increase the sponsor’s operating risk in the view of rating agencies (See rating
criteria for rating agencies and banks in Table 5 of Appendix).
A further specific examination on Moody's rating methodology of regulated electric utilities and
unregulated electric utilities (Table 6 of Appendix) clearly illustrates that although nuclear power
construction may enjoy some political and regulatory support, the issuer's rating would be seriously
affected by a number of other factors, especially the financial metrics. The multi-billion size of the
investments and sizeable sunk costs could undoubtedly introduce material financial distress for almost
any issuer. These impacts could overcome regulatory support in the form of rate of return regulation
and service area monopolies, as well as tax incentives and other financial support available as a result of
the job creation and tax base expansion likely to result from new nuclear plant construction.
Default Events of Nuclear Power Sponsors
Significance and Definition Here we use the same definition for default as Moody’s Default Risk Service and its other risk
management products. Moody's definition of default includes three types of credit events:
A missed or delayed disbursement of interest and/or principal, including delayed payments
made within a grace period
Bankruptcy, administration, legal receivership, or other legal blocks (perhaps by regulators) to
the timely payment of interest and/or principal
A distressed exchange occurs where: (i) The issuer offers debt holders a new security or
package of securities that amount to a diminished financial obligation (such as preferred or
common stock, or debt with a lower coupon or par amount, lower seniority, or longer maturity);
or (ii) the exchange had the apparent purpose of helping the borrower avoid default.
Upgrade No change Downgrade
Completed 7 9 36
13% 17% 69%
Canceled 2 3 3
25% 38% 38%

9
Conclusion Six investor owned utilities that sponsored nuclear power projects have defaulted on debt rated by
Moody’s4 since 1960. None of the defaulting utilities was liquated, and two of these defaults can be
characterized as strategic defaults. We define a strategic default as one initiated by a borrower that is
capable of servicing its indebtedness as it comes due, but chooses to default in order to address other
liabilities. In these cases, because the debtor defaults when it still has substantial resources, the likely
outcome is payment in full for the senior creditors once the other liability issues have been resolved.
Technical Summary and Charts Based upon a review of available sources, no investor owned utilities that announced plans to build a
nuclear reactor, but abandoned the plans prior to commencement of construction experienced a
default. Further, it does not appear that any investor owned utility that commenced construction of a
nuclear reactor experienced a default prior to completion of construction of the nuclear reactor, despite
substantial construction delays and cost overruns for a number of nuclear projects.
The absence of defaults during plant construction and the three defaults that occurred shortly following
plant completion merits some discussion. As stated in the introduction, at the time that nuclear plant
construction was commenced in the United States, utilities were permitted monopolies in their service
areas, but their rates were regulated. The utilities were generally allowed to charge their customers an
amount that was expected to provide for their cost of providing service plus a return on the assets that
were used or useful in providing service to customers, limited by a requirement that the costs be
prudently incurred. Assets under construction were not permitted to earn a rate of return until they
were placed in service. Instead, utilities funded debt service on assets under construction by borrowing
additional amounts, so that no utilities defaulted during construction since they continued to borrow to
pay debt service. When construction was completed, nuclear plant owners sought to increase their
charges to customers to recover a return on the nuclear plant investments. In a number of cases, the
utility regulators concluded that nuclear plant construction costs had not been prudently incurred and
denied the utilities permission to recover the imprudently incurred costs. The three utilities that
defaulted shortly after completion of nuclear plants lacked other resources (either shareholder equity or
revenues from other sources) from which to pay debt service on the disallowed costs and defaulted as a
result.
There were six investor owned utilities that experienced defaults during the period of nuclear plant
ownership. The three most recent of those defaults, however, occurred for reasons that appear to be
substantially unrelated to their nuclear plant ownership. In particular, both Pacific Gas & Electric
Company (PG&E) and Southern California Edison defaulted in 2001 as a result of the disastrous effects of
a California law deregulating the wholesale electricity industry. The law was viewed in hindsight as
4 As stated above, we limit our analysis to debt covered by the Moody’s database. That would exclude most privately placed
debt, as well as most high yield debt because many high yield (or junk) debt issues do not seek a credit rating from Moody’s.
We are aware of at least one bankruptcy by an issuer of unrated bonds related to the Seabrook nuclear project, as well as one
case where Public Service New Hampshire while in bankruptcy assumed the power purchase obligations of a municipal utility.

10
having been flawed, and the implementation scheme was subject to manipulation by power marketing
companies who earned substantial profits at the expense of the utilities. The last case involved Energy
Future Holdings, which has vigorously denied that its voluntary exchange of debt instruments with its
creditors constituted a default at all. We treat it as a default because Moody’s has classified it as a
default. However the event is classified, its cause is the leveraged buyout of Texas Utilities in 2007, and
the significant decline in natural gas prices in the Energy Future Holdings service area since mid-2008,
not nuclear plant operations, which have continued in the same manner since Comanche Peak came on
line in the early 1990s.
Exhibit 5: Default events for nuclear power sponsors
The 52 utilities that undertook nuclear projects issued a total of $239 billion in senior secured debt and
$286 billion in senior unsecured debt during the study period. Not all of this debt was outstanding at
any one time, but all of it could potentially have been the subject of a default by the issuer of the debt.
For the same reason that we include all defaults that occurred in the period from 1960 to 2011, we
include the principal amount of all debt issued by investor owned utilities that owned nuclear plants
during the relevant period in our calculations.
Exhibit 6: Senior debt issued by nuclear power sponsors from 1960 to 2011
Nuclear Power SponsorsDefault
TimeDefault Type Resolution Type
1 El Paso Electric Company 1/8/1992 Chapter 11 Emerged from Chapter 11
2 Energy Future Holdings Corp. 8/17/2010 Distressed exchange
3 Pacific Gas & Electric Company 4/6/2001 Chapter 11 Reorganization plan confirmed
4Public Service Company of New
Hampshire1/28/1988 Chapter 11 Emerged from Chapter 11
5 Southern California Edison Company 1/16/2001Missed principal and
interest paymentsCreditors paid in full
6Yankee Companies, Incorporated,
The6/30/1987
Missed interest
payment
Decade Sr. Secured Sr. UnSecuredTotal
(in $million)
1960's 304 91 $395
1970's 2,499 - $2,499
1980's 49,608 15,351 $64,959
1990's 86,616 62,449 $149,065
2000's 90,206 191,966 $282,172
2010's 9,851 15,986 $25,837
Total (in $million) $239,084 $285,843

11
The six utilities that experienced a default constituted 11.5% of all nuclear plant sponsors, and their
$14.8 billion in senior debt, both secured and unsecured, outstanding at the time of default constituted
2.82% of all senior debt issued by investor owned utilities that sponsored nuclear plants in the United
States. If we exclude the three defaults by nuclear plant sponsors that do not appear to be related to
nuclear plants, 5.8% of all issuers, and 0.32% of all senior debt issued by investor owned utilities that
sponsored nuclear plants in the United States experienced a default.
Exhibit 7: Default amount of nuclear power defaulters
Compared to the observation on the larger class of global corporate issuers5, bankruptcy played a
significant role for nuclear power sponsors, accounting for 50% of initial defaults. El Paso Electric, PG&E
and Public Service Company of New Hampshire filed Chapter 11 and emerged from bankruptcy.
Southern California Edison and The Yankee Companies repaid their creditors in full following defaults,
but did not file bankruptcy. None of the defaulting utilities was liquidated, reflecting the traditional
monopoly status accorded to electric utilities and the essential nature of providing electric service to the
public, both of which made continued operation of the enterprise assets, rather than liquidation, the
preferred outcome of bankruptcy cases.
Exhibit 8: Default type of nuclear power sponsors
5 " Corporate Default and Recovery Rates, 1920-2007", February 2008
Default NumberDefaulted Senior Debt
(in $million)
Nuclear Power Defaulters 6 $14,783
11.5% 2.82%
Default due to
Nuclear Operations3 $1,700
5.8% 0.32%

12
Rating Transition Rates for Nuclear Power Investor Owned Utilities
Significance and Definition Consider a simple rating system with two rating classes A and B, and a default category Default. The
transition matrix for this rating system is a table listing the probabilities that a borrower rated A at the
start of a period has rating A, B or Default at the end of the period.
Exhibit 9: Structure of a transition matrix
Rating at end of period
A B Default
Rating at start of period
A Probability of Staying in A Probability of Migrating to B Probability of Default from A
B Probability of Migrating to A Probability of Staying in B Probability of Default from B
Rating agencies use a cohort approach to estimate transition probabilities through historical transition
frequencies. We also apply the cohort approach here to create a benchmark to evaluate the nuclear
power sponsors' performance.
Conclusion Although the rating system of nuclear power investor owned utilities is extremely stable, the inadequate
forecast for the two strategic defaults raises doubts with respect to the predictive power of Moody's
ratings.
0%
10%
20%
30%
40%
50%
60%
Global Corporate Issuers1970-2007
Nuclear Power Sponsors1960-2011
Distressed Exchange Bankruptcy Payment Default

13
Technical Summary and Charts The following table illustrates one year rating transition rates for all investor owned utilities during 1960
to present.
Since our data in the study period only has 52 issuers and has very limited C ratings samples, our
discussion is mainly focused on A and B classes. The one year rating transition matrix reflects two
findings:
First, the rating system of nuclear power investor owned utilities is extremely stable: their on-diagonal
entries are the highest, ranges from 72% to over 98%, and their ratings withdrawal rates are the lowest.
It illustrates that, compared to the larger class of regulated utilities6 or even to the largest class of all
nonfinancial corporations7, a relatively higher percentage of nuclear power sponsors remained at their
original rating and a lower percentage of nuclear power sponsors experienced a rating withdrawal.
Exhibit 10: Comparison of rating system for Nuclear IOUs, Regulated utilities and all corporations
Second, default frequencies for the best two rating classes are zero. This is consistent with their high
rating classes, since the default event for an Aaa or Aa class in a one year horizon is very rare. Due to the
two 2001 strategic defaults (PG&E and SCE), however, the A class default rate, 0.18% (compared to
0.003% to 0.037% for A rated category in Table 9), is abnormally high. Because most of nuclear power
sponsors are A rated or Baa rated, the result raises questions regarding the efficacy of Moody's rating
6 According to Moody’s, "Regulated electric and gas companies are a diverse universe in terms of business model (ranging from
vertically integrated to unbundled generation, transmission and/or distribution entities) and regulatory environment (ranging
from stable and predictable regulatory regimes to those that are less developed or undergoing significant change). " Our study
included regulated electric and gas utilities and excluded regulated electric and gas networks (companies primarily engaged in
the transmission and/or distribution of electricity and/or natural gas that do not serve retail customers). Municipal utilities and
electric cooperatives were also excluded.
7 " Corporate Default and Recovery Rates, 1920-2010" February 2011
1 Year Rating Transition Rates, 1960-2010
Aaa Aa A Baa Ba B Caa Ca-C Default WR
Aaa 98.04% 0.00% 1.96% 0.00% 0.00% 0.00% 0.00% 0.00% 0.00% 0.00%
Aa 0.00% 90.67% 9.00% 0.33% 0.00% 0.00% 0.00% 0.00% 0.00% 0.00%
A 0.09% 0.98% 92.64% 5.41% 0.35% 0.00% 0.18% 0.00% 0.00% 0.35%
Baa 0.00% 0.18% 3.78% 91.61% 3.87% 0.00% 0.09% 0.00% 0.00% 0.46%
Ba 0.00% 0.00% 0.29% 13.91% 82.03% 2.32% 0.58% 0.00% 0.00% 0.87%
B 0.00% 0.00% 0.00% 0.00% 20.45% 72.73% 2.27% 0.00% 2.27% 2.27%
Caa 0.00% 0.00% 0.00% 0.00% 33.33% 0.00% 44.44% 11.11% 11.11% 0.00%
Ca-C 0.00% 0.00% 0.00% 0.00% 0.00% 0.00% 0.00% 0.00% 50.00% 50.00%
Nuclear Power IOUs Regulated Utilities Nonfinancial Corporations
On-diagonal 72.7% to 98.0% 60.5% to 89.7% 74.2% to 86.6%
WR rate 0.4% to 2.2% 2.4% to 5.2% 4.7% to 10.7%
Rating Stablility Very Stable Stable Normal

14
system. The effect lasts for a long time. From exhibit 11, we can observe that the A class’s average
cumulative default rate is much higher than the lower class Baa’s average cumulative default rate. For
example, at a 20 year horizon, the average cumulative default rates for A rated utility is 1.95% verse
0.87% for Baa rated.
Exhibit 11: Average cumulative default rates for A-rated verse Baa-rated class
Historical Default Rates for Investor Owned Utilities
Significance and Definition In this section we compared our result with the default rates of all regulated utilities in Moody's
research report.
Conclusion Comparing our result to Moody's recent research report8, both the default rates of A rated nuclear
power investor owned utilities and Baa rated nuclear power investor owned utilities are lower than that
of all regulated utilities. No investor owned utilities experienced a default during the construction
period for a nuclear power project, although several experienced defaults immediately following
construction as a result of disallowance of cost recovery by regulators based upon the regulators’
findings that construction costs had been imprudently incurred .
Technical Summary and Charts Exhibit 12: Comparison for default rates between nuclear power IOUs and all regulated utilities
8 " Default, Recovery, and Credit Loss Rates for Regulated Utilities, 1983-2008", May 2009
0.00%
0.50%
1.00%
1.50%
2.00%
2.50%
1 2 3 4 5 6 7 8 9 10 11 12 13 14 15 16 17 18 19 20
A-rated IOUs has higher default rates than Baa-rated class
A rated IOUs Baa rated IOUs

15
When we remove the limitation of specific rating category, and then examine all nuclear power issuers
during the study period, the cumulative default rates of Nuclear Power sponsors appear to be much
lower than that of all regulated utilities.
Exhibit 13: Cumulative default rates for all rated issuers
0.00%
0.50%
1.00%
1.50%
2.00%
2.50%
3.00%
3.50%
4.00%
4.50%
5.00%
1 2 3 4 5 6 7 8 9 10 11 12 13 14 15 16 17 18 19 20
Default Rates for A-rated Nuclear power IOUs are low relative to A-rated Regulated Utilities
Nuclear Power IOUs Regulated Utilities
0.00%
0.50%
1.00%
1.50%
2.00%
2.50%
3.00%
3.50%
4.00%
4.50%
5.00%
1 2 3 4 5 6 7 8 9 10 11 12 13 14 15 16 17 18 19 20
Default Rates for Baa-rated Nuclear power IOUs are low relative to Baa-rated Regulated Utilities
Nuclear Power IOUs Regulated Utilities

16
If we exclude Energy Future Holdings, Southern California Edison and PG&E, each of which can be
argued to have defaulted for reasons completely unrelated to ownership of a nuclear facility, the
cumulative default rates come back to normal. The 20 year default rate of Baa rated utilities that own
nuclear projects is below 1.00%, this result is significantly lower than the comparable assumption of
Appendix C in Moody’s regulated utilities report.
Exhibit 14: Assume Energy Future Holdings, SCE and PG&E not default
0.00%
0.50%
1.00%
1.50%
2.00%
2.50%
3.00%
3.50%
4.00%
4.50%
1 2 3 4 5 6 7 8 9 10 11 12 13 14 15 16 17 18 19 20
Default Rates for All-rated Nuclear power IOUs are low relative to All-rated Regulated Utilities
Nuclear Power IOUs Regulated Utilities
0.00%
0.10%
0.20%
0.30%
0.40%
0.50%
0.60%
0.70%
0.80%
0.90%
1.00%
1 2 3 4 5 6 7 8 9 10 11 12 13 14 15 16 17 18 19 20
Default due to nuclear plant operations
A rated IOUs Baa rated IOUs

17
Rating Dynamics of Nuclear Power Defaulters
Significance and Definition We examined the characteristic of rating dynamics for all nuclear power defaulters.
Conclusion As illustrated in the following exhibit 15, nuclear power sponsors appear to default at relatively high
rating levels.
Technical Summary and Charts Exhibit 15: Rating changes prior default
At Default 1 month 6 months 1 year 2 years 3 years Default Date
El Paso Electric Company Ca B2 B1 Ba3 Ba3 Baa1 1/8/1992
Energy Future Holdings Corp. Caa2 Caa2 Caa2 Caa1 B3 8/17/2010
Pacific Gas & Electric Company Caa2 Caa2 A2 A2 A2 A2 4/6/2001
Public Service Company of New Hampshire C C Caa2 Caa2 Caa2 Caa2 1/28/1988
Southern California Edison Company Baa3 A2 A2 A2 A2 A2 1/16/2001
Yankee Companies, Incorporated, The Caa2 Caa2 B2 6/30/1987
Time Prior to DefaultDefaulter
3 years 2 years 1 year 6 months 1 month At Default
Rating Dynamics of Nuclear Power Defaulters
InvestmentGrade
Near Default
YankeeEnergy Future
Hampshire
El Paso
PG&E
SCE

18
Within 6 months prior to default, only two of these six defaulters (Energy Future Holdings Corp. and
Public Service Company of New Hampshire) had been downgraded to C grade; Pacific Gas & Electric
Company and Southern California Edison Company were even in an investment grade category, A2.
The high likelihood of unexpected strategic default definitely increases default risk of sponsors, and
probably would suggest that rating agencies should consider exogenous event risk (e.g., changes in
regulatory scheme) on investor-owned utilities in the future.
Default Experience for Preferred Stock
Significance and Definition Just as issuers may miss interest or principal payments on loans or bonds, they may also miss dividend
payments on preferred stock as well. Although preferred stock ranks below debt in a firm’s capital
structure, it usually has a number of debt-like characteristics. A dividend omission is also a significant
negative credit event.
Conclusion Historical statistics show that sponsors usually would receive a rating downgrade followed within a very
short period by a dividend omission of preferred stock. The extent of downgrade was about 1 to 2
notches.
Technical Summary and Charts Exhibit 16: Impairments for nuclear power sponsors
Based on Moody’s research report9, 45% dividend omissions of preferred stock (50 out of 110 dividend
omissions from 1983 to 2007) were followed by bond defaults. Within the scope of our study, El Paso
Electric Company and Public Service Company of New Hampshire are two of these five dividend
omissions (40%) followed by bond defaults.
9 " Corporate Default and Recovery Rates, 1920-2007", February 2008
Default_IssuerDividend
Omission
Distressed
ExchangeChapter 11
Missed
Payments
1 El Paso Electric Company √ √
2 Energy Future Holdings Corp. √
3 Entergy Gulf States Louisiana, LLC √
4 Entergy Louisiana, LLC √
5 Long Island Lighting Company √
6 Pacific Gas & Electric Company √ √
7 Public Service Company of New Hampshire √ √
8 Southern California Edison Company √
9 Yankee Companies, Incorporated, The √
Impairment Type

19
Exhibit 17: Rating changes followed by dividend omission
Historical statistics show that sponsors usually would receive a rating downgrade followed within a very
short period by a dividend omission of preferred stock. The extent of downgrade was about 1 to 2
notches.
Risk of Loss to Creditors
Significance and Definition An objective of this study is to describe the characteristics of nuclear power bond defaults in the U.S.
The most important attribute is the amount lost if an issuer defaults. For management of utilities and
investors in nuclear power sponsors, improved understanding of losses enables them to make better
decisions, to allocate capital more efficiently, and to obtain more accurate estimates of valuations of
existing debt. For government agencies, the benefit is a more informed decision about perspective
credit subsidy costs.
Conclusion While the rating impact of nuclear plant construction is significant for both investor owned utility
managers and investors, the risk of loss of principal is the ultimate concern for creditors.
Technical Summary and Discussion An often used methodology for measuring loss to creditors given default assumes that the creditor exits
the defaulted investment within 30 days following the default event. This is consistent with the
behavior of many investors in debt securities, and may be valuable information to those investors. We
analyzed the consequences of defaults using this method, but we also attempted to assess the ultimate
recovery for the creditor if the creditor held the debt instrument through the resolution of any
subsequent reorganization of the debtor, which is more likely to model the behavior of a guarantor such
as the United States government under the Title XVII loan guarantee program currently available to
sponsors of the construction of a limited number of new nuclear facilities.
Dividend Omission DownGrade Within Rating Changes Notches
El Paso Electric Company Y 2 weeks B1 to B2 -1
Entergy Gulf States Louisiana, LLC Y immediately Ba3 to B1 -1
Entergy Louisiana, LLC Y 1 week Ba1 to Ba3 -2
Long Island Lighting Company N
Public Service Company of New Hampshire Y 3 days B3 to Caa2 -2

20
Value-Weighted Ultimate Recovery Rates
Significance and Definition “Ultimate recoveries" refer to the recovery values that creditors actually receive at the resolution of a
default, usually at the time of emergence from Chapter 11 bankruptcy proceedings.
Conclusion The aggregate ultimate recovery rate for all six nuclear power defaulters are similar to all regulated
utilities, however, the ultimate recovery rate for the three utilities that defaulted due to nuclear plant
ownership is much lower.
Technical Summary and Charts Based upon the three cases where investor owned nuclear plant operators have experienced a default
attributable to disallowance of construction costs, the experience of creditors of nuclear plant operating
investor owned utilities is significantly worse than the experience of all bankrupt regulated utilities, with
creditors recovering only about 83.9% of the amounts owed. Based upon the six cases where investor
owned nuclear plant operators have experienced some form of default, the ultimate recovery rate by
creditors has been reasonably consistent with the experience of creditors of all bankrupt regulated
utilities, 98.5% for all defaulting regulated utilities versus 97.8% for those that operated nuclear plants.
However, there is certainly room for debate whether the three defaults not directly related to nuclear
plant operations should be excluded from the analysis, since defaults always arise from events that were
likely unexpected, at least by the creditor, at the time that the credit was extended. It may be most
reasonable to use the limited three default universe as a guide to decision making by utilities
considering nuclear plant ownership, since those three defaults seem to be attributable to nuclear plant
ownership, but to use the six default universe as a guide for potential guarantors because the guarantor
must also consider default risks beyond those related to nuclear plant ownership.
Exhibit 18: Ultimate recovery rate for nuclear power sponsors

21
Nuclear Power SponsorsDefault
TimeDefault Type
Ultimate
Recovery
El Paso Electric Company 1/8/1992 Chapter 11 98.33%
Energy Future Holdings Corp. 8/17/2010 Distressed exchange N/A
Pacific Gas & Electric Company 4/6/2001 Chapter 11 100%
Public Service Company of New
Hampshire1/28/1988 Chapter 11 77.41%
Southern California Edison
Company1/16/2001
Missed principal and
interest payments100%
Yankee Companies, Incorporated,
The6/30/1987 Missed interest payment N/A
Average for all defaulted IOUs 97.8%
Average for defaults due to nuclear operations 83.9%
98.5% 97.8%
83.9%
0.0%
10.0%
20.0%
30.0%
40.0%
50.0%
60.0%
70.0%
80.0%
90.0%
100.0%
Regulated Utilities1983-2009
Nuclear Power1960-2010
Defaults due to Nuclear Operations
Ultimate recovery

22
Creditor Loss Using 30 Days Post Default Trading Price
Significance and Definition The data available in Moody’s DRD allows us to analyze bond losses for all nuclear power sponsors
during the period of 1960 to 2010. LGD (loss given default) is defined as the 30 day post default trading
price, expressed as a percentage of par value.
Conclusion Only the two strategic defaulters (PGE and SCE) have recovery rates comparable with the class of
regulated utilities. Creditors of the remaining defaulters suffered much greater losses following the
default.
Technical Summary and Charts The definition of LGD applied to the unique set of nuclear power utilities defaults yields a loss given
default of 29.7%. In other words, based on past experience, an investor who sells its holdings of bonds
issued by a defaulting nuclear plant owner should expect to recover, on average, 70.3% of the default
amount for nuclear power bonds, specifically, 75.1% for senior secured bonds and 59.0% for senior
unsecured bonds. If we use value weighted recovery rate instead of issuer weighted recovery rate, a
more accurate estimate is 82.5% for senior secured bonds and 62.8% for senior unsecured bonds.
Exhibit 19: Comparison between nuclear power sponsors and all Moody's corporate issuers
In comparison with the larger class of Moody’s corporate issuers, we have two observations. First, the
recovery rate of nuclear power utilities is significantly higher than that of the broad class. Second, due to
the huge debt amount of nuclear power utilities, the difference between value weighted recovery rate
and issuer weighed recovery rate is also significant.
The difference between value weighted recovery rate and issuer weighted of nuclear power sponsors is
greater than that of all corporate issuers. That is because the defaulted amount is unevenly distributed
among all six defaulters. From the following exhibit 20, the two 2001 strategic defaults (PG&E and SCE)
involved defaults with respect to senior securities totaling $11.6 billion, which is two-thirds of all
defaulted debts. A strategic default is the decision by a borrower to default (i.e. stop making fixed
payments) on a debt despite having the financial ability to make the payments. Not surprisingly, the
creditors affected by these defaults had very high recovery rates, since the defaulting debtors had the
ability to repay their creditors.
Exhibit 20: Defaulted amount and type of defaulted debt
Corporate Issuers Nuclear Power Corporate Issuers Nuclear Power
1983-2010 1960-2010 1983-2010 1960-2010
Sr.Secured Bond 50.8% 75.1% 49.1% 82.5%
Sr.UnSecured Bond 36.7% 59.0% 37.4% 62.8%
Lien Position
Issuer-Weighted Value-Weighted

23
Exhibit 21: Recovery rates if we assume PG&E and SCE do not default
Above exhibit 21 shows that if we assume PE&G and SCE had not defaulted in 2001, as well as Energy
Future Holdings Corp. had not defaulted in 2010, nuclear power utilities still outperform the largest class
of all corporate issuers in the senior secured bonds. But how did they perform against the comparable
class of regulated utilities?
Exhibit 22: Comparison for nuclear power sponsors without strategic bankruptcies
Actually nuclear plant ownership does not necessarily guarantee more "senior security" to the issuer.
Only the two strategic defaulters have comparable performance of recovery rate against the bigger class
of regulated utilities. Other nuclear power “normal” defaulters suffered much bigger losses than their
peer companies. The above table shows that nuclear power defaulters without the 2 strategic defaults
only recovered 68.0% of Senior Secured Bonds and 43.9% of Senior Unsecured Bonds, which is much
lower than regulated utilities did.
$million
Company NameDefaulted
Amount
Senior
Secured
Senior
Unsecured
Senior
Secured
Senior
Unsecured
El Paso Electric Company $665.64 62.05% 56.27%
Energy Future Holdings Corp. $3,593.86 61.80% 62.18%
Pacific Gas & Electric Company $5,910.29 83.59% 61.33% 83.52% 60.87%
Public Service Company of New
Hampshire$1,420.88 70.79% 36.76% 79.01% 33.91%
Southern California Edison Company $5,709.40 86.73% 73.07% 87.35% 73.23%
Yankee Companies, Incorporated,
The$45.00 85.00% 85.00%
Issuer-Weighted Value-Weighted
Corporate Issuers Defaults due to Corporate Issuers Defaults due to
1983-2010 Nuclear Operations 1983-2010 Nuclear Operations
Sr.Secured Bond 50.8% 68.0% 49.1% 71.7%
Sr.UnSecured Bond 36.7% 36.8% 37.4% 33.9%
Lien Position
Issuer-Weighted Value-Weighted
Corporate Issuers Regulated Utilities Nuclear Power Nuclear Power W/O
1983-2010 1983-2009 1960-2010 Strategic Bankruptcy
Sr.Secured Bond 50.8% 83.7% 75.1% 68.0%
Sr.UnSecured Bond 36.7% 67.8% 59.0% 43.9%
Lien Position
Issuer-Weighted

24
Discussion Regarding Risk of Loss to Creditors The risk of loss to a creditor advancing funds to a sponsor of a proposed nuclear facility is a union of two
probabilities—first that the debt will default, and second that there will be a loss arising from that
default. As discussed above, the universe of defaulting nuclear plant sponsors is small and half of the
sponsors in that universe can be said to have defaulted for reasons unrelated to the fact that they were
sponsors of nuclear plants. That said, those defaults did occur, and illustrate real risks that face
creditors who advance funds to utilities, so we believe that the better side of the argument is that there
are six nuclear plant sponsoring utilities who have defaulted in the 51 year study period, roughly 11% of
the total. We also believe that since a sponsor default typically affects all of the debt issued by a
sponsor, it is appropriate to calculate the percentage risk to a creditor that the creditor’s portfolio of
debt instruments will be affected by a default using an average weighted by the dollar amounts of
defaulted debt.
Over our 51 year study period, the risk of default in any single year would be calculated to be around
0.17% or 0.0017. For a 20 year debt instrument, the cumulative risk would be around 1.00%. Now,
having concluded that we should include all six defaulting utilities in our calculation of risk of default, we
also conclude that we should include all six in our calculation of risk of loss, given default. Also, we
choose to use the ultimate recovery method for determining risk of loss, rather than 30 days post
default trading price methodology because we are more interested in assessing the question from the
perspective of a guarantor who guarantees payment, not one that indemnifies against risk of market
loss. Using that method, we derive a probability of loss given default of (1-0.978), or 2.2%.
83.7%
75.1%
68.0%67.8%
59.0%
43.9%
0.0%
10.0%
20.0%
30.0%
40.0%
50.0%
60.0%
70.0%
80.0%
90.0%
Regulated Utilities
1983-2009
Nuclear Power
1960-2010
Nuclear Power W/O
Strategic Bankruptcy
Sr.Secured Bond
Sr.UnSecured Bond

25
The product of these two probabilities is 0.000221, or 0.0221%, yielding an expected cumulative loss to
the creditor from a portfolio of 20 year maturity bonds issued by nuclear plant sponsors of $0.221 per
$1,000 in credit extended.
If we limit our analysis to those cases that clearly arise from nuclear plant ownership (i.e., we exclude
PG&E, SCE and Energy Future Holdings from the analysis), the expected portfolio loss rate is higher. The
one year probability of default on a principal weighted basis falls to 0.1%, and the 20 year probability of
default on a principal weighted basis falls to 0.71%. However, the risk of loss to senior secured creditors
given default rises to 16.1%, and the product of the two probabilities is thus increased to 0.114%, or a
cumulative loss expectation to the holder of a portfolio of 20 year maturity bonds issued by nuclear
plant sponsors of $1.15 per $1,000 invested.
We have not attempted to adjust this loss expectation to reflect the present value of losses based upon
the likelihood that loan losses will occur at particular points in the life of the loan. We do not believe
that the available data would support an attempt to refine the analysis to this level.
Condensed Information Regarding Specific Default Events of US Utilities
with Nuclear Operations
1) El Paso Electric Company, January 8, 1992
Created in 1901, El Paso Electric generates and provides electricity to approximately 250,000 customers
in El Paso and the Rio Grande Valley in Texas and in southern New Mexico. The company faced a
liquidity crisis directly related to its heavy investment in the Palo Verde Nuclear Generating Station in
Arizona. Development costs exceeded estimates considerably due to the unfamiliarity of management
with this type of project and changes in government regulations, primarily in reaction to the incident at
the Three Mile Island nuclear plant. Subject to regulations on rates enacted by the Public Utility
Commission of Texas (PUCT), the company was not allowed to include the total costs of its investment in
Palo Verde in determining its rates. Given the $550 million plus of debt obligations due at the end of
1991, El Paso was forced to restructure its debt. As a part of its restructuring plan, the company
requested a $131 million increase in rates in July 1991 from the PUCT. Although the Commission
subsequently ordered a $52 million increase, the increase was insufficient for El Paso Electric to meet its
obligations, and the company filed for bankruptcy protection.
Time Event_Description
9/19/1991 Annouced that it will not pay preferred stock dividends due 10/1/91
10/1/1991 Dividend omission
1/8/1992 Filed for Chapter 11 bankruptcy protection
9/8/1992 Filed reorganization plan
11/18/1992 Reorganization plan approved by bankruptcy court
2/12/1996 Emerged from bankruptcy

26
2) Energy Future Holdings Corp., August 17, 2010
On August 17, 2010, Energy Future Holdings Corp. successfully completed a debt restructuring of its
10.875% Senior Notes due 2017 and its 11.25% / 12.00% Senior PIK Toggle Notes due 2017. EFH
exchanged in aggregate principal amount approximately $1.428B of the 10.875% Senior Notes and
$2.166B of the 11.25% / 12.00% Senior PIK Toggle Notes for $2.18B of new 10.00% Senior Secured Notes
due 2020 issued by Energy Future Intermediate Holding Company, LLC and $499.7mm in cash. The
completion of the exchange effectively allowed EFH to reduce its overall net debt by approximately
$1.0B and to extend a portion of its maturities. Given the company’s very weak financial profile,
untenable capital structure, questionable long-term business plan, material operating headwinds, and a
loss of approximately 30% for investors who participated in the exchange, Moody’s views the
transaction as a distressed exchange, which is tantamount to default. Energy Future Holdings Corp.
generates, transmits, and distributes electricity in the greater north Texas region. EFH has two primary
operating subsidiaries: Oncor Electric Delivery Company, LLC and Texas Competitive Electric Holdings
Company, LLC.
3) Pacific Gas & Electric Company, April 6, 2001
On April 6, 2001, Pacific Gas & Electric Company filed for Chapter 11 following the company's inability to
reach consensus with government officials and regulators concerning the recovery of approximately $9
billion of under-collections related to the wholesale power market. In 1996, California was the first state
to deregulate its wholesale electricity market, while continuing to regulate retail electric rates. Under
the deregulation program (now widely considered to have been poorly designed), the state’s investor-
owned utilities sold most of their power generating plants, and then had to buy back that power at spot
market prices. Wholesale prices of electricity spiked and rolling blackouts occurred throughout the
state of California. Pacific Gas & Electric Company, headquartered in San Francisco, California, is the
state’s largest utility and is engaged principally in the business of providing electricity and natural gas
distribution.
Time Event_Description
8/17/2010 Distressed Exchange completed
Time Event_Description
1/17/2001 Missed payment on commercial paper
2/1/2001 Missed payment on commercial paper
3/16/2001 Announced that it would defer PG&E Capital Is quarterly distribution
payment on its 7.9% Cumulative Quarterly Income Preferred
Securities due on April 2, 20014/6/2001 Chapter 11
1/12/2004 Reorganization plan confirmed

27
4) Public Service Company of New Hampshire, January 28, 1988
Public Service Company of New Hampshire was the first major utility to file for bankruptcy protection
since the 1930s. It provided electric service to more than 400,000 homes and businesses, and was
headquartered in Manchester, NH. It had invested about $3 billion in the Seabrook Station nuclear
power generating facility. According to New Hampshire law, the investment in this facility could not be
included in the rate base until the plant was functional, which led to PSNH’s debt servicing problems.
PSNH emerged from bankruptcy on May 16, 1991, and was acquired by Northeast Utilities about a year
afterwards.
5) Southern California Edison Company, January 16, 2001
On January 16, 2001, Southern California Edison Company failed to honor interest and principal
payments on its public debts. In 1996, California was the first state to deregulate its electricity market.
Under deregulation, the state’s investor-owned utilities sold most of their power generating plants, and
Time Event_Description
4/19/1984 Dividend omission
10/15/1987 Interest default on 17.5% Debentures due 10/15/04
11/15/1987 Interest default on 15% Debentures due 11/15/03
1/28/1988 Chapter 11
2/1/1988 Interest default on 14.375% Debentures due 2/1/91
2/15/1988 Interest default on Deferred Interest Third Mortgage, Series A due
2/15/963/1/1988 Interest default on 9% First Mortgage, Series S due 3/1/04
3/15/1988 Interest default on 12% General and Refunding Mortgage, Series B
due 9/15/994/1/1988 Interest default on 6.125% First Mortgage, Series N due 10/1/96
and 15.75% Debentures due 10/1/884/15/1988 Interest default on 9.125% First Mortgage, Series V due 10/15/06
5/1/1988 Interest default on 7.125% First Mortgage, Series P due 11/1/98
and 9% First Mortgage, Series Q due 11/1/006/1/1988 Interest default anticipated on 6.25% First Mortgage, Series O due
6/1/97 and 17% General and Refunding Mortgage, Series D due
12/1/906/15/1988 Interest default anticipated on 7.625% First Mortgage, Series R due
6/15/02 and 18% General Refunding Mortgage, Series E due7/1/1988 Interest default anticipated on 4.625% First Mortgage, Series M due
7/1/927/15/1988 Interest default anticipated on 14.5% General and Refunding Series
C due 1/15/004/20/1990 Reorganization plan confirmed
Time Event_Description
1/16/2001 Missed principal and interest payments on maturing senior
notes; Failed to make interest payment on its senior notes
due 2006 and 2010 as well as its first mortgage notes due1/18/2001 Missed payment on maturing commercial paper and announced that
it would defer dividend payment on preferred stock6/1/2001 Missed interest paymen on its senior notes due 2001
2/8/2002 Creditors Paid in Full
3/1/2002 Credit Facility offer complete; creditors paid in full

28
then had to buy back that power at market prices. Wholesale prices of electricity spiked and rolling
blackouts occurred throughout the state of California. The company suffered from escalating financial
stress, which resulted from its inability to recover high market-priced wholesale power costs against the
legislatively frozen electric retail rates. Southern California Edison, headquartered in Rosemead,
California, is California’s second largest utility and serves southern California.
6) Yankee Companies, Incorporated, June 30, 1987
On June 30, 1987, Yankee Companies, Inc. missed interest payments on Senior Secured Bonds. The
Yankee Companies included Connecticut Yankee Atomic Power Company, Maine Yankee Atomic Power
Company, Massachusetts Yankee Atomic Power Company, Vermont Yankee Atomic Operating Company,
and Yankee Atomic Electric Company. The nuclear generating plants previously operated by these
companies are all decommissioned or in the process of being decommissioned.
Summary of Findings In summary, based upon our examination of the Moody’s database for investor owned utilities that
announced plans to construct nuclear power projects, we found that:
The announcement of an intention to construct a new nuclear facility did not, by itself, result in
credit rating impact or increase risk of default for investor owned utilities operating in the
United States.
Commencement of construction of a new nuclear plant by an investor owned utility operating in
the United States carried an almost 70% probability that the utility would experience a rating
downgrade of uncertain magnitude.
Commencement of operation of a nuclear facility arguably resulted in defaults by three (5.8%)
of 52 investor owned utilities operating in the United States, and an additional three utilities
that operated nuclear facilities also ultimately defaulted as a result of unrelated events.
Senior secured creditors of defaulting investor owned utilities that operated nuclear facilities in
the United States recovered a substantial portion of the amounts owed, depending upon the
specific factors taken into account, of up to 97.8% (using value of principal to calculate
percentages, assuming the creditor held to ultimate resolution of the default, and including
strategic defaults).
The indicated expected cumulative loss to a creditor from a portfolio of 20 year maturity senior
bonds of nuclear plant sponsors would be $0.221 per $1000 in credit extended (again, using
Time Event_Description
6/30/1987 Interest default
10/1/1987 Debt exchange offer
2/8/1988 Debt exchange for Yankee Gas, wholly owned subsidiary of the
Yankee Companies, Inc

29
value of principal to calculate percentages, assuming the creditor held to ultimate resolution of
the default, and including strategic defaults).
Based upon these findings, an investor would have been well advised to avoid owning debt of
investor owned utilities during the construction period for a nuclear power project. However,
owning debt of an investor owned utility following the conclusion of the rate case that
determined the costs allowable for ratemaking and commencement of operation of the nuclear
plant carried a relatively low risk of loss.
-- Monty Humble and Yan Zhang

30
Appendices
Table 1 Precedent Rating Actions for Utilities Attempted to Build Reactors This table examined Moody's rating actions for utilities who canceled their nuclear power plan. Table 3
examined Moody's rating actions for utilities who completed their nuclear power plant. Table 4
examined whether the utility received its lowest rating during the construction period.
Utilities Year Canceled Beginning Rating Notches
of Order Date Rating Change Moved
Delmarva Power & Light Company 1971 1975 A2 Baa2 -3
Duke Energy Ohio, Inc. 1969 1984 Aa2 Ba2 -9
New York State Electric and Gas Corporation 1967 1980 A2 Ba2 -6
Northern Indiana Public Service Company 1967 1981 A2 A2 0
Potomac Electric Power Company 1972 1977 Baa2 Baa2 0
Public Service Company of Indiana 1974 1985 A2 A2 0
Public Service Company of Oklahoma 1973 1982 A2 A1 1
Puget Sound Energy, Inc. (Old) 1973 1983 Ba2 Baa3 2
31
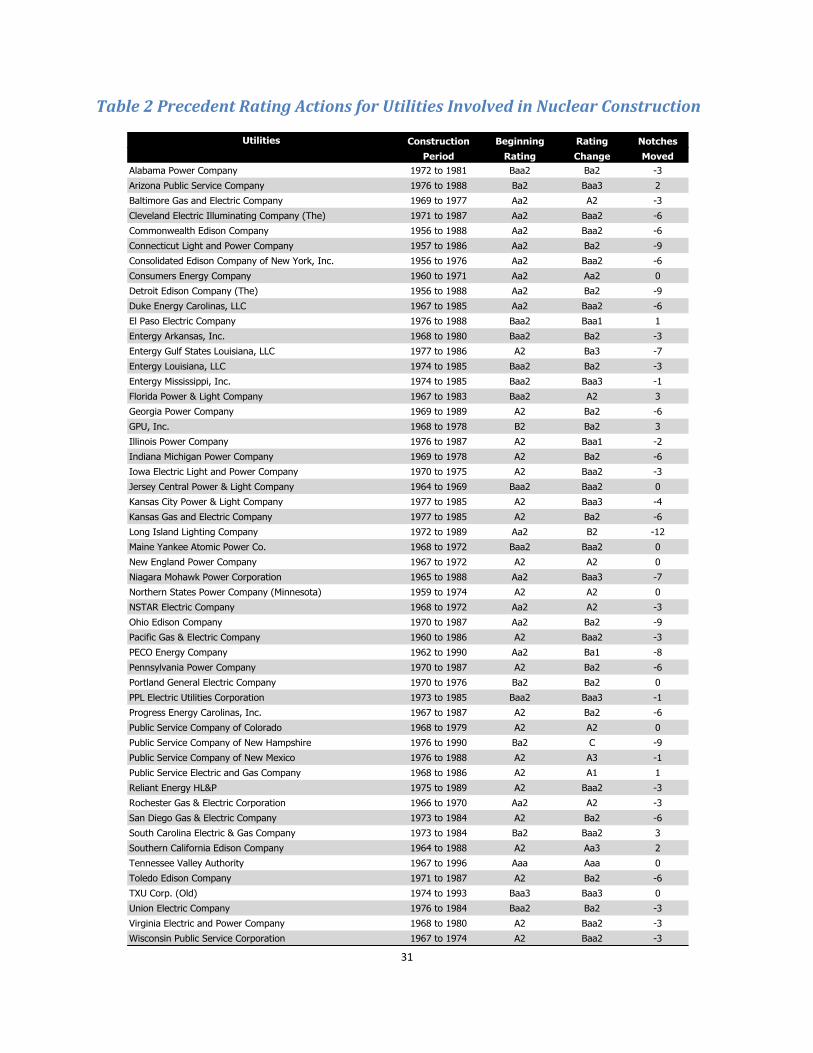
Table 2 Precedent Rating Actions for Utilities Involved in Nuclear Construction
Utilities Construction Beginning Rating Notches
Period Rating Change Moved
Alabama Power Company 1972 to 1981 Baa2 Ba2 -3
Arizona Public Service Company 1976 to 1988 Ba2 Baa3 2
Baltimore Gas and Electric Company 1969 to 1977 Aa2 A2 -3
Cleveland Electric Illuminating Company (The) 1971 to 1987 Aa2 Baa2 -6
Commonwealth Edison Company 1956 to 1988 Aa2 Baa2 -6
Connecticut Light and Power Company 1957 to 1986 Aa2 Ba2 -9
Consolidated Edison Company of New York, Inc. 1956 to 1976 Aa2 Baa2 -6
Consumers Energy Company 1960 to 1971 Aa2 Aa2 0
Detroit Edison Company (The) 1956 to 1988 Aa2 Ba2 -9
Duke Energy Carolinas, LLC 1967 to 1985 Aa2 Baa2 -6
El Paso Electric Company 1976 to 1988 Baa2 Baa1 1
Entergy Arkansas, Inc. 1968 to 1980 Baa2 Ba2 -3
Entergy Gulf States Louisiana, LLC 1977 to 1986 A2 Ba3 -7
Entergy Louisiana, LLC 1974 to 1985 Baa2 Ba2 -3
Entergy Mississippi, Inc. 1974 to 1985 Baa2 Baa3 -1
Florida Power & Light Company 1967 to 1983 Baa2 A2 3
Georgia Power Company 1969 to 1989 A2 Ba2 -6
GPU, Inc. 1968 to 1978 B2 Ba2 3
Illinois Power Company 1976 to 1987 A2 Baa1 -2
Indiana Michigan Power Company 1969 to 1978 A2 Ba2 -6
Iowa Electric Light and Power Company 1970 to 1975 A2 Baa2 -3
Jersey Central Power & Light Company 1964 to 1969 Baa2 Baa2 0
Kansas City Power & Light Company 1977 to 1985 A2 Baa3 -4
Kansas Gas and Electric Company 1977 to 1985 A2 Ba2 -6
Long Island Lighting Company 1972 to 1989 Aa2 B2 -12
Maine Yankee Atomic Power Co. 1968 to 1972 Baa2 Baa2 0
New England Power Company 1967 to 1972 A2 A2 0
Niagara Mohawk Power Corporation 1965 to 1988 Aa2 Baa3 -7
Northern States Power Company (Minnesota) 1959 to 1974 A2 A2 0
NSTAR Electric Company 1968 to 1972 Aa2 A2 -3
Ohio Edison Company 1970 to 1987 Aa2 Ba2 -9
Pacific Gas & Electric Company 1960 to 1986 A2 Baa2 -3
PECO Energy Company 1962 to 1990 Aa2 Ba1 -8
Pennsylvania Power Company 1970 to 1987 A2 Ba2 -6
Portland General Electric Company 1970 to 1976 Ba2 Ba2 0
PPL Electric Utilities Corporation 1973 to 1985 Baa2 Baa3 -1
Progress Energy Carolinas, Inc. 1967 to 1987 A2 Ba2 -6
Public Service Company of Colorado 1968 to 1979 A2 A2 0
Public Service Company of New Hampshire 1976 to 1990 Ba2 C -9
Public Service Company of New Mexico 1976 to 1988 A2 A3 -1
Public Service Electric and Gas Company 1968 to 1986 A2 A1 1
Reliant Energy HL&P 1975 to 1989 A2 Baa2 -3
Rochester Gas & Electric Corporation 1966 to 1970 Aa2 A2 -3
San Diego Gas & Electric Company 1973 to 1984 A2 Ba2 -6
South Carolina Electric & Gas Company 1973 to 1984 Ba2 Baa2 3
Southern California Edison Company 1964 to 1988 A2 Aa3 2
Tennessee Valley Authority 1967 to 1996 Aaa Aaa 0
Toledo Edison Company 1971 to 1987 A2 Ba2 -6
TXU Corp. (Old) 1974 to 1993 Baa3 Baa3 0
Union Electric Company 1976 to 1984 Baa2 Ba2 -3
Virginia Electric and Power Company 1968 to 1980 A2 Baa2 -3
Wisconsin Public Service Corporation 1967 to 1974 A2 Baa2 -3

32
Table 3 Utilities Received Their Lowest Rating While Building Nuclear Plants
Utilities Construction Lowest Reactors
Period Rating
Alabama Power Company 1972 to 1981 TRUE Farley
Arizona Public Service Company 1976 to 1988 TRUE Palo Verde
Baltimore Gas and Electric Company 1969 to 1977 Calvert Cliffs
Cleveland Electric Illuminating Company (The) 1971 to 1987 Beaver Valley / Davis-Besse /
PerryCommonwealth Edison Company 1956 to 1988
Braidwood / Byron / Dresden /
LaSalle / Quad Cities / Zion
Connecticut Light and Power Company 1957 to 1986 Millstone / Conn. Yankee /
Yankee Rowe
Consolidated Edison Company of New York, Inc. 1956 to 1976 TRUE Indian Point
Consumers Energy Company 1960 to 1971 Palisades / Big Rock
Detroit Edison Company (The) 1956 to 1988 TRUE Fermi
Duke Energy Carolinas, LLC 1967 to 1985 TRUE Catawba / McGuire / Oconee
El Paso Electric Company 1976 to 1988 Palo Verde
Entergy Arkansas, Inc. 1968 to 1980 Arkansas
Entergy Gulf States Louisiana, LLC 1977 to 1986 River Bend
Entergy Louisiana, LLC 1974 to 1985 Waterford
Entergy Mississippi, Inc. 1974 to 1985 Grand Gulf
Florida Power & Light Company 1967 to 1983 TRUECrystal River / St. Lucie / Turkey
Point
Georgia Power Company 1969 to 1989 TRUE Hatch / Vogtle
GPU, Inc. 1968 to 1978 TRUE Three Mile Island
Illinois Power Company 1976 to 1987 Clinton
Indiana Michigan Power Company 1969 to 1978 TRUE Cook
Iowa Electric Light and Power Company 1970 to 1975 Duane Arnold
Jersey Central Power & Light Company 1964 to 1969 Oyster Creek
Kansas City Power & Light Company 1977 to 1985 TRUE Wolf Creek
Kansas Gas and Electric Company 1977 to 1985 TRUE Wolf Creek
Long Island Lighting Company 1972 to 1989 TRUE Shoreham
Maine Yankee Atomic Power Co. 1968 to 1972 TRUE Maine Yankee
New England Power Company 1967 to 1972 Vermont Yankee
Niagara Mohawk Power Corporation 1965 to 1988 FitzPatrick / Nine Mile
Northern States Power Company (Minnesota) 1959 to 1974 Monticello / Prairie Island /
Pathfinder
NSTAR Electric Company 1968 to 1972 Pilgrim
Ohio Edison Company 1970 to 1987 TRUE Beaver Valley / Perry
Pacific Gas & Electric Company 1960 to 1986 Diablo Canyon / Humboldt Bay
PECO Energy Company 1962 to 1990 TRUE Limerick / Peach Bottom
Pennsylvania Power Company 1970 to 1987 TRUE Beaver Valley / Perry
Portland General Electric Company 1970 to 1976 TRUE Trojan
PPL Electric Utilities Corporation 1973 to 1985 TRUE Susquehanna
Progress Energy Carolinas, Inc. 1967 to 1987 TRUEBrunswick / H. B. Robinson /
Shearon Harris
Public Service Company of Colorado 1968 to 1979 Fort St. Vrain
Public Service Company of New Hampshire 1976 to 1990 TRUE Seabrook
Public Service Company of New Mexico 1976 to 1988 Palo Verde
Public Service Electric and Gas Company 1968 to 1986 Hope Creek / Salem
Reliant Energy HL&P 1975 to 1989 TRUE South Texas Project
Rochester Gas & Electric Corporation 1966 to 1970 Ginna
San Diego Gas & Electric Company 1973 to 1984 TRUE San Onofre
South Carolina Electric & Gas Company 1973 to 1984 TRUE Summer
Southern California Edison Company 1964 to 1988 Palo Verde / San Onofre
Tennessee Valley Authority 1967 to 1996 TRUEBrowns Ferry / Sequoyah Watts
Bar
Toledo Edison Company 1971 to 1987 Beaver Valley / Davis-Besse /
PerryTXU Corp. (Old) 1974 to 1993 Comanche Peak
Union Electric Company 1976 to 1984 TRUE Callaway
Virginia Electric and Power Company 1968 to 1980 TRUE North Anna / Surry
Wisconsin Public Service Corporation 1967 to 1974 TRUE Kewaunee / Point Beach

33
Table 4 Rating Criteria of Agencies and Banks
S&P Moody's Typical Banks
Financial risk:
·Balance sheet and P&L
·Financial policy
·Return
·Capital structure
·Cash-flow
·Financial flexibility
Financial risk:
·Cash-flow
·Liquidity
·Debt structure
·Equity and reserves
Economic situation:
·Earnings(Cash-flow, return,...)
·Financial situation (Capital structure, liquidity,...)
·Forecasts: earnings and liquidity
Business risk:
·Industry code
·Competitive situation
Competition and business risk:
·Relative market share,
·competitive position
·Diversification
·Turnover, costs, returns
·Sales and purchases
Business situation:
·Industry assessment
·USP and competition
·Product mix
·Special risks
Legal structure and legal risk:
·Consolidation of related firms
Legal structure
·Management Quality of management:
·Planning and controlling
·Managerial track record
·Organizational structure
·Entrepreneurial succession
Quality of management:
·Experience
·Succession
·Quality of accounting and controlling
Customer relationship Account management

34
Table 5 Moody's Rating Methodology for Electric Utilities
Broad Rating FactorsBroad Factor
WeightingRating Sub-Factor
Sub-Factor
Weighting
Regulatory Framework 25% 25%
Ability to Recover Costs and
Earn Returns25% 25%
Diversification 10% Market Position 5%
Generation and Fuel Diversity 5%
Financial Strength, 40% Liquidity 10%
Liquidity and Key Financial
MetricsCFO pre-WC / Debt 7.50%
CFO pre-WC + Interest /
Interest7.50%
CFO pre-WC - Dividends /
Debt7.50%
Debt / Capitalization or Debt /
Regulated Asset Value7.50%
Broad Rating FactorsBroad Factor
WeightingRating Sub-Factor
Sub-Factor
Weighting
Market Assessment, 25% Size and scale 15%
Scale and Competitive
Position
Competitive position and
market structure10%
Cash Flow Predictability of
Business Model25% Fuel strategy and mix 5%
Degree of integration and
hedging strategy5%
Capital requirements and
operational performance5%
Contribution from low-
risk/high risk business10%
Financial Policy 10% 10%
Financial Strength Metrics 40% Cash Flow / Debt 12.5%
Cash Flow Interest Coverage 10%
Retained Cash / Debt 12.5%
Free Cash Flow / Debt 5%
Rating Factor Weighting - Regulated Electric Utilities
Rating Factor Weighting - UnRegulated Electric Utilities
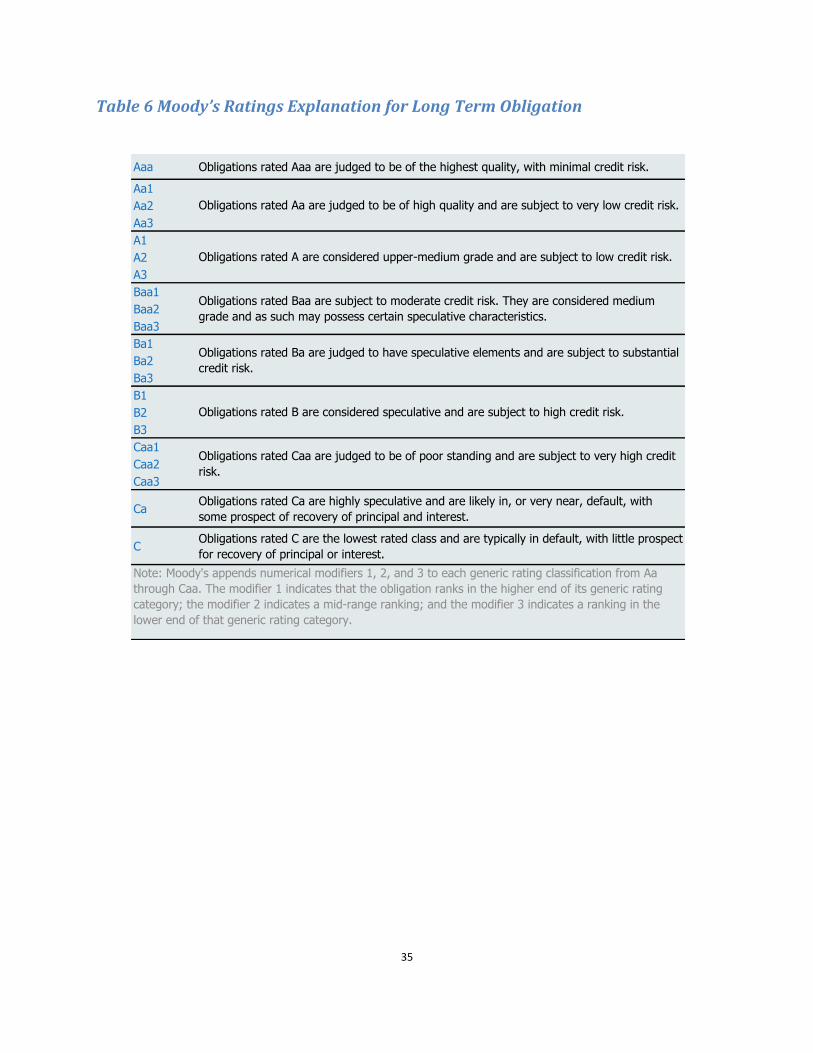
35
Table 6 Moody’s Ratings Explanation for Long Term Obligation
Aaa Obligations rated Aaa are judged to be of the highest quality, with minimal credit risk.
Aa1
Aa2
Aa3
A1
A2
A3
Baa1
Baa2
Baa3
Ba1
Ba2
Ba3
B1
B2
B3
Caa1
Caa2
Caa3
CaObligations rated Ca are highly speculative and are likely in, or very near, default, with
some prospect of recovery of principal and interest.
CObligations rated C are the lowest rated class and are typically in default, with little prospect
for recovery of principal or interest.
Note: Moody's appends numerical modifiers 1, 2, and 3 to each generic rating classification from Aa
through Caa. The modifier 1 indicates that the obligation ranks in the higher end of its generic rating
category; the modifier 2 indicates a mid-range ranking; and the modifier 3 indicates a ranking in the
lower end of that generic rating category.
Obligations rated Aa are judged to be of high quality and are subject to very low credit risk.
Obligations rated A are considered upper-medium grade and are subject to low credit risk.
Obligations rated Baa are subject to moderate credit risk. They are considered medium
grade and as such may possess certain speculative characteristics.
Obligations rated Ba are judged to have speculative elements and are subject to substantial
credit risk.
Obligations rated B are considered speculative and are subject to high credit risk.
Obligations rated Caa are judged to be of poor standing and are subject to very high credit
risk.

36
Table 7 The Average Cumulative Default Rates for Moody's Credit Ratings in
2007 by %
Rating Year 1 Year 5 Year 10
UST 0.000 0.000 0.000
AAA 0.000 0.085 0.208
Aa1 0.000 0.166 0.187
Aa2 0.000 0.232 0.588
Aa3 0.019 0.299 0.392
A1 0.003 0.416 0.792
A2 0.026 0.612 1.509
A3 0.037 0.657 1.397
Baa1 0.166 1.368 2.143
Baa2 0.161 2.053 4.893
Baa3 0.335 3.479 7.025
Ba1 0.753 6.417 10.806
Ba2 0.780 7.989 12.943
Ba3 2.069 16.529 25.596
B1 3.223 21.467 30.830
B2 5.457 23.805 28.405
B3 10.460 33.022 38.446
Caa-C 20.982 41.228 43.256

37
Definition of Terms
Terminology Explanation
Senior Debt
In the issuer's capital structure, senior debt is debt that takes priority over
other unsecured or otherwise "junior" debt. Senior debt is often secured or
backed by collateral on which the lender has put in place. In the event the
issuer goes bankrupt, senior debt must be repaid before other creditors
received any payments.
Chapter 11
When a business is unable to service its debt or pay its creditors, the
business or its creditors can file with a federal bankruptcy court for
protection under either Chapter 7 or Chapter 11.In Chapter 7 the business
ceases operations, a trustee sells all of its assets, and then distributes the
proceeds to its creditors. In Chapter 11, in most instances the debtor
remains in control of its business operations as a debtor in possession, and
is subject to the oversight and jurisdiction of the court.
WR- WithdrawWhen Moody’s no longer rates an obligation on which it previously
maintained a rating, the symbol WR is employed.
Impairment
A security is impaired when investors receive — or expect to receive with
near certainty — less value than would be expected if the obligor were not
experiencing financial distress or otherwise prevented from making
payments by a third party, even if the indenture or contractual agreement
does not provide the investor with a natural remedy for such events, such
as the right to press for bankruptcy.
LGD
The loss-given-default rate for a security is 100% minus the value that is
received at default resolution (which may occur at a single point in time or
accrue over an interval of time), discounted by the coupon rate back to
the date the last debt service payment was made, divided by the principal
outstanding at the date of the last debt service payment.
Cohort Apporach
A cohort comprises all obligors holding a given rating at the start of a
given period. In the cohort approach, the transition matrix is filled with
empirical transition frequencies.

38
References
Emery, K, Ou, S, Tennant, J, Kim, F and Cantor, R (2008). “Corporate Default and Recovery Rates, 1920-
2007.”
Figlewski, S, Frydman, H, Liang, W (2006) "Modeling the Effect of Macroeconomic Factors on Corporate
Default and Credit Rating Transitions"
Haggarty, M.G, Moss, M, Hess, W.L, Keller, T, Oosterveld, B (2009) "Regulated Electric and Gas Utilities."
Hempstead, J, Hess, W.L (2009). "U.S. Investor-Owned Electric Utilities."
Hurt, L, Felsovalyi, A (1998) "Measuring Loss on Latin American Defaulted Bank Loans."
Krahnen, J.P, Weber, M (2001) "Generally accepted rating principles: A primer."
Mackinlay, A.C (1997) "Event Studies in Economics and Finance"
Ou, S, Chiu, D, and Metz, A (2011). "Corporate Default and Recovery Rates, 1920-2010."
Sabatelle, A.J, Hess, W, Bisset, N (2009) "Unregulated Utilities and Power Companies."
Tennant, J and Emery, K (2009). “Default, Recovery, and Credit Loss Rates for Regulated Utilities, 1983-
2008.”