NEW SYSTEMS, OLD HABITS
34
NEW SYSTEMS, OLD HABITS Using Data from Continuous Emission Monitoring Systems in Coal-based Thermal Power Stations
Transcript of NEW SYSTEMS, OLD HABITS

NEW SYSTEMS, OLD HABITSUsing Data from Continuous Emission Monitoring Systems in Coal-based Thermal Power Stations

Research director: Nivit Kumar Yadav
Writer: Soundaram Ramanathan
Support: Dr D.D. Basu, Shobhit Srivastava and Shreya Verma
Editor: Archana Shankar
Layout: Kirpal Singh
Production: Rakesh Shrivastava and Gundhar Das
We would also like to thank the following people who shared their insights which were helpful in the consolidation of the report: Chirag Bhimani, Sudheesh Narayanan, Vikas Mehta, Santanu Sathpathy, B. Krishnakumar, Ashu Gupta and Sudeep Mamde.
© 2021 Centre for Science and Environment
Citation: NIvit Kumar Yadav and Soundaram Ramanathan 2021, New Systems, Old Habits: Using Data from Continuous Emission Monitoring Systems in Coal-based Thermal Power Stations, Centre for Science and Environment, New Delhi
Published byCentre for Science and Environment41, Tughlakabad Institutional AreaNew Delhi 110 062Phones: 91-11-40616000 Fax: 91-11-29955879E-mail: [email protected]: www.cseindia.org

NEW SYSTEMS, OLD HABITS
Using Data from Continuous Emission Monitoring Systems in Coal-based
Thermal Power Stations


5
Contents
1. Overview: What are continuous emission monitoring systems? 7
2. CEMS: The infrastructure in coal-based thermal power plants 9
3. Data availability 13
4. Data quality 17
5. Using CEMS data 22
6. International best practices 25
7. The way forward 29

6

7
Continuous emission monitoring systems (CEMS) are the equipment in chimneys used to measure and send data on pollutants such as particulate matter, sulphur dioxide and oxides of nitrogen in flue gas on a 24 x 7 basis.
The installation of CEMS in industries began in 2014 as per directions by the Central Pollution Control Board (CPCB) under Section 18(1) b of the Water Act, 1974 and the Air Act, 1981. According to this direction, all industries in the red category (highly polluting industries) must have CEMS installed. It is a legal requirement to have CEMS installed in coal-based thermal power stations.
The data collected by these systems is, however, now only used for self-reporting. This data is expected to aid the industry in terms of improving process parameters. The regulators do not use this information because the existing laws prohibits regulatory checks using this information. State Pollution Control Board however can chose to turn it into a compliance tool by bringing in necessary modifications.
Continuous monitoring helps both Pollution Control Boards (PCBs) and industry ensure that pollution levels are kept in check in real time. Industries can keep a track of abnormal pollution spikes if any, and make process changes to reduce pollution on a real-time basis. Also, PCBs, through continuous analysis of the data, can identify persistently defaulting industries and accordingly schedule their inspection. This means less human labour for the PCB and better monitoring.
In India, where resources are meagre and infrastructure weak, it is useful that CEMS is automated. Today, however, this data is only used to create warnings. Whenever a pollutant emitted by a power plant is over prescribed norms, PCBs send only SMSs. Based on the number of SMS warnings, plants plan inspection by manual sampling to identify whether they are defaulting. This is in contradiction to the CPCB and SPCB claims that the quality of CEMS data generated is poor and plants cannot be considered to be defaulting based on the data generated by these systems.
If the quality of CEMS data is poor, the regulators will ideally need to work to get them in order. In addition, the validity of CPCB and SPCB claims that they work on the data from CEMS and send SMS to defaulting plants is unverifiable, as this action taken by the regulators is not available in the public domain even as a brief. As a result, the data generated by these continuous systems is invalid in court and cannot therefore be used for compliance assessment and reporting.
1. Overview: What are continuous emission monitoring systems?

8
NEW SYSTEMS, OLD HABITS
PCBs and coal-based thermal power stations perform manual monitoring for the purpose of reporting in parallel with continuous emission monitoring. While servers are linked and data collected, it remains unused due to the lack of legal provisions.
According to the CSE survey of power stations in Maharashtra, coal-based thermal power stations, spend on average up to 7.5 per cent of their total project cost towards environmental management and protection. About 70 per cent of this expense is used in fly ash management, and the remainder is usually used to manually monitor emissions. Manual emission monitoring in thermal power stations occurs in a stack (chimney) at a height of 70 m. The area often lacks housekeeping, and it is hard for regulators or officials to monitor emissions periodically as the lift system and platforms are congested and not built appropriately. Personal protective equipment (PPE) kits and safety equipment are not maintained in most cases, increasing the risks associated with monitoring. Due to the complexity involved, regulators and power stations tend to avoid frequent manual monitoring.
It has been over six years since CEMS was built at coal-based thermal power plants. CSE believes the use of the data produced by these systems currently needs to be formalized. The use of CEMS data for regulatory purposes can ease pressure on boards and industry to control pollution. The current system of only sending SMSs of violations is insufficient use of such data and cannot aid in controlling pollution. The data must be put to use to enable meaningful action. To enable this, transparency in data on emission of pollutants from these facilities is essential in key sectors such as coal-based thermal power stations.
This paper attempts to understand the preparedness and gaps that need to be addressed in order to make CEMS data available for regulatory use. It covers the following aspects:1. The current scenario-in-place, data quality and CEMS infrastructure in Indian coal-based thermal power plants;2. Improvements that need to be made if this data is to be used regularly for
compliance;3. International best practices; and4. How to use the data to track compliance.

9
Is CEMS available in all the thermal power stations?About 205 GW of coal- and lignite-based utility thermal power stations operate in India.
It is a legal requirement for all coal- and lignite-based thermal power stations to install and operate CEMS. In 2016–20, Centre for Science and Environment carried out state-level surveys of utility power stations in close association with the Pollution Control Boards of Uttar Pradesh, Madhya Pradesh, Rajasthan, Punjab, Haryana, Maharashtra, Odisha and Karnataka. The ground surveys in these states revealed that they were equipped with CEMS in their stack to measure particulate matter, sulphur dioxide and oxides of nitrogen.
Consolidated information of data generation by these system as a national-level database is, however, unavailable in the public domain. Even broad analyses, such as the amount of data received and emission ranges, are not available. According to the Central Pollution Control Board (CPCB), they and SPCBs receive regular information on the emission by the power station however no one knows the quality and frequency of the data as it is never updated in the public domain.
The set-up Typically, two major instruments are available in a 200-m-tall chimney at a height of 70 m. One instrument measures particulate matter only and the other measures the gaseous pollutants sulphur dioxide and nitrogen oxides (see picture below).
2. CEMS—The infrastructure in coal-based thermal power plants
CSE
PH
OTO
LIB
RARY
, 202
1
Particulate
matter and gas
sensors installed
in a chimney

10
NEW SYSTEMS, OLD HABITS
The data generated from these systems is then transmitted continuously with the support of an IOT (internet of things) provider, which enables the power station to collect data from the CEMS sensors via data loggers (data storage systems) and upload it to the internet via a server network. IoT operators depend on a network of physical objects embedded with software in CEMS systems, electronics, networks, and sensors.
How are measurements made by these system?
Particulate matter Particles emitted from the combustion process include smoke, soot and ash. These particles are visible and can be measured by looking at how much they absorb and scatter light. A beam of light energy is passed from one end of the opening to the other end. The dust particles in the middle absorb or deflect light energy, reducing its intensity. The Beer-Lambert Law is used to measure the reduction in light energy by means of instruments. The loss of light intensity is correlated to particulate mass concentration, measured by manual gravimetric sampling. This correlation procedure is termed device calibration (see Graph 1: Calibrating CEMS for particulate matter measurement). It involves noting the current or energy loss output while passing a dust sample, collection of this dust samples, doing chemical analysis of it to understand the dust concentration and marking the same on a graph. The series of experiments are repeated, and regression curves Y1, Y2, Y3 are plotted as in Graph 1 to identify the best fit.
Graph 1: Calibrating CEMS for particulate matter measurementOpacity levels and corresponding dust levels are used for correlation
Source: Presentation: PM CEMS—Maintenance and Calibration, Sankar Kannan, Certificate Course on CEMS, CEQMS and Data Interpretation during 1–5 October 2018
Regression curve Y
Du
st c
on
cen
trat
ion
(m
g/m
3 )
0.1 Extinction
20 Output of monitor / mA
0
60
40
20
0
Gravimetric measurement(example)
Optical measurement(example)
Confidence range Y1-Y2
Tolerance range Y3-Y4

11
NEW SYSTEMS, OLD HABITS
Different technologies employing this fundamental principle of measuring light scattering differences exist. According to experts, the installation of forward scattered light technology, opacity or dynamic opacity meter will be the best suitable technologies for these CEMS systems. But a few power stations resort to installing cheaper technologies such as tribo-electric, which are not suitable for dust measurement post an electrostatic precipitator (ESP).
Gaseous pollutants—Sulphur dioxide and oxides of nitrogen In gaseous CEMS, typically a probe is placed to extract gases into sensors from the chimney. A sample portion of flue gas is passed into the sensor after removing moisture and dust through minor mechanical systems into the analyser. In the analyser an infrared or ultraviolet light source is then passed from one end into this gas within the sensor. The gas molecules absorb the energy corresponding to a specific wavelength. The reduced energy is measured at the other end. This reduced energy is then compared with that of reduced energy measured by passing the light through a standard reference gas kept in another chamber parallel to the flue-gas sample to arrive at the pollutant concentrations. The energy absorbed at different concentrations of sulphur hydroxyl gas is plotted in Graph 2; the plot generated in the experiment will be layered on similar energy absorption graphs to understand the concentration of the pollutants in flue gas.
This principle used by the sensor is called the spectroscopy principle. Spectroscopy is a close analysis of the difference in energy such as light or heat absorbed by the gases from the energy originally passed over them. These energy differences are then converted into electrical signals and later to values using electronic systems. Gases absorb a certain bandwidth of light rays such as ultraviolet and infrared.
Graph 2: Calibrating gaseous pollutantsInfrared or UV rays and corresponding absorbance are used for correlation
0.5
0.4
0.3
0.2
0.1
0210 220 230 240 250 260 270 280
100 ppm RSH
50 ppm RSH
75 ppm RSH
25 ppm RSH
Wavelength (nm)
Ab
sorb
ance
(A
U)
Source: Applied analytics, 2021

12
NEW SYSTEMS, OLD HABITS
Who has supplied/installed instruments?CPCB’s 2017 national guidelines titled Guidelines for Continuous Emission Monitoring Systems outline the various technologies that can be used to monitor specific pollutants. There is currently no Indian certification system in place, and there is no stipulation to purchase Indian-certified CEMS device to monitor pollution. As a result, internationally accredited and verified equipment manufacturers holding either the Environment Agency’s Monitoring Certification Scheme (MCERTS) or Technischer Überwachungsverein (TUV-CERTS) certification have supplied instruments to these stations. Most National Thermal Power Corporation (NTPC) power plants have procured their instruments from Analysers Instrument Company Pvt. Ltd, Kota, Rajasthan; Forbes Marshall and CODEX have provided instruments to most of the power stations in Maharashtra. Likewise SICK India Pvt. Ltd has installed instruments in Chhattisgarh State Power Electricity Board. Instrument suppliers to other stations include Seimens, Emerson and Yakogawa India.

13
How much of this data generated is available?Through CSE state surveys, interactions and data from several Pollution Control Board (PCB) websites it is ascertained that CEMS is available in most power stations. According to Central Pollution Control Board (CPCB) officials, the objective of pushing power stations to install these equipment so far is to initiate self-monitoring. Though data is received by the board, the board doesn’t validate the data except on limited occasions. Therefore its authenticity remains a question. As per discussions between CSE researchers and CPCB in 2016, CPCB’s cell received CEMS data from approximately 90,000 MW. Now, in 2021, it receives data for over 160,000 MW.
At the state-level, only four of the 16 states where coal-based power generation is located had no website domain to display data (see Graph 3: Capacity in four states with no server link to display continuous stack emissions of TPPs). The rest of the state Pollution Control Boards (PCBs) had dedicated websites to display CEMS data. But most of these are password protected.
Graph 3: Capacity in four states with no server link to display continuous stack emissions of TPPs20 per cent of the coal-based capacity is located in these states
0
5,000
10,000
15,000
20,000
25,000
Uttar Pradesh Rajasthan Telangana Jharkhand
Cap
acit
y in
MW
State
Source: Centre for Science and Environment, 2021
How much of this available in the public domain?Only four states—Madhya Pradesh, Punjab, Chhattisgarh and Tamil Nadu—have CEMS data of coal-based thermal power plants available in the public domain (see Graph 4: CEMS data publicly available).
Only Madhya Pradesh has made the data analysable—archival data for up to a maximum of three months maximum is retrievable for analysis from the site. The Punjab portal gives minute data, and the Tamil Nadu portal gives one day’s data in the public domain. Chhattisgarh gives different portal links with password and displays four-hourly data.
3. Data availability

14
NEW SYSTEMS, OLD HABITS
The rest of the stations have locked the data with password protection.
Graph 4: CEMS data publicly available28 per cent of the coal-based capacity is located in these states
Cap
acit
y in
MW
State
0
5,000
10,000
15,000
20,000
25,000
Madhya Pradesh Tamil Nadu PunjabChhattisgarh
Source: Centre for Science and Environment, 2021
State analysis—Madhya Pradesh The Madhya Pradesh Pollution Control Board is one of the most transparent boards in the country. CSE accessed the generated CEMS data of the coal-based thermal power sector in this state for 15 days (1–15 December 2020) and analysed it to understand consistent data generation and transmission (or data availability). There are 17 thermal power plants in the state, with 55 units generating CEMS data. Data availability was assessed on the basis of the number of days for which the data is available out of the 15 days of assessment period for each unit.
Particulate matter—data for only half the units is transmittedIt was found that for particulate matter, data was available only for 50 per cent of the units for all 15 days, while 20 per cent of the plants had no data for the specific 15 days. Fifteen per cent of the units had data available for 11–14 days. Data for 7 per cent of the units was available for five to 10 days and 9 per cent of the units had data available for less than 5 days (see Graph 5: Data availability—particulate matter).
Graph 5: Data availability—particulate matterOnly for 50 per cent units transmitted data all 15 days
All 15 days50%
11-14 days15%
5-10 days6%
<5 days9%
0 day20%
Total number of units - 55
Source: Centre for Science and Environment, 2021

15
NEW SYSTEMS, OLD HABITS
Sulphur dioxide—data for only about two-fifths of the units is transmittedFor SO2, data for about 31 per cent of the units was not available on any single day. About 42 per cent of the plants had 100 per cent data availabile for 15 days. Another 16 per cent of the units had data available for 11–14 days, and 4 per cent of the units had data available for five to 10 days (see Graph 6: Data availability—sulphur dioxide).
Graph 6: Data availability—sulphur dioxideOnly 50 per cent units transmitted data all 15 days
Total number of units - 55
All 15 days42%
11-14 days16%
5-10 days4%
<5 days7%
0 day31%
Source: Centre for Science and Environment, 2021
Oxides of nitrogen—data for only about two-fifth of the units is transmitted Data availability for NOx was similar to that for sulphur dioxide; 40 per cent of the units had data availability for all 15 days, while 31 per cent of the units had no data available on any day. Data availability for 7 per cent of the units was less than five days and another 7 per cent had data available for five to 10 days. Data for 15 per cent of the units was available for 11–14 days.
Graph 7: Data availability—oxides of nitrogenOnly 50 per cent of the units transmitted data on all 15 days
Total number of units - 55
11-14 days15%
All 15 days40%
5-10 days7%
<5 days7%
0 day31%
Source: Centre for Science and Environment, 2021

16
NEW SYSTEMS, OLD HABITS
Overall, CSE analysis found only 40–50 per cent of the units regularly transmitted data from these systems to the regulators. This could be due to malfunctioning of the CEMS system or non-operation of the units.

17
Countries in the EU are discussing use of air modelling for regulatory purposes and CEMS has become a major source of data for this. Ensuring the quality of data that CEMS generates is therefore an important step. The quality and integrity of data must be ascertained.
Currently, the Central Pollution Control Board (CPCB) pulls out on a random basis data generated by industries, and visits these industries to ascertain the quality of the data. Overall, however, the quality remains poor due to lack of sustained effort, inspection and studies to ascertain their quality.
Analysis of 93,000 MW by CSE—collected in discussion with various Pollution Control Boards in 2016—indicated gross under-reporting of sulphur dioxide (SO2) and oxides of nitrogen (NOx) emissions (see Graph 8: Indian fleet—SO2 emissions and Graph 9: Indian fleet—NOx emissions).
Graph 8: Indian fleet—SO2 emissions (in mg/N.cu.m) Only 35 per cent of the units reported emissions of over 600 mg/N.cu.m; data appears grossly under-reported
Below 1006%
100-2009%
200-30017%
300-60027%
600-100018%
1000-15009%
1500-30007%
No data 7%
Capacity 93 GWEmissions in mg/N.cu.m
Source: Central Pollution Control Board, 2017
Graph 9: Indian fleet—NOX emissions According to CEMS data, nearly half the capacity reported compliance with the norms
Below 1006%
100-2009%
200-30017%
300-60027%
600-100018%
1000-15009%
1500-30007%
No data 7%
Capacity 93 GWemissions in
mg/Nm3
Source: Central Pollution Control Board, 2017
4. Data quality

18
NEW SYSTEMS, OLD HABITS
As per Graph 9, 68 per cent (out of 93,000 MW plants) reported NOx levels less than 300 mg/Nm3, which is possible only if there is an advanced primary control measure in place at the plant. This is, however, not the case at most of the plants. NOx levels less than 100 mg/Nm3 and even less than 200 mg/Nm3 are possible only with a combination of primary and selective catalytic reduction (SCR) technologies. But SCR technology is not yet installed in any thermal power plant. A possible reason for such low NOx levels can be that the data is reported in NO parts per million (ppm) and not NO2 mg/Nm3 (and oxygen might not have been recalculated to 6 per cent).
Poor CEMS data quality could be due to the following: 1. Tampering of data, 2. Error in unit conversion, 3. Calibration error, and4. Errors due to fault in the system (absence of maintenance, error during
installation or placement issues).
1. Tampering of data
The industrial unit with the help of the data service provider sends data from the equipment to the regulators. Some stakeholders allege that industrial units manipulate this data with the aid of equipment suppliers or data service providers. Some of the tampering techniques include placing the upper measurement limit below the software standard so that even if the system detects a high value, it shows that it is below standards; increasing the measurement range of the equipment to a higher level so that the monitoring value appears insignificant; and modifying software using a mathematical factor.
Graph 10: A constructed algorithm shows CEMS reports from two industries. One industry clearly transfers particulate matter data, which naturally fluctuates in the range of 30–100mg/Nm3. Data from the second industry indicates abnormality as the values are cut to vary in the narrow range of 15–30 mg/Nm3.
Graph 10: A constructed algorithm A minute-wise graph can be studied to understand if the algorithm is constructed
Source: Centre for Science and Environment, 2020
19
NEW SYSTEMS, OLD HABITS
In addition, some power stations switch off their monitoring equipment, resulting in 10–30 per cent loss of data when they anticipate high pollution from their operations. As per CPCB CEMS guidelines, the analyser measurement values are to be transmitted directly from the analyser, without any computer and server in between. But most of the industries are transmitting data through their server, leaving great possibility for data tampering.
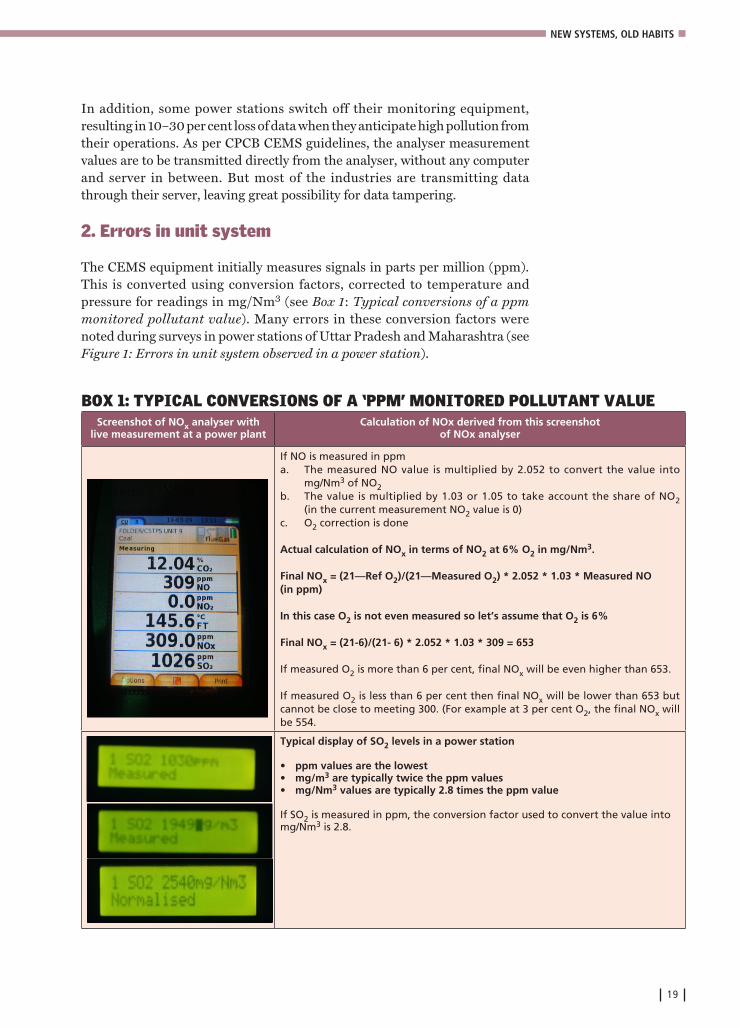
2. Errors in unit system
The CEMS equipment initially measures signals in parts per million (ppm). This is converted using conversion factors, corrected to temperature and pressure for readings in mg/Nm3 (see Box 1: Typical conversions of a ppm monitored pollutant value). Many errors in these conversion factors were noted during surveys in power stations of Uttar Pradesh and Maharashtra (see Figure 1: Errors in unit system observed in a power station).
BOX 1: TYPICAL CONVERSIONS OF A ‘PPM’ MONITORED POLLUTANT VALUEScreenshot of NOx analyser with
live measurement at a power plantCalculation of NOx derived from this screenshot
of NOx analyser
If NO is measured in ppma. The measured NO value is multiplied by 2.052 to convert the value into
mg/Nm3 of NO2 b. The value is multiplied by 1.03 or 1.05 to take account the share of NO2
(in the current measurement NO2 value is 0)c. O2 correction is done
Actual calculation of NOx in terms of NO2 at 6% O2 in mg/Nm3.
Final NOx = (21—Ref O2)/(21—Measured O2) * 2.052 * 1.03 * Measured NO (in ppm)
In this case O2 is not even measured so let’s assume that O2 is 6%
Final NOx = (21-6)/(21- 6) * 2.052 * 1.03 * 309 = 653
If measured O2 is more than 6 per cent, final NOx will be even higher than 653.
If measured O2 is less than 6 per cent then final NOx will be lower than 653 but cannot be close to meeting 300. (For example at 3 per cent O2, the final NOx will be 554.
Typical display of SO2 levels in a power station
• ppm values are the lowest• mg/m3 are typically twice the ppm values • mg/Nm3 values are typically 2.8 times the ppm value
If SO2 is measured in ppm, the conversion factor used to convert the value into mg/Nm3 is 2.8.

20
NEW SYSTEMS, OLD HABITS
Experts on the ground have noted that in thermal power stations typically the sensors measure only nitric oxide (NO). Whether every CEMS installed is con-verting NO with the correct calculations (NO to NO2 and units ppm to mg/Nm3) should be carefully evaluated so that the final NOx is in terms of NO2 in mg/Nm3 recalculated at 6 per cent O2, matching the norms specification. Recalculation errors with corrected oxygen and standard parameters need to be avoided.
3. Calibration errors
CEMS equipment measures only the variations in electrical signals in different levels of emissions on the ground. Based on pre-programmed algorithms, these electrical signals are associated with emission levels and displayed by the equipment. These algorithms are developed through a series of real-time experiments using pollutant samples and the resulting signals to establish pollution levels. Calibration is this process of determining and setting the algorithms onto CEMS equipment. This calibration process must be repeated at a specific frequency to ensure the system’s health.
According to CPCB guidelines, calibration should be performed at least once every six months for gaseous analysers and once a year for PM analysers, or after any change in the solid fuel. Experts point out, however, that no industry performs this calibration procedure after online analysers have been installed. The lack of knowledge of power plant operators about terms such as ‘dust factor’ is an example of how calibration is not done even after years. The term dust factor is used to describe the ratio of dust in flue gas at a given electrical signal, and it changes every year during calibration. Most power plants, however, continue to use the dust factor numbers given by the suppliers during the installation.
Even the basic hard infrastructure is absent to carry out cross-verification of CEMS systems. For calibrating or cross-checking online analysers, a sam-pling port is required at a height of 500 mm above the installed position of the CEMS analyser. But most TPPs still do not provide reference sampling ports, without which iso-kinetic sampling to verify the installed CEMS cannot be done.
Calibration oversight is a major reason for poor data quality. Calibration errors, unlike other errors, could lead to data measurement variations by about 10–20 per cent or more. Expired gases used for calibration can lead to errors in volume that can further deviate data by over 100 per cent of its actual value. Also post-calibration plants will need to check regularly for zero drift. Instruments and analysers have to be tested on a quarterly basis for zero and time. Gaseous analysers need to be examined every day for zero check and once a fortnight for span check; the same is not done by the TPPs, and without these the drift cannot be found out. Normalization is to be done for both SOx and NOx before transmitting to the state pollution control board (SPCB) or the Central Pollution Control Board (CPCB). The range of analysers should be 2.5 to three times the emission limit value (ELV) for the cross-interference to be minimized.
21
NEW SYSTEMS, OLD HABITS
4. Errors due to maintenance or location of equipment
Our latest survey of Maharashtra power stations revealed that three of the 17 plants studied had built CEMS in ducts, which is not a preferred position, considering that there is often no 8D/2D straight length. It is advisable to install CEMS in ducts only in cases where a thorough stratification analysis has been carried out.
These can be identified on-site and addressed within a few days in the majority of cases. It is to be noted that installation of CEMS equipment on-site is a job that does not take more than a week. The panel and other procurements could be a few months.
Sometimes lack of maintenance of equipment causes significant errors. For instance, most of the dust analysers that measure particulate matter norms are provided with a purge blower to clean the optics but experts’ point out that currently purge blowers at most power stations are choked with dust and sufficient air blowing is not carried out. As a result the optics that measure dust are scaled with dust due to which the particulate matter values are constant, without much deviation, or the standard deviations in the data generated is less than 1. In certain cases necessary equipment such as temperature sensors are absent. Generally PM analysers will measure only the signal output as extinction, scintillation (SL) count, voltage etc. and never measure dust concentration as mg/m3. All these measurement values are arrived based on correlation methods, which we can get as mg/m3, and the same needs to be converted into normalization. Most of the thermal power plants have not installed temperature sensors for real time temperature measurement so they are currently transmitting PM values as mg/m3.
2. The CSE survey
on cities

22
As mandated, power stations are now connected with the Pollution Control Boards. The status of operation of industries, emissions data, calibration status and remote calibration facilities are available with regulators, the State and Central Pollution Control Boards. One can generate and download the reports in tabular format or in graphical form for specific time periods ranging between one second to months.
Data quality remains a question. However it remains a vicious cycle as unless the data is put to use, material effort to ensure its accuracy will not be taken up. These data has to be analysed to suggest corrective measures. Transparency of such data should be increased, researchers must be allowed to do statistical analysis around the same in order to develop credible pattern checks.
CSE analysed the Madhya Pradesh Pollution Control Board (MPPCB) data on Satpura Thermal Power Station to provide an example of how credibly the data can be put to use to understand compliance. For this analysis: • The historical data of Satpura Thermal Power Station from the MPPCB
portal was downloaded in the form of an excel sheet. The 15-minute average data for 15 days was extracted from the portal.
• Daily average values is calculated using the 15 minute average values.• Exceedance factor, a theoretical index conceptualized by CSE researchers,
was calculated to assess the kind of compliance followed by each industry, along with the other statistical parameters.
The factor has been introduced to to understand the compliance status of the industry and reduce complications for users of different domains. The formula used to compute the factor was: Exceedance factor (EF) for compliance standard = Daily average concentration of the pollutant/emission standard of the pollutant.
Based on the value of the EF, the industry was categorized as: • Gross violators: Industries that emitted pollution 1.5 times of the statutory
norms every hour. The EF for industry in this category was more than 1.5.• Exceeding emission levels: Industries that emitted pollution up to 1.5
times over the statutory norms every hour. The EF for industry in this category was 1.5≥EF>1 representing the exceeding limit by the industries;
• Complying satisfactorily: Industries that emitted pollution up to 0.5 times the statutory norms. The EF for industry in this category was 1≥EF>0.5 representing that the industry is complying satisfactorily with the standards; and
• Desired emission levels: Industries emitting pollution less than 0.5 times the statutory norms every hour with the EF = 0 to 0.5.
The data is further analysed statistically for the parameters like mean, standard deviation, range and percentile values.
5. Using CEMS data

23
NEW SYSTEMS, OLD HABITS
The case of Satpura Thermal Power Station Satpura Thermal Power Station (TPP) has six units, namely units 6–11. Units 10 and 11 has 100 per cent data available for all the parameters. For Units 6 and 7, PM data is available for all 15 days. SO2 and NOx data for Unit 6 is not available, and for Unit 7 it is available for five to 10 days. Thus the availability of data is less than 85 per cent. Data for Unit 8 is available for less than five days for all the parameters. PM data for Unit 9 is available for less than five days while no data is available for SO2 and NOx. Analysis was therefore taken up for Units 10 and 11.
• Exceedance factor was calculated for each unit and parameter in order to assess the nature of compliance.
PM exceedance factor for Unit 10 is in the range of <0.5 for most of the time and indicates desired compliance. Exceedance factor for NOx is mostly above 1.0, denoting exceeding compliance. Data for SO2 is continuously in the category of gross violation.
Graph 11: Exceedance factor for Satpura Unit 10Only PM norms are met with at desired level
0
0.5
1
1.5
2
2.5
01/1
2/21
02/1
2/21
03/1
2/21
04/1
2/21
05/1
2/21
06/1
2/21
07/1
2/21
08/1
2/21
09/1
2/21
10/1
2/21
11/1
2/21
12/1
2/21
13/1
2/21
14/1
2/21
15/1
2/21
Exceedance factor – Satpura unit 10
PM SO2 NOX
Des
ired
Sat
isfa
cto
ry E
xcee
din
g G
ross
vio
lati
on
Source: Centre for Science and Environment, 2021
PM exceedance factor for Unit 11 is either in desired or satisfactory compliance apart from one day which shows a spike with exceedance factor above 2. Exceedance factor for NOx is also most often exceeding. Data for SO2 is continuously in the category of gross violation.

24
NEW SYSTEMS, OLD HABITS
• Statistical interpretation of data: Mean value of PM emissions for Units 10 and 11 is within the standard limit. Data for unit 10 is consistent with standard deviation of 7.2 per cent, with a range of 27.1 mg/Nm3. However data for unit 11 is highly deviating, with high range of about 193 mg/Nm3. The 90th percentile for both the units lies within the emission limit. For SO2, the standard deviation is relatively high, with a corresponding high range. The 90th percentile value for both the units exceeds the emission standard of 600 mg/Nm3 by more than twice. Data for NOx is randomized with a standard deviation of 35–51 and a corresponding range of 188 mg/Nm3 for Units 10 and 11 respectively.
Graph 12: Exceedance factor for Satpura Unit 11PM norms spike to gross violation on certain days unlike in Unit 10
Exceedance factor – Satpura unit 10
PM SO2 NOX
0
0.5
1
1.5
2
2.5
3
01/1
2/21
02/1
2/21
03/1
2/21
04/1
2/21
05/1
2/21
06/1
2/21
07/1
2/21
08/1
2/21
09/1
2/21
10/1
2/21
11/1
2/21
12/1
2/21
13/1
2/21
14/1
2/21
15/1
2/21
Des
ired
Sat
isfa
cto
ry E
xcee
din
g G
ross
vio
lati
on
Source: Centre for Science and Environment, 2021
Table 1: Statistical data for Satpura Thermal Power PlantName of Industry
Parameter Statistical parameters Percentile Standard
Satpura TPP Mean SD Range 25% 50% 75% 90% mg/Nm3
Unit 10PM
41.7 7.2 27.1 36.8 39.7 47.9 49.6 100
Unit 11 59.0 47.2 192.7 41.1 45.8 55.9 62.2 100
Unit 10SO2
1,187 112 389 1,124 1,161 1,259 1,332 600
Unit 11 1,171 103 427 1,126 1,154 1,217 1,256 600
Unit 10NOx
334 35 114 317 326 363 383 600
Unit 11 341 51 188 312 342 360 409 600
Source: Centre for Science and Environment, 2021

25
Regulators across the world favour using CEMS for monitoring pollutants. The US has used CEMS for monitoring industries for over 20 years; the European Union has for 15 years.
European Union EU countries use CEMS data to check compliance of coal-fired thermal power stations to meet the emission limits. They interpret the CEMS data to check compliance by calculating averages—hourly, monthly and daily (see Table 2: How compliance is checked in EU countries for TPPs).
Table 2: How compliance is checked in EU countries for TPPsAverages of CEMS data is used to check compliance in EU
Average Condition
Daily CEMS value = is less than 110% of the emission limit
Monthly CEMS value = or less than Emission limit
Source: Europe law EUR-Lex - 32010L0075 – EN
Every power plant in the EU has to have its own permit (compliance) to meet pollution norms. Typically all power plants have to meet the 24-hour daily average as well as the annual average as compliance (see Table 3: BAT-associated emission levels [BAT-AELs] for NOx emissions to air from the combustion of coal and/or lignite). The daily average value should be the same as that of the national norm to be complied (in India norms as issued by MoEF/CPCB). The annual average value is either same or tighter than the daily average value. In addition to daily average and annual average, many plants have to also meet the weekly average for compliance. Only a few power plants have to meet the monthly average for compliance in addition to the daily average and annual average. All plants > 50 MW should have a CEMS for online monitoring. Plants lower than 50 MW can have site measurement of NOx. Online measurement like CEMS is not mandatory. Power plants > 50 MW have to meet pollution norms in all conditions and loads. The only exception where pollution norms are not required to be complied with is if the plant is not synchronized with the grid. NOx is measured in terms of NO2 in mg/Nm3 at 6 per cent O2 dry basis.
6. International best practices

26
NEW SYSTEMS, OLD HABITS
Table 3: BAT-associated emission levels (BAT-AELs) for NOx emissions to air from the combustion of coal and/or ligniteLarger boilers have more stringent norms
Combustion plant total rated thermal input
(MWth)
BAT-AELs (mg/Nm3)
Yearly averageDaily average or average over the sampling period
New plantExisting plant[1] New plant
Existing plant[2],[3]
<100 100–150 100–270 155–200 165–330
100–300 50–100 100–180 80–130 155–210
>= 300, FBC boiler combusting coal and/or lignite and lignite-fired PC boiler
50–85 <85–150 [4],[5] 80-125 140–165 [6]
>=300, coal-fired PC boiler
65–85 65–150 80–125 <85–165[7]
[1] These BAT-AELs do not apply to plants operated <1500 hour/year
[2] In the case of plants put into operation no later than 1 July 1987, which are operated <1500 hour/year and
for which SCR and/or SNCR is not applicable, the higher end of the range is 340 mg/Nm3
[3] These levels are indicative for plants operated <500 hour/year.
[4] The lower end of the range is considered achievable when using SCR
[5] The higher end of the range is 175 mg/Nm3 for FBC boilers put into operation no later than 7 January 2014
and for lignite-fired PC boilers
[6] The higher end of the range is 220 mg/Nm3 for FBC boilers put into operation no later than 7 January 2014
and for lignite-fired PC boilers
[7] In the case of plants put into operation no later than 7 January 2014, the higher end of the range is 200 mg/
Nm3 for plants operated >=1500 hour/year, and 220 mg/Nm3 for plants operated <1500 hour/year.
Source: Centre for Science and Environment, 2021
To ensure CEMS and data quality, the EU has specified detailed procedures under EN 14181 Stationary Source Emissions—Quality Assurance of Automated Measuring Systems. It is been in use over the last 10 years. This legislation is used by regulators, equipment suppliers, testing laboratories, and process operators. It explains the quality assurance protocols that must be followed to ensure that the CEMS system mounted accurately monitors air pollutants. Three Quality Assurance Levels (QAL) and one Annual Surveillance Test (AST) aspects must be undertaken to comply with these regulations.
Table 4: Overview of Quality Assurance Levels (QALs)The EU has detailed requirements by law to ensure data and system quality
QAL1 QAL2 QAL3 AST
When? Before CEMS installation
Installation and calibration
During operation Starting one year after QAL2
Frequency Once At least every five years
Continuously Annually
Who? Operator/Manufacturer
Accredited laboratory
Operator Accredited laboratory
Relevant standard
EN14181, ENISO14956, EN15267-3
EN14181, EN15259
EN14181 EN14181, EN15259
Source: Central Pollution Control Board

27
NEW SYSTEMS, OLD HABITS
BOX 2: APPLYING ROLLING AVERAGES TO INDIAN TPPs AS IN THE EU
Graph 13 depicts the hourly average SO2 emissions from a 600 MW thermal power plant during the unit’s February
operations in 2020. The emissions decrease to less than 600 mg/Nm3 on a regular basis, indicating zero-span tests. On the
other hand, if we overlook these values, typically emissions are in the range of 800–1,200 mg/Nm3.
There is currently no abatement control in place at the plant to mitigate SO2 emissions. According to the current regulatory
framework, after installing such a device, the plant must ensure that its emissions are less than 200 mg/Nm3 by 2024.
However, it would be difficult for power plants to emit less than 200 mg/Nm3 24 hours a day, seven days a week, because
they use liquid fuels like diesel during start-up and must shut down their emission control systems because they are not
equipped to handle the flue gas generated by burning liquid fuels. If the Pollution Control Board approves a rolling
monthly average norm of say 10 per cent of the statutory norm of 200 mg/Nm3, the monthly average of emissions should
not exceed 220 mg/Nm3 (see Graph 13: Application of EU practice for an Indian thermal power plants). This allows the
station to emit slightly higher emissions than needed at some hours, such as at start-up.
Graph 13: Application of EU practice for an Indian thermal power plantsHourly SO2 averages of a 600 MW plant should be below 220 mg/Nm3
Source: Madhya Pradesh Pollution Control Board, 2020
USAIn the US, their law 40 CFR (Protection of the Environment) Part 60 and 40 CFR Part 75 of Clean Air Act, 1963, requires industry to submit CEMS data to the Environment Protection Agency (EPA) for monitoring compliance. They have defined protocols in the law regarding maintenance, installation and procedure to ensure appropriate data quality and CEMS system quality, data gap handling procedures and the respective accountability.
EPA collects hourly pollution measurements and operating characteristics (e.g. electricity generation or steam production, energy input) and conducts electronic checks to ascertain data quality. These electronic checks, in combination with desk and on-site audits performed by EPA and state environmental agency staff gives a higher level of confidence in the data relative to other measurement methods (e.g. stack testing, emission factors).
Also, the US law also mandates involvement of a third-party agency which validates CEMS data through a Relative Accuracy Test Audit (RATA). The RATA is a quality assurance procedure in which a consultancy equipped with CEMS (also certified by methods found in 40 CFR 60) runs the certified CEMS
1400.00
1200,00
1000,00
800.00
600.00
400.00
200.00
0.002020-02-01 00:00:00 2020-02.08 05:45:00 2020-02.15 11:30:00 2020-02.22 17:15:00 2020-02.29 23:00:00
Monthly average 220 mg/Nm3
Prescribe standard (200 mg/NM3)
Stack 1 boiler ESP 600MW-SOx Raw
mg
/Nm
3

28
NEW SYSTEMS, OLD HABITS
with the facility or industry CEMS. The procedure for RATA is performed quarterly to meet the emission quantity from the industry as per the prescribed governmental standards. There are many consultancies in the US that perform RATA, including ORTECH Consulting, LEHDER Environmental Services, Source Testing and Consulting Services (STACS). The data collected from RATA is further submitted to both local environmental agencies and the District Attorney. Also, the industry collects the hourly data and submits it to EPA every calendar quarter (within 30 days of the end of the calendar quarter). Data from RATA is used to determine both the relative accuracy and systematic error (low bias) if manifested in the CEMS measurements.
The norms are also defined in the law as rolling averages of CEMS data. The compliance is checked by calculating daily and monthly averages. Since power stations may sometimes not be regularly operating, the US government clarifies the term monthly average to be ‘30-boiler operating days’ and daily average to be ‘calculated by averaging at least 18 hours of unit operation in a day’ (see Table 5: How compliance is checked in the USA for TPPs).
In India, the EU, China and many other countries, the emission limits of the power stations are normalized against concentration or air volume. Largely because the coal used in these countries has more or less similar characteristics, the power plants that burn them have similar efficiencies and so use similar amounts of air for combustion. However, the US has a variety of coal used across power stations throughout the country, each requiring specific quantities of air for combustion. Therefore for ease in regulation, the country mandates reporting of air pollution normalized against heat rate of the power station.
Table 5: How compliance is checked in the USA for TPPsRolling averages of CEMS data is used to check compliance in the USA
Parameter How compliance is checked
Particulate matter Daily average CEMS value = Emission limit
Daily average PM emissions limit is determined by calculating the arithmetic average of all hourly emission rates of PM each boiler operating day, except for data obtained during start-up, shutdown, or malfunction periods. They are only when there is non-out-of-control data for at least 18 hours of unit operation during which the standard applies.
Sulphur dioxide and oxides of nitrogen
Monthly average CEMS value = Emission limit
30-boiler operating-day rolling average of SO2 and NOX emissions limits is determined by dividing the sum of the SO2 and NOX emissions for the 30 successive boiler operating days by the sum of the gross energy output or net energy output, as applicable, for the 30 successive boiler operating days.
Source: E-Cfr: Title 40: Protection of Environment, PART 60—Standards of Performance for New Stationary Sources, Subpart Da—Standards of Performance for Electric Utility Steam Generating Units

29
For coal-based thermal power stations, collection of manual samples and testing in laboratories are legally defined in the Air Act, 1981 and Environment (Protection) Act, 1965. The norms are also defined based on a one-time sample. Given the current manpower constraints, legal sampling is carried only twice or thrice a month at most. Such legal tests would only be useful to interpret stack emissions when they are tested and will not offer a true reflection of the emission pattern over an extended period of time in a day or month relative to the notified standards.
CEMS solves this issue by ensuring that the data is collected in real time and on an ongoing basis, ensuring that emission requirements are met 95 per cent of the time. To bring the data into use, the following steps need to be taken:
1. Ascertain physical location is set right: The ideal location for placing the equipment has been defined by the Central Pollution Control Board (CPCB) in its manual Revised Guidelines for Continuous Emission Monitoring Systems August 2018. However, specific surveys to authenticate the placement of the CEMS system exclusively for thermal power stations have not been carried out so far. This needs to be done in coordination with experts and the regional pollution control regulators at the earliest and repeated on a quarterly or half-yearly basis.
2. Make sure right technology is installed: Some thermal power plants have been observed to be installing less expensive systems that may or may not be useful in accurately measuring emissions from thermal power plants. For example, there is a variety of technologies for measuring dust levels in flue gas, with tribo-electric systems being the cheapest. However tribo-electric systems cannot measure dust levels accurately post ESP. But many power stations still use this technology and under-report their emissions. Experts believe that opacity, dynamic opacity meter or forward dispersed light technology would be the best techniques for measuring dust after electrostatic precipitator (ESP).
3. Ensure availability of ports on the chimney to enable calibration: For calibrating and cross-checking of online analysers, a sampling port is required at a height of 500 mm above the installed position of the CEMS analyser. But still most thermal power plants do not provide reference sampling ports without which one cannot do iso-kinetic sampling to verify the installed CEMS.
4. Ensure calibration is done: As per the CPCB guidelines, gaseous analysers must be calibrated once every six months and PM analysers once a year, or after any changes in the solid fuel. Most thermal power plants are not aware of the dust factor, which is the important calibration parameter to give actual flue gas PM values. The dust factor in most of the thermal
7. The way forward

30
NEW SYSTEMS, OLD HABITS
power plants is fixed by the supplier and is based on the emission limit value (ELV) compliance at the time of installation and left uncorrected for years, giving inaccurate values. The factor needs to be verified once a month as per CPCB CEMS guidelines. Most thermal power plants do not regularly do this, and this needs to be checked.
Plants will need to check regularly for zero drift. The instruments and analysers have to be tested on a quarterly basis for zero and time. For this purpose calibration gases, which are typically sulphur dioxide or oxides of nitrogen gas containing 80 per cent of the maximum pollutants that can be measured by the instrument, are used. Calibration oversight is also a reason for poor data quality. Calibration errors, however, unlike other errors, could lead to a variations in measurement of data by about 10–20 per cent, provided the gases are appropriate.
Calibration gas, during import, gets some error due to temperature or pressure changes. People also use expired calibration gases, thus giving an incorrect result. Calibration gases or span gases used in power stations are CO, CO2 (with a particular dust factor), SO2 and NO. Twenty-litre gas cylinders are purchased every quarter or twice a year, depending on the number of recalibrations done. Regulators in their reports and survey inspection must continue to procure details and ensure there are no defaults.
5. Do regular operation and maintenance of CEMS installed: CEMS systems are very complex equipment and delicate in nature. To continue to generate credible data, it should be given a proper maintenance schedule and be regularly checked for zero and span. For instance, most thermal power plants fail to clean their optics with purge blowers. As a result the optics get scaled with dust and does not measure the pollutants properly. As a result the particulate matter values are constant without much deviation.
6. Bring in data validation protocols: Generic data validation protocols such as introduction of exceedance factor, data check points, collection of further data to validate the measurements and data generated through these systems must be put forth. The protocols could include the following aspects:• Collect more details to cross-verify: The general issue that was
observed during data analysis was that the values of either PM or SO2 are relatively low. To check the credibility of such data the analysis of the fuel consumed and details of the APCDs installed should be available.
• Check for claimed values: In some cases the value for either PM, SO2 or NOx were observed to be same on all days of analysis, signifying that there may be issues with the CEMS installation. This generally happens when the data is clamped to a certain value but the actual value of emissions is always higher than the clamped value. It could also be a dummy value. Emission monitoring and inspection of CEMS installation is essential in such units.

31
NEW SYSTEMS, OLD HABITS
• Check if temperature sensors are available: Generally PM analysers will measure only the signal output as extinction, SL count, voltage etc. and never measure dust concentration as mg/m3. All these measurement values are arriving on the basis of correlation methods, which we can get as mg/m3 and the same needs to be converted into normalization for a particular temperature. Most industries have not installed temperature sensors on real-time temperature measurement so that they are transmitting the PM values as mg/m3 and not as mg/Nm3.
• Check if oxygen is measured at stack: Oxygen should be measured at same point in the stack as where SO2, NO and NO2 are measured.
• Check for appropriate conversion factors: Check if values are reported in mg/Nm3. Correct conversion factors to be used for NOx (to be calculated in terms of NO2 at 6 per cent O2 dry basis).
• Check if the analyser ranges are appropriate: The range of analysers should be 2.5 to three times the emission limit value (ELV) so cross-interference is minimized.
• Highly random data (SD>30) and highly consistent data (SD<1) needs to be cross checked by the Pollution Control Boards through surveys.
• CEMS audit at regular time interval: It has been noticed in several plants that the data is consistent with less of deviation and small range. Such plants need to be cross-checked by the regulators or by the plant itself to self-regularize its own system. In some cases it was also found that the data for all 15 days was the same. Audit at such facilities will uncover the issue and help improve the data quality.
7. Data transmission integrity: To ensure data is not tampered or misplaced, mechanisms should be put forth to ensure server integrity. According to CSE surveys, currently Glens is the popular server holding over 90 per cent of the data. Ninety per cent of the data is stored in their server. As per CPCB CEMS guidelines, the analyser measurement values needs to be transmitted directly from the analyser, without any computer and server in between. Most of the thermal power plants transmit through their server, leaving scope for data tampering.
8. Build mechanisms to ensure equipment authenticity: Currently there are no legal requirements to ascertain equipment authenticity. On the ground, equipment manufacturers are certified by the US or European certifying agencies. The National Physical Laboratory has to roll out mechanisms at the earliest to authenticate equipment.
9. Introduce rolling average norms: Currently, emissions concentrations measured from a grab sample are used to determine compliance with emission norms. CPCB must collaborate with MoEF&CC to switch from grab sample measurements to rolling-average values obtained from the CEMS system. Currently, the industry generates CEMS data every 15 minutes, and the organization will not be able to meet the standards 24 x 7. In this situation, rolling averages would provide a more accurate picture of the company’s compliance. Misinterpretation of the current data as

32
NEW SYSTEMS, OLD HABITS
industry non-compliance is a fear that inhibits the sharing of such data in the public domain. Misreading can be avoided if such rolling-average norms are made statutory.
10. Improve data availability: From the Madhya Pradesh experience, it is clear that a plant may not be transmitting data completely. CSE analysis of the data from the state found that currently only 40–50 per cent of the PM, SO2 and NOx data are made available. There are a few examples of plants that are active as per the status on the portal but they generate zero value to the system. Particulate matter data was observed to be available 50 per cent of the time and gaseous sensor data only 40 per cent of the time. Most units did not send any information on pollutants to the board 30–35 per cent of the time.
With this limited data, regulators work by sending SMSs to the defaulting industry, advising them to make process changes to control pollution. This in the long run will only make this system defunct. Irrespective of whether the generated data is junk or not, it will need to be put out in the public domain. At the very least, a monthly analytical report of the data obtained from a plant should be made public, stating monthly average emissions and data availability over the time. Such cases should then be studied by regulators in detail and the reason for not displaying proper values should be discussed and sorted out with the industry. The availability of the CEMS data and its transparency must be improved. Improving the transparency will foster further analysis and improve data quality.
11. Third-party audit: To ensure the accuracy of the data produced by these systems, third-party consultants should be hired to audit it. A third-party agency may be an academic institution or any approved consultant that can visit the site, collect manual samples and verify the accuracy of the data obtained by the CEMS during such measurements. Also, its opinion on the system’s maintenance should be certified. To increase integrity, the Pollution Control Board can authorize a list of organizations to which this function can be entrusted, and payment can also be made via the board.
12. Capacity building: Multiple stakeholders—industry, consultants and
Pollution Control Board—must be trained to ensure adequate use of these systems. Such capacity-building exercises can focus on audit methodology, which ensures correct implementation of the real-time monitoring of emissions and effluent to check whether the stated standards and other regulatory requirements are being followed; status of facility’s compliance; certification; verification; accreditation of the system; technical acceptance through calibration; quality assurance; generating accurate, reliable and traceable data; and other related aspects.


In February 2014, India adopted a new-age emission monitoring system. This was marked as a step toward broadening and strengthening the country’s environmental governance and was expected to be a game-changer in terms of resetting and transforming India’s sluggish pollution compliance and enforcement. But this system has still not been put to use by regulators.
This study is a systematic attempt to understand what needs to be done to regularly use data generated by these systems in order to assist regulators in the coal-based thermal power sector, one of India’s most polluting industries.
Centre for Science and Environment
41, Tughlakabad Institutional Area, New Delhi 110 062
Phones: 91-11-40616000 Fax: 91-11-29955879
E-mail: [email protected] Website: www.cseindia.org