New Product Sales Forecasting in the Mobile Phone … New Product Sales Forecasting in the Mobile...
23
1 New Product Sales Forecasting in the Mobile Phone Industry: an evaluation of current methods Semco Jahanbin Paul Goodwin and Sheik Meeran Abstract Today’s technological development and global competition in markets, requires suppliers of products and services to introduce new products or to improve their current products in order to survive. Fast technological development in the high tech sector also makes this global competition even harder for firms in today’s market place, because technology advances have shortened the life cycle for many products. Demand forecasting is crucial for firms operating in this environment who need to make decisions relating to future production capacity, marketing budgets, human resource planning, and research and development. This is especially true of pre-launch forecasts of demand time series where products have a short life cycle. However, producing such forecasts is a difficult, complex and challenging task mainly because of the unavailability of past data and short life cycles of earlier products. This paper assesses the pros and cons of a range of new product forecasting methods where products have short life cycles. The potential effectiveness of methods such as individual and group management judgments, prediction and preference markets, intention surveys, diffusion models, conjoint analysis, market testing and agent based modelling, are evaluated in the context of the UK mobile phone industry. Areas where there is a need for future research are identified. Key words: New product forecasting, forecasting methods, products with short life cycles, Telecommunications, Mobile phones, pre-launch sales forecasting
Transcript of New Product Sales Forecasting in the Mobile Phone … New Product Sales Forecasting in the Mobile...
1
New Product Sales Forecasting in the Mobile Phone Industry: an
evaluation of current methods
Semco Jahanbin
Paul Goodwin and Sheik Meeran
Abstract
Today’s technological development and global competition in markets, requires suppliers of
products and services to introduce new products or to improve their current products in order
to survive. Fast technological development in the high tech sector also makes this global
competition even harder for firms in today’s market place, because technology advances have
shortened the life cycle for many products. Demand forecasting is crucial for firms operating
in this environment who need to make decisions relating to future production capacity,
marketing budgets, human resource planning, and research and development. This is
especially true of pre-launch forecasts of demand time series where products have a short life
cycle. However, producing such forecasts is a difficult, complex and challenging task mainly
because of the unavailability of past data and short life cycles of earlier products. This paper
assesses the pros and cons of a range of new product forecasting methods where products
have short life cycles. The potential effectiveness of methods such as individual and group
management judgments, prediction and preference markets, intention surveys, diffusion
models, conjoint analysis, market testing and agent based modelling, are evaluated in the
context of the UK mobile phone industry. Areas where there is a need for future research are
identified.
Key words: New product forecasting, forecasting methods, products with short life cycles,
Telecommunications, Mobile phones, pre-launch sales forecasting
2
1. Introduction Today’s technological development and global competition in markets, requires suppliers of
products and services to introduce new products or to improve their current products in order
to survive (Bose, 2002). Fast technological development in the high tech sector also makes
this global competition even harder for firms in today’s market place, because technology
advances have shortened the life cycle for many products in this sector (Reiner et al., 2009).
Demand forecasting is crucial for firms operating in this environment who need to make
decisions relating to future production capacity, marketing budgets, human resource
planning, and research and development. In particular, forecasts of sales time series will be
required to estimate the discounted future returns on the investment to assess its likely return
and viability (Goodwin, Dyussekeneva and Meeran, 2012). More accurate forecasts can give
companies better insights during the product development stages, inform go-no-go decisions
on whether to launch a developed product and also support decisions on whether a recently
launched product should be withdrawn or not due to poor early stage sale (Dyussekeneva et
al, forthcoming).
However, this is also an environment that creates problems for forecasters. By definition no
past time series will exist for products that have yet to be launched, but time series relating to
similar products that have already been launched will be short. Rapid technological
development and competition also mean that these series may carry little information that is
relevant for the estimation of the demand patterns of future products. Yet forecast errors can
be costly. For instance a PC division of one major manufacturer reportedly lost $1 billion for
the year because of demand underestimation in Christmas sale season (Weng, 1999).
As a result, suppliers and retailers who have the aim of decreasing the risk of product
unavailability, due to the risk of losing sales to their competitors, rely on large inventory
holdings. This large inventory holding strategy is very costly, especially in the case of high
tech sector products because such products lose value every day due to relatively high speed
of development and innovation in this sector. This means that the stored products must be
deeply discounted or sold through alternative channels. In extreme cases, the annual costs of
holding inventory for such products could reach up to 50% of their costs (Reiner et al., 2009),
which can be decreased by more accurate forecasting. According to Hofmann and Reiner
(2006), mobile phones are categorised as high technology products with a short life cycle,
which lose their value over time. In the mobile phone industry, the obsolescence costs are 5–
15 times higher than the average of 1% of revenue for products that do not have a short life
3
cycle (Hofmann and Reiner, 2006). Although a number of methods have been developed,
despite the critical roles of new products sales forecasting, the topic has received relatively
little attention in the literature (Kahn, 2006 cited by Goodwin et al, 2012). This lack of
attention is also the case for mobile phones in the telecommunication industry that have a
short life cycle.
This paper reviews the literature to assess the likely effectiveness of a range of new product
sales forecasting methods in the mobile phone industry. These methods includes management
judgment, prediction and preference markets, intention surveys, diffusion models, conjoint
analysis, market testing and agent based modelling. It then suggests areas where future
research is likely to be most fruitful.
The paper starts by reviewing the literatures on product life cycles and the challenges this
poses for sales forecasters. This is followed by a review of the literature on the
telecommunication sector, with special reference to the mobile phone industry in the UK
which is representative of a saturated market with short life cycle products. Afterwards, the
paper introduces various methods of new product forecasting, followed by critical discussion
of pros and cons of different methods. Finally, possibility of future research will be
concluded.
2. Mobile Phone Industry in the UK Business executives began to use mobile communication devices such as wireless cell phones
in 1970’s and 80s and these evolved into an essential daily communication device for every
level of end users from children to older people to business people on the go (Sek et al,
2010). Since that time, due to rapid speed of development and innovation, the industry has
been under a high level of uncertainty. Frequent changes of product design, competition and
the willingness of customers to substitute new products for their existing ones have all
contributed to uncertainty in the target markets. The high number of competitors in the
mobile industry changed the nature of competition from that of product or service
performance to the effective use of complementary assets such as marketing, distribution,
competitive manufacturing (e.g. process innovation), and after-sales support (Funk, 2004). As
result, accurate forecasts of sales of new products play a significant role in winning
customers from competitors in this industry.
The UK market, which we focus on here, is representative of a saturated market (level have
reached 134% saturation, Forbes, 2013) of high technology products with short life cycles in
a developed country with intensive levels of competition.
4
The comedian, Ernie Wise made the UK's inaugural mobile phone call on 1 January 1985.
Coverage was restricted to London and costs were prohibitive, but Britain's mobile culture
had arrived. Britain's mobile phone users were either very rich or used a mobile in their jobs.
When digital technology arrived in 1992 and two new networks, One2One and Orange,
launched their first products a year later, the market opened up to consumers for the first
time” (Mobile Phone History Website, 2012). The UK mobile phones market had total
revenues of $3.1 billion in 2010, representing a compound annual growth rate (CAGR) of
4.5% between 2006 and 2010; the UK mobile market has more than 83 million subscribers.
In the late nineties, the mobile phone industry witnessed a large increase in the capacity of
production in order to fulfil the requirements of a fast growing market, which caused the
market saturation due to overcapacity among suppliers and shifted the power balance towards
the mobile phone service providers. Market saturation increases pressure on suppliers’
competition and costs which resulted in the bankruptcy of BENQ Siemens in 2006 (Reiner et
al., 2009). The market saturation increases the level of competition in this industry and raised
the necessity of providing good service levels with reasonable prices in order to improve
customer satisfaction, which is only possible when supplier knows what the accurate demand
is in the market.
Nowadays, the UK mobile market is mainly served by five main network providers i.e. O2,
Orange, Vodafone, Three and T-mobile (Orange and T-mobile have recently merged as
Everything Everywhere), which provide both network service and handsets from different
handset manufacturing suppliers (e.g. Apple, Nokia, HTC) (Telecom Market Research
Website, 2011). These service providers supply customers in both contract and pre-pay (Pay
as you go) categories through their own retail outlets. There are other insignificant players
such as Virgin, Asda, Tesco, Vectone, Lyca and Lebara that mostly provide a pre-pay service
through unspecialised retailers in different sectors from that of mobile phone such as off-
licence supermarkets, supermarkets and grocery stores. Above named insignificant players in
mobile industry in the UK provide their network through the network infrastructures of five
main providers by using a virtual network on their own name; for example Tesco mobile uses
O2 network infrastructure; however by using a virtual network customer can see their
reception from Tesco itself (Research and Market website, 2011).
The manufacturers of handsets (original suppliers) divide the handsets market into various
classes so that each class has various models with similar technological features i.e. smart
phones, comfort phones, low end phones and outdoor phones. In this industry, specific
models within a class and contract type usually see a pattern of declining prices over time, so
5
providers practice a markdown strategy such that the price at each stage of the life cycle is
perceived as ‘fair’ relative to its technological features (Reiner et al., 2009). Mobile
providers, who follow this reference/fair price, cannot encourage demand through a pricing
strategy and therefore the actual sale price has to be lower than this reference price in order to
stimulate sales significantly. In contrast a price higher than the fair price leads to a sales
decrease (Winer, 1986). The mobile phone selling price is normally below its constant
purchasing price (seller price) after a certain period (or even right away after the product has
been launched to the market). According to Reiner et al. (2009), the pricing of a mobile
subscription service with a handset by a service provider depends on various interdependent
criteria such as service level, customer satisfaction, handset price, sales forecasting accuracy
and stock inventory.
3. Product Life Cycle In 1950, the Product Life Cycle (PLC) concept was introduced by Dean as “The evolution of
product attributes and market characteristics through time.... [the PLC concept can be]....used
prescriptively in selection of marketing actions and planning” (Rink and Swan, 1979). Kotler,
Wong, Saunders and Armstrong (2005) define product life cycle as the course of a product’s
sales and profits over its lifetime. Although over the life a product, a company does not know
how the sales will change in the future from one period to the next, the sales of any one
product to some extent will normally follow the PLC curve from initial stage to the
termination of product life through several distinct phases as it is greatly studied and
discussed in literature (Cox, 1967; Rink and Swan, 1979; Day, 1981; Gardner, 1987).
A product’s life cycle includes four distinct stages such as Introduction, Growth, Majority
and Decline; however some authors add an initial stage of development and other add final
phase of cancellation (Tibben-Lembke, 2002) to these four stages (Kotler et al, 2005), as
follows:
1. Product Development: developing the concept of a product into physical product with
the aim of ensuring that the product idea can be turned into a workable product, at this
stage there are no sales at all.
2. Introduction: once the product is launched into market, there is period of slow sales
growth as the product is being introduced.
3. Growth: in this period, the product is accepted in the market and sales grow rapidly.
6
4. Maturity: as the product has achieved acceptance by most potential buyers at this
stage, the sales growth slows down.
5. Decline: it is a period when sales fall off and profits stop.
6. Cancellation: it is a time for termination of production of a specific product.
According to Everett (1962) (cited by Rink and Swan (1979)), the theoretical rationale behind
the PLC concept derives from the adoption and diffusion theory of innovations. In the
introduction stage, there are low sales as few consumers are aware of the new product or
service. More consumer awareness and acceptance of the product or service raises the amount
of sales, thereby signalling the beginning of the growth stage. However, the growth rate
shrinks as more competitors enter the industry and the market becomes smaller. In the
maturity stage, sales become more stable as most of the mass market has already purchased
the item. This is followed by decline stage as most consumers look for newer counterparts.
Golder and Tellis (2004) believe that the forecasting of PLC is an essential activity in
marketing for at least three reasons. First of all, there are various dramatic pressures on
managers before and after the turning point in the life cycle. In the introduction stage prior to
start of growth stage, pessimism abounds and managers are under escalating pressure to pull
the plug on new products. In the growth stage prior to slowdown optimism abounds and
managers are eager to meet the apparently greedy demand with fresh capacity and more
marketing activities. Forecasting the turning points of take-off and slowdown are vital to
avoid premature withdrawal or excessive investments. Second, the level and increase of sales
is considerably different across stages of the life cycle. Managers need to have accurate
forecast of sales and the PLC in order to appropriately plan the corresponding levels of
production, inventory, sales staff, distribution, marketing, and advertising. Third, expenses
and prices decrease significantly over the PLC, especially during the early stages, because
consumers become more sensitive to price through various stages of the PLC. Managers need
to have great understanding of sales patterns and changes their pricing strategy accordingly.
As a result, having an accurate forecast of sales is a necessity (Parker, 1994) and errors in
sales projections can trigger serious consequences.
Although a product may go through all of the mention stages, not all of the products follow
the product life cycle; some products never reach their intended customers and fail to reach
growth phase (Tibben-Lembke, 2002) for example according to Gallo (1992) the failure rate
of new product is approximately 85 to 90 percent in the grocery industry and here products
do not follow the usual shape of the PLC curve. In the grocery industry, steep growth is
7
followed by stable maturity and sharp decline (Jensen, 1982). There are other products that
die quickly, soon after their introduction and hence they do not have all the distinct stages
such as fashion apparel, PCs, mobile phones. These are called Products with Short Life
Cycle. The PLC can be as short as a few months (a season) in fashion apparel (Kurawarwala
and Matsuo, 1998) and PCs (Angelus and Porteus, 2002).
4. Challenges of Sales Forecasting for Product with Short Life Cycle The fast pace of new product introduction has led to shortened life cycles for products in
many industries, especially products in high-tech sector. According to Decker and Gnibba-
Yukawa (2010), the term high-tech market refers to newly established, rapidly growing
markets, which are mainly driven by technological innovations. Traditional demand
forecasting methods are not oriented toward forecasting of short life cycle products. Retailers
or providers, who market products with a short selling season and/or a short life cycle, find
the task of forecasting sales challenging due to high levels of uncertainty in the demand for
these products, especially in absence of a long sales history (Subrahmanyan, 2000).
In many of traditional forecasting methods, the long-term (long-term trend, cyclical
component) and the short-term (seasonality, short-term trend) patterns are considered distinct
and treated separately according to Kurawarwala and Matuso (1998). Some of the challenges
of sale forecasting for product with short life cycles with some of traditional forecasting
methods are:
1. Decomposition Methods and Box-Jenkins models: they are designed to identify and
separate the time series into its various components. However, they require many data
points for proper identification and parameter estimation. A sufficiently long time
series is not available for short life cycle products until the end of their life cycles;
therefore applications of these methods are not feasible and useful.
2. Smoothing Methods: methods such as moving averages, simple and linear exponential
smoothing, perform well only when there is steady trend over the short term. A
change in trend usually leads to a systematic lag or lead effect. As a result, undergo
rapid growth, maturity, and decline along with seasonal variations in sales forecasting
of product with short life cycle, made simple smoothing methods for these product
inappropriate.
3. Analogy methods: Some researcher believe that they can use the available data on
prior similar products; although these data may yield valuable information that can be
8
used to forecast future products, it has its own problem and downsides (the
advantages and disadvantages of analogies will be discussed in more detail later on in
this paper).
These traditional forecasting methods are not designed for application in new product
forecasting (except when the analogy method is applied), especially for products with short
life cycles. In the next section, we will discuss the specific methods that have been used for
new product sales forecasting.
5. New Product Forecasting Methods and Dimensions Wind (1981) refers to two general types of sales forecasting models that may be useful in
new product forecasting. These are:
Diffusion models, which are usually based on time series data from previously launch
similar products and assume a sigmoid-shaped curve representing product penetration
over time (Bass, 1969; Mahajan, et al, 2000; Mead and Islam, 2006).
Choice models, which are based on individual level data to investigate the consumer
preferences for different characteristics of products and how this will affect the choice
of different opinions presented to the consumers (Greene, 2009).
In the absence of a sales history, the forecasters, who wants to apply the above models either
use the similar product sales history (Analogy method) or employ conjoint analysis based on
hypothetical scenarios to collect individuals’ potential behaviours and preferences towards
the new product before applying the choice model (Green et al, 2001; Gustafsson, et al,
2007). Some studies recently have been combined diffusion models and choice models to
forecast new product demand (Jun and Park, 1999; Kumar et al, 2002; Lee et al, 2007; Lee
and Cho, 2009; Lee, et al 2006). However, none of them have studied new product sales
forecasting for products with short life cycles.
Apart from the aforementioned models, there are other methods that are not based on models;
however they are frequently used by forecasters in order to forecast new product sales. These
are:
Individual management judgment, which is the most common method in new product
sales forecasting, especially in the high-tech industry due to high level of uncertainty
(Lynn et al, 1999; Kahn, 2002).
Judgments by group of managers can be also used to obtain different opinions and
perspectives with aim of having more accurate forecasting (Dyussekeneva et al,

9
forthcoming). Methods such as the Delphi method, prediction markets and preference
markets can offer a structured process of eliciting judgments from groups of
managers.
Customer intention surveys method, which involve asking potential customers about
their likelihood of purchasing the new product (Bass et al, 2001).
Market testing and agent base-modelling. In former, a firm assesses the acceptance
level and success of a new product in a sub-set market before launching into complete
market. In latter approach, computer software models simulate the action and
intention of customers by taking into account pre-defined behavioural rules
(Dyussekeneva et al, forthcoming).
The relative effectiveness of these methods is likely to depend on the nature of the
forecasting task. Dyussekeneva et al, (forthcoming), defined seven dimensions of this task, of
which six are applicable to the mobile phone industry. These are set out below:
1. The product’s ‘newness’. This has been defined differently by various scholars. One
definition relates to the ‘radicalness’ of an innovation. This can be divided into three
categories: “A. incremental: products whose innovations made a marginal improvement over
existing technology, such as improvements of camera, display resolution, and the processor
in iphone 5 comparing to that of a iphone 4 (apple UK website, 2012); B. semi-radical: those
products whose innovation represented a significant improvement over existing technology
such as a cordless phone; C. radical: those product innovations that represented a major or
revolutionary technological advance, such as the concept of the smartphone by Ericsson for
first time in 2000 (Teardown Report, 2001). The Ericsson R380 smartphone combined the
functions of a mobile phone and a personal digital assistant (PDA). Other scholars consider
the newness of the product through its influences on consumer behaviour: continuous
innovations will not disrupt behavioural patterns, (e.g. an improved version of iphone),
dynamically continuous innovation will lead to small changes in behaviour, (e.g. camera
phone) whereas discontinuous innovation will lead to significant changes in consumer
behaviour and substantial learning will be required on the part of consumers such as
launching of ipad as new generation of PDA that generate new demands in market and taste
of consumers about tablets performance by its radical innovation.
2. The intrinsic nature of the product determines the frequency and amount of spent each
time to purchase a product, the essentiality of product and perceived associated risk of
impulse purchasing; for instance, the product might be a consumer durable (e.g. smartphone),
10
a consumer packaged good (e.g. a new chocolate bar) or a service (e.g. internet mobile
subscription).
3. The type of purchasers. different purchasers show various buying behaviour for same
product; for instance, there are special subscriptions for business customers in terms of tariff
and usages as business to business selling strategy differ in mobile phone industry from that
of business to consumers.
4. Product Life Cycle is different among various products, which affects sales forecasting for
a new product as we discuss it earlier in this paper mobile phones has short life cycle. Rapid
growth and decline and also short maturity of mobile phones due to speed of innovation in
this industry, makes the forecasting task much more complicated.
5. Whether the aim of forecast is the size of the total market or the market share of a product.
Forecasts of market share require estimates of the probability of consumers choosing a
particular product or brand (e.g. the probability of a consumer choosing an Apple iphone over
the Samsung Galaxy). This requirement will be different when the total size of a market is
required for a specific product in a period of time (e.g. total size of smart phone market in the
UK in summer 2012).
6. The extent to which forecasting is essential for a company may differ in different
industries. It is crucial to keep the right balance between level of complexity and accuracy in
the adoption of a method.
We next consider the likely pros and cons of these methods when they are applied to new
product sales forecasting in the mobile phone industry.
5.1. Management Judgments
Graefe and Armstrong (2011) suggest that human judgment can be used in new product sales
forecasting where a lack of appropriate or available information precludes one from using
quantitative methods. Human judgment or management judgement can be divided into two
categories: individual manager judgment and judgments from groups of managers.
Judgments by individual managers was the most common method used to forecast new
product sales, especially for forecasting sales of high-tech products in survey by Kahn
(2002).
A number of issues are associated with the application of management judgment as a single
method of forecasting. The main concern is that managers have difficulties in accurately
extrapolating simple linear patterns; therefore, the more complex non-linear patterns
associated with new products’ life cycles would be much less amenable. Hence this method is

11
likely to be less reliable as result of inconsistency and cognitive limitations (Dyussekeneva et
al., forthcoming).
In addition, there are other elements that may influence managers’ judgments, such as
unrealistic views about the prospects for a specific product by some of the managers who are
involved in developing the product, resources competition among managers to support the
development and commercialization of a new product, peer pressure and motivational biases
from independent forecasters who deliberately tell the managers the overestimated forecast
which is what manager want to hear, and also wrong indicators from market may mislead the
management judgment like any other human judgments as human judgment is quite
subjective (Dyussekeneva et al., forthcoming).
While the use of judgment on its own may be problematical, it can be a valuable method in
combination with other methods of forecasting1. For example, it can be used to estimate
initial sales or to select appropriate analogies when applying diffusion models. Also
judgmental adjustments of statistical forecasts can improve accuracy where a manager has
information that is not taken into account by the statistical methods.
Judgment by groups of managers instead of individuals’ judgment can be a way to decrease
biases and improve the accuracy of judgment. Common approaches are: unstructured face to
face meetings, nominal groups, the Delphi method and prediction and preference markets.
Unstructured face to face meeting is the most common form of group decision making in
organisations. While the approach may give participants the enjoyment and satisfaction of
direct human interaction and working together, it also may be subject to many biases and
drawbacks. For instance, a group requires time and effort to be maintained, and also peer
pressure may influence members’ decision. For example, the presence of people from
different hierarchical levels within an organisation company the politics may mean that, not
all members are willing to express their own ideas or decisions (Armstrong, 2006).
Van den Van and Delbecq (1974) tried to improve traditional unstructured face to face
meeting drawbacks by giving structure it by proposing a method called the nominal group
technique. This technique consists of three steps: first, group member work independently
and produce their own decisions based on their individual estimations; second, the group
enters an unstructured face to face meeting to discuss the issue with the aim of finding a
solution; and finally, they work independently again and prepare their final individual
decision. The group result is the aggregated outcome of these final individual estimates. The
1 Other methods can be Diffusion model, statistical methods, to name but a few.
12
face to face interaction in the second phase of the nominal group technique helps group
members to justify and clarify their point of view to achieve more informed decisions. On the
other hand, the final phase of decision making which prevents direct interaction between
group members, decrease the drawbacks associated with traditional face to face meetings.
The Delphi method was developed in 1950s by RAND corporation workers while they are
involved in US Air force sponsored project. It involves an anonymous multiple-round survey
about a problem. After each round summaries of the individual estimates are reported to all
participants and then, by taking into account this information, participants start their new
round of estimation. The result is the aggregate estimate of the final round outcome of all
individuals. Clearly, this method avoids the drawbacks and biases that associated with direct
interaction. “Delphi is not a procedure intended to challenge statistical or model-based
procedures, against which human judgment is generally shown to be inferior: it is intended
for use in judgment and forecasting situations in which pure model-based statistical methods
are not practical or possible because of the of appropriate historical /economic/ technical data,
and thus where some form of human judgmental input is necessary” (Rowe and Wright,
1999).
Prediction market and preference market can also be categorised as a group judgment
approach (Graefe and Armstrong, 2011; Dyussekeneva et al., forthcoming); however this
paper discuss these in the next section as they are based on significantly different approach,
which this method has received more attention in recent years.
5.2. Prediction and Preference Market
Graefe and Armstrong (2011) found that prediction markets are gaining attention in various
field of forecasting. The approach involves setting up a contract whose payoff depends on the
result of an uncertain future situation. The participants of prediction markets can trade this
contract, which can be interpreted as a bet on the outcome of the underlying future event.
Participants are paid off in exchange for contracts they hold as soon as the outcome reveals.
Participants can win money based on their individual performance in the same way as on the
stock market. Ivanov (2009) believes that the prediction market is a useful tool of forecasting
to harness collective wisdom. Unlike Delphi, it offers incentives for accurate forecasting and
can instantly respond to new information. However, there are several serious issues
associated with the method. First user friendly software has to be adopted and developed to
support the method. Second, according to Graefe and Armstrong (2011) participants find it
hard to understand and implement prediction markets, even after a proper training session.
13
Prediction markets also suffer from the long period between the forecast and potential payoff,
though this would be less of a problem in the mobile phone industry given its short product
life cycles. Preference markets offer an alternative method that addresses this issue by
replacing the occurrence of the event as the basis for the payoff with the group’s mutual
expectation.
5.3. Intention Surveys
Asking potential customers about their likelihood of purchasing a new product in a
questionnaire is called an “intentions survey”. Clearly, by eliciting judgments directly from
potential customers important information about the potential market can be obtained.
However, according to Dyussekeneva et al (forthcoming), in addition to the usual errors
associated with surveys, such as sampling error and non-response biases, there are numbers
of other kind of error could potentially be associated with sales forecasts based on intentions
surveys.
First, the unfamiliarity of participants with a product reduces the accuracy of their judgments
about their probability of purchasing it. Clearly, most users will be familiar with mobile
phones. However, the speed of innovation in this industry and the newness of products may
still have a negative impact on accuracy. However, the method is known to be more reliable
for durable products, like mobile phones rather than non-durable products, like packets of
crisps. This is because buying decisions for durable products are less likely to be based on
impulse and are more likely to be the results of thoughtful and planned buying. Second, the
timing of intention surveys influences the accuracy of its responses; the closer the time of
product launching, the more accurate the customer responses would be to the surveys. Third,
one of the significant issue that associated with this method in the mobile industry research
context, is “the act of eliciting intentions can itself change purchaser’s behaviour –when
respondents have predicted their own behaviour they are more likely to act in a way that is
consistent with this; hence those who participate in an intention survey may behave
differently from other member of target population. Finally, previous research has shown that
intention surveys are more reliable when they are related to a specific brand rather than the
entire product category (Morwitz, 2001 cited by Dyussekeneva et al, forthcoming).
14
5.4. Diffusion models
Diffusion models have been developed since the 1960s to model and forecast the diffusion of
innovations (Mead and Islam, 2006). Wind et al (1981) believes that diffusion models can be
adapted to model new product forecasting in the early stages. As we discussed earlier, new
product sales forecasting is often necessary prior to the launch of a product and the
unavailability of past data is therefore one of the main challenges to the application of
diffusion models in this context. One solution is “to fit the model to the sales time series of
similar products that have been launched in an earlier time period and to assume that the
parameter values identified for the analogy are applicable to the new product” (Goodwin et
al, 2012). This process called “forecasting by analogy”.
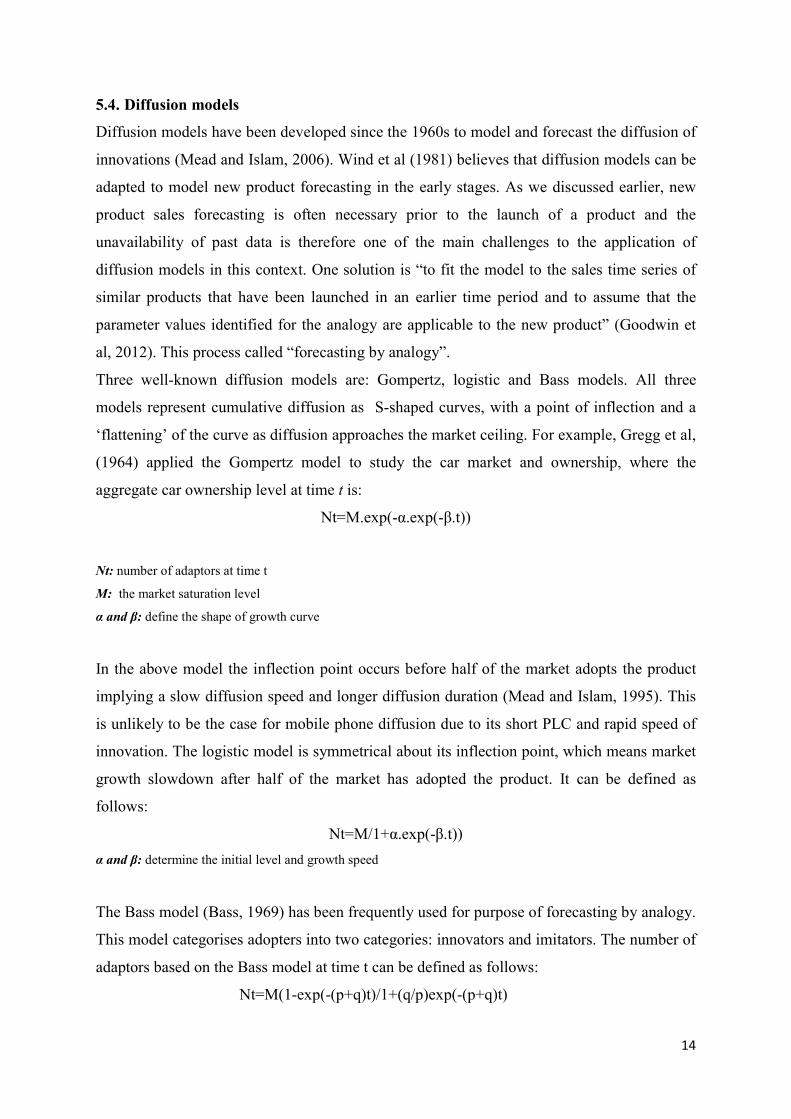
Three well-known diffusion models are: Gompertz, logistic and Bass models. All three
models represent cumulative diffusion as S-shaped curves, with a point of inflection and a
‘flattening’ of the curve as diffusion approaches the market ceiling. For example, Gregg et al,
(1964) applied the Gompertz model to study the car market and ownership, where the
aggregate car ownership level at time t is:
Nt=M.exp(-α.exp(-β.t))
Nt: number of adaptors at time t
M: the market saturation level
α and β: define the shape of growth curve
In the above model the inflection point occurs before half of the market adopts the product
implying a slow diffusion speed and longer diffusion duration (Mead and Islam, 1995). This
is unlikely to be the case for mobile phone diffusion due to its short PLC and rapid speed of
innovation. The logistic model is symmetrical about its inflection point, which means market
growth slowdown after half of the market has adopted the product. It can be defined as
follows:
Nt=M/1+α.exp(-β.t)) α and β: determine the initial level and growth speed
The Bass model (Bass, 1969) has been frequently used for purpose of forecasting by analogy.
This model categorises adopters into two categories: innovators and imitators. The number of
adaptors based on the Bass model at time t can be defined as follows:
Nt=M(1-exp(-(p+q)t)/1+(q/p)exp(-(p+q)t)
15
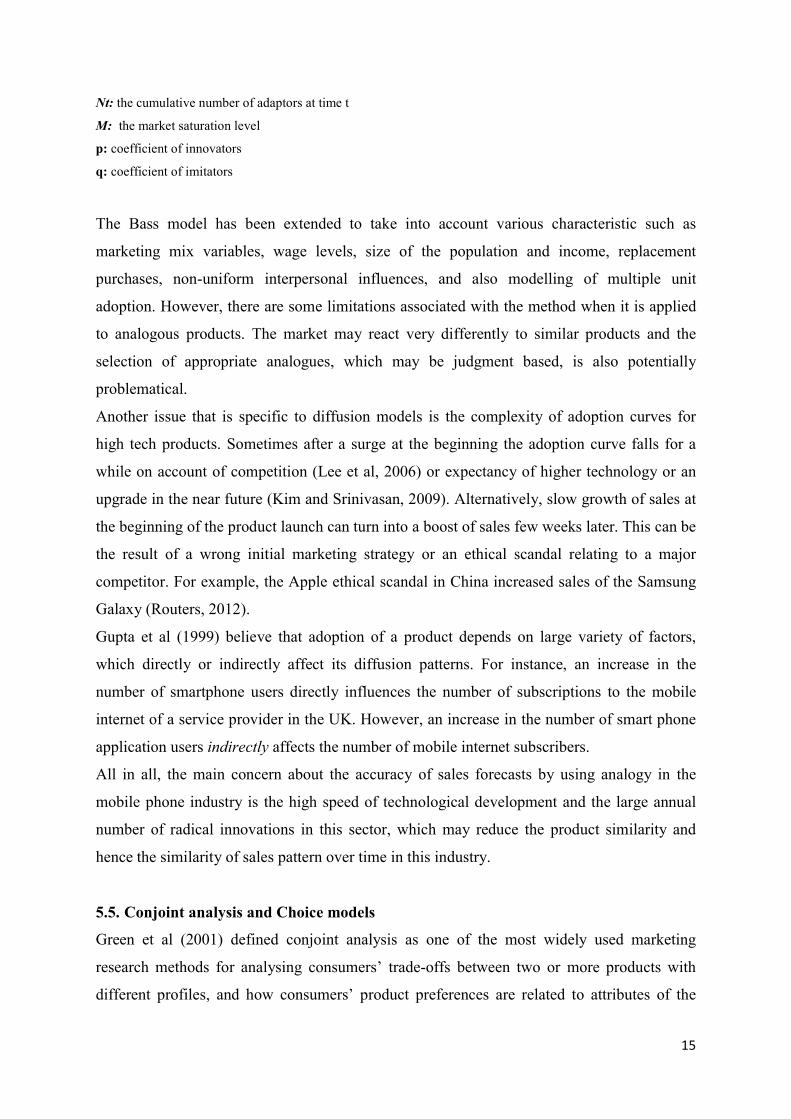
Nt: the cumulative number of adaptors at time t
M: the market saturation level
p: coefficient of innovators
q: coefficient of imitators
The Bass model has been extended to take into account various characteristic such as
marketing mix variables, wage levels, size of the population and income, replacement
purchases, non-uniform interpersonal influences, and also modelling of multiple unit
adoption. However, there are some limitations associated with the method when it is applied
to analogous products. The market may react very differently to similar products and the
selection of appropriate analogues, which may be judgment based, is also potentially
problematical.
Another issue that is specific to diffusion models is the complexity of adoption curves for
high tech products. Sometimes after a surge at the beginning the adoption curve falls for a
while on account of competition (Lee et al, 2006) or expectancy of higher technology or an
upgrade in the near future (Kim and Srinivasan, 2009). Alternatively, slow growth of sales at
the beginning of the product launch can turn into a boost of sales few weeks later. This can be
the result of a wrong initial marketing strategy or an ethical scandal relating to a major
competitor. For example, the Apple ethical scandal in China increased sales of the Samsung
Galaxy (Routers, 2012).
Gupta et al (1999) believe that adoption of a product depends on large variety of factors,
which directly or indirectly affect its diffusion patterns. For instance, an increase in the
number of smartphone users directly influences the number of subscriptions to the mobile
internet of a service provider in the UK. However, an increase in the number of smart phone
application users indirectly affects the number of mobile internet subscribers.
All in all, the main concern about the accuracy of sales forecasts by using analogy in the
mobile phone industry is the high speed of technological development and the large annual
number of radical innovations in this sector, which may reduce the product similarity and
hence the similarity of sales pattern over time in this industry.
5.5. Conjoint analysis and Choice models
Green et al (2001) defined conjoint analysis as one of the most widely used marketing
research methods for analysing consumers’ trade-offs between two or more products with
different profiles, and how consumers’ product preferences are related to attributes of the
16
product itself. Since the introduction of conjoint analysis in the early 1970s, it has been used
not only to analyse consumer preferences or intentions to buy existing products, but also how
consumers may react to potential changes in the existing product or to a new product being
introduced to the market later (Qian, 2012).
The reason that researchers have chosen conjoint analysis over other methods is because it
address key question: why do consumers’ prefer one brand of a product over other? What
attributes are they looking for and how do they make tradeoffs between these attributes?
According to Green et al (2001), it is a useful method for simulating how consumers might
react to changes in current products or to new products introduced into an existing
competitive array. For example, it is potentially useful if a marketer in the mobile phone
industry wishes to examine the possibility of modifying its current line of services. One of the
first steps in designing a conjoint study is to develop a set of attributes and corresponding
attribute levels to characterize the competitive domain. This can be obtained via a qualitative
method or through multiple methods such as a focus group, interview and observation and
choice-based conjoint analysis can be employed by using data from a large scale survey.
Although choice models would benefit from further empirical studies to assess their
effectiveness in different contexts, they may suffer from a number of limitations in some
circumstances. For instance, choice experiments suffer from the defect of modelling current
attitudes. In the mobile industry, a new product may change these attitudes, especially where
imitator’s attitudes depend on their observations of others’ experiences of the product (Fildes
and Kumar, 2002).
5.6. Market testing
Market testing is more common for forecasting sales of non-durable goods such as consumer
packaged goods and grocery products. However, few researchers have been able to generate
one or two years of accurate sales forecasting from almost market testing data which may
cover periods shorter than six months (Fourt and Woodlock, 1960 and Baumen and Dennis,
1961 cited by Fader, 2003). Market testing is costly and it causes some delays in the
launching of the product to the main market, the risk that competitors will imitate a product,
especially in the mobile phone industry where novelty and innovation are likely to be its key
competitive advantages.
17
5.7. Agent Based Modelling
In agent based modelling computer software models simulate the action and intentions of
customers in accordance with pre-defined behavioural rules. This allows a rich mixture of
factors to be taken into account, such as consumer traits (e.g. social connectedness,
imitativeness) and environmental characteristics (e.g. geographical variables, shopping
location). Problems such as achieving a good balance between the realistic behaviour of
consumers and the need for model simplicity, absence of historical data, the likely sensitivity
of models to initial conditions, and model calibration and validation still need to be resolved.
However, if these problems can be addressed in the future, this method has the potential to
become a strong tool for new product sales forecasting (Dyussekeneva et al, forthcoming).
6. Future Research Having reviewed the current status of methods that are used in new product sales forecasting,
what further research and development is needed to meet the demands of the mobile phone
industry with its fast moving markets and its short product life cycles?
A number of avenues seem worth pursuing. We need to establish whether new patterns of
diffusion apply to such markets and whether analogies of the Bass model can be developed to
account for such patterns. Clearly, such methods would only work if the patterns are stable
across analogous products launched into different markets at different points in time, or if
attributes of the market that are known at the time of the forecast can be used to determine the
parameter values of the model. They will also require a solid theoretical base, on a par with
Bass’s model of the interaction of imitators and innovators. The signposts for such a theory
may lie initially in qualitative research, such as that based on focus groups, where consumers’
motivations and perceptions can be identified and explored.
Preference markets are an unexplored method in this context and their ability to provide
rewards soon after the conclusion of the market means that they can potentially draw on the
benefits of incentives, group judgments and information on consumer preferences all within
the short time scales required by fast moving markets
Recent development of choice models in association with conjoint analysis could also prove
to be productive. Currently, there is a dearth of empirical evidence on the out-of-sample
accuracy of such methods. This is often because the methods have been used to forecast sales
for many years ahead so that the accuracy of the forecast is still awaited. The mobile industry,
with its short PLCs would seem to be ideal for obtaining this evidence at an early stage.

18
Research into individual management judgment in this context is also a neglected area. Most
research has focussed on time series extrapolation or event forecasting. There is huge scope
here for testing the effectiveness of techniques like providing feedback, decomposition, and
judgmental bootstrapping,
Overall it seems most likely that a combination of complementary methods will lead to the
greatest accuracy. This has proved to be the case in other areas of forecasting and it is
important for future researchers to establish whether this is the case here and, if it is, how
such combinations can be implemented in the most effective way.
19
References Angelus, A. and Porteus, E.L. 2002, “Simultaneous capacity and production management of short life cycle, product to stock goods under stochastic demand”, Management Science, 48(3), pp. 399-413
Apple UK Website, available from: http://www.apple.com/uk/iphone/compare-iphones/ [Last access 3 May, 2012]
Armstrong, J. S. 2006, “How to make better forecasts and decisions: Avoid face-to-face meetings”, Foresight - The International Journal of Applied Forecasting, 5, pp. 3-8.
Bass, F.M. 1969, “A New Product Growth Model for Consumer Durables”, Management Science, 15, pp. 215-227.
Baum J. and Dennis K., 1961, The estimation of the expected brand share of a new product, VIIth ESOMAR/WAPOR Congress
Bose, R. 2002, “Customer relationship management: key components for IT success”, Industrial Management and Data Systems, 102 (2), P89-97.
Cox, W. E. 1967, “Product Life Cycles as Marketing Models”, The Journal of Business,40(4), pp. 375-84
Day G. S. 1981, “The Product Life Cycle: Analysis and Applications Issues”, Journal of Marketing, 45(4), pp. 60-6
Decker, R., and Gnibba-Yakawa, K. 2010. “Sales Forecasting in High-Technology Markets: A Utility-Based Approach”, Journal of Product Innovation Management, 27, pp.115-29.
Dyussekeneva K., Meeran S. nnd Goodwin P. forthcoming, “Forecasting sales time series for new products: methods and challenges”
Everret, R. 1962, “The diffusion of innovations”, The Free Press, New York.
Fader, P. S., Hardie, B. G. S. and Zeithammer, R. 2003, “Forecasting New Product Trial in a Controlled Test Market Environment”, Journal of Forecasting, 22, pp. 391–410
Fildes, Robert., and V. Kumar.2002. “Telecommunications Demand Forecasting—A Review”, International Journal of Forecasting, 18, pp. 489–522.
Forbes A., “Mobile Telephony, first the revolution, now the evolution”, CMI annual dinner and joint meeting with the IET presentation, Bath Spa Hotel, 17th January 2013
Fourt L. A, Woodlock J. W., 1960, “Early prediction of market success for new grocery products”, Journal of Marketing, 25, pp. 31–38
Funk J. L. 2004, “The Product Life Cycle Theory and Product Line Management: The Case of Mobile Phones”, IEEE TRANSACTIONS ON ENGINEERING MANAGEMENT, 51(2), pp. 142-52

20
Gallo, A. 1992, “Record number of new products in 1991”, Food Review, July-September, p.19 Gardner, D. 1987, “The product life cycle: a critical look at the literature”, Review of Marketing, pp.162-94
Goodwin, Paul., Dyussekeneva, Karima and Meeran Sheik 2012. “The use of analogies in forecasting the annual sales of new electronics products”, IMA Journal of Management Mathematics, 2 January.
Golder, P. N. and Tellis G. J. 2004, “Growing, Growing, Gone: Cascades, Diffusion, and Turning Points in The Product Life Cycle”, Marketing Science, 23 (2), pp. 207-218
Graefe A. And Armstrong S. J. 2011, “Comparing Face-to-Face Meetings, Nominal Groups, Delphi and Prediction Markets on an Estimation Task”, International Journal of Forecasting, 27(1). pp. 183-195.
Green P. E., Krieger A. M. And Wind y. J. 2001, “Thirty Years of Conjoint Analysis: Reflections and Prospects”, Interfaces, 31(3), pp. S56-S73
Greene, W. H. (2009), Discrete choice modelling; Mills T. and Patterson K. (eds), Palgrave Handbook of Econometrics: Volume 2: Applied Econometrics; London: Palgrave
Gregg, J.V., Hossell C. H. and Richardson, J. T., 1964, Mathematical trend curves:an aid to forecasting. Edinbrugh: Oliver & Boyd
Gupta, Sechin., Dipak C. Jain., and Mohanbir S. Sawhney. 1999. “Modeling The`Evolution of Markets with Indirect Network Externalities: An Application to Digital Television”, Marketing Science, 18, pp.396-416.
Gustafsson A., Herrmann A. and Huber F., 2007, Conjoint Measurement: methods and applications (4th ed.),Berlin:Springer
Hofmann, P. and Reiner, G. 2006, “Drivers for improving supply chain performance – an empirical study”, International Journal of Integrated Supply Management, 2(3), pp.214–30.
International Telecommunication Union, 2011, Available from: http://www.itu.int/ITU-D/icteye/Reporting/ShowReportFrame.aspx?ReportName=/WTI/CellularSubscribersPublic&ReportFormat=HTML4.0&RP_intYear=2009&RP_intLanguageID=1&RP_bitLiveData=False [Last accessed 6 January 2011]
Ivanov A., 2009, “Using Prediction Markets to Harness Collective Wisdom for Forecasting”, Journal of Business Forecasting, Fall, pp. 9-14
Jensen, W. 1982, “Grocery product exhibit different life cycle curve”, Marketing News, 6 August, p.6
Jun, D. B. and Park, Y. S. 1999, “A choice based diffusion model for multiple generations of products”, Technological Forecasting and Social Change, 61, pp. 45– 58
Kahn, K. B. 2002, “An Explanatory Investigation of New Product Forecasting Practices”, Journal of Product Innovation Management, 19, pp. 133-143.
21
Kahn, K. B. 2006, New Product Forecasting: An Applied Approach. Armonk, NY: ME Sharpe.
Kalchschmidt, M., Nieto Y. and Reiner, G. 2010, “The impact of forecasting on operational performance: Mediation effects through flexibility enablers”, Operations Management Research, 3, pp. 129-137
Kim, Sang-Hoon., and V. Srinivasan. 2009, “A Conjoint-Hazard Model of the Timing of Buyers’ Upgrading to Improved Versions of High-Technology Products”, Journal of Product Innovation Management, 26, pp. 278-290.
Kotler P., Wong V., Saunders J. and Armstrong G. 2005, “Principles of Marketing”, 4th
Edition, Harlow, England: Pearson Education Limited
Kumar, V. and Krishnan, T. V. 2002, “Multinational diffusion models: An alternative framework”, Marketing Science, 21, pp. 318– 330
Kurawarwala A. A. and Matsuo H. 1998, “Product Growth Models for Medium-Term Forecasting of Short Life Cycle Products”, Technological Forecasting and Social Change, 57, pp. 169–196
Lee, J., Cho Y., Lee, J. D. and Lee. C.Y. 2006, “Forecasting Future Demand For Large-Screen Television Sets Using Conjoint Analysis With Diffusion Model”, Technological Forecasting & Social Change, 73, pp. 362–376.
Lee C. Y., Lee J. D. and Kim Y. B. 2007, “Demand forecasting for new technology with a short history in a competitive environment: the case of the home networking market in South Korea”, Technological Forecasting and Social Change, 75(1), pp. 91-106
Lee, J. and Cho, Y. 2009, “Demand forecasting of diesel passenger car considering consumer preference and government regulation in South Korea”, Transportation Research Part A-Policy and Practice, 43(4), pp. 420-429
Lynn, G. S., Schnaars S. P. and Skov R. B. 1999, “Survey of New Product Forecasting Practices in Industrial High Technology and Low Technology Businesses”, Industrial Marketing Management, 28, pp. 565–571.
Mahajan, V., Muller, E., and Wind, Y. 2000, New product diffusion models; London. Kluwer Academic Publishers
Malhorta, N. K. and Birks, D.F. 2007, Marketing Research: An Applied Approach, 3rd ed., Prentice-Hall, London, England.
Meade, N. and Islam, T. (1995), “Growth curve forecasting: An empirical comparison”, International Journal of Forecasting, 11(2), pp. 199– 215.
Meade, N. and Islam, T. (2006), “Modelling and forecasting the diffusion of innovation – A 25-year review”, International Journal of Forecasting, 22(3), pp. 519–545
22
Mobile Phone History, 2012, Available from: http://www.mobilephonehistory.co.uk/history/mobile_phone_history.php [Last accessed 1 Sep 2012]
Morwitz, V. G. 2001. “Methods for forecasting from intentions data”, pp. 33-56 in: Principles of Forecasting: A Handbook for Researchers and Practitioners. Edited by J. Scott Armstrong,. Boston: Kluwer, pp.33-56.
Parker, Philip M. 1994. “Aggregate Diffusion Forecasting Models in Marketing: A Critical Review”, International Journal of Forecasting, 10, pp. 353-380.
Qian L. 2012, “Essays on Forecasting Demand and Preferences for Cars in emerging Markets: The Case of china”, Thesis (PhD), Lancaster University.
Reiner, G. ,Natter M. and Drechsler W. 2009, “Life cycle profit – reducing supply risks by integrated demand management”, Technology Analysis & Strategic Management, 21(5), pp. 653–664.
Research and Market website, 2011, Available from: http://www.researchandmarkets.com/research/d49230/mobile_phones_in_t [Last accessed 7 January 2011]
Rink, D. and Swan, J. 1979, “Product life cycle research: a literature review”, Journal of Business Research, 7(3), pp. 219-44
Routers, 2012, available from: http://www.reuters.com/article/2012/03/15/corporate-ethics-idUSL2E8ED84M20120315 [Last accessed 3 May 2012]
Rowe, G. and Wright, G. 1999, “The Delphi technique as a forecasting tool: Issues and analysis”, International Journal of Forecasting, 15, pp.353-375.
Sek, Y.W., Lau, S. H., Teoh, K. K., Law, C.Y. and Parumo S. B. 2010, “Prediction of user acceptance and adoption of smart phone for learning with technology acceptance model”, Journal of Applied Sceince, 10(20), pp.2395-2402
Silver, A., Pyke D. and Peterson A.1998, “Inventory management and production planning and scheduling”, 3rd Edition, NewYork, Wiley.
Sousa C. and Bradley F. 2009, “Price adaptation in export markets”, European Journal of Marketing, 43(3/4), pp. 438-458.
Srinivasan, V. and Mason, C. H., 1986, “Technical Note: Nonlinear Least squares Estimation of New Product Diffusion Models”, Marketing Science, 5, pp. 169-178
Subrahmanyan S. 2000, “Using quantitative models for setting retail prices”, Journal of Product and Brand Management, 9(5), pp. 304-315.
Teardown Report (2001), access from: http://www.teardown.com/allreports/Ericsson_R380_SmartPhone_Teardown_Analysis[Last accessed 3 May 2012]
23
Telecom Market Research Website, 2011, Available from: http://www.telecomsmarketresearch.com/resources/UK_Mobile_Operator_Subscriber_Statistics_2.shtml#Mobile_Operator_Market_Share_1Q10 [Last accessed 9 January 2011]
Tibben-Lembke R. S. 2002, “Life after death: reverse logistic and product life cycle”, International Jounal of Physical Distribution and Logistics Managements, 32(3), pp. 233-44
Van de Ven, A. H. and Delbecq, A. L. 1974, “The effectiveness of nominal, Delphi, and interacting group decision making processes”, Academy of Management Journal, 17, pp. 605-621.
Weng, Z. K. 1999, “The power of coordinated decisions for short-life-cycle products in a manufacturing and distribution supply chain”, IIE Transactions, 31, pp. 1037-1049 Winer, R. 1986. “A reference price model of brand choice for frequently purchased products”, Journal of Consumer Research, 13(2), pp. 250–6.
Wind, Y., Mahajan V. and Cardozo R. N. (eds), 1981, New Product Forecasting. Lexington, Mass.: Lexington Books.