New Home Construction April 2011
10
FOR IMMEDIATE RELEASE TUESDAY, MAY 17, 2011 AT 8:30 A.M. EDT CB11-87 Erica Filipek or Stephen Cooper Manufacturing and Construction Division (301) 763-5160 NEW RESIDENTIAL CONSTRUCTION IN APRIL 2011 The U.S. Census Bureau and the Department of Housing and Urban Development jointly announced the following new residential construction statistics for April 2011: BUILDING PERMITS Privately-owned housing units authorized by building permits in April were at a seasonally adjusted annual rate of 551,000. This is 4.0 percent (±1.1%) below the revised March rate of 574,000 and is 12.8 percent (±1.2%) below the revised April 2010 estimate of 632,000. Single-family authorizations in April were at a rate of 385,000; this is 1.8 percent (±1.0%) below the revised March figure of 392,000. Authorizations of units in buildings with five units or more were at a rate of 143,000 in April. HOUSING STARTS Privately-owned housing starts in April were at a seasonally adjusted annual rate of 523,000. This is 10.6 percent (±13.0%)* below the U.S. Census Bureau News Joint Release U.S. Department of Housing and Urban Developm ent U.S. De partment of Commerce Washington, D.C. 20233 revised March estimate of 585,000 and is 23.9 percent (±7.0%) below the revised April 2010 rate of 87,000. Single-family housing starts in April were at a rate of 394,000; this is 5.1 percent (±10.2%)* below the revised March figure of 415,000. The April rate for units in buildings with five units or more was 114,000. HOUSING COMPLETIONS Privately-owned housing completions in April were at a seasonally adjusted annual rate of 554,000. This is 4.1 percent (±15.2%)* above the revised March estimate of 532,000, but is 25.5 percent (±8.6%) below the revised April 2010 rate of 744,000. Single-family housing completions in April were at a rate of 420,000; this is 14.4 percent (±12.8%) above the revised March figure of 367,000. The April rate for units in buildings with five units or more was 118,000. New Residential Construction data for May 2011 will be released on Thursday, June 16, 2011, at 8:30 A.M. EDT. Our Internet site is: http://www.census.gov/newresconst EXPLANATORY NOTES * http://www.census.gov/newresconst In interpreting changes in the statistics in this releas e, note that month-to-month changes in seasonally adjusted statistics often show movements which may be irregular. It may take 2 months to establish an underlying trend for building permit authorizations, 4 months for total starts, and 5 months for total completions. The statistics in this release are estima ted from sample surveys and are subject to sampling variability as well as nonsampling error including bias and variance from response, nonreporting, and undercoverage. Estimated relative standard errors of the most recent data are s hown in the tables. Whenev er a statement such as “2.5 percent ( 3.2%) above” appe ars in the text, this indicates the range (-0.7 to +5.7 percent) in which the actual perce nt change is likely to have occurred. All ranges given for percent changes are 90-percent confidence intervals and account only for sam pling variability. If a range does not contain zero, the change is statistically significant. If it does contain zero, the change is not statistically significant; that is, it is uncertain whether there was an increase or decrease. The same policies apply to the confidence intervals for percent changes shown in the tables. On average, the preliminary seasonal ly adjusted estimates of total building permits, housing starts and housing completions are revised about two percent or less. Explanations of confidence intervals and samp ling variability can be found on our web site listed above. Unadjusted estimates of housing units authorized by building permits for January through December 2010 have been revised. Also, seasonally adjusted estimates of housing units authorized by building permits, started, under construction, and completed for January 2009 through March 2011 have been revised. U.S. Census Bureau News Joint Release U.S. Department of Housing and Urban Developm ent U.S. De partment of Commerce Washington, D.C. 20233 * con ence nterva ncu es zero. e ensus ur ea u oes no t ave su c ent stat st ca ev ence to co nc u e t at t e ac tua c ange s er ent rom ze ro. http://www.census.gov/newresconst In interpreting changes in the statistics in this releas e, note that month-to-month changes in seasonally adjusted statistics often show movements which may be irregular. It may take 2 months to establish an underlying trend for building permit authorizations, 4 months for total starts, and 5 months for total completions. The statistics in this release are estima ted from sample surveys and are subject to sampling variability as well as nonsampling error including bias and variance from response, nonreporting, and undercoverage. Estimated relative standard errors of the most recent data are s hown in the tables. Whenev er a statement such as “2.5 percent ( 3.2%) above” appe ars in the text, this indicates the range (-0.7 to +5.7 percent) in which the actual perce nt change is likely to have occurred. All ranges given for percent changes are 90-percent confidence intervals and account only for sam pling variability. If a range does not contain zero, the change is statistically significant. If it does contain zero, the change is not statistically significant; that is, it is uncertain whether there was an increase or decrease. The same policies apply to the confidence intervals for percent changes shown in the tables. On average, the preliminary seasonal ly adjusted estimates of total building permits, housing starts and housing completions are revised about two percent or less. Explanations of confidence intervals and samp ling variability can be found on our web site listed above. Unadjusted estimates of housing units authorized by building permits for January through December 2010 have been revised. Also, seasonally adjusted estimates of housing units authorized by building permits, started, under construction, and completed for January 2009 through March 2011 have been revised. U.S. Census Bureau News Joint Release U.S. Department of Housing and Urban Developm ent U.S. De partment of Commerce Washington, D.C. 20233
-
Upload
coy-davidson -
Category
Documents
-
view
218 -
download
0
Transcript of New Home Construction April 2011

8/6/2019 New Home Construction April 2011
http://slidepdf.com/reader/full/new-home-construction-april-2011 1/10
FOR IMMEDIATE RELEASE TUESDAY, MAY 17, 2011 AT 8:30 A.M. EDT
CB11-87
Erica Filipek or Stephen CooperManufacturing and Construction Division
(301) 763-5160
NEW RESIDENTIAL CONSTRUCTION IN APRIL 2011
The U.S. Census Bureau and the Department of Housing and Urban Development jointly announced the following new residential
construction statistics for April 2011:
BUILDING PERMITS
Privately-owned housing units authorized by building permits in April were at a seasonally adjusted annual rate of 551,000.
This is 4.0 percent (±1.1%) below the revised March rate of 574,000 and is 12.8 percent (±1.2%) below the revised April 2010 estimate
of 632,000.Single-family authorizations in April were at a rate of 385,000; this is 1.8 percent (±1.0%) below the revised March figure of 392,000.
Authorizations of units in buildings with five units or more were at a rate of 143,000 in April.
HOUSING STARTS
Privately-owned housing starts in April were at a seasonally adjusted annual rate of 523,000. This is 10.6 percent (±13.0%)* below the
U.S. Census Bureau News
Joint Release
U.S. Department of Housing and Urban Development
U.S. Department of Commerce Washington, D.C. 20233
revised March estimate of 585,000 and is 23.9 percent (±7.0%) below the revised April 2010 rate of 87,000.
Single-family housing starts in April were at a rate of 394,000; this is 5.1 percent (±10.2%)* below the revised March figure of
415,000. The April rate for units in buildings with five units or more was 114,000.
HOUSING COMPLETIONS
Privately-owned housing completions in April were at a seasonally adjusted annual rate of 554,000. This is 4.1 percent (±15.2%)*
above the revised March estimate of 532,000, but is 25.5 percent (±8.6%) below the revised April 2010 rate of 744,000.
Single-family housing completions in April were at a rate of 420,000; this is 14.4 percent (±12.8%) above the revised March figure of
367,000. The April rate for units in buildings with five units or more was 118,000.
New Residential Construction data for May 2011 will be released on Thursday, June 16, 2011, at 8:30 A.M. EDT.
Our Internet site is: http://www.census.gov/newresconst
EXPLANATORY NOTES
*
http://www.census.gov/newresconst
In interpreting changes in the statistics in this release, note that month-to-month changes in seasonally adjusted statistics often show movements which may be irregular. I
may take 2 months to establish an underlying trend for building permit authorizations, 4 months for total starts, and 5 months for total completions. The statistics in thisrelease are estimated from sample surveys and are subject to sampling variability as well as nonsampling error including bias and variance from response, nonreporting,and undercoverage. Estimated relative standard errors of the most recent data are shown in the tables. Whenever a statement such as “2.5 percent ( 3.2%) above” appears
in the text, this indicates the range (-0.7 to +5.7 percent) in which the actual percent change is likely to have occurred. All ranges given for percent changes are 90-percentconfidence intervals and account only for sampling variability. If a range does not contain zero, the change is statistically significant. If it does contain zero, the change isnot statistically significant; that is, it is uncertain whether there was an increase or decrease. The same policies apply to the confidence intervals for percent changes
shown in the tables. On average, the preliminary seasonally adjusted estimates of total building permits, housing starts and housing completions are revised about twopercent or less. Explanations of confidence intervals and sampling variability can be found on our web site listed above.
Unadjusted estimates of housing units authorized by building permits for January through December 2010 have been revised.
Also, seasonally adjusted estimates of housing units authorized by building permits, started, under construction, and completed
for January 2009 through March 2011 have been revised.
U.S. Census Bureau News
Joint Release
U.S. Department of Housing and Urban Development
U.S. Department of Commerce Washington, D.C. 20233
* con ence nterva nc u es zero. e ensus ureau oes not ave su c ent stat st ca ev ence to conc u e t at t e actua c ange s erent rom zero.
http://www.census.gov/newresconst
In interpreting changes in the statistics in this release, note that month-to-month changes in seasonally adjusted statistics often show movements which may be irregular. I
may take 2 months to establish an underlying trend for building permit authorizations, 4 months for total starts, and 5 months for total completions. The statistics in thisrelease are estimated from sample surveys and are subject to sampling variability as well as nonsampling error including bias and variance from response, nonreporting,and undercoverage. Estimated relative standard errors of the most recent data are shown in the tables. Whenever a statement such as “2.5 percent ( 3.2%) above” appears
in the text, this indicates the range (-0.7 to +5.7 percent) in which the actual percent change is likely to have occurred. All ranges given for percent changes are 90-percentconfidence intervals and account only for sampling variability. If a range does not contain zero, the change is statistically significant. If it does contain zero, the change isnot statistically significant; that is, it is uncertain whether there was an increase or decrease. The same policies apply to the confidence intervals for percent changes
shown in the tables. On average, the preliminary seasonally adjusted estimates of total building permits, housing starts and housing completions are revised about twopercent or less. Explanations of confidence intervals and sampling variability can be found on our web site listed above.
Unadjusted estimates of housing units authorized by building permits for January through December 2010 have been revised.
Also, seasonally adjusted estimates of housing units authorized by building permits, started, under construction, and completed
for January 2009 through March 2011 have been revised.
U.S. Census Bureau News
Joint Release
U.S. Department of Housing and Urban Development
U.S. Department of Commerce Washington, D.C. 20233

8/6/2019 New Home Construction April 2011
http://slidepdf.com/reader/full/new-home-construction-april-2011 2/10
Table 1. New Privately-Owned Housing Units Authorized in Permit-Issuing Places
[Thousands of units. Detail may not add to total because of rounding]
2 to 4 5 units
Total 1 unit units or more Total 1 unit Total 1 unit Total 1 unit Total 1 unit
2009:r
January 545 337 23 185 59 41 89 53 282 179 115 64
February 558 377 20 161 74 38 89 61 296 213 99 65March 513 361 21 131 61 38 86 55 262 201 104 67
April 521 391 21 109 58 41 83 61 270 206 110 83
May 556 431 21 104 64 44 95 78 285 220 112 89
June 601 458 25 118 63 45 100 78 320 243 118 92
July 595 489 19 87 64 48 109 85 292 255 130 101
August 616 491 20 105 70 48 106 90 316 253 124 100
September 609 477 19 113 70 49 105 81 309 249 125 98
October 583 472 16 95 67 51 104 80 299 246 113 95
November 623 483 26 114 74 50 114 82 318 253 117 98
December 664 508 18 138 101 53 116 82 319 267 128 106
2010:r
January 636 508 20 108 74 50 98 86 319 261 145 111
February 655 514 22 119 87 66 109 82 311 258 148 108
March 688 533 23 132 71 51 117 86 355 288 145 108
April 632 473 19 140 72 47 116 78 316 253 128 95
May 582 435 20 127 66 47 103 73 300 230 113 85
June 585 423 21 141 79 47 96 74 293 218 117 84
July 575 409 22 144 63 43 102 71 297 213 113 82
August 575 405 21 149 70 43 98 71 280 210 127 81
September 562 403 25 134 68 44 96 70 287 208 111 81
October 555 407 24 124 65 44 111 74 269 207 110 82
November 564 420 20 124 64 48 94 78 283 215 123 79
December 630 445 25 160 114 70 97 66 257 211 162 98
2011: Januaryr 568 419 20 129 77 49 94 65 286 216 111 89
Februaryr
534 382 15 137 63 39 86 59 288 209 97 75
Marchr
574 392 16 166 60 37 94 64 296 215 124 76
Aprilp
551 385 23 143 60 36 89 64 279 205 123 80
Average RSE (%)1 1 1 8 4 5 4 2 2 1 1 3 2
Percent Change:
April 2011 from March 2011 -4.0% -1.8% 43.8% -13.9% 0.0% -2.7% -5.3% 0.0% -5.7% -4.7% -0.8% 5.3%
90% Con idence Interval2 ± 1.1 ± 1.0 ± 3.8 ± 3.7 ± 2.7 ± 3.5 ± 3.4 ± 3.8 ± 1.4 ± 1.6 ± 3.1 ± 3.8
April 2011 from April 2010 -12.8% -18.6% 21.1% 2.1% -16.7% -23.4% -23.3% -17.9% -11.7% -19.0% -3.9% -15.8%
90% Confidence Interval2 ± 1.2 ± 0.9 ± 6.6 ± 2.5 ± 4.1 ± 5.3 ± 2.9 ± 3.2 ± 1.1 ± 1.3 ± 2.8 ± 3.4
See footnotes at end of table.
Seasonally adjusted annual rate
PeriodIn structures with --
NortheastUnited States Midwest South West

8/6/2019 New Home Construction April 2011
http://slidepdf.com/reader/full/new-home-construction-april-2011 3/10
Table 1. New Privately-Owned Housing Units Authorized in Permit-Issuing Places - Continued
[Thousands of units. Detail may not add to total because of rounding]
2 to 4 5 units
Total 1 unit units or more Total 1 unit Total 1 unit Total 1 unit Total 1 unit
2009 583.0 441.1 20.7 121.1 68.5 45.8 100.3 74.9 297.4 231.8 116.7 88.7
2010r 604.6 447.3 22.0 135.3 73.8 49.1 103.5 75.4 299.1 232.3 128.2 90.6
RSE (%) (X) (X) (X) (X) (X) (X) (X) (X) (X) (X) (X) (X)
2010: First 4 months3
205.0 162.5 6.2 36.3 21.3 15.0 30.6 24.3 107.6 89.3 45.5 33.8
2011: First 4 months3
176.1 126.4 5.6 44.1 18.0 11.2 25.2 18.7 96.1 71.2 36.8 25.3
RSE (%) 1 1 3 (Z) 4 4 1 1 1 1 2 2
Year to Date Percent Change 4 -14.1% -22.2% -9.7% 21.4% -15.2% -25.5% -17.5% -23.0% -10.7% -20.3% -19.2% -25.3%
90% Confidence Interval2 ± 1.3 ± 1.1 ± 9.5 ± 3.5 ± 5.8 ± 7.4 ± 1.9 ± 2.2 ± 1.3 ± 1.5 ± 2.2 ± 2.7
2009: January 37.6 22.1 1.5 14.0 3.6 2.5 4.5 2.3 21.3 13.1 8.1 4.1
February 39.2 26.3 1.3 11.6 4.2 2.0 4.7 3.5 22.9 16.3 7.4 4.5
March 45.4 32.7 2.0 10.7 4.6 3.0 6.9 4.8 24.7 18.9 9.1 6.0
April 47.8 37.8 1.7 8.3 5.3 3.7 8.0 6.6 24.5 19.5 10.0 8.0
May 49.5 39.5 1.7 8.3 5.4 4.0 9.0 7.7 24.9 19.5 10.1 8.2
June 61.3 47.0 2.4 11.9 7.0 4.6 10.6 8.4 31.6 24.1 12.1 9.9
July 56.1 46.9 1.7 7.5 6.3 4.8 11.0 8.5 26.7 23.9 12.2 9.8
August 54.0 42.9 1.7 9.3 6.3 4.3 9.6 8.0 27.5 21.9 10.6 8.7
September 52.9 40.7 1.8 10.4 6.4 4.5 10.2 7.5 25.6 20.4 10.8 8.3
October 47.9 38.6 1.3 8.0 6.2 4.5 10.0 7.4 22.3 18.9 9.4 7.6
November 42.1 31.9 2.1 8.1 5.6 3.7 8.2 5.7 20.9 16.4 7.4 6.2
December 49.2 34.7 1.4 13.1 7.8 4.0 7.6 4.6 24.4 18.7 9.4 7.4
2010:r
January 40.4 31.4 1.3 7.6 4.2 3.0 4.6 3.5 22.2 18.1 9.4 6.8
February 45.3 35.4 1.4 8.5 4.9 3.5 5.7 4.6 23.8 19.7 10.9 7.5
March 64.1 50.9 2.2 11.0 5.7 4.2 9.8 7.9 34.8 28.4 13.8 10.4
April 58.9 46.1 1.6 11.2 6.5 4.3 11.4 8.6 29.3 24.2 11.7 9.0
May 51.1 39.9 1.7 9.5 5.8 4.4 9.7 7.3 25.8 20.5 9.9 7.8
June 59.2 42.9 2.1 14.2 8.6 4.8 10.0 7.9 28.6 21.3 12.0 8.9
July 51.6 37.5 1.8 12.2 5.8 4.0 9.8 6.8 26.0 19.2 10.0 7.6
August 53.7 37.2 1.9 14.5 6.4 4.1 9.7 6.6 26.2 19.2 11.4 7.3
September 48.5 34.3 2.3 11.9 6.3 4.1 9.0 6.4 23.6 17.0 9.6 6.9
October 43.5 31.5 1.9 10.1 5.6 3.7 10.2 6.5 19.0 15.0 8.6 6.2
November 40.9 29.6 1.7 9.6 5.1 3.8 7.4 5.8 19.9 14.8 8.4 5.3
December 47.6 30.6 2.0 15.0 8.9 5.3 6.3 3.6 19.9 14.8 12.5 6.9
2011: January 36.0 26.3 1.2 8.5 4.6 2.9 4.4 2.7 19.9 15.1 7.2 5.5
February 37.2 26.5 1.0 9.7 3.6 2.0 4.5 3.3 22.0 15.9 7.1 5.2
Marchr
53.7 37.6 1.4 14.7 4.7 3.0 8.0 6.0 29.4 21.3 11.6 7.3
Aprilp
48.8 36.0 1.9 10.9 5.1 3.1 8.4 6.8 24.3 18.8 11.0 7.4
Average RSE (%)1
1 1 8 4 5 4 2 2 1 1 3 2
pPreliminary.
rRevised. RSE Relative standard error. S Does not meet publication standards because tests for identifiable and stable seasonality do not meet reliability standards.
X Not applicable. Z Relative standard error is less than 0.5 percent.1Average RSE for the latest 6-month period.
2See the Explanatory Notes in the accompanying text for an explanation of 90% confidence intervals
3Reflects revisions not distributed to months.
4Computed using unrounded data.
Not seasonally adjusted
PeriodIn structures with --
NortheastUnited States Midwest South West

8/6/2019 New Home Construction April 2011
http://slidepdf.com/reader/full/new-home-construction-april-2011 4/10
Table 2. New Privately-Owned Housing Units Authorized, but Not Started, at End of Period
[Not seasonally adjusted. Thousands of units. Detail may not add to total because of rounding]
2 to 4 5 units
Total 1 unit units or more Total 1 unit Total 1 unit Total 1 unit Total 1 unit
2009: January 118.1 62.2 5.6 50.2 13.4 7.2 14.3 6.2 58.1 33.9 32.4 14.9
February 112.9 61.5 5.9 45.6 13.7 7.5 13.4 6.9 54.5 33.0 31.4 14.0
March 106.4 60.7 4.2 41.5 12.1 6.3 11.4 7.1 51.1 33.3 31.8 14.1
April 109.1 64.0 4.1 41.0 12.4 6.5 12.3 8.0 53.7 34.5 30.8 15.1
May 102.9 63.1 4.2 35.6 11.6 6.4 13.2 8.3 51.4 34.2 26.7 14.3
June 103.2 61.9 4.8 36.5 10.6 6.0 12.5 7.6 53.7 34.6 26.3 13.8
July 99.9 60.9 3.4 35.6 9.6 5.3 12.0 7.7 52.8 35.5 25.6 12.5
August 97.1 59.1 3.4 34.5 8.7 5.0 10.8 7.1 53.5 36.0 24.0 11.0
September 91.6 55.1 3.4 33.1 8.8 5.0 10.3 6.4 50.8 33.4 21.7 10.3
October 90.9 53.2 4.4 33.4 8.8 5.1 10.7 6.3 50.1 32.1 21.3 9.7
November 87.7 49.2 4.4 34.1 8.7 5.2 9.6 5.3 48.7 29.7 20.6 9.0
December 95.4 55.3 3.3 36.7 10.4 6.5 10.1 5.1 52.9 33.7 22.0 10.1
2010: January 93.6 55.1 3.6 34.9 9.8 6.3 9.8 5.2 51.4 33.5 22.6 10.2
February 96.2 55.3 3.3 37.7 10.5 6.8 9.1 4.8 53.9 33.7 22.8 10.0
March 100.8 58.6 3.6 38.6 11.0 7.1 11.4 7.1 54.8 33.8 23.5 10.6
April 93.3 53.0 3.6 36.7 9.9 6.3 10.9 6.8 49.7 29.2 22.8 10.7
May 87.7 50.7 3.7 33.4 9.0 5.3 9.2 5.6 48.0 29.7 21.5 10.0
June 92.5 51.3 4.2 37.0 11.5 5.8 9.7 6.2 49.2 29.5 22.1 9.8
July 90.1 50.3 3.5 36.3 10.0 5.5 9.1 6.0 49.0 28.6 22.0 10.1
August 87.0 48.8 3.7 34.4 10.2 6.0 8.0 5.2 48.3 28.3 20.5 9.3
September 80.8 49.3 3.2 28.2 9.9 6.0 7.6 5.3 44.5 29.1 18.7 9.0
October 78.8 47.3 3.0 28.5 8.6 5.1 8.3 5.6 42.6 26.9 19.3 9.6
November 75.0 43.6 2.5 28.9 7.9 5.1 7.0 4.9 40.5 24.0 19.7 9.6
December 84.8 47.2 2.3 35.2 11.9 7.0 7.6 5.3 42.2 24.5 23.1 10.5
2011: January 79.4 46.3 2.3 30.7 11.5 7.6 6.2 4.5 39.5 24.1 22.2 10.2
Februaryr
79.3 46.3 2.0 30.9 11.0 7.6 6.9 4.8 38.8 23.7 22.6 10.3
Marchr
81.4 48.0 1.8 31.6 10.2 7.3 8.4 5.7 38.3 24.3 24.5 10.7
Aprilp
81.2 48.1 2.1 30.9 9.8 6.7 8.6 6.7 38.1 23.8 24.7 10.9
Average RSE (%)1
6 8 17 8 16 17 12 14 8 10 12 18
Percent Chan e: 2
April 2011 from March 2011 -0.3% 0.3% 18.4% -2.2% -4.0% -8.9% 2.2% 17.3% -0.5% -1.8% 0.8% 2.3%
90% Con idence Interval3 ± 3.5 ± 3.4 ± 46.3 ± 6.9 ± 14.9 ± 9.3 ± 9.8 ± 13.0 ± 5.6 ± 6.0 ± 6.1 ± 5.6
April 2011 from April 2010 -13.0% -9.2% -40.6% -15.8% -1.1% 6.3% -21.8% -2.0% -23.3% -18.4% 8.3% 2.4%
90% Confidence Interval3 ± 9.7 ± 8.6 ± 19.3 ± 17.1 ± 23.1 ± 20.7 ± 13.0 ± 14.9 ± 14.4 ± 11.5 ± 14.0 ± 19.5
pPreliminary.
rRevised. RSE Relative Standard Error.
1Average RSE for the latest 6-month period.
2Computed using unrounded data.
3See the Explanatory Notes in the accompanying text for an explanation of 90% confidence intervals.
Note: These data represent the number of housing units authorized in all months up to and including the last day of the reporting period and not started as of that date without regard to the
months of original permit issuance. Cancelled, abandoned, expired, and revoked permits are excluded.
Period
South West
In structures with --
United States Northeast Midwest

8/6/2019 New Home Construction April 2011
http://slidepdf.com/reader/full/new-home-construction-april-2011 5/10
Table 3. New Privately-Owned Housing Units Started
[Thousands of units. Detail may not add to total because of rounding]
2 to 4 5 units
Total 1 unit units or more Total 1 unit Total 1 unit Total 1 unit Total 1 unit
2009:r
January 490 358 (S) 119 36 26 59 47 254 200 141 85
February 582 358 (S) 210 63 37 95 55 311 207 113 59
March 505 353 (S) 122 66 42 96 58 264 189 79 64
April 478 387 (S) 80 50 40 86 68 230 197 112 82
May 540 408 (S) 124 56 35 79 71 273 212 132 90
June 585 482 (S) 93 80 49 104 87 277 242 124 104
July 594 509 (S) 70 61 53 110 87 297 258 126 111
August 586 487 (S) 93 69 45 104 85 286 244 127 113
September 585 510 (S) 66 66 51 105 86 297 272 117 101
October 534 476 (S) 53 54 46 103 83 266 249 111 98
November 588 497 (S) 81 67 47 104 75 301 267 116 108
December 581 484 (S) 84 63 49 97 83 313 259 108 93
2010:r
January 615 510 (S) 98 69 57 93 77 326 272 127 104
February 603 522 (S) 64 73 55 108 97 280 256 142 114
March 626 531 (S) 87 65 57 93 83 334 281 134 110
April 687 566 (S) 108 85 57 119 93 374 317 109 99
May 580 460 (S) 108 71 56 106 80 289 231 114 93
June 539 451 (S) 83 60 49 85 71 286 237 108 94
July 550 429 (S) 102 76 51 92 76 275 225 107 77
August 606 427 (S) 165 72 33 107 83 287 222 140 89
September 597 447 (S) 144 69 58 97 78 298 222 133 89
October 539 434 (S) 93 82 57 95 74 265 227 97 76
November 551 454 (S) 82 78 53 108 82 267 240 98 79
December 526 421 (S) 97 58 49 65 55 269 225 134 92
2011: Januaryr
636 437 (S) 187 94 46 115 86 306 208 121 97
Februaryr
518 388 (S) 112 55 34 63 61 310 221 90 72
Marchr
585 415 (S) 159 63 39 83 70 331 225 108 81
Aprilp
523 394 (S) 114 60 44 96 65 255 208 112 77
Average RSE (%)1
6 5 (X) 18 17 17 12 12 9 7 12 10
Percent Change:
April 2011 from March 2011 -10.6% -5.1% (S) -28.3% -4.8% 12.8% 15.7% -7.1% -23.0% -7.6% 3.7% -4.9%
90% Confidence Interval2 ± 13.0 ± 10.2 (X) ± 35.6 ± 35.7 ± 35.0 ± 31.6 ± 30.3 ± 16.5 ± 14.6 ± 37.8 ± 29.0
April 2011 from April 2010 -23.9% -30.4% (S) 5.6% -29.4% -22.8% -19.3% -30.1% -31.8% -34.4% 2.8% -22.2%
90% Confidence Interval2 ± 7.0 ± 5.7 (X) ± 34.7 ± 22.8 ± 21.2 ± 13.7 ± 13.4 ± 10.4 ± 8.8 ± 17.6 ± 11.5
See footnotes at end of table.
Seasonally adjusted annual rate
South West
Period
United States Northeast Midwest
In structures with --
8/6/2019 New Home Construction April 2011
http://slidepdf.com/reader/full/new-home-construction-april-2011 6/10
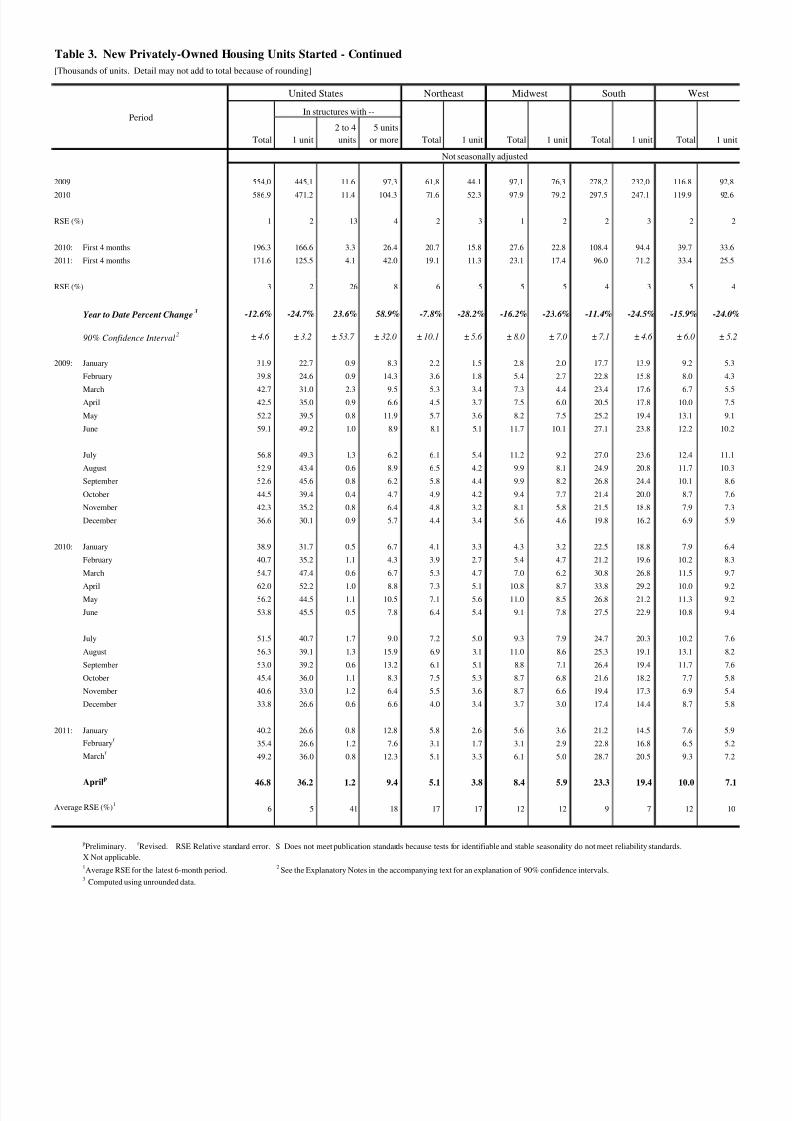
Table 3. New Privately-Owned Housing Units Started - Continued
[Thousands of units. Detail may not add to total because of rounding]
2 to 4 5 units
Total 1 unit units or more Total 1 unit Total 1 unit Total 1 unit Total 1 unit
2009 554.0 445.1 11.6 97.3 61.8 44.1 97.1 76.3 278.2 232.0 116.8 92.8
2010 586.9 471.2 11.4 104.3 71.6 52.3 97.9 79.2 297.5 247.1 119.9 92.6
RSE (%) 1 2 13 4 2 3 1 2 2 3 2 2
2010: First 4 months 196.3 166.6 3.3 26.4 20.7 15.8 27.6 22.8 108.4 94.4 39.7 33.6
2011: First 4 months 171.6 125.5 4.1 42.0 19.1 11.3 23.1 17.4 96.0 71.2 33.4 25.5
RSE (%) 3 2 26 8 6 5 5 5 4 3 5 4
Year to Date Percent Change 3 -12.6% -24.7% 23.6% 58.9% -7.8% -28.2% -16.2% -23.6% -11.4% -24.5% -15.9% -24.0%
90% Confidence Interval2 ± 4.6 ± 3.2 ± 53.7 ± 32.0 ± 10.1 ± 5.6 ± 8.0 ± 7.0 ± 7.1 ± 4.6 ± 6.0 ± 5.2
2009: January 31.9 22.7 0.9 8.3 2.2 1.5 2.8 2.0 17.7 13.9 9.2 5.3
February 39.8 24.6 0.9 14.3 3.6 1.8 5.4 2.7 22.8 15.8 8.0 4.3
March 42.7 31.0 2.3 9.5 5.3 3.4 7.3 4.4 23.4 17.6 6.7 5.5April 42.5 35.0 0.9 6.6 4.5 3.7 7.5 6.0 20.5 17.8 10.0 7.5
May 52.2 39.5 0.8 11.9 5.7 3.6 8.2 7.5 25.2 19.4 13.1 9.1
June 59.1 49.2 1.0 8.9 8.1 5.1 11.7 10.1 27.1 23.8 12.2 10.2
July 56.8 49.3 1.3 6.2 6.1 5.4 11.2 9.2 27.0 23.6 12.4 11.1
August 52.9 43.4 0.6 8.9 6.5 4.2 9.9 8.1 24.9 20.8 11.7 10.3
September 52.6 45.6 0.8 6.2 5.8 4.4 9.9 8.2 26.8 24.4 10.1 8.6
October 44.5 39.4 0.4 4.7 4.9 4.2 9.4 7.7 21.4 20.0 8.7 7.6
November 42.3 35.2 0.8 6.4 4.8 3.2 8.1 5.8 21.5 18.8 7.9 7.3
December 36.6 30.1 0.9 5.7 4.4 3.4 5.6 4.6 19.8 16.2 6.9 5.9
2010: January 38.9 31.7 0.5 6.7 4.1 3.3 4.3 3.2 22.5 18.8 7.9 6.4
February 40.7 35.2 1.1 4.3 3.9 2.7 5.4 4.7 21.2 19.6 10.2 8.3
March 54.7 47.4 0.6 6.7 5.3 4.7 7.0 6.2 30.8 26.8 11.5 9.7
April 62.0 52.2 1.0 8.8 7.3 5.1 10.8 8.7 33.8 29.2 10.0 9.2May 56.2 44.5 1.1 10.5 7.1 5.6 11.0 8.5 26.8 21.2 11.3 9.2
June 53.8 45.5 0.5 7.8 6.4 5.4 9.1 7.8 27.5 22.9 10.8 9.4
July 51.5 40.7 1.7 9.0 7.2 5.0 9.3 7.9 24.7 20.3 10.2 7.6
August 56.3 39.1 1.3 15.9 6.9 3.1 11.0 8.6 25.3 19.1 13.1 8.2
September 53.0 39.2 0.6 13.2 6.1 5.1 8.8 7.1 26.4 19.4 11.7 7.6
October 45.4 36.0 1.1 8.3 7.5 5.3 8.7 6.8 21.6 18.2 7.7 5.8
November 40.6 33.0 1.2 6.4 5.5 3.6 8.7 6.6 19.4 17.3 6.9 5.4
December 33.8 26.6 0.6 6.6 4.0 3.4 3.7 3.0 17.4 14.4 8.7 5.8
2011: January 40.2 26.6 0.8 12.8 5.8 2.6 5.6 3.6 21.2 14.5 7.6 5.9
Februaryr
35.4 26.6 1.2 7.6 3.1 1.7 3.1 2.9 22.8 16.8 6.5 5.2
Marchr
49.2 36.0 0.8 12.3 5.1 3.3 6.1 5.0 28.7 20.5 9.3 7.2
April
p
46.8 36.2 1.2 9.4 5.1 3.8 8.4 5.9 23.3 19.4 10.0 7.1
Average RSE (%)1
6 5 41 18 17 17 12 12 9 7 12 10
pPreliminary.
rRevised. RSE Relative standard error. S Does not meet publication standards because tests for identifiable and stable seasonality do not meet reliability standards.
X Not applicable.1Average RSE for the latest 6-month period.
2See the Explanatory Notes in the accompanying text for an explanation of 90% confidence intervals.
3Computed using unrounded data.
Not seasonally adjusted
South West
Period
United States Northeast Midwest
In structures with --

8/6/2019 New Home Construction April 2011
http://slidepdf.com/reader/full/new-home-construction-april-2011 7/10
Table 4. New Privately-Owned Housing Units Under Construction at End of Period
[Thousands of units. Detail may not add to total because of rounding]
2 to 4 5 units
Total 1 unit units or more Total 1 unit Total 1 unit Total 1 unit Total 1 unit
2009:r
January 783 383 (S) 382 157 55 102 69 313 160 211 99
February 756 366 (S) 372 153 54 100 66 303 153 200 93
March 717 344 (S) 354 149 53 95 61 286 144 187 86
April 677 327 (S) 332 140 51 90 58 269 136 178 82
May 650 316 (S) 317 136 49 87 57 257 131 170 79
June 627 314 (S) 296 131 49 86 57 245 130 165 78
July 611 316 (S) 278 129 49 86 58 239 132 157 77
August 588 311 (S) 262 127 48 84 57 225 130 152 76
September 576 314 (S) 248 124 48 84 58 220 132 148 76
October 554 308 (S) 232 122 47 84 58 208 130 140 73
November 532 301 (S) 218 118 46 82 56 201 130 131 69
December 517 300 (S) 205 115 45 79 55 194 131 129 69
2010:r
January 501 299 (S) 191 110 44 78 55 191 133 122 67
February 494 303 (S) 180 109 45 79 57 187 134 119 67
March 493 307 (S) 175 108 45 80 58 188 137 117 67
April 489 308 (S) 171 108 45 81 59 186 138 114 66
May 477 302 (S) 164 106 45 79 58 184 135 108 64
June 447 282 (S) 155 103 42 71 52 176 128 97 60
July 444 278 (S) 155 103 42 71 51 175 126 95 59
August 443 274 (S) 158 102 41 71 51 174 123 96 59
September 439 270 (S) 159 101 41 71 51 174 121 93 57
October 434 264 (S) 160 99 40 70 49 172 119 93 56
November 431 266 (S) 154 99 40 69 49 173 121 90 56
December 430 262 (S) 157 100 40 67 48 171 118 92 56
2011: Januaryr
430 259 (S) 160 100 39 68 48 171 116 91 56
Februaryr
423 252 (S) 160 99 38 66 47 171 113 87 54
Marchr
422 253 (S) 158 97 37 65 47 174 115 86 54
Aprilp
418 249 (S) 158 96 37 65 45 171 114 86 53
Average RSE (%)13 4 (X) 5 7 8 8 11 3 4 7 9
Percent Change:
April 2011 from March 2011 -0.9% -1.6% (S) 0.0% -1.0% 0.0% 0.0% -4.3% -1.7% -0.9% 0.0% -1.9%
90% Confidence Interval2 ± 1.1 ± 1.4 (X) ± 2.5 ± 1.4 ± 3.2 ± 5.0 ± 3.1 ± 2.1 ± 2.6 ± 1.8 ± 2.0
April 2011 from April 2010 -14.5% -19.2% (S) -7.6% -11.1% -17.8% -19.8% -23.7% -8.1% -17.4% -24.6% -19.7%
90% Confidence Interval2 ± 3.5 ± 3.3 (X) ± 8.3 ± 5.7 ± 7.8 ± 8.3 ± 7.4 ± 5.3 ± 4.2 ± 6.7 ± 4.5
See footnotes at end of table.
Seasonally adjusted
PeriodIn structures with --
United States Northeast SouthMidwest West
8/6/2019 New Home Construction April 2011
http://slidepdf.com/reader/full/new-home-construction-april-2011 8/10
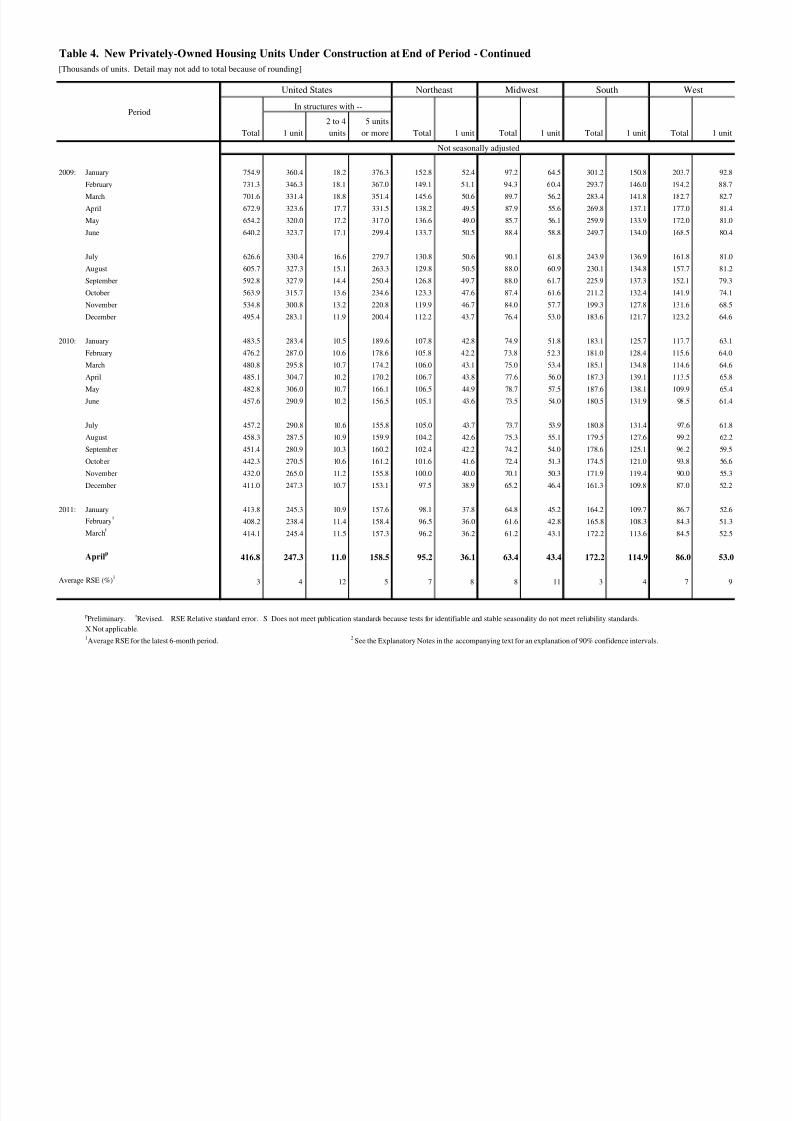
Table 4. New Privately-Owned Housing Units Under Construction at End of Period - Continued
[Thousands of units. Detail may not add to total because of rounding]
2 to 4 5 units
Total 1 unit units or more Total 1 unit Total 1 unit Total 1 unit Total 1 unit
2009: January 754.9 360.4 18.2 376.3 152.8 52.4 97.2 64.5 301.2 150.8 203.7 92.8
February 731.3 346.3 18.1 367.0 149.1 51.1 94.3 60.4 293.7 146.0 194.2 88.7
March 701.6 331.4 18.8 351.4 145.6 50.6 89.7 56.2 283.4 141.8 182.7 82.7
April 672.9 323.6 17.7 331.5 138.2 49.5 87.9 55.6 269.8 137.1 177.0 81.4
May 654.2 320.0 17.2 317.0 136.6 49.0 85.7 56.1 259.9 133.9 172.0 81.0
June 640.2 323.7 17.1 299.4 133.7 50.5 88.4 58.8 249.7 134.0 168.5 80.4
July 626.6 330.4 16.6 279.7 130.8 50.6 90.1 61.8 243.9 136.9 161.8 81.0
August 605.7 327.3 15.1 263.3 129.8 50.5 88.0 60.9 230.1 134.8 157.7 81.2
September 592.8 327.9 14.4 250.4 126.8 49.7 88.0 61.7 225.9 137.3 152.1 79.3
October 563.9 315.7 13.6 234.6 123.3 47.6 87.4 61.6 211.2 132.4 141.9 74.1
November 534.8 300.8 13.2 220.8 119.9 46.7 84.0 57.7 199.3 127.8 131.6 68.5
December 495.4 283.1 11.9 200.4 112.2 43.7 76.4 53.0 183.6 121.7 123.2 64.6
2010: January 483.5 283.4 10.5 189.6 107.8 42.8 74.9 51.8 183.1 125.7 117.7 63.1
February 476.2 287.0 10.6 178.6 105.8 42.2 73.8 52.3 181.0 128.4 115.6 64.0
March 480.8 295.8 10.7 174.2 106.0 43.1 75.0 53.4 185.1 134.8 114.6 64.6
April 485.1 304.7 10.2 170.2 106.7 43.8 77.6 56.0 187.3 139.1 113.5 65.8
May 482.8 306.0 10.7 166.1 106.5 44.9 78.7 57.5 187.6 138.1 109.9 65.4June 457.6 290.9 10.2 156.5 105.1 43.6 73.5 54.0 180.5 131.9 98.5 61.4
July 457.2 290.8 10.6 155.8 105.0 43.7 73.7 53.9 180.8 131.4 97.6 61.8
August 458.3 287.5 10.9 159.9 104.2 42.6 75.3 55.1 179.5 127.6 99.2 62.2
September 451.4 280.9 10.3 160.2 102.4 42.2 74.2 54.0 178.6 125.1 96.2 59.5
October 442.3 270.5 10.6 161.2 101.6 41.6 72.4 51.3 174.5 121.0 93.8 56.6
November 432.0 265.0 11.2 155.8 100.0 40.0 70.1 50.3 171.9 119.4 90.0 55.3
December 411.0 247.3 10.7 153.1 97.5 38.9 65.2 46.4 161.3 109.8 87.0 52.2
2011: January 413.8 245.3 10.9 157.6 98.1 37.8 64.8 45.2 164.2 109.7 86.7 52.6
Februaryr
408.2 238.4 11.4 158.4 96.5 36.0 61.6 42.8 165.8 108.3 84.3 51.3
Marchr
414.1 245.4 11.5 157.3 96.2 36.2 61.2 43.1 172.2 113.6 84.5 52.5
Aprilp
416.8 247.3 11.0 158.5 95.2 36.1 63.4 43.4 172.2 114.9 86.0 53.0
Average RSE (%)1
3 4 12 5 7 8 8 11 3 4 7 9
pPreliminary.
rRevised. RSE Relative standard error. S Does not meet publication standards because tests for identifiable and stable seasonality do not meet reliability standards.
X Not applicable.1Average RSE for the latest 6-month period.
2See the Explanatory Notes in the accompanying text for an explanation of 90% confidence intervals.
Not seasonally adjusted
PeriodIn structures with --
United States Northeast SouthMidwest West

8/6/2019 New Home Construction April 2011
http://slidepdf.com/reader/full/new-home-construction-april-2011 9/10
Table 5. New Privately-Owned Housing Units Completed
[Thousands of units. Detail may not add to total because of rounding]
2 to 4 5 units
Total 1 unit units or more Total 1 unit Total 1 unit Total 1 unit Total 1 unit
2009:r
January 777 566 (S) 204 89 51 116 91 391 300 181 124
February 819 535 (S) 271 103 52 116 95 379 267 221 121
March 839 545 (S) 279 78 62 119 99 431 262 211 122
April 846 532 (S) 299 143 58 120 86 402 276 181 112
May 818 492 (S) 315 81 50 120 82 420 262 197 98
June 797 507 (S) 279 102 38 120 86 391 261 184 122
July 797 500 (S) 283 103 60 115 78 377 242 202 120
August 792 517 (S) 259 66 44 130 102 437 257 159 114
September 721 481 (S) 222 96 54 107 77 343 243 175 107
October 746 526 (S) 205 91 60 96 80 364 254 195 132
November 844 567 (S) 262 102 55 142 100 396 264 204 148
December 750 493 (S) 236 81 61 127 98 387 234 155 100
2010:r
January 662 439 (S) 206 87 51 79 66 298 209 198 113
February 660 451 (S) 200 85 52 85 64 323 231 167 104
March 651 492 (S) 150 68 48 83 75 344 263 156 106
April 744 551 (S) 181 94 60 105 78 406 309 139 104
May 702 517 (S) 180 92 59 120 81 313 264 177 113
June 881 684 (S) 189 82 68 172 136 388 330 239 150
July 581 476 (S) 97 67 45 109 94 289 250 116 87
August 607 482 (S) 119 85 54 100 73 300 263 122 92
September 634 486 (S) 137 88 56 94 76 307 246 145 108
October 601 479 (S) 115 86 57 116 87 287 246 112 89
November 551 432 (S) 114 73 53 120 73 260 226 98 80
December 565 454 (S) 100 59 43 90 74 299 247 117 90
2011: Januaryr
509 417 (S) 86 66 48 92 74 246 215 105 80
Februaryr
611 482 (S) 121 69 52 96 79 325 250 121 101
Marchr
532 367 (S) 157 69 43 95 66 279 193 89 65
Aprilp
554 420 (S) 118 74 45 95 70 284 224 101 81
Average RSE (%)1
6 6 (X) 20 18 19 14 13 8 8 12 11
Percent Change:
April 2011 from March 2011 4.1% 14.4% (S) -24.8% 7.2% 4.7% 0.0% 6.1% 1.8% 16.1% 13.5% 24.6%
90% Con idence Interval2 ± 15.2 ± 12.8 (X) ± 38.5 ± 66.1 ± 69.1 ± 31.1 ± 23.4 ± 20.5 ± 19.2 ± 19.2 ± 20.5
April 2011 from April 2010 -25.5% -23.8% (S) -34.8% -21.3% -25.0% -9.5% -10.3% -30.0% -27.5% -27.3% -22.1%
90% Con idence Interval2 ± 8.6 ± 9.0 (X) ± 26.1 ± 29.0 ± 31.9 ± 33.6 ± 30.0 ± 13.8 ± 10.6 ± 22.5 ± 27.4
See footnotes at end of table.
Period
United States
In structures with --
Northeast
Seasonally adjusted annual rate
Midwest South West

8/6/2019 New Home Construction April 2011
http://slidepdf.com/reader/full/new-home-construction-april-2011 10/10
Table 5. New Privately-Owned Housing Units Completed - Continued
[Thousands of units. Detail may not add to total because of rounding]
2 to 4 5 units
Total 1 unit units or more Total 1 unit Total 1 unit Total 1 unit Total 1 unit
2009 794.4 520.1 14.5 259.8 94.2 53.8 119.2 89.3 393.5 259.0 187.5 118.1
2010 651.7 496.3 8.9 146.5 80.4 54.0 106.9 81.9 316.7 257.6 147.7 102.8
RSE (%) 2 2 15 5 4 4 3 2 3 3 3 2
2010: First 4 months 198.1 141.2 3.5 53.4 23.0 14.0 24.8 19.8 102.3 76.2 48.0 31.2
2011: First 4 months 159.4 122.0 2.7 34.6 19.0 12.5 26.4 20.1 83.9 65.8 30.0 23.6
RSE (%) 3 3 23 9 9 8 6 7 5 4 5 5
Year to Date Percent Change 3 -19.5% -13.6% -22.5% -35.1% -17.3% -10.8% 6.6% 1.6% -17.9% -13.6% -37.5% -24.4%
90% Confidence Interval2 ± 4.7 ± 5.0 ± 47.8 ± 13.1 ± 16.0 ± 16.5 ± 21.7 ± 23.9 ± 7.2 ± 5.1 ± 9.1 ± 9.6
2009: January 54.7 39.0 0.5 15.1 6.2 3.4 8.0 6.2 27.8 21.1 12.6 8.4
February 56.5 36.4 0.9 19.1 6.9 3.3 7.8 6.3 26.9 19.0 14.8 7.8
March 62.1 41.3 1.1 19.7 4.8 3.6 8.3 6.9 32.2 20.3 16.8 10.5April 65.5 41.3 1.2 23.0 10.9 4.4 9.1 6.4 31.7 22.0 13.8 8.5
May 68.1 41.1 0.9 26.1 6.7 4.2 10.0 6.8 35.0 21.9 16.4 8.2
June 70.3 44.4 1.0 24.9 9.4 3.6 10.3 7.3 34.3 22.7 16.4 10.8
July 66.4 41.1 1.2 24.2 8.6 4.9 9.4 6.3 31.4 19.9 17.0 10.0
August 73.9 44.5 1.7 27.8 6.3 3.9 11.9 8.9 41.3 22.1 14.5 9.6
September 64.4 43.9 1.5 19.1 8.9 5.3 9.9 7.3 29.8 21.2 15.9 10.1
October 67.4 49.0 1.3 17.1 9.0 6.4 9.0 7.7 32.3 23.1 17.2 11.9
November 72.6 50.1 1.3 21.2 8.5 4.7 13.1 9.7 33.7 22.9 17.3 12.7
December 72.4 48.0 2.0 22.5 8.1 6.2 12.3 9.5 37.2 22.7 14.8 9.6
2010: January 46.3 30.0 1.3 15.1 5.8 3.2 5.5 4.5 21.2 14.7 13.9 7.6
February 45.4 30.7 0.6 14.1 5.6 3.2 5.7 4.3 23.0 16.5 11.2 6.8
March 48.6 37.6 0.6 10.4 4.4 3.0 5.7 5.2 26.0 20.4 12.5 9.0
April 57.7 42.9 0.9 13.9 7.2 4.6 7.9 5.8 32.1 24.7 10.5 7.9May 58.7 43.0 0.5 15.2 7.5 4.7 10.0 6.7 26.2 22.1 14.9 9.5
June 77.7 60.1 0.7 16.9 7.7 6.5 14.8 11.6 33.9 28.7 21.2 13.3
July 48.2 39.2 0.7 8.3 5.8 4.0 8.8 7.5 23.8 20.4 9.8 7.3
August 54.6 41.4 0.6 12.6 7.9 4.6 9.3 6.4 26.6 22.7 10.9 7.7
September 56.7 43.9 1.0 11.8 7.9 5.2 8.8 7.3 26.7 21.4 13.2 10.0
October 54.8 44.7 0.6 9.5 8.2 5.8 10.7 8.3 25.9 22.4 10.0 8.1
November 48.3 38.7 0.4 9.2 6.5 4.9 11.0 7.1 22.4 19.7 8.4 7.0
December 54.7 44.0 1.0 9.6 5.9 4.3 8.7 7.2 28.9 23.9 11.2 8.6
2011: January 35.0 28.4 0.4 6.2 4.2 2.9 6.3 5.0 17.3 15.1 7.2 5.4
Februaryr
42.0 32.9 0.5 8.5 4.4 3.2 6.4 5.2 23.1 17.8 8.1 6.7
Marchr
39.3 27.8 0.5 11.0 4.5 2.7 6.6 4.6 21.0 15.0 7.2 5.5
April
p
43.1 32.9 1.2 8.9 5.9 3.7 7.1 5.2 22.5 17.9 7.6 6.1
Average RSE (%)1
6 6 50 20 18 19 14 13 8 8 12 11
pPreliminary.
rRevised. RSE Relative standard error. S Does not meet publication standards because tests for identifiable and stable seasonality do not meet reliability standards.
X Not applicable.1Average RSE for the latest 6-month period.
2See the Explanatory Notes i n the accompanying text for an explanation of 90% confidence intervals.
3Computed using unrounded data.
Period
United States
In structures with --
Northeast
Not seasonally adjusted
Midwest South West