New Enlistment Screening · PDF fileConstruction of Final Forms for a New Enlistment Screening...
25
-rg 4WU791 , 4,- AD-A235 405 cRM 90-120/ December 1990 Construction of Final Forms for a New Enlistment Screening Test D. R. DivgI DTIC ELECTE ~~ MAY 10 01991D CENTER FOR NAVAL ANALYSES 4401 Ford Avenue - Post Office Box 16268 - Alxodria, Virgy n 22302-0268 I UM2' STArEM?.. A1 Approved for public rele-c 9. 5 0 Distribution Unlimited
Transcript of New Enlistment Screening · PDF fileConstruction of Final Forms for a New Enlistment Screening...

-rg 4WU791 , 4,-
AD-A235 405 cRM 90-120/ December 1990
Construction of Final Forms for aNew Enlistment Screening Test
D. R. DivgI
DTICELECTE
~~ MAY 10 01991D
CENTER FOR NAVAL ANALYSES4401 Ford Avenue - Post Office Box 16268 - Alxodria, Virgy n 22302-0268
I UM2' STArEM?.. A1Approved for public rele-c 9. 5 0
Distribution Unlimited

APPROVED FOR PUBLIC RELEASE; DISTRIBUTION UNLIMITED.
Work conducted under contract N0001 4-91 -C-0002.
This Research Memorandum represents the best opinion of CNA at the time of Issue.It does not necessarily represent the opinion of the Department of the Navy.

REPORT DOCUMENTATION PAGE ]o,,, 0~ 074d18
1uli '~ts 1w tIsb cadhcm of isfamom is etmmd to =wu 1 ham wj uin, i dol du for sIW ng luuds wa bisa dau mm plsi mdinmua b a muad.mim uaWwWg t alctim o aot i V ~~ oru my otborishadm upu af this caDlctim at = wsfiin.tbow ,adu ti- buid. o war.dmm I-aamu Suime D um o fiu m -w-ia . 1215 DMs tm D way, Sub 12M. Adhqm VA 2 6 ow to
,l,. Ofe,,- at tuts d Reua mu, .fsua. Gffi m t i m um-. nSRudts, W, s"S. DC 2M.
1. AGENCY USE ONLY (Leave Baulk) 2. REPORT DATE 3. REPORT TYPE AND DATES COVERED
December 1990 Final
4. TIrL AND SUBTITIL 5. FUNDING NUMBERS
Construction of Final Forms for a New Enlistment Screening Test C - N00014-91-C-0002
PH 65153M
6. AUTHOR(S)D.R. Divgi PR - C0031
7. PERFORMING ORGANIZATION NAME(S) AND ADDRESS(ES) S. PERFORMING ORGANIZATIONREPORT NUMBER
Center for Naval Analyses CRM 90-1204401 Ford AvenueAlexandria, Virginia 22302-0268
9. SPONSORING/MONITORING AGENCY NAME(S) AND ADDRESS(ES) 10. SPONSORING/MONITORING AGENCYCommanding General REPORT NUMBER
Marine Corps Combat Development Command (WF 13F)Studies and Analyses BranchQuantico, Virginia 22134
11. SUPPLEMENTARY NOTES
12L DISIRIBUTION/AVAIIABIY STATEMENT 12b. DISTRIBUTION CODE
Approved for Public Release; Distribuion Unlimited
13. ABSTRACT (Maximugm 200 word•)
Two forms, each containing 35 verbal and 30 mathematics items, have been developed for a new Enlistment Screening Test (EST) to predictArmed Forces Qualification Test (AFQT) scores of military applicants. These forms were constructed in two stages from items in discontinued versionsof the Defense Department's test batteries. The first stage was to develop overlength forms from the available item pool. This research memorandumdescribes the seccid stage: constructing final forms by selecting items from the overlength forms. Item selection was based on the correlation of theitem with AFQT, in a subsample of applicants with AFQT percentiles between 21 and 65. For each EST form, the AFQT score was predicted from thetotal score on the final EST items. The results were used to calculate expectancy tables which, for any given EST score, provide probabilities ofexceeding the specified AFQT cutoffs. These probabilities ar reported in tables.
14. SUBJECT TERMS 15. NUMBER OF PAGESAFQT (armed forces qualification test), Aptitude tests, ASVAB (armed services vocational aptitude battery). Forms 20(paper), Perfonnance (human), Performance tests, Personnel selection, Predictions, Recruiting, Regression analysis, 16. PRICE CODEScoring, Tables (data), Test onstmtion, Test scores
17. SECURITY CLASSIFICATIONI 18. SBCURITY CLASSIFICATION I 19. SECURITY CLASSlFICATION 20. LIM1TATION OF ABSTRACTOF REPORT CP OF TIS PAGE CP OF ABSTRACT CP A
kSN 740-OI-280-330 Standard Form 298, (Rev. 2-8Pfwath od by ANSI Sl. 239-18

ED CENTER FOR NAVAL ANALYSES4401 Ford Avenue .Post Offie Box 16268 Alexandria, Virginia 22302-0268.(703) 824-2000
9 January 1991
MEMORANDUM FOR DISTRIBUTION LIST
Subj: Center for Naval Analyses Research Memorandum 90-120
Encl: (1) CNA Research Memorandum 90-120, Construction of Final Formsfor a New Enlistment Screening Test, by D.R. Divgi,Dec 1990
1. Enclosure (1) is forwarded as a matter of possible interest.
2. Two forms, each containing 35 verbal and 30 mathematics items, havebeen developed for a new Enlistment Screening Test (EST) to predictArmed Forces Qualification Test (AFQT) scores of military applicants.These forms were constructed in two stages from items in discontinuedversions of the DOD's test batteries. The first stage was to developoverlength forms from the available item pool. This research memorandumdescribes the second stage: constructing final forms by selecting itemsfrom the overlength forms. Item selection was based on the correlationof the item with AFQT, in a subsample of applicants with AFQTpercentiles between 21 and 65. For each EST form, the AFQT score waspredicted from the total score on the final EST items. The results wereused to calculate expectancy tables which, for any given EST score,provide probabilities of exceeding the specified AFQT cutoffs. Theseprobabilities are reported in tables.
. CabeDirector
Manpower and Training Program
Distribution List:Reverse page

Subj: Center for Naval Analyses Research Memorandum 90-120
Distribution List
SNDLAl DASN - MANPOWERAlH ASSTSECNAV MRAA2A CNRA6 HQMC MPR & RA
Attn: MAttn: MPAttn: MRAttn: MAAttn: MPP-54
FF38 USNAAttn: Nimitz Library
FF42 NAVPGSCOLFF44 NAVWARCOL
Attn: E-111FJAI COMNAVMILPERSCOMFJA 13 NAVPERSRANDCEN
Attn: Technical Director (Code 01)Attn: Director, Testing Systems (Code 13)Attn: Technical LibraryAttn: Director, Personnel Systems (Code 12)Attn: CAT/ASVAB PMOAttn: Manpower Systems (Code 11)
FJB1 COMNAVCRU1TCOMFrI CNErV12 NV=
Attn: Training and Education CenterAttn: Warfighting Center (WF-13F)
OPNAVOP-i1BOP-136
OTHERMilitary Accession Policy Working Group (17 copies)Defense Advisory Committee on Military Personnel Testing (8 copies)

CRM 90-120 / December 1990
Construction of Final Forms for aNew Enlistment Screening Test
D. R. DIvgi
Force Structure and Acquisition Division
A0092SIOD ForXTIS -A.
DTIC TABUnannouneajustification
Di stribution/ i-
Availability CodesAvil ado
Dist special
CENTER FOR NAVAL ANALYSES4401 Ford Avrnw * Post Ofw Box 16268 - ALxwndrka, Virginia 22302-0268

ABSTRACT
Two forms, each containing35 verbal and 30 mathematics items, havebeen developed for a new EnlistmentScreening Test (EST) to predict ArmedForces Qualification Test (AFQT) scoresof military applicants. These formswere constructed in two stages fromitems in discontinued versions of theDefense Department's test batteries.The first stage was to developoverlength forms from the available itempool. This research memorandumdescribes the second stage:constructing final forms by selectingitems from the overlength forms. Itemselection was based on the correlationof the item with AFQT, in a subsample ofapplicants with AFQT percentiles between21 and 65. For each EST form, the AFQTscore was predicted from the total scoreon the final EST items. The resultswere used to calculate expectancy tableswhich, for any given EST score, provideprobabilities of exceeding the specifiedAFQT cutoffs. These probabilities arereported in tables.
-iii-

EXECUTIVE SUMMARY
The Enlistment Screening Test (EST) is used by military recruitersto predict how a potential applicant is likely to score on the ArmedForces Qualification Test (AFQT). Persons with low EST scores can bescreened out as being unlikely to pass the AFQT standard. Persons withhigh EST scores can be encouraged to apply by describing availableincentives such as bonuses and enlistment guarantees.
CNA has developed a new EST because the Marine Corps felt that theprevious EST had become obsolete. The development had two stages: Inthe first stage, described in an earlier research memorandum, CNAconstructed two overlength forms (containing about 50 percent more testitems than would be needed in the final forms) from items indiscontinued versions of the DOD's test batteries. The overlength formswere administered to applicants for military enlistment and theresulting data were sent to CNA. AFQT scores of the applicants wereobtained from the Defense Manpower Data Center (DMDC). In the secondstage of analysis, the data on overlength forms and AFQT were used toselect items for the final EST forms and to compute performanceprediction tables. This research memorandum describes the second stage,i.e., construction of final forms and calculation of prediction tables.
At first the final forms were constructed for the Marine Corpsusing USMC data. These forms were then printed and distributed to USMCrecruiters. However, other services also expressed interest in usingthe new EST and provided data on overlength forms. The data from theMarine Corps, the Navy, and the Air Force were therefore analyzedtogether to construct a Joint Service EST. Items having highcorrelations with the AFQT were included in the final forms. Separateexpectancy tables were developed for EST Forms A and B. These tablesprovide probabilities of exceeding specified cutoff scores on the AFQTfrom a potential applicant's EST score.
Subgroup analyses showed that, at any EST score, mean AFQT washigher for whites than for blacks. With concurrence from the MilitaryAccession Policy Working Group, the author decided-to use only the whitesubsample while computing prediction tables. Therefore, to someextent, the tables overpredict the AFQT scores of blacks.
The new EST forms, along with their expectancy tables, were printedin February 1989 and distributed to recruiters in all four services.
_V-

CONTENTS
PageIntroduction ..................................................... 1
Marine Corps Enlistment Screening Test ........................... 1
Data Quality ..................................................... 2
Item Selection ................................................... 5
Differential Item Functioning .................................... 5
Final Item Selection ............................................. 6
Regression in Subgroups ........................................... 7
Expectancy Tables ................................................ 7
References ....................................................... 9
Appendix A: Lists of Items in Final Forms and -
Expectancy Tables ......................................... A-1 - A-6
-vii-

INTRODUCTION
The Enlistment Screening Test (EST) is used by military recruitersto predict how a potential applicant is likely to score on the ArmedForces Qualification Test (AFQT). Persons with low EST scores can bescreened out as being unlikely to pass the AFQT standard. Persons withhigh EST scores can be encouraged to apply by describing availableincentives such as bonuses and enlistment guarantees.
A new EST has been developed because the Marine Corps felt that theprevious EST had become obsolete [1]. The development had two stages:In the first stage, two overlength forms (containing about 50 percentmore test items than would be needed in the final forms) wereconstructed. In the second stage, data on overlength forms were used toselect items for the final forms.
The AFQT now consists of the Word Knowledge (WK), ParagraphComprehension (PC), Arithmetic Reasoning (AR), and Mathematics Knowledge(MK) subtests of the Armed Services Vocational Aptitude Battery(ASVAB). For optimum prediction of AFQT scores, content of the ESTshould resemble that of the AFQT as much as practicable. PC wasexcluded because it takes three times as long per item as WK does, whilemeasuring almost the same construct. The author therefore decided thatthe verbal part of the new EST would consist of 35 WK items (the samenumber as in the ASVAB), and the mathematics part would contain 30 ARand MK items (the same number as in AR). The ratio of AR and MK itemswas not preset; the numbers of these items were to depend on the resultsof the item selection procedure, in which AR and MK would be treated asmeasuring the same trait.
With permission from the Joint Service Selection and ClassificationWorking Group, CNA used items from discontinued forms of the ASVAB andthe AFQT. These forms were ASVAB 5X, 6X, 7X, 6E, 7E, and AFQT7A.The overlength forms were to contain 55 verbal and 45 math items so thatat least a third of the items would be deleted on the final forms. Thegoal was to predict AFQT scores as accurately as possible, emphasizingAFQT percentile ranks of 31 and 50, which are the lower-end points ofAFQT Categories IIIB and IlIA (1].
Development of the overlength forms has been described in anearlier CNA publication [2]. This research memorandum describes theselection of items for the final forms from those in the overlengthforms, and the calculation of expectancy tables for predicting AFQTperformance from the EST score.
MARINE CORPS EST
Overlength forms were printed by Headquarters, Marine Corps (HQMC),in May 1987 and distributed to USMC recruiters for experimental useduring a limited period. HQMC provided CNA with applicants' answersheets in January 1988. Item responses were entered into computers
-1-

independently at HQMC and CNA. The two data sets were then compared tofind typing errors. The corrected data file was sent to the DefenseManpower Data Center (DMDC) for operational ASVAB scores. DMDC usedsocial security numbers (SSNs) to match EST and ASVAB records.
In accordance with the original USMC request to CNA [1], whichemphasized the AFQT range between the 21st and 65th percentiles, onlythe applicants with AFQT scores in this range were used for selectingitems for the final forms. Each item was correlated with the AFQT sumof standard scores. In each EST form, verbal items with the highest35 correlations and math items with the highest 30 correlations werechosen for the final forms. This concluded the item selection phase.Then, to predict AFQT from EST, AFQT scores were regressed on totalscores for the selected EST items. These regressions, performedindependently for the two forms, provided the expected AFQT score ateach EST score. The Marine Corps EST and the tables of predicted AFQTscores were printed and distributed by HQMC in July 1988.
Detailed results of these analyses are not provided in thisdocument because the Marine Corps version has been superseded by thejoint service version. Some details were given in the author's briefingto the Defense Advisory Committee (DAC) on Military Personnel Testing inOctober 1988 [3]. As work on the Marine Corps version was nearingcompletion, other services expressed interest in using the new EST.The Navy and the Air Force provided data on overlength forms, which werethen added to the Marine Corps data. This document reports the analysesof the total joint service data.
DATA QUALITY
As before, DMDC matched EST records with operational records to addASVAB scores to the data. The size of the matched sample was 1,281 forForm A and 1,109 for Form B. One important concern was whetherrecruiters had refrained from administering the ASVAB to applicants whohad low scores on the overlength EST. Recruiters were instructed toadminister the ASVAB to everyone who took the overlength EST during datacollection; however, the extent of compliance with this instruction wasunknown. The EST item responses were therefore scored and matched andunmatched groups were compared on their total EST scores.
The results of this comparison are presented in table 1. The meanstend to be higher in the matched group, especially in the Navy and theAir Force. This trend may indicate that recruiters did in fact rejectsome applicants on the basis of their overlength EST scores, even thoughno tables for interpreting the scores had been provided. On the otherhand, it may be that those who had low scores on the EST also tend to becareless in writing their social security numbers. Because of thisambiguity, and also because the alternative was to use Marine Corps dataonly, it was decided to use the Navy and Air Force samples.
-2-
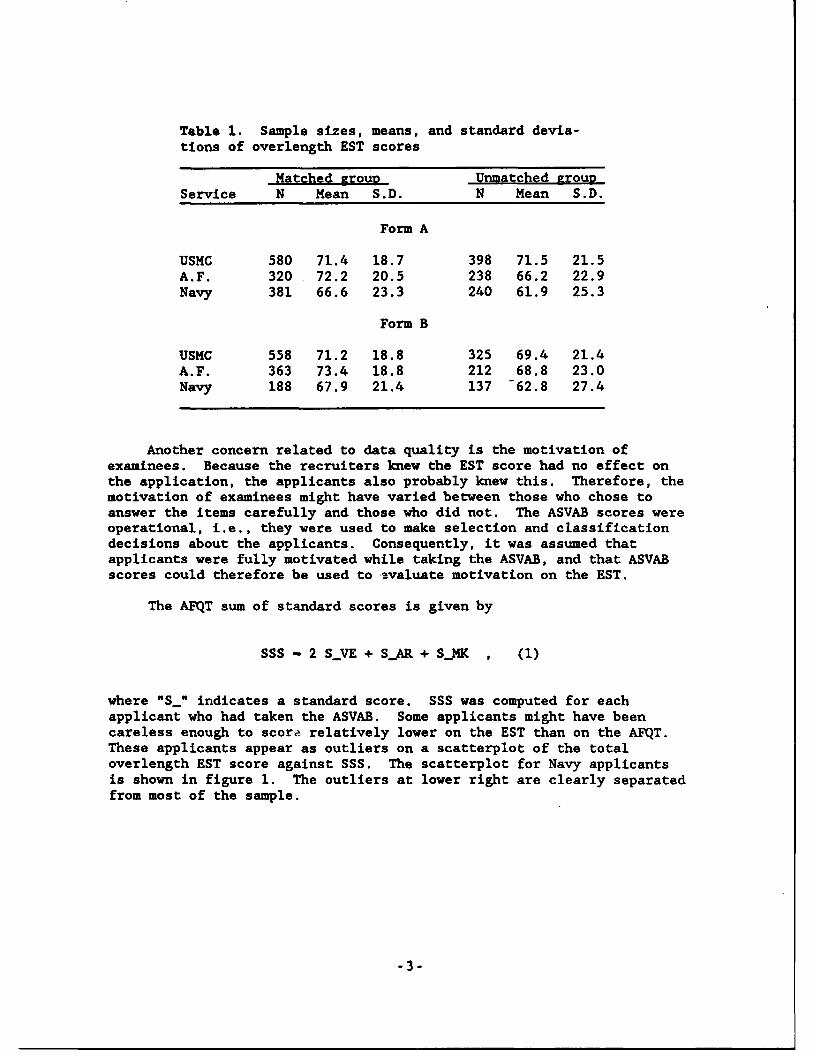
Table 1. Sample sizes, means, and standard devia-tions of overlength EST scores
Matched arouR Unmatched aroupService N Mean S.D. N Mean S.D.
Form A
USMC 580 71.4 18.7 398 71.5 21.5A.F. 320 72.2 20.5 238 66.2 22.9Navy 381 66.6 23.3 240 61.9 25.3
Form B
USMC 558 71.2 18.8 325 69.4 21.4A.F. 363 73.4 18.8 212 68.8 23.0Navy 188 67.9 21.4 137 -62.8 27.4
Another concern related to data quality is the motivation ofexaminees. Because the recruiters knew the EST score had no effect onthe application, the applicants also probably knew this. Therefore, themotivation of examinees might have varied between those who chose toanswer the items carefully and those who did not. The ASVAB scores wereoperational, i.e., they were used to make selection and classificationdecisions about the applicants. Consequently, it was assumed thatapplicants were fully motivated while taking the ASVAB, and that ASVABscores could therefore be used to 9valuate motivation on the EST.
The AFQT sum of standard scores is given by
SSS - 2 S.VE + S_AR+ SMK , (1)
where "S_" indicates a standard score. SSS was computed for eachapplicant who had taken the ASVAB. Some applicants might have beencareless enough to score relatively lower on the EST than on the AFQT.These applicants appear as outliers on a scatterplot of the totaloverlength EST score against SSS. The scatterplot for Navy applicantsis shown in figure 1. The outliers at lower right are clearly separatedfrom most of the sample.
-3-

100 A A A BBBBA A A BABBAAA BA
A AA A AA DABAB BEBBBBBA A D A A BAC
90 A B A A BABA AACDCCDDABC BAAAA AA BA AABABD CA AA BBAA ACACCAAABB B A A A
A AA BAA ACAAAAAA A
80 A A ABBA BAA BAABBB ABBA AAA BA AAA A AI AA
A AA A AA ABBA BC A AB AB C BACAAABB CA A A
70 A AA B A AC CAB A A AA A BA BAAB BA B ABA A A
DGA BB B AA B A A A AAAA AS D AA BA A A A
60 A B A ABADA CB AAA AA AA AA A AAAA A A BAAA A
A DA BDB C AAA A B AA A A AAAAA AAA BA A
o50 B AAB A AAA AB
A AA A AA CABAA B
A A A B40 -A A AAA A
B A A
A A A AA A A A AAA A A A A A A
30 - A A A A AA A AAA A A A A
AA A AB AA AAA AA A AAA A AA A A A B A A
20 - A AAA A AAB B AAA A A
A AA
10 -
o I I I , I I A l I I I 1 1120 130 140 150 160 170 180 190 200 210 220 230 240 250 260
AFOT sum of standard scores
Figure 1. Plot of total overlength EST score against AFQT SSS, Navy data only
-4-

To identify outliers quantitatively, a cubic regression of ESTscore on SSS was fitted with forms A and B combined. The regressioncurves for the Marine Corps and Air Force were quite close at the 50thpercentile of SSS, while the curve for Navy was four points lower. Thisindicated lower average motivation among Navy applicants. The MarineCorps and Air Force samples were therefore combined and a quadraticregression was fitted. The standard error of estimate was 14.6. Thosewho scored more than 40 points below their predicted overlength ESTscore were excluded from further analyses. Examinees were also excludedif they scored below the chance level of 25. The remaining sample sizewas 1,205 for Form A and 1,067 for Form B. The total sample contained15.5 percent women and 20.6 percent blacks.
ITEM SELECTION
Five different indicators of item quality were compared bycross-validation. Two used item-SSS correlation in the sample and in asubsample of examinees scoring between the 21st and 65th percentiles ofAFQT. Two procedures used a graphical procedure in Lord and Novick [4],again using the entire sample and the subsample. The fifth indicatorused logistic regression of the item on SSS. To compare these measures,the total sample for each form was split randomly, with 50-50probabilities, into a selection sample and a validation sample. Datafrom the selection sample were used to select items for the final ESTforms, and those from the validation sample were used to evaluate thefinal forms. The best method was that which yielded the smallestresidual variance on regressing AFQT on EST in the validation sample.
Results of these comparisons, presented to the DAC in February1989, indicated that the best index for item selection was item-SSScorrelation in the subsample [5]. This index was therefore used todevelop the joint service EST forms. However, it turned out later thatthe results of the cross-validation were sensitive to minor changes indata editing rules, and also changed when a different pair of randomselection and validation samples were created from the same totalsample. It appears that true differences among tests constructed by thefive methods are not large enough to be detected reliably with theavailable sample sizes. For that reason, detailed results of thecomparison are not reported here.
DIFFERENTIAL ITEM FUNCTIONING
During test construction, items that suffer from differential itemfunctioning (DIF), i.e., items that are harder for some groups ofexaminees than for others, must be eliminated. A good indicator of DIFis the Mantel-Haenszel (MH) statistic (6], which compares the difficultyof an item in a reference group with that in a focal group. Usually,these groups are a majority and a minority defined on the basis of race,ethnicity, or gender. Individuals in the two groups are matched onsubtest scores, and at a given subtest score, the proportions of correctanswers within the two groups are compared. When there is no DIF and
-5-

the sample size is large, the MH statistic has a chi-square distributionwith one degree of freedom ([6], p. 8). The desirable features of theMH statistic are simplicity and support in statistical theory. Thisstatistic also provides a measure of effect size, i.e., of the extent towhich the item functions differently in the two groups, but this measurewas not needed in the present study.
The comparisons of interest were between blacks and whites andbetween women and men. (Hispanics could not be identified reliably fromthe ethnicity code available.) The data at a given subtest score cannotbe used unless at least one examinee from each subgroup gets that score.Consequently, a part of the sample is unavailable for DIF analysis. Foreach person, unanswered items were excluded from the calculations.The sample size available for DIF analysis therefore varied somewhatfrom one item to another. The minimum DIF sample sizes for the twoforms were 226 and 194 among blacks, and 177 and 153 among women.
Exclusion of items requires a decision rule. An item waseliminated if its MH statistic exceeded 6.63, which is the 99thpercentile of the chi-square distribution, with one degree of freedom.In the total of 200 items in the two overlength forms, 12 were rejectedin the MH analyses by race, and 14 were rejected by gender. Therejected items were either easier or harder equally often for theminority groups.
FINAL ITEM SELECTION
Item selection for the final forms used the item-SSS correlation inthe subsample of applicants with AFQT percentiles between 21 and 65(inclusive). Omitted items were treated as missing data. In eachsubtest, items were arranged in descending order by correlation. Itemswere selected in order from the top, excluding those rejected by the MHstatistic. The number of items in the final forms was 35 for verbal and30 for mathematics. The total number with acceptable correlations, butunacceptable MH statistics, was 6 in Form A and 16 in Form B. Itemsselected for use in the final forms are listed in the appendix. Summarystatistics of the scores on these forms are given in table 2.Reliabilities were not calculated because they may capitalize on chance,being based on the same data that were used to select the items from theoverlength forms.
-6-

Table 2. Descriptive statistics on final formsa
Mean scores Standard deviationsForm Verbal Math Total Verbal Math Total
A 26.9 20.5 47.4 6.8 6.7 11.9
B 27.0 19.5 46.5 6.5 6.9 11.9
a. With Form A and B samples combined, AFQT SSS had amean of 207.0 and a standard deviation of 25.3.
REGRESSION IN SUBGROUPS
Even after items with large DIF have been eliminated, regression ofSSS on EST may not be the same in all subgroups. Equality of linearregressions across subgroups was therefore tested, using the GLMprocedure in SAS [7]. This procedure allows independent statisticaltests for the intercept and the slope of regression. To properlyevaluate the subgroup differences in intercept, the mean of the minoritywas subtracted from the EST score in each regression analysis.Consequently, the difference between the intercepts equals thedifference between predictions of the majority and minority regressionsfor the average member of the minority group.
Differences between men and women were not statisticallysignificant at the .05 level. On Forms A and B, the F ratios forintercepts were 0.7 and 2.3; those for slope were 0.2 and 3.1. On theother hand, differences between blacks and whites were significant.F ratios were 22.3 and 58.4 for intercept, 5.4 and 2.8 for slope.
The regression lines were lower for blacks than for whites, thedifference in intercepts being 5.0 SSS points with Form A, 10.2 withForm B. In other words, at any given EST score on Form A, the mean AFQTSSS was five points lower among blacks than among whites; for Form B thegap between regression lines was 10 points. While such differences areundesirable, they have been observed frequently [8]. Regression amongwhites was used to develop expectancy tables. This overpredicts theAFQT scores of blacks, and thus makes it easier for low-scoring blacksto appear eligible for ASVAB testing.
EXPECTANCY TABLES
Calculation of expectancy tables requires a regression equation topredict SSS from EST. In the white subgroup, the correlation of ESTwith SSS was .737 with Form A and .708 with Form B. Stepwise regressionshowed that a quadratic term was necessary, but a cubic term was not.
-7-
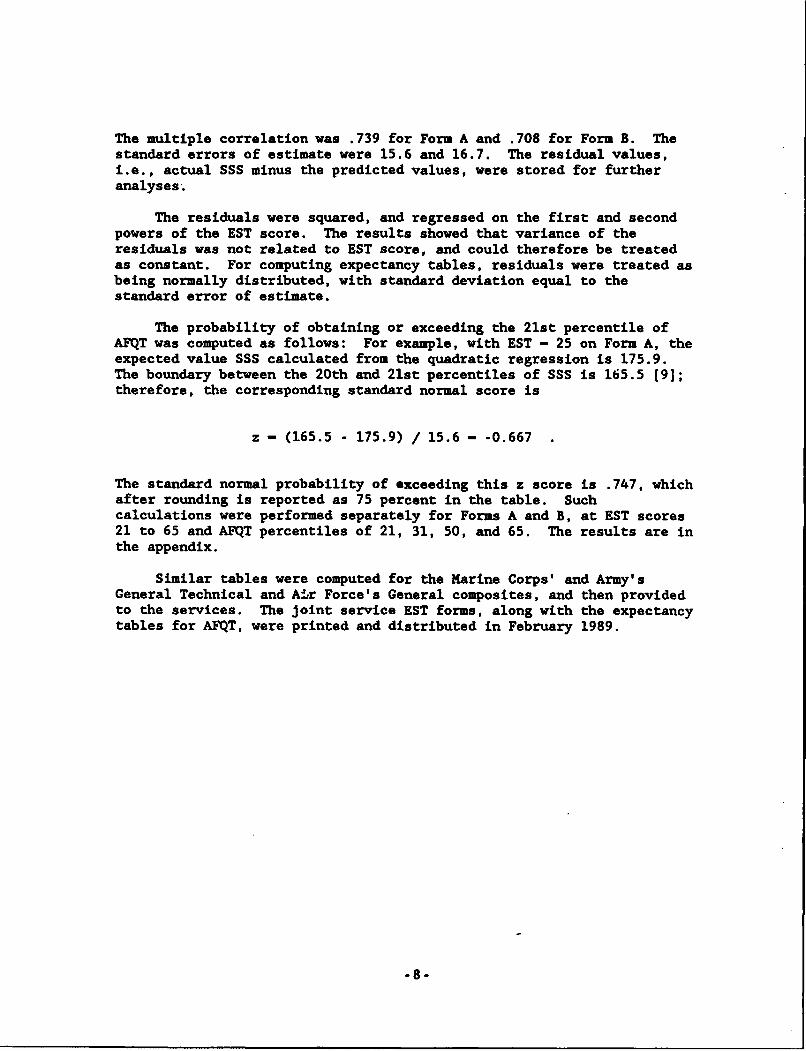
The multiple correlation was .739 for Form A and .708 for Form B. Thestandard errors of estimate were 15.6 and 16.7. The residual values,i.e., actual SSS minus the predicted values, were stored for furtheranalyses.
The residuals were squared, and regressed on the first and secondpowers of the EST score. The results showed that variance of theresiduals was not related to EST score, and could therefore be treatedas constant. For computing expectancy tables, residuals were treated asbeing normally distributed, with standard deviation equal to thestandard error of estimate.
The probability of obtaining or exceeding the 21st percentile ofAFQT was computed as follows: For example, with EST - 25 on Form A, theexpected value SSS calculated from the quadratic regression is 175.9.The boundary between the 20th and 21st percentiles of SSS is 165.5 [9];therefore, the corresponding standard normal score is
z - (165.5 - 175.9) / 15.6 - -0.667
The standard normal probability of exceeding this z score is .747, whichafter rounding is reported as 75 percent in the table. Suchcalculations were performed separately for Forms A and B, at EST scores21 to 65 and AFQT percentiles of 21, 31, 50, and 65. The results are inthe appendix.
Similar tables were computed for the Marine Corps' and Army'sGeneral Technical and A!,r Force's General composites, and then providedto the services. The joint service EST forms, along with the expectancytables for AFQT, were printed and distributed in February 1989.
-8,
REFERENCES
(1] Memorandum from the Deputy Chief of Staff for Manpower (MPI-20),Construction of an Enlistment Screening Test (EST) for Use withthe Armed Services Vocational Aptitude Battery (ASVAB),15 Oct 1986
[2] CNA Research Memorandum 90-119, Development of Overlength Forms ofa New Enlistment Screening Test, by D. R. Divgi, in process
[3] Briefing to the Defense Advisory Committee on Military PersonnelTesting, Development of a New Enlistment Screening Test, by D. R.Divgi, 31 Oct 1988
[4] Frederic M. Lord and Melvin R. Novick. Statistical Theories ofMental Test Scores. Reading, MA: Addison Wesley, 1968
[5] CNA Memorandum 89-0246, Joint Service Enlistment Screening Test:Item Selection and Expectancy Tables, by D. R. Divgi, Feb 1989
[6] Paul W. Holland and Dorothy T. Thayer. Differential ItemFunctioning and the Mantel-Haenszel Procedure. RR-86-31.Princeton, NJ: Educational Testing Service, 1986
[7] SAS Institute, Inc. Statistical Analysis System, Version 5.03.Cary, NC: SAS Institute, Inc., 1986
[8] Arthur R. Jensen. Bias In Mental Testing. New York: Free Press,1980
[9] Conversion Tables: Armed Services Vocational Aptitude BatteryForms 8-17. Washington, DC: Department of Defense, Jan 1989
-9-

APPENDIX A
LISTS OF ITEMS IN FINAL FORMSAND EXPECTANCY TABLES

Table A-i. Joint service enlistment screening test
items in verbal parts of final forms
Form A Form B
Final Overlength Final Overlengthitem item Key item item Key
1 2 B 1 1 B2 1 A 2 2 A3 13 B 3 5 D
4 7 A 4 7 B5 5 A 5 12 C
6 18 C 6 4 C7 4 C 7 9 C8 10 B 8 15 B9 27 B 9 19 A
10 6 A 10 25 B
11 25 C 11 20 D12 26 B 12 18 C13 17 C 13 28 D14 46 B 14 41 C15 22 A 15 36 C
16 20 C 16 37 D17 30 C 17 34 D18 47 C 18 43 A19 42 B 19 31 D20 24 D 20 32 B
21 38 D 21 46 B22 33 C 22 30 A23 50 B 23 24 B24 28 B 24 44 B25 43 B 25 47 D
26 31 D 26 40 B27 37 D 27 38 D28 52 A 28 54 A
A-1

Table A-1. (Continued)
Form A Form B
Final Overlength Final Overlengthitem item Key item item Key
29 40 A 29 53 A30 49 C 30 39 C
31 35 D 31 51 C32 55 D 32 49 A33 32 D 33 50 D34 51 D 34 42 A35 53 A 35 55 C
Table A-2. Joint service enlistment screening test
items in mathematics parts of final forms
Form A Form B
Final Overlength Final Overlengthitem item Key item item Key
1 3 C 1 2 A2 10 B 2 3 D3 23 B 3 4 C4 4 A 4 6 B5 8 A 5 11 A
6 7 D 6 7 A7 6 D 7 22 C8 11 D 8 17 C9 12 C 9 21 A
10 19 B 10 9 B
11 17 B 11 10 A12 14 D 12 29 D13 22 D 13 14 A14 21 C 14 32 C15 32 C 15 35 C
16 27 C 16 15 D17 16 C 17 34 D18 24 B 18 26 A19 30 A 19 24 D20 31 C 20 40 A
A-2

Table A-2. (Continued)
Form A Form B
Final Overlength Final Overlengthitem item Key item item Key
21 25 B 21 20 C22 33 B 22 31 D23 28 D 23 41 C24 44 A 24 39 C25 40 D 25 44 A
26 34 C 26 42 D27 37 D 27 36 D28 41 D 28 43 D29 42 A 29 37 A30 38 D 30 45 D
Table A-3. Expectancy table to predict AFQT from totalEST score, Form A
EST Percent chance of AFQT percentile being at leastscore 21 31 50 65
21 65 26 2 022 67 28 2 023 70 31 3 024 72 33 3 025 75 36 4 0
26 77 39 4 027 79 42 5 028 82 45 6 129 84 48 7 130 86 51 8 1
31 87 55 10 132 89 58 11 133 91 61 13 234 92 65 15 235 93 68 17 3
36 94 71 19 337 95 74 22 438 96 77 25 539 97 79 28 640 97 82 31 7
A-3

Table A-3. (Continued)
EST Percent chance of AFQT percentile being at leastscore 21 31 50 65
41 98 84 34 942 98 87 38 1043 99 89 42 1244 99 90 46 1445 99 92 50 17
46 99 93 54 1947 100 95 58 2248 100 96 62 2549 100 97 66 2950 100 97 70 33
51 100 98 73 3752 100 98 77 4153 100 99 80 4554 100 99 83 5055 100 99 86 54
56 100 100 88 5957 100 100 90 6358 100 100 92 6759 100 100 94 7160 100 100 95 75
61 100 100 96 7962 100 100 97 8263 100 100 98 8564 100 100 98 8865 100 100 99 90
A-4

Table A-4. Expectancy table to predict AFQT from totalEST score, Form B
EST Percent chance of AFQT percentile being at leastscore 21 31 50 65
21 65 29 3 022 68 31 4 023 71 34 4 024 74 37 5 125 76 40 6 1
26 79 43 7 127 81 47 8 128 83 50 9 129 85 53 11 230 87 56 12 2
31 89 60 14 232 90 63 16 333 92 66 18 434 93 69 21 435 94 72 23 5
36 95 75 26 637 96 78 29 738 96 80 32 939 97 83 35 1040 98 85 39 12
41 98 87 42 1442 98 89 46 1643 99 90 49 1844 99 92 53 2045 99 93 56 23
46 99 94 60 2647 100 95 64 2948 100 96 67 3249 100 97 70 3650 100 97 74 39
51 100 98 77 4352 100 98 79 4753 100 99 82 5154 100 99 84 5555 100 99 87 58
A-5

Table A-4. (Continued)
EST Percent chance of AFQT percentile being at least
score 21 31 50 65
56 100 99 89 6257 100 100 90 6658 100 100 92 6959 100 100 93 7360 100 100 95 76
61 100 100 96 7962 100 100 96 8263 100 100 97 8464 100 100 98 8765 100 100 98 89
A-6