New Cushion Curve Method - talkpkgtalkpkg.com/Papers-Presentations/Presentation/Daum Matthew... ·...
34
© 2005 Hewlett-Packard Development Company, L.P. The information contained herein is subject to change without notice New Cushion Curve Method Matt Daum, Ph.D. March 2006
Transcript of New Cushion Curve Method - talkpkgtalkpkg.com/Papers-Presentations/Presentation/Daum Matthew... ·...

© 2005 Hewlett-Packard Development Company, L.P.The information contained herein is subject to change without notice
New Cushion Curve Method
Matt Daum, Ph.D.
March 2006

Change

Change

Change
Change for the Beloved Cushion Curve?
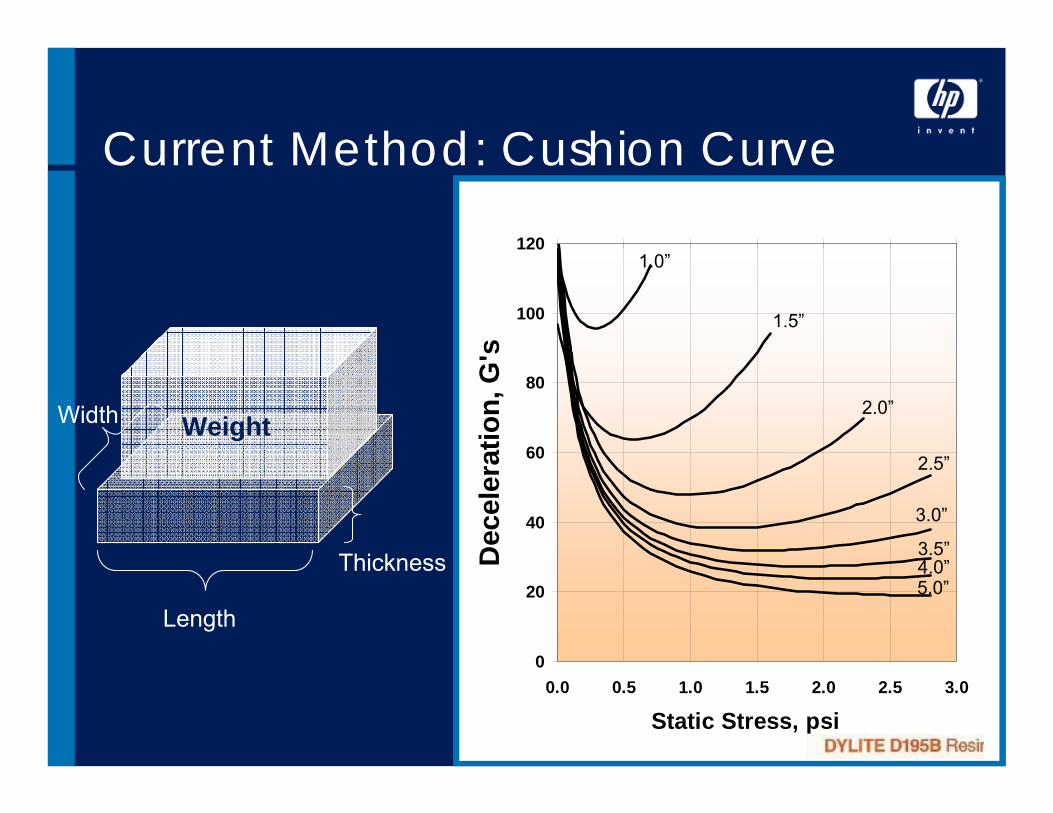
Current Method: Cushion Curve
0
20
40
60
80
100
120
0.0 0.5 1.0 1.5 2.0 2.5 3.0
Static Stress, psi
Dec
eler
atio
n, G
's
1.0”
1.5”
2.0”
2.5”
3.0”
3.5”4.0”5.0”
36” Drop Height1.25 pcf1st Impact
Width
Thickness
Length
Weight
0
20
40
60
80
100
120
0.0 0.5 1.0 1.5 2.0 2.5 3.0
Static Stress, psi
Dec
eler
atio
n, G
's
1.0”
1.5”
2.0”
2.5”
3.0”
3.5”4.0”5.0”
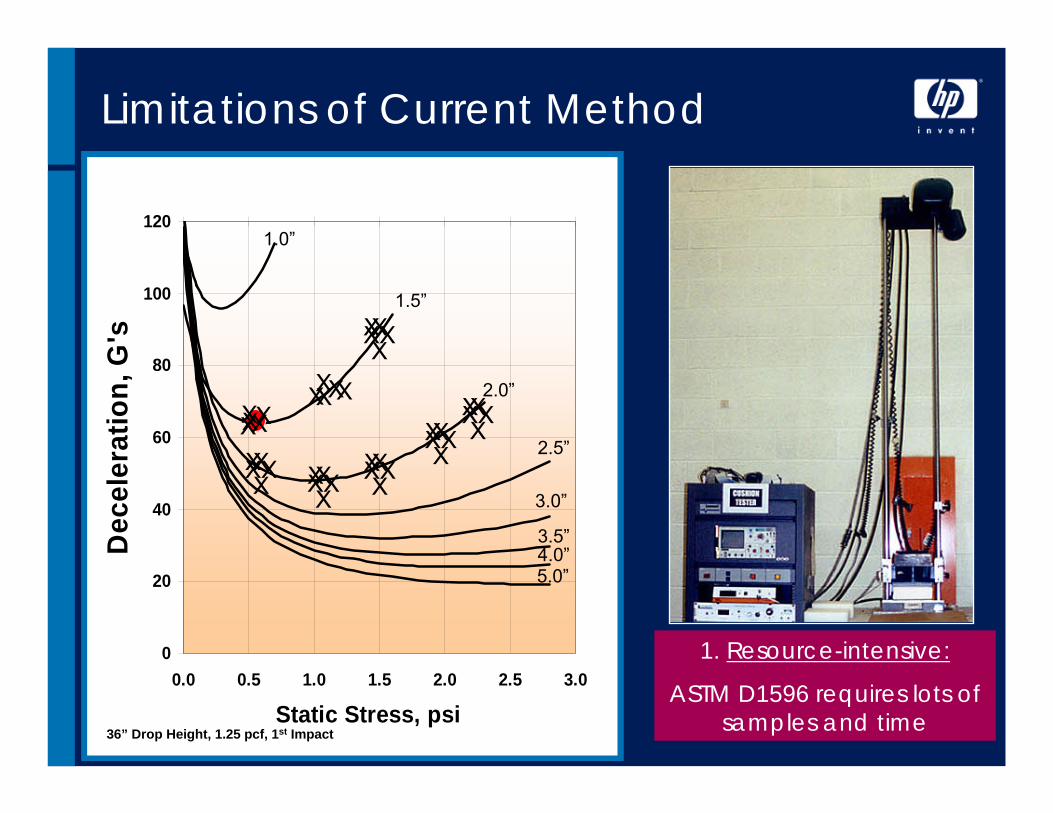
36” Drop Height, 1.25 pcf, 1st Impact
1. Resource-intensive:
ASTM D1596 requires lots of samples and time
Limitations of Current Method
XX
XXX
X XXXXXXXXX
XX
XXX XX
XXX
XX
XXX
XX
XXXX
XXXX

Limitations of Cushion Curves
2. Limited Data
What if I want to know G level in
these areas?
0
20
40
60
80
100
120
0.0 0.5 1.0 1.5 2.0 2.5 3.0
Static Stress, psi
Dec
eler
atio
n, G
's
1.0”
1.5”
2.0”
2.5”
3.0”
3.5”4.0”5.0”
36” Drop Height1.25 pcf1st Impact
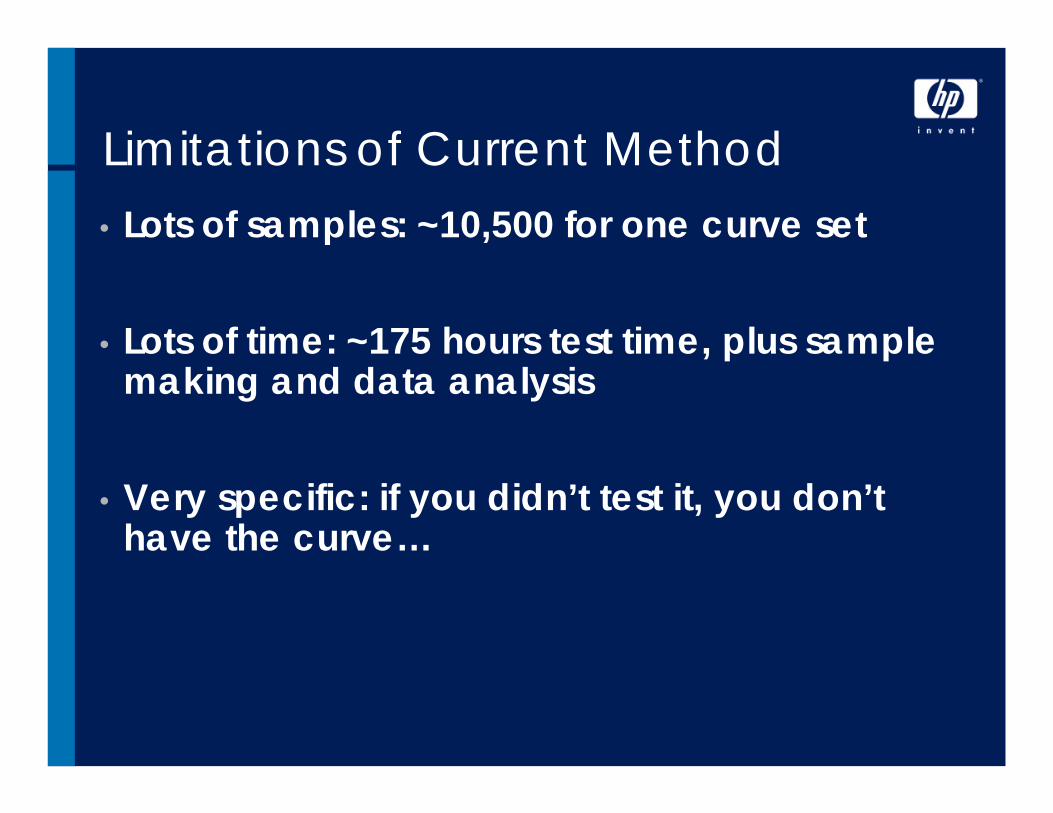
Limitations of Current Method• Lots of samples: ~10,500 for one curve set
• Lots of time: ~175 hours test time, plus sample making and data analysis
• Very specific: if you didn’t test it, you don’t have the curve…

Something New

Something NewWhat if you could…• Generate a cushion curve for ANY
combination of variables?
• Have all the data for these curves represented in ONE easy equation?
• Have all this quickly, at a fraction of the effort of the current method?

New Method: Stress vs. Energy
• Called “Stress-Energy” method− Technically, Dynamic stress vs. dynamic energy
density−Pioneered by Dr. Burgess @ MSU 1990
• Stress-Energy is about material properties−Relationship b/w variables SL, h, t, and G− From ONE equation, can construct ANY cushion
curve – infinite data from one test!−Can be generated with as few as 10 drops
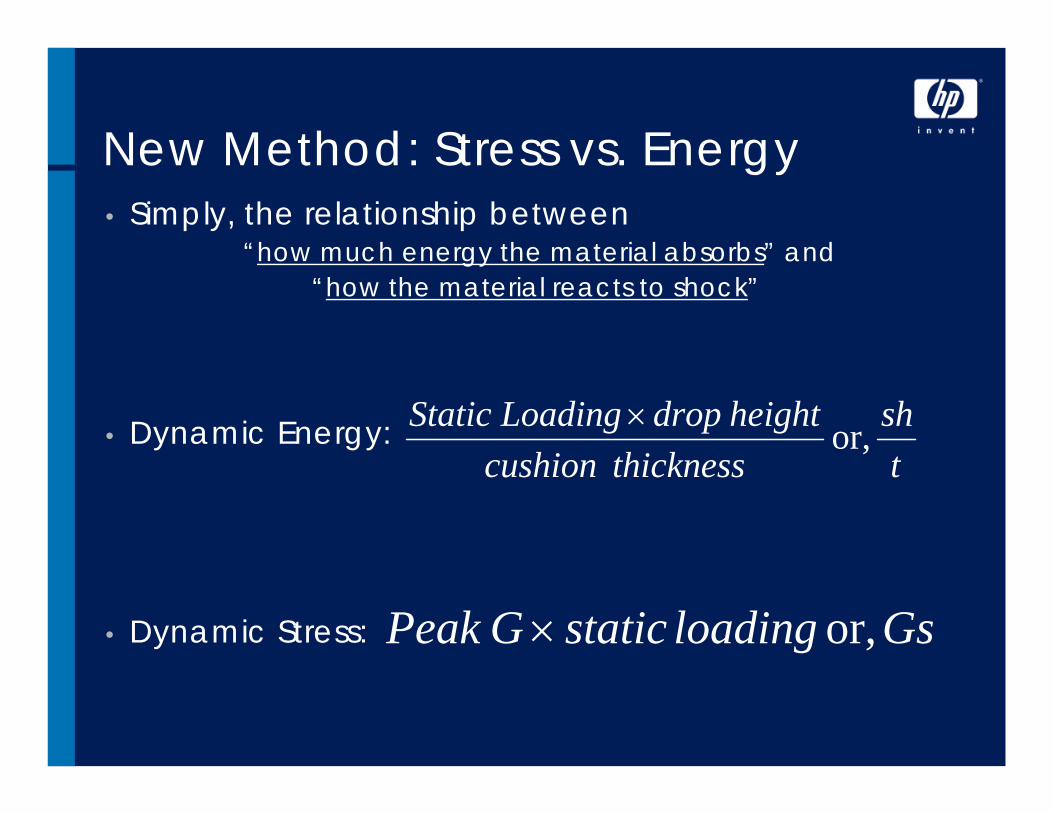
New Method: Stress vs. Energy• Simply, the relationship between
“how much energy the material absorbs” and “how the material reacts to shock”
• Dynamic Energy:
• Dynamic Stress:
tsh
thicknesscushionheightdropLoadingStatic or,
×
GsloadingstaticGPeak or, ×

New Method: Stress vs. Energy
0
20
40
60
80
100
120
0.0 0.5 1.0 1.5 2.0 2.5 3.0
Static Stress, psi
Dec
eler
atio
n, G
's
1.0”
1.5”
2.0”
2.5”
3.0”
3.5”4.0”5.0”
Relationship between existing
variables
s = 1.0h = 36”t = 2.0”
Energy = sh/t = 18Stress = G*s = 50
36”Drop Height1.25 pcf1stImpact
0
20
40
60
80
100
120
0.0 0.5 1.0 1.5 2.0 2.5 3.0
Static Stress, psi
Dec
eler
atio
n, G
's
1.0”
1.5”
2.0”
2.5”
3.0”
3.5”4.0”5.0”
New Method: Stress vs. Energy
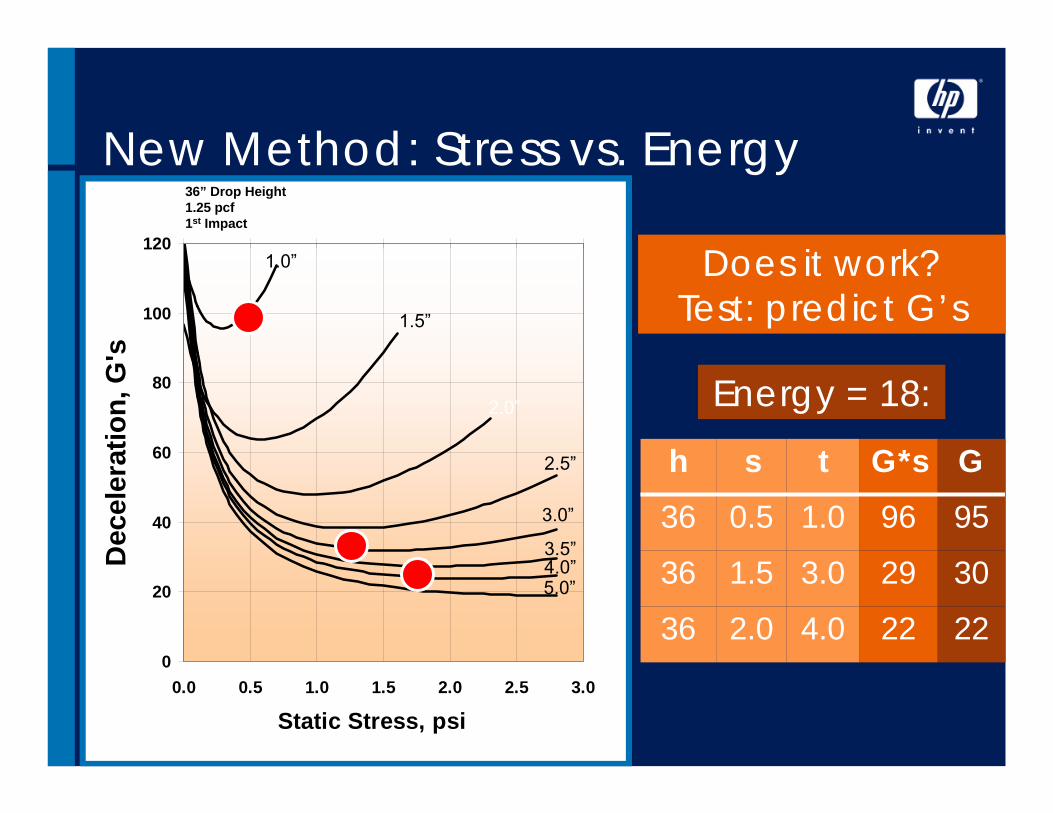
Does it work?Test: predict G’s
36” Drop Height1.25 pcf1st Impact
22224.02.036
30293.01.536
95961.00.536
GG*stsh
Energy = 18:

New Method: Stress vs. Energy• One equation describing cushion
behavior:
• ANY cushion curve can be calculated−Closed cell foam, and corrugated− See literature from Burgess, Wenger, etc.
bxay e=

bxay e=
New Method: Stress vs. Energy
tshenergyx
Gsstressyyx
==
==testing from and
a and b calculated from curve fitting for each specific
material and density

New Method: Stress vs. Energy
Limited Data
Don’t think of cushion curves as
lines on a grid
Unlimited Data
Think of cushion curves as lines
from an equation0
20
40
60
80
100
120
0.0 0.5 1.0 1.5 2.0 2.5 3.0
Static Stress, psi
Dec
eler
atio
n, G
's
1.0”
1.5”
2.0”
2.5”
3.0”
3.5”4.0”5.0”
36” Drop Height1.25 pcf1st Impact

New Method: Stress vs. EnergyEthafoam Select polyethylene, 1.9pcf
1st Drop
y = 9.8891e0.1036x
R2 = 0.9544
0
50
100
150
200
250
0 10 20 30 40
Dynamic Energy, sh/t
Dyn
amic
Str
ess,
G
s
1. Plot Stress vsEnergy
2. LSM, or Power Trendline in
Excel
This equation can now be used to draw any cushion
curve
BA

Compare Methods
Curve fitn/aCalculate
Plot Gs vs sh/tPlot G vs static stress
Plot results
Same data, less drops
height, area, thickness, G, wt
Collect data
SameCushion drop testTest Apparatus
New: Stress vs. Energy
Current: ASTM D1596
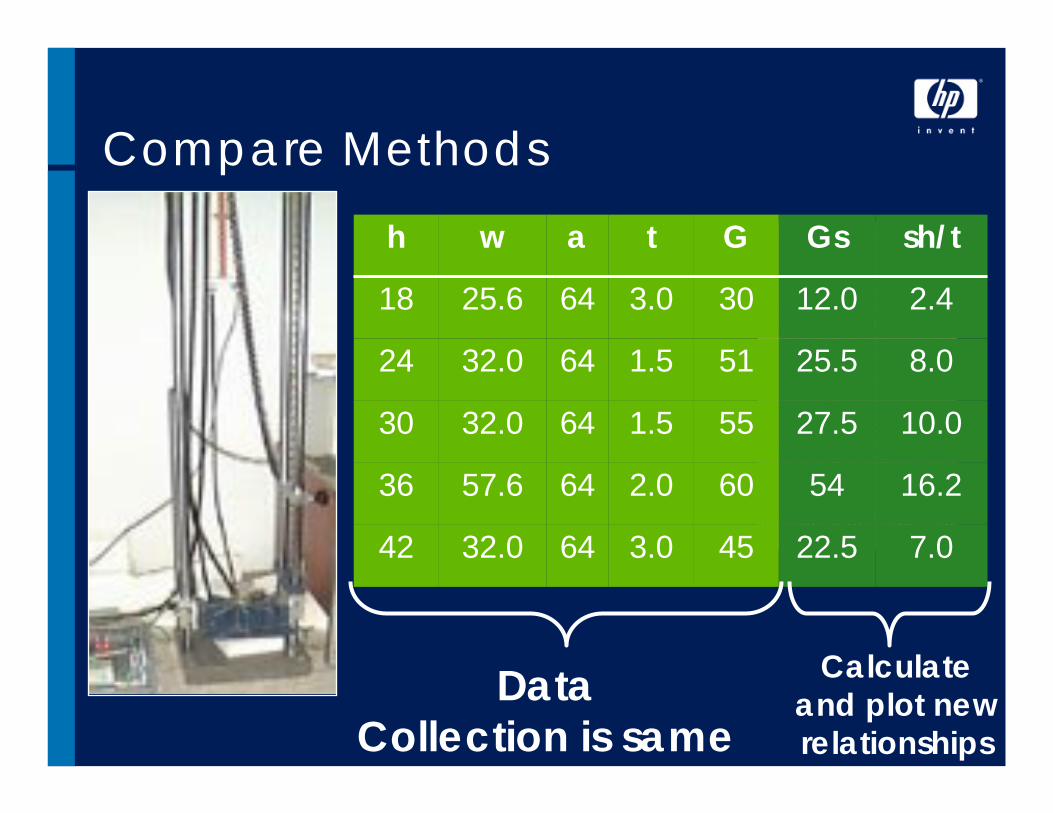
45
60
55
51
30
G
22.5
54
27.5
25.5
12.0
Gs
7.03.06432.042
16.22.06457.636
10.01.56432.030
8.01.56432.024
2.43.06425.618
sh/ttawh
Compare Methods
DataCollection is same
Calculateand plot newrelationships

From Equation to Cushion Curve

Case Study
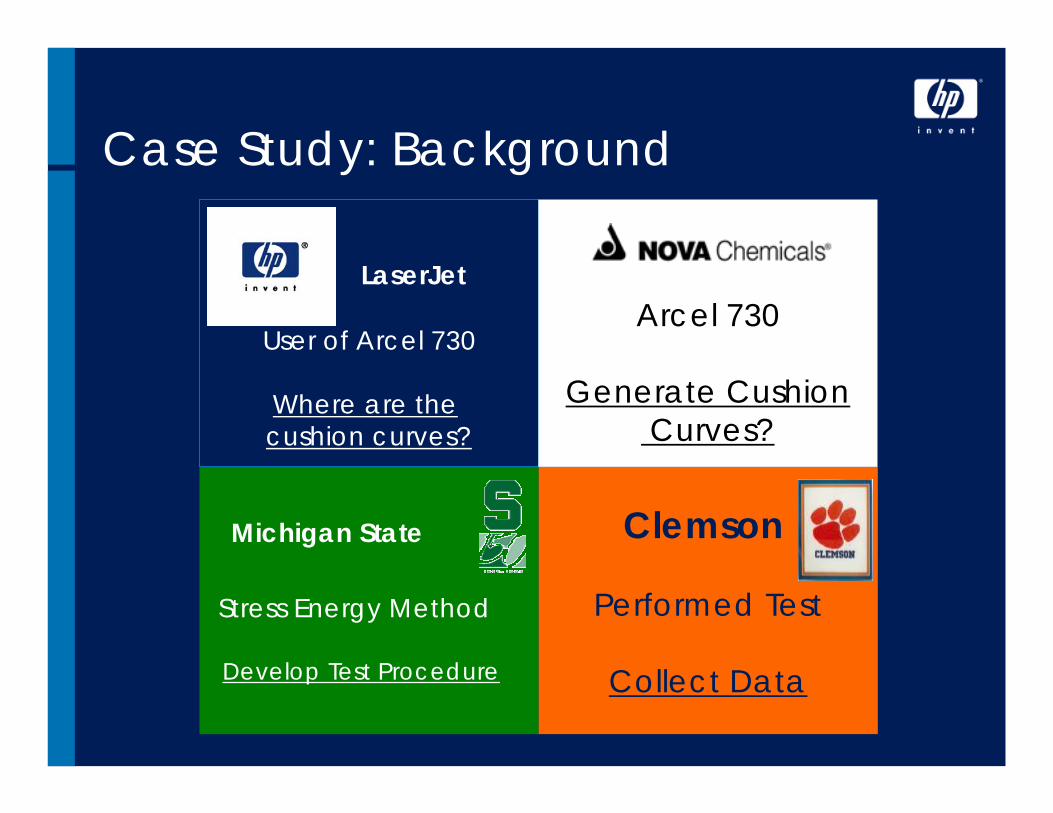
Case Study: Background
Michigan State
Stress Energy Method
Develop Test Procedure
LaserJet
User of Arcel 730
Where are the cushion curves?
Clemson
Performed Test
Collect Data
Arcel 730
Generate CushionCurves?

Case Study: Test Objectives
•Find Stress vs. Energy equation for Arcel 730
−1.2 pcf−1.7 pcf−2.2 pcf−3.0 pcf
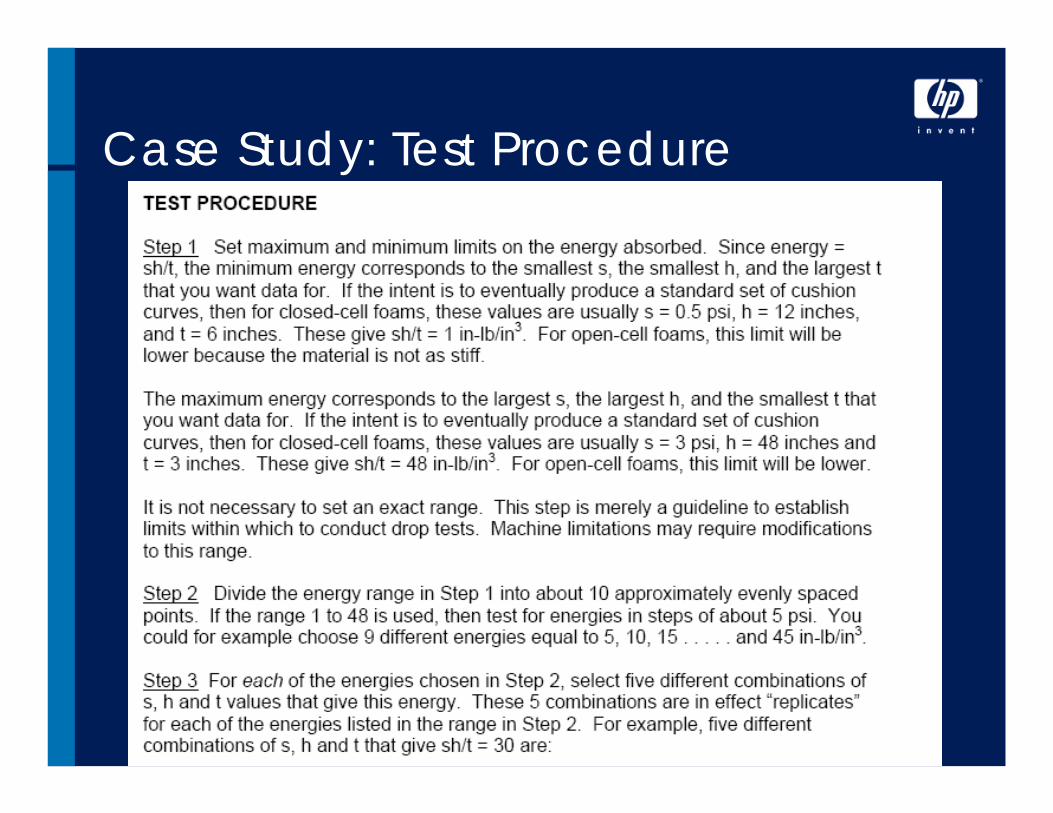
Case Study: Test Procedure
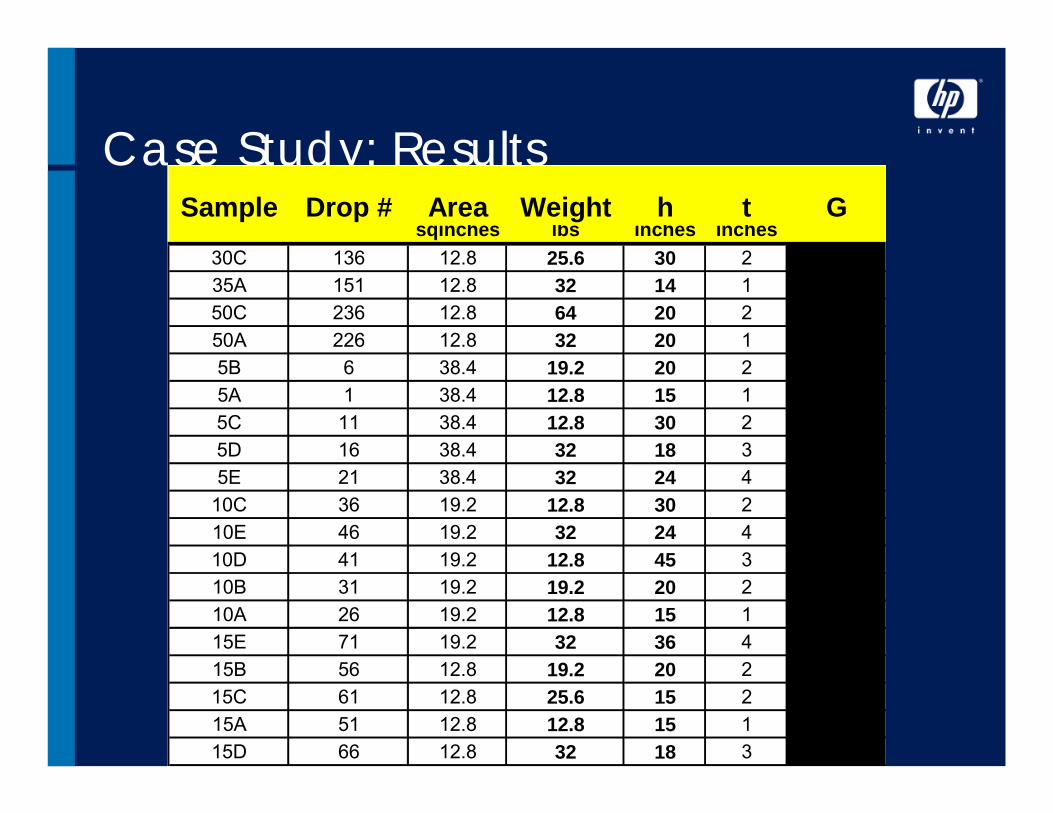
Case Study: ResultsSample Drop # Area Weight h t G
sqinches lbs inches inches30C 136 12.8 25.6 30 2 6135A 151 12.8 32 14 1 7650C 236 12.8 64 20 2 8850A 226 12.8 32 20 1 1465B 6 38.4 19.2 20 2 365A 1 38.4 12.8 15 1 625C 11 38.4 12.8 30 2 605D 16 38.4 32 18 3 215E 21 38.4 32 24 4 32
10C 36 19.2 12.8 30 2 3710E 46 19.2 32 24 4 1610D 41 19.2 12.8 45 3 3710B 31 19.2 19.2 20 2 2510A 26 19.2 12.8 15 1 4515E 71 19.2 32 36 4 2115B 56 12.8 19.2 20 2 2315C 61 12.8 25.6 15 2 2015A 51 12.8 12.8 15 1 4115D 66 12.8 32 18 3 14

Case Study: ResultsARCEL 1.2M 1st drop
R2 = 0.9902
-
100
200
300
400
500
600
- 10 20 30 40 50 60
Energy (sh/t)
Stre
ss (G
s)
1.0
2.0
3.0
4.0
5.0
6.0
7.0
bxay e=

Case Study: Results•Stress vs. Energy equation for Arcel730
−1.2 pcf−1.7 pcf−2.2 pcf−3.0 pcf
•Stress/Energy Equation generated
•Cushion properties fully characterized
•ANY cushion curve can now be drawn

Conclusion

Conclusion
•Recommendation #1
−Convert existing cushion curves into Stress/Energy equations
−Generate new data?

Calculated Values from Existing Cushion Curves
Name Material Density (pcf) Impact A BARCEL 512 Arcel 1.2 1 18.79 0.0543ARCEL 512 Arcel 1.2 2-5 18.643 0.0786DYLITE D195B EPS 1.25 1 20.655 0.0474DYLITE D195B EPS 1.25 2-5 20.486 0.0834Eperan EPP EPP 1.3 1 12.463 0.0782Eperan EPP EPP 1.3 2-5 13.573 0.1007Eperan EPP EPP 1.9 1 21.312 0.0448Eperan EPP EPP 1.9 2-5 25.443 0.0478Arpro EPP 3413 EPP 1.3 1 13.424 0.0735Arpro EPP 3413 EPP 1.3 2-5 14.065 0.0864Arpro EPP 3419 EPP 1.9 1 22.172 0.0445Arpro EPP 3419 EPP 1.9 2-5 20.779 0.0595Ethafoam Nova EPE 1.7 1 10.666 0.1039Ethafoam Nova EPE 1.7 2-5 9.9059 0.1386Ethafoam HS 45 EPE 3.9 1 18.585 0.0586Ethafoam HS 45 EPE 3.9 2-5 17.786 0.0790Ethafoam 220 EPE 2.2 1 14.538 0.0658Ethafoam 220 EPE 2.2 2-5 14.684 0.0881Ethafoam Select EPE 1.9 1 9.5351 0.1003Ethafoam Select EPE 1.9 2-5 9.8891 0.1036

Conclusion
•Recommendation #2
−Re-visit ASTM 1596?

Thank You
Questions?

![Untitled-1 [] · Cushion: M*2 Cushion: M*2 Cushion: M*1 Cushion: M*1 Cushion: M*2 Cushion: M*3 Cushion: M*4 Cushion: S*3 Cushion: S*2 Cushion: S*1 Cushion: M*3 S*2 Cushion: M*2 S*1](https://static.fdocuments.in/doc/165x107/5fcbbac82e8c411bf55b5c66/untitled-1-cushion-m2-cushion-m2-cushion-m1-cushion-m1-cushion-m2.jpg)