Adrenal failure of Pituitary Origin Plasma Protein Studies ...

Ashton et al., Sci. Adv. 2019; 5 : eaau7220 6 February 2019
S C I E N C E A D V A N C E S | R E S E A R C H A R T I C L E
1 of 12
N E U R O S C I E N C E
A plasma protein classifier for predicting amyloid burden for preclinical Alzheimer’s diseaseNicholas J. Ashton1,2,3,4, Alejo J. Nevado-Holgado5, Imelda S. Barber5, Steven Lynham6, Veer Gupta7,8,9, Pratishtha Chatterjee7,10,11, Kathryn Goozee10,11,12,13, Eugene Hone7,8, Steve Pedrini7,8, Kaj Blennow3,14, Michael Schöll3,4, Henrik Zetterberg3,14,15,16, Kathryn A. Ellis17, Ashley I. Bush8,18, Christopher C. Rowe19, Victor L. Villemagne19, David Ames17,20, Colin L. Masters18, Dag Aarsland1,2,21, John Powell1,2, Simon Lovestone5, Ralph Martins7,8,10,11, Abdul Hye1,2*
A blood-based assessment of preclinical disease would have huge potential in the enrichment of participants for Alzheimer’s disease (AD) therapeutic trials. In this study, cognitively unimpaired individuals from the AIBL and KARVIAH cohorts were defined as A negative or A positive by positron emission tomography. Nontargeted proteomic analysis that incorporated peptide fractionation and high-resolution mass spectrometry quantified relative protein abundances in plasma samples from all participants. A protein classifier model was trained to predict A-positive participants using feature selection and machine learning in AIBL and independently assessed in KARVIAH. A 12-feature model for predicting A-positive participants was established and demonstrated high accu-racy (testing area under the receiver operator characteristic curve = 0.891, sensitivity = 0.78, and specificity = 0.77). This extensive plasma proteomic study has unbiasedly highlighted putative and novel candidates for AD pathology that should be further validated with automated methodologies.
INTRODUCTIONThe search for a blood-based signature that can predict the onset of Alzheimer’s disease (AD) has gathered considerable momentum in recent years. Much effort has been dedicated to the discovery of single- and multianalyte protein markers to differentiate AD from age-matched cognitively unimpaired individuals [reviewed in (1)]. A major concern for the field has been the lack of reproducibility for these putative candidates, and these inconsistencies might be explained by substantial preanalytical variations among research cohorts. However, it is likely that the inherent heterogeneity of AD is partially accountable for the failure in replicating “case-versus-control” studies (2). Given the long preclinical phase in AD where the accumulation of pathology is thought to begin 15 to 20 years before clinical pre-sentation (3), a considerable proportion of seemingly unimpaired individuals will harbor substantial amyloid (A) pathology. Con-
sequently, within a clinical diagnosis–dependent study design, indi-viduals in the preclinical disease phase would be classified as “healthy controls,” despite underlying A pathology being present. Increasingly, “endophenotype” studies are using surrogate markers of neocortical A burden [positron emission tomography (PET) imaging or cerebrospinal fluid (CSF) measures] to identify blood-based biomarkers indicative of ongoing disease pathogenesis. Tools to identify and monitor A burden are of critical importance, given the increased focus on anti-A therapeutics. Retrospective imaging from these early trials confirmed that a considerable proportion of recruited participants did not exhibit the target pathology or were too advanced in the disease course (4). This was a major concern and highlighted the importance of a biomarker-driven participant selec-tion, and consequently, these trials are targeting individuals with biomarker evidence of pathology with no or little cognitive deficits. This selection process, based on PET imaging and/or CSF A, is likely to be unfeasible to implement widely, particularly for population- based screening. Therefore, a minimally invasive and accessible blood- based prediction of A burden would be of considerable use in thera-peutic stratification and clinical management at the earliest stage.
Ultrasensitive immunoassay and immunoprecipitation mass spec-trometry (MS) methods have recently reported plasma A ratios as being able to predict A PET (5, 6). However, there has been limited investigation using untargeted methods in the discovery of novel blood markers that could reflect A burden. Studies using A endophenotype stratification have seldom investigated preclinical AD and have used a range of technologies, including two-dimensional gel electropho-resis (7, 8) and immunoassay panels (9, 10), but these approaches have limitations (e.g., predetermined targets, large sample volumes, and large variability). At the discovery level, MS has the key advan-tage of unbiased measurement of features present within a sample without prior knowledge of its contents. This enables MS to be com-patible with a hypothesis-free investigation, the results of which could be confirmed using targeted proteomics. The foremost criti-cism of shotgun MS workflows is poor sensitivity owing to the large
1King’s College London, Institute of Psychiatry, Psychology and Neuroscience, Maurice Wohl Institute Clinical Neuroscience Institute, London, UK. 2NIHR Biomedical Research Centre for Mental Health and Biomedical Research Unit for Dementia at South London and Maudsley NHS Foundation, London, UK. 3Department of Psychiatry and Neurochemistry, Sahlgrenska Academy at the University of Gothenburg, Mölndal, Sweden. 4Wallenberg Centre for Molecular and Translational Medicine, University of Gothenburg, Gothenburg, Sweden. 5Department of Psychiatry, University of Oxford, Oxford, UK. 6Proteomics Core Facility, James Black Centre, King’s College, London, UK. 7School of Medical Sciences, Edith Cowan University, Joondalup, WA, Australia. 8Cooperative Research Centre for Mental Health, Carlton South, VIC, Australia. 9School of Medicine, Faculty of Health, Deakin University, 3220 VIC, Australia. 10KaRa Institute of Neurological Diseases, Macquarie Park, NSW, Australia. 11Department of Biomedical Sciences, Macquarie University, 2109, NSW, Australia. 12Clinical Research Department, Anglicare, Sydney, NSW, Australia. 13School of Psychiatry and Clinical Neurosciences, University of Western Australia, WA, Australia. 14Clinical Neurochemistry Laboratory, Sahlgrenska University Hospital, Mölndal, Sweden. 15Department of Molecular Neuroscience, UCL Institute of Neurology, Queen Square, London, UK. 16UK Dementia Research Institute at UCL, London, UK. 17Academic Unit for Psychiatry of Old Age, St. George’s Hospital, University of Melbourne, VIC, Australia. 18The Florey Institute, University of Melbourne, VIC, Australia. 19Department of Molecular Imaging and Therapy, Austin Health, Heidelberg, VIC, Australia. 20National Ageing Research Institute, Parkville, VIC, Australia. 21Centre for Age-Related Medicine, Stavanger University Hospital, Stavanger, Norway.*Corresponding author. Email: [email protected]
Copyright © 2019 The Authors, some rights reserved; exclusive licensee American Association for the Advancement of Science. No claim to original U.S. Government Works. Distributed under a Creative Commons Attribution NonCommercial License 4.0 (CC BY-NC).
on June 3, 2019http://advances.sciencem
ag.org/D
ownloaded from

Ashton et al., Sci. Adv. 2019; 5 : eaau7220 6 February 2019
S C I E N C E A D V A N C E S | R E S E A R C H A R T I C L E
2 of 12
dynamic range of protein abundances, which results in an inade-quate coverage of the plasma proteome. The marked improvement in MS technology over recent years has renewed the interest in un-targeted plasma proteins in many disease areas, and combined with immunodepletion of highly abundant proteins and extensive frac-tionation methods, it is possible to identify more than 1000 proteins (11). With this in mind, the aim of this study was to perform an exten-sive untargeted proteomic discovery in plasma to predict A burden in preclinical disease. We primarily focused on 238 cognitively un-impaired individuals from the Australian Imaging, Biomarker and Lifestyle Flagship Study of Ageing (AIBL) and the Kerr Anglican Re-tirement Village Initiative in Ageing Health (KARVIAH) studies who had undergone PET to determine their A status. Moreover, we took a comprehensive approach to replicating our findings in an indepen-dent sample set using the same methodological approach.
RESULTSSubject demographicsThe demographic and clinical characteristics of the cognitively unimpaired individuals are presented in Table 1. In AIBL, 100 participants were classified as A negative (A−) and 44 participants as A positive (A+) by 11C-PiB standardized uptake values ratio (SUVR) cutoff of 1.4. In KARVIAH, 59 participants were classified as A− and 35 participants as A+ by 18FBB (Florbetaben) SUVR cut-off of 1.35. There was a significant increase in the number APOE 4 carriers in both A+ groups, and the A+ groups also had a tendency to be older. There was no significant difference in cognitive perfor-mance between A− and A+ groups (Table 1). A secondary analy-sis included a further 46 AIBL participants with a diagnosis of mild cognitive impairment (MCI; n = 21) or AD (n = 25). The character-istics of the full cohort including these subjects are presented in Table 2.
Plasma protein metricsA total of 2356 individual protein groups at 5% false discovery rate (FDR) were measured across all experiments. The lowest observed concentration was 4.3 pg/ml (multiple epidermal growth factor–like domains protein 8), with 29% of protein groups measured in this study had reported concentrations in a reference database (Human Plasma Proteome Project; www.hupo.org/plasma-proteome-project/). A total of 560 protein groups were consistently measured across >75% of the sample set (table S1), and these protein groups were taken forward for statistical evaluation.
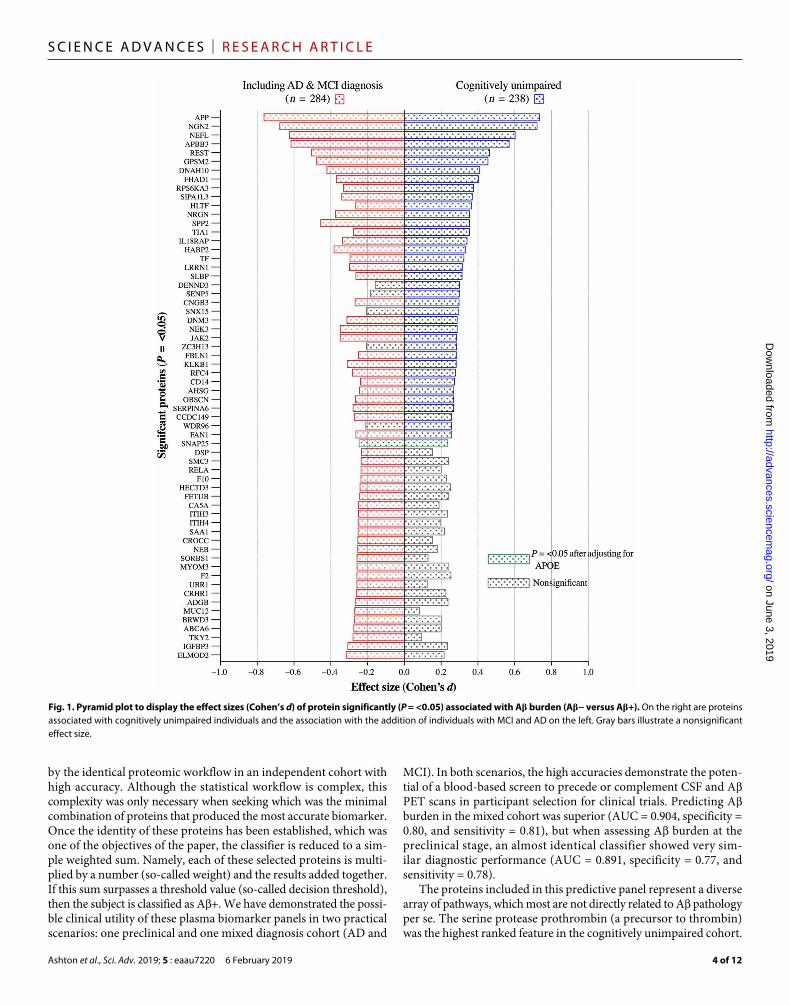
Plasma proteins associated with A burden in a preclinical diseaseA PET SUVR measures from 238 cognitively unimpaired individuals (Table 1) were categorized into binary “A−” or “A+” classification, and adjusted scores for 560 plasma proteins were analyzed for their association with A pathology. A total of 37 protein groups were found to be nominally associated with A groups at the uncorrected P value of <0.05 (Fig. 1 and table S2A). After Benjamini-Hochberg multiple testing correction (FDR), five protein groups remained associated with A classification (Q = <0.05; Table 3). An increased expression for A A4 precursor protein (APP), neurogenin-2 (NGN2), neurofila-ment light polypeptide (NfL), and A APP–binding family B member 3 (APBB3) in A+ individuals was observed with a medium-to-large effect size (Fig. 1). A decreased protein expression in the A+ group was found for RE1-silencing transcription factor (REST) with a small
effect size (Cohen’s d = 0.46). After adjusting for the influence of APOE genotype, APP, NGN2, and NfL remained statistically increased in the A+ group despite a weaker association (Q = <0.05; Table 3). Synaptosomal-associated protein 25 (SNAP25) was the only protein group to become nominally associated with A burden after APOE adjustment but did not pass FDR (Fig. 1 and table S2A). Only four protein groups were uniquely significantly associated with A+ in cognitively unimpaired individuals: DENN domain-containing protein 3 (DENN3), sentrin-specific protease 5 (SENP5), zinc finger CCCH domain–containing protein 13 (ZCH13), and cilia- and flagella-associated protein 43 (WDR96). In addition, NGN2, helicase- like transcription factor (HLTF), forkhead-associated domain- containing protein 1 (FHAD1), ribosomal protein S6 kinase alpha-3 (RPS6KA3), and signal-induced proliferation-associated 1–like protein 3 (SIPAIL3) had greater effect sizes in the cognitively unimpaired group despite being statistically significant in both analyses (Fig. 1).
Plasma proteins associated with A burden including individuals with MCI and ADWe then combined an additional 46 participants from AIBL with an MCI, and AD diagnosis was included in a secondary analysis (table S3). A total of 56 protein groups were found to be statistically different between A− and A+ groups at the uncorrected P value of <0.05 (Fig. 1). After FDR, eight protein groups remained associated with A classification (Q = <0.05; table S3A). These included APP, NGN2, NfL, APBB3, and REST, with the addition of dynein heavy chain 10 (DNAH10), G protein–signaling modulator 2 (GPSM2), and secreted phosphoprotein 24 (SPP2).
Most of protein groups had larger effect sizes when including A+ individuals with AD/MCI, including APP, NfL, REST, SPP2, and NRGN (neurogranin). There were an additional 24 protein groups that were statistically significant in the AD/MCI group compared with the cognitively unimpaired. However, several of these proteins were similar in effect size, and therefore, the reduced sample size in the cognitively unimpaired meant that they did not reach statistical significance [e.g., prothrombin (F2); Fig. 1]. Protein groups that had substantially greater effect in AD/MCI were nonreceptor tyrosine-protein kinase (TKY2) and mucin-12 (MUC12).
Plasma protein classifier for A positivityUnivariate analysis revealed several single plasma protein groups to be nominally associated with A classification, with a small number of protein groups being strongly associated with A status with medium-to-large effect sizes (Tables 3 and 4). While this univariate analysis studies associations one protein at a time, classifier methods do so with all proteins simultaneously, which enables detecting pro-teins that are related to disease only when considered in combination with other proteins. Owing to this, classifiers are able to achieve the greater sensitivity and specificity required for clinical implementation, although the proteins they select may not always coincide with those found by univariate methods.
The feature selection method “Ridge,” followed by a support vector machine (SVM) analysis, was used to create classifiers predicting A+ in the AIBL cohort. We used either demographics only [gender, age, and APOE ɛ4 count (“demographic data”)] and/or proteins (“full data”). Each scenario produced 50 classifier models, with each classifier including one additional feature into the model. We tested each
on June 3, 2019http://advances.sciencem
ag.org/D
ownloaded from

Ashton et al., Sci. Adv. 2019; 5 : eaau7220 6 February 2019
S C I E N C E A D V A N C E S | R E S E A R C H A R T I C L E
3 of 12
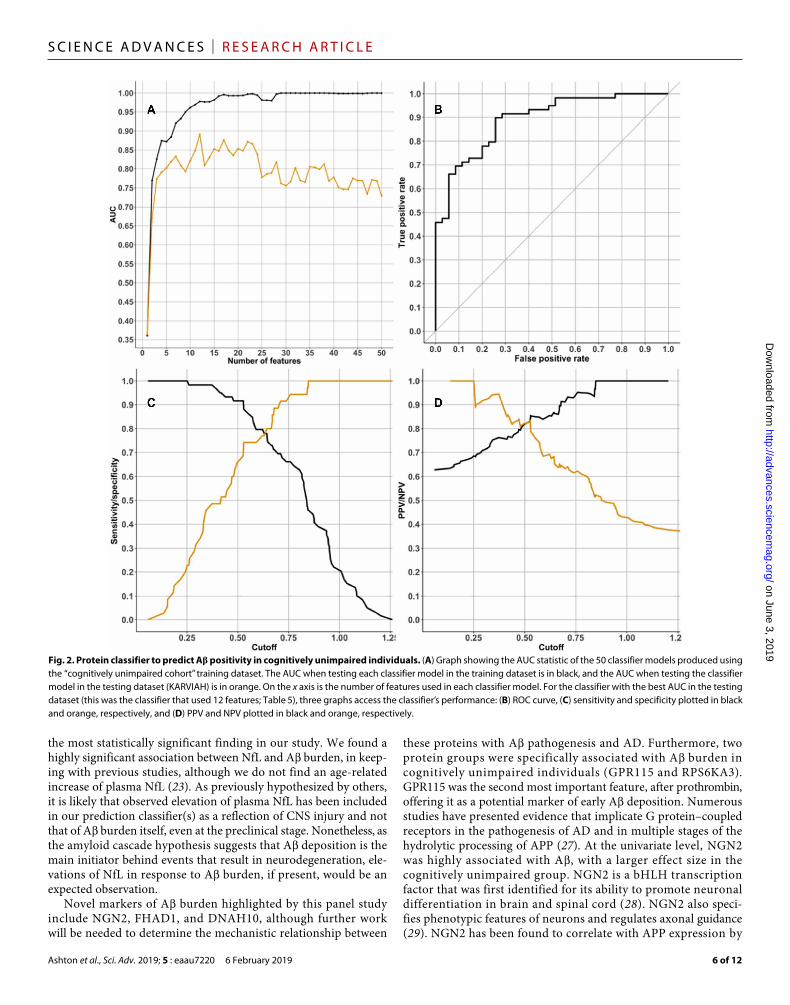
classifier in the independent KARVIAH dataset and calculated the area under the receiver operator characteristic (ROC) curve (AUC) to detect the best model at predicting A positivity in each scenario. The optimal model to predict A positivity in cognitively unim-paired individuals produced a testing AUC of 0.891 [cutoff = 0.63, specificity = 0.77, sensitivity = 0.78, positive predictive value (PPV) = 0.85, and negative predictive value (NPV) = 0.68; Fig. 2]. This classifier included 10 protein features (Table 5) and two demographic fea-tures (APOE 4 count and age). A classifier that included participants with MCI and AD produced a testing AUC of 0.904 (cutoff = 0.687, specificity = 0.80, sensitivity = 0.81, PPV = 0.87, and NPV = 0.72; Fig. 3). This classifier included one demographic feature (APOE 4 count) and nine protein features, of which eight proteins were com-mon with the cognitively unimpaired classifier (Table 6). The opti-mum demographic data model demonstrated a testing AUC of 0.725 for the cognitively unimpaired cohort.
DISCUSSIONCurrent imaging and CSF measurements of A are considered gold standards for diagnosis of cerebral AD pathophysiology (12). How-ever, PET imaging is costly, access to the ligand is limited, and this
imaging is only available in relatively specialized centers. Therefore, it is unlikely to be part of routine clinical assessment of cognitive complaints before therapies become available. Conversely, CSF collec-tion is more readily accessible, less expensive, but generally consid-ered as invasive with a small risk of mild adverse effects by the public or as time consuming by clinicians. Furthermore, neither of these gold standards is suitable for population-based screening for identi-fying high-risk individuals for early intervention before symptom onset. Thus, a blood-based measure that accurately reflects AD pathology, ideally at the preclinical phase, would have significant advantages in therapeutic trials and clinical decisions in prescribing A-targeting drugs once available.
In the present study, we used a nontargeted proteomic technique that combined extensive prefractionation and high-resolution MS to demonstrate a substantial number of individual plasma proteins to be nominally associated with A burden in the cognitively unim-paired. A distinct group of analytes were shown to be highly related to A burden, with medium-to-large effect sizes. However, the sub-stantial overlap of the group-wise distributions suggested that these markers alone would not reliably distinguish A burden. Therefore, and more notably, using feature selection and SVM, we detailed a multianalyte classifier to predict A burden that was replicated
Table 2. Subject demographics for the mixed diagnosis cohort (AIBL, n = 190; KARVIAH, n = 94). n/a, not available.
AIBL discovery cohort (11C-PiB) KARVIAH replication cohort (18FBB)
A− A+ P value A− A+ P
Number of subjects (n) 108 82 59 35
A PET SUVR [means (SD)] 1.16 (0.1) 2.09 (0.4) 7.44 × 10−60 1.16 (0.1) 1.70 (0.2) 8.35 × 10⁻²³
Gender; females [n (%)] 54 (50.0) 40 (48.7) ns 40 (67.8) 21 (60.0) ns
Age in years [means (SD)] 71.17 (7.2) 74.04 (7.7) 0.011 77.5 (5.5) 79.6 (5.3) ns
Clinical diagnosis [n (%)]Cognitively unimpairedMCIAD
100 (92.6)7 (6.5)1 (0.9)
44 (53.7)14 (17.1)24 (29.2)
3.38 × 10−1159 (100.0)
n/an/a
35 (100.0)n/an/a
n/a
APOE 4 carrier [n (%)] 28 (25.9) 54 (65.9) 5.91 × 10⁻⁵ 6 (10.2) 15 (42.9) 0.001
MMSE [means (SD)] 28.7 (1.4) 26.1 (4.0) 5.96 × 10⁻⁷ 29.4 (1.6) 29.1 (1.4) ns
Table 1. Subject demographics for cognitively unimpaired individuals (AIBL, n = 144; KARVIAH, n = 94). MMSE, Mini Mental State Examination; ns, not significant.
AIBL discovery cohort (11C-PiB) KARVIAH replication cohort (18FBB)
A− A+ P value A− A+ P value
Number of subjects (n) 100 44 59 35
A PET SUVR [means (SD)] 1.16 (0.1) 1.90 (0.3) 1.11 × 10−54 1.16 (0.1) 1.70 (0.2) 8.35 × 10⁻²³
Gender; females [n (%)] 51 (50.0) 21 (50.0) ns 40 (67.8) 21 (60.0) ns
Age in years [means (SD)] 70.8 (7.1) 75.5 (6.9) 0.001 77.5 (5.5) 79.6 (5.3) ns
APOE 4 carrier [n (%)] 27 (27) 27 (61.4) 7.70 × 10⁻⁴ 6 (10.2) 15 (42.9) 0.001
MMSE [means (SD)] 28.9 (1.2) 28.5 (1.3) ns 29.4 (1.6) 29.1 (1.4) ns
on June 3, 2019http://advances.sciencem
ag.org/D
ownloaded from
Ashton et al., Sci. Adv. 2019; 5 : eaau7220 6 February 2019
S C I E N C E A D V A N C E S | R E S E A R C H A R T I C L E
4 of 12
by the identical proteomic workflow in an independent cohort with high accuracy. Although the statistical workflow is complex, this complexity was only necessary when seeking which was the minimal combination of proteins that produced the most accurate biomarker. Once the identity of these proteins has been established, which was one of the objectives of the paper, the classifier is reduced to a sim-ple weighted sum. Namely, each of these selected proteins is multi-plied by a number (so-called weight) and the results added together. If this sum surpasses a threshold value (so-called decision threshold), then the subject is classified as A+. We have demonstrated the possi-ble clinical utility of these plasma biomarker panels in two practical scenarios: one preclinical and one mixed diagnosis cohort (AD and
MCI). In both scenarios, the high accuracies demonstrate the poten-tial of a blood-based screen to precede or complement CSF and A PET scans in participant selection for clinical trials. Predicting A burden in the mixed cohort was superior (AUC = 0.904, specificity = 0.80, and sensitivity = 0.81), but when assessing A burden at the preclinical stage, an almost identical classifier showed very sim-ilar diagnostic performance (AUC = 0.891, specificity = 0.77, and sensitivity = 0.78).
The proteins included in this predictive panel represent a diverse array of pathways, which most are not directly related to A pathology per se. The serine protease prothrombin (a precursor to thrombin) was the highest ranked feature in the cognitively unimpaired cohort.
Fig. 1. Pyramid plot to display the effect sizes (Cohen’s d) of protein significantly (P = <0.05) associated with A burden (A− versus A+). On the right are proteins associated with cognitively unimpaired individuals and the association with the addition of individuals with MCI and AD on the left. Gray bars illustrate a nonsignificant effect size.
on June 3, 2019http://advances.sciencem
ag.org/D
ownloaded from

Ashton et al., Sci. Adv. 2019; 5 : eaau7220 6 February 2019
S C I E N C E A D V A N C E S | R E S E A R C H A R T I C L E
5 of 12
At the univariate level, prothrombin (or coagulation factor II) was shown to be decreased in A+ individuals but had a modest effect size. Multiple lines of evidence support that cerebrovascular disease may play a role in AD and that A may be involved in thrombosis, fibrinolysis, and inflammation via its interaction with the coagula-tion cascade (13). The APP isoform Kunitz protease inhibitor domain (protease nexin-2) is involved in the regulation of coagulation and in thrombosis pathophysiology (14, 15). Thrombin has previously been reported to induce the release of APP from platelets and its sub-sequent processing (16), and we have previously reported fibrinogen gamma chain, a protein involved in the intrinsic coagulation cascade and target of prothrombin, as having a modest prediction of A pos-itivity (17). However, this study did not replicate our previous find-ing. Encouragingly, our study has highlighted the most investigated current plasma biomarkers for AD and/or neurodegeneration, APP and NfL, in an unbiased fashion. These proteins are included in both A burden prediction models but have a greater effect size in the classifier that included individuals with reported cognitive de-cline, confirming their connection with the more established dis-ease state. A, derived from APP, is readily measured in plasma, but historically, the correlation with AD and/or surrogate A measures has been absent or weak (18). Plasma A concentrations have been
interpreted as influenced by production in platelets and other extra-cerebral tissues (19). However, recent MS studies suggest that a ratio of APP-derived fragments (APP669–711 and A42/A40) identifies A+ individuals with high sensitivity and specificity (6). In part, our data agree with these studies and with prior work that found plasma APP species to be elevated in AD and implicated serine proteases in these changes (20). We have shown that combined intensities from tryptic peptides residing from similar APP fragment regions, as the studies described above were shown to be statistically related to A PET, although large overlap between groups remained. As with other panel-based studies, we also conclude that APP peptides (including A species) have the utility to contribute to a compound panel (9, 21). NfL is an axonal neuron-specific protein actively involved in the pathogenesis of axonal injury and degeneration. NfL is detect-able and quantifiable in blood despite being more than 50-fold lower in concentration than in the CSF (22), and here, we have demon-strated NfL peptide measurements using an untargeted MS approach. In previous studies, NfL levels in blood have been found to be in-creased in AD (23), frontotemporal dementia (24), and progressive supranuclear palsy (25). CSF and plasma concentrations correlate, supporting the notion that plasma NfL reflects CSF concentration and potentially CNS damage (26). NfL, after APP and NGN2, was
Table 3. GLM-adjusted protein groups significantly associated with A SUVR in cognitively unimpaired participants stratified by A+/− classification after multiple testing correction. Protein groups were also associated with A SUVR with an adjustment for APOE genotype. All protein groups that are nominally associated with A in cognitively unimpaired (P > 0.05) are shown in table S1.
UniProt ID Protein group description A+ group
Adjusted for APOE 4 status
t Mean difference P value Q t Mean
difference P value Q value
P05067 APP ↑ −5.651 −0.290 4.57 × 10−08 2.08x10−05 −4.686 −0.241 4.71 × 10−06 0.001
Q9H2A3 NGN2 ↑ −5.556 −0.319 7.43 × 10−08 2.08x10−05 −4.787 −0.276 2.99 × 10−06 0.001
P07196 NfL ↑ −4.639 −0.229 5.80 × 10−06 0.001 −3.716 −0.184 2.53 × 10−04 0.047
O95704 APBB3 ↑ −4.389 −0.274 1.71 × 10−05 0.002 −3.374 −0.210 0.001 ns
Q13127 REST ↓ 3.570 0.142 4.33 × 10−04 0.048 3.385 0.135 0.001 ns
Table 4. GLM-adjusted protein groups significantly associated with A SUVR in all subjects stratified by A+/− classification after Benjamini-Hochberg multiple testing corrections. Protein groups were also associated with A SUVR with an adjustment for APOE genotype. All protein groups that are nominally associated with A (P > 0.05) are shown in table S2 (A and B).
UniProt ID Protein group description A+ group
Adjusted for APOE 4 status
t Mean difference P value Q t Mean
difference P value Q value
P05067 A A4 protein ↑ −6.419 −0.279 5.79 × 10⁻¹⁰ 3.24 × 10−07 −5.019 −0.220 9.22 × 10−07 0.001
Q9H2A3 NGN2 ↑ −5.702 −0.283 2.98 × 10−08 8.34 × 10−06 −4.624 −0.231 5.75 × 10−06 0.002
P07196 NfL ↑ −5.258 −0.219 2.88 × 10−07 5.38 × 10−05 −3.928 −0.164 1.08 × 10−04 0.015
O95704 APBB3 ↑ −5.189 −0.272 4.05 × 10−07 5.67 × 10−05 −3.710 −0.194 2.49 × 10−04 0.028
Q13127 REST ↓ 4.247 0.143 2.94 × 10−05 3.29 × 10−03 3.984 0.135 8.64 × 10−05 0.015
P81274 GPSM2 ↓ 4.016 0.124 7.61 × 10−05 0.007 3.564 0.111 4.28 × 10−04 0.040
Q13103 SPP2 ↓ 3.833 0.108 1.56 × 10−04 0.013 3.310 0.094 0.001 0.084
Q8IVF4 DNAH10 (axonemal) ↑ −3.548 −0.090 4.54 × 10−04 0.032 −3.165 −0.081 0.002 0.120
on June 3, 2019http://advances.sciencem
ag.org/D
ownloaded from
Ashton et al., Sci. Adv. 2019; 5 : eaau7220 6 February 2019
S C I E N C E A D V A N C E S | R E S E A R C H A R T I C L E
6 of 12
the most statistically significant finding in our study. We found a highly significant association between NfL and A burden, in keep-ing with previous studies, although we do not find an age-related increase of plasma NfL (23). As previously hypothesized by others, it is likely that observed elevation of plasma NfL has been included in our prediction classifier(s) as a reflection of CNS injury and not that of A burden itself, even at the preclinical stage. Nonetheless, as the amyloid cascade hypothesis suggests that A deposition is the main initiator behind events that result in neurodegeneration, ele-vations of NfL in response to A burden, if present, would be an expected observation.
Novel markers of A burden highlighted by this panel study include NGN2, FHAD1, and DNAH10, although further work will be needed to determine the mechanistic relationship between
these proteins with A pathogenesis and AD. Furthermore, two protein groups were specifically associated with A burden in cognitively unimpaired individuals (GPR115 and RPS6KA3). GPR115 was the second most important feature, after prothrombin, offering it as a potential marker of early A deposition. Numerous studies have presented evidence that implicate G protein–coupled receptors in the pathogenesis of AD and in multiple stages of the hydrolytic processing of APP (27). At the univariate level, NGN2 was highly associated with A, with a larger effect size in the cognitively unimpaired group. NGN2 is a bHLH transcription factor that was first identified for its ability to promote neuronal differentiation in brain and spinal cord (28). NGN2 also speci-fies phenotypic features of neurons and regulates axonal guidance (29). NGN2 has been found to correlate with APP expression by
Fig. 2. Protein classifier to predict A positivity in cognitively unimpaired individuals. (A) Graph showing the AUC statistic of the 50 classifier models produced using the “cognitively unimpaired cohort” training dataset. The AUC when testing each classifier model in the training dataset is in black, and the AUC when testing the classifier model in the testing dataset (KARVIAH) is in orange. On the x axis is the number of features used in each classifier model. For the classifier with the best AUC in the testing dataset (this was the classifier that used 12 features; Table 5), three graphs access the classifier’s performance: (B) ROC curve, (C) sensitivity and specificity plotted in black and orange, respectively, and (D) PPV and NPV plotted in black and orange, respectively.
on June 3, 2019http://advances.sciencem
ag.org/D
ownloaded from

Ashton et al., Sci. Adv. 2019; 5 : eaau7220 6 February 2019
S C I E N C E A D V A N C E S | R E S E A R C H A R T I C L E
7 of 12
an increase in APP transgenic mice (Tg2576) but significantly down- regulated in neural stem/progenitor cells from APP knockout mice (30). In addition, a close relationship between NGN2 and APP was found in our study, but the origin of our NGN2 expression is unclear as limited information is available about peripheral NGN2.
A biologically complex neurodegenerative disease such as AD is unlikely to be caused by a single pathogenic event (31), and the find-ing of a panel of plasma biomarkers characterizing AD pathology, rather than a single marker, was to be expected. What was encour-aging was the high performance and reproducibility of the trained model in an entirely independent cohort, despite a methodically
Table 5. Feature list for multianalyte classifier predicting elevated A burden in cognitively unimpaired cohort. The classifier was training in the AIBL cohort (n = 144), achieving a testing AUC of 0.891 in the KARVIAH cohort (n = 94). GPCR, G protein–coupled receptor; sens, sensitivity; spec, specificity.
Feature no.
Cognitively unimpaired classifier for A burden(Testing AUC = 0.891, sens = 0.78, spec = 0.77, NPV = 0.68, PPV = 0.85)
UniProt ID Feature description Tryptic amino acid peptide sequences contributing to protein scores
1 P00734 Prothrombin 87–94, 98–116, 125–133, 178–198, 199–224, 217–224, 225–243, 248–263, 315–327, 328–344, 345–363, 354–363, 441–447, 447–452, 467–468, 518–537, 544–560, and 560–575
2 Q8IZF3 Adhesion GPCR F4 100–107, 315–328, 657–689, and 673–698
3 P05067 A A4 protein 677–687 and 688–699
4 Q9H2A3 NGN2 114–120
5 n/a APOE 4 count n/a
6 Q8IVF4 DNAH10 (axonemal)
207–223, 528–540, 879–915, 1133–1148, 1524–1528, 1870–1927, 2404–2436, 2906–2941, 2923–2945, and 4100–4139
7 Q13127 REST 353–369, 727–742, and 882–896
8 P07196 NfL 137–144, 154–164, 318–331, and 447–462
9 P51812 RPS6KA3 80–100, 109–132, 193–216, 226–242, 274–282, 508–525, and 570–591
10 P81274 GPSM2 267–278, 318–347, and 422–433
11 B1AJZ9 FHAD1 861–868, 876–887, 897–905, 931–942, 1030–1052, 1059–1070, and 1104–1139
12 n/a Age of participant n/a
Table 6. Feature list for multianalyte classifier predicting elevated A burden in a mixed diagnosis cohort. The classifier was training in the AIBL cohort (n = 169), achieving a testing AUC of 0.905 in the KARVIAH cohort (n = 94).
Feature no.
Mixed diagnosis classifier for A burden(Testing AUC = 0.904, sens = 0.81, spec = 0.80, NPV = 0.72, PPV = 0.87)
UniProt ID Feature description Tryptic amino acid peptide sequences contributing to protein scores
1 n/a APOE 4 count* n/a
2 P05067 A A4 protein* 677–687 and 688–699
3 P07196 NfL* 137–144, 154–164, 318–331, and 447–462
4 Q9H2A3 NGN2* 114-120
5 Q8IVF4 DNAH10 (axonemal)*
207–223, 528–540, 879–915, 1133–1148, 1524–1528, 1870–1927, 2404–2436, 2906–2941, 2923–2945, and 4100–4139
6 Q13127 REST* 353–369, 727–742, and 882–896
7 O95704 APBB3 155–175 and 414–430
8 P81274 GPSM2* 267–278, 318–347, and 422–433
9 P00734 Prothrombin* 87-94, 98–116, 125–133, 178–198, 199–224, 217–224, 225–243, 248–263, 315–327, 328–344, 345–363, 354–363, 441–447, 447–452, 467–468, 518–537, 544–560, and 560–575
10 B1AJZ9 FHAD1* 861–868, 876–887, 897–905, 931–942, 1030–1052, 1059–1070, and 1104–1139
*Proteins also included in the classifier for predicting A in the cognitively unimpaired individuals.
on June 3, 2019http://advances.sciencem
ag.org/D
ownloaded from

Ashton et al., Sci. Adv. 2019; 5 : eaau7220 6 February 2019
S C I E N C E A D V A N C E S | R E S E A R C H A R T I C L E
8 of 12
complex procedure. Previous studies have used shotgun MS as a hypothesis-generating tool to identify plasma protein biomarkers of AD pathology (7, 8, 17, 32). In each of these occasions, an attempt was then made to replicate these markers on an orthogonal platform, typically an immuno-based assay [e.g., enzyme-linked immuno-sorbent assay (ELISA) or Luminex xMAP]. In these cases, translation between techniques has been relatively disappointing and is likely due to key platform differences. Untargeted proteomics by MS in-volves the analysis of peptides resulting from denatured proteins, while ELISA measures native protein or, more precisely, the region of the intact protein where the epitope is recognized by the antibody resides. Therefore, using different methods will inevitably lead to
different results, and this may contribute to why proteins identified by an untargeted approach fail in replication using a targeted ap-proach. To our knowledge, this is the first time that a multianalyte plasma biomarker panel for an AD-related phenotype has been found and independently replicated by a nontargeted MS approach, and the commonality in platform, and certainly the homology in sample preprocessing, between discovery and replication has con-tributed to this successful result.
There are limitations to this study. First, although generating promising results, the platform used cannot be used as a routine tool, although we have demonstrated it to be robust in an indepen-dent cohort. Interlaboratory standardized operating procedures for
Fig. 3. Protein classifier to predict A positivity that includes participants with MCI and AD. (A) Graph showing the AUC statistic of the 50 classifier models produced using the “mixed diagnosis cohort” training dataset. The AUC when testing each classifier model in the training dataset is in black, and the AUC when testing the classifier model in the testing dataset (KARVIAH) is in orange. On the x axis is the number of features used in each classifier model. For the classifier with the best AUC in the testing dataset (this was the classifier that used 10 features; Table 6), three graphs access the classifier’s performance: (B) ROC curve, (C) sensitivity and specificity plotted in black and orange, respectively, (D) PPV and NPV plotted in black and orange, respectively.
on June 3, 2019http://advances.sciencem
ag.org/D
ownloaded from

Ashton et al., Sci. Adv. 2019; 5 : eaau7220 6 February 2019
S C I E N C E A D V A N C E S | R E S E A R C H A R T I C L E
9 of 12
this analytical process would prove difficult, given the complexed and variable methodological stages. Efforts will need to be made, guided by the MS spectral data, to transform the panel to an alter-native platform that is more appropriate for widespread implemen-tation. Second, the proteins measured in this study have been inferred on the basis of the combination of peptides, where a selec-tive reaction monitoring approach as a validation of specific peptides associated with A burden might be more appropriate. Further, it remains unclear whether the classifiers can track longitudinal changes in A, monitor A reduction in a therapeutic trial setting, or differentiate between other dementias that display A pathology. Last, cross- sectional studies have indicated that CSF A42 changes precede changes in A PET (33). This signifies that individuals with AD may be initially classified as “CSF+/PET−” before converting to “CSF+/PET+” at a later stage (34). Future studies could comple-ment the endophenotype approach using PET measures of A load, with studies using CSF measures of both A42 and tau as the comparison variable.
In summary, using an unbiased MS approach, we have found and replicated with high accuracy, specificity, and sensitivity a plasma protein classifier reflecting A burden in a cognitively unimpaired cohort. These predictive panels highlighted novel and established markers for AD. These panels almost certainly need to be refined, simplified, and undoubtedly validated in independent cohorts. Furthermore, efforts need to be made to successfully translate this panel to a simpler automated platform suitable for wider utility. The prediction of A burden in preclinical AD using a blood-based measure offers great potential in preclinical stratification for clinical trials and future diagnostic management.
MATERIALS AND METHODSStudy cohorts, assessments, and biofluid proceduresThe AIBL was used as the discovery cohort in the study. The AIBL study is a longitudinal study of aging, neuroimaging, biomarkers, lifestyle, and clinical and neuropsychological analysis, with a focus on early detection and lifestyle intervention (www.aibl.csiro.au). Specifics regarding participant recruitment, study design, and clinical assessments were previously described (35). Plasma samples from 190 AIBL participants with baseline A PET imaging (11C-PiB) were selected, with a focus on individuals without cognitive de-ficits at baseline. Further details about the 11C-PiB imaging protocols for the AIBL cohort were previously described (36). Participants were categorized as A− and A+ based on the 11C-PiB SUVR cutoff of 1.4 (37). For plasma preparation, whole blood (80 ml) was collected in the morning (overnight fasting) by venepuncture and centrifuged at 200g (20°C) for 10 min. The platelet-rich plasma was further spun at 800g (20°C) for 15 min (9). The KARVIAH was used as an independent replication cohort in this study. Participants recruited to this cohort were residents of Anglicare (Sydney, NSW, Australia), and all volunteers were required to meet the set screening inclu-sion and exclusion criteria to be eligible for the KARVIAH cohort (38). Selection of 94 KARVIAH participants was dependent on the availability of 18FBB images for each subject, where an A SUVR cutoff score of 1.35 was used to categorize A− and A+ (39). All KARVIAH participants were cognitively unimpaired based on their Mini Mental State Examination score of >26. Plasma preparation for 94 KARVIAH participants followed the same protocol as AIBL participants.
Immunodepletion, enzymatic digestion, and tandem mass tag peptide labelingAll AIBL and KARVIAH samples were randomized before sample preparation. Albumin and immunoglobulin G immuno-depletion was achieved by a commercially available immunoaffinity column (ProteoPrep, Sigma-Aldrich) with a starting volume of 30 l. For enzymatic digestion, 100 g of immunodepleted sample was initially incubated with 100 mM triethylammonium bicarbonate (TEAB) and 0.1% (w/v) SDS. Reduction and alkylation were achieved in 1 mM tris (2-carboxyethyl) phosphine for 1 hour at 55°C, followed by incu-bation in 7.5 mM iodoacetamide. Protein samples were individually digested overnight in 4 g of trypsin (sequencing grade, Roche) reconstituted in 100 mM TEAB. TMT10plex reagents (Thermo Fisher Scientific), reconstituted in acetonitrile (ACN), were added to the appropriate samples and incubated for 1 hour at room tem-perature (RT). Samples were treated with 5% hydroxylamine and incubated at RT for a further 15 min. For the 284 samples included in the study, a total of 32 “TMT10plex groups” were created by com-bining nine clinical samples (AIBL or KARVIAH) and one study reference. The study reference was an equal contribution of all sam-ples examined in the study. After combining, TMT10plex groups were incubated at RT for a further 15 min.
OFFGEL (OGE):Isoelectric peptide fractionationPeptide separation was achieved using the 3100 OFFGEL Fraction-ator (Agilent Technologies) with a 24-well setup. Immobilized pH gradient (IPG) gel strips (24 cm; GE Healthcare), with a 3 to 10 lin-ear pH gradient, were rehydrated for 15 min. Before fractionation, TMT10plex groups were dried down and resuspended in OFFGEL stock solution. Next, 150 l of resuspended TMT10plex peptide sam-ple was loaded into each compartment of the OFFGEL system. Peptide samples were focused until 50 kVh had accumulated (~48 hours). Liquid fractions were collected into separate Eppendorf tubes (pri-mary recovery). To extract larger peptides retained within the IPG strips, 150 l of ddH20/ACN/formic acid (49:50:1) was added to each compartment and incubated for a further 30 min with occasional pipette mixing. The supernatant (secondary recovery) was retrieved and added to the primary recovery. Each fraction collection was purified by a SOLA horseradish peroxidase solid-phase extraction cartridge (10 mg/1 ml; Thermo Fisher Scientific) before evapora-tion by centrifugation under a vacuum.
MS (LC-MS/MS) analysisBefore liquid chromatography–tandem MS (LC-MS/MS) analysis, each OFFGEL peptide fraction was reconstituted in ddH20/ACN/formic acid (50:49.9:0.1) and then shaken at 37°C and vortexed thoroughly. Chromatographic separation and mass spectra acquisi-tion (LTQ Orbitrap Velos Pro, Thermo Fisher Scientific) was per-formed on each fraction and was previously described (17), with a modified MS1 resolution of 60,000 and MS2 resolution of 30,000.
Preprocessing of MS (LC-MS/MS) dataRaw MS data for all fractions within a single TMT10plex were com-bined and searched as a “MudPIT” against the human UniProtKB/Swiss-Prot database using Mascot and Sequest (Proteome Discov-erer version 1.4). The criteria for Mascot were described elsewhere (17) and Sequest also followed these settings. Peptide spectrum matches (PSMs) were rejected if identified with only low confidence (≥5% FDR) and/or missing quantification channels [e.g., not all
on June 3, 2019http://advances.sciencem
ag.org/D
ownloaded from

Ashton et al., Sci. Adv. 2019; 5 : eaau7220 6 February 2019
S C I E N C E A D V A N C E S | R E S E A R C H A R T I C L E
10 of 12
peaks for tandem mass tags (TMTs) visible in spectra]. Raw inten-sity values of TMTs from PSMs passing filters were used for quantifi-cation. Preprocessing steps were applied to translate PSM intensities to relative protein abundance. This was a three-step process and was mod-ified from a previously described R script (PRQ, or Pre- processing for Relative Quantification) (17). First, sequences with an intensity <50 were removed from the analysis. Second, median normalization within each TMT10plex was applied. This was achieved by calculating the ratio between all the intensities within a sample and the correspond-ing reference sample and then dividing each intensity by the calcu-lated ratio, obtaining an intensity ratio. Each intensity ratio is, in turn, divided by the corresponding reference sample, and all results corresponding to the same peptide were summed into a peptide score. Third, the mean peptide scores are calculated to obtain protein abun-dance measurements. Last, a protein matrix table was then produced, which collated all identified protein groups and their corresponding TMT scores for each individual across the whole study. A protein group is defined as proteins that are identified by the same set or subset of assigned peptides.
Statistical analysisPrincipal components analysis demonstrated a significant variation in protein abundance scores between the 32 TMT10plex groups. Many experimental factors are intrinsic with TMT10plex group: off-gel electrophoresis (OGE) fractionation date, TMT labeling date, and date of MS acquisition, which are prone to significant variation. Therefore, an initial generalized linear model (GLM) correcting for only TMT10plex group was performed before further investigating the effect of other covariates on protein group ratios. All GLM protein abundance scores were then log10-transformed to achieve normal distribution. Covariates including age, gender, and center (AIBL or KARVIAH) were investigated. We found that most proteins were significantly affected by these covariates, and therefore, subsequent GLM to include these confounders was appropriate. Missing protein abundance observations were imputed with the R package “mice” (version 2.46.0) using four imputations, four itera-tions, and 50 other proteins as a predictor. The 50 predictor pro-teins were chosen using the feature selection method LASSO via the R package “glmnet” (version 2.0-13) (40) with an penalty cost of 1, the result of which was a list of proteins ranked by their correlation with the protein to impute; the top 50 predictor proteins were se-lected from this list.
Univariate analysisUnivariate analysis specializes on finding proteins that, by themselves, correlate with a given outcome once the effect of a number of covari-ates is eliminated. This analysis was performed in SPSS version 24 (IBM). For univariate analysis only, AIBL and KARVIAH samples were combined for the association with A PET. All univariate analyses were performed on the imputed GLM-adjusted data described above. Student’s t test and Pearson’s correlation were performed to assess protein abundances with A as a binary (A+/−) and continuous measure (SUVR). A partial correlation and binary logistic regression were also performed to examine the influence of APOE genotype on the results. Benjamini-Hochberg Q values were calculated as a multiple testing correction. This univariate pipeline was performed for two datasets: (i) those classified as cognitively unimpaired (n = 238; Table 1) and (ii) all individuals included in the study, including those with MCI and AD (n = 284; Table 2).
Multivariate biomarker classifierIn the case of our study, and given a large set of proteins and an outcome, multivariate analysis specializes on finding which is the combination of proteins that best predicts the outcome. Many, but not necessarily all, of these proteins will also correlate with the out-come by themselves. All analyses in this section were performed using R (version 3.3.3). For the purpose of multianalyte classification of A positivity, imputed protein abundances that were only GLM ad-justed for TMT10plex group were used, thus allowing demographic variables to be independently chosen in feature selection. GLM was achieved using the R package “stats” (version 3.3.3).
Biomarker classifier development took place in three steps: (i) feature selection, (ii) training, and (iii) testing. Feature selection and training used only the AIBL cohort, while the KARVIAH cohort was kept for independent testing. Two training datasets were created, cognitively unimpaired individuals (n = 144; Table 1) and one in-cluding those with MCI and AD (n = 169; Table 2). This format would allow us to observe the influence of disease on the ability of a classifier model to predict A positivity. The testing dataset contained a total of 94 samples from KARVIAH (Table 1). Two feature sets were used, either demographic variables only (gender, age at sampling, and APOE ɛ4 status) or both demographic and protein scores. Analysis was performed four times, each with a different combination of train-ing dataset and feature set. For each analysis, the aforementioned three steps (feature selection, training, and testing) were performed over 50 iterations, where, in each iteration, the algorithm was allowed to use one protein more than in the previous iteration, starting with 1 protein and finishing with 50. Feature selection was performed using a training dataset and the R package glmnet (version 2.0-13) (40) with an penalty cost of zero (“Ridge regression”), this result-ed in a list of features ranked by their correlation with A positivity, of which the top x was selected for subsequent training (where x = iteration number). Training was performed using the selected fea-tures, the same training dataset, and SVM from the R package “e1071” (version 1.6-8), this resulted in a model to classify A positivity. Testing involved evaluating the accuracy at which the classifier could predict A positivity in the testing dataset (KARVIAH); this was achieved by calculating the AUC using the R package “ROCR” (version 1.0.7). The training and testing AUC of all 50 classifiers was plotted using the R package “ggplot2” (version 2.2.1). Following these three steps, we selected the classifier with the highest AUC in the testing dataset as the best performing, and to assess this further, we used ROCR to calculate six statistics for a range of cutoff values and plotted these over three images using ggplot2. These statistics included the true positive rate, false positive rate, sensitivity, specificity, PPV, and NPV. The best cutoff value was chosen as the intersection of the sensitivity and specificity.
SUPPLEMENTARY MATERIALSSupplementary material for this article is available at http://advances.sciencemag.org/cgi/content/full/5/2/eaau7220/DC1Table S1. Residual scores for all 560 protein groups.Table S2. The association of plasma protein groups with A SUVR in cognitively unimpaired subjects.Table S3. The association of plasma protein groups with A SUVR in all subjects.
REFERENCES AND NOTES 1. A. L. Baird, S. Westwood, S. Lovestone, Blood-based proteomic biomarkers of Alzheimer’s
disease pathology. Front. Neurol. 6, 236 (2015). 2. C. Bazenet, S. Lovestone, Plasma biomarkers for Alzheimer’s disease: Much needed but
tough to find. Biomark. Med. 6, 441–454 (2012).
on June 3, 2019http://advances.sciencem
ag.org/D
ownloaded from

Ashton et al., Sci. Adv. 2019; 5 : eaau7220 6 February 2019
S C I E N C E A D V A N C E S | R E S E A R C H A R T I C L E
11 of 12
3. C. R. Jack Jr., D. S. Knopman, W. J. Jagust, R. C. Petersen, M. W. Weiner, P. S. Aisen, L. M. Shaw, P. Vemuri, H. J. Wiste, S. D. Weigand, T. G. Lesnick, V. S. Pankratz, M. C. Donohue, J. Q. Trojanowski, Tracking pathophysiological processes in Alzheimer’s disease: An updated hypothetical model of dynamic biomarkers. Lancet Neurol. 12, 207–216 (2013).
4. S. Salloway, R. Sperling, N. C. Fox, K. Blennow, W. Klunk, M. Raskind, M. Sabbagh, L. S. Honig, A. P. Porsteinsson, S. Ferris, M. Reichert, N. Ketter, B. Nejadnik, V. Guenzler, M. Miloslavsky, D. Wang, Y. Lu, J. Lull, I. C. Tudor, E. Liu, M. Grundman, E. Yuen, R. Black, H. R. Brashear, Bapineuzumab 301 and 302 Clinical Trial Investigators, Two phase 3 trials of bapineuzumab in mild-to-moderate Alzheimer’s disease. N. Engl. J. Med. 370, 322–333 (2014).
5. S. Janelidze, E. Stomrud, S. Palmqvist, H. Zetterberg, D. van Westen, A. Jeromin, L. Song, D. Hanlon, C. A. Tan Hehir, D. Baker, K. Blennow, O. Hansson, Plasma -amyloid in Alzheimer’s disease and vascular disease. Sci. Rep. 6, 26801 (2016).
6. A. Nakamura, N. Kaneko, V. L. Villemagne, T. Kato, J. Doecke, V. Doré, C. Fowler, Q.-X. Li, R. Martins, C. Rowe, T. Tomita, K. Matsuzaki, K. Ishii, K. Ishii, Y. Arahata, S. Iwamoto, K. Ito, K. Tanaka, C. L. Masters, K. Yanagisawa, High performance plasma amyloid- biomarkers for Alzheimer’s disease. Nature 554, 249–254 (2018).
7. M. Thambisetty, R. Tripaldi, J. Riddoch-Contreras, A. Hye, Y. An, J. Campbell, J. Sojkova, A. Kinsey, S. Lynham, Y. Zhou, L. Ferrucci, D. F. Wong, S. Lovestone, S. M. Resnick, Proteome-based plasma markers of brain amyloid- deposition in non-demented older individuals. J. Alzheimers Dis. 22, 1099–1109 (2010).
8. S. Westwood, E. Leoni, A. Hye, S. Lynham, M. R. Khondoker, N. J. Ashton, S. J. Kiddle, A. L. Baird, R. Sainz-Fuertes, R. Leung, J. Graf, C. T. Hehir, D. Baker, C. Cereda, C. Bazenet, M. Ward, M. Thambisetty, S. Lovestone, Blood-based biomarker candidates of cerebral amyloid using PiB PET in non-demented elderly. J. Alzheimers Dis. 52, 561–572 (2016).
9. S. C. Burnham, N. G. Faux, W. Wilson, S. M. Laws, D. Ames, J. Bedo, A. I. Bush, J. D. Doecke, K. A. Ellis, R. Head, G. Jones, H. Kiiveri, R. N. Martins, A. Rembach, C. C. Rowe, O. Salvado, S. L. Macaulay, C. L. Masters, V. L. Villemagne, Alzheimer’s Disease Neuroimaging Initiative, Australian Imaging, Biomarkers and Lifestyle Study Research Group, A blood-based predictor for neocortical A burden in Alzheimer’s disease: Results from the AIBL study. Mol. Psychiatry 19, 519–526 (2014).
10. S. J. Kiddle, M. Thambisetty, A. Simmons, J. Riddoch-Contreras, A. Hye, E. Westman, I. Pike, M. Ward, C. Johnston, M. K. Lupton, K. Lunnon, H. Soininen, I. Kloszewska, M. Tsolaki, B. Vellas, P. Mecocci, S. Lovestone, S. Newhouse, R. Dobson, Alzheimers Disease Neuroimaging Initiative, Plasma based markers of [11C] PiB-PET brain amyloid burden. PLOS ONE 7, e44260 (2012).
11. P. E. Geyer, N. A. Kulak, G. Pichler, L. M. Holdt, D. Teupser, M. Mann, Plasma proteome profiling to assess human health and disease. Cell Syst. 2, 185–195 (2016).
12. K. Blennow, N. Mattsson, M. Schöll, O. Hansson, H. Zetterberg, Amyloid biomarkers in Alzheimer’s disease. Trends Pharmacol. Sci. 36, 297–309 (2015).
13. H. J. Ahn, Z. L. Chen, D. Zamolodchikov, E. H. Norris, S. Strickland, Interactions of -amyloid peptide with fibrinogen and coagulation factor XII may contribute to Alzheimerʼs disease. Curr. Opin. Hematol. 24, 427–431 (2017).
14. F. Xu, J. Davis, J. Miao, M. L. Previti, G. Romanov, K. Ziegler, W. E. van Nostrand, Protease nexin-2/amyloid -protein precursor limits cerebral thrombosis. Proc. Natl. Acad. Sci. U.S.A. 102, 18135–18140 (2005).
15. W. Wu, H. Li, D. Navaneetham, Z. W. Reichenbach, R. F. Tuma, P. N. Walsh, The Kunitz protease inhibitor domain of protease nexin-2 inhibits factor XIa and murine carotid artery and middle cerebral artery thrombosis. Blood 120, 671–677 (2012).
16. A. I. Bush, R. N. Martins, B. Rumble, R. Moir, S. Fuller, E. Milward, J. Currie, D. Ames, A. Weidemann, P. Fischer, The amyloid precursor protein of Alzheimer’s disease is released by human platelets. J. Biol. Chem. 265, 15977–15983 (1990).
17. N. J. Ashton, S. J. Kiddle, J. Graf, M. Ward, A. L. Baird, A. Hye, S. Westwood, K. V. Wong, R. J. Dobson, G. D. Rabinovici, B. L. Miller, H. J. Rosen, A. Torres, Z. Zhang, L. Thurfjell, A. Covin, C. T. Hehir, D. Baker, C. Bazenet, S. Lovestone, AIBL Research Group, Blood protein predictors of brain amyloid for enrichment in clinical trials? Alzheimers Dement. 1, 48–60 (2015).
18. B. Olsson, R. Lautner, U. Andreasson, A. Öhrfelt, E. Portelius, M. Bjerke, M. Hölttä, C. Rosén, C. Olsson, G. Strobel, E. Wu, K. Dakin, M. Petzold, K. Blennow, H. Zetterberg, CSF and blood biomarkers for the diagnosis of Alzheimer’s disease: A systematic review and meta-analysis. Lancet Neurol. 15, 673–684 (2016).
19. H. Zetterberg, Plasma amyloid —Quo vadis? Neurobiol. Aging 36, 2671–2673 (2015). 20. A. I. Bush, S. Whyte, L. D. Thomas, T. G. Williamson, C. J. van Tiggelen, J. Currie,
D. H. Small, R. D. Moir, Q.-X. Li, B. Rumble, U. Mönning, K. Beyreuther, C. L. Masters, An abnormality of plasma amyloid protein precursor in Alzheimer’s disease. Ann. Neurol. 32, 57–65 (1992).
21. A. Rembach, N. G. Faux, A. D. Watt, K. K. Pertile, R. L. Rumble, B. O. Trounson, C. J. Fowler, B. R. Roberts, K. A. Perez, Q. X. Li, S. M. Laws, K. Taddei, S. Rainey-Smith, J. S. Robertson, M. Vandijck, H. Vanderstichele, K. J. Barnham, K. A. Ellis, C. Szoeke, L. Macaulay, C. C. Rowe, V. L. Villemagne, D. Ames, R. N. Martins, A. I. Bush, C. L. Masters, AIBL research group,
Changes in plasma amyloid beta in a longitudinal study of aging and Alzheimer’s disease. Alzheimers Dement. 10, 53–61 (2014).
22. J. Kuhle, C. Barro, U. Andreasson, T. Derfuss, R. Lindberg, Å. Sandelius, V. Liman, N. Norgren, K. Blennow, H. Zetterberg, Comparison of three analytical platforms for quantification of the neurofilament light chain in blood samples: ELISA, electrochemiluminescence immunoassay and Simoa. Clin. Chem. Lab. Med. 54, 1655–1661 (2016).
23. N. Mattsson, U. Andreasson, H. Zetterberg, K. Blennow, Alzheimer’s Disease Neuroimaging Initiative, Association of plasma neurofilament light with neurodegeneration in patients with Alzheimer disease. JAMA Neurol. 74, 557–566 (2017).
24. J. D. Rohrer, I. O. C. Woollacott, K. M. Dick, E. Brotherhood, E. Gordon, A. Fellows, J. Toombs, R. Druyeh, M. J. Cardoso, S. Ourselin, J. M. Nicholas, N. Norgren, S. Mead, U. Andreasson, K. Blennow, J. M. Schott, N. C. Fox, J. D. Warren, H. Zetterberg, Serum neurofilament light chain protein is a measure of disease intensity in frontotemporal dementia. Neurology 87, 1329–1336 (2016).
25. J. C. Rojas, A. Karydas, J. Bang, R. M. Tsai, K. Blennow, V. Liman, J. H. Kramer, H. Rosen, B. L. Miller, H. Zetterberg, A. L. Boxer, Plasma neurofilament light chain predicts progression in progressive supranuclear palsy. Ann. Clin. Transl. Neurol. 3, 216–225 (2016).
26. M. Gisslén, R. W. Price, U. Andreasson, N. Norgren, S. Nilsson, L. Hagberg, D. Fuchs, S. Spudich, K. Blennow, H. Zetterberg, Plasma concentration of the neurofilament light protein (NFL) is a biomarker of CNS injury in HIV infection: A cross-sectional study. EBioMedicine 3, 135–140 (2016).
27. A. Thathiah, B. De Strooper, The role of G protein-coupled receptors in the pathology of Alzheimer’s disease. Nat. Rev. Neurosci. 12, 73–87 (2011).
28. S. Li, P. Mattar, D. Zinyk, K. Singh, C. P. Chaturvedi, C. Kovach, R. Dixit, D. M. Kurrasch, Y. C. Ma, J. A. Chan, V. Wallace, F. J. Dilworth, M. Brand, C. Schuurmans, GSK3 temporally regulates neurogenin 2 proneural activity in the neocortex. J. Neurosci. 32, 7791–7805 (2012).
29. J. Kele, N. Simplicio, A. L. Ferri, H. Mira, F. Guillemot, E. Arenas, S.-L. Ang, Neurogenin 2 is required for the development of ventral midbrain dopaminergic neurons. Development 133, 495–505 (2006).
30. M. Bolos, Y. Hu, K. M. Young, L. Foa, D. H. Small, Neurogenin 2 mediates amyloid- precursor protein-stimulated neurogenesis. J. Biol. Chem. 289, 31253–31261 (2014).
31. G. G. Kovacs, I. Milenkovic, A. Wöhrer, R. Höftberger, E. Gelpi, C. Haberler, S. Hönigschnabl, A. Reiner-Concin, H. Heinzl, S. Jungwirth, W. Krampla, P. Fischer, H. Budka, Non-Alzheimer neurodegenerative pathologies and their combinations are more frequent than commonly believed in the elderly brain: A community-based autopsy series. Acta Neuropathol. 126, 365–384 (2013).
32. A. Hye, S. Lynham, M. Thambisetty, M. Causevic, J. Campbell, H. L. Byers, C. Hooper, F. Rijsdijk, S. J. Tabrizi, S. Banner, C. E. Shaw, C. Foy, M. Poppe, N. Archer, G. Hamilton, J. Powell, R. G. Brown, P. Sham, M. Ward, S. Lovestone, Proteome-based plasma biomarkers for Alzheimer’s disease. Brain 129, 3042–3050 (2006).
33. S. Palmqvist, N. Mattsson, O. Hansson, Alzheimer’s Disease Neuroimaging Initiative, Cerebrospinal fluid analysis detects cerebral amyloid- accumulation earlier than positron emission tomography. Brain 139, 1226–1236 (2016).
34. S. Palmqvist, M. Schöll, O. Strandberg, N. Mattsson, E. Stomrud, H. Zetterberg, K. Blennow, S. Landau, W. Jagust, O. Hansson, Earliest accumulation of -amyloid occurs within the default-mode network and concurrently affects brain connectivity. Nat. Commun. 8, 1214 (2017).
35. K. A. Ellis, A. I. Bush, D. Darby, D. de Fazio, J. Foster, P. Hudson, N. T. Lautenschlager, N. Lenzo, R. N. Martins, P. Maruff, C. Masters, A. Milner, K. Pike, C. Rowe, G. Savage, C. Szoeke, K. Taddei, V. Villemagne, M. Woodward, D. Ames, AIBL Research Group, The Australian Imaging, Biomarkers and Lifestyle (AIBL) study of aging: Methodology and baseline characteristics of 1112 individuals recruited for a longitudinal study of Alzheimer’s disease. Int. Psychogeriatr. 21, 672–687 (2009).
36. C. C. Rowe, K. A. Ellis, M. Rimajova, P. Bourgeat, K. E. Pike, G. Jones, J. Fripp, H. Tochon-Danguy, L. Morandeau, G. O’Keefe, R. Price, P. Raniga, P. Robins, O. Acosta, N. Lenzo, C. Szoeke, O. Salvado, R. Head, R. Martins, C. L. Masters, D. Ames, V. L. Villemagne, Amyloid imaging results from the Australian Imaging, Biomarkers and Lifestyle (AIBL) study of aging. Neurobiol. Aging 31, 1275–1283 (2010).
37. G. Chetelat, V. L. Villemagne, N. Villain, G. Jones, K. A. Ellis, D. Ames, R. N. Martins, C. L. Masters, C. C. Rowe, AIBL Research Group, Accelerated cortical atrophy in cognitively normal elderly with high -amyloid deposition. Neurology 78, 477–484 (2012).
38. K. Goozee, P. Chatterjee, I. James, K. Shen, H. R. Sohrabi, P. R. Asih, P. Dave, C. ManYan, K. Taddei, S. J. Ayton, M. L. Garg, J. B. Kwok, A. I. Bush, R. Chung, J. S. Magnussen, R. N. Martins, Elevated plasma ferritin in elderly individuals with high neocortical amyloid- load. Mol. Psychiatry 23, 1807–1812 (2018).
39. K. Goozee, P. Chatterjee, I. James, K. Shen, H. R. Sohrabi, P. R. Asih, P. Dave, B. Ball, C. ManYan, K. Taddei, R. Chung, M. L. Garg, R. N. Martins, Alterations in erythrocyte fatty acid composition in preclinical Alzheimer’s disease. Sci. Rep. 7, 676 (2017).
40. J. Friedman, T. Hastie, R. Tibshirani, Regularization paths for generalized linear models via coordinate descent. J. Stat. Softw. 33, 1–22 (2010).
on June 3, 2019http://advances.sciencem
ag.org/D
ownloaded from

Ashton et al., Sci. Adv. 2019; 5 : eaau7220 6 February 2019
S C I E N C E A D V A N C E S | R E S E A R C H A R T I C L E
12 of 12
Acknowledgments Funding: We express our appreciation to all participants in the AIBL and KARVIAH studies. This paper presents independent research funded by Butterfield Trust via Rosetree Trust UK. N.J.A. was supported by Rosetree Trust for this study. P.C. is supported by KaRa Institute of Neurological Diseases (KaRa MINDS) and Macquarie University. K.G. is funded by Anglicare (Sydney, Australia). H.Z. is a Wallenberg Academy Fellow and acknowledges support from the UK Dementia Research Institute. A.I.B. is funded by the National Health and Medical Research Council (GNT1103703, GNT1132604, and GNT1103703) and the Cooperative Research Centre for Mental Health. S. Lovestone is funded by the National Institute for Health Research (NIHR) Oxford Biomedical Research Centre and named in inventor on biomarker intellectual property protected by Proteome Science and King’s College London (unrelated to this study). R.M. is funded jointly by Edith Cowan University and Macquarie University. A.H. is funded by the Research Centre for Mental Health and Biomedical Research Unit for dementia. All other authors acknowledge that they received no funding in support of this research. This study represents independent research part funded by the NIHR Biomedical Research Centre at South London and Maudsley NHS Foundation Trust and King’s College London. The views expressed are those of the authors and not necessarily those of the NHS, the NIHR, or the Department of Health and Social Care. Competing interests: S. Lovestone is currently an employee of Johnson and Johnson. All other authors declare that they have no competing
interests. Author contributions: N.J.A., S. Lovestone, R.M., and A.H. contributed to the study concept and design. N.J.A. and S. Lynham were responsible for the data acquisition. N.J.A., A.J.N.-H., I.S.B., and A.H. carried out the data analysis and drafted the manuscript. All authors contributed to the sample selection and data interpretation and revised the manuscript. Data and materials availability: All data needed to evaluate the conclusions in the paper are present in the paper and/or the Supplementary Materials. Raw MS/MS data and additional data related to this paper may be requested from the authors.
Submitted 9 July 2018Accepted 19 December 2018Published 6 February 201910.1126/sciadv.aau7220
Citation: N. J. Ashton, A. J. Nevado-Holgado, I. S. Barber, S. Lynham, V. Gupta, P. Chatterjee, K. Goozee, E. Hone, S. Pedrini, K. Blennow, M. Schöll, H. Zetterberg, K. A. Ellis, A. I. Bush, C. C. Rowe, V. L. Villemagne, D. Ames, C. L. Masters, D. Aarsland, J. Powell, S. Lovestone, R. Martins, A. Hye, A plasma protein classifier for predicting amyloid burden for preclinical Alzheimer’s disease. Sci. Adv. 5, eaau7220 (2019).
on June 3, 2019http://advances.sciencem
ag.org/D
ownloaded from

A plasma protein classifier for predicting amyloid burden for preclinical Alzheimer's disease
Ralph Martins and Abdul HyeChristopher C. Rowe, Victor L. Villemagne, David Ames, Colin L. Masters, Dag Aarsland, John Powell, Simon Lovestone,Goozee, Eugene Hone, Steve Pedrini, Kaj Blennow, Michael Schöll, Henrik Zetterberg, Kathryn A. Ellis, Ashley I. Bush, Nicholas J. Ashton, Alejo J. Nevado-Holgado, Imelda S. Barber, Steven Lynham, Veer Gupta, Pratishtha Chatterjee, Kathryn
DOI: 10.1126/sciadv.aau7220 (2), eaau7220.5Sci Adv
ARTICLE TOOLS http://advances.sciencemag.org/content/5/2/eaau7220
MATERIALSSUPPLEMENTARY http://advances.sciencemag.org/content/suppl/2019/02/04/5.2.eaau7220.DC1
REFERENCES
http://advances.sciencemag.org/content/5/2/eaau7220#BIBLThis article cites 40 articles, 6 of which you can access for free
PERMISSIONS http://www.sciencemag.org/help/reprints-and-permissions
Terms of ServiceUse of this article is subject to the
registered trademark of AAAS.is aScience Advances Association for the Advancement of Science. No claim to original U.S. Government Works. The title
York Avenue NW, Washington, DC 20005. 2017 © The Authors, some rights reserved; exclusive licensee American (ISSN 2375-2548) is published by the American Association for the Advancement of Science, 1200 NewScience Advances
on June 3, 2019http://advances.sciencem
ag.org/D
ownloaded from


![Human plasma protein N-glycosylation - Springer · 2017. 8. 26. · As the previous review on plasma protein N-glycosylation originatesfrom2008[40],weherestrivetoconveythecurrent](https://static.fdocuments.in/doc/165x107/6148e5b178bdf203dd34e7ec/human-plasma-protein-n-glycosylation-springer-2017-8-26-as-the-previous-review.jpg)