
Neuronal Morphology: Shape Characteristics and Modelsschierwa/Schierwa2008_Neuronal... · At the...
6
310 0090-2977/08/4004-0310 © 2008 Springer Science+Business Media, Inc. Neurophysiology, Vol. 40, No. 4, 2008 Proceedings of the International School “Problems of Experimental, Clinical, and Theoretical Neurosciences” (Dnepropetrovsk, Ukraine, May 2-4, 2008) Neuronal Morphology: Shape Characteristics and Models A. Schierwagen 1 Neirofiziologiya/Neurophysiology, Vol. 40, No. 4, pp. 366-372, July-August, 2008. Received May 28, 2008. This paper is focused on quantification (morphometry) and modeling of neuronal morphological complexity. First, computer-aided methods for reconstruction, processing, and analysis of raw morphological data are reviewed. Then, topological and metrical measures are touched upon. Fractal measures (together with the extension of multiscale fractal dimension) are presented more explicitly. Models of neuronal arborizations are differentiated between reconstruction models and growth models (stochastic or mechanistic). The growth model approach is discussed in more detail. The methods presented are applied to several types of neurons and shown to have considerable discriminative power. Recent developments stress the importance of these methods for optimizing virtual neuronal trees in view of functional characteristics of the neurons. Keywords: neuronal morphology, neuromorphometry, fractal analyses, growth models. 1 Institute for Computer Science, University of Leipzig, 04109 Leipzig, Germany. Correspondence should be addressed to A. Schierwagen (e-mail: [email protected]). INTRODUCTION To understand the brain, its organization must be studied at different levels from both ontogenetic and phylogenetic aspects. At the cellular level, neurons in different brain regions of one species and in the same brain region of different species must be compared with respect to their structural and functional properties. The nervous system shows a great variety in neuronal shapes and cell types, as well as a large variability within these neuron classes (Fig. 1 from Ramon y Cajal [1] and Schierwagen and Grantyn [2]). The neuronal structure is characterized by elongated processes (neurites); among them, two kinds can be differentiated, axons and often-branching dendrites. From a functional point of view, axons and dendrites are conduits for electrical and chemical signals. The shapes of neurites determine not only the routes for signal transmission within the nervous system but also the way in which electrical signals are processed and transmitted. Neurons attain their shapes as a result of developmental processes in which intracellular mechanisms and interactions with local environments are operating in concert. Activity- dependent mechanisms make the morphological Fig. 1. Variety of the neuronal forms. Neuron shapes range from a pyramidal neuron of the cerebral cortex (A) to a Purkinje cell of the cerebellum (B), and a multipolar neuron of the superior colliculus (C). A and B) From Ramon y Cajal [1], C) from Schierwagen and Grantyn [2]. A B C
Transcript of Neuronal Morphology: Shape Characteristics and Modelsschierwa/Schierwa2008_Neuronal... · At the...
3100090-2977/08/4004-0310 © 2008 Springer Science+Business Media, Inc.
Neurophysiology, Vol. 40, No. 4, 2008Proceedings of the International School
“Problems of Experimental, Clinical, and Theoretical Neurosciences”(Dnepropetrovsk, Ukraine, May 2-4, 2008)
Neuronal Morphology: Shape Characteristics and ModelsA. Schierwagen1
Neirofiziologiya/Neurophysiology, Vol. 40, No. 4, pp. 366-372, July-August, 2008.
Received May 28, 2008.
This paper is focused on quantification (morphometry) and modeling of neuronal morphological complexity. First, computer-aided methods for reconstruction, processing, and analysis of raw morphological data are reviewed. Then, topological and metrical measures are touched upon. Fractal measures (together with the extension of multiscale fractal dimension) are presented more explicitly. Models of neuronal arborizations are differentiated between reconstruction models and growth models (stochastic or mechanistic). The growth model approach is discussed in more detail. The methods presented are applied to several types of neurons and shown to have considerable discriminative power. Recent developments stress the importance of these methods for optimizing virtual neuronal trees in view of functional characteristics of the neurons.
Keywords: neuronal morphology, neuromorphometry, fractal analyses, growth models.
1 Institute for Computer Science, University of Leipzig, 04109 Leipzig, Germany.
Correspondence should be addressed to A. Schierwagen (e-mail: [email protected]).
INTRODUCTION
To understand the brain, its organization must be studied at different levels from both ontogenetic and phylogenetic aspects. At the cellular level, neurons in different brain regions of one species and in the same brain region of different species must be compared with respect to their structural and functional properties.
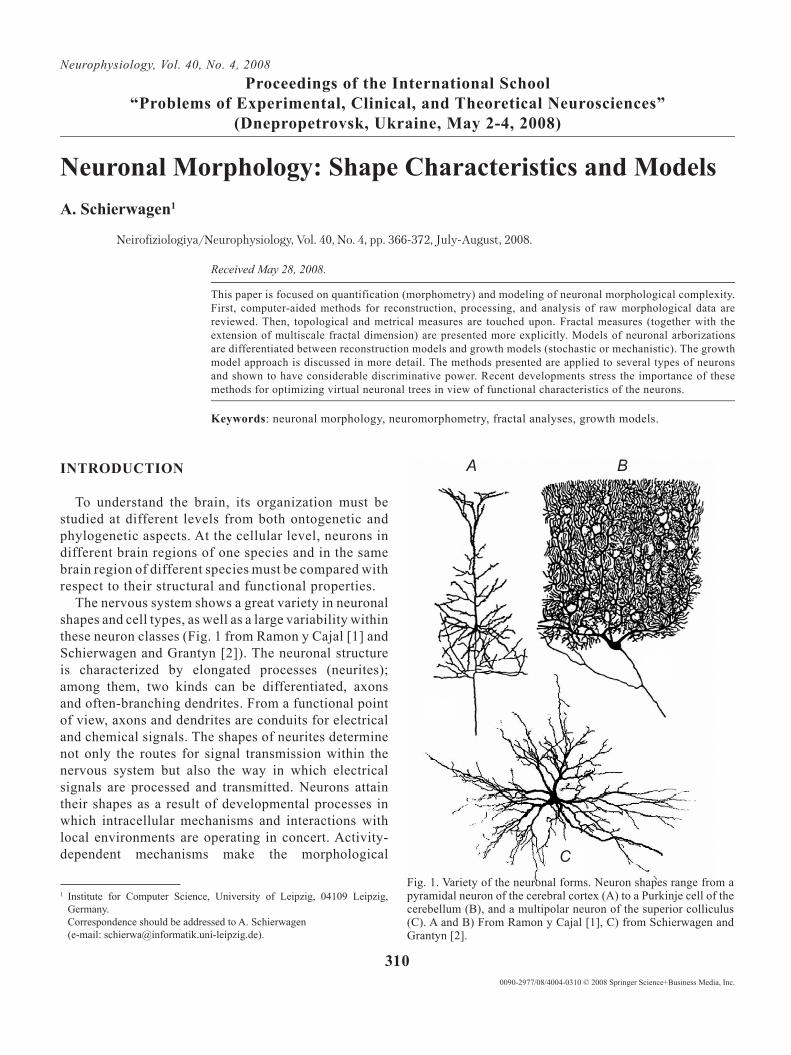
The nervous system shows a great variety in neuronal shapes and cell types, as well as a large variability within these neuron classes (Fig. 1 from Ramon y Cajal [1] and Schierwagen and Grantyn [2]). The neuronal structure is characterized by elongated processes (neurites); among them, two kinds can be differentiated, axons and often-branching dendrites. From a functional point of view, axons and dendrites are conduits for electrical and chemical signals. The shapes of neurites determine not only the routes for signal transmission within the nervous system but also the way in which electrical signals are processed and transmitted. Neurons attain their shapes as a result of developmental processes in which intracellular mechanisms and interactions with local environments are operating in concert. Activity-dependent mechanisms make the morphological
Fig. 1. Variety of the neuronal forms. Neuron shapes range from a pyramidal neuron of the cerebral cortex (A) to a Purkinje cell of the cerebellum (B), and a multipolar neuron of the superior colliculus (C). A and B) From Ramon y Cajal [1], C) from Schierwagen and Grantyn [2].
A B
C
311
development also a function of the neuron’s connectivity with other neurons and the electrical activity in the neuronal network.
The intricate interplay between the morphological parameters and the complexities of excitable neuronal membranes is still poorly understood. Formal and simulation approaches have been established to provide support for dealing with it (e.g., [3-5]). In the following, I give a review (concededly biased by my own contributions to the field) on morphological quantification(neuromorphometry) and mathematical modeling approaches to the neuron structure and function.
PROCESSING AND QUANTIFYING NEURONAL MORPHOLOGICAL DATA
A basic requisite for realistic modeling is the acquisition, processing, reconstruction, analysis, and visualization of neuronal morphological data. The quantitative characterization of the neuronal shape requires morphological reconstruction. For this, neurons are stained with a contrast substance (e.g., by means of Golgi techniques, HRP, or immunocytochemistry).
Recent methods are characterized by sophisticated and adaptive segmentation procedures and automation
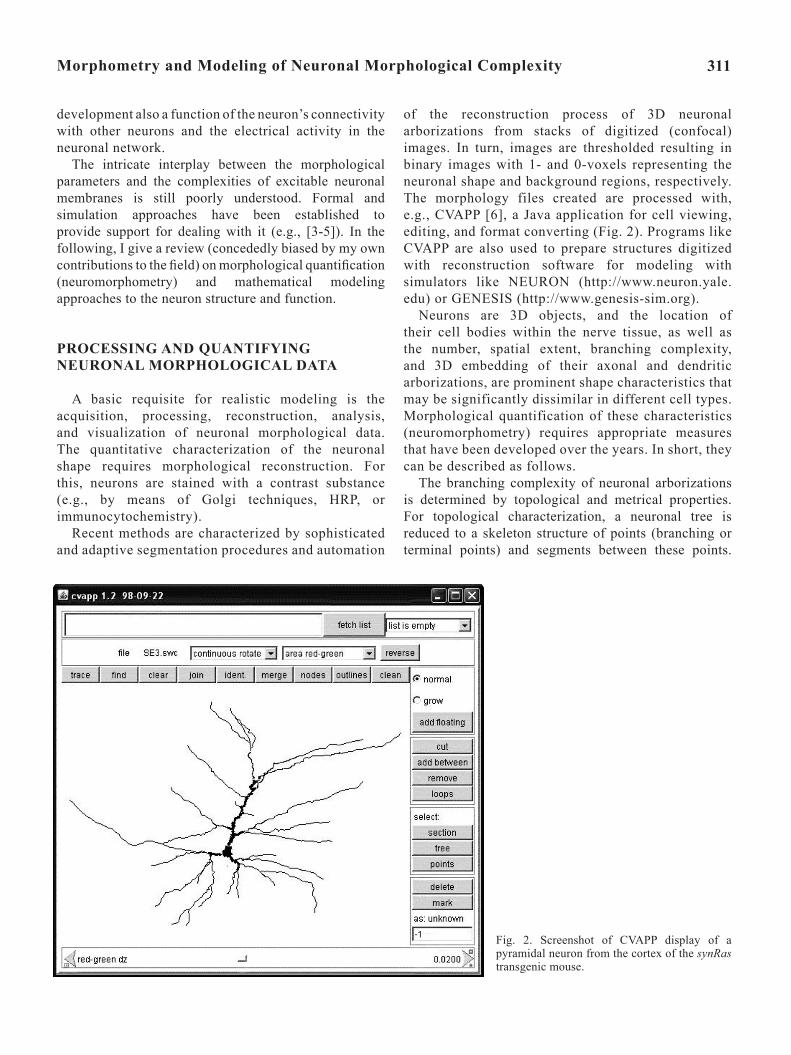
of the reconstruction process of 3D neuronal arborizations from stacks of digitized (confocal) images. In turn, images are thresholded resulting in binary images with 1- and 0-voxels representing the neuronal shape and background regions, respectively. The morphology files created are processed with, e.g., CVAPP [6], a Java application for cell viewing, editing, and format converting (Fig. 2). Programs like CVAPP are also used to prepare structures digitized with reconstruction software for modeling with simulators like NEURON (http://www.neuron.yale.edu) or GENESIS (http://www.genesis-sim.org).
Neurons are 3D objects, and the location of their cell bodies within the nerve tissue, as well as the number, spatial extent, branching complexity, and 3D embedding of their axonal and dendritic arborizations, are prominent shape characteristics that may be significantly dissimilar in different cell types. Morphological quantification of these characteristics (neuromorphometry) requires appropriate measures that have been developed over the years. In short, they can be described as follows.
The branching complexity of neuronal arborizations is determined by topological and metrical properties. For topological characterization, a neuronal tree is reduced to a skeleton structure of points (branching or terminal points) and segments between these points.
Fig. 2. Screenshot of CVAPP display of a pyramidal neuron from the cortex of the synRas transgenic mouse.
Morphometry and Modeling of Neuronal Morphological Complexity

312
Such a skeleton forms a specific rooted tree from a finiteset of possible different topological tree types. The tree-asymmetry index provides a discriminative measure based on asymmetries in pairs of subtrees at bifurcations [7]. A segment can be labelled by its centrifugal order (number of segments on its path to the root). Metrical aspects include the length and diameter of the segments, path lengths (total length of the path from the dendritic root to a branch point or terminal tip), radial distances of terminal tips from the center of the cell, and branching angles. A different class of measures is concerned with the spatial embedding in 3D space and focuses on, e.g., the spatial extension, spatial density, spatial orientation, and space filling of the structure. Initially, such measureswere developed for projected 2D images. For example, Sholl [8] put an overlay of concentric circles on the projected image and counted the number of branch points within each circle (Sholl analysis).
FRACTAL ANALYSES
Other selective measures for neuronal arborizations have been based on the observation that neuronal dendrites are tenous structures whose average density decreases with the distance from the soma. This is a property found generally in self-similar objects. A self-similar, or fractal, structure is an object whose statistical properties are unchanged under a change in spatial length scale. In other words, two pieces of an ideal fractal of different sizes are equivalent over all length scales. One quantitative measure of self-similarity is the fractal dimension D introduced by Mandelbrot in 1983 [9], which is smaller than the Euclidean dimension d of the embedding space but greater than their topological dimension dt.
Fractal Dimension. There are several methods for describing dendritic trees by fractal measurements, including the mass-radius, box-counting, and dilation methods [10]. In 1986, the cumulative intersection method for fractal analysis of neuronal dendritic trees was introduced [11, 12]. This approach was based on the method described by Sholl [8], and, later on, it was implemented in Fractop, a web-based program for automatic fractal analysis [13].
The method uses concentrically organized circles (in 2D) or spherical shells (in 3D) centered at the cell body. If a neuron corresponds to a 3D fractal, the relation between the total length N of all branches inside a shell of radius R should follow a power law
.
Thus, the number of branches n(R) at a given distance R from the soma is approximately given by (cf. [10])
.
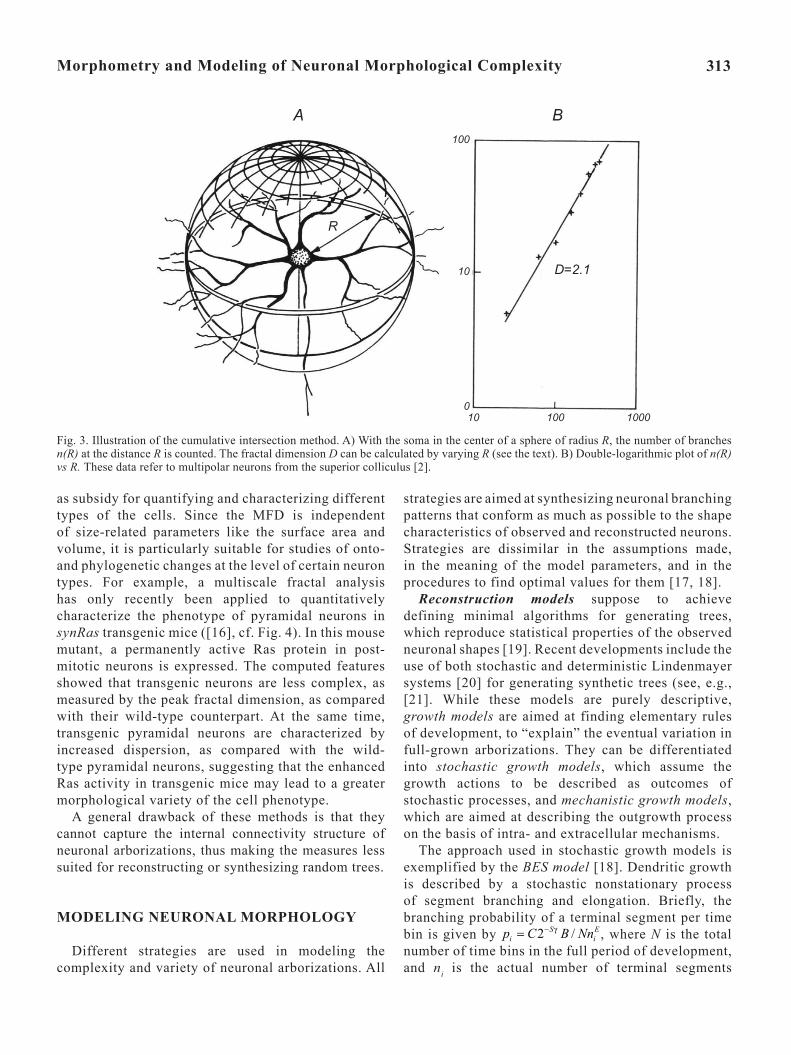
The cumulative number of intersections n(R) between dendritic branches and shells of increasing radii R is counted. The slope of the log–log relationship between the cumulative number of intersections and radius is calculated by linear regression, and the fractal dimension is obtained. For example, the analysis of reconstructed neurons from the cat superior colliculus [2] yielded D ≈ 2.1 for deep-layer multipolar neurons, whereas specialized superficial-layer neurons had D ≈ 2.4-2.7 (Fig. 3). Interestingly, these results are in general agreement with results derived from 3D simulations of the diffusion-limited growth (DLG) model for which D ≈ 2.5 was calculated [14] (see below).
Fractal analysis has found widespread application in the field of neuroscience. Various authors have discussed classification systems of neurons using fractal analysis and proved that fractal dimension could categorize different classes of neurons from the superior colliculus, retina, spinal cord, and cortex (e.g., [12] and review by Costa et al [15]).
Multiscale Extension of Fractal Dimension. The application of fractal analyses to neuroscience data (and, in general, to physical, biological, and other structures in nature) is complicated by the fact that the latter objects are not perfectly self-similar. The scaling ranges of experimentally identified neuronal fractals are limited, often to less than two or three orders of similarity [15]. This problem can be suitably addressed by using the multiscale extension of the fractal dimension recently described [10, 16]; the respective approach involves numerical estimation of the first derivative of a log-log cumulative function. While the traditional fractal dimension corresponds to a single scalar value, the multiscale fractal dimension (MFD) D becomes a function f(s) of the spatial scale parameter s.
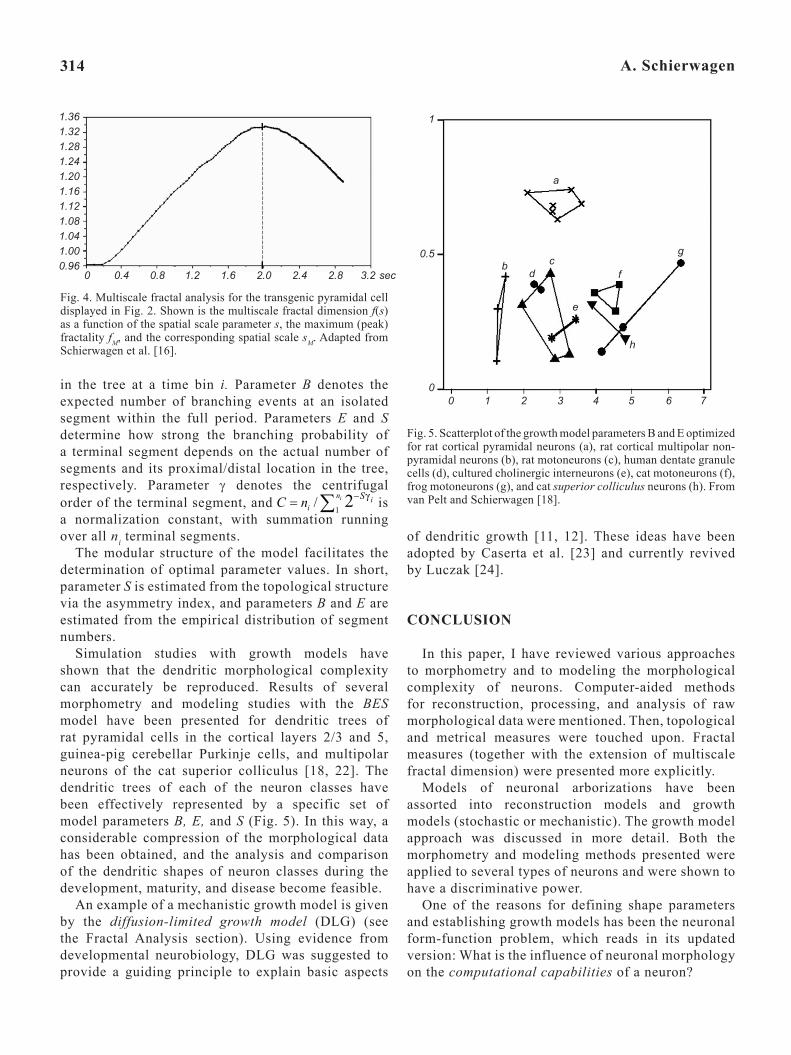
Given that the fractal dimension D of real objects decreases at both micro and macro scales, a peak fractality, fM, is observed near the intermediate scales (in Fig. 4, near s = 2.0). This fact points to the advantages of the MFD over the traditional fractal dimension; it provides additional information about the analyzed shapes. Meaningful parameters are the peak fractality, fM, the corresponding spatial scale, sM , and the average fractality, <f>, to be calculated and used
A. Schierwagen
313
as subsidy for quantifying and characterizing different types of the cells. Since the MFD is independent of size-related parameters like the surface area and volume, it is particularly suitable for studies of onto- and phylogenetic changes at the level of certain neuron types. For example, a multiscale fractal analysis has only recently been applied to quantitatively characterize the phenotype of pyramidal neurons in synRas transgenic mice ([16], cf. Fig. 4). In this mouse mutant, a permanently active Ras protein in post-mitotic neurons is expressed. The computed features showed that transgenic neurons are less complex, as measured by the peak fractal dimension, as compared with their wild-type counterpart. At the same time, transgenic pyramidal neurons are characterized by increased dispersion, as compared with the wild-type pyramidal neurons, suggesting that the enhanced Ras activity in transgenic mice may lead to a greater morphological variety of the cell phenotype.
A general drawback of these methods is that they cannot capture the internal connectivity structure of neuronal arborizations, thus making the measures less suited for reconstructing or synthesizing random trees.
MODELING NEURONAL MORPHOLOGY
Different strategies are used in modeling the complexity and variety of neuronal arborizations. All
strategies are aimed at synthesizing neuronal branching patterns that conform as much as possible to the shape characteristics of observed and reconstructed neurons. Strategies are dissimilar in the assumptions made, in the meaning of the model parameters, and in the procedures to find optimal values for them [17, 18].
Reconstruction models suppose to achieve defining minimal algorithms for generating trees, which reproduce statistical properties of the observed neuronal shapes [19]. Recent developments include the use of both stochastic and deterministic Lindenmayer systems [20] for generating synthetic trees (see, e.g., [21]. While these models are purely descriptive, growth models are aimed at finding elementary rules of development, to “explain” the eventual variation in full-grown arborizations. They can be differentiated into stochastic growth models, which assume the growth actions to be described as outcomes of stochastic processes, and mechanistic growth models, which are aimed at describing the outgrowth process on the basis of intra- and extracellular mechanisms.
The approach used in stochastic growth models is exemplified by the BES model [18]. Dendritic growth is described by a stochastic nonstationary process of segment branching and elongation. Briefly, the branching probability of a terminal segment per time bin is given by , where N is the total number of time bins in the full period of development, and ni is the actual number of terminal segments
Fig. 3. Illustration of the cumulative intersection method. A) With the soma in the center of a sphere of radius R, the number of branches n(R) at the distance R is counted. The fractal dimension D can be calculated by varying R (see the text). B) Double-logarithmic plot of n(R) vs R. These data refer to multipolar neurons from the superior colliculus [2].
R
D=2.1
100
10
010 100 1000
A B
Morphometry and Modeling of Neuronal Morphological Complexity
314
in the tree at a time bin i. Parameter B denotes the expected number of branching events at an isolated segment within the full period. Parameters E and S determine how strong the branching probability of a terminal segment depends on the actual number of segments and its proximal/distal location in the tree, respectively. Parameter γ denotes the centrifugal order of the terminal segment, and is a normalization constant, with summation running over all ni terminal segments.
The modular structure of the model facilitates the determination of optimal parameter values. In short, parameter S is estimated from the topological structure via the asymmetry index, and parameters B and E are estimated from the empirical distribution of segment numbers.
Simulation studies with growth models have shown that the dendritic morphological complexity can accurately be reproduced. Results of several morphometry and modeling studies with the BES model have been presented for dendritic trees of rat pyramidal cells in the cortical layers 2/3 and 5, guinea-pig cerebellar Purkinje cells, and multipolar neurons of the cat superior colliculus [18, 22]. The dendritic trees of each of the neuron classes have been effectively represented by a specific set of model parameters B, E, and S (Fig. 5). In this way, a considerable compression of the morphological data has been obtained, and the analysis and comparison of the dendritic shapes of neuron classes during the development, maturity, and disease become feasible.
An example of a mechanistic growth model is given by the diffusion-limited growth model (DLG) (see the Fractal Analysis section). Using evidence from developmental neurobiology, DLG was suggested to provide a guiding principle to explain basic aspects
of dendritic growth [11, 12]. These ideas have been adopted by Caserta et al. [23] and currently revived by Luczak [24].
CONCLUSION
In this paper, I have reviewed various approaches to morphometry and to modeling the morphological complexity of neurons. Computer-aided methods for reconstruction, processing, and analysis of raw morphological data were mentioned. Then, topological and metrical measures were touched upon. Fractal measures (together with the extension of multiscale fractal dimension) were presented more explicitly.
Models of neuronal arborizations have been assorted into reconstruction models and growth models (stochastic or mechanistic). The growth model approach was discussed in more detail. Both the morphometry and modeling methods presented were applied to several types of neurons and were shown to have a discriminative power.
One of the reasons for defining shape parameters and establishing growth models has been the neuronal form-function problem, which reads in its updated version: What is the influence of neuronal morphology on the computational capabilities of a neuron?
Fig. 4. Multiscale fractal analysis for the transgenic pyramidal cell displayed in Fig. 2. Shown is the multiscale fractal dimension f(s) as a function of the spatial scale parameter s, the maximum (peak) fractality fM, and the corresponding spatial scale sM. Adapted from Schierwagen et al. [16].
1.361.321.281.241.201.161.121.081.041.000.96
0 0.4 0.8 1.2 1.6 2.0 2.4 2.8 3.2 sec
Fig. 5. Scatterplot of the growth model parameters B and E optimized for rat cortical pyramidal neurons (a), rat cortical multipolar non-pyramidal neurons (b), rat motoneurons (c), human dentate granule cells (d), cultured cholinergic interneurons (e), cat motoneurons (f), frog motoneurons (g), and cat superior colliculus neurons (h). From van Pelt and Schierwagen [18].
1
0.5
00 1 2 3 4 5 6 7
a
bd
c
e
f
h
g
A. Schierwagen

315
Very recently, studies were published, which seem promising for the investigation of this problem. Virtual neurons were generated and validated via Genetic Algorithms with respect to a prespecified fitness criterion, which is a specific computational function of the neurons. An example could be the coincidence detection, and the required criterion would be the neuron tuning to a specific activation pattern.
For example, an optimization procedure was used by Stiefel and Sejnowski [25] to find neuronal morphological structures (with passive electrical membrane properties only) for two computational tasks: for linearly summing excitatory synaptic potentials (EPSPs), and to distinguish the temporal order of EPSPs. The solutions resembled the morphology of real neurons.
This kind of automated mapping between neuronal computations and structure seems undoubtedly attractive. It remains to be seen of how this approach can cope with the full complexities of neuron morphology and membrane conductances. While this is just a technical problem (how to do an effective multi-objective optimization), a more serious question is whether at all a specific computation can be identified for a given class of neurons. Elsewhere, I have discussed the trouble caused by this so-called neurocomputational conception [26]. Nevertheless, the methods have their importance for optimizing virtual neuronal trees in view of biophysical and physiological characteristics.
REFERENCES
1. S. Ramon y Cajal, Histologie du systéme nerveux de l’ homme et des vertébrés, Vol. 1. Maloine, Paris (1909).
2. A. Schierwagen and R. Grantyn, “Quantitative morphological analysis of deep superior colliculus neurons stained intracellularly with HRP in the cat,” J. Hirnforsch., 27, 611-623 (1986).
3. A. Schierwagen, “Growth, structure and dynamics of real neurons: model studies and experimental results,” Biomed. Biochim. Acta, 49, 709-722 (1990).
4. A. van Ooyen (ed.), Modeling Neural Development, MIT Press, Cambridge MA (2003).
5. G. Ascoli (ed.), Computational Neuroanatomy, Principles and Methods, Humana Press, Totawa, NJ (2002).
6. R. C. Cannon, “Structure editing and conversion with cvapp (2000).” Available from: http://www.compneuro.org/CDROM/nmorph/usage.html.
7. J. van Pelt, H. B. M. Uylings, R. W. H. Verwer, et al., “Tree asymmetry – a sensitive and practical measure for binary topological trees,” Bull. Math. Biol., 54, 759-784 (1992).
8. D. A. Sholl, “Dendritic organization in the neurons of the visual cortices of the cat,” J. Anat., 87, 387-406 (1953).
9. B. B. Mandelbrot, The Fractal Geometry of Nature, Freeman and Co., San Francisco (1983).
10. A. Schierwagen, “Dendritic branching patterns,” in: Chaos in Biological System, H. Degn, A. V. Holden, and L. F. Olsen (eds.), Plenum Press, New York, London (1987), pp. 191-193.
11. A. Schierwagen, “Scale-invariant diffusive growth: A dissipative principle relating neuronal form to function,” in: Organizational Constraints on the Dynamics of Evolution, J. Maynard-Smith and G. Vida (eds.), Manchester Univ. Press, Manchester (1990), pp. 167-189.
12. P. Meakin, “A new model for biological pattern formation,” J. Theor. Biol., 118, 101-113 (1986).
13. E. Fernandez and H. F. Jelinek, “Use of fractal theory in neuroscience: methods, advantages and potential problems,” Methods, 24, 309-321 (2001).
14. H. F. Jelinek, G. N. Elston, and B. Zietsch, “Fractal analysis: pitfalls and revelations in neuroscience,” in: Fractals in Biology and Medicine, Vol. IV, G. A. Losa, D. Merlini, T. F. Nonnenmacher, and E. R. Weibel (eds.), Birkhäuser, Basel (2005), pp. 85-94.
15. L. Costa, E. Manoel, F. Faucereau, et al., “A shape analysis framework for neuromorphometry,” Network: Comput. Neural Syst., 13, 283-310 (2002).
16. A. Schierwagen, L. F. Costa, A. Alpar, et al., “Neuro-morphological phenotyping in transgenic mice: a multiscale fractal analysis,” in: Mathematical Modeling of Biological Systems, Vol. II, A. Deutsch, R. Bravo de la Parra, R. de Boer, et al., (eds.), Birkhäuser, Boston, 2007, pp. 191-199.
17. A. Schierwagen and J. van Pelt, “Shaping neuronal dendrites: Interplay of topological and metrical parameters,” J. Biol. Syst., 3, 1193-1200 (1995).
18. J. van Pelt and A. Schierwagen, “Morphological analysis and modeling of neuronal dendrites,” Math. Biosci., 188, Nos. 1/2, 147-155 (2004).
19. R. E. Burke, W. B. Marks, and B. Ulfhake, “A parsimonious description of motoneuron dendritic morphology using computer simulation,” J. Neurosci., 12, 2403-2416 (1992).
20. A. Lindenmayer, “Mathematical models for cellular interaction in development,” J. Theor. Biol., 18, 280-315 (1968).
21. B. Torben-Nielsen, K. Tuyls, and E. Postma, “EvOL-neuron: Neuronal morphology generation,” Neurocomputing, doi:10.1016/j.neucom.2007.02.016 (2007).
22. J. van Pelt, A. Schierwagen, and H. B. M. Uylings, “Modeling dendritic complexity of deep layer superior colliculus neurons,” Neurocomputing, 38/40, Nos. 1/4, 403-408 (2001).
23. F. Caserta, H. E. Stanley, W. Eldred, et al., “Physical mechanisms underlying neurite outgrowth: A quantitative analysis of neuronal shape,” Phys. Rev. Lett., 64, 95-98 (1990).
24. A. Luczak, “Spatial embedding of neuronal trees modeled by diffusive growth,” J. Neurosci. Meth., 157, 132-141 (2006).
25. K. M. Stiefel and T. J. Sejnowski, “Mapping functions onto neuronal morphology,” J. Neurophysiol., 98, 513-526 (2007).
26. A. Schierwagen, “Brain organization and computation,” in: IWINAC 2007, Part I: Bio-Inspired Modeling of Cognitive Tasks, LNCS 4527, J. Mira and J. R. Alvarez (eds.), Springer Verlag, Berlin (2007), pp. 31-40.
Morphometry and Modeling of Neuronal Morphological Complexity


![miR-196a Enhances Neuronal Morphology through …2453 behavioral phenotypes in HD , suggesting that [4, 5] miRNA-mediated pathways should contribute to this ... transgenes using lipofectamineTM](https://static.fdocuments.in/doc/165x107/602650c6f5fad338e5282c24/mir-196a-enhances-neuronal-morphology-through-2453-behavioral-phenotypes-in-hd-.jpg)


