Networks: Local Area Networks1 LANs Studying Local Area Networks Via Media Access Control (MAC)...
44
Networks: Local Area Networks 1 LANs Studying Local Area Networks Via Media Access Control (MAC) SubLayer
-
date post
22-Dec-2015 -
Category
Documents
-
view
218 -
download
0
Transcript of Networks: Local Area Networks1 LANs Studying Local Area Networks Via Media Access Control (MAC)...
Networks: Local Area Networks 1
LANs
Studying
Local Area NetworksVia
Media Access Control (MAC) SubLayer
Networks: Local Area Networks 2
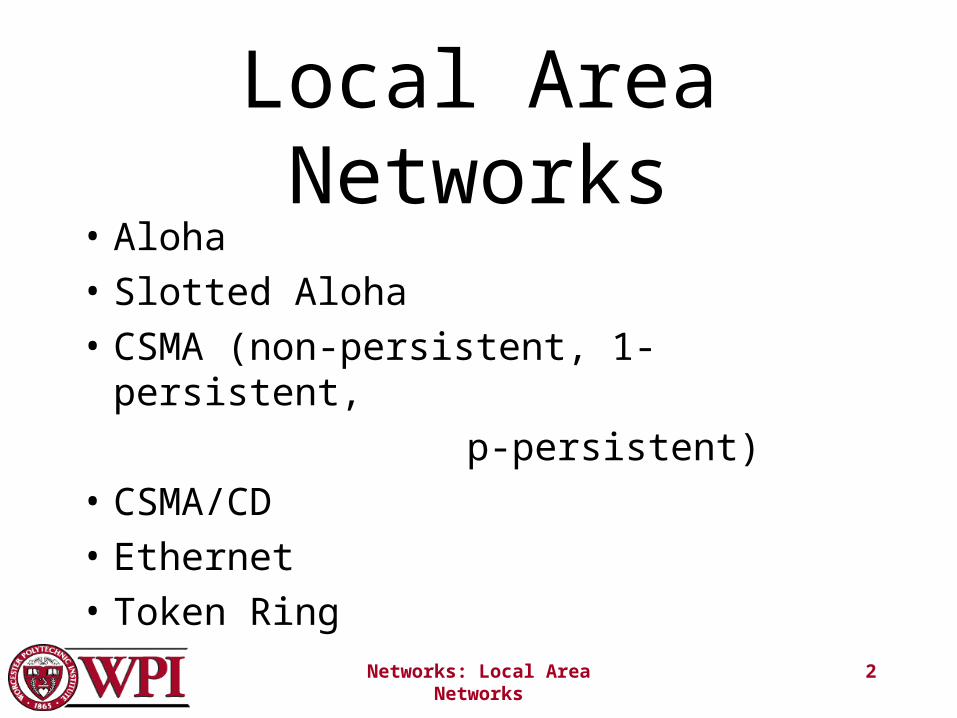
Local Area Networks• Aloha
• Slotted Aloha
• CSMA (non-persistent, 1-persistent,
p-persistent)
• CSMA/CD
• Ethernet
• Token Ring
Networks: Local Area Networks 3
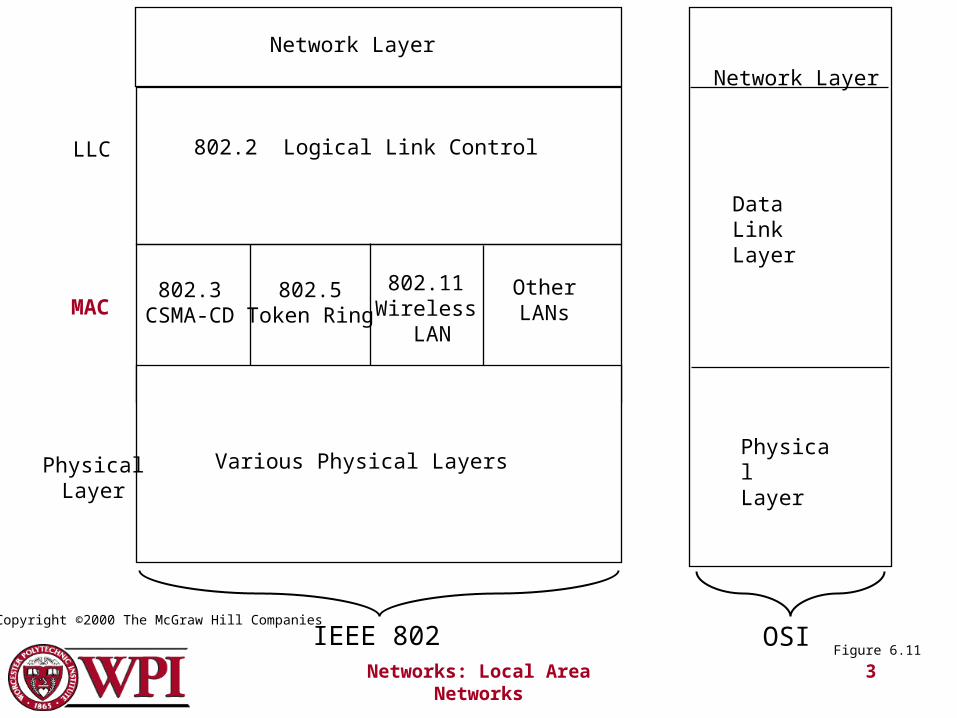
Data LinkLayer
802.3CSMA-CD
802.5Token Ring
802.2 Logical Link Control
PhysicalLayer
MAC
LLC
802.11Wireless
LAN
Network Layer
Network Layer
PhysicalLayer
OSIIEEE 802
Various Physical Layers
OtherLANs
Figure 6.11
Copyright ©2000 The McGraw Hill Companies
Networks: Local Area Networks 4
12
3
4
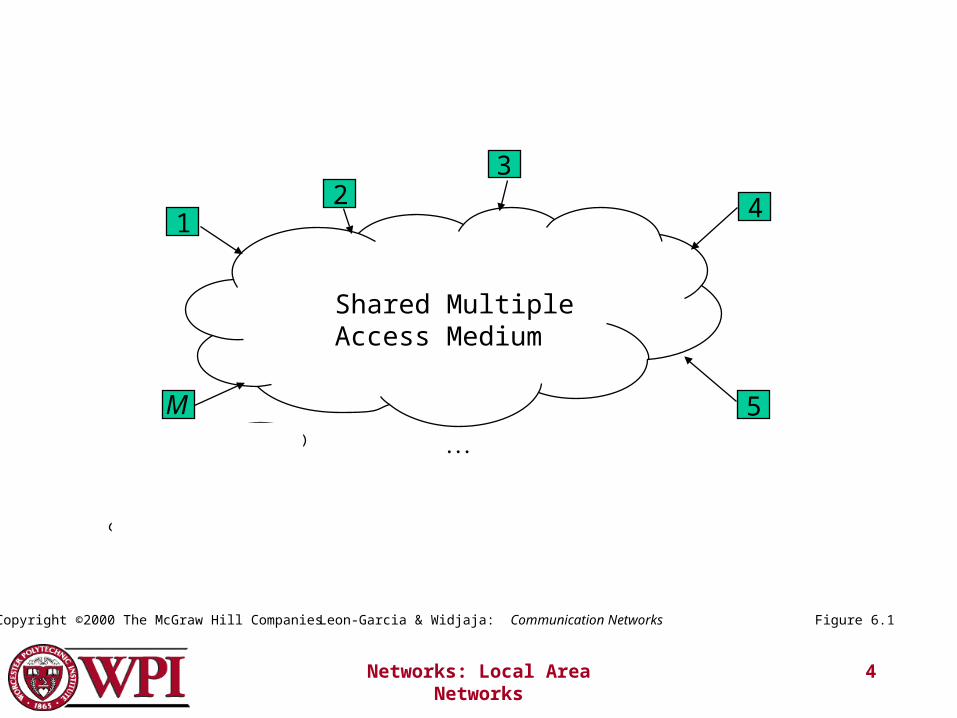
5M
Shared MultipleAccess Medium
Figure 6.1Leon-Garcia & Widjaja: Communication NetworksCopyright ©2000 The McGraw Hill Companies
Networks: Local Area Networks 5
Static Channel Allocation Problem
The history of broadcast networks includes satellite and packet radio networks.
Let us view a satellite as a repeater amplifying and rebroadcasting everything that comes in.
To generalize this problem, consider networks where every frame sent is automatically received by every site (node).
Networks: Local Area Networks 6
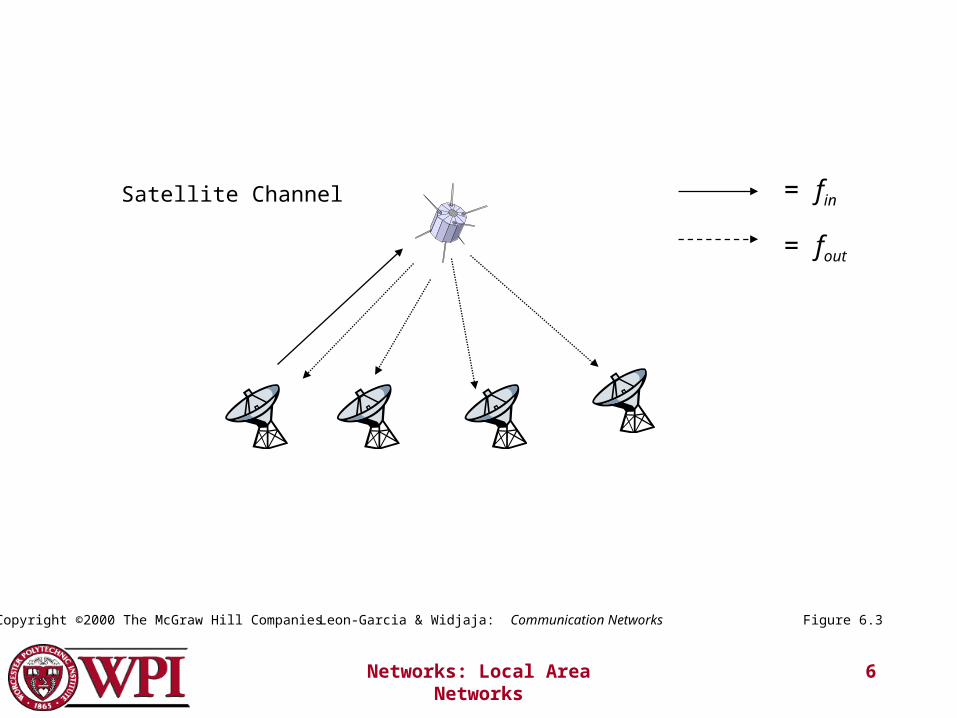
Satellite Channel = fin
= fout
Figure 6.3Leon-Garcia & Widjaja: Communication NetworksCopyright ©2000 The McGraw Hill Companies
Networks: Local Area Networks 7
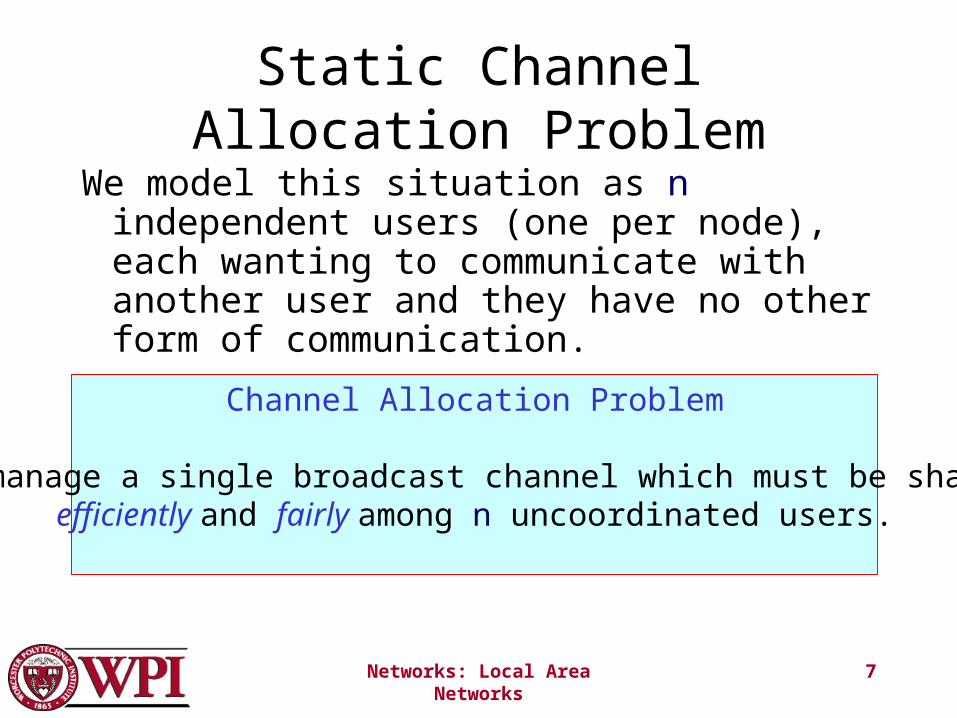
Static Channel Allocation Problem
We model this situation as n independent users (one per node), each wanting to communicate with another user and they have no other form of communication.
Channel Allocation Problem
To manage a single broadcast channel which must be sharedefficiently and fairly among n uncoordinated users.
Networks: Local Area Networks 8
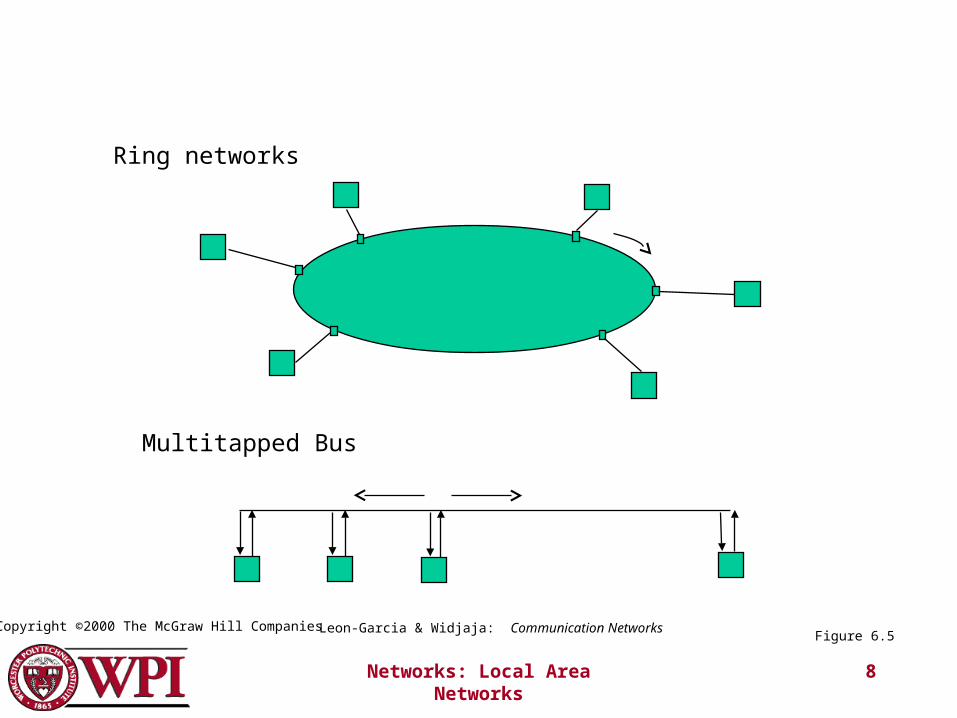
Ring networks
Multitapped Bus
Figure 6.5Leon-Garcia & Widjaja: Communication NetworksCopyright ©2000 The McGraw Hill Companies
Networks: Local Area Networks 9
Possible Model Assumptions for Channel Allocation Problem
0. Listen property :: (applies to satellites)
The sender is able to listen to sent frame one round-trip after sending it.
no need for explicit ACKs
1. Model consists of n independent stations.
2. A single channel is available for communications.
Networks: Local Area Networks 10
Possible Model Assumptions for Channel Allocation Problem
3. Collision Assumption :: If two frames are transmitted simultaneously, they overlap in time and the resulting signal is garbled. This event is a collision.
4a. Continuous Time Assumption :: frame transmissions can begin at any time instant.
4b. Slotted Time Assumption :: time is divided into discrete intervals (slots). Frame transmissions always begin at the start of a time slot.
Networks: Local Area Networks 11
Possible Model Assumptions for Channel Allocation Problem
5a. Carrier Sense Assumption :: Stations can tell if the channel is busy (in use) before
trying to use it. If the channel is busy, no station will attempt to use the channel until it is idle.
5b. No Carrier Sense Assumption :: Stations are unable to sense channel before attempting
to send a frame. They just go ahead and transmit a frame.
Networks: Local Area Networks 12
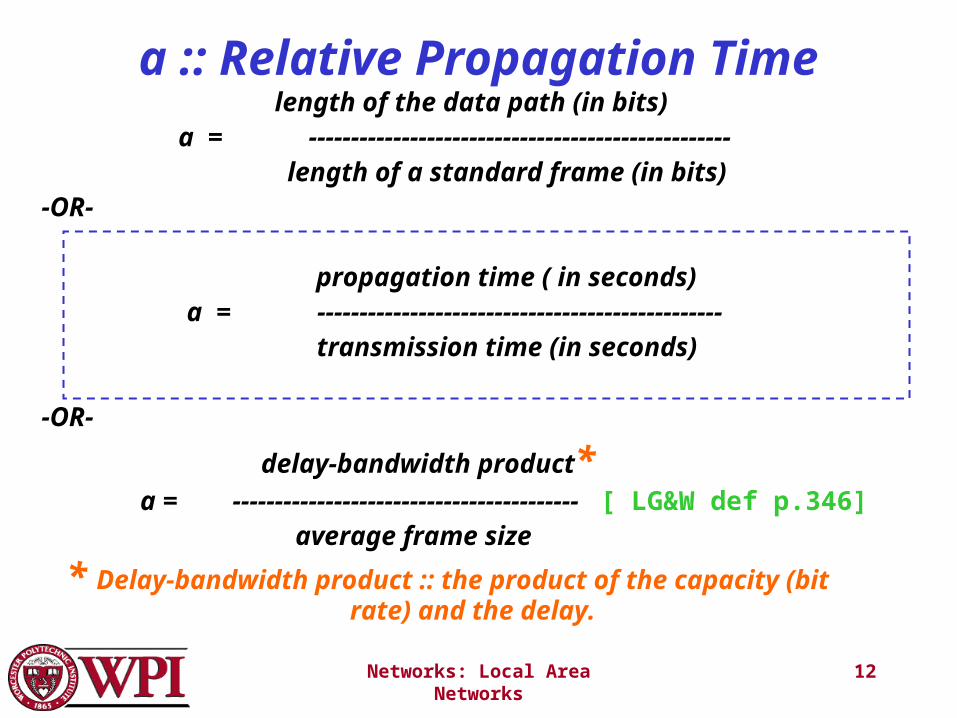
a :: Relative Propagation Time length of the data path (in bits)
a = -------------------------------------------------- length of a standard frame (in bits)
-OR-
propagation time ( in seconds)a = ------------------------------------------------
transmission time (in seconds)
-OR-
delay-bandwidth product*a = ----------------------------------------- [ LG&W def p.346]
average frame size
* Delay-bandwidth product :: the product of the capacity (bit rate) and the delay.
Networks: Local Area Networks 13
Networks: Local Area Networks 14
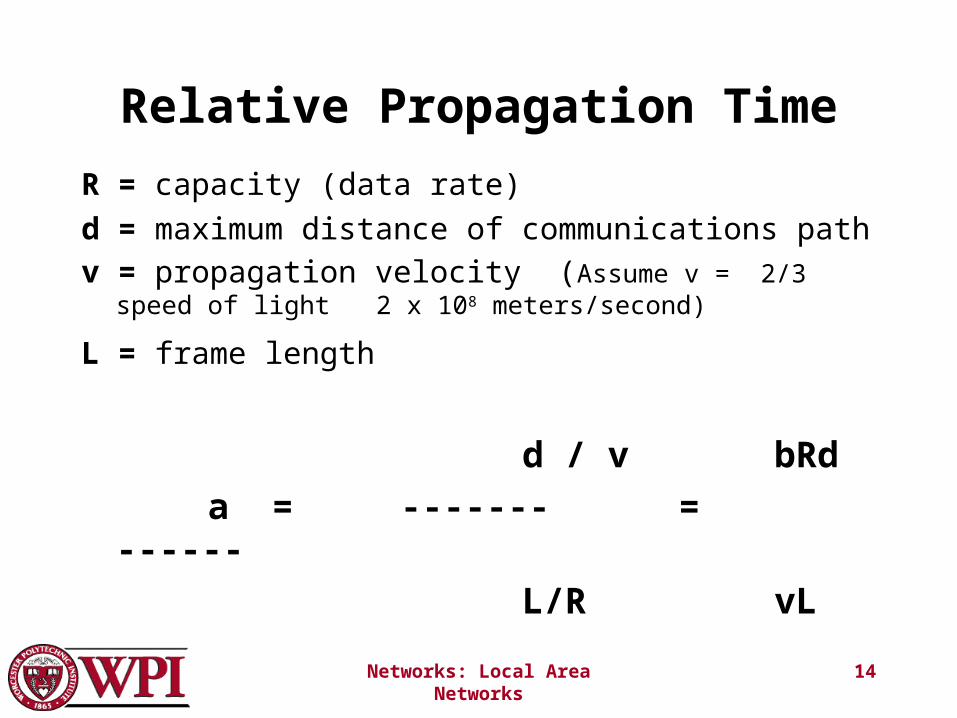
Relative Propagation Time
R = capacity (data rate)
d = maximum distance of communications path
v = propagation velocity (Assume v = 2/3 speed of light 2 x 10⁸ meters/second)
L = frame length
d / v bRd
a = ------- = ------
L/R vL
Networks: Local Area Networks 15
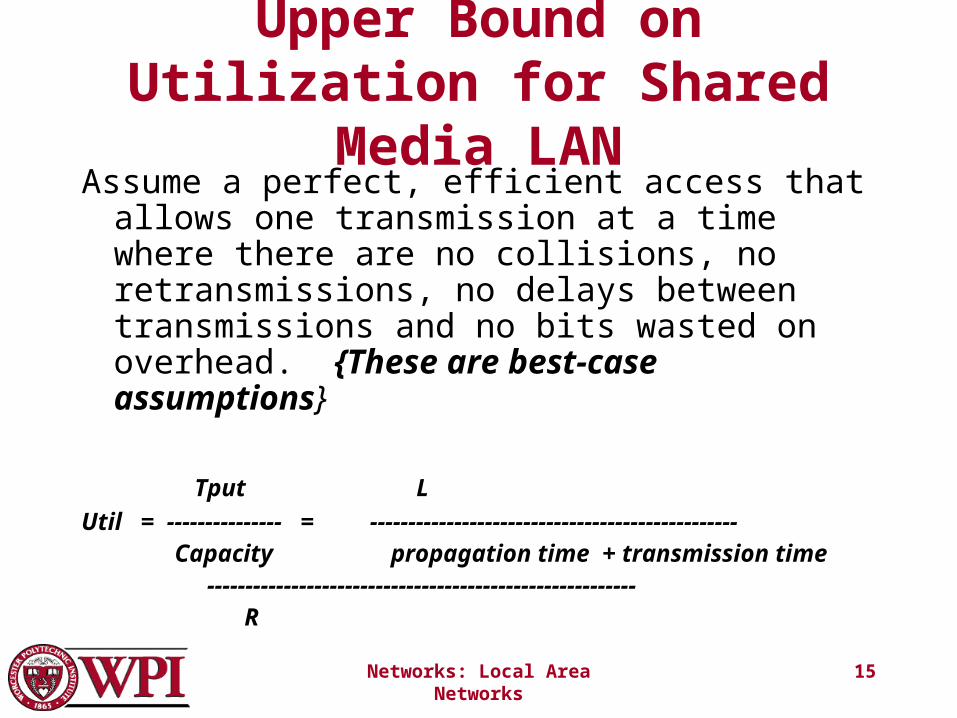
Upper Bound on Utilization for Shared Media LAN
Assume a perfect, efficient access that allows one transmission at a time where there are no collisions, no retransmissions, no delays between transmissions and no bits wasted on overhead. {These are best-case assumptions}
Tput L
Util = --------------- = ------------------------------------------------ Capacity propagation time + transmission time
--------------------------------------------------------
R
Networks: Local Area Networks 16
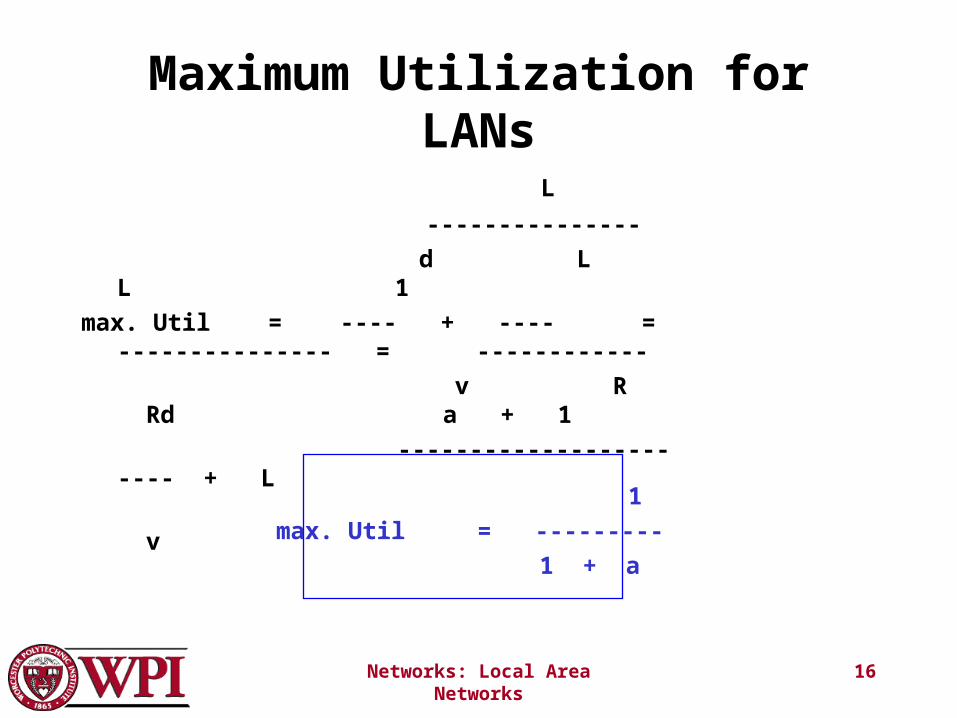
Maximum Utilization for LANs
L
---------------
d L L 1
max. Util = ---- + ---- = --------------- = ------------
v R Rd a + 1
------------------- ---- + L
R v
1
max. Util = ---------
1 + a
Networks: Local Area Networks 17
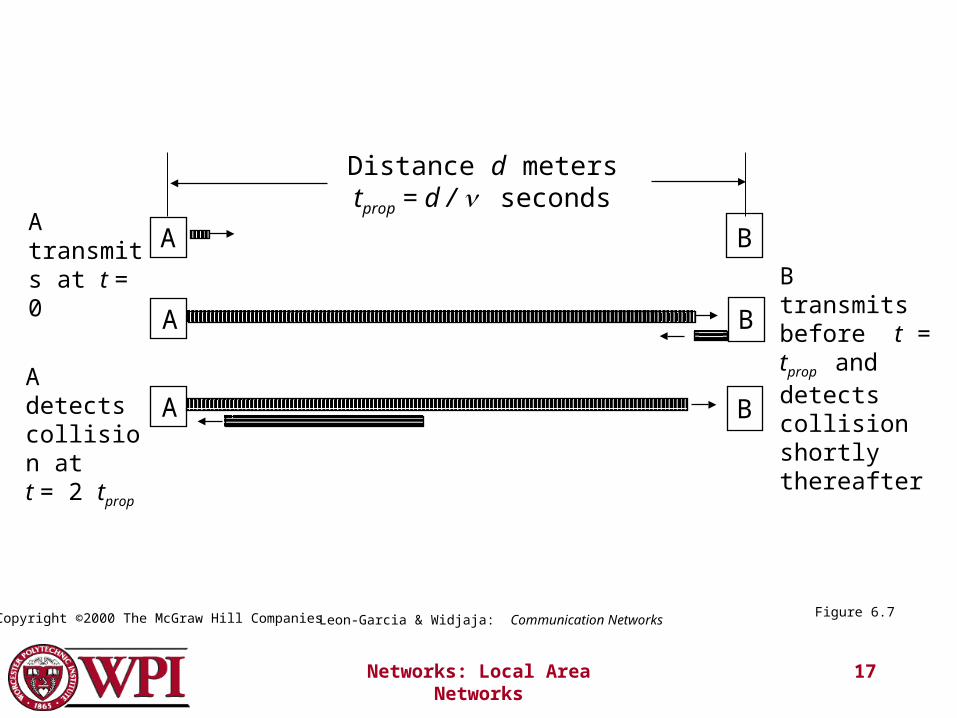
A transmits at t = 0
Distance d meterstprop = d / seconds
A B
B transmits before t = tprop and detectscollision shortlythereafter
A B
A BA detectscollision at t = 2 tprop
Figure 6.7Copyright ©2000 The McGraw Hill Companies Leon-Garcia & Widjaja: Communication Networks
Networks: Local Area Networks 18
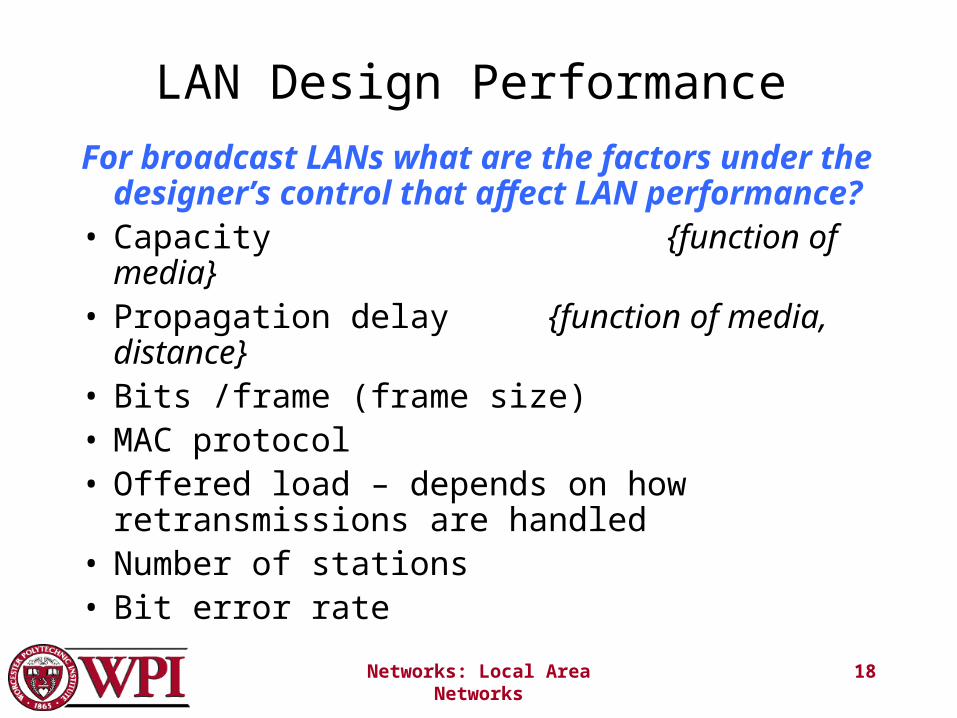
LAN Design Performance
For broadcast LANs what are the factors under the designer’s control that affect LAN performance?
• Capacity {function of media}• Propagation delay {function of media, distance}• Bits /frame (frame size)• MAC protocol• Offered load – depends on how retransmissions
are handled• Number of stations• Bit error rate
Networks: Local Area Networks 19
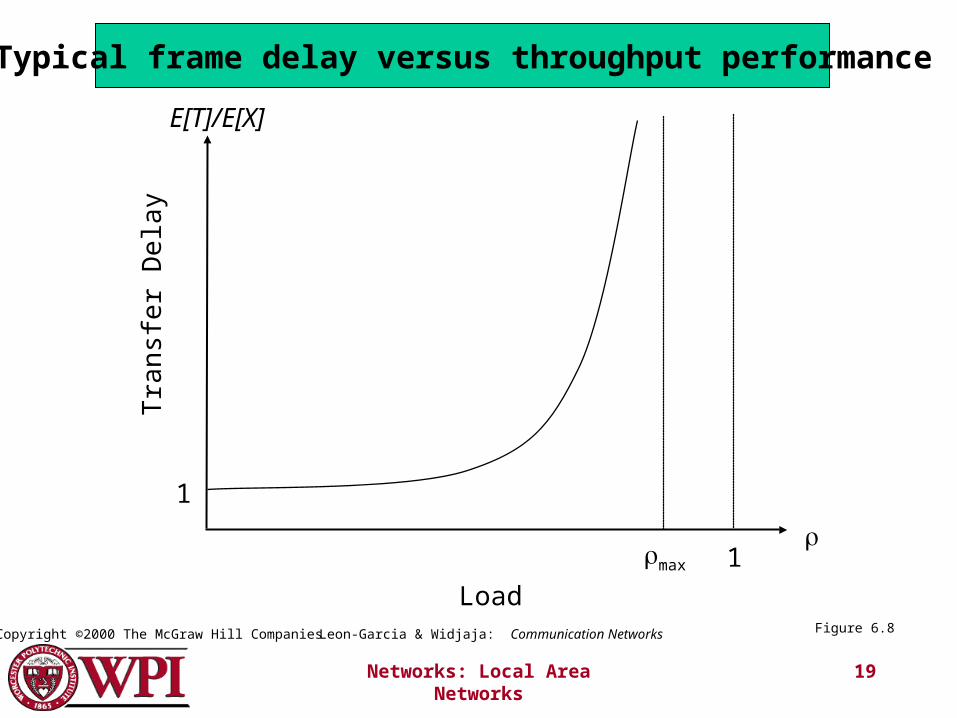
Tra
nsfe
r D
elay
Load
E[T]/E[X]
max 1
1
Figure 6.8Leon-Garcia & Widjaja: Communication NetworksCopyright ©2000 The McGraw Hill Companies
Typical frame delay versus throughput performance
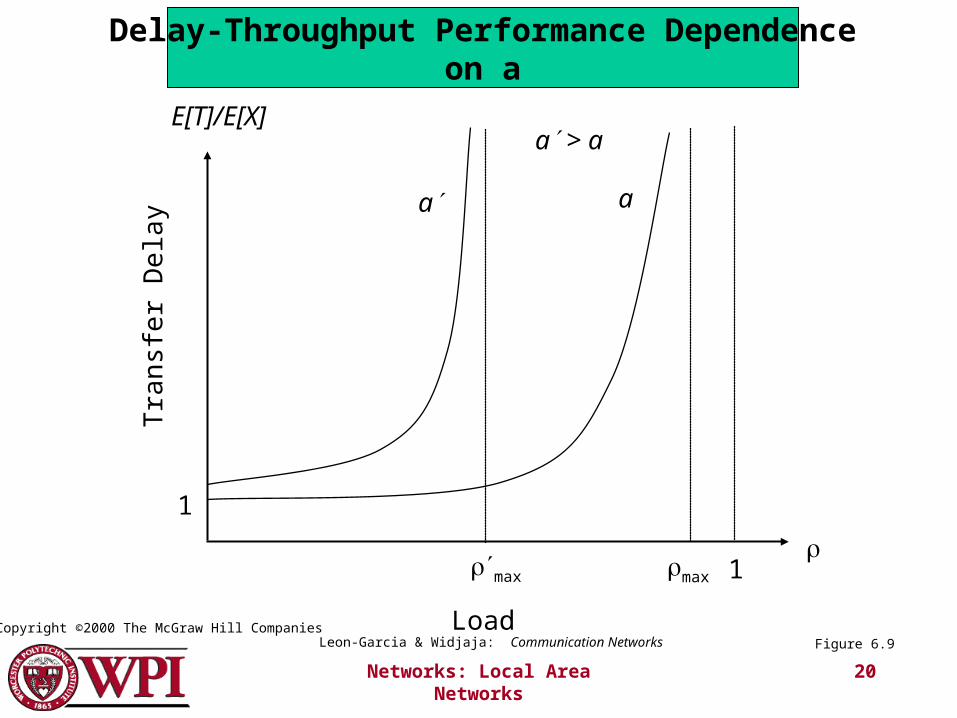
Networks: Local Area Networks 20
Tra
nsfe
r D
elay
Load
E[T]/E[X]
max 1
1
max
aa
a > a
Figure 6.9Leon-Garcia & Widjaja: Communication NetworksCopyright ©2000 The McGraw Hill Companies
Delay-Throughput Performance Dependenceon a
Networks: Local Area Networks 21
Multiple Access Protocols
Networks: Local Area Networks 22
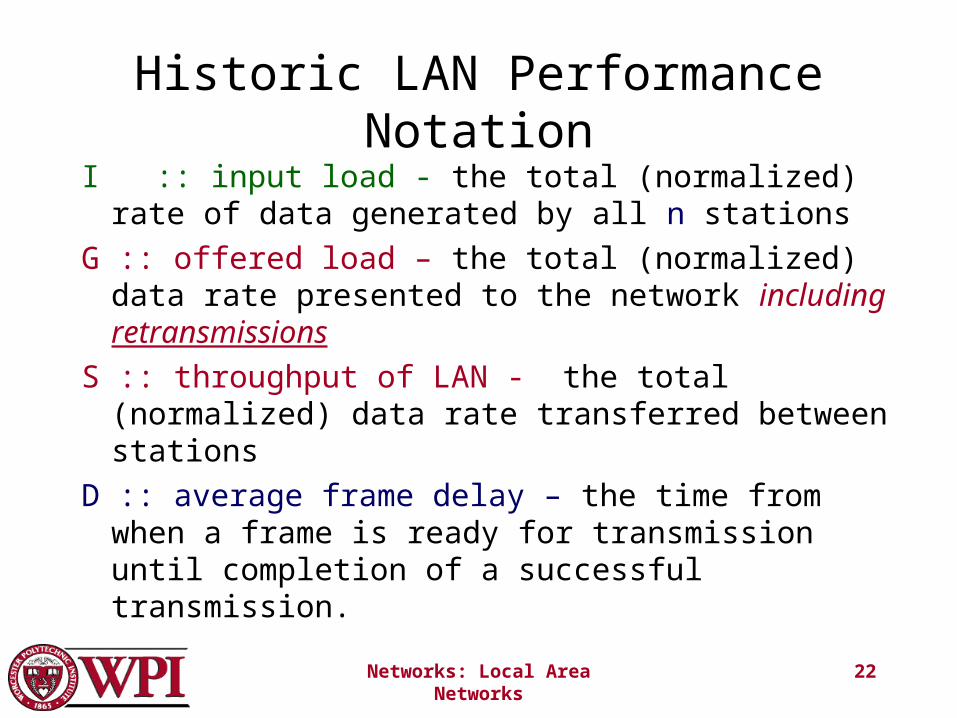
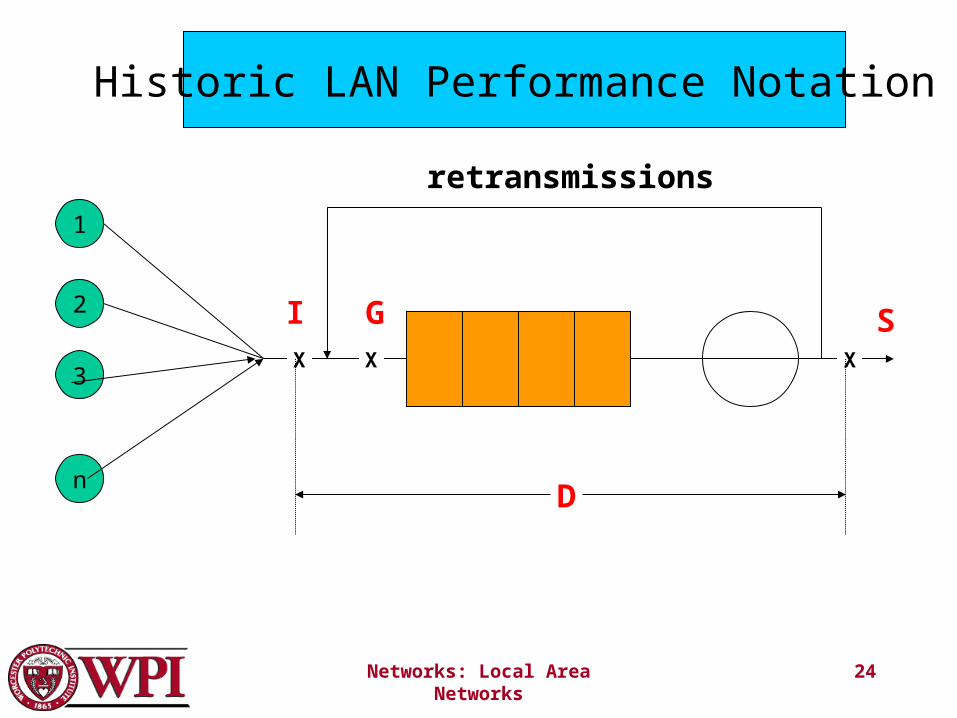
Historic LAN Performance Notation
I :: input load - the total (normalized) rate of data generated by all n stations
G :: offered load – the total (normalized) data rate presented to the network including retransmissions
S :: throughput of LAN - the total (normalized) data rate transferred between stations
D :: average frame delay – the time from when a frame is ready for transmission until completion of a successful transmission.
Networks: Local Area Networks 23
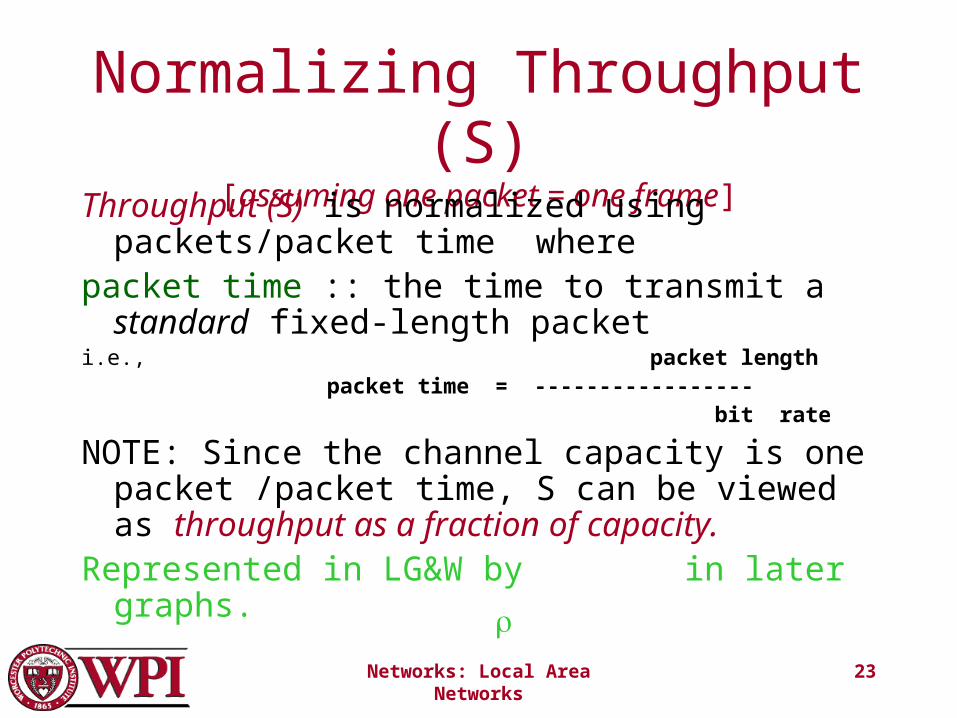
Normalizing Throughput (S)[assuming one packet = one frame]
Throughput (S) is normalized using packets/packet time where
packet time :: the time to transmit a standard fixed-length packet
i.e., packet length packet time = ----------------- bit rate
NOTE: Since the channel capacity is one packet /packet time, S can be viewed as throughput as a fraction of capacity.
Represented in LG&W by in later graphs.
Networks: Local Area Networks 24
1
2
3
n
retransmissions
SIXXX
G
D
Historic LAN Performance Notation
Networks: Local Area Networks 25
ALOHA• Abramson solved the channel allocation problem
for ground radio at University of Hawaii in 1970’s.
Aloha Transmission Strategy
Stations transmit whenever they have data to send.
• Collisions will occur and colliding frames are destroyed.
Aloha Retransmission Strategy
Station waits a random amount of time before sending again.
Networks: Local Area Networks 26
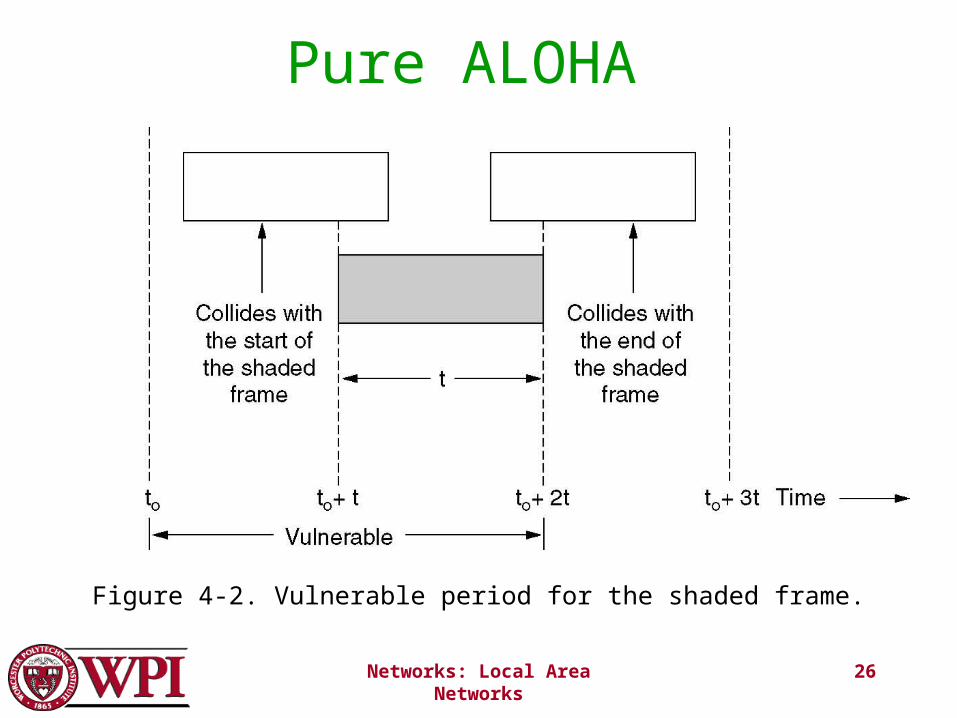
Pure ALOHA
Figure 4-2. Vulnerable period for the shaded frame.
Networks: Local Area Networks 27
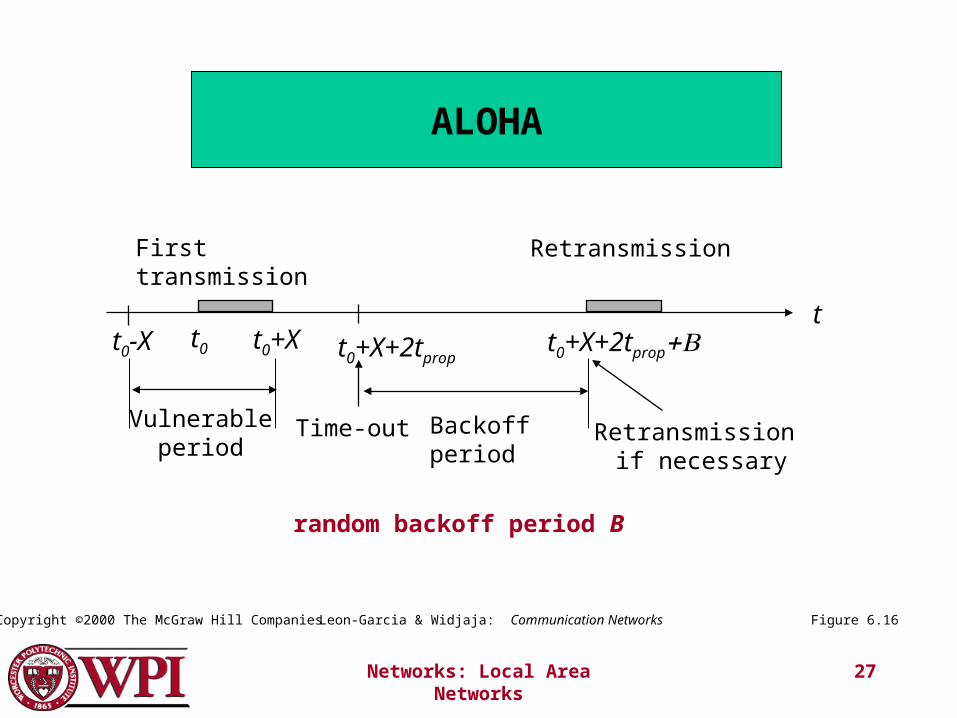
tt0t0-X t0+X t0+X+2tprop
t0+X+2tprop
Vulnerableperiod
Time-out Backoffperiod
Retransmission if necessary
First transmission Retransmission
Figure 6.16Leon-Garcia & Widjaja: Communication NetworksCopyright ©2000 The McGraw Hill Companies
random backoff period B
ALOHA
Networks: Local Area Networks 28
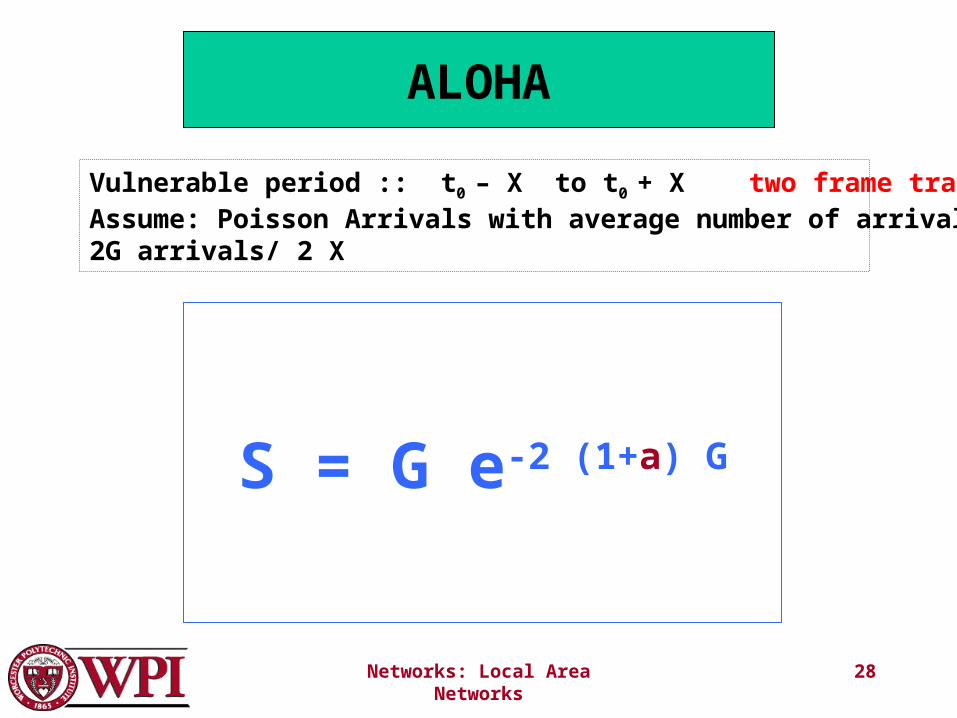
ALOHA
S = G e-2 (1+a) G
Vulnerable period :: t0 – X to t0 + X two frame transmission timesAssume: Poisson Arrivals with average number of arrivals of2G arrivals/ 2 X
Networks: Local Area Networks 29
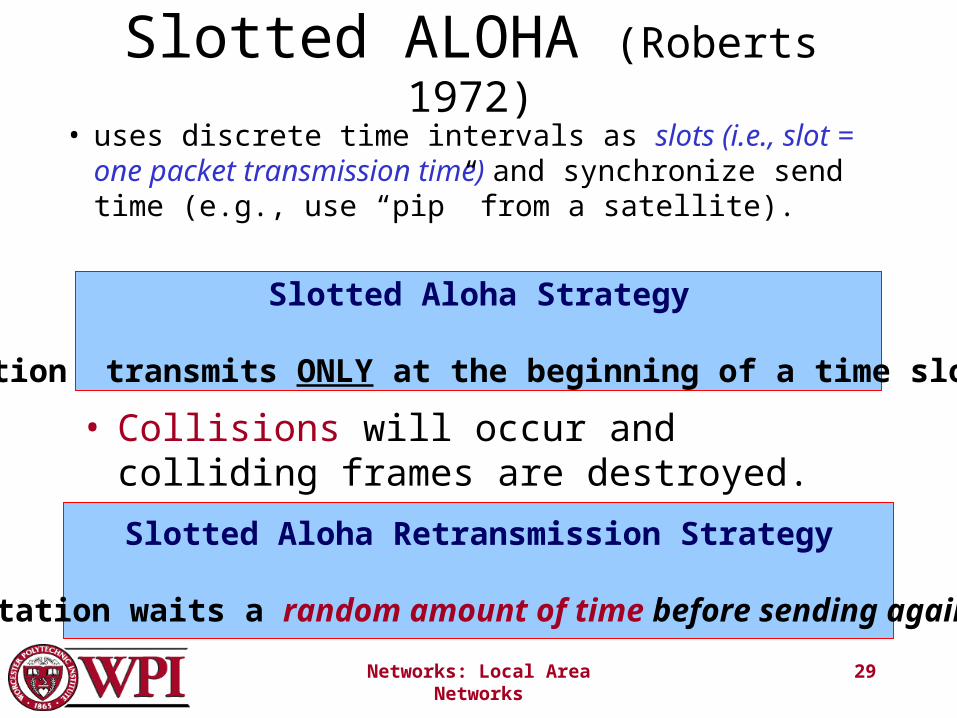
Slotted ALOHA (Roberts 1972)
• uses discrete time intervals as slots (i.e., slot = one packet transmission time) and synchronize send time (e.g., use “pip” from a satellite).
Slotted Aloha Strategy
Station transmits ONLY at the beginning of a time slot.
• Collisions will occur and colliding frames are destroyed.
Slotted Aloha Retransmission Strategy
Station waits a random amount of time before sending again.
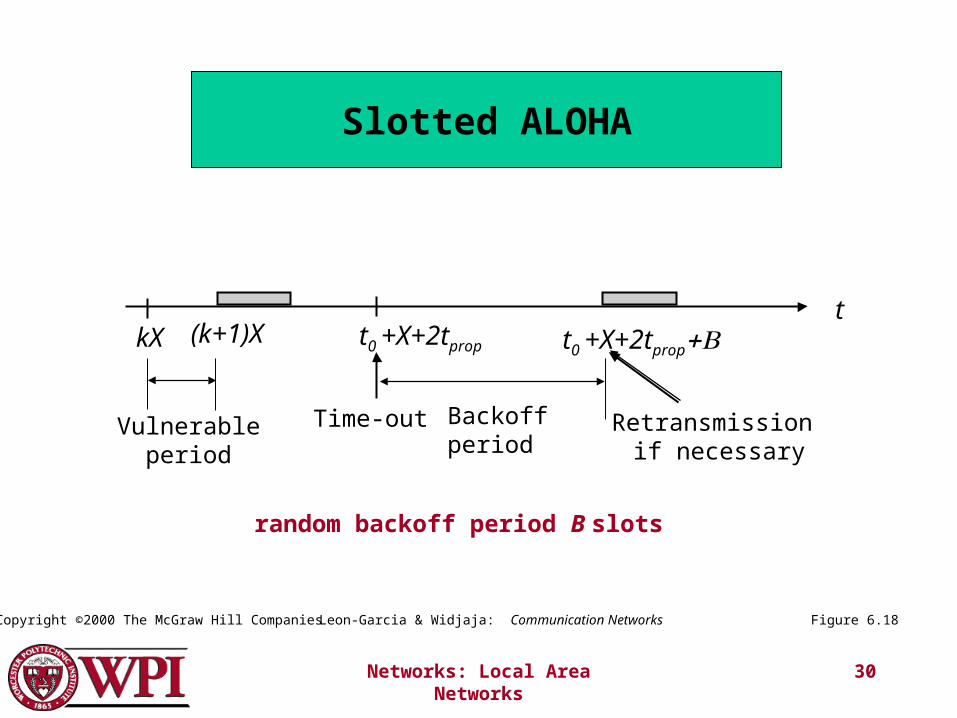
Networks: Local Area Networks 30
t(k+1)XkX t0 +X+2tpropt0 +X+2tprop
Figure 6.18
Vulnerableperiod
Time-out Backoffperiod
Retransmission if necessary
Leon-Garcia & Widjaja: Communication NetworksCopyright ©2000 The McGraw Hill Companies
Slotted ALOHA
random backoff period B slots
Networks: Local Area Networks 31
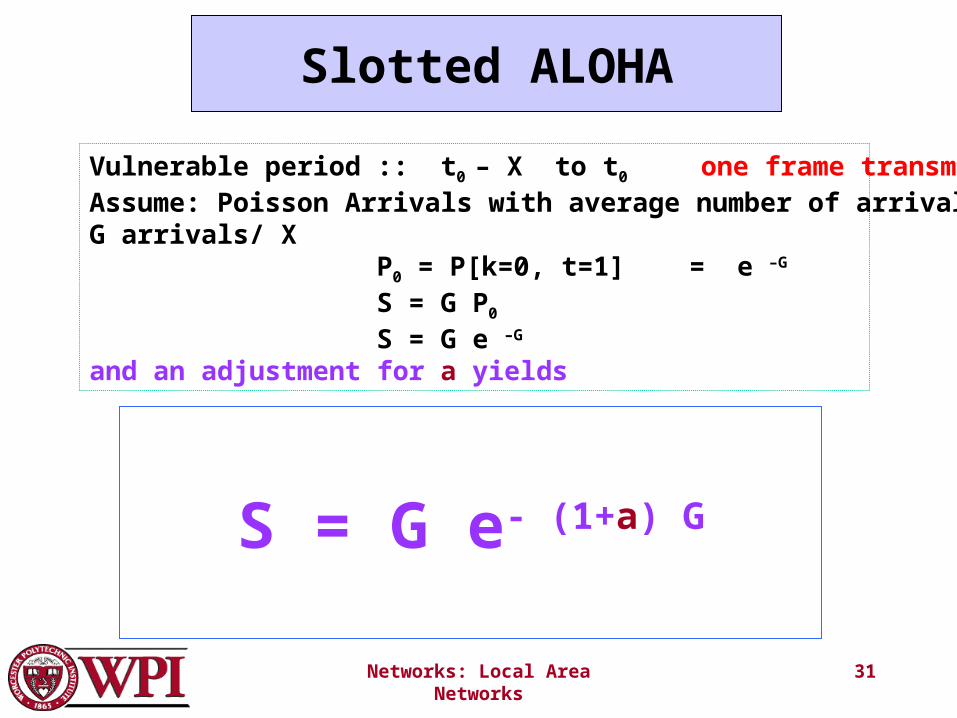
Slotted ALOHA
S = G e- (1+a) G
Vulnerable period :: t0 – X to t0 one frame transmission timeAssume: Poisson Arrivals with average number of arrivals ofG arrivals/ X
P0 = P[k=0, t=1] = e –G
S = G P0
S = G e –G
and an adjustment for a yields
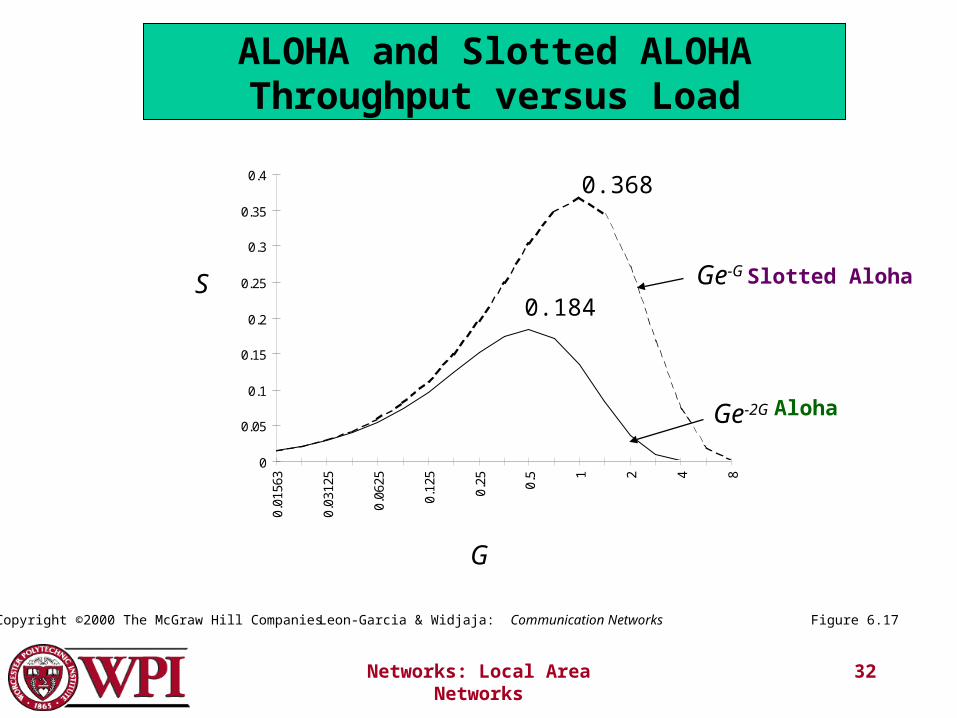
Networks: Local Area Networks 32
0
0.05
0.1
0.15
0.2
0.25
0.3
0.35
0.4
0.01
563
0.03
125
0.06
25
0.12
5
0.25 0.5 1 2 4 8
Ge-G
Ge-2G
G
S0.184
0.368
Figure 6.17Leon-Garcia & Widjaja: Communication NetworksCopyright ©2000 The McGraw Hill Companies
ALOHA and Slotted ALOHAThroughput versus Load
Aloha
Slotted Aloha
Networks: Local Area Networks 33
CSMA(Carrier Sense with Multiple Access)
nonpersistent CSMA {less greedy}
1. Sense the channel.
2. IF the channel is idle, THEN transmit.
3. IF the channel is busy, THEN wait a random amount of time and start over.
Networks: Local Area Networks 34
1 - Persistent CSMA
1 - persistent CSMA {selfish}
1. Sense the channel.
2. IF the channel is idle, THEN transmit.
3. IF the channel is busy, THEN continue to listen until channel is idle and transmit immediately.
Networks: Local Area Networks 35
P - Persistent CSMA
p - persistent CSMA {a slotted approximation}
1. Sense the channel.
2. IF the channel is idle, THEN with probability p transmit and with probability (1-p) delay one time slot and start over.
3. IF the channel is busy, THEN delay one time slot and start over.
Networks: Local Area Networks 36
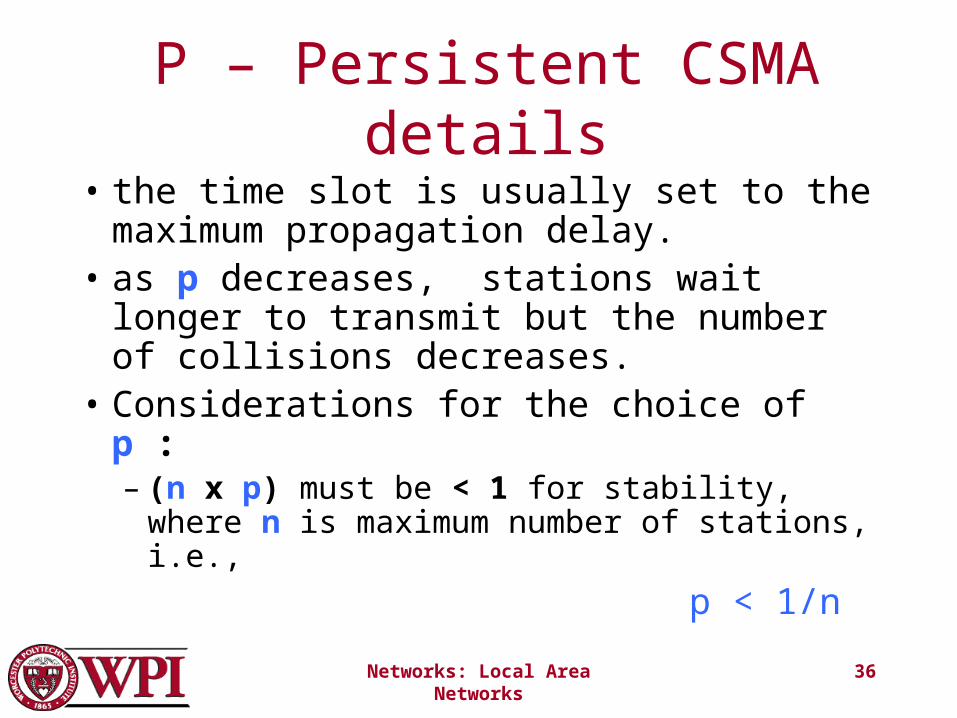
P – Persistent CSMA details
• the time slot is usually set to the maximum propagation delay.
• as p decreases, stations wait longer to transmit but the number of collisions decreases.
• Considerations for the choice of p : – (n x p) must be < 1 for stability, where n is
maximum number of stations, i.e.,
p < 1/n
Networks: Local Area Networks 37
CSMA Collisions
• In all three cases a collision is possible.
• CSMA determines collisions by the lack of an ACK which results in a TIMEOUT. {This is extremely expensive with respect to performance.}
• If a collision occurs, THEN wait a random amount of time and start over.
Networks: Local Area Networks 38
CSMA/CDCSMA with Collision Detection
• If a collision is detected during transmission, THEN immediately cease transmitting the frame.
• The first station to detect a collision sends a jam signal to all stations to indicate that there has been a collision.
• After receiving a jam signal, a station that was attempting to transmit waits a random amount of time before attempting to retransmit.
• The maximum time needed to detect a collision = 2 x propagation delay.
Networks: Local Area Networks 39
CSMA vs CSMA/CD
• CSMA is essentially a historical technology until we include Wireless LANs.
• If propagation time is short compared to transmission time, station can be listening before sending with CSMA.
• Collision detection (CD) accomplished by detecting voltage levels outside acceptable range. Thus attenuation limits distance without a repeater.
• If the collision time is short compared to packet time (i.e., small a), performance will increase due to CD.
Networks: Local Area Networks 40
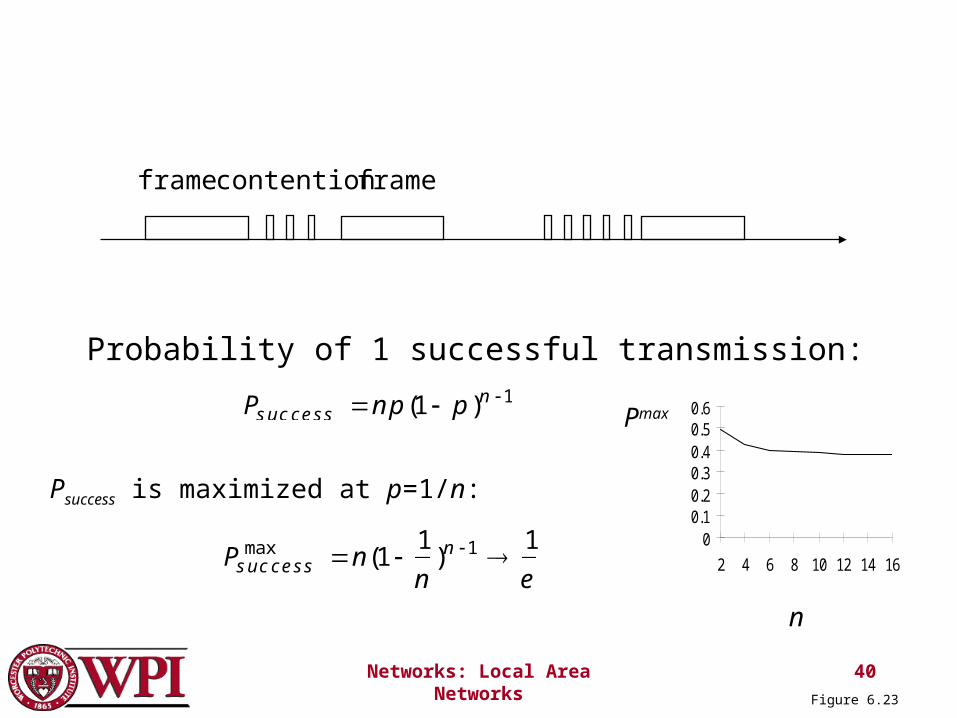
Probability of 1 successful transmission:
frame contention frame
Psuccess np(1 p)n 1
Psuccess is maximized at p=1/n:
Psuccess
max n(11
n)n 1
1
e
00.10.20.30.40.50.6
2 4 6 8 10 12 14 16
n
Pmax
Figure 6.23
Networks: Local Area Networks 41
0
0.1
0.2
0.3
0.4
0.5
0.6
0.0
2
0.0
3
0.0
6
0.1
3
0.2
5
0.5 1 2 4 8 16
32
64
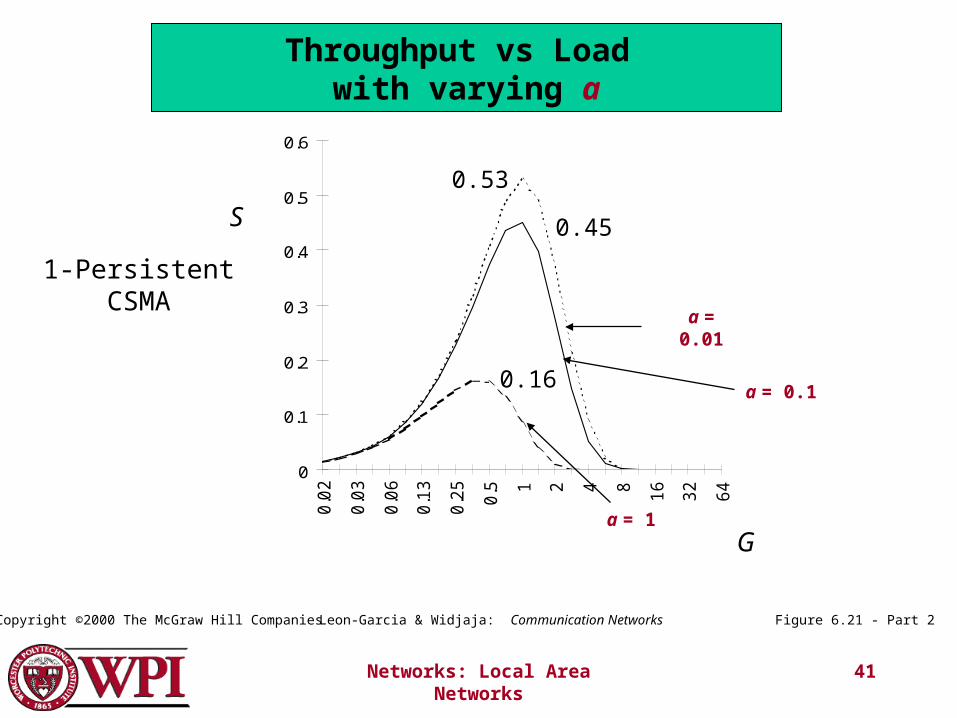
1-PersistentCSMA
0.53
0.45
0.16
S
G
Figure 6.21 - Part 2Leon-Garcia & Widjaja: Communication NetworksCopyright ©2000 The McGraw Hill Companies
Throughput vs Load with varying a
a = 1
a = 0.01
a = 0.1
Networks: Local Area Networks 42
0
0.1
0.2
0.3
0.4
0.5
0.6
0.7
0.8
0.9
0.0
2
0.0
3
0.0
6
0.1
3
0.2
5
0.5 1 2 4 8 16
32
64
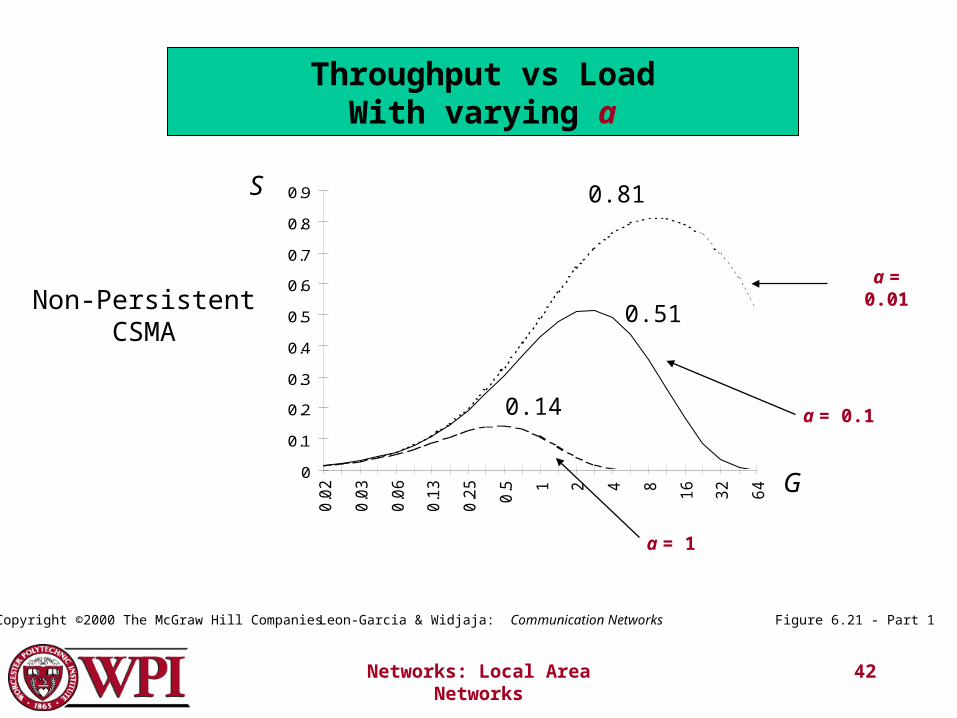
Non-PersistentCSMA
0.81
0.51
0.14
S
G
Figure 6.21 - Part 1Leon-Garcia & Widjaja: Communication NetworksCopyright ©2000 The McGraw Hill Companies
Throughput vs LoadWith varying a
a = 0.01
a = 0.1
a = 1
Networks: Local Area Networks 43
0
0.2
0.4
0.6
0.8
1
0.01 0.1 1
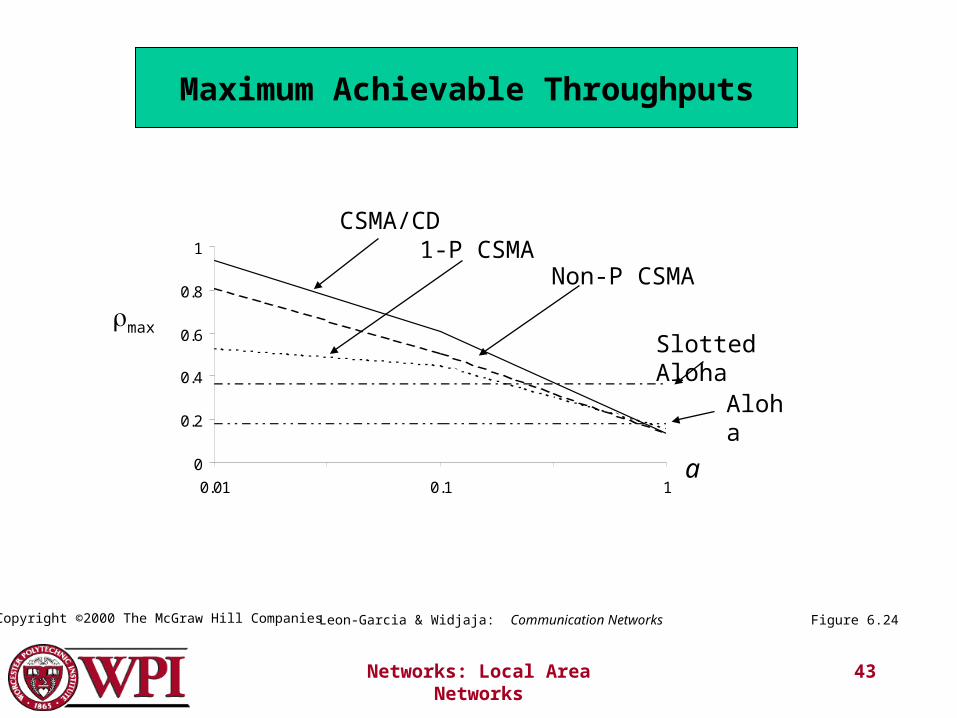
Aloha
Slotted Aloha
1-P CSMANon-P CSMA
CSMA/CD
a
max
Figure 6.24Leon-Garcia & Widjaja: Communication NetworksCopyright ©2000 The McGraw Hill Companies
Maximum Achievable Throughputs
Networks: Local Area Networks 44
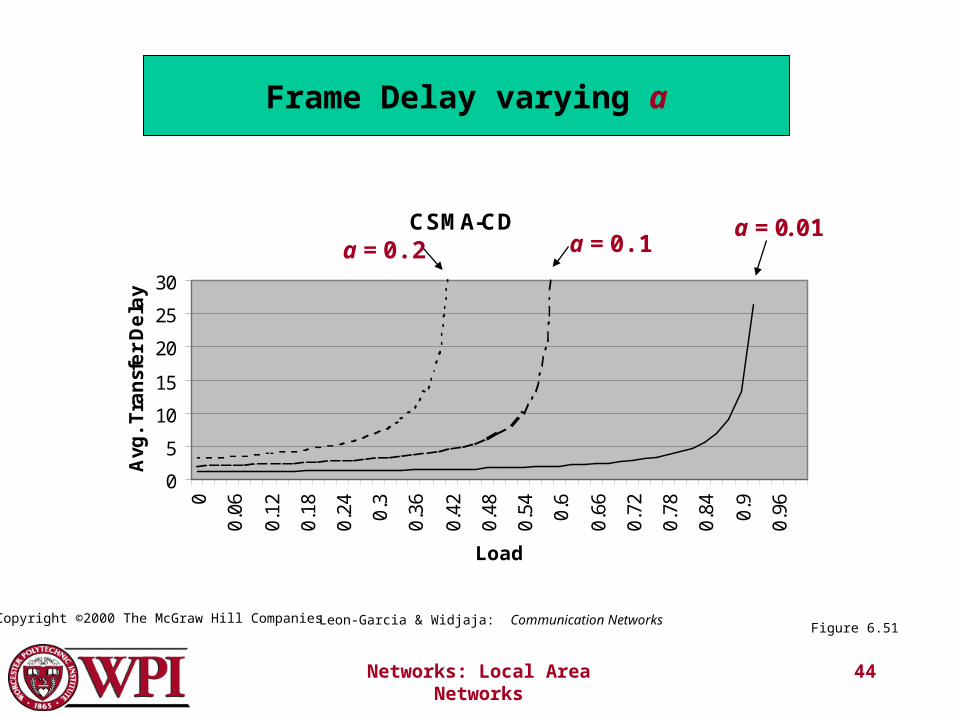
CSMA-CD
0
5
10
15
20
25
30
0
0.06
0.12
0.18
0.24 0.3
0.36
0.42
0.48
0.54 0.6
0.66
0.72
0.78
0.84 0.9
0.96
Load
Avg
. T
ran
sfe
r D
ela
y
a = 0.01a = 0.1a = 0.2
Figure 6.51
Frame Delay varying a
Leon-Garcia & Widjaja: Communication NetworksCopyright ©2000 The McGraw Hill Companies