Netcare Limited HY 2012 results
26
UNAUDITED GROUP INTERIM RESULTS for the six months ended 31 March 2012 Netcare Limited
-
Upload
africanfinancials-investor-presentations -
Category
Investor Relations
-
view
152 -
download
0
Transcript of Netcare Limited HY 2012 results

UNAUDITED GROUP INTERIM RESULTSfor the six months ended 31 March 2012
Netcare Limited

Netcare Limited
Unaudited Group interim results for the six months ended 31 March 2012 1
Financial highlights
Revenue (R million)
+11.1%2012: R12 654 million 2011: R11 392 million
2010
11 038 11 39212 654
2011 2012
Adjusted1 headline earnings per share (cents)
+16.1%2010
42.9 44.7
51.9
2011 2012
2012: 51.9 cents 2011: 44.7 cents
1 Adjusted to exclude, inter alia, the effects of the ineffective portion of the interest rate swaps and the change in the UK tax rate.

2
Overview
A positive performance in South Africa (SA) was offset by weaker results in the United Kingdom (UK) primarily due to the challenging economic environment. Adjusted headline earnings per share (HEPS) increased 16.1% to 51.9 cents for the period under review. Operational efficiency and implementing business improvement plans were again key focus areas for the Group.
Commentary
Netcare Limited
Unaudited Group interim results for the six months ended 31 March 2012 3
Group financial review
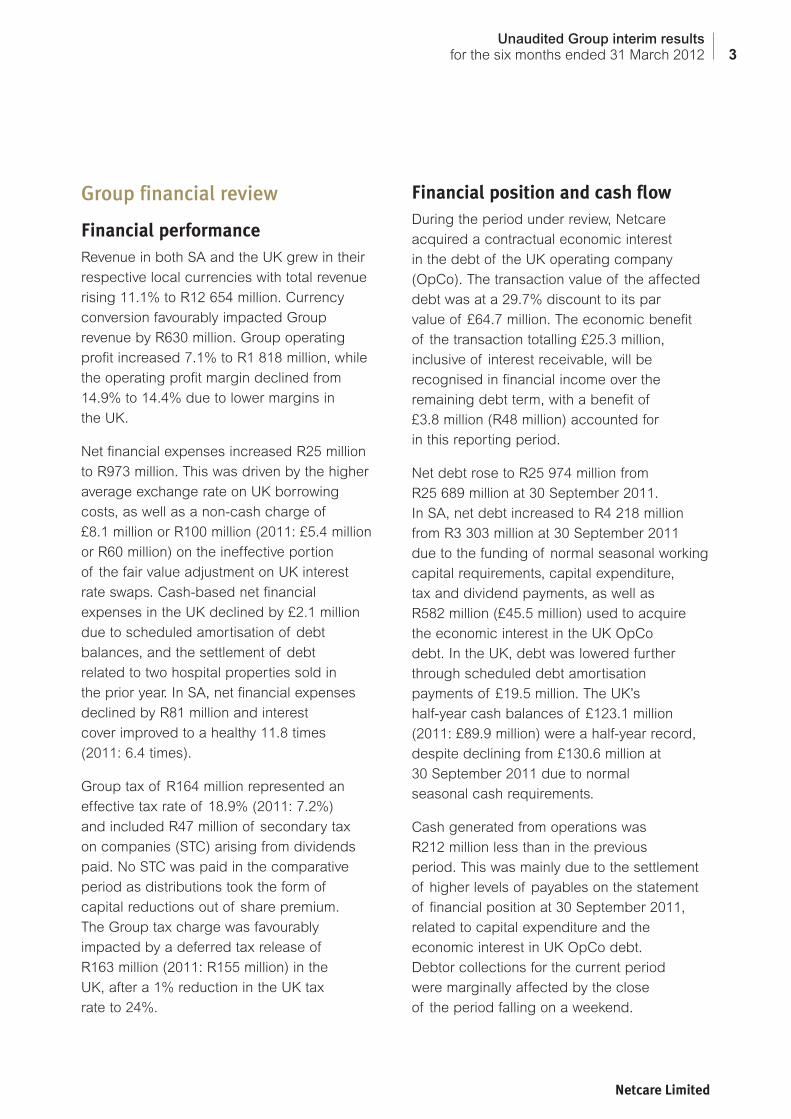
Financial performanceRevenue in both SA and the UK grew in their
respective local currencies with total revenue
rising 11.1% to R12 654 million. Currency
conversion favourably impacted Group
revenue by R630 million. Group operating
profit increased 7.1% to R1 818 million, while
the operating profit margin declined from
14.9% to 14.4% due to lower margins in
the UK.
Net financial expenses increased R25 million
to R973 million. This was driven by the higher
average exchange rate on UK borrowing
costs, as well as a non-cash charge of
£8.1 million or R100 million (2011: £5.4 million
or R60 million) on the ineffective portion
of the fair value adjustment on UK interest
rate swaps. Cash-based net financial
expenses in the UK declined by £2.1 million
due to scheduled amortisation of debt
balances, and the settlement of debt
related to two hospital properties sold in
the prior year. In SA, net financial expenses
declined by R81 million and interest
cover improved to a healthy 11.8 times
(2011: 6.4 times).
Group tax of R164 million represented an
effective tax rate of 18.9% (2011: 7.2%)
and included R47 million of secondary tax
on companies (STC) arising from dividends
paid. No STC was paid in the comparative
period as distributions took the form of
capital reductions out of share premium.
The Group tax charge was favourably
impacted by a deferred tax release of
R163 million (2011: R155 million) in the
UK, after a 1% reduction in the UK tax
rate to 24%.
Financial position and cash flowDuring the period under review, Netcare
acquired a contractual economic interest
in the debt of the UK operating company
(OpCo). The transaction value of the affected
debt was at a 29.7% discount to its par
value of £64.7 million. The economic benefit
of the transaction totalling £25.3 million,
inclusive of interest receivable, will be
recognised in financial income over the
remaining debt term, with a benefit of
£3.8 million (R48 million) accounted for
in this reporting period.
Net debt rose to R25 974 million from
R25 689 million at 30 September 2011.
In SA, net debt increased to R4 218 million
from R3 303 million at 30 September 2011
due to the funding of normal seasonal working
capital requirements, capital expenditure,
tax and dividend payments, as well as
R582 million (£45.5 million) used to acquire
the economic interest in the UK OpCo
debt. In the UK, debt was lowered further
through scheduled debt amortisation
payments of £19.5 million. The UK’s
half-year cash balances of £123.1 million
(2011: £89.9 million) were a half-year record,
despite declining from £130.6 million at
30 September 2011 due to normal
seasonal cash requirements.
Cash generated from operations was
R212 million less than in the previous
period. This was mainly due to the settlement
of higher levels of payables on the statement
of financial position at 30 September 2011,
related to capital expenditure and the
economic interest in UK OpCo debt.
Debtor collections for the current period
were marginally affected by the close
of the period falling on a weekend.

4
Working capital remained tightly controlled across both geographies.
Capital expenditure was R570 million (including intangible assets), compared to R461 million in the prior period.
Divisional reviewSouth AfricaRevenue grew 7.9% to R6 983 million and operating profit rose 12.1% to R1 145 million. Earnings before interest, tax, depreciation and amortisation (EBITDA) margin increased to 19.6% from 18.7% in 2011. The EDITDA margin has increased 310 basis points from 16.5% in 2009. SA HEPS increased 18.4% to 54.1 cents.
Cash generated from operations, affected by higher seasonal working capital, fell from R949 million in the comparative period to R657 million for the current period. Capital expenditure including intangible assets totalled R378 million (2011: R242 million).
Our Public Private Partnership (PPP) with the Government of Lesotho is fully operational. The PPP will operate the newly built 425-bed Queen ‘Mamohato Hospital and four primary care clinics for 18 years. We are confident that this innovative integrated approach to healthcare delivery will deliver improved clinical outcomes and a sustainable operating performance.
Netcare was recognised at the Metropolitan Oliver Empowerment Awards for Supply Chain, Community Development and New Black Business Development. In the Financial Mail’s Top Empowerment Companies Survey for 2012, Netcare was ranked the most empowered company in the JSE’s healthcare sector for the fourth consecutive
year. Accelerating transformation is one of our
strategic pillars and we are humbled that our
efforts to assist in normalising our nation have
been so consistently recognised.
Hospitals and Emergency servicesRevenue from Hospitals and Emergency
services grew 8.3% to R6 327 million, and
EBITDA rose 11.2% to R1 324 million. The
division grew patient days by 1.8%, while
revenue per patient day increased 5.9%.
The total number of beds increased from
9 052 to 9 143 during the six months under
review. Major expansion projects completed
include building projects at Netcare Mulbarton
(30 surgical and six neo-natal intensive care
unit (ICU) beds), Netcare Kingsway
(23 medical and 12 surgical beds) and
Netcare The Bay (18 medical and 14 ICU
beds). Current projects include Netcare
Montana (46 beds) and Netcare Linmed
(31 beds). In addition to expanding our
ability to service the escalating demand for
healthcare, a portion of our capital investment
is focused on upgrading and replacing
existing equipment, in line with our
commitment to quality patient care.
According to Stats SA, hospital inflation
in 2010 and 2011 was 7.0% and 5.5%
respectively which compares favourably
with medical insurance inflation of 13.0%
and 10.3% respectively. This is evidence of
cost containment efforts by private hospital
operators such as Netcare.
Primary CareThe division delivered pleasing results for the
period, with revenue up 4.5% to R656 million.
The EBITDA margin has increased to 6.9% from
3.3% in 2011 underpinned by stringent cost
control measures and operational efficiencies,

Netcare Limited
Unaudited Group interim results for the six months ended 31 March 2012 5
as well as sound risk management in the managed care division. Operating profit rose to R31 million (2011: R8 million).
Medicross and Prime Cure is the largest private national network of group GP and dental practices. Primary care delivery is becoming increasingly more important in the delivery of sustainable and affordable healthcare.
United KingdomDespite a very difficult trading environment characterised by continuing recessionary pressures and ongoing NHS reforms, our UK operations delivered a robust performance for the period under review. Revenue rose by 2.5% to £456.8, although EBITDA declined 1.3% to £88.9 mainly due to the reduction in insured lives.
General Healthcare Group’s (GHG) overall caseload increased by 3.2% compared to the prior period, driven by NHS Choose & Book (C&B) growth, offset by a continued decline in Private Medical Insurance (PMI) volumes. High levels of unemployment and low levels of disposable income continued to cause the number of insured lives across the wider PMI market to contract. Self-pay volumes have recovered after two years of decline. This has been driven by NHS waiting times increasing further due to financial constraints and regulatory changes in the healthcare sector. Pleasingly, NHS activity has continued to increase and GHG has grown its market share in this segment to become the largest private hospital service provider to the NHS under C&B.
The EBITDA margin declined to 19.5% from 20.2% in the comparative period mainly as a result of the continued shift from private patient volumes to lower-margin NHS volumes and a
shift to more day cases. GHG’s operational
efficiency and cost rationalisation programmes
have however continued to offset this effect.
Net financial expenses were adversely
affected by an £8.1 million (2011: £5.4 million)
non-cash charge, representing the ineffective
portion of the movement in the fair value of
GHG’s interest rate swaps.
A tax benefit of £13.6 million
(2011: £14.0 million) was recognised for the
period, following a further 1% reduction in the
UK statutory company tax rate to 24%. GHG
recorded a loss after tax of £2.3 million
(2011: profit after tax of £7.1 million).
Capital expenditure (including intangible
assets) amounted to £15.1 million
(2011: £19.9 million), relating mainly to
projects initiated in the 2011 financial year
and spending on the existing asset base.
Net debt declined £9.0 million from
30 September 2011 to £1 776.4 million.
Working capital was tightly controlled and the
improvements of the prior year were sustained
during the period. Closing cash balances
remain high at £123.1 million compared to
£89.9 million in the comparative period.
GHG continues to meet all financial covenants
on both the OpCo and property-owning
companies (PropCo) debt facilities. PropCo
remains focused on achieving a solution to
the PropCo debt facility, which matures in
October 2013. Advisors have been appointed
and various options are being evaluated.
The PropCo debt is ring-fenced from the
OpCo and is also without recourse to
Netcare’s SA operations. Furthermore, in
terms of the long-term lease arrangements
in place (19 years remaining plus additional

6
extensions of 10 years), OpCo has the right
to ongoing use and occupation of the hospital
premises as long as it complies with its
contractual rental obligations to PropCo.
OutlookNetcare, in consultation with key stakeholders,
has completed an extensive scenario analysis
of the South African healthcare environment.
In every possible future scenario, healthcare
demand continues to expand. While this is
the basis for growth in health services, it also
poses a risk insofar as these demands may
not be met nationally by current healthcare
delivery systems or resources. The launch
of 10 NHI pilot sites is a significant step
forward in assessing the supply and demand
parameters of healthcare delivery. Netcare
is firmly committed to increasing access to
quality health care. We believe we can play
a meaningful role in assisting future NHI
delivery, in partnership with government
given our broad portfolio of healthcare
services and experience over the last
decade in the UK of working with the NHS
in public health delivery.
In the UK, a firm foundation has been set for
the remainder of the financial year, although
the challenges remain significant. These
include the economic headwinds and their
impact on personal incomes and the PMI
market, as well as government austerity
measures and changing dynamics within
the NHS. However, GHG continues to be
focused on its core businesses, ensuring
efficiency and quality, and being ready to
capitalise on the inevitable return to growth
of the private healthcare market.
Declaration of interim dividend number 6Notice is hereby given that on Thursday, 10 May 2012, the board of directors of Netcare Limited declared an interim gross dividend of 22.0 cents per ordinary share (18.7846 cents per ordinary share net of dividend withholding tax and STC credits) (2011: 22.0 cents), for the six months ended 31 March 2012. The board has determined that, taking all relevant factors into account, this dividend is appropriate in working towards a sustainable dividend policy of between 2.5 to 3.0 times cover over time. The board have confirmed by resolution that the solvency and liquidity test as contemplated by the Companies Act 71 of 2008 has been duly considered, applied and satisfied.
The dividend has been declared from income reserves.
In terms of the new Dividends Tax effective 1 April 2012, the following additional information is disclosed:
withholding tax at 15%. In determining dividend withholding tax, STC credits must be taken into account and the STC credits utilised as part of this dividend declaration amount to R8 178 401.
to 0.564 cents per share.
which results in a net dividend of 18.7846 cents per share to shareholders who are not exempt from dividends withholding tax.
Netcare Limited
Unaudited Group interim results for the six months ended 31 March 2012 7
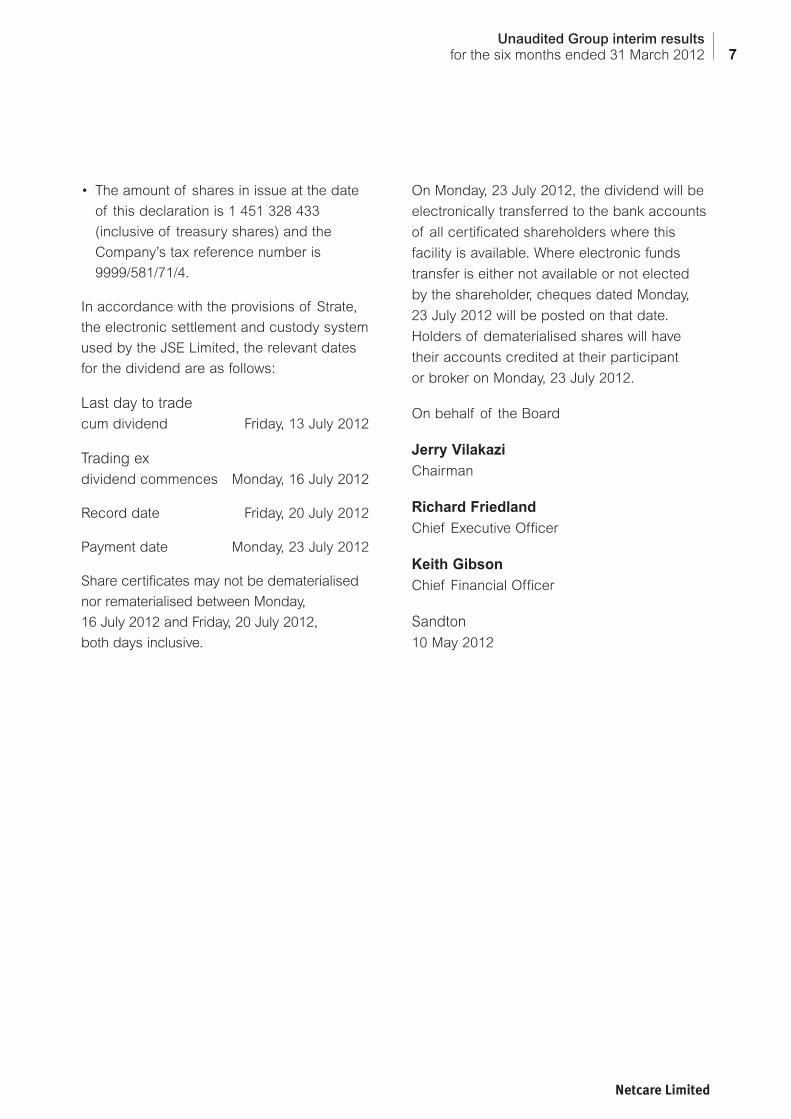
of this declaration is 1 451 328 433
(inclusive of treasury shares) and the
Company’s tax reference number is
9999/581/71/4.
In accordance with the provisions of Strate,
the electronic settlement and custody system
used by the JSE Limited, the relevant dates
for the dividend are as follows:
Last day to trade cum dividend Friday, 13 July 2012
Trading ex dividend commences Monday, 16 July 2012
Record date Friday, 20 July 2012
Payment date Monday, 23 July 2012
Share certificates may not be dematerialised
nor rematerialised between Monday,
16 July 2012 and Friday, 20 July 2012,
both days inclusive.
On Monday, 23 July 2012, the dividend will be
electronically transferred to the bank accounts
of all certificated shareholders where this
facility is available. Where electronic funds
transfer is either not available or not elected
by the shareholder, cheques dated Monday,
23 July 2012 will be posted on that date.
Holders of dematerialised shares will have
their accounts credited at their participant
or broker on Monday, 23 July 2012.
On behalf of the Board
Jerry Vilakazi
Chairman
Richard Friedland
Chief Executive Officer
Keith Gibson
Chief Financial Officer
Sandton10 May 2012

8
Group income statement
Rm Notes
Unauditedsix months ended
% change
Auditedyear ended
31 March2012
31 March2011
30 September2011
Revenue 12 654 11 392 11.1 23 221 Cost of sales (7 359) (6 681) (13 513)
Gross profit 5 295 4 711 12.4 9 708 Other income 143 177 408 Administrative and other expenses (3 620) (3 190) (6 415)
Operating profit 3 1 818 1 698 7.1 3 701 Investment income 4 90 26 115 Financial expenses 5 (970) (904) (1 847)Other losses – net 6 (93) (70) (23)Attributable earnings of associates 25 3 23
Profit before taxation 870 753 15.5 1 969 Taxation (164) (54) (114)
Profit for the period 706 699 1.0 1 855
Attributable to:Owners of the parent 699 642 1 570 Preference shareholders 22 24 47
Profit attributable to shareholders 721 666 1 617 Non-controlling interest (15) 33 238
706 699 1 855
Earnings per share (cents)
Basic 53.6 50.2 6.8 122.1 Diluted 52.9 48.7 8.6 119.2
Dividend per share (cents) 22.0 22.0 53.0

Netcare Limited
Unaudited Group interim results for the six months ended 31 March 2012 9
Group statement of comprehensive income
Rm Note
Unauditedsix months ended
Auditedyear ended
31 March2012
31 March*2011
30 September2011
Profit for the period 706 699 1 855 Other comprehensive (loss)/income, net of tax (172) 1 091 22
Actuarial losses on defined benefit plans (1)Effect of cash flow hedge accounting Change in the fair value of cash flow hedges (78) 1 130 (608) Reclassification of the cash flow hedge reserve 6 (9) 1 43
Effect of translation of foreign entities (85) (40) 588
Total comprehensive income for the period 534 1 790 1 877
Attributable to:Owners of the parent 594 1 210 1 605 Preference shareholders 22 24 47 Non-controlling interest (82) 556 225
534 1 790 1 877
* Restated refer to note 2.
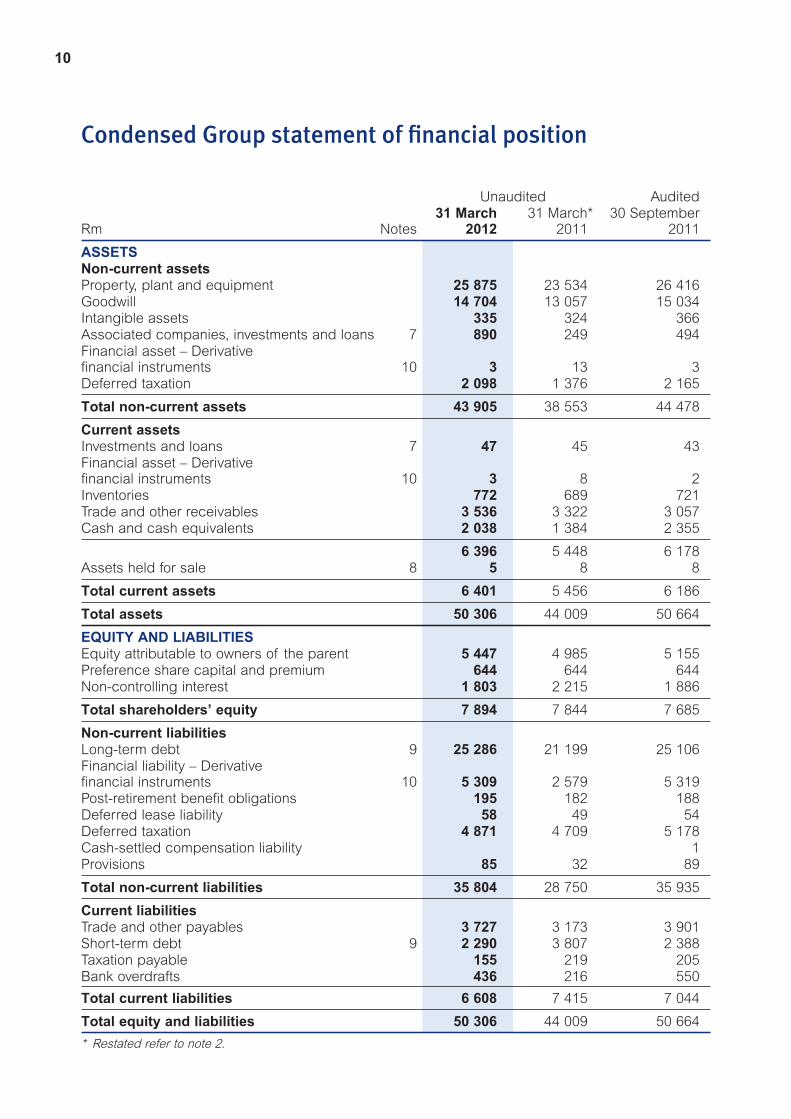
10
Condensed Group statement of financial position
Unaudited Audited
Rm Notes31 March
2012 31 March*
2011 30 September
2011
ASSETSNon-current assetsProperty, plant and equipment 25 875 23 534 26 416 Goodwill 14 704 13 057 15 034 Intangible assets 335 324 366 Associated companies, investments and loans 7 890 249 494 Financial asset – Derivative financial instruments 10 3 13 3 Deferred taxation 2 098 1 376 2 165
Total non-current assets 43 905 38 553 44 478
Current assetsInvestments and loans 7 47 45 43 Financial asset – Derivative financial instruments 10 3 8 2 Inventories 772 689 721 Trade and other receivables 3 536 3 322 3 057 Cash and cash equivalents 2 038 1 384 2 355
6 396 5 448 6 178 Assets held for sale 8 5 8 8
Total current assets 6 401 5 456 6 186
Total assets 50 306 44 009 50 664
EQUITY AND LIABILITIES Equity attributable to owners of the parent 5 447 4 985 5 155 Preference share capital and premium 644 644 644 Non-controlling interest 1 803 2 215 1 886
Total shareholders’ equity 7 894 7 844 7 685
Non-current liabilitiesLong-term debt 9 25 286 21 199 25 106 Financial liability – Derivative financial instruments 10 5 309 2 579 5 319 Post-retirement benefit obligations 195 182 188 Deferred lease liability 58 49 54 Deferred taxation 4 871 4 709 5 178 Cash-settled compensation liability 1 Provisions 85 32 89
Total non-current liabilities 35 804 28 750 35 935
Current liabilitiesTrade and other payables 3 727 3 173 3 901 Short-term debt 9 2 290 3 807 2 388 Taxation payable 155 219 205 Bank overdrafts 436 216 550
Total current liabilities 6 608 7 415 7 044
Total equity and liabilities 50 306 44 009 50 664
* Restated refer to note 2.

Netcare Limited
Unaudited Group interim results for the six months ended 31 March 2012 11
Group statement of cash flows
Rm
Unauditedsix months ended
Auditedyear ended
31 March2012
31 March2011
30 September2011
Cash flows from operating activities
Cash received from customers 12 135 11 349 23 645 Cash paid to suppliers and employees (10 363) (9 365) (18 073)
Cash generated from operations 1 772 1 984 5 572 Interest paid (936) (902) (1 836)Taxation paid (427) (346) (674)Ordinary dividends paid by subsidiaries (1) (1) (3)Ordinary dividends paid (405) (269) (553)Preference dividends paid (22) (24) (47)Capital reductions paid (83) (83)Distributions to beneficiaries of the HPFL trusts (31) (38) (47)
Net cash from operating activities (50) 321 2 329
Cash flows from investing activities
Purchase of property, plant and equipment (561) (436) (1 327)Proceeds on disposal of property, plant and equipment 27 144 415 Additions to intangible assets (9) (25) (81)(Increase)/decrease in investments and loans (364) 85 (250)Interest received 54 26 115 Increase in equity interest in subsidiaries (11)
Net cash from investing activities (853) (206) (1 139)
Cash flows from financing activities
Proceeds from issue of ordinary shares 16 36 74 Proceeds on disposal of treasury shares 119 62 123 Equity premium on repurchase of convertible bond (10)Long-term liabilities raised/(repaid) 680 (286) 477 Short-term liabilities repaid (79) (37) (1 544)
Net cash from financing activities 736 (225) (880)
Net (decrease)/increase in cash and cash equivalents (167) (110) 310 Translation effects on cash and cash equivalents of foreign entities (36) (7) 210 Cash and cash equivalents at beginning of the period 1 805 1 285 1 285
Cash and cash equivalents at end of the period 1 602 1 168 1 805
Consisting of:
Cash on hand and balances with banks 2 038 1 384 2 355 Short-term money market borrowings and bank overdrafts (436) (216) (550)
1 602 1 168 1 805
12
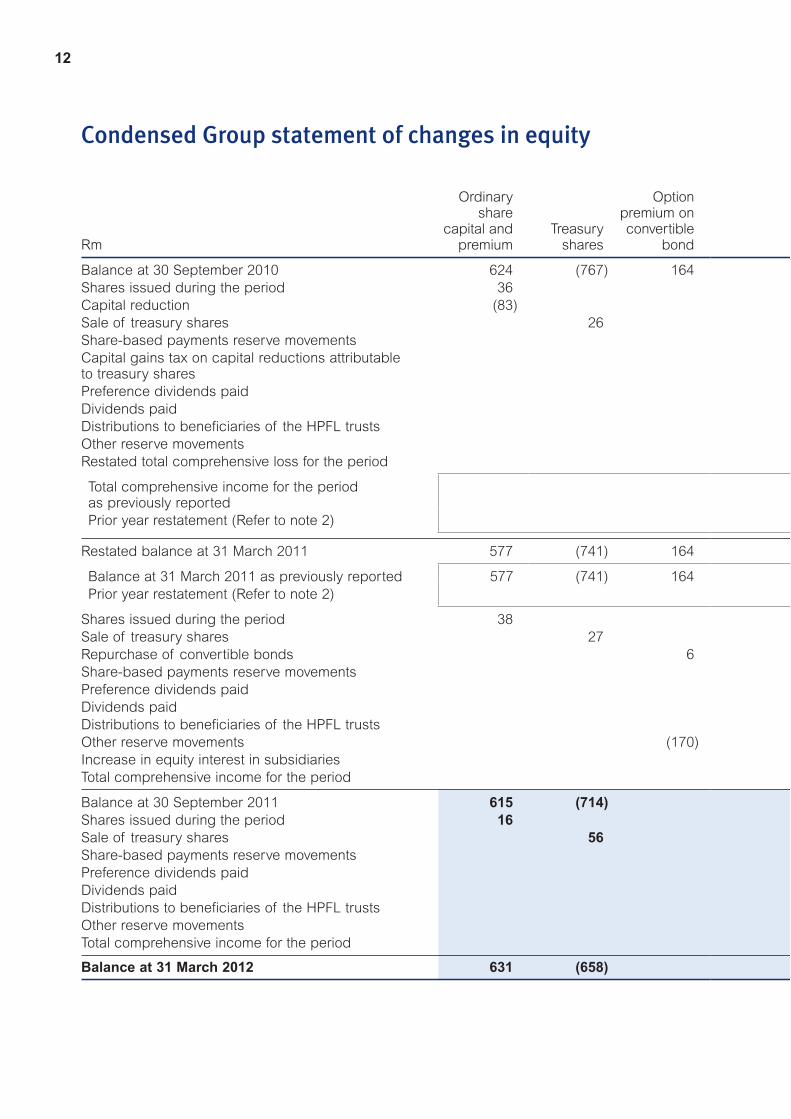
Condensed Group statement of changes in equity
Rm
Ordinary share
capital and premium
Treasury shares
Option premium onconvertible
bond
Balance at 30 September 2010 624 (767) 164 Shares issued during the period 36 Capital reduction (83)Sale of treasury shares 26 Share-based payments reserve movementsCapital gains tax on capital reductions attributable to treasury sharesPreference dividends paidDividends paid Distributions to beneficiaries of the HPFL trustsOther reserve movementsRestated total comprehensive loss for the period
Total comprehensive income for the period as previously reported
Prior year restatement (Refer to note 2)
Restated balance at 31 March 2011 577 (741) 164
Balance at 31 March 2011 as previously reported 577 (741) 164 Prior year restatement (Refer to note 2)
Shares issued during the period 38 Sale of treasury shares 27 Repurchase of convertible bonds 6 Share-based payments reserve movementsPreference dividends paidDividends paid Distributions to beneficiaries of the HPFL trustsOther reserve movements (170)Increase in equity interest in subsidiariesTotal comprehensive income for the period
Balance at 30 September 2011 615 (714)
Shares issued during the period 16
Sale of treasury shares 56
Share-based payments reserve movementsPreference dividends paidDividends paid Distributions to beneficiaries of the HPFL trustsOther reserve movementsTotal comprehensive income for the period
Balance at 31 March 2012 631 (658)

Netcare Limited
Unaudited Group interim results for the six months ended 31 March 2012 13
Cash flowhedge
accountingreserve
Foreigncurrency
translationreserve
Other reserves
Retained earnings
Equityattributable
to owners of the parent
Preferenceshare
capital andpremium
Non-controlling
interest
Totalshare-
holders’equity
(1 790) 769 551 4 518 4 069 644 1 645 6 358 36 36
(83) (83) 30 56 56
14 14 14
(1) (1) (1) (24) (24) (24)
(269) (269) (1) (270) (38) (38) (38)
19 (28) (9) 15 6 588 (20) 666 1 234 556 1 790
588 (21) 666 1 233 555 1 788 1 1 1 2
(1 202) 749 584 4 854 4 985 644 2 215 7 844
(1 202) 722 584 4 968 5 072 644 2 297 8 013 27 (114) (87) (82) (169)
38 38 25 52 52
(21) (15) (15) 9 9 9
(23) (23) (23) (284) (284) (2) (286)
(9) (9) (9) 104 80 14 (15) (1)
(30) (30) 19 (11) (889) 362 945 418 (331) 87
(2 091) 1 111 697 5 537 5 155 644 1 886 7 685
16 16
53 109 109
9 9 9
(22) (22) (22)
(405) (405) (1) (406)
(31) (31) (31)
5 (5)
(45) (60) 721 616 (82) 534
(2 136) 1 051 711 5 848 5 447 644 1 803 7 894
14
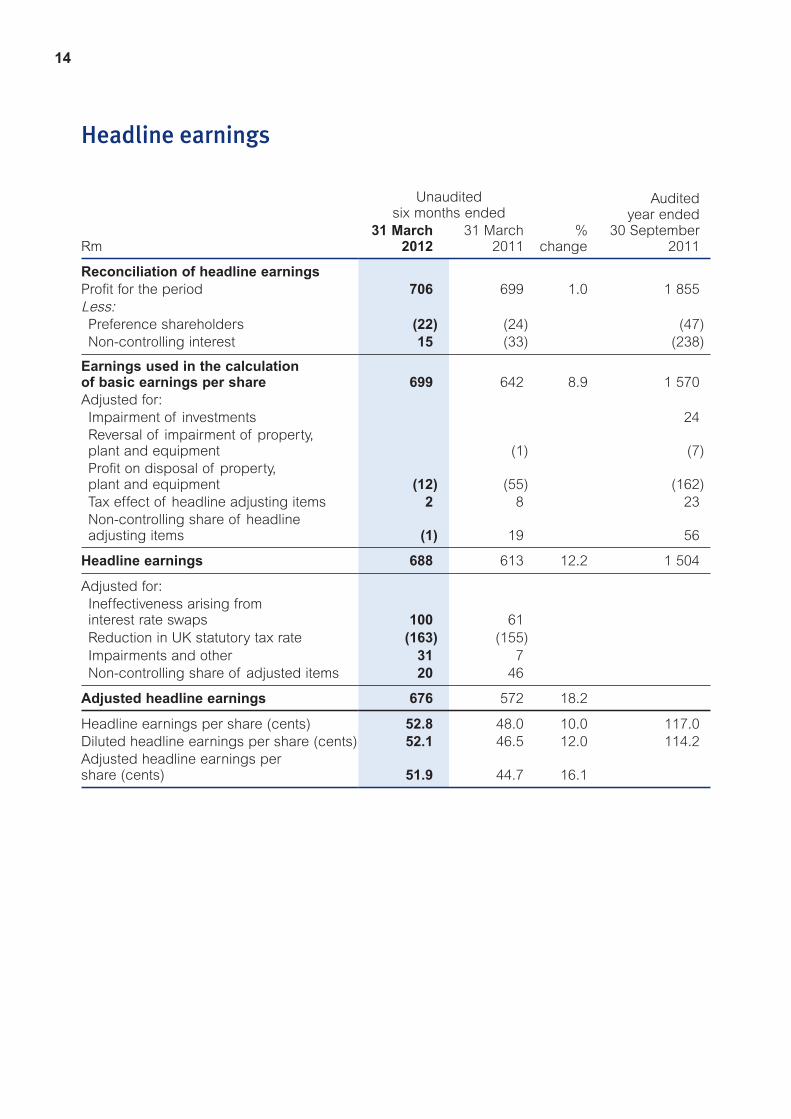
Headline earnings
Rm
Unauditedsix months ended
% change
Auditedyear ended
30 September2011
31 March2012
31 March2011
Reconciliation of headline earnings
Profit for the period 706 699 1.0 1 855 Less: Preference shareholders (22) (24) (47) Non-controlling interest 15 (33) (238)
Earnings used in the calculation of basic earnings per share 699 642 8.9 1 570 Adjusted for: Impairment of investments 24 Reversal of impairment of property, plant and equipment (1) (7)
Profit on disposal of property, plant and equipment (12) (55) (162)
Tax effect of headline adjusting items 2 8 23 Non-controlling share of headline adjusting items (1) 19 56
Headline earnings 688 613 12.2 1 504
Adjusted for: Ineffectiveness arising from interest rate swaps 100 61
Reduction in UK statutory tax rate (163) (155) Impairments and other 31 7 Non-controlling share of adjusted items 20 46
Adjusted headline earnings 676 572 18.2
Headline earnings per share (cents) 52.8 48.0 10.0 117.0 Diluted headline earnings per share (cents) 52.1 46.5 12.0 114.2Adjusted headline earnings per share (cents) 51.9 44.7 16.1

Netcare Limited
Unaudited Group interim results for the six months ended 31 March 2012 15
1. Basis of preparation and accounting policiesThe condensed financial statements for the six months ended 31 March 2012 have been prepared in accordance with International Financial Reporting Standards (IFRS) and comply with IAS 34 Interim Financial Reporting, the AC500 standards as issued by the Accounting Practices Board or its successor, the Listings Requirements of the JSE Limited and the South African Companies Act No 71 of 2008.
The accounting policies applied in the preparation of these condensed financial statements are consistent in all material respects with those applied in the audited financial statements for the year ended 30 September 2011.
A significant portion of the UK PropCo debt matures in October 2013, and the business is actively involved with its advisors in order to seek a solution. Whilst no formally committed plan currently exists, it is premature at this stage, with 17 months remaining before the maturity date, to conclude that a solution cannot be achieved. Furthermore, given the ring-fencing of the PropCo debt from the UK OpCo, and the non-recourse nature of this debt to Netcare’s SA operations, the directors are comfortable with the going concern assessment.
The interim results have not been audited by the Group’s independent external auditors, Grant Thornton.
The condensed financial statements have been prepared under the supervision of KN Gibson CA (SA), Chief Financial Officer of Netcare Limited.
2. Restatement of comparative informationThe annual financial statements for the year ended 30 September 2011 included a prior year restatement resulting from a change in GHG’s interpretation of IAS 12 Income taxes. This change related to the differences that arise on the straight-lining of lease rentals on operating leases between GHG’s wholly owned subsidiaries, BMI Healthcare Limited and other group property holding companies. In prior years, the differences were accounted for as permanent differences with no deferred tax being raised. Management concluded that fairer presentation would be achieved if these were treated as timing differences and the appropriate deferred tax liability raised. More details are provided in note 33 of the annual financial statements for the year ended 30 September 2011.
The March 2011 statement of financial position, statement of changes in equity and statement of comprehensive income have been restated to reflect the changes. The restatement did not result in any changes to earnings or headline earnings per share.
Condensed notes to the Group financial statements

16
2. Restatement of comparative information (continued)The effect of this change is summarised below:Group statement of financial position for the six months ended 31 March 2011
RmPreviously
reported Adjustment Restated
Non-current assets
Deferred taxation 1 071 305 1 376 Non-current liabilities
Deferred taxation (4 235) (474) (4 709)Equity
Foreign currency translation reserve (722) (27) (749)Retained earnings (4 968) 114 (4 854)Non-controlling interest (2 297) 82 (2 215)
Rm
Unauditedsix months ended
Auditedyear ended
31 March2012
31 March2011
30 September2011
3. Operating profitAfter charging:Depreciation and amortisation 659 568 1 213 Operating lease charges 272 176 469
4. Investment incomeReturn on retirement benefit plan assets 49 Interest on bank accounts and other 90 26 66
90 26 115
5. Financial expensesAmortisation of arrangement fee 52 43 90 Interest on convertible bonds (liability portion) 73 140 Interest on promissory notes 121 84 166 Interest on preference shares classified as debt 1 3 4 Interest on bank loans and other 796 701 1 447
970 904 1 847
6. Other losses – netForeign exchange (losses)/gains (1) 5 Ineffectiveness (losses)/gains on cash flow hedges (100) (61) 43 Fair value loss on inflation rate swaps (not hedge accounted) (2)Fair value loss on derivative financial assets (not hedge accounted) (2) (7) (26)Amount reclassified from cash flow hedge reserve 9 (1) (43)
(93) (70) (23)
Condensed notes to the Group financial statements (continued)

Netcare Limited
Unaudited Group interim results for the six months ended 31 March 2012 17
Rm
Unauditedsix months ended
Auditedyear ended
31 March2012
31 March2011
30 September2011
7. Associated companies, investments and loansNon-current
Associated companies 287 224 289 Available-for-sale investments 22 Loans and receivables 603 3 205
890 249 494
Current
Loans and receivables 47 45 43
937 294 537
The available-for-sale investment represents an 8% investment in Phoenix Hospital Limited, an unlisted group which comprises The Weymouth Clinic Limited and 9 Harley Street Limited in the United Kingdom. An impairment loss of R22 million was recognised during the prior year.
Included in loans and receivables is an investment of R584 million relating to the acquisition of a contractual economic interest in the debt of the UK OpCo.
8. Assets held for saleCertain land and buildings were classified as held for sale 5 8 8

18
Condensed notes to the Group financial statements (continued)
Rm
Unauditedsix months ended
Auditedyear ended
31 March2012
31 March2011
30 September2011
9. DebtLong-term debt 25 286 21 199 25 106 Short-term debt 2 290 3 807 2 388
Total debt 27 576 25 006 27 494
Comprising:Debt in South African Rand
Finance leases 51 57 57 Redeemable cumulative preference shares 22 42 34 Convertible bonds (debt portion) 1 445 Promissory notes 4 039 1 910 3 180 Unsecured liabilities 200 452 200
4 312 3 906 3 471
Debt in foreign currency
Secured liabilities 22 927 20 903 23 563 Finance leases 153 111 154 Other 184 86 306
23 264 21 100 24 023
27 576 25 006 27 494
Maturity profile
Rm Total< 1
year1 – 2 years
2 – 3 years
3 – 4 years
> 4 years
31 March 2012
Debt in South African Rand 4 312 1 500 420 1 374 7 1 011 Debt in foreign currency 23 264 790 19 700 1 086 1 518 170
27 576 2 290 20 120 2 460 1 525 1 181
31 March 2011Debt in South African Rand 3 906 3 192 683 7 6 18 Debt in foreign currency 21 100 615 440 17 421 86 2 538
25 006 3 807 1 123 17 428 92 2 556
31 September 2011Debt in South African Rand 3 471 1 622 483 344 7 1 015 Debt in foreign currency 24 023 766 575 19 908 1 592 1 182
27 494 2 388 1 058 20 252 1 599 2 197

Netcare Limited
Unaudited Group interim results for the six months ended 31 March 2012 19
Rm
Unauditedsix months ended
Auditedyear ended
31 March2012
31 March2011
30 September2011
10. Derivative financial instrumentsDerivative financial assets
European style call optionsSouth African Rand 3 21 5 Interest rate swapsSouth African Rand 3
6 21 5
Included in:Non-current assets 3 13 3 Current assets 3 8 2
6 21 5
Derivative financial liabilities
Interest rate swapsSouth African Rand 9 10 16 Foreign currency 5 297 2 569 5 300
5 306 2 579 5 316 Inflation rate swapsSouth African Rand 3 3
5 309 2 579 5 319
Included in:Non-current liabilities 5 309 2 579 5 319
The inter-bank rate used in the fair value calculations of the foreign currency interest rate swaps has been adjusted to take into account the credit risk to which the Group is exposed. The value of the foreign currency interest rate swaps excluding the counterparty valuation adjustment (CVA) at 31 March 2012 was R6 202 million.
20
Condensed notes to the Group financial statements (continued)
Rm
Unauditedsix months ended
Auditedyear ended
31 March2012
31 March2011
30 September2011
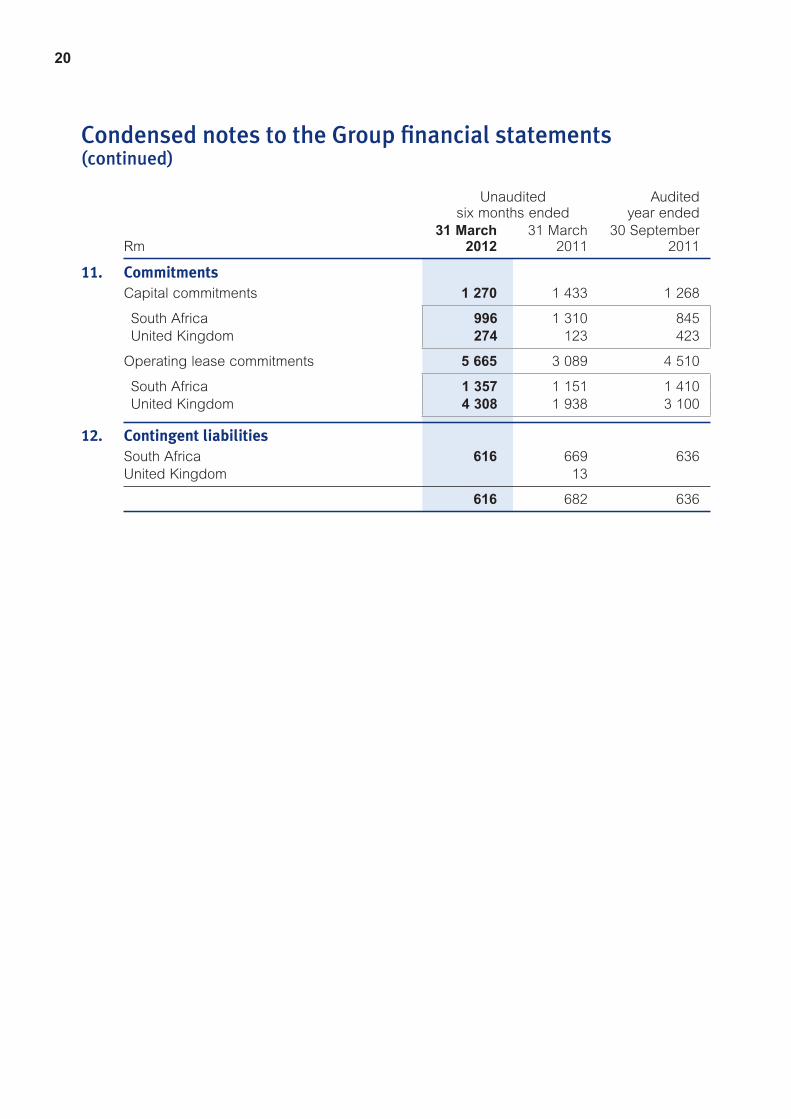
11. CommitmentsCapital commitments 1 270 1 433 1 268
South Africa 996 1 310 845 United Kingdom 274 123 423
Operating lease commitments 5 665 3 089 4 510
South Africa 1 357 1 151 1 410 United Kingdom 4 308 1 938 3 100
12. Contingent liabilitiesSouth Africa 616 669 636 United Kingdom 13
616 682 636
Netcare Limited
Unaudited Group interim results for the six months ended 31 March 2012 21
Condensed segment report
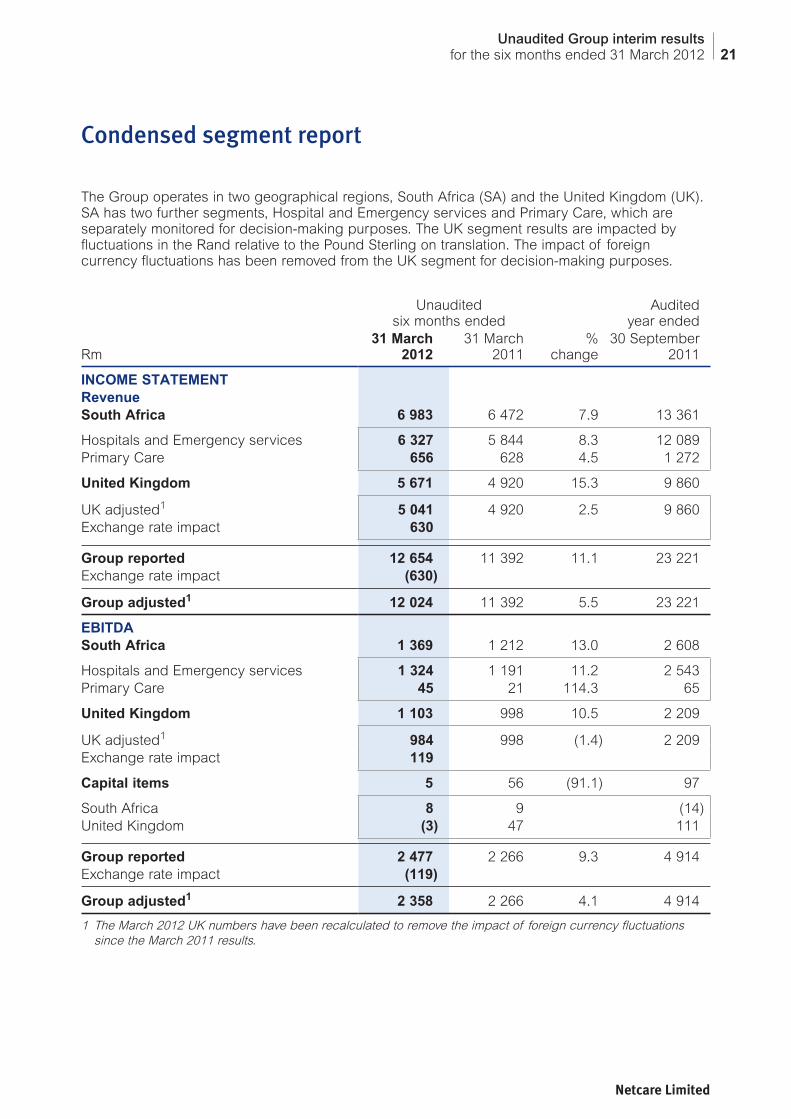
The Group operates in two geographical regions, South Africa (SA) and the United Kingdom (UK). SA has two further segments, Hospital and Emergency services and Primary Care, which are separately monitored for decision-making purposes. The UK segment results are impacted by fluctuations in the Rand relative to the Pound Sterling on translation. The impact of foreign currency fluctuations has been removed from the UK segment for decision-making purposes.
Rm
Unauditedsix months ended
% change
Auditedyear ended
31 March2012
31 March2011
30 September2011
INCOME STATEMENT
Revenue South Africa 6 983 6 472 7.9 13 361
Hospitals and Emergency services 6 327 5 844 8.3 12 089 Primary Care 656 628 4.5 1 272
United Kingdom 5 671 4 920 15.3 9 860
UK adjusted1 5 041 4 920 2.5 9 860 Exchange rate impact 630
Group reported 12 654 11 392 11.1 23 221 Exchange rate impact (630)
Group adjusted1 12 024 11 392 5.5 23 221
EBITDA
South Africa 1 369 1 212 13.0 2 608
Hospitals and Emergency services 1 324 1 191 11.2 2 543 Primary Care 45 21 114.3 65
United Kingdom 1 103 998 10.5 2 209
UK adjusted1 984 998 (1.4) 2 209 Exchange rate impact 119
Capital items 5 56 (91.1) 97
South Africa 8 9 (14)United Kingdom (3) 47 111
Group reported 2 477 2 266 9.3 4 914 Exchange rate impact (119)
Group adjusted1 2 358 2 266 4.1 4 914
1 The March 2012 UK numbers have been recalculated to remove the impact of foreign currency fluctuations since the March 2011 results.

22
Condensed segment report (continued)
Rm
Unauditedsix months ended
% change
Auditedyear ended
31 March2012
31 March2011
30 September2011
Operating profit
South Africa 1 145 1 021 12.1 2 220
Hospitals and Emergency services 1 114 1 013 10.0 2 182 Primary Care 31 8 287.5 38
United Kingdom 668 621 7.6 1 384
UK adjusted1 598 621 (3.7) 1 384 Exchange rate impact 70
Capital items 5 56 (91.1) 97
South Africa 8 9 (14)United Kingdom (3) 47 111
Group reported 1 818 1 698 7.1 3 701 Exchange rate impact (70)
Group adjusted1 1 748 1 698 2.9 3 701
Net interest expense
South Africa 98 162 39.5 327 United Kingdom 782 716 (9.2) 1 405
UK adjusted1 693 716 3.2 1 405 Exchange rate impact 89
Group reported 880 878 (0.2) 1 732 Exchange rate impact (89)
Group adjusted1 791 878 9.9 1 732
1 The March 2012 UK numbers have been recalculated to remove the impact of foreign currency fluctuations since the March 2011 results.

Netcare Limited
Unaudited Group interim results for the six months ended 31 March 2012 23
Rm
Unaudited%
change
Audited31 March
201231 March
201130 September
2011
STATEMENT OF FINANCIAL POSITION
Total assets2
South Africa 10 969 9 395 16.8 10 262 United Kingdom 39 337 34 614 13.6 40 402
UK adjusted1 34 832 34 614 0.6 40 402 Exchange rate impact (4 505)
Group reported 50 306 44 009 14.3 50 664 Exchange rate impact 4 505
Group adjusted1 45 801 44 009 4.1 50 664
Debt net of cash
South Africa 4 218 3 713 (13.6) 3 303 United Kingdom 21 756 20 125 (8.1) 22 386
UK adjusted1 19 264 20 125 4.3 22 386 Exchange rate impact 2 492
Group reported 25 974 23 838 (9.0) 25 689 Exchange rate impact (2 492)
Group adjusted1 23 482 23 838 1.5 25 689
1 The March 2012 UK numbers have been recalculated to remove the impact of foreign currency fluctuations since the March 2011 results.
2 Restated refer to note 2.
Salient features
Unaudited Audited31 March
2012 31 March
2011 30 September
2011
Share statistics
Ordinary sharesShares in issue (million) 1 448 1 441 1 446 Shares in issue net of treasury shares (million) 1 306 1 277 1 295 Weighted average number of shares (million) 1 303 1 279 1 286 Diluted weighted average number of shares (million) 1 321 1 318 1 317 Market price per share (cents) 1 423 1 450 1 305
Currency conversion guide (R:£)
Closing exchange rate 12.25 10.85 12.54 Average exchange rate for the period 12.42 11.02 11.09

Netcare Limited (“Netcare”, “the Company” or “the Group”)
Registration number: 1996/008242/06 (Incorporated in the Republic of South Africa)
JSE share code: NTC
ISIN code: ZAE000011953
����������� ���76 Maude Street (corner West Street), Sandton 2196, Private Bag X34, Benmore 2010
Executive directors: RH Friedland (Chief Executive Officer)KN Gibson (Chief Financial Officer)
Non-executive directors:SJ Vilakazi (Chairman)T BrewerAPH JammineJM KahnMJ KuscusHR LevinKD MorokaN Weltman
Company Secretary: L Bagwandeen
Sponsor: Nedbank Capital, a division of Nedbank Group Limited
Transfer secretaries: Link Market Services South Africa (Proprietary) Limited, 13th Floor, Rennie House, 19 Ameshoff Street, Braamfontein 2001
Investor relations: [email protected]
AdministrationDisclaimerNetcare has acted in good faith and has made every reasonable effort to ensure the accuracy and completeness of the information contained in this presentation, including all information that may be defined as ‘forward-looking statements’.
Forward-looking statements may be identified by words such as ‘believe’, ‘anticipate’, ‘expect’, ‘plan’,’estimate’, ‘intend’, ‘project’, ‘target’, ‘predict’ and ‘hope’. By their nature, forward-looking statements are inherently predictive, speculative and involve risk and uncertainty because they relate to events and depend on circumstances that will occur in the future, involve known and unknown risks, uncertainties and other facts or factors which may cause the actual results, performance or achievements of the Group, or its sector to be materially different from any results, performance or achievement expressed or implied by such forward-looking statements. Forward-looking statements are not guarantees of future performance and are based on assumptions regarding the Group’s present and future business strategies and the environments in which it operates now and in the future. No assurance can be given that forward-looking statements will prove to be correct and undue reliance should not be placed on such statements.
Netcare does not undertake to update any forward-looking statements contained in this document and does not assume responsibility for any loss or damage whatsoever and howsoever arising as a result of the reliance by any party thereon.