
NetApp OnCommand Unified Manager Reporting for ONTAP · The application server in OnCommand Unified...
62
Technical Report NetApp OnCommand Unified Manager Reporting for ONTAP Dhiman Chakraborty, NetApp February 2018 | TR-4565 Version 1.1 Abstract This technical report describes the reporting features introduced with NetApp ® OnCommand ® Unified Manager 6.2 for NetApp ONTAP ® management software. Instructions are provided for implementing this capability in OnCommand 6.3 through 7.3 and how to create and manage custom reports, including how to export and import external reports. This report also provides examples and reference information for creating native and custom reports within OnCommand Unified Manager installations.
Transcript of NetApp OnCommand Unified Manager Reporting for ONTAP · The application server in OnCommand Unified...

Technical Report
NetApp OnCommand Unified Manager Reporting for ONTAP Dhiman Chakraborty, NetApp February 2018 | TR-4565
Version 1.1
Abstract
This technical report describes the reporting features introduced with NetApp® OnCommand® Unified Manager 6.2 for NetApp ONTAP® management software. Instructions are provided for implementing this capability in OnCommand 6.3 through 7.3 and how to create and manage custom reports, including how to export and import external reports. This report also provides examples and reference information for creating native and custom reports within OnCommand Unified Manager installations.

2 OnCommand Unified Manager Reporting for NetApp ONTAP
© 2018 NetApp, Inc. All rights reserved. © 2016 NetApp, Inc. All rights reserved.
TABLE OF CONTENTS
1 Purpose.............................................................................................................................. 4
2 Glossary of Terminology ..................................................................................................... 4
3 Introduction ........................................................................................................................ 5
4 Reporting Feature Overview ................................................................................................ 5
4.1 OnCommand Unif ied Manager Report Features .................................................................................................6
5 Architecture Overview ......................................................................................................... 7
5.1 OnCommand Unif ied Manager Reporting Under the Hood .................................................................................7
6 Granular Reporting with Annotations ................................................................................... 8
6.1 Annotation ..............................................................................................................................................................8
6.2 Create Annotations ................................................................................................................................................9
7 Reporting Dashboard ........................................................................................................ 12
7.1 Reporting Functions .............................................................................................................................................12
7.2 Enhance Standard Reports .................................................................................................................................14
8 Custom Reports ................................................................................................................ 24
8.1 Softw are Requirements .......................................................................................................................................24
8.2 Ec lipse Prerequisites ...........................................................................................................................................25
8.3 Creating Custom Reports w ith Eclipse ...............................................................................................................26
8.4 Expanded Customization Using Format and Style ............................................................................................36
9 Portability of Custom Reports ............................................................................................ 38
9.1 Connection Profile................................................................................................................................................38
9.2 Creating a Connection Profile .............................................................................................................................39
9.3 Creating Reports Using Connection Profile ........................................................................................................41
10 Importing Custom Reports................................................................................................. 48
10.1 Importing Custom Reports in OnCommand Unif ied Manager 7.x .....................................................................48
10.2 Importing Custom Reports in OnCommand Unif ied Manager 6.x .....................................................................49
11 What’s new with Unified Manager 7.3 ................................................................................. 51
11.1 Database Schemas exposed w ith Unif ied Manager 7.3 ....................................................................................51
11.2 Prerequisites ........................................................................................................................................................51
11.3 Exposed Schemas ...............................................................................................................................................51
12 Different ways to extract data from Unified Manager 7.3 ...................................................... 52
12.1 BIRT......................................................................................................................................................................52

3 OnCommand Unified Manager Reporting for NetApp ONTAP
© 2018 NetApp, Inc. All rights reserved. © 2016 NetApp, Inc. All rights reserved.
12.2 Open Database ....................................................................................................................................................52
12.3 Export data directly from Unif ied Manager GUI .................................................................................................52
13 Frequently asked questions ............................................................................................... 60
References ............................................................................................................................. 60
Version History....................................................................................................................... 61
LIST OF TABLES
Table 1) Technical Report Terminology ................................................................................................................................4
LIST OF FIGURES
Figure 1) Annotation enhances the reporting capabilities of Unif ied Manager. ..................................................................5
Figure 2) Unif ied Manager extends annotation enhancements. ..........................................................................................6
Figure 3) OnCommand Unif ied Manager reporting architecture .........................................................................................8
Figure 4) OnCommand Unif ied Manager Reports dashboard ...........................................................................................12
Figure 5) Sample of standard data protection reports........................................................................................................13
Figure 6) Unif ied Manager Reports page ............................................................................................................................13
Figure 7) Example of report scheduling process ................................................................................................................14
Figure 8) Customize reports w ith the Enable Interactivity function ...................................................................................15
Figure 9) Options for customizing reports ...........................................................................................................................15
Figure 10) Example of custom condit ional formatting. .......................................................................................................24
Figure 11) Workflow to create custom report w ith Eclipse .................................................................................................26
Figure 12) Drag-and-drop f ields from the dataset to create tables....................................................................................37
Figure 13) Create charts using functions in the Palette tab ...............................................................................................37
Figure 14) Format fonts and captions for charts created ...................................................................................................38
Figure 15) Schemas that are exposed to the user .............................................................................................................51

4 OnCommand Unified Manager Reporting for NetApp ONTAP
© 2018 NetApp, Inc. All rights reserved. © 2016 NetApp, Inc. All rights reserved.
1 Purpose
This document is designed to help OnCommand Unified Manager administrators and storage administrators effectively use the reporting and custom reporting functionalities in Unified Manager versions 6.3 through 7.x.
Note: We worked with Eclipse, an open-source integrated development environment (IDE), for the custom reports in this documentation.
Note:
All Unified Manager releases through UM 7.0 have reached End of Version Support (EVOS). Please check the Software Version Support page for supported Unified Manager releases.
2 Glossary of Terminology
Table 1) Technical Report Terminology
Acronym Description
BIRT Business intelligence reporting tool from OpenText; the embedded reporting engine in OnCommand Unified Manager
Eclipse Open-source IDE used to create report definitions for BIRT
IDE Integrated development environment
FQDN Fully qualified domain name
REST Representational state transfer
SVM Storage virtual machine
.war
Web application archive

5 OnCommand Unified Manager Reporting for NetApp ONTAP
© 2018 NetApp, Inc. All rights reserved. © 2016 NetApp, Inc. All rights reserved.
3 Introduction
An IT environment requires the accurate and comprehensive reporting of its assets to optimize operations and improve asset use. These reports can be informational, for measuring storage and capacityinformation, or for administrative purposes. As the number of reports increases, so does the complexity of the reporting process.
4 Reporting Feature Overview
Unified Manager provides a reporting feature that includes a library of standard reports about the underlying NetApp storage infrastructure. With these reports, administrators can easily obtain the information that they need to effectively manage their NetApp FAS and All Flash FAS systems. If preferred, administrators can customize reports to capture only the desired data objects with the extended reporting capabilities in Unified Manager.
Unified Manager further extends the custom reporting capabilities with the addition of annotation tables. With this capability, administrators can simplify the process of customizing reports with the ability to expose annotation tables as a database view.
Unified Manager extended custom reporting capabilities.
• Enable both the aggregate and the volume history to be exposed as a database view, facilitating custom reports to capture capacity utilization metrics
• Expose protection relationships as database views for users to build custom reports, as shown in Figure 2
• Import custom reports without table elements in the report design (see Section 9: Portability of
(Custom) Reports for details)
Figure 1) Annotation enhances the reporting capabilities of Unified Manager.

6 OnCommand Unified Manager Reporting for NetApp ONTAP
© 2018 NetApp, Inc. All rights reserved. © 2016 NetApp, Inc. All rights reserved.
Note: The annotations and history options displayed above are not currently available with standard reports.
4.1 OnCommand Unified Manager Report Features
OnCommand Unified Manager reports provide storage visibility and analytics for NetApp FAS and All Flash FAS. Operating as agentless browser-based software, Unified Manager reports allow administrators to create extensive reports on:
• Operations management. Events, severity, and status trend charts
• Capacity. Storage summary, aggregate, volume, qtree
• Inventory. Cluster, storage virtual machine (SVM), volumes
• Protection relationships
With the Unified Manager reporting feature, administrators can:
• Customize core reports for additional use cases:
Group, filter, sort, add compute fields, hide, and delete at the column level (for each column) in the report.
Get hints to customize the preceding list of additional use cases.
• Export and import report definitions to enable sharing of information.
• Schedule and share reports; view reports in PDF, CSV, XLS, HTML, or TXT format.
• Group storage resources with a single identifier for analysis and reporting; for example, by business function or by application.
• Make full use of Eclipse, a third-party tool, to create custom, comprehensive reports that can be
imported to import Unified Manager as a design template.
Figure 2) Unified Manager extends annotation enhancements.

7 OnCommand Unified Manager Reporting for NetApp ONTAP
© 2018 NetApp, Inc. All rights reserved. © 2016 NetApp, Inc. All rights reserved.
5 Architecture Overview
OnCommand Unified Manager 6.x ships with standard reports in the following categories:
• Capacity utilization
• Operational
• Inventory
• Data protection
In addition, users can create custom reports or support third-party reports with the OpenText BIRT component. An integrated development environment (IDE) connects to the Unified Manager database over port 3306 by using a MySQL Java Database Connectivity (JDBC) driver. Users can interact to view reports online (in real time), offline through sharing or exporting, or through scheduling of standard and imported reports.
Note: Although this technical report provides guidance on creating custom reports from available IDEs, NetApp does not support issues that users might incur with the custom reports that are created. The creation, management, and maintenance of custom reports are the responsibility of the customer.
A database has been added to the Unified Manager server (ocum_report). It is accessible by users who have been defined with a report schema role. The database provides wrapper views to imported reports that are created by using Eclipse. BIRT uses various customized feature-rich REST APIs for background tasks: share, schedule, and import reports created from IDEs.
5.1 OnCommand Unified Manager Reporting Architecture
The application server in OnCommand Unified Manager comes with two main application archive (WAR) files:
• dfm-app.war contains UM content.
• dfm-report-app.war is a wrapper over the third-party Actuate BIRT component; the WAR file contains canned report designs.

8 OnCommand Unified Manager Reporting for NetApp ONTAP
© 2018 NetApp, Inc. All rights reserved. © 2016 NetApp, Inc. All rights reserved.
In addition, an intermediate dfm-report.war is available to help port to the OnCommand product
foundation.
6 Granular Reporting with Annotations
6.1 Annotation
With annotation, users can tie SVMs, volumes, and clusters into a single group for better manageability. An annotation is a combination of a name-value pair that can be applied to storage objects in NetApp ONTAP—clusters, SVMs, and volumes—using user-defined rules. With this capability, users can create storage tags that can be used for reporting and administration of storage objects linked to that tag.
An annotation name refers to the metadata that is associated with storage objects. And storage objects can be associated with one or more unique annotation names. Examples of an annotation include an application, a data center, and a business unit.
Figure 3) OnCommand Unified Manager reporting architecture

9 OnCommand Unified Manager Reporting for NetApp ONTAP
© 2018 NetApp, Inc. All rights reserved. © 2016 NetApp, Inc. All rights reserved.
An annotation value is the value associated with an annotation name, such as:
Data Center = New York, Application = Exchange, Business Unit = Finance
With OnCommand Unified Manager 6.4 and later, users can create custom annotations by applying rules to augment supported storage objects—clusters, SVMs, and volumes. The following conditions hold true for annotation association:
• A given storage object can associate any number of annotation labels with it.
• A storage object can have only one annotation value for a given annotation name.
6.2 Create Annotations
To create an annotation, use the following procedure:
1. Log in to Unified Manager as the OnCommand administrator.
2. Navigate to Administration Manage Annotations.
In the Manage Annotations window, click Add Annotation.

10 OnCommand Unified Manager Reporting for NetApp ONTAP
© 2018 NetApp, Inc. All rights reserved. © 2016 NetApp, Inc. All rights reserved.
3. On the Add Annotation screen, enter:
• The annotation name
• A description of the annotation
Click Save and Close.
4. Add values to the annotation:
• Click Add.
• Enter the value name for tagging.
• Click Add to save.

11 OnCommand Unified Manager Reporting for NetApp ONTAP
© 2018 NetApp, Inc. All rights reserved. © 2016 NetApp, Inc. All rights reserved.
5. Define the annotation value conditions with rule definitions. Doing so associates all storage objects matching the annotation “Application” and the value “Exchange.”
To complete Step5, follow these stepsm as shown in the previous screenshot:
1. Click Annotation Rules to open the Annotation Rule window.
2. Enter the name of the rule.
3. Associate the rule to a storage object type from the drop-down menu.
4. Associate the rule to the annotation name created earlier.
5. Select the value to which to attach this rule.
6, 7, 8. Create filtering definitions to augment storage objects to this value (Additional conditions can be included for advanced filtering.).
9. Review the definitions, click Save and Add, and close the window.

12 OnCommand Unified Manager Reporting for NetApp ONTAP
© 2018 NetApp, Inc. All rights reserved. © 2016 NetApp, Inc. All rights reserved.
7 Reporting Dashboard
The reporting dashboard is the main page on which reports are categorized and listed:
• Capacity utilization
• Operational reports
• Inventory reports
• Data protection reports
• Imported reports
To navigate to the reporting dashboard, click the Reports tab at the top navigation bar.
The first four categories contain standard reports. To view the reports available within a category, click “+”. Each of these reports can be customized as described in Section 7.2 Enhance Standard Reports.
In addition, imported reports can also be customized using Eclipse (free license open-source report designer) or the OpenText Actuate Analytics Designer (free commercial-grade designer). To customize imported reports, the BIRT reporting engine must be installed on the system. See Section 8 Custom Reports for more information.
7.1 Reporting Functions
The reporting function in OnCommand Unified Manager provides a comprehensive view of all NetApp ONTAP devices in the environment. This view assists administrators with operational tasks such as capacity and operations management. With this capability, users can perform the following reporting functions:
• View reports under the reporting categories listed in the dashboard, as mentioned earlier.
• Run a report.
• Schedule a report.
• Customize standard reports.
• Import a report using the third-party Eclipse designer tool.
Figure 4) OnCommand Unified Manager Reports dashboard

13 OnCommand Unified Manager Reporting for NetApp ONTAP
© 2018 NetApp, Inc. All rights reserved. © 2016 NetApp, Inc. All rights reserved.
View Reports
Each of the reporting categories can be expanded to view the specific reporting capabilities available. For example, the following standard reports are available within the Data Protection category.
Run a Report
To run a report, expand the category, then click the Run Report button next to the desired report to open - the Report Details page.
Schedule a Report
The scheduling feature allows you to define the specific time to run a report, with the ability to automatically send to administrators and other recipients by email. A variety of formats is supported, including PDF, HTML, CSV, Excel, and so on.
Figure 5) Sample of standard data protection reports
Figure 6) Unified Manager Reports page

14 OnCommand Unified Manager Reporting for NetApp ONTAP
© 2018 NetApp, Inc. All rights reserved. © 2016 NetApp, Inc. All rights reserved.
To schedule a report, go to the individual report summary page. Click Manage Report Schedules and complete the following fields, as shown in Figure 7:
1. Schedule Name
2. Recipient Email Address
3. Report Format
4. Frequency (of the reporting intervals)
5. Date and Time
6. Report Category
7. Select Available Reports
8. Click + to add to the Schedule
9. Click Save to complete the Task
Note: Use the drag-and-drop feature to add specific fields within the schedule.
7.2 Enhance Standard Reports
You can further customize standard reports in the native UI by selecting the specific reporting fields that you want to include in your report. To customize a report, first select Enable Interactivity on the report, as shown in Figure 8.
Note: This choice is enabled by default.
Figure 7) Example of report scheduling process

15 OnCommand Unified Manager Reporting for NetApp ONTAP
© 2018 NetApp, Inc. All rights reserved. © 2016 NetApp, Inc. All rights reserved.
.
Once interactivity has been enabled, you can customize your report to sort, filter, or delete a row or a column from the report. When the customization is complete, you can save the modified report for future reference or schedule it to run on a regular basis.
To customize a standard report, click any of the columns, as shown in Figure 9, to explore the available features.
Figure 8) Customize reports with the Enable Interactivity function
Figure 9) Options for customizing reports

16 OnCommand Unified Manager Reporting for NetApp ONTAP
© 2018 NetApp, Inc. All rights reserved. © 2016 NetApp, Inc. All rights reserved.
Enhance Standard Reports Example 1
This example describes the process to customize a report that highlights all volumes in the data center that exceeded the Space Full Threshold. From the Report: Aggregate Capacity and Utilization page, as shown in the following screenshot, click Run Report. Then perform the following steps to get your desired report:
1) To remove grouping by cluster or HA pair, follow these steps:
a) Click the column to be ungrouped (in this case, the Cluster and HA Pair columns)
b) Click.
c) Select Group Delete Inner Group.
2) To display the difference between Space Full Threshold % and Available Data %, add a new column, as shown in the following screenshot
a) Select the column and click.
b) Select Column New Computed Column.
c) In the New Computed Column dialog box, enter a column label.
d) From the Select Category list, select Math.
e) From the Select Function list, select DIFFERENCE.
f) From the Column 1 list, select Space Full Threshold (%).
g) From the Column 2 list, select Used Data (%).
h) Click OK.

17 OnCommand Unified Manager Reporting for NetApp ONTAP
© 2018 NetApp, Inc. All rights reserved. © 2016 NetApp, Inc. All rights reserved.
3) To filter values greater than 0 in the new column, click the New Computed column and then click to open Filter dialog box.
4) From the Condition drop-down list, select Greater Than.
5) In the Value field, enter 0 and click OK.
6) To sort the values, click the New Computed column and then click
7) Select Filter Top/Bottom N.
8) In the Top/Bottom N dialog box, select Top N from the Filter field and enter a value in the text field.
9) Click OK.

18 OnCommand Unified Manager Reporting for NetApp ONTAP
© 2018 NetApp, Inc. All rights reserved. © 2016 NetApp, Inc. All rights reserved.
The following screenshot shows the new report that now includes the volumes that breached the Space Full Threshold. Save this report with a new name to differentiate it from the standard report included in the OnCommand Unified Manager library.
Similarly, you can customize multiple reports from the standard reports to suit your specific requirements. The following are typical scenarios that you can customize:
a) Listing top aggregates that are reaching their full capacity
b) Listing aggregates with overcommitted threshold breached
c) Listing NetApp SnapLock® compliance volumes
d) Top qtrees that breached soft limits
e) Listing events with a severity type
f) Listing most critical events
g) Listing nodes that are breaching the maximum nodes limit
h) Listing volumes with inaccessible junction paths
i) Listing volumes with default export policy
j) Data protection reports based on schedules on which they are run
k) Data protection volumes grouped by the timelines by which they are triggered, etc.
l) … and many more.

19 OnCommand Unified Manager Reporting for NetApp ONTAP
© 2018 NetApp, Inc. All rights reserved. © 2016 NetApp, Inc. All rights reserved.
Enhance Standard Reports Example 2
This example describes the process to create a simple volume report using filtering to select volumes that reached 85% to 95% of capacity. The following steps show how to use color in contextual formatting and in removing the grouping from the standard report:
1) Go to the Reports tab and run the following report:
2) Doing so takes you to the report:
3) To remove a grouping by cluster or HA pair and SVM(s), perform the following steps on the Cluster and Storage Virtual Machine columns:
a) Click in the column to be ungrouped (the Cluster and Storage Virtual Machine columns in this case)
b) Click
c) Select Group Delete Inner Group.

20 OnCommand Unified Manager Reporting for NetApp ONTAP
© 2018 NetApp, Inc. All rights reserved. © 2016 NetApp, Inc. All rights reserved.
4) Delete all the columns you want to remove from the report:
5) The report now displays the cluster and SVM information and the required fields .

21 OnCommand Unified Manager Reporting for NetApp ONTAP
© 2018 NetApp, Inc. All rights reserved. © 2016 NetApp, Inc. All rights reserved.
6) Perform the following steps to create conditional filtering on the Used Data% column:
7) On the conditional formatting window, select Column Name, Condition, and Value (for used data %):
22 OnCommand Unified Manager Reporting for NetApp ONTAP
© 2018 NetApp, Inc. All rights reserved. © 2016 NetApp, Inc. All rights reserved.
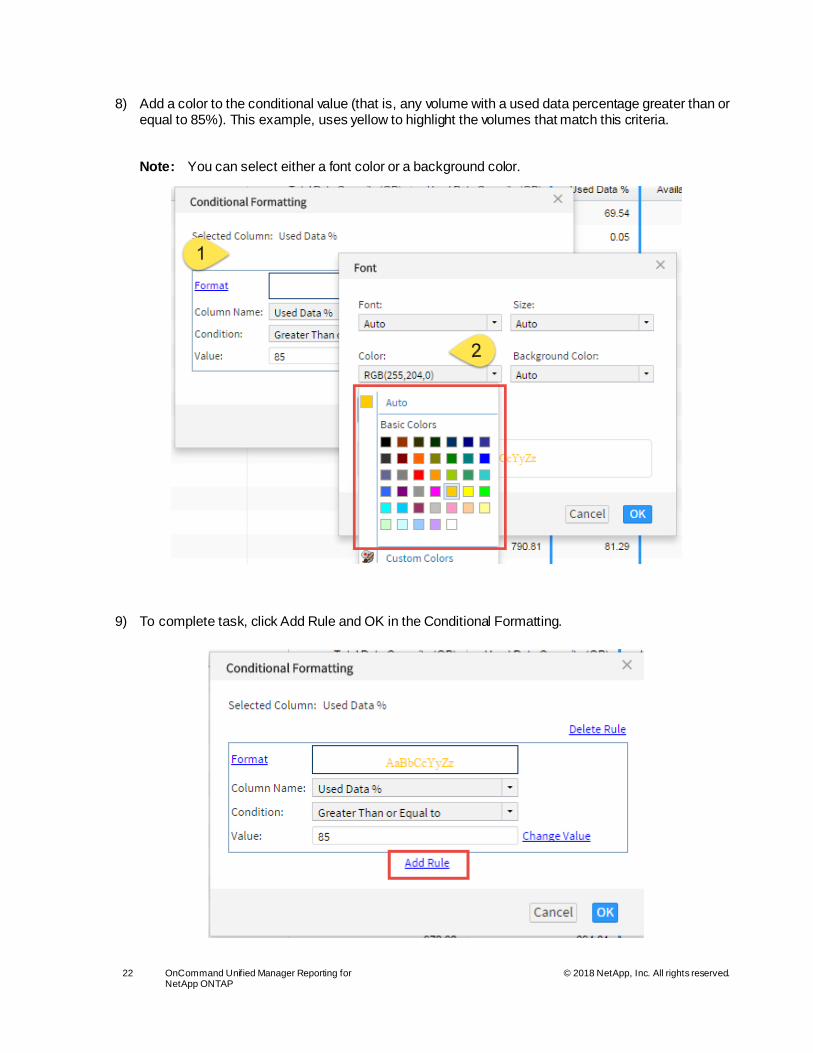
8) Add a color to the conditional value (that is, any volume with a used data percentage greater than or equal to 85%). This example, uses yellow to highlight the volumes that match this criteria.
Note: You can select either a font color or a background color.
9) To complete task, click Add Rule and OK in the Conditional Formatting.

23 OnCommand Unified Manager Reporting for NetApp ONTAP
© 2018 NetApp, Inc. All rights reserved. © 2016 NetApp, Inc. All rights reserved.
10) If you want to create additional rules, repeat steps 7 and 8 with the condition “Greater Than or Equal to 95%” and add red to this value, as shown in step 9.
Click OK to complete all the steps.
Note: The values in the example are differentiated by background color.
11) Figure 10 shows the report with the selected color-coded values for Used Data %.
Note:
• The example uses yellow for values >=75% and red for values >=85%. You can customize these colors and percentages to suit your requirements.
• You can save the report with a new name, schedule the report, or export the new report to an email address, as explained earlier.

24 OnCommand Unified Manager Reporting for NetApp ONTAP
© 2018 NetApp, Inc. All rights reserved. © 2016 NetApp, Inc. All rights reserved.
8 Custom Reports
To build a new custom report, you need the following:
• A fully operational OnCommand Unified Manager server
• An Eclipse-based tool installed on a separate system to design reports using simple SQL queries
8.1 Software Requirements
To produce feature-rich custom reports, you can apply the open-source Eclipse tool or the OpenText Actuate Analytics Designer.
To install the Eclipse tool, use either of these links:
• Eclipse IDE for Java and report developers: http://www.eclipse.org/downloads/packages/eclipse-ide-java-and-report-developers/marsr
• “All-in-one” package: http://download.eclipse.org/birt/downloads/
Note: Eclipse can be installed on Windows, Mac OS X, and Linux operating systems. To set up and configure the designer of your choice, follow the installation instructions for the software.
To download the OpenText Actuate Analytics Designer, go to:
• http://birt.actuate.com/products/analytics-designers/analytics-designer
Figure 10) Example of custom conditional formatting.

25 OnCommand Unified Manager Reporting for NetApp ONTAP
© 2018 NetApp, Inc. All rights reserved. © 2016 NetApp, Inc. All rights reserved.
Note: The Eclipse tool is an open source free IDE. If you prefer the professional version, you need to procure the license yourself. For Unified Manager reporting, the open source version satisfies most of your needs.
8.2 Eclipse Prerequisites
Eclipse requires a connection to the Unified Manager database, using Port 3306 to connect through a JDBC connector and a database user for authorization.
To create a database user in the Unified Manager server:
1. Log in to Unified Manager as the OnCommand administrator.
2. Navigate to Administration Manage Users.
3. Click Add and add a database user with Report Schema as the role definition.
26 OnCommand Unified Manager Reporting for NetApp ONTAP
© 2018 NetApp, Inc. All rights reserved. © 2016 NetApp, Inc. All rights reserved.
8.3 Creating Custom Reports with Eclipse
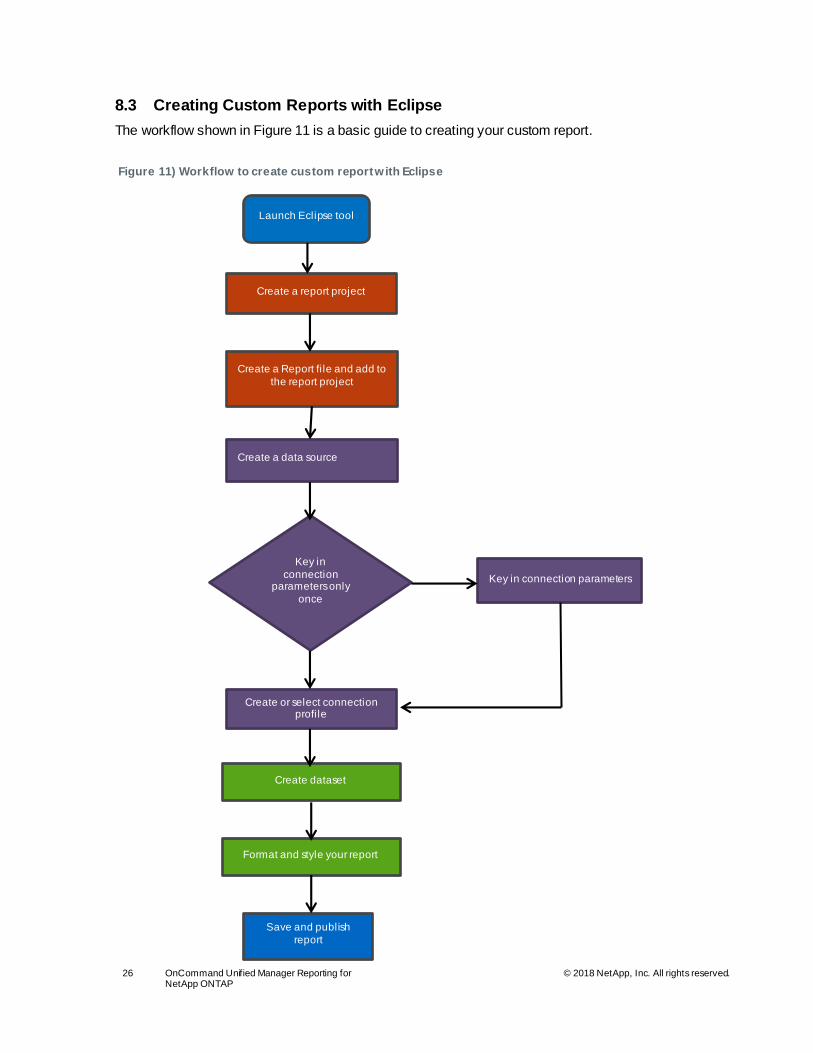
The workflow shown in Figure 11 is a basic guide to creating your custom report.
Launch Eclipse tool
Create a report project
Create a Report fi le and add to
the report project
Create a data source
Key in
connection parameters only
once
Key in connection parameters
Create or select connection profile
Create dataset
Format and style your report
Save and publish
report
Figure 11) Workflow to create custom report w ith Eclipse

27 OnCommand Unified Manager Reporting for NetApp ONTAP
© 2018 NetApp, Inc. All rights reserved. © 2016 NetApp, Inc. All rights reserved.
Create a Report Project
The following steps describe how to create a new report using Windows after Eclipse is set up on a separate system (as described in Section 8.1 Software Requirements). The Linux and Mac OS X versions follow similar procedures.
1. Log in to the system that is hosting Eclipse and open the application.
2. Change the view to the Report Design perspective. Select Window Open Perspective Report
Design.

28 OnCommand Unified Manager Reporting for NetApp ONTAP
© 2018 NetApp, Inc. All rights reserved. © 2016 NetApp, Inc. All rights reserved.
3. To create a new project, navigate to File New Project. The following screen appears.
4. In the wizard, click New Report Project and click Next.

29 OnCommand Unified Manager Reporting for NetApp ONTAP
© 2018 NetApp, Inc. All rights reserved. © 2016 NetApp, Inc. All rights reserved.
5. On the Eclipse launch page, create a new project. Navigate to New Project Report Project and then click Next. Provide a name for the project and click Finish.
6. Provide a new name for the project and then click Finish. Either use the default location for storing your reports or specify the desired location by deselecting the checkbox.

30 OnCommand Unified Manager Reporting for NetApp ONTAP
© 2018 NetApp, Inc. All rights reserved. © 2016 NetApp, Inc. All rights reserved.
Create a Report File
1. To create a new report under a project, click File New Report.
Alternatively, right-click the new project and select New Report.

31 OnCommand Unified Manager Reporting for NetApp ONTAP
© 2018 NetApp, Inc. All rights reserved. © 2016 NetApp, Inc. All rights reserved.
2. Select the report project name to store your report. For this demo, we selected Demo Project, as
created in the previous section. Provide a name for the new report and click Next.
3. The next page of the New Report dialog box presents a selection of report templates. Select the type of template to create and then click Finish.

32 OnCommand Unified Manager Reporting for NetApp ONTAP
© 2018 NetApp, Inc. All rights reserved. © 2016 NetApp, Inc. All rights reserved.
Create a Data Source
BIRT reports use a data source element to connect to the OnCommand Unified Manager database and to query and retrieve data from the data provider.
1. Open the Data Explorer view.
2. Select the Data Source node from the tree. Right-click Data Source and select New Data Source from the drop-down menu:
3. Select Create from a Data Source Type in the Following List and then select JDBC Data Source from the drop-down menu. Enter a name in the Data Source Name field. Click Next.
33 OnCommand Unified Manager Reporting for NetApp ONTAP
© 2018 NetApp, Inc. All rights reserved. © 2016 NetApp, Inc. All rights reserved.
Note: If you already created a connection profile, you can select Create from a Connection Profile in the Profile Store. For details about the benefits and use of a connection profile, see Section 9.1 Connection Profile.
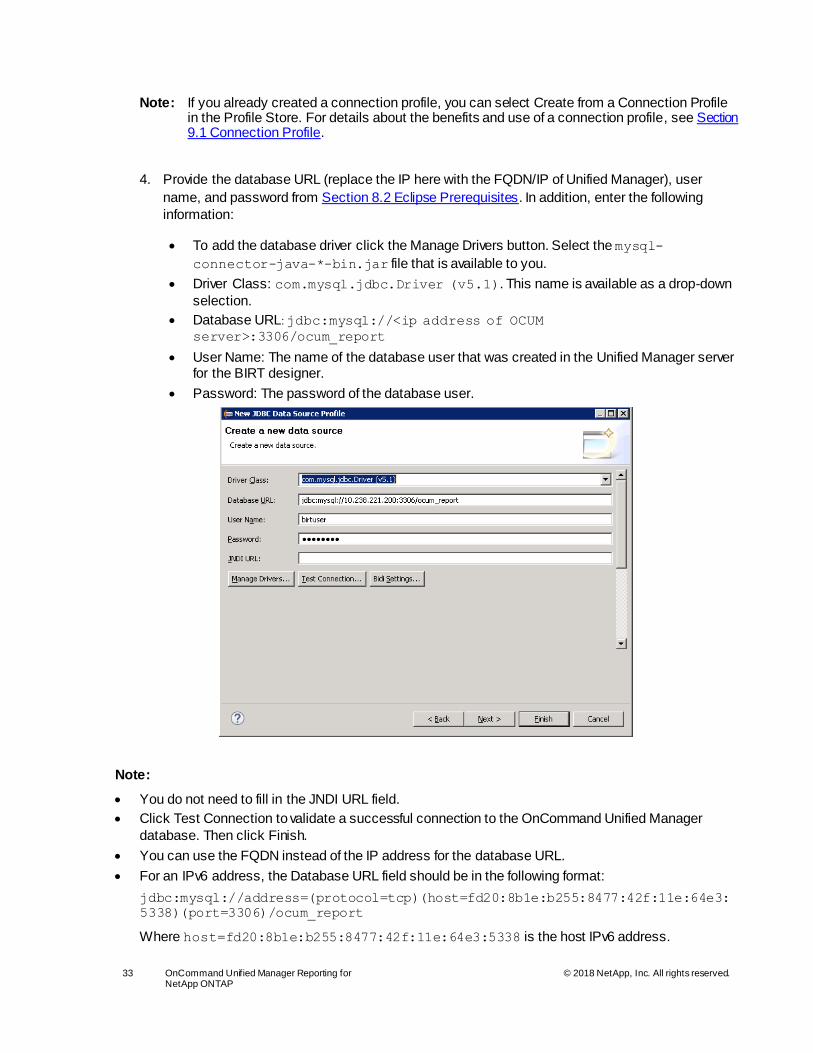
4. Provide the database URL (replace the IP here with the FQDN/IP of Unified Manager), user
name, and password from Section 8.2 Eclipse Prerequisites. In addition, enter the following
information:
• To add the database driver click the Manage Drivers button. Select the mysql-
connector-java-*-bin.jar file that is available to you.
• Driver Class: com.mysql.jdbc.Driver (v5.1). This name is available as a drop-down
selection.
• Database URL: jdbc:mysql://<ip address of OCUM
server>:3306/ocum_report
• User Name: The name of the database user that was created in the Unified Manager server for the BIRT designer.
• Password: The password of the database user.
Note:
• You do not need to fill in the JNDI URL field.
• Click Test Connection to validate a successful connection to the OnCommand Unified Manager
database. Then click Finish.
• You can use the FQDN instead of the IP address for the database URL.
• For an IPv6 address, the Database URL field should be in the following format:
jdbc:mysql://address=(protocol=tcp)(host=fd20:8b1e:b255:8477:42f:11e:64e3:
5338)(port=3306)/ocum_report
Where host=fd20:8b1e:b255:8477:42f:11e:64e3:5338 is the host IPv6 address.

34 OnCommand Unified Manager Reporting for NetApp ONTAP
© 2018 NetApp, Inc. All rights reserved. © 2016 NetApp, Inc. All rights reserved.
Create a Dataset
With the database connection established between the Eclipse designer and the OnCommand Unified Manager database, you are ready to create the report logic. The report logic is created in the Eclipse editor by using simple SQL queries. Advanced users can use MySQL Workbench to create queries and paste in the Eclipse dataset.
The following steps guide you through creating a dataset and SQL queries:
1. Navigate to Data Explorer Data Set and click New Data Set.
2. Select the data source created in the earlier section and then:
a. Select SQL Select Query from the Data Set Type drop-down menu.
b. Enter a name under Data Set Name.
c. Click Next.
3. In SQL query window that opens, define a SQL query for the report that you want to produce. To create a query, use the fields from the Available Items on the left-hand side. Expand an item to use the fields that are available under that item.
Alternatively, drag and drop the Unified Manager database table fields (available under “Available Items”) to create your logic.

35 OnCommand Unified Manager Reporting for NetApp ONTAP
© 2018 NetApp, Inc. All rights reserved. © 2016 NetApp, Inc. All rights reserved.
When you complete your selections, click Finish to view the results.
Note: If an incorrect query syntax or logic statement is submitted, an error occurs and the you are alerted with a pop-up message.
4. Select the output columns you want to include in the report and then click OK.
5. Drag the columns from the Data Sets to the Detail Row in the order that you want them displayed.

36 OnCommand Unified Manager Reporting for NetApp ONTAP
© 2018 NetApp, Inc. All rights reserved. © 2016 NetApp, Inc. All rights reserved.
6. After you save the query, you can review the output by using a browser. Select the report in the bottom left-hand corner and select Run View Report As HTML.
7. To import this report into OnCommand Unified Manager, locate the new_report.rptdesign file (normally located in the workspace location defined during installation of Eclipse). Copy this file to a system that can browse Unified Manager using the importing function explained in Section 9 Portability of Custom Reports.
Note: The custom reports, once saved, have *.rptdesign extensions in their file names.
8.4 Expanded Customization Using Format and Style
Eclipse Designer UI Functions
A wide range of style and formatting functions is available with the Eclipse tool. This section describes the basic UI functions.
Layout Editor
The Layout Editor is the central area in which report designs are created. The editor has five tabs:
• Layout. Edit report design.
• Preview. Run reports and show output.
• Script. Add JavaScript to reports to customize their behavior.
• XML Source. View and modify the XML source of a report.
• Master Page. Format page data such as page headers.

37 OnCommand Unified Manager Reporting for NetApp ONTAP
© 2018 NetApp, Inc. All rights reserved. © 2016 NetApp, Inc. All rights reserved.
Views
• Palette. BIRT view shows the standard report items that can be added to your report using drag and
drop.
• Outline. BIRT view that shows the structure of your report as a tree view.
• Navigator. Standard Eclipse view that shows your projects and the reports within your projects.
• Data Explorer. BIRT view that shows your data sources (connections), datasets (queries), and report parameters. You also use this view to add dataset columns to your report layout.
• Property Editor. BIRT view that displays properties for many report items. It has tabs and groupings that organize properties into categories.
• Properties View. Standard Eclipse view that shows all properties for a report item as a simple list.
Format and Style
Once you create the report logic (SQL queries), as explained in step 4 of Create New Data Set, you can use formatting to further customize by charting the data points. The following figures describe some of the basic functions.
Figure 12) Drag-and-drop fields from the dataset to create tables
Figure 13) Create charts using functions in the Palette tab

38 OnCommand Unified Manager Reporting for NetApp ONTAP
© 2018 NetApp, Inc. All rights reserved. © 2016 NetApp, Inc. All rights reserved.
9 Portability of Custom Reports
Custom reports, created with the Eclipse designer, can be imported between environments. This capability enables you to seamlessly import a report file (.rptdesign) created in Unified Manager instance A to Unified Manager instance B.
Note: The methods for importing files are different for Unified Manager 6.4 and 7.x.
9.1 Connection Profile
A connection profile contains the required connection property information to connect to a data source (in this example, a Unified Manager database). With a connection profile, administrators are not required to repeat the connection definitions or to add the required MySQL drivers multiple times for each “custom” report created within a single Unified Manager instance. The administrator can also use connection profiles to import external BIRT report files (.rptdesign) from another environment.
A connection profile is an XML file with an .acconnprofiles extension. A connection profile contains the database connection-related data for BIRT run-time environments. Optionally, the entire content in the connection profile can be encrypted for additional security. The major components in a connection profile are:
• Data source name
• Database server class information
• Database URL that connects to the Unified Manager database
• Database user name and password to connect to the Unified Manager database
Advantages of Using a Connection Profile
With a connection profile, you can:
• Create the profile one time for multiple (or all of the) reports used in a Unified Manager instance and
its associated storage objects.
Figure 14) Format fonts and captions for charts created

39 OnCommand Unified Manager Reporting for NetApp ONTAP
© 2018 NetApp, Inc. All rights reserved. © 2016 NetApp, Inc. All rights reserved.
• Create multiple reports without having to reenter the connection parameters (database driver, user name, and password), resulting in significant time savings.
• With a simple understanding of the connection profile, you can import the same report to multiple
Unified Manager instances (the same file name but different parameters).
• Encrypt content (optional).
Connection Profile Prerequisites
The following components are required to create a connection profile. These components can be downloaded from the host where the Eclipse designer is installed:
• BIRT designer editor (Eclipse with a BIRT plug-in or Eclipse from Actuate).
• Fully operational Unified Manager server with a report user created.
• Downloaded mysql-connector-java-*-bin.jar from the web. For optimal reporting solutions, NetApp recommends the version mysql-connector-java-5.1.26-bin.jar or higher. You can
download this version from http://downloads.mysql.com/archives/c-j/.
Note: The Unified Manager server should be in the same network as that of the server that hosts the BIRT designer or, at a minimum, it should have port 3306 allowed.
9.2 Creating a Connection Profile
Log in to the host where the Eclipse designer is installed. Follow these steps to create a connection profile:
1. From the main menu, select File New Other.
2. Under Connection Profiles, select Connection Profile from the wizard and click Next.

40 OnCommand Unified Manager Reporting for NetApp ONTAP
© 2018 NetApp, Inc. All rights reserved. © 2016 NetApp, Inc. All rights reserved.
3. Select the connection profile type.
4. Enter a unique name for the connection profile type.
5. Under Connection Profile Types, select BIRT JDBC Data Source. Enter a name and a description identifier for the datastore. Click Next.
Note: Make sure that you document the data source name. This information is extremely important from a report portability perspective. If you need to import another report (an .rptdesign file from an external BIRT server or from another environment), your BIRT server must have the same data source name while creating the connection profile.
6. Complete the required information in the wizard for your connection profile type. Provide the database URL (replace the IP here with the FQDN/IP of Unified Manager), the user name, and the password from Connection Profile Prerequisites. In addition, complete the following fields with this information:
a. Click the Manage Drivers button to add the dtabase driver. Select the available mysql-connector-java-*-bin.jar file.
b. Driver Class: com.mysql.jdbc.Driver (v5.1). This name is available as a drop-down selection.
c. Database URL: jdbc:mysql://<ip address of Unified Manager server>:3306/ocum_report.
d. User Name: The name of the database user that was created in the Unified Manager server for the BIRT designer.
e. Password: The password of the database user.
Note: For an IPv6 address, the Database URL field should be in the following format:

41 OnCommand Unified Manager Reporting for NetApp ONTAP
© 2018 NetApp, Inc. All rights reserved. © 2016 NetApp, Inc. All rights reserved.
jdbc:mysql://address=(protocol=tcp)(host=fd20:8b1e:b255:8477:42f:11e
:64e3:5338)(port=3306)/ocum_report
Where host=fd20:8b1e:b255:8477:42f:11e:64e3:5338 is the host IPv6 address.
7. The JDBC Data Source Profile window opens.
9.3 Creating Reports Using Connection Profile
To create a report using a connection profile:
1. Select File New Report to create a new report in your report project

42 OnCommand Unified Manager Reporting for NetApp ONTAP
© 2018 NetApp, Inc. All rights reserved. © 2016 NetApp, Inc. All rights reserved.
Alternatively, you can right-click the new project and select New Report.
2. Provide a name for the new report. You can use the default location to store all reports by selecting the Use Default Location checkbox. Click Next.

43 OnCommand Unified Manager Reporting for NetApp ONTAP
© 2018 NetApp, Inc. All rights reserved. © 2016 NetApp, Inc. All rights reserved.
3. Select the type of report from the report template; in this case, Blank Report. Click Finish.
4. For the new report, create a data source by using the Connection Profile option. Click Next.

44 OnCommand Unified Manager Reporting for NetApp ONTAP
© 2018 NetApp, Inc. All rights reserved. © 2016 NetApp, Inc. All rights reserved.
5. On the Connection Profile screen, click New.
6. Select your connection profile. In the Specify a File Name field, enter a file name and path to create a profile at that location.
Note: This step is a one-time operation. After you take this step, you can always choose this file in Step 5 by clicking Browse.

45 OnCommand Unified Manager Reporting for NetApp ONTAP
© 2018 NetApp, Inc. All rights reserved. © 2016 NetApp, Inc. All rights reserved.
7. In Create a Connection Profile Store, click OK.
8. Click Next.

46 OnCommand Unified Manager Reporting for NetApp ONTAP
© 2018 NetApp, Inc. All rights reserved. © 2016 NetApp, Inc. All rights reserved.
9. After the process has finished, you can see the connection profile with.acconnprofiles in your workplace, showing the datastore that was created.
10. Now you can create a dataset with the desired query for the report. Click Next.

47 OnCommand Unified Manager Reporting for NetApp ONTAP
© 2018 NetApp, Inc. All rights reserved. © 2016 NetApp, Inc. All rights reserved.
11. Fill in the query and click Finish.
Note:
• You should create the data source by using a connection profile.
• Do not provide a name for the data source.
• You should select the Use the Default Data Source Name checkbox.
• Create an encrypted connection profile. (This step is optional, in case you want a secure method of communication.)
• The .rptdesign file with a connection profile has the following lines under the Data Sources design element. You can review the lines in bold to identify that the report is using a connection profile.
<property name="odaDriverClass">com.mysql.jdbc.Driver</property>
<property name="odaURL">jdbc:mysql://192.168.1.1:3306/ocum_report</property>
<property name="odaUser">birtuser</property>
<encrypted-property name="odaPassword"
encryptionID="base64">bmV0YXBwMSE=</encrypted-property>
<property name="OdaConnProfileName">NtapReport</property>
<property
name="OdaConnProfileStorePath">Conn/ntap_conn.acconprofiles</property>

48 OnCommand Unified Manager Reporting for NetApp ONTAP
© 2018 NetApp, Inc. All rights reserved. © 2016 NetApp, Inc. All rights reserved.
Note: For an IPv6 address, the database URL should be in the following format:
jdbc:mysql://address=(protocol=tcp)(host=fd20:8b1e:b255:8477:42f:11e:64
e3:5338)(port=3306)/ocum_report
Where host=fd20:8b1e:b255:8477:42f:11e:64e3:5338 is the host IPv6 address.
10 Importing Custom Reports
This section describes the steps required to import custom reports in Unified Manager 7.0 and 6.x versions.
10.1 Importing Custom Reports in OnCommand Unified Manager 7.x
The OnCommand Unified Manager 7.0 report import feature is interactive and easy to use. With the *.rptdesign file is running in the Unified Manager instance, perform the following steps:
1. Select the Reports tab. On the Reports page, click Import Report.
2. In the Import Report window, enter the following details:
a) Select the custom report (*.rptdesign) file.
b) Enter the report name.
49 OnCommand Unified Manager Reporting for NetApp ONTAP
© 2018 NetApp, Inc. All rights reserved. © 2016 NetApp, Inc. All rights reserved.
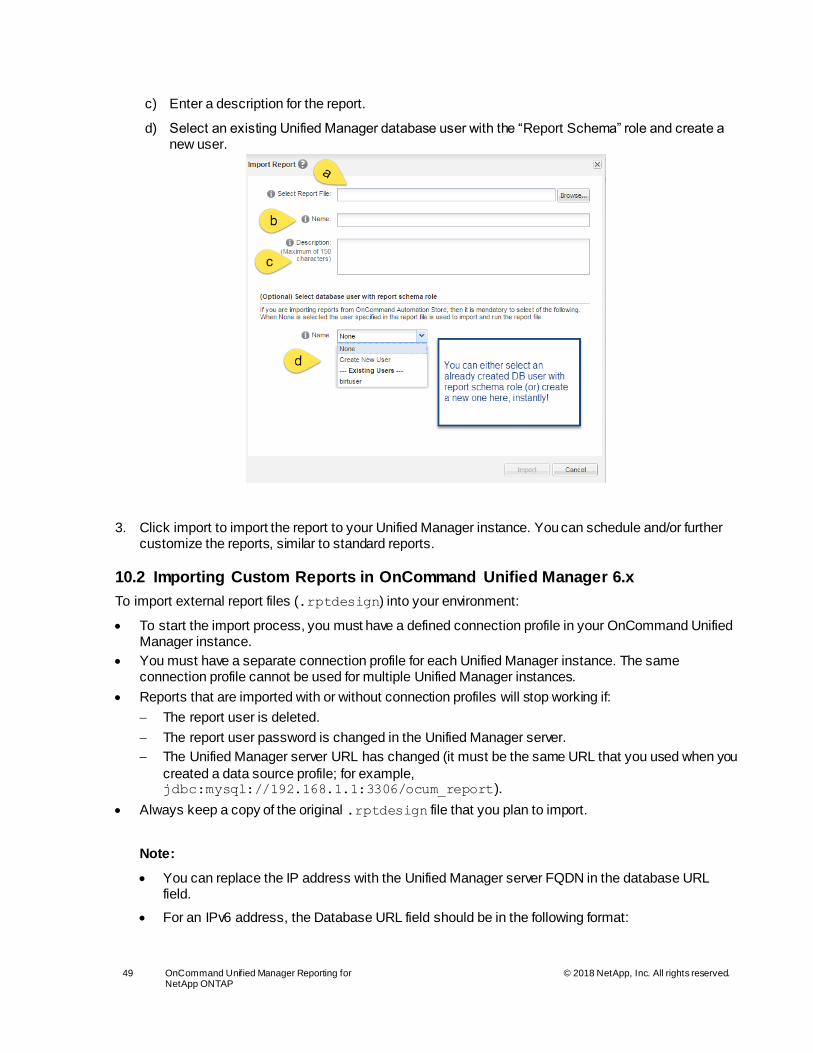
c) Enter a description for the report.
d) Select an existing Unified Manager database user with the “Report Schema” role and create a new user.
3. Click import to import the report to your Unified Manager instance. You can schedule and/or further customize the reports, similar to standard reports.
10.2 Importing Custom Reports in OnCommand Unified Manager 6.x
To import external report files (.rptdesign) into your environment:
• To start the import process, you must have a defined connection profile in your OnCommand Unified Manager instance.
• You must have a separate connection profile for each Unified Manager instance. The same connection profile cannot be used for multiple Unified Manager instances.
• Reports that are imported with or without connection profiles will stop working if:
The report user is deleted.
The report user password is changed in the Unified Manager server.
The Unified Manager server URL has changed (it must be the same URL that you used when you
created a data source profile; for example, jdbc:mysql://192.168.1.1:3306/ocum_report).
• Always keep a copy of the original .rptdesign file that you plan to import.
Note:
• You can replace the IP address with the Unified Manager server FQDN in the database URL field.
• For an IPv6 address, the Database URL field should be in the following format:

50 OnCommand Unified Manager Reporting for NetApp ONTAP
© 2018 NetApp, Inc. All rights reserved. © 2016 NetApp, Inc. All rights reserved.
jdbc:mysql://address=(protocol=tcp)(host=fd20:8b1e:b255:8477:42f:11e:64
e3:5338)(port=3306)/ocum_report
Where host=fd20:8b1e:b255:8477:42f:11e:64e3:5338 is the host IPv6 address.
Configuration Changes
To import an external .rptdesign file, you need to make a few configuration adjustments:
1. Log in to the Unified Manager instance and create a directory called Conn under the reports directory. For Linux systems, the default location is /opt/netapp/ocum/reports/.
Note: For OnCommand Unified Manager servers that are deployed as vApp, log in to the server by using root credentials.
2. Copy the connection profile that you created for this Unified Manager instance to the Conn directory.
3. Change the .rptdesign file contents to point to this connection profile location. (The following example is from a Unified Manager instance that is installed in Linux; you should find equivalent information for Windows.)
From
<property
name="OdaConnProfileStorePath">Conn/ntap_conn.acconprofiles</property>
To
<property
name="OdaConnProfileStorePath">/opt/netapp/ocum/reports/Conn/ntap_conn.acconp
rofiles</property>
4. To confirm that the report is connected using the connection profile, remove the following lines. These lines are optional and are used by BIRT as a fallback mechanism if it cannot connect through the connection profile:
<property name="odaDriverClass">com.mysql.jdbc.Driver</property>
<property name="odaURL">jdbc:mysql://192.168.1.1:3306/ocum_report</property>
<property name="odaUser">birtuser</property>
<encrypted-property name="odaPassword" encryptionID="base64">bmV0YXBwMSE=</encrypted-property>
Note: For an IPv6 address, the database URL should be in the following format:
jdbc:mysql://address=(protocol=tcp)(host=fd20:8b1e:b255:8477:42f:11e:64
e3:5338)(port=3306)/ocum_report
Where host=fd20:8b1e:b255:8477:42f:11e:64e3:5338 is the host IPv6 address.
5. Import the external .rptdesign file.

51 OnCommand Unified Manager Reporting for NetApp ONTAP
© 2018 NetApp, Inc. All rights reserved. © 2016 NetApp, Inc. All rights reserved.
11 What’s new with Unified Manager 7.3
11.1 Database Schemas Exposed with Unified Manager 7.3
Before Unified Manager 7.3, you could create custom reports with only one “read-only” schema – ocum_reports. However, with Unified Manager 7.3, NetApp exposes all the schemas in Unified Manager for external consumption. You can now view all the available objects monitored by Unified Manager and create custom reports with any third-party tool that accepts a JDBC connection.
With Unified Manager 7.3, you get read-only access to most of the Unified Manager internal schemas (including the Performance Schema).
Prerequisites
The procedure to connect to the Unified Manager server is the same as described earlier in this document; an existing reporting user (DB user with the 'Report Schema' role) is required to access all the tables. Therefore you must create a DB user with 'Report Schema' permission from the Unified Manager User's page. This user has only 'Read-Only' permission for all existing tables in the MySQL database. However, this user does not have permission to access any tables that hold user data or cluster credential information.
11.2 Exposed Schemas
All tables for the schemas shown in Figure15 are exposed to this user with only the 'SELECT' operation, except for tables that contain cluster and DB credentials.
Figure 15) Schemas that are exposed to the user

52 OnCommand Unified Manager Reporting for NetApp ONTAP
© 2018 NetApp, Inc. All rights reserved. © 2016 NetApp, Inc. All rights reserved.
12 Different Ways to Extract Data from Unified Manager 7.3
With Unified Manager 7.3, you can export and extract Unified Manager data in several ways, as described in this section.
12.1 BIRT
The built-in reports use BIRT integrated with Unified Manager to provide customizable reports as explained in Section 7.2.
12.2 Open Database
Users can extract data via a JDBC connection from the Unified Manager database. Starting with Unified Manager 7.3, multiple schemas are exposed providing flexibility to customers to create reports from any storage object monitored by Unified Manager, including performance reports. This is explained in Section 11
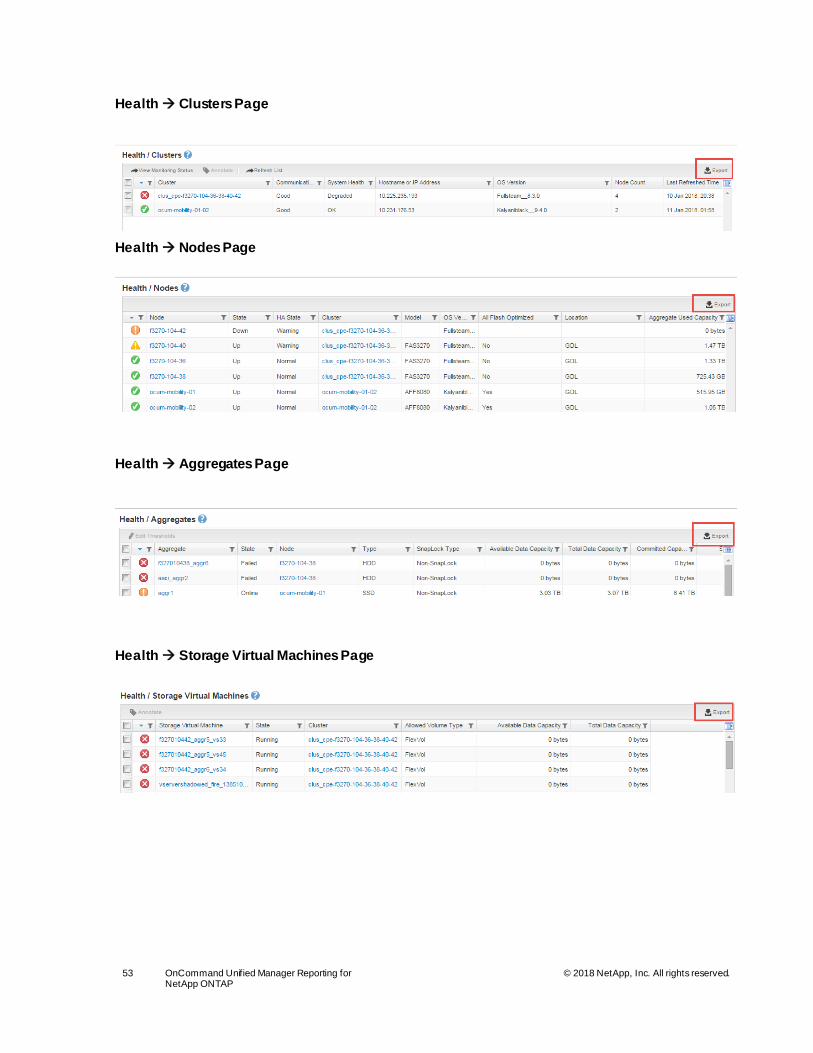
12.3 Export Data Directly from Unified Manager GUI
Various reports can be extracted directly from the Unified Manager GUI. The reports can be extracted in CSV format directly to your desktop, including performance data.
You can customize the views and export the views in CSV format right to your desktop. However, you cannot save the customized views for next login.
The following subsections show all the data that you can extract from different areas of the GUI:
Health Tab
Navigate to the Health tab on the left-hand side of the Unified Manager GUI screen. You can select views from the sub-tabs under the Health tab.
53 OnCommand Unified Manager Reporting for NetApp ONTAP
© 2018 NetApp, Inc. All rights reserved. © 2016 NetApp, Inc. All rights reserved.
Health Clusters Page
Health Nodes Page
Health Aggregates Page
Health Storage Virtual Machines Page

54 OnCommand Unified Manager Reporting for NetApp ONTAP
© 2018 NetApp, Inc. All rights reserved. © 2016 NetApp, Inc. All rights reserved.
Health Volumes Page
Performance Tab
Navigate to the Performance tab in the left hand side of the Unified Manager GUI screen. You can select views from the sub-tabs under the Performance tab.

55 OnCommand Unified Manager Reporting for NetApp ONTAP
© 2018 NetApp, Inc. All rights reserved. © 2016 NetApp, Inc. All rights reserved.
Export Top Workload Data as Report
With Unified Manager 7.3, you can download top performers for Aggregates, Clusters, Volumes and LUNs. You can select metrics like latency, IOPS, Mbps, Aggregate Utilization, Node Utilization, Perf Capacity Used etc..
Examples:
Performance Clusters Page

56 OnCommand Unified Manager Reporting for NetApp ONTAP
© 2018 NetApp, Inc. All rights reserved. © 2016 NetApp, Inc. All rights reserved.
Performance Nodes Page
Performance Aggregates Page

57 OnCommand Unified Manager Reporting for NetApp ONTAP
© 2018 NetApp, Inc. All rights reserved. © 2016 NetApp, Inc. All rights reserved.
Performance Volumes Page
Performance Ports Page
Performance – SVMs Page

58 OnCommand Unified Manager Reporting for NetApp ONTAP
© 2018 NetApp, Inc. All rights reserved. © 2016 NetApp, Inc. All rights reserved.
Performance LUNs Page
Performance LIFs Page
Protection Tab
Expand the Protection tab to gather details from the sub-tabs.
Protection Volume Relationships Page

59 OnCommand Unified Manager Reporting for NetApp ONTAP
© 2018 NetApp, Inc. All rights reserved. © 2016 NetApp, Inc. All rights reserved.
Capacity Trending Charts
Trending charts are available with each of the Volume and Aggregate detail pages. Charts in the drop down menu provides different levels of trending data. The data is retained for one year, and users can plot graphs for one week, one month or one year
Volume Page
Aggregate Page

60 OnCommand Unified Manager Reporting for NetApp ONTAP
© 2018 NetApp, Inc. All rights reserved. © 2016 NetApp, Inc. All rights reserved.
13 Frequently Asked Questions
1. Can I change units from GB to TB and vice versa on the Capacity Reports?
Answer: Yes, you can change details in any report. For Capacity reports, you need to create a new column (Advanced Column Computed Column) to convert capacity numbers into the units you want; for example GB TB.
Follow the steps detailed in Example 1
2. What tool can I use to build custom reports, and run a SQL query to the Unified Manager Database?
Answer: You can take any IDE of your choice as long as it supports JDBC connection to the MySQL database (Unified Manager Database).
3. Is the Eclipse tool free of cost?
Yes, an open source version of Eclipse is available, as explained in Section 8.1
References
• NetApp OnCommand customer community in which users post questions and subject-matter experts respond and in which users can interact with peers http://community.netapp.com/t5/OnCommand-Storage-Management-Software-Discussions/bd-p/oncommand-storage-management-software-discussions
• OnCommand Unified Manager on NetApp.com http://www.netapp.com/us/products/management-software/oncommand/
• OnCommand Unified Manager on the NetApp TechComm TV channel on YouTube https://www.youtube.com/watch?v=34Pzo0KuMOQ
• Download site for the latest version of Unified Manager and product documentation mysupport.netapp.com

61 OnCommand Unified Manager Reporting for NetApp ONTAP
© 2018 NetApp, Inc. All rights reserved. © 2016 NetApp, Inc. All rights reserved.
Version History
Version Date Author Description
1.0 November 2016
Dhiman Chakraborty • Reporting Architecture • Customizing built-in reports • Creating Custom Reports from IDEs with
examples • Using Connection Profiles to create
connection settings between IDE and Unified Manager Database
1.1 January 2018 Dhiman Chakraborty Added updates on:
1. Schema enhancements in Unified Manager 7.3
2. New schema definitions 3. Different ways to extract Unified Manager
data 4. Added FAQ section
Refer to the Interoperability Matrix Tool (IMT) on the NetApp Support site to validate that the exact product and feature versions described in this document are supported for your specific environment. The NetApp IMT defines the product components and versions that can be used to construct configurations that are supported by NetApp. Specific results depend on each customer’s installation in accordance with published specifications.

62 OnCommand Unified Manager Reporting for NetApp ONTAP
© 2018 NetApp, Inc. All rights reserved. © 2016 NetApp, Inc. All rights reserved.
Copyright Information
Copyright © 1994–2017 NetApp, Inc. All rights reserved. Printed in the U.S. No part of this document covered by copyright may be reproduced in any form or by any means—graphic, electronic, or mechanical, including photocopying, recording, taping, or storage in an electronic retrieval system—without prior written permission of the copyright owner.
Software derived from copyrighted NetApp material is subject to the following license and disclaimer:
THIS SOFTWARE IS PROVIDED BY NETAPP “AS IS” AND WITHOUT ANY EXPRESS OR IMPLIED WARRANTIES, INCLUDING, BUT NOT LIMITED TO, THE IMPLIED WARRANTIES OF MERCHANTABILITY AND FITNESS FOR A PARTICULAR PURPOSE, WHICH ARE HEREBY DISCLAIMED. IN NO EVENT SHALL NETAPP BE LIABLE FOR ANY DIRECT, INDIRECT, INCIDENTAL, SPECIAL, EXEMPLARY, OR CONSEQUENTIAL DAMAGES (INCLUDING, BUT NOT LIMITED TO, PROCUREMENT OF SUBSTITUTE GOODS OR SERVICES; LOSS OF USE, DATA, OR PROFITS; OR BUSINESS INTERRUPTION) HOWEVER CAUSED AND ON ANY THEORY OF LIABILITY, WHETHER IN CONTRACT, STRICT LIABILITY, OR TORT (INCLUDING NEGLIGENCE OR OTHERWISE) ARISING IN ANY WAY OUT OF THE USE OF THIS SOFTWARE, EVEN IF ADVISED OF THE POSSIBILITY OF SUCH DAMAGE.
NetApp reserves the right to change any products described herein at any time, and without notice. NetApp assumes no responsibility or liability arising from the use of products described herein, except as expressly agreed to in writing by NetApp. The use or purchase of this product does not convey a license under any patent rights, trademark rights, or any other intellectual property rights of NetApp.
The product described in this manual may be protected by one or more U.S. patents, foreign patents, or pending applications.
RESTRICTED RIGHTS LEGEND: Use, duplication, or disclosure by the government is subject to restrictions as set forth in subparagraph (c)(1)(ii) of the Rights in Technical Data and Computer Software clause at DFARS 252.277-7103 (October 1988) and FAR 52-227-19 (June 1987).
Trademark Information
NETAPP, the NETAPP logo, and the marks listed at http://www.netapp.com/TM are trademarks of NetApp, Inc. Other company and product names may be trademarks of their respective owners .