Net Acid Production, Acid Neutralizing Capacity, and ... · Net Acid Production, Acid Neutralizing...
79
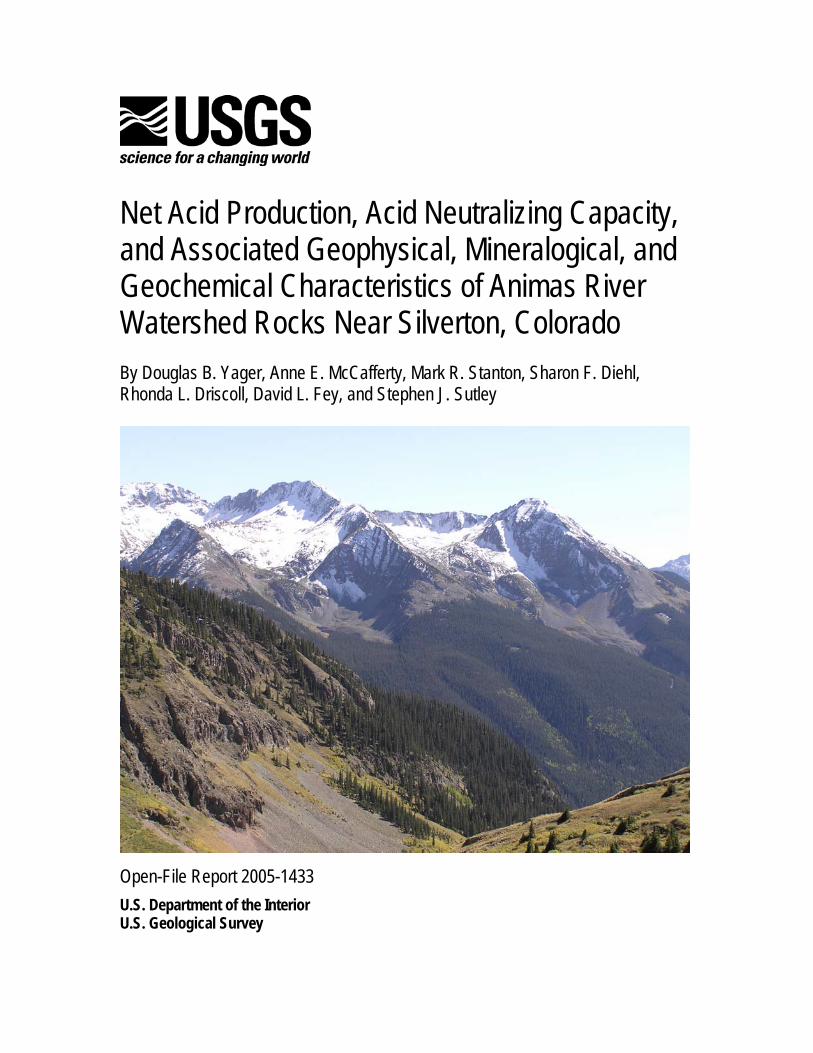
Net Acid Production, Acid Neutralizing Capacity, and Associated Geophysical, Mineralogical, and Geochemical Characteristics of Animas River Watershed Rocks Near Silverton, Colorado By Douglas B. Yager, Anne E. McCafferty, Mark R. Stanton, Sharon F. Diehl, Rhonda L. Driscoll, David L. Fey, and Stephen J. Sutley Open-File Report 2005-1433 U.S. Department of the Interior U.S. Geological Survey
Transcript of Net Acid Production, Acid Neutralizing Capacity, and ... · Net Acid Production, Acid Neutralizing...
Net Acid Production, Acid Neutralizing Capacity, and Associated Geophysical, Mineralogical, and Geochemical Characteristics of Animas River Watershed Rocks Near Silverton, Colorado By Douglas B. Yager, Anne E. McCafferty, Mark R. Stanton, Sharon F. Diehl, Rhonda L. Driscoll, David L. Fey, and Stephen J. Sutley
Open-File Report 2005-1433 U.S. Department of the Interior U.S. Geological Survey
CONTENTS
Abstract 1 Introduction 2 Geologic Setting 5 Mid-Tertiary volcanism 5 Mineralization and subsequent erosion events 7 Quaternary Glaciation and sedimentation 7 Rock Types of Interest for Potential Acid Neutralization Capacity 8 Precambrian Rocks 8 Paleozoic Sedimentary Rocks 8 Mesozoic Sedimentary Rocks 9 Tertiary Sedimentary Rocks 9 Tertiary Igneous Rocks 9 Regional Propylitic Alteration 10 Quaternary Surficial Deposits 11 Methods 12 Sample Preparation 12 Magnetic Rock Properties 12 Net Acid Production 23 Acid Neutralizing Capacity Test 24 Results 25 Magnetic Rock Properties 25 Net Acid Production 26 Sulfide-Bearing Minerals 27 Non-Sulfide-Bearing Minerals 28 Acid Neutralizing Capacity 28 ANC of Major Rock Types 30 Precambrian Irving Formation 30 San Juan Formation 31 Eureka and Picayune Megabreccia Members of Sapinero Tuff 32 Sultan Mountain Stock 36 Silverton Volcanics 36 Burns Member 38 Pyroxene Andesite Member 39 Dacite Intrusion 43 Magnetic Properties of Major Rock Types 47 Magnetic and Environmental Properties 47 Magnetite Content as a Function of Alteration 48 Magnetite, Clay Content, Acid Generating, and Acid Consuming Minerals 49 Magnetic Rock Properties and Mineralogy of Geologic Units 51 Pyroxene-Andesite Member 52 Burns Member 55 Eureka Tuff Member 55 San Juan Formation 56 Sultan Mountain Stock 57 Mineralized Vein, Dacite Intrusion, and Precambrian Rock 58 Summary of Magnetic Minerals, NAP, and ANC 60 Discussion 60 Non-Equilibria Reactions Involving Calcite 60
ii
ANC Rank, Mineralogy, and Magnetic Properties 62 Pyroxene-Andesite 62 Burns Member 65 Other Geologic Units 66 Conclusions 66 Future Study Directions 70 Sample Strategies and Laboratory Studies 70 Map-Scale Efforts and Analysis 70 Acknowledgements 71 Disclaimers 71 References Cited 71
Figures 1. Location map and geographic features referred to in this report 3 2. Generalized geology 6 3. Generalized alteration map of Animas River watershed 11 4. Box plot and basic statistics for NAP results 27 5. Box plot and basic statistics for ANC results 29 6. Graph comparing total amount of acid added at titration setpoints 30 7. Acid titration curve for Precambrian Irving Formation 31 8. Acid titration curve for San Juan Formation 33 9. Total alkali versus silica rock classification 34 10. Acid titration curves for Eureka tuff and Picauyune Megabreccia 35 11. Acid titration curves for Sultan Montain stock 37 12. Photomicrograph of propylitically altered Burns Member 39 13. Acid titration curves for Burns Member 41 14. Acid titration curve for propylitically altered Burns Member 42 15. Scanned thin section of Pyroxene Andesite Member 43 16. Acid titration curve for Pyroxene Andesite sample SDY0312 44 17. Acid titration curves for Pyroxene Andesite Member 45 18. Acid titration curve for quartz-sericite-pyrite altered dacite intrusion 46 19. NAP and ANC for samples analyzed using both methods 46 20. Ilmenite intergrown along octahedral planes of magnetite 47 21. Volume-percent magnetite for all samples 48 22. Magnetite content relative to clay minerals, pyrite, and ANC minerals for all samples 50 23. Magnetite content relative to clay minerals, pyrite, and ANC minerals for pyroxene andesite samples 52 24. Magnetite content relative to clay minerals, pyrite, and ANC minerals for Burns Member samples 54 25. Magnetite content relative to clay minerals, pyrite, and ANC minerals for Eureka tuff and Picauyune Megabreccia samples 56 26. Magnetite content relative to clay minerals, pyrite, and ANC minerals for San Juan formation samples 57 27. Magnetite content relative to clay minerals, pyrite, and ANC minerals for Sultan Mountain Stock samples 58 28. Magnetite content relative to clay minerals, pyrite, and ANC minerals for dacite intrusion, mineralized vein, and Precambrian gneiss samples 59 29. Kendall’s tau regression for samples that lack calcite and contain chlorite 61 30. Photomicrograph of Eureka Member of Sapinero Mesa Tuff sample 62
iii
31. SEM backscatter image of sample HDY0314 65 32. ANC by lithologic unit for all samples 67 33. NAP by lithologic unit for all samples 68 Tables 1. Geologic unit and locality information for all samples 13 2. Major element oxide analysis 14 3. Mineralogy determined by X-ray diffraction analysis 15 4. Weight percent CO2, carbon from carbonate, and total carbon 17 5. Inductively coupled plasma atomic emission spectroscopy analyes 18 6. Estimates of volume percent magnetite, NAP, and ANC 22 7. Net acid production 24 8. Acid neutralizing capacity 26 9. ANC, ANC to NAP ratio, and ANC Rank 40 10. Summary of environmental properties, alteration, and % magnetite 60 11. Calcite attributed to weight percent carbonate 64 Plates 1. Acid Neutralizing Capacity of Animas River Watershed Rocks in the Vicinity of Silverton, Colorado
iv
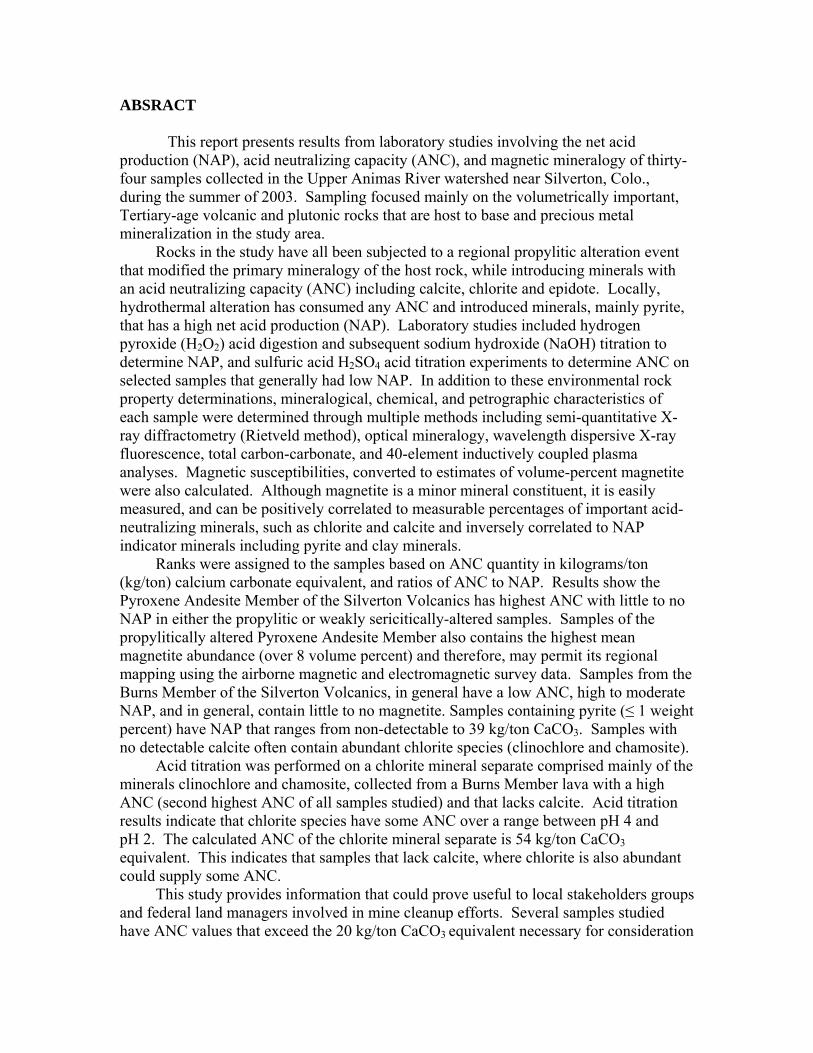
ABSRACT This report presents results from laboratory studies involving the net acid production (NAP), acid neutralizing capacity (ANC), and magnetic mineralogy of thirty-four samples collected in the Upper Animas River watershed near Silverton, Colo., during the summer of 2003. Sampling focused mainly on the volumetrically important, Tertiary-age volcanic and plutonic rocks that are host to base and precious metal mineralization in the study area. Rocks in the study have all been subjected to a regional propylitic alteration event that modified the primary mineralogy of the host rock, while introducing minerals with an acid neutralizing capacity (ANC) including calcite, chlorite and epidote. Locally, hydrothermal alteration has consumed any ANC and introduced minerals, mainly pyrite, that has a high net acid production (NAP). Laboratory studies included hydrogen pyroxide (H2O2) acid digestion and subsequent sodium hydroxide (NaOH) titration to determine NAP, and sulfuric acid H2SO4 acid titration experiments to determine ANC on selected samples that generally had low NAP. In addition to these environmental rock property determinations, mineralogical, chemical, and petrographic characteristics of each sample were determined through multiple methods including semi-quantitative X-ray diffractometry (Rietveld method), optical mineralogy, wavelength dispersive X-ray fluorescence, total carbon-carbonate, and 40-element inductively coupled plasma analyses. Magnetic susceptibilities, converted to estimates of volume-percent magnetite were also calculated. Although magnetite is a minor mineral constituent, it is easily measured, and can be positively correlated to measurable percentages of important acid-neutralizing minerals, such as chlorite and calcite and inversely correlated to NAP indicator minerals including pyrite and clay minerals. Ranks were assigned to the samples based on ANC quantity in kilograms/ton (kg/ton) calcium carbonate equivalent, and ratios of ANC to NAP. Results show the Pyroxene Andesite Member of the Silverton Volcanics has highest ANC with little to no NAP in either the propylitic or weakly sericitically-altered samples. Samples of the propylitically altered Pyroxene Andesite Member also contains the highest mean magnetite abundance (over 8 volume percent) and therefore, may permit its regional mapping using the airborne magnetic and electromagnetic survey data. Samples from the Burns Member of the Silverton Volcanics, in general have a low ANC, high to moderate NAP, and in general, contain little to no magnetite. Samples containing pyrite (≤ 1 weight percent) have NAP that ranges from non-detectable to 39 kg/ton CaCO3. Samples with no detectable calcite often contain abundant chlorite species (clinochlore and chamosite). Acid titration was performed on a chlorite mineral separate comprised mainly of the minerals clinochlore and chamosite, collected from a Burns Member lava with a high ANC (second highest ANC of all samples studied) and that lacks calcite. Acid titration results indicate that chlorite species have some ANC over a range between pH 4 and pH 2. The calculated ANC of the chlorite mineral separate is 54 kg/ton CaCO3 equivalent. This indicates that samples that lack calcite, where chlorite is also abundant could supply some ANC. This study provides information that could prove useful to local stakeholders groups and federal land managers involved in mine cleanup efforts. Several samples studied have ANC values that exceed the 20 kg/ton CaCO3 equivalent necessary for consideration
in mine waste remediation. Data collected for the environmental rock properties, NAP and ANC, of Animas River watershed rocks could aid in locating rocks that could be suitable for use in ongoing mine waste remediation efforts. INTRODUCTION Land management agencies, in partnership with mine owners, and other local, State and Federal stakeholders in several watersheds located in the western United States are involved in the cleanup of abandoned hard rock metal mines and mine-related features. These cleanup efforts are necessary because many abandoned mine sites have acid generating minerals, predominantly pyrite, that in the presence of oxygen and water, produces sulfuric acid that can be toxic to aquatic life. In addition, acidic water leaches major- and trace-elements from rocks in concentrations that can also be toxic to aquatic life and can adversely effect local watersheds. Mine site remediation project managers must consider multiple variables in order to achieve the goal of reducing the impact that acid mine drainage has on surface and groundwater (Hutchison, and Ellison, 1992). Mine site configuration in relation to topography, hydrology, local geology including lithology, possible attenuation of metals by underlying substrate be it either surficial deposits or bedrock, geologic structures and hazards, and transportation logistics are but a few examples of those important issues that need careful consideration when designing and implementing a mine site remediation project. We address a little studied but important geochemical variable-- the acid neutralization capacity (ANC) of local rocks. In addition, we examine the associated magnetic characteristics of these rocks to determine if airborne electromagnetic and magnetic survey data can be used to regionally map rocks that have acid generating or acid neutralizing physical properties. Information on the ANC of rocks in a mined area could prove useful to land managers who are attempting to mitigate the effects of acid mine drainage and who are trying to understand the relative acid generating potential of mine waste piles that contain rocks with varying ANC. The Animas River watershed near the historic mining town of Silverton, Colorado (Fig. 1), is an excellent area in which to study the ANC of local rocks. A more than 100-year history of mining primarily silver, gold, and base-metals (copper-lead-zinc) has left behind hundreds of abandoned mine-waste piles, mills and associated deposits, fluvial tailings, and mine-adits. Many mining-related features are located on lands managed by the U.S. Forest Service and U.S. Bureau of Land Management and require Federal involvement in any cleanup efforts. The active Animas River Stakeholders Group that is based in Silverton, Colo. is also currently involved in several mine cleanup efforts that could benefit from detailed information on the ANC of local rocks for application in remediation projects. If it is demonstrated that geologic units have significant ANC, then more local source materials could be used in remediation projects, reducing the amount of material that would need to be hauled from long distances. The Silverton, Colo. area is relatively remote, located at 10,000 ft (3,048 m) and is nestled between two high mountain passes, 50 miles from the nearest large town, so utilization of local source materials could help reduce remediation costs associated with hauling.
2

Figure 1. Location map and geographic features referred to in this report. Complex weathering reactions of chemical constituents of minerals in rocks determine if a sample will produce or consume acid. Reactions at the water-mineral interface involving oxidation, adsorption, desorption, ion exchange, dissolution, and surface area control the processes that ultimately results in the elements that are released into solution or are chemically bound or sequestered (Davis and Kent, 1990). The kinetic rates at which these reactions take place in situ are variable and are thus difficult to reproduce or simulate in a laboratory setting. It is; therefore, important to emphasize that
3
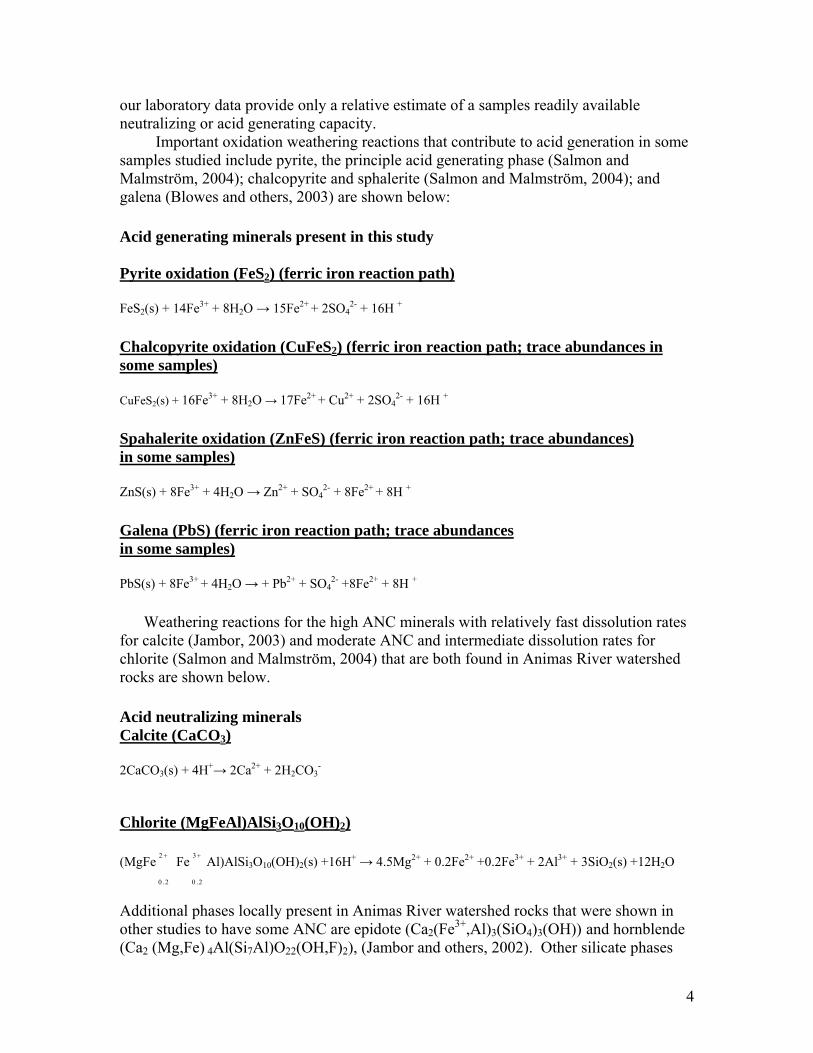
our laboratory data provide only a relative estimate of a samples readily available neutralizing or acid generating capacity. Important oxidation weathering reactions that contribute to acid generation in some samples studied include pyrite, the principle acid generating phase (Salmon and Malmström, 2004); chalcopyrite and sphalerite (Salmon and Malmström, 2004); and galena (Blowes and others, 2003) are shown below: Acid generating minerals present in this study Pyrite oxidation (FeS2) (ferric iron reaction path) FeS2(s) + 14Fe3+ + 8H2O → 15Fe2+ + 2SO4
2- + 16H +
Chalcopyrite oxidation (CuFeS2) (ferric iron reaction path; trace abundances in some samples) CuFeS2(s) + 16Fe3+ + 8H2O → 17Fe2+ + Cu2+ + 2SO4
2- + 16H +
Spahalerite oxidation (ZnFeS) (ferric iron reaction path; trace abundances) in some samples) ZnS(s) + 8Fe3+ + 4H2O → Zn2+ + SO4
2- + 8Fe2+ + 8H +
Galena (PbS) (ferric iron reaction path; trace abundances in some samples) PbS(s) + 8Fe3+ + 4H2O → + Pb2+ + SO4
2- +8Fe2+ + 8H +
Weathering reactions for the high ANC minerals with relatively fast dissolution rates for calcite (Jambor, 2003) and moderate ANC and intermediate dissolution rates for chlorite (Salmon and Malmström, 2004) that are both found in Animas River watershed rocks are shown below. Acid neutralizing minerals Calcite (CaCO3) 2CaCO3(s) + 4H+→ 2Ca2+ + 2H2CO3
-
Chlorite (MgFeAl)AlSi3O10(OH)2) (MgFe Fe Al)AlSi+2
2.0
+3
2.0
3O10(OH)2(s) +16H+ → 4.5Mg2+ + 0.2Fe2+ +0.2Fe3+ + 2Al3+ + 3SiO2(s) +12H2O
Additional phases locally present in Animas River watershed rocks that were shown in other studies to have some ANC are epidote (Ca2(Fe3+,Al)3(SiO4)3(OH)) and hornblende (Ca2 (Mg,Fe) 4Al(Si7Al)O22(OH,F)2), (Jambor and others, 2002). Other silicate phases
4
that are thought to have low reactivity and minimal ANC include the sodic feldspars, potassium feldspar, and sericite (Jambor, 2003; Jambor and others, 2002). GEOLOGIC SETTING A brief discussion of the geology of the study area is important because it helps to provide context for the various rock types that were studied in our ANC experiments. The western San Juan Mountains record a relatively complete geologic record from Precambrian to Cenozoic time. Within the upper Animas River watershed near Silverton, however; multiple Tertiary volcano-tectonic and intrusive events have obliterated much of the geologic record, but have left thick accumulations of silicic igneous rocks. In general, Animas River watershed study area stratigraphy consists of a Precambrian crystalline basement overlain by Paleozoic, Mesozoic, and Eocene-age sedimentary rocks, and a 1- to 2-km thick, Oligocene- to Miocene-age volcanic cover (Fig. 2), (Yager and Bove, 2002, Yager and Bove, in press). Mid-Tertiary volcanism Rocks related to the episode of mid-Tertiary volcanism and later alteration are of principle interest in this study. Tertiary volcanic rocks in the San Juan Mountains blanketed more than 25,000 km2, forming one of the great epicontinental volcanic piles of intermediate- to silicic- composition volcanic rocks. Onset of mid-Tertiary volcanism records the construction of stratovolcanoes and volcanic shields built up by thick accumulations of andesite to rhyolite flows and breccias that were followed by several eruption cycles of silicic ash flows. The eruption of ash flows led to caldera formation and localized subsidence.
5
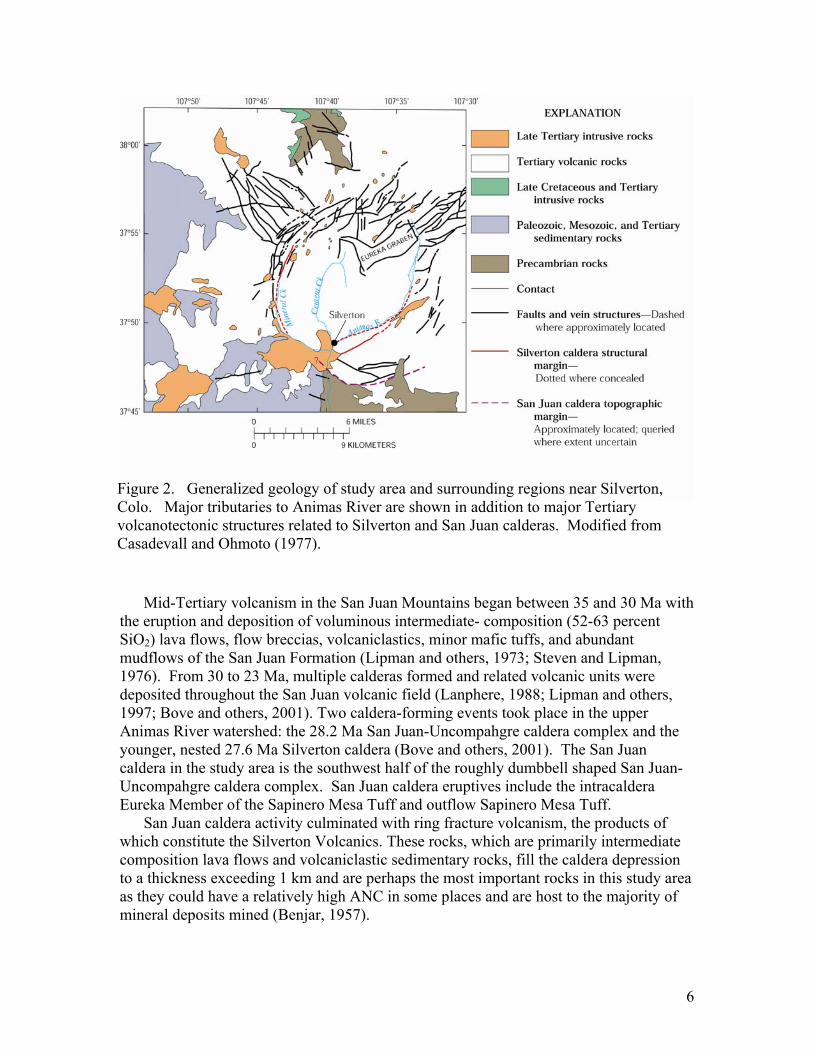
Figure 2. Generalized geology of study area and surrounding regions near Silverton, Colo. Major tributaries to Animas River are shown in addition to major Tertiary volcanotectonic structures related to Silverton and San Juan calderas. Modified from Casadevall and Ohmoto (1977).
Mid-Tertiary volcanism in the San Juan Mountains began between 35 and 30 Ma with the eruption and deposition of voluminous intermediate- composition (52-63 percent SiO2) lava flows, flow breccias, volcaniclastics, minor mafic tuffs, and abundant mudflows of the San Juan Formation (Lipman and others, 1973; Steven and Lipman, 1976). From 30 to 23 Ma, multiple calderas formed and related volcanic units were deposited throughout the San Juan volcanic field (Lanphere, 1988; Lipman and others, 1997; Bove and others, 2001). Two caldera-forming events took place in the upper Animas River watershed: the 28.2 Ma San Juan-Uncompahgre caldera complex and the younger, nested 27.6 Ma Silverton caldera (Bove and others, 2001). The San Juan caldera in the study area is the southwest half of the roughly dumbbell shaped San Juan-Uncompahgre caldera complex. San Juan caldera eruptives include the intracaldera Eureka Member of the Sapinero Mesa Tuff and outflow Sapinero Mesa Tuff. San Juan caldera activity culminated with ring fracture volcanism, the products of which constitute the Silverton Volcanics. These rocks, which are primarily intermediate composition lava flows and volcaniclastic sedimentary rocks, fill the caldera depression to a thickness exceeding 1 km and are perhaps the most important rocks in this study area as they could have a relatively high ANC in some places and are host to the majority of mineral deposits mined (Benjar, 1957).
6

Beginning approximately 1 million years after Silverton caldera formation, numerous stocks, dikes, and other silicic intrusions formed along the Silverton caldera ring fracture zone and are known as the Sultan Mountain stock. The oldest postcaldera granitic stocks (monzonite, monzodiorite, granodiorite, and monzogranite) are about 26.6 Ma and intrude along the southern part of the Silverton caldera ring fracture (Lipman and others, 1976; Ringrose, 1982; Bove and others, 2001). Mineralization and subsequent erosion events The Tertiary volcanotectonic activity was followed by multiple silicic igneous intrusion and mineralization events that span more than 20 million years and have resulted in five major alteration types in the study area (Bove and others, this volume). The multiple alteration and coincident mineralization events postdate caldera collapse, taking place between 26 and 10 Ma (Bove and others, 2001). For a detailed discussion of the alteration types, see Bove and others (in press). Neogene erosion denuded much of the San Juan Mountains volcanic cover. The high potential for erosion developed during this time due to differential displacement of the San Juan Mountains relative to the incipient, adjacent Rio Grande Rift basin to the east and post-mid-Tertiary extensional tectonic activity. Chapin and Cather (1994) estimated Precambrian bedrock offset in adjacent mountain ranges and basins to gauge the amount of late Tertiary relative displacement. Using this technique they determined that an average of 5 km of relative displacement of Precambrian rocks has occurred. They further estimated from basin stratigraphy that 7 - 30 times more sediment was supplied to the Rio Grande Rift basin during the Miocene and Pliocene than in the Pleistocene. Clearly, late Tertiary erosion was important in exposing large surface areas of mineralized terrain and also large areas of igneous bedrock that may have a high ANC. Steven and others (1995) suggested that regional uplift and tilting from 5 to 2 Ma, concurrent with continued active rifting in the Rio Grande Rift to the east, further accelerated erosion and canyon cutting throughout the uplifted area. Quaternary Glaciation and sedimentation Pleistocene, Wisconsin age glaciation greatly altered the San Juan landscape (Atwood and Mather, 1932; Gillam, 1998). The San Juan ice sheet was one of the largest (second only to the Yellowstone-Absaroka) to form south of the upper-mid-latitude Laurentide ice sheet (Atwood and Mather, 1932; Leonard and others, 1993). The San Juan ice sheet covered approximately 5,000 km2, was as much as 1,000 m thick, covered all but the highest peaks, and formed piedmont glaciers that extended to the adjacent foothill areas (Atwood and Mather, 1932). Unstable slope conditions developed after glacier retreat. Weathering processes in glaciated cirque basins and subalpine to alpine mountain valleys have resulted in accumulation of large volumes of talus, debris cone, and landslide deposits. The mineral constituents present in these surficial deposits may influence their acid generating or neutralizing capacities. Numerous surficial deposits in the upper Animas River watershed serve as porous and permeable pathways for surface-water infiltration and ground water flow (Blair and others, 2002). From GIS analysis of a geology coverage, (Yager and Bove, 2001), we estimate that 27 percent of the bedrock in the watershed is covered by between 1 and 5 m
7

or more of Pleistocene to Holocene sedimentary deposits (Yager and Bove, in press). These deposits formed as a result of mass wasting of weathered bedrock outcrops, and accumulated in cirque basins and on slopes and in valleys to form talus, landslides, and colluvium. Alluvial processes have formed multiple generations of stream terraces (Gillam, 1998) and caused deposition of alluvial fans and flood-plain sediments along main drainages and their tributaries (Blair and others, 2002).
ROCK TYPES OF INTEREST FOR POTENTIAL ACID NEUTRALIZATION CAPACITY
Multiple lithologic units throughout the stratigraphic section in or near the study area, from Precambrian basement rocks to Quaternary surficial deposits, have a potentially moderate to high ANC. These rock types are discussed below.1
Precambrian Rocks Precambrian rocks crop out near the periphery of the Animas River watershed study area– principally along the Animas River below Silverton, near Cunningham Creek, near the eastern margin of the watershed, east of the historical Animas Forks townsite, and north of Mount Abrams. Precambrian rocks along the Animas River below Silverton and at the headwaters of Cunningham Creek (sampled in this study) are equivalent to the Irving Formation (Barker, 1969; Luedke and Burbank, 2000). Irving Formation rocks consist of interlayered fine-grained, dark-gray to greenish-gray banded amphibolite with various fine-grained, gray to green, plagioclase-quartz-biotite-bearing gneisses and minor sericite-biotite-chlorite schists (Barker, 1969). Amphibolite is the predominant rock type in the Irving Formation and consists of blue-green hornblende, calcic plagioclase, and epidote; varieties with biotite, chlorite, and quartz are not uncommon (Barker, 1969). In many places, plagioclase-quartz-biotite-bearing gneisses contain one or more of the following phases: chlorite, epidote, microcline, garnet, calcite, magnetite, and pyrite. Regional uplift, tilting to the west, and subsequent retrograde metamorphism (Steven and others, 1969) resulted in formation and concentration of the possible acid-neutralizing mineral assemblage of chlorite-epidote-calcite (Desborough and Driscoll, 1998; Desborough and Yager, 2000). Paleozoic Sedimentary Rocks Paleozoic sedimentary units are primarily exposed south and west of Silverton along the Animas River and in the South Fork Mineral Creek subbasin (Luedke and Burbank, 2000; Yager and Bove, in press). Several of the Paleozoic sedimentary units likely have a high ANC due to the presence of limestone interbeds, calcareous units such as mudstone, and the presence of either limestone clasts or calcite-cemented matrix. Calcareous-bearing units include the Upper Devonian Elbert Formation, Mississippian Leadville-Ouray Limestone, Pennsylvanian Molas Formation, Pennsylvanian Hermosa Formation, and the Permian Cultler Formations. The thickest section of Paleozoic strata is preserved along the Animas River below Silverton and in the subbasins that drain South Fork Mineral Creek.
1 Paleozoic, Mesozoic, and Eocene sedimentary rocks were not investigated for ANC as part of this study.
8
Mesozoic Sedimentary Rocks Mesozoic-age rocks are best exposed near the Animas River watershed margins, outside the Tertiary calderas in the headwater subbasins of South Fork Mineral Creek (Luedke and Burbank, 2000; Yager and Bove, in press), As with the Paleozoic section, several units in the Mesozoic sedimentary section contain calcareous-bearing units such as the Triassic Delores Formation, the Jurassic Morrison Formation, and the Jurassic Wanakah Formation.
Tertiary Sedimentary Rocks Tertiary sedimentary rocks in the Animas River watershed crop out in the western and southern part if the study area, and are composed of the Eocene Telluride Conglomerate. Lower layers within the Telluride Conglomerate contain rounded to subangular cobbles of Mesozoic and Paleozoic red sandstone and limestone and are thus an important unit for its high ANC potential. Tertiary Igneous Rocks Rocks of the San Juan Formation represent the oldest Tertiary units sampled and are exposed outward from the Silverton caldera structural margin in the Mineral Creek Basin and near the San Juan caldera margin south of Silverton in the vicinity of Cunningham Creek and Deer Park Creek, among other Animas River subbasins. The San Juan Formation is primarily composed of intermediate composition volcaniclastic sedimentary rocks; however, minor intercalated andesitic lavas are typically porphyritic and consist of plagioclase, clinopyroxene, hornblende, and opaque oxide primary phases. This unit along with all other igneous units studied is altered to a secondary propylitic mineral assemblage (see below). Subsequent to deposition of the San Juan Formation, ash flows were deposited in response to collapse of both the San Juan and younger nested Silverton calderas and are sources of the Eureka Member of the Sapinero Mesa Tuff and the Crystal Lake Tuff, respectively. The Eureka Member of the Sapenero Mesa Tuff is the intracaldera equivalent of the Sapenero Mesa Tuff, is dacitic to rhyolitic in composition and contains phenocrysts of plagioclase, with lesser amounts of sanidine, biotite, and trace augite. The Crystal Lake Tuff is volumetrically minor in comparison to the Sapenero Mesa Tuff and thus was not sampled. During San Juan caldera formation, limestone units of the Leadville and Ouray Limestone caved inward toward the central core of the caldera forming megabreccia. One such megabreccia block crops out near the Highland Mary Mine in the Cunningham Creek subbasin. San Juan caldera activity culminated with ring fracture volcanism, the products of which constitute the Silverton Volcanics. These rocks fill the caldera depression to a thickness exceeding 1 km. The Burns Member of the Silverton Volcanics is characterized mainly by propylitically altered lavas. The Pyroxene Andesite member, which generally overlies the Burns Member, is mainly composed of intermediate composition lava flows with a trend toward more mafic compositions (Yager and Bove, in press), and tends to be somewhat less altered than the Burns Member. The volcaniclastic sedimentary rocks of the Henson Member interfinger with both the Burns and the pyroxene andesite members
9

(Lipman, 1976). The Henson Member of the Silverton Volcanics (unsampled for this study) is in most places the capping member of this volcanic sequence and is composed mostly of volcaniclastic sedimentary rocks. In general, lavas of the Silverton Volcanics are porphyritic and typically contain phenocrysts of plagioclase, amphibole, pyroxene, opaque oxides, and minor biotite, in a fine-grained to aphanitic groundmass. Late-stage, 23-to-10 Ma dacitic to rhyolitic intrusions emplaced along the north and northwest structural margin of the Silverton caldera were concomitant with hydrothermal alteration and related mineralization (Bove and others, in press). Dacitic intrusions dated at 23 Ma in the Red Mountain mining district are coarsely porphyritic, containing large (1 cm) phenocrysts of potassium feldspar, plagioclase, quartz, and biotite in a fine-grained groundmass. Regional Propylitic Alteration Regional propylitic alteration identified by Burbank (1960) and described further in Bove and others (in press) as a “pre-ore propylitization” event has affected most igneous rocks in the vicinity of the San Juan-Uncompahgre and Silverton caldera complex (Fig. 3). The mineralogy of this assemblage, although variable, consists of quartz, chlorite, epidote, calcite, secondary potassium feldspar, albite, pyrite, and opaque oxides in the presence of unaltered to slightly altered primary feldspar crystals. This alteration type is thought to have formed during the period 28.2 Ma to about 27.6 Ma, as the nearly 1 km sequence of Silverton Volcanics lavas that infilled the San Juan caldera cooled, and in the process of cooling, degassed volatile constituents. Large quantities of carbon dioxide (CO2), perhaps the primary rock-altering volatile component (among others such as water (H2O) and sulfur dioxide (SO2), were released during cooling, altering the original minerals and matrix of the country rock (Burbank, 1960, Bove and others, in press). Rocks that have experienced this type of alteration commonly have a greenish hue in outcrop owing to the presence of chlorite and epidote. Where pyrite is either sparse or absent, the propylitic assemblage can supply some ANC. The subsequent, more intense alteration and mineralization events that were commonly focused along vein structures related to San Juan and Silverton caldera formation in several places overprint the regionally pervasive propylitic alteration assemblage and locally eliminate any ANC of the propylitic assemblage (Fig. 3).
10

Figure 3. Generalized alteration map of Animas River watershed study area. Data in (Bove and others, in press, Yager and others, in press).
Quaternary Surficial Deposits Weathering of mineralized bedrock and subsequent deposition of weathered material in downslope surficial deposits will result in acid generation, as water infiltrates and reacts with pyrite and other acid-generating minerals. In contrast, water infiltrating surficial deposits containing abundant propylitic rocks with the mineral assemblage chlorite-epidote-calcite will probably undergo some reduction in acidity (Desborough and Yager, 2000; Yager and others, 2000; Wirt and others, in press).
11
12
METHODS Sample preparation A suite of 32 composite rock samples was collected in September 2003 for ANC study (table 1). Sample sites were chosen to be representative of the lithologies preserved in several geographic areas (plate 1). Sampling was mainly focused on the most volumetrically important igneous rock types that are host to the majority of mineralization, such as the thick sequence of Silverton Volcanics lavas north of Silverton, Colorado. Additional hand specimens were collected from several of the other Tertiary igneous units, from the Precambrian Irving Formation Gneiss, and from two drill cores collected in September, 2004. Splits of all samples were first jaw-crushed using steel plates to pebble-size, then pulverized to approximately <200 mesh (70µm) in an agate shatterbox for wavelength dispersive x-ray Fluorescence (WDXRF) analyses (table 2), x-ray diffractometry (XRD) semi-quantitative mineralogy using the Rietveld method (Young, R.A., 1993; Raudsepp and Pani, 2003) (Table 3), total carbon-carbonate analyses (table 4), 40-element inductively coupled plasma analyses (ICP-AES) (Table 5), and for Net Acid Production (Lapakko, 1993). Additional splits were crushed and sieved to less than 2 millimeter (mm) for ANC acid titration experiments. One sample was sieved to between the less than 80 (< 180 μm) and greater than 120 (<125 μm) standard mesh size for a chlorite mineral separation and subsequent acid titration. None of the samples was subjected to grinding during any preparation process. Grinding could lead to surface exposure and water-mineral reactions on layered chlorite surfaces not commonly found in natural weathering processes. Such surfaces may not be exposed during normal weathering processes involving freeze-thaw cycles, rainfall precipitation events, and grain-to-grain abrasion that occurs during fluvial transport. Magnetic rock properties One-inch (2.54 cm) diameter cylindrical core plugs approximately 1-inch in length were prepared from all samples. Magnetic susceptibilities were measured from the cores using a Bison Magnetic Susceptibility Bridge2 and are reported in Table 6.
Use of trade names does not imply endorsement by the U.S. Geological Survey2
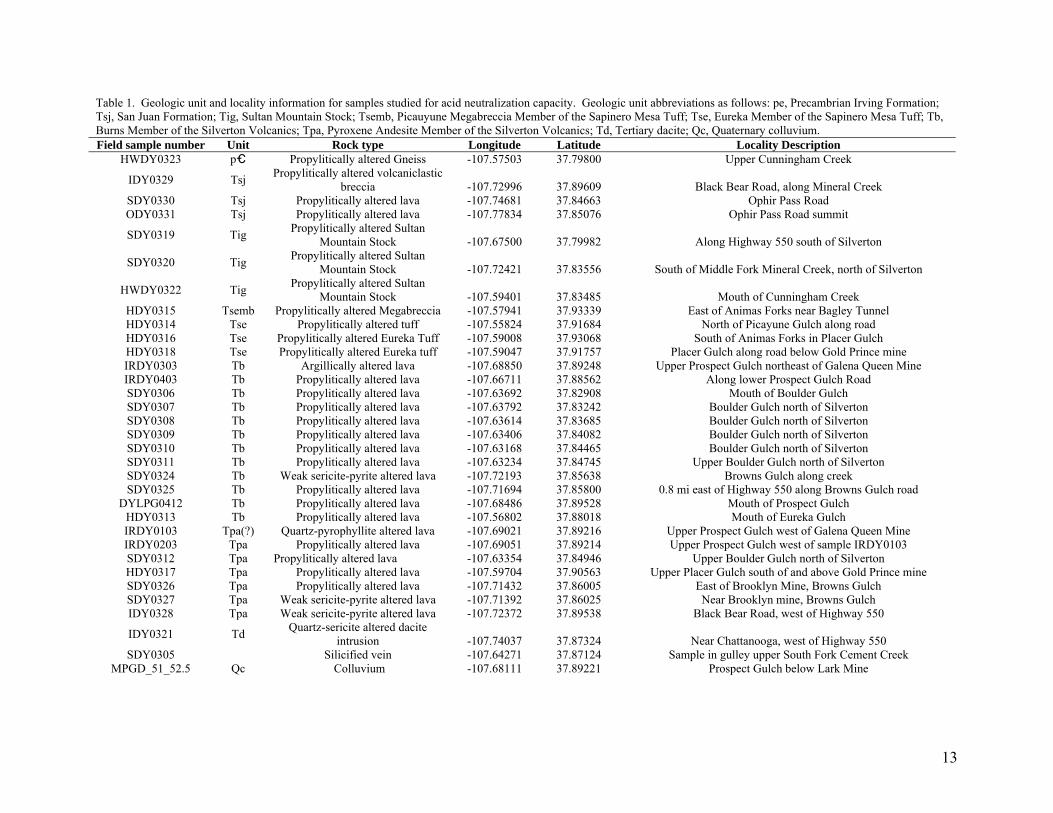
Table 1. Geologic unit and locality information for samples studied for acid neutralization capacity. Geologic unit abbreviations as follows: pe, Precambrian Irving Formation; Tsj, San Juan Formation; Tig, Sultan Mountain Stock; Tsemb, Picauyune Megabreccia Member of the Sapinero Mesa Tuff; Tse, Eureka Member of the Sapinero Mesa Tuff; Tb, Burns Member of the Silverton Volcanics; Tpa, Pyroxene Andesite Member of the Silverton Volcanics; Td, Tertiary dacite; Qc, Quaternary colluvium. Field sample number Unit Rock type Longitude Latitude Locality Description
HWDY0323 pe Propylitically altered Gneiss -107.57503 37.79800 Upper Cunningham Creek
IDY0329 Tsj Propylitically altered volcaniclastic breccia -107.72996 37.89609 Black Bear Road, along Mineral Creek
SDY0330 Tsj Propylitically altered lava -107.74681 37.84663 Ophir Pass Road ODY0331 Tsj Propylitically altered lava -107.77834 37.85076 Ophir Pass Road summit
SDY0319 Tig Propylitically altered Sultan Mountain Stock -107.67500 37.79982 Along Highway 550 south of Silverton
SDY0320 Tig Propylitically altered Sultan Mountain Stock -107.72421 37.83556 South of Middle Fork Mineral Creek, north of Silverton
HWDY0322 Tig Propylitically altered Sultan Mountain Stock -107.59401 37.83485 Mouth of Cunningham Creek
HDY0315 Tsemb Propylitically altered Megabreccia -107.57941 37.93339 East of Animas Forks near Bagley Tunnel HDY0314 Tse Propylitically altered tuff -107.55824 37.91684 North of Picayune Gulch along road HDY0316 Tse Propylitically altered Eureka Tuff -107.59008 37.93068 South of Animas Forks in Placer Gulch HDY0318 Tse Propylitically altered Eureka tuff -107.59047 37.91757 Placer Gulch along road below Gold Prince mine IRDY0303 Tb Argillically altered lava -107.68850 37.89248 Upper Prospect Gulch northeast of Galena Queen Mine IRDY0403 Tb Propylitically altered lava -107.66711 37.88562 Along lower Prospect Gulch Road SDY0306 Tb Propylitically altered lava -107.63692 37.82908 Mouth of Boulder Gulch SDY0307 Tb Propylitically altered lava -107.63792 37.83242 Boulder Gulch north of Silverton SDY0308 Tb Propylitically altered lava -107.63614 37.83685 Boulder Gulch north of Silverton SDY0309 Tb Propylitically altered lava -107.63406 37.84082 Boulder Gulch north of Silverton SDY0310 Tb Propylitically altered lava -107.63168 37.84465 Boulder Gulch north of Silverton SDY0311 Tb Propylitically altered lava -107.63234 37.84745 Upper Boulder Gulch north of Silverton SDY0324 Tb Weak sericite-pyrite altered lava -107.72193 37.85638 Browns Gulch along creek SDY0325 Tb Propylitically altered lava -107.71694 37.85800 0.8 mi east of Highway 550 along Browns Gulch road
DYLPG0412 Tb Propylitically altered lava -107.68486 37.89528 Mouth of Prospect Gulch HDY0313 Tb Propylitically altered lava -107.56802 37.88018 Mouth of Eureka Gulch IRDY0103 Tpa(?) Quartz-pyrophyllite altered lava -107.69021 37.89216 Upper Prospect Gulch west of Galena Queen Mine IRDY0203 Tpa Propylitically altered lava -107.69051 37.89214 Upper Prospect Gulch west of sample IRDY0103 SDY0312 Tpa Propylitically altered lava -107.63354 37.84946 Upper Boulder Gulch north of Silverton HDY0317 Tpa Propylitically altered lava -107.59704 37.90563 Upper Placer Gulch south of and above Gold Prince mine SDY0326 Tpa Propylitically altered lava -107.71432 37.86005 East of Brooklyn Mine, Browns Gulch SDY0327 Tpa Weak sericite-pyrite altered lava -107.71392 37.86025 Near Brooklyn mine, Browns Gulch IDY0328 Tpa Weak sericite-pyrite altered lava -107.72372 37.89538 Black Bear Road, west of Highway 550
IDY0321 Td Quartz-sericite altered dacite intrusion -107.74037 37.87324 Near Chattanooga, west of Highway 550
SDY0305 Silicified vein -107.64271 37.87124 Sample in gulley upper South Fork Cement Creek MPGD_51_52.5 Qc Colluvium -107.68111 37.89221 Prospect Gulch below Lark Mine
13
14
W alys ovid seph ga .S. Ge ical SurvDXRF an es pr ed by Jo E. Tag rt, U olog ey.
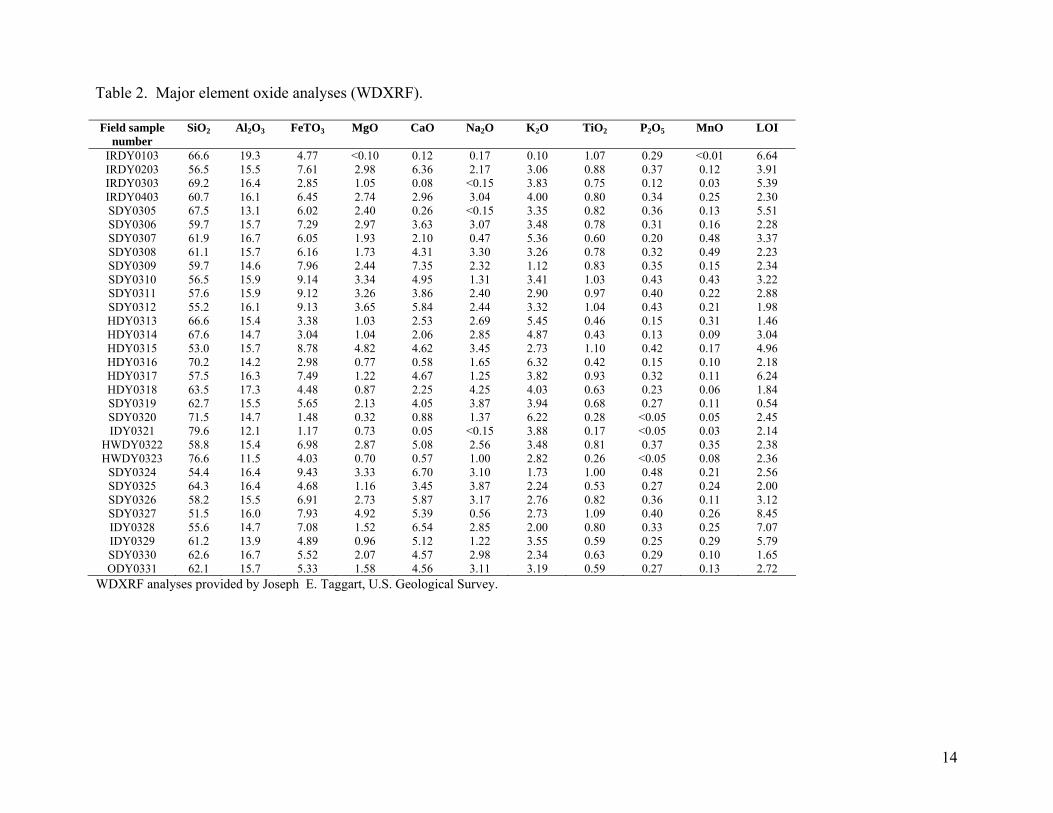
Field sample number
SiO2 Al2O3 FeTO3 MgO CaO Na2O K2O TiO2 P2O5 MnO LOI
IRDY0103 66.6 19.3 4.77 <0.10 0.12 0.17 0.10 1.07 0.29 <0.01 6.64 IRDY0203 56.5 15.5 7.61 2.98 6.36 2.17 3.06 0.88 0.37 0.12 3.91 IRDY0303 69.2 16.4 2.85 1.05 0.08 <0.15 3.83 0.75 0.12 0.03 5.39 IRDY0403 60.7 16.1 6.45 2.74 2.96 3.04 4.00 0.80 0.34 0.25 2.30 SDY0305 67.5 13.1 6.02 2.40 0.26 <0.15 3.35 0.82 0.36 0.13 5.51 SDY0306 59.7 15.7 7.29 2.97 3.63 3.07 3.48 0.78 0.31 0.16 2.28 SDY0307 61.9 16.7 6.05 1.93 2.10 0.47 5.36 0.60 0.20 0.48 3.37 SDY0308 61.1 15.7 6.16 1.73 4.31 3.30 3.26 0.78 0.32 0.49 2.23 SDY0309 59.7 14.6 7.96 2.44 7.35 2.32 1.12 0.83 0.35 0.15 2.34 SDY0310 56.5 15.9 9.14 3.34 4.95 1.31 3.41 1.03 0.43 0.43 3.22 SDY0311 57.6 15.9 9.12 3.26 3.86 2.40 2.90 0.97 0.40 0.22 2.88 SDY0312 55.2 16.1 9.13 3.65 5.84 2.44 3.32 1.04 0.43 0.21 1.98 HDY0313 66.6 15.4 3.38 1.03 2.53 2.69 5.45 0.46 0.15 0.31 1.46 HDY0314 67.6 14.7 3.04 1.04 2.06 2.85 4.87 0.43 0.13 0.09 3.04 HDY0315 53.0 15.7 8.78 4.82 4.62 3.45 2.73 1.10 0.42 0.17 4.96 HDY0316 70.2 14.2 2.98 0.77 0.58 1.65 6.32 0.42 0.15 0.10 2.18 HDY0317 57.5 16.3 7.49 1.22 4.67 1.25 3.82 0.93 0.32 0.11 6.24 HDY0318 63.5 17.3 4.48 0.87 2.25 4.25 4.03 0.63 0.23 0.06 1.84 SDY0319 62.7 15.5 5.65 2.13 4.05 3.87 3.94 0.68 0.27 0.11 0.54 SDY0320 71.5 14.7 1.48 0.32 0.88 1.37 6.22 0.28 <0.05 0.05 2.45 IDY0321 79.6 12.1 1.17 0.73 0.05 <0.15 3.88 0.17 <0.05 0.03 2.14
HWDY0322 58.8 15.4 6.98 2.87 5.08 2.56 3.48 0.81 0.37 0.35 2.38 HWDY0323 76.6 11.5 4.03 0.70 0.57 1.00 2.82 0.26 <0.05 0.08 2.36
SDY0324 54.4 16.4 9.43 3.33 6.70 3.10 1.73 1.00 0.48 0.21 2.56 SDY0325 64.3 16.4 4.68 1.16 3.45 3.87 2.24 0.53 0.27 0.24 2.00 SDY0326 58.2 15.5 6.91 2.73 5.87 3.17 2.76 0.82 0.36 0.11 3.12 SDY0327 51.5 16.0 7.93 4.92 5.39 0.56 2.73 1.09 0.40 0.26 8.45 IDY0328 55.6 14.7 7.08 1.52 6.54 2.85 2.00 0.80 0.33 0.25 7.07 IDY0329 61.2 13.9 4.89 0.96 5.12 1.22 3.55 0.59 0.25 0.29 5.79 SDY0330 62.6 16.7 5.52 2.07 4.57 2.98 2.34 0.63 0.29 0.10 1.65 ODY0331 62.1 15.7 5.33 1.58 4.56 3.11 3.19 0.59 0.27 0.13 2.72
Table 2. Major element oxide analyses (WDXRF).

Table 3. Mineralogy determined by X-ray diffractometry (XRD) analysis (values reported in weight percent).
Field sample number
Unit Calcite Clinochlore Epidote Hematite Hornblende Kaolinite Magnetite
HWDY0323 pe 2 8 IDY0329 Tsj 8 9 SDY0330 Tsj 11 7 ODY0331 Tsj 3 12 8 1 SDY0319 Tig 3 16 7 SDY0320 Tig 3 4
HWDY0322 Tig < 1 20 14 1.5 HDY0315 Tsemb 6 25 2 HDY0314 Tse 5 6 5 HDY0316 Tse 6 HDY0318 Tse 2 9 4 IRDY0303 Tb 2 2 (?) IRDY0403 Tb 24 1 SDY0306 Tb 19 5 SDY0307 Tb 18 SDY0308 Tb 18 SDY0309 Tb 14 19 < 1 SDY0310 Tb 18 11 SDY0311 Tb 20 5 1 SDY0324 Tb 20 5 12 4 SDY0325 Tb 12 6
DYLPG0412 Tb n/a n/a n/a n/a n/a n/a n/a HDY0313 Tb 12 7 IRDY0103 Tsv
IRDY0203 Tpa (?)
2 8 5
6
SDY0312 Tpa 9 9 11 HDY0317 Tpa 10 13 3 2 SDY0326 Tpa 3 7 8 SDY0327 Tpa 9 15 IDY0328 Tpa 10 14 IDY0321 Td 3 SDY0305 vein 6
Note: Rietveld XRD analyses provided by Stephen J. Sutley, U.S. Geological Survey. Accuracy and precision using the Rietveld method were shown to vary based on phase abundance. In another study (Raudsepp, and others, 1999) demonstrated that in complex mixtures of varying proportions of skarn minerals that included wollastonite as the major phase, the accuracy ranged from 1.3% to 6% containing wollastonite in mixtures of 30 to 90 weight percent and 6 weight percent respectively.
15

Table 3 (cont.). Field sample
number Unit Mica
(sericite) Plagioclase Potassium
feldspar Pyrite Pyrophyllite Quartz Sphalerite
HWDY0323 pe 24 7 58 IDY0329 Tsj 27 15 3 38 SDY0330 Tsj 11 29 8 33 ODY0331 Tsj 10 29 11 27 SDY0319 Tig 3 36 18 17 SDY0320 Tig 23 13 19 38
HWDY0322 Tig 23 21 < 1 20 HDY0315 Tsemb 3 35 14 15 HDY0314 Tse 12 28 10 33 HDY0316 Tse 12 15 26 2 38 HDY0318 Tse 13 39 13 < 1 19 IRDY0303 Tb 21 2 11 IRDY0403 Tb 9 29 16 21 SDY0306 Tb 5 32 22 17 SDY0307 Tb 33 5 7 37 SDY0308 Tb 30 22 < 1 28 SDY0309 Tb 21 11 34 SDY0310 Tb 7 18 12 32 SDY0311 Tb 7 26 16 27 SDY0324 Tb 32 13 1 12 SDY0325 Tb 11 34 8 < 1 28
DYLPG0412 Tb n/a n/a n/a n/a n/a n/a n/a HDY0313 Tb 7 26 22 25 IRDY0103 Tsv < 1 10 60 28 2
IRDY0203 Tpa (?)
7 49 < 1 1 21
SDY0312 Tpa 39 16 16 HDY0317 Tpa 32 12 29 SDY0326 Tpa 3 7 8 SDY0327 Tpa 9 15 IDY0328 Tpa 10 14 IDY0321 Td 35 62 SDY0305 vein 29 12 53
Note: Sericite is used throughout this report. The term sericite is a field and petrographic term used to describe samples containing micaceaous minerals that are not definitively identified by x-ray diffractometry or by another analytical method. Samples containing sericite in this study are most similar to fine-grained muscovite but could contain illite.
16
17
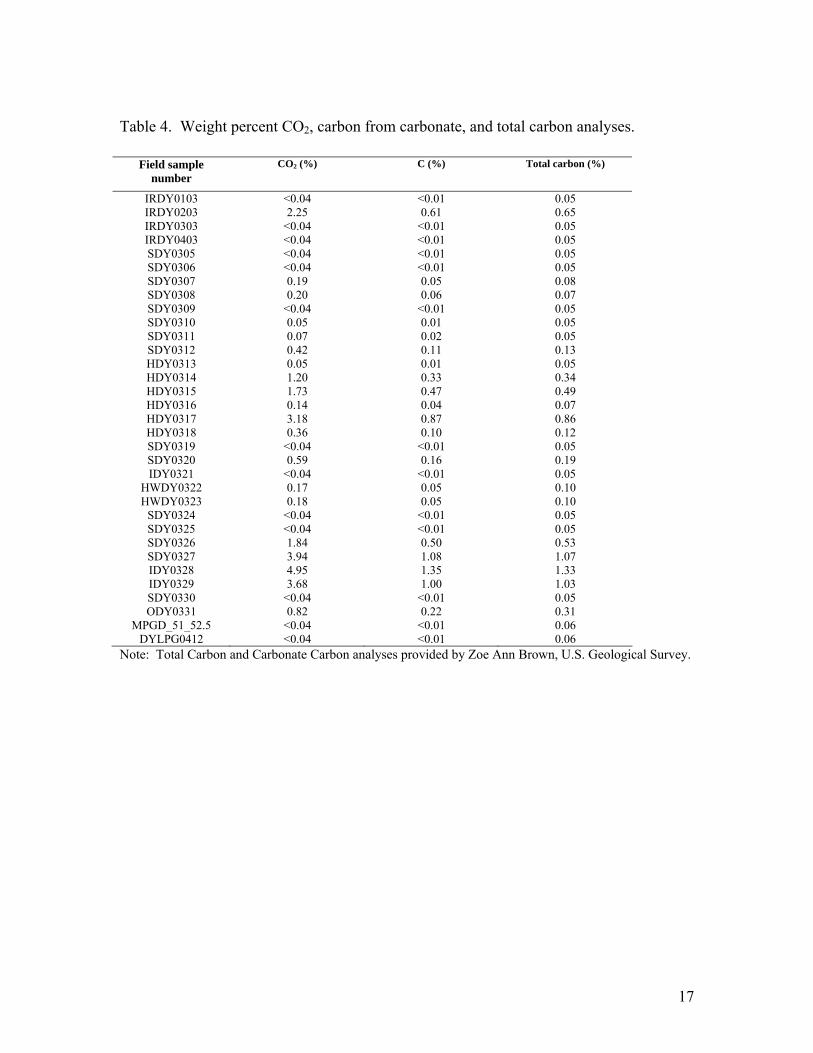
Table 4. Weight percent CO2, carbon from carbonate, and total carbon analyses.
Field sample number
CO2 (%)
C (%)
Total carbon (%)
IRDY0103 <0.04 <0.01 0.05 IRDY0203 2.25 0.61 0.65 IRDY0303 <0.04 <0.01 0.05 IRDY0403 <0.04 <0.01 0.05 SDY0305 <0.04 <0.01 0.05 SDY0306 <0.04 <0.01 0.05 SDY0307 0.19 0.05 0.08 SDY0308 0.20 0.06 0.07 SDY0309 <0.04 <0.01 0.05 SDY0310 0.05 0.01 0.05 SDY0311 0.07 0.02 0.05 SDY0312 0.42 0.11 0.13 HDY0313 0.05 0.01 0.05 HDY0314 1.20 0.33 0.34 HDY0315 1.73 0.47 0.49 HDY0316 0.14 0.04 0.07 HDY0317 3.18 0.87 0.86 HDY0318 0.36 0.10 0.12 SDY0319 <0.04 <0.01 0.05 SDY0320 0.59 0.16 0.19 IDY0321 <0.04 <0.01 0.05
HWDY0322 0.17 0.05 0.10 HWDY0323 0.18 0.05 0.10
SDY0324 <0.04 <0.01 0.05 SDY0325 <0.04 <0.01 0.05 SDY0326 1.84 0.50 0.53 SDY0327 3.94 1.08 1.07 IDY0328 4.95 1.35 1.33 IDY0329 3.68 1.00 1.03 SDY0330 <0.04 <0.01 0.05 ODY0331 0.82 0.22 0.31
MPGD_51_52.5 <0.04 <0.01 0.06 DYLPG0412 <0.04 <0.01 0.06
Note: Total Carbon and Carbonate Carbon analyses provided by Zoe Ann Brown, U.S. Geological Survey.
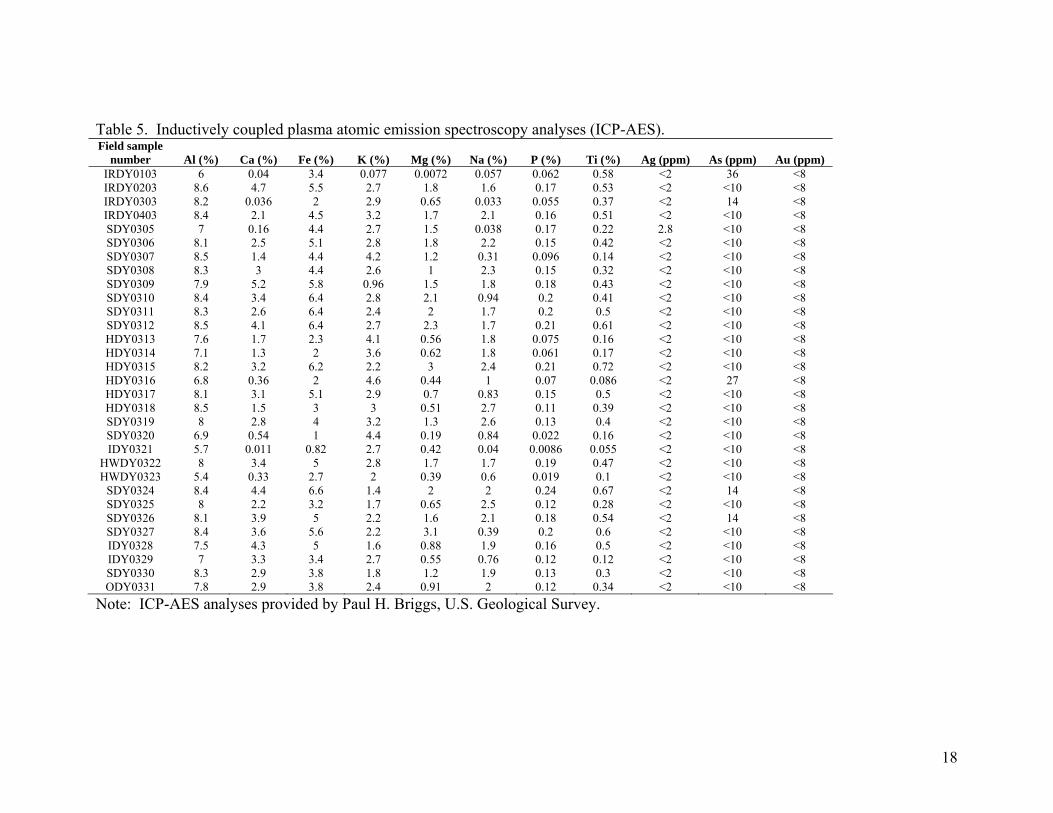
Table 5. Inductively coupled plasma atomic emission spectroscopy analyses (ICP-AES). Field sample
number Al (%) Ca (%) Fe (%) K (%) Mg (%) Na (%) P (%) Ti (%) Ag (ppm) As (ppm) Au (ppm) IRDY0103 6 0.04 3.4 0.077 0.0072 0.057 0.062 0.58 <2 36 <8 IRDY0203 8.6 4.7 5.5 2.7 1.8 1.6 0.17 0.53 <2 <10 <8 IRDY0303 8.2 0.036 2 2.9 0.65 0.033 0.055 0.37 <2 14 <8 IRDY0403 8.4 2.1 4.5 3.2 1.7 2.1 0.16 0.51 <2 <10 <8 SDY0305 7 0.16 4.4 2.7 1.5 0.038 0.17 0.22 2.8 <10 <8 SDY0306 8.1 2.5 5.1 2.8 1.8 2.2 0.15 0.42 <2 <10 <8 SDY0307 8.5 1.4 4.4 4.2 1.2 0.31 0.096 0.14 <2 <10 <8 SDY0308 8.3 3 4.4 2.6 1 2.3 0.15 0.32 <2 <10 <8 SDY0309 7.9 5.2 5.8 0.96 1.5 1.8 0.18 0.43 <2 <10 <8 SDY0310 8.4 3.4 6.4 2.8 2.1 0.94 0.2 0.41 <2 <10 <8 SDY0311 8.3 2.6 6.4 2.4 2 1.7 0.2 0.5 <2 <10 <8 SDY0312 8.5 4.1 6.4 2.7 2.3 1.7 0.21 0.61 <2 <10 <8 HDY0313 7.6 1.7 2.3 4.1 0.56 1.8 0.075 0.16 <2 <10 <8 HDY0314 7.1 1.3 2 3.6 0.62 1.8 0.061 0.17 <2 <10 <8 HDY0315 8.2 3.2 6.2 2.2 3 2.4 0.21 0.72 <2 <10 <8 HDY0316 6.8 0.36 2 4.6 0.44 1 0.07 0.086 <2 27 <8 HDY0317 8.1 3.1 5.1 2.9 0.7 0.83 0.15 0.5 <2 <10 <8 HDY0318 8.5 1.5 3 3 0.51 2.7 0.11 0.39 <2 <10 <8 SDY0319 8 2.8 4 3.2 1.3 2.6 0.13 0.4 <2 <10 <8 SDY0320 6.9 0.54 1 4.4 0.19 0.84 0.022 0.16 <2 <10 <8 IDY0321 5.7 0.011 0.82 2.7 0.42 0.04 0.0086 0.055 <2 <10 <8
HWDY0322 8 3.4 5 2.8 1.7 1.7 0.19 0.47 <2 <10 <8 HWDY0323 5.4 0.33 2.7 2 0.39 0.6 0.019 0.1 <2 <10 <8
SDY0324 8.4 4.4 6.6 1.4 2 2 0.24 0.67 <2 14 <8 SDY0325 8 2.2 3.2 1.7 0.65 2.5 0.12 0.28 <2 <10 <8 SDY0326 8.1 3.9 5 2.2 1.6 2.1 0.18 0.54 <2 14 <8 SDY0327 8.4 3.6 5.6 2.2 3.1 0.39 0.2 0.6 <2 <10 <8 IDY0328 7.5 4.3 5 1.6 0.88 1.9 0.16 0.5 <2 <10 <8 IDY0329 7 3.3 3.4 2.7 0.55 0.76 0.12 0.12 <2 <10 <8 SDY0330 8.3 2.9 3.8 1.8 1.2 1.9 0.13 0.3 <2 <10 <8 ODY0331 7.8 2.9 3.8 2.4 0.91 2 0.12 0.34 <2 <10 <8
Note: ICP-AES analyses provided by Paul H. Briggs, U.S. Geological Survey.
18
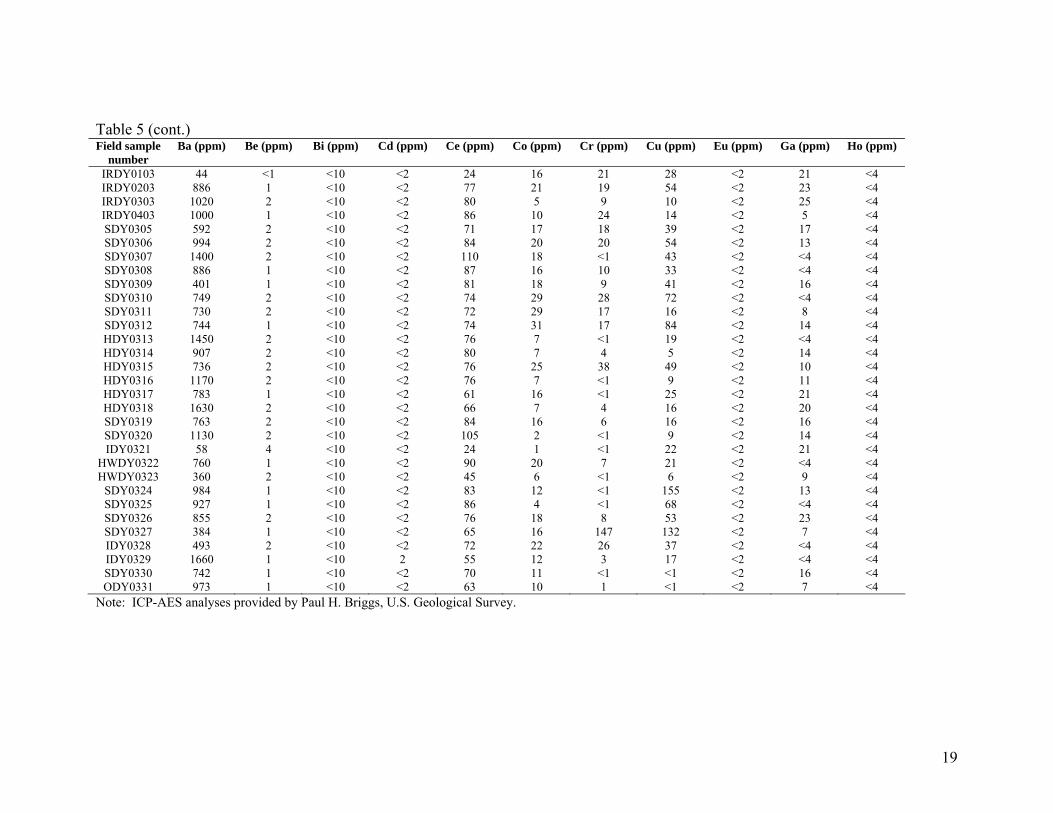
Table 5 (cont.) Field sample
number Ba (ppm) Be (ppm) Bi (ppm) Cd (ppm) Ce (ppm) Co (ppm) Cr (ppm) Cu (ppm) Eu (ppm) Ga (ppm) Ho (ppm)
IRDY0103 44 <1 <10 <2 24 16 21 28 <2 21 <4 IRDY0203 886 1 <10 <2 77 21 19 54 <2 23 <4 IRDY0303 1020 2 <10 <2 80 5 9 10 <2 25 <4 IRDY0403 1000 1 <10 <2 86 10 24 14 <2 5 <4 SDY0305 592 2 <10 <2 71 17 18 39 <2 17 <4 SDY0306 994 2 <10 <2 84 20 20 54 <2 13 <4 SDY0307 1400 2 <10 <2 110 18 <1 43 <2 <4 <4 SDY0308 886 1 <10 <2 87 16 10 33 <2 <4 <4 SDY0309 401 1 <10 <2 81 18 9 41 <2 16 <4 SDY0310 749 2 <10 <2 74 29 28 72 <2 <4 <4 SDY0311 730 2 <10 <2 72 29 17 16 <2 8 <4 SDY0312 744 1 <10 <2 74 31 17 84 <2 14 <4 HDY0313 1450 2 <10 <2 76 7 <1 19 <2 <4 <4 HDY0314 907 2 <10 <2 80 7 4 5 <2 14 <4 HDY0315 736 2 <10 <2 76 25 38 49 <2 10 <4 HDY0316 1170 2 <10 <2 76 7 <1 9 <2 11 <4 HDY0317 783 1 <10 <2 61 16 <1 25 <2 21 <4 HDY0318 1630 2 <10 <2 66 7 4 16 <2 20 <4 SDY0319 763 2 <10 <2 84 16 6 16 <2 16 <4 SDY0320 1130 2 <10 <2 105 2 <1 9 <2 14 <4 IDY0321 58 4 <10 <2 24 1 <1 22 <2 21 <4
HWDY0322 760 1 <10 <2 90 20 7 21 <2 <4 <4 HWDY0323 360 2 <10 <2 45 6 <1 6 <2 9 <4
SDY0324 984 1 <10 <2 83 12 <1 155 <2 13 <4 SDY0325 927 1 <10 <2 86 4 <1 68 <2 <4 <4 SDY0326 855 2 <10 <2 76 18 8 53 <2 23 <4 SDY0327 384 1 <10 <2 65 16 147 132 <2 7 <4 IDY0328 493 2 <10 <2 72 22 26 37 <2 <4 <4 IDY0329 1660 1 <10 2 55 12 3 17 <2 <4 <4 SDY0330 742 1 <10 <2 70 11 <1 <1 <2 16 <4 ODY0331 973 1 <10 <2 63 10 1 <1 <2 7 <4
Note: ICP-AES analyses provided by Paul H. Briggs, U.S. Geological Survey.
19
20
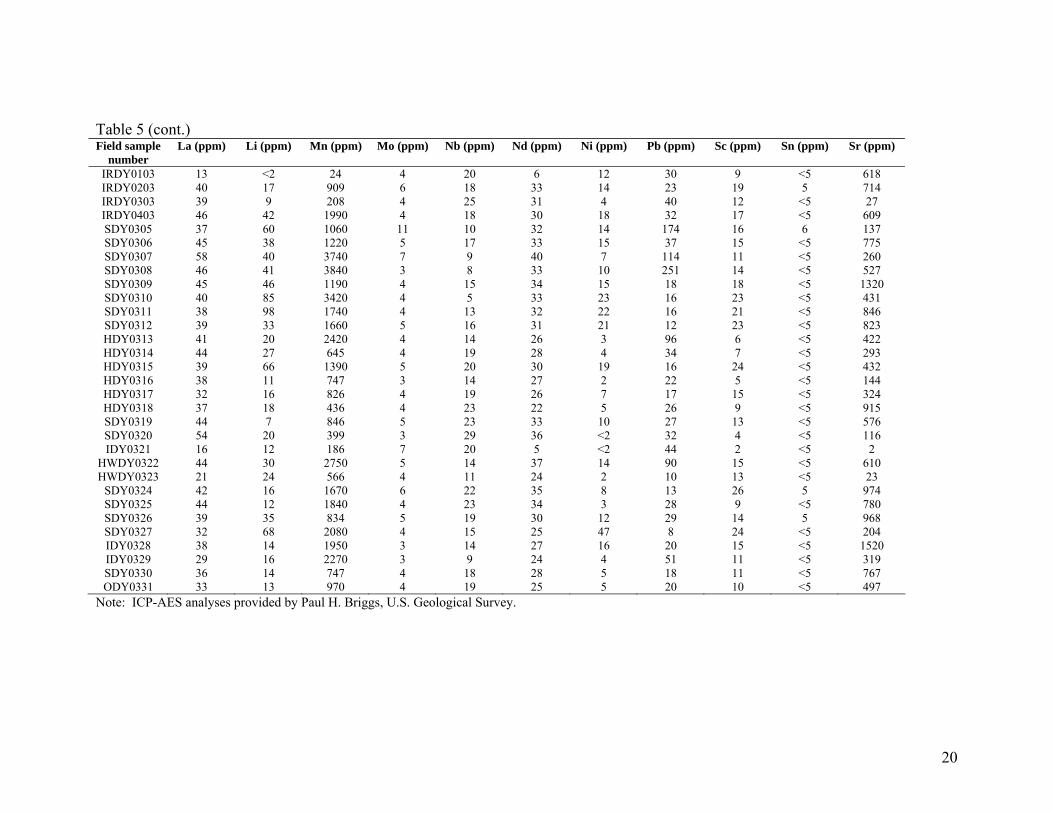
Table 5 (cont.) Field sample
number La (ppm) Li (ppm) Mn (ppm) Mo (ppm) Nb (ppm) Nd (ppm) Ni (ppm) Pb (ppm) Sc (ppm) Sn (ppm) Sr (ppm)
IRDY0103 13 <2 24 4 20 6 12 30 9 <5 618 IRDY0203 40 17 909 6 18 33 14 23 19 5 714 IRDY0303 39 9 208 4 25 31 4 40 12 <5 27 IRDY0403 46 42 1990 4 18 30 18 32 17 <5 609 SDY0305 37 60 1060 11 10 32 14 174 16 6 137 SDY0306 45 38 1220 5 17 33 15 37 15 <5 775 SDY0307 58 40 3740 7 9 40 7 114 11 <5 260 SDY0308 46 41 3840 3 8 33 10 251 14 <5 527 SDY0309 45 46 1190 4 15 34 15 18 18 <5 1320 SDY0310 40 85 3420 4 5 33 23 16 23 <5 431 SDY0311 38 98 1740 4 13 32 22 16 21 <5 846 SDY0312 39 33 1660 5 16 31 21 12 23 <5 823 HDY0313 41 20 2420 4 14 26 3 96 6 <5 422 HDY0314 44 27 645 4 19 28 4 34 7 <5 293 HDY0315 39 66 1390 5 20 30 19 16 24 <5 432 HDY0316 38 11 747 3 14 27 2 22 5 <5 144 HDY0317 32 16 826 4 19 26 7 17 15 <5 324 HDY0318 37 18 436 4 23 22 5 26 9 <5 915 SDY0319 44 7 846 5 23 33 10 27 13 <5 576 SDY0320 54 20 399 3 29 36 <2 32 4 <5 116 IDY0321 16 12 186 7 20 5 <2 44 2 <5 2
HWDY0322 44 30 2750 5 14 37 14 90 15 <5 610 HWDY0323 21 24 566 4 11 24 2 10 13 <5 23
SDY0324 42 16 1670 6 22 35 8 13 26 5 974 SDY0325 44 12 1840 4 23 34 3 28 9 <5 780 SDY0326 39 35 834 5 19 30 12 29 14 5 968 SDY0327 32 68 2080 4 15 25 47 8 24 <5 204 IDY0328 38 14 1950 3 14 27 16 20 15 <5 1520 IDY0329 29 16 2270 3 9 24 4 51 11 <5 319 SDY0330 36 14 747 4 18 28 5 18 11 <5 767 ODY0331 33 13 970 4 19 25 5 20 10 <5 497
Note: ICP-AES analyses provided by Paul H. Briggs, U.S. Geological Survey.
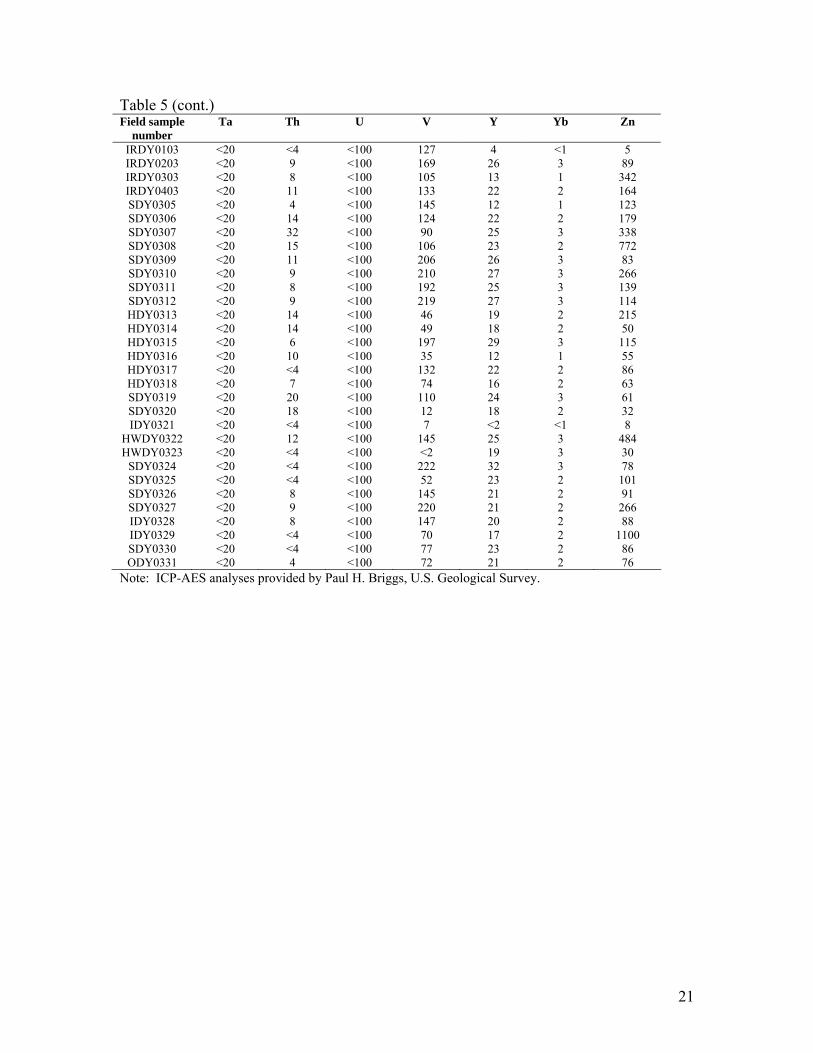
Table 5 (cont.) Field sample
number Ta Th U V Y Yb Zn
IRDY0103 <20 <4 <100 127 4 <1 5 IRDY0203 <20 9 <100 169 26 3 89 IRDY0303 <20 8 <100 105 13 1 342 IRDY0403 <20 11 <100 133 22 2 164 SDY0305 <20 4 <100 145 12 1 123 SDY0306 <20 14 <100 124 22 2 179 SDY0307 <20 32 <100 90 25 3 338 SDY0308 <20 15 <100 106 23 2 772 SDY0309 <20 11 <100 206 26 3 83 SDY0310 <20 9 <100 210 27 3 266 SDY0311 <20 8 <100 192 25 3 139 SDY0312 <20 9 <100 219 27 3 114 HDY0313 <20 14 <100 46 19 2 215 HDY0314 <20 14 <100 49 18 2 50 HDY0315 <20 6 <100 197 29 3 115 HDY0316 <20 10 <100 35 12 1 55 HDY0317 <20 <4 <100 132 22 2 86 HDY0318 <20 7 <100 74 16 2 63 SDY0319 <20 20 <100 110 24 3 61 SDY0320 <20 18 <100 12 18 2 32 IDY0321 <20 <4 <100 7 <2 <1 8
HWDY0322 <20 12 <100 145 25 3 484 HWDY0323 <20 <4 <100 <2 19 3 30
SDY0324 <20 <4 <100 222 32 3 78 SDY0325 <20 <4 <100 52 23 2 101 SDY0326 <20 8 <100 145 21 2 91 SDY0327 <20 9 <100 220 21 2 266 IDY0328 <20 8 <100 147 20 2 88 IDY0329 <20 <4 <100 70 17 2 1100 SDY0330 <20 <4 <100 77 23 2 86 ODY0331 <20 4 <100 72 21 2 76
Note: ICP-AES analyses provided by Paul H. Briggs, U.S. Geological Survey.
21
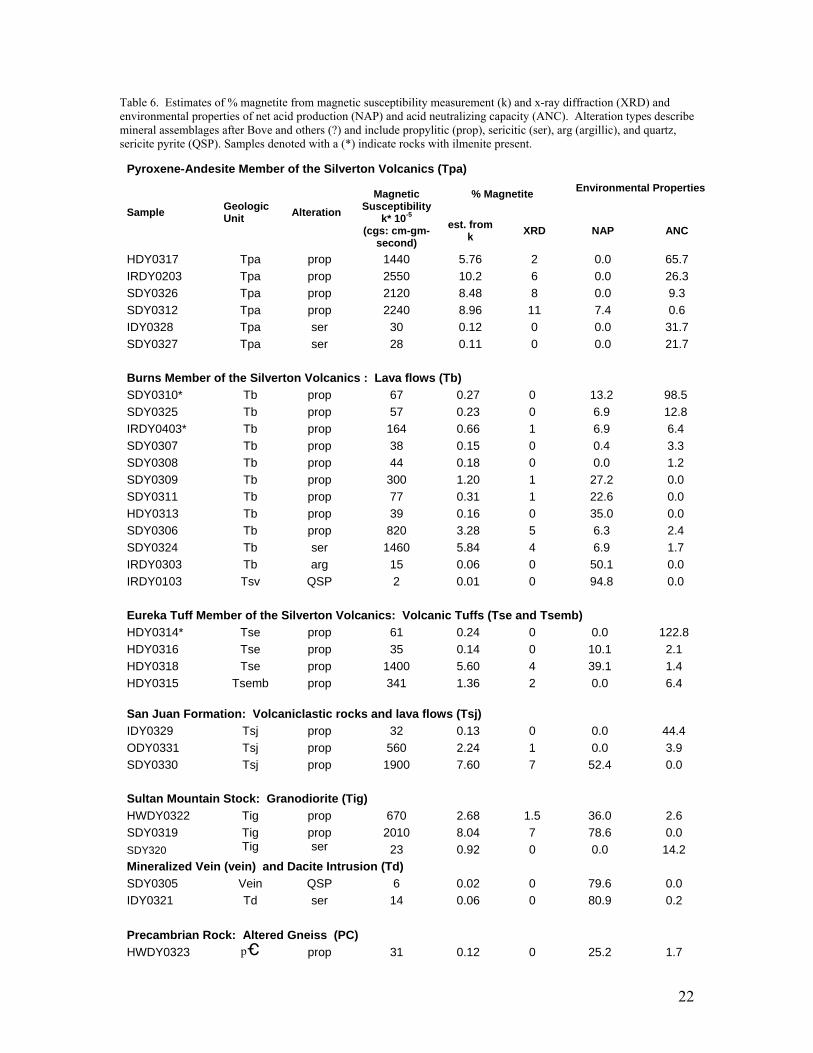
Table 6. Estimates of % magnetite from magnetic susceptibility measurement (k) and x-ray diffraction (XRD) and environmental properties of net acid production (NAP) and acid neutralizing capacity (ANC). Alteration types describe mineral assemblages after Bove and others (?) and include propylitic (prop), sericitic (ser), arg (argillic), and quartz, sericite pyrite (QSP). Samples denoted with a (*) indicate rocks with ilmenite present.
Pyroxene-Andesite Member of the Silverton Volcanics (Tpa)
% Magnetite
Environmental Properties
Sample Geologic Unit Alteration
Magnetic
Susceptibility k* 10-5
(cgs: cm-gm-second)
est. from k XRD NAP ANC
HDY0317 Tpa prop 1440 5.76 2 0.0 65.7 IRDY0203 Tpa prop 2550 10.2 6 0.0 26.3 SDY0326 Tpa prop 2120 8.48 8 0.0 9.3 SDY0312 Tpa prop 2240 8.96 11 7.4 0.6 IDY0328 Tpa ser 30 0.12 0 0.0 31.7 SDY0327 Tpa ser 28 0.11 0 0.0 21.7 Burns Member of the Silverton Volcanics : Lava flows (Tb) SDY0310* Tb prop 67 0.27 0 13.2 98.5 SDY0325 Tb prop 57 0.23 0 6.9 12.8 IRDY0403* Tb prop 164 0.66 1 6.9 6.4 SDY0307 Tb prop 38 0.15 0 0.4 3.3 SDY0308 Tb prop 44 0.18 0 0.0 1.2 SDY0309 Tb prop 300 1.20 1 27.2 0.0 SDY0311 Tb prop 77 0.31 1 22.6 0.0 HDY0313 Tb prop 39 0.16 0 35.0 0.0 SDY0306 Tb prop 820 3.28 5 6.3 2.4 SDY0324 Tb ser 1460 5.84 4 6.9 1.7 IRDY0303 Tb arg 15 0.06 0 50.1 0.0 IRDY0103 Tsv QSP 2 0.01 0 94.8 0.0 Eureka Tuff Member of the Silverton Volcanics: Volcanic Tuffs (Tse and Tsemb) HDY0314* Tse prop 61 0.24 0 0.0 122.8 HDY0316 Tse prop 35 0.14 0 10.1 2.1 HDY0318 Tse prop 1400 5.60 4 39.1 1.4 HDY0315 Tsemb prop 341 1.36 2 0.0 6.4 San Juan Formation: Volcaniclastic rocks and lava flows (Tsj) IDY0329 Tsj prop 32 0.13 0 0.0 44.4 ODY0331 Tsj prop 560 2.24 1 0.0 3.9 SDY0330 Tsj prop 1900 7.60 7 52.4 0.0 Sultan Mountain Stock: Granodiorite (Tig) HWDY0322 Tig prop 670 2.68 1.5 36.0 2.6 SDY0319 Tig prop 2010 8.04 7 78.6 0.0 SDY320 Tig ser 23 0.92 0 0.0 14.2 Mineralized Vein (vein) and Dacite Intrusion (Td) SDY0305 Vein QSP 6 0.02 0 79.6 0.0 IDY0321 Td ser 14 0.06 0 80.9 0.2
Precambrian Rock: Altered Gneiss (PC) HWDY0323 pe prop 31 0.12 0 25.2 1.7
22
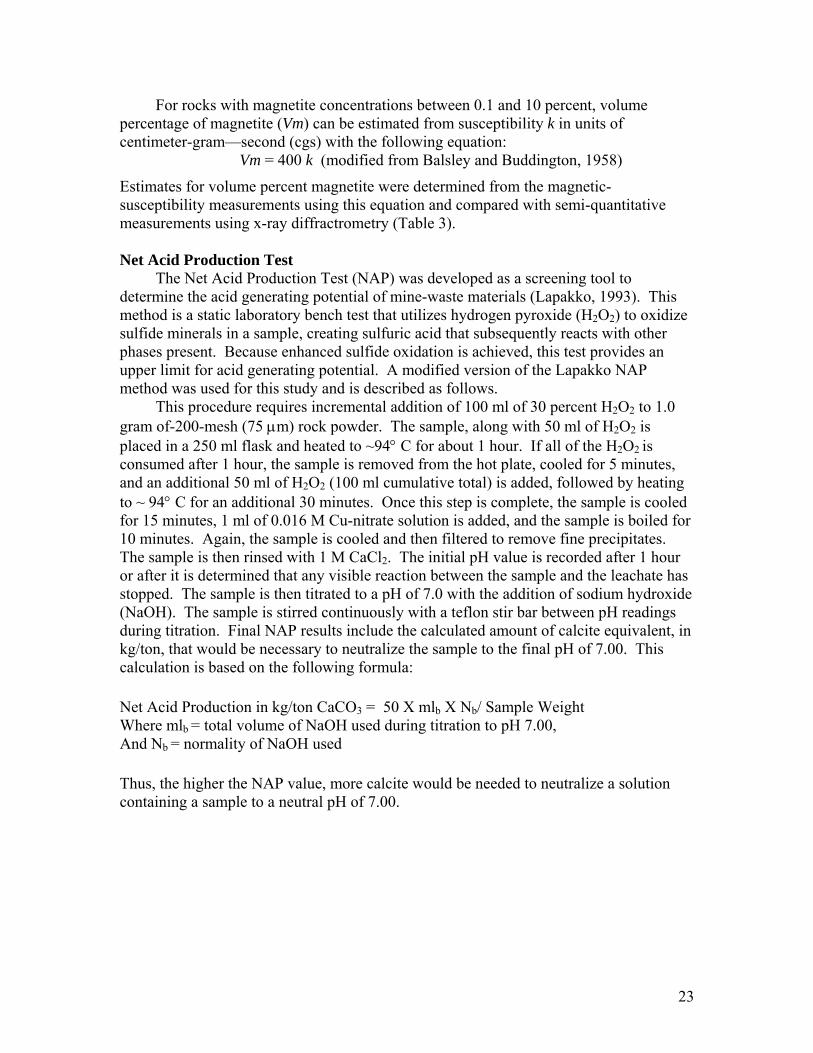
For rocks with magnetite concentrations between 0.1 and 10 percent, volume percentage of magnetite (Vm) can be estimated from susceptibility k in units of centimeter-gram—second (cgs) with the following equation:
Vm = 400 k (modified from Balsley and Buddington, 1958)
Estimates for volume percent magnetite were determined from the magnetic-susceptibility measurements using this equation and compared with semi-quantitative measurements using x-ray diffractrometry (Table 3). Net Acid Production Test The Net Acid Production Test (NAP) was developed as a screening tool to determine the acid generating potential of mine-waste materials (Lapakko, 1993). This method is a static laboratory bench test that utilizes hydrogen pyroxide (H2O2) to oxidize sulfide minerals in a sample, creating sulfuric acid that subsequently reacts with other phases present. Because enhanced sulfide oxidation is achieved, this test provides an upper limit for acid generating potential. A modified version of the Lapakko NAP method was used for this study and is described as follows. This procedure requires incremental addition of 100 ml of 30 percent H2O2 to 1.0 gram of-200-mesh (75 μm) rock powder. The sample, along with 50 ml of H2O2 is placed in a 250 ml flask and heated to ~94° C for about 1 hour. If all of the H2O2 is consumed after 1 hour, the sample is removed from the hot plate, cooled for 5 minutes, and an additional 50 ml of H2O2 (100 ml cumulative total) is added, followed by heating to ~ 94° C for an additional 30 minutes. Once this step is complete, the sample is cooled for 15 minutes, 1 ml of 0.016 M Cu-nitrate solution is added, and the sample is boiled for 10 minutes. Again, the sample is cooled and then filtered to remove fine precipitates. The sample is then rinsed with 1 M CaCl2. The initial pH value is recorded after 1 hour or after it is determined that any visible reaction between the sample and the leachate has stopped. The sample is then titrated to a pH of 7.0 with the addition of sodium hydroxide (NaOH). The sample is stirred continuously with a teflon stir bar between pH readings during titration. Final NAP results include the calculated amount of calcite equivalent, in kg/ton, that would be necessary to neutralize the sample to the final pH of 7.00. This calculation is based on the following formula: Net Acid Production in kg/ton CaCO3 = 50 X mlb X Nb/ Sample Weight Where mlb = total volume of NaOH used during titration to pH 7.00, And Nb = normality of NaOH used Thus, the higher the NAP value, more calcite would be needed to neutralize a solution containing a sample to a neutral pH of 7.00.
23
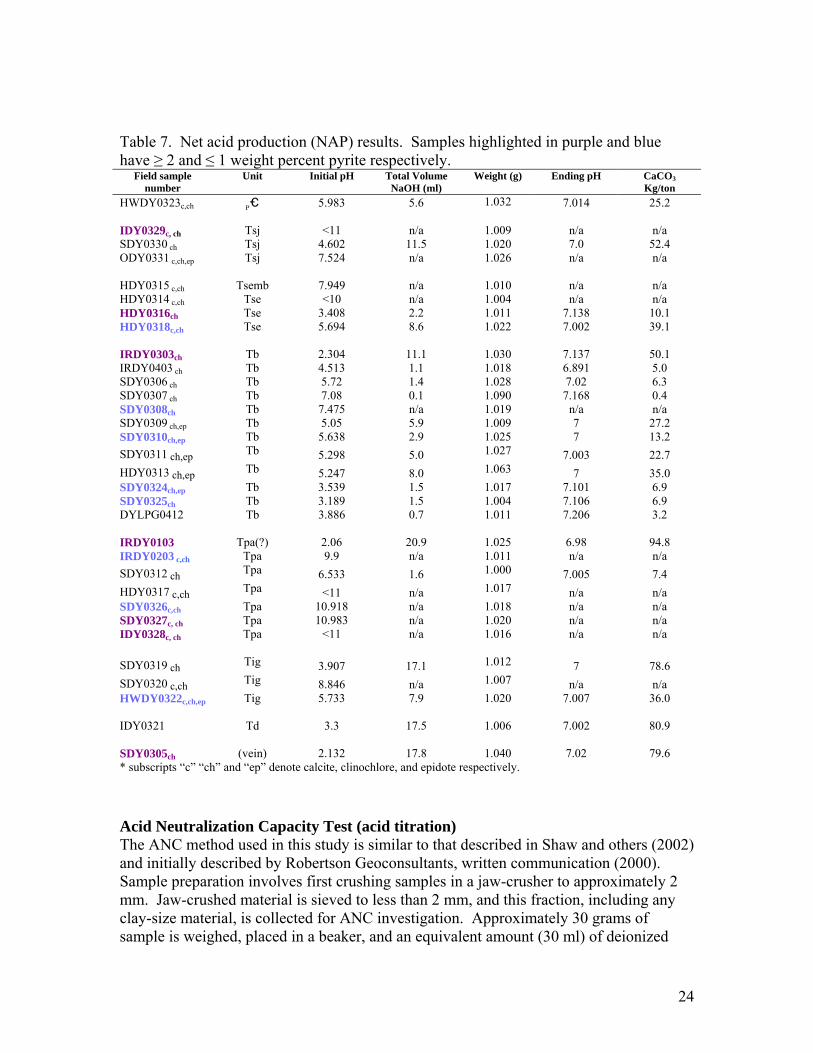
Table 7. Net acid production (NAP) results. Samples highlighted in purple and blue have ≥ 2 and ≤ 1 weight percent pyrite respectively.
Field sample number
Unit Initial pH Total Volume NaOH (ml)
Weight (g) Ending pH CaCO3Kg/ton
HWDY0323c,ch Pe 5.983 5.6 1.032 7.014 25.2 IDY0329c, ch Tsj <11 n/a 1.009 n/a n/a SDY0330 ch Tsj 4.602 11.5 1.020 7.0 52.4 ODY0331 c,ch,ep Tsj 7.524 n/a 1.026 n/a n/a HDY0315 c,ch Tsemb 7.949 n/a 1.010 n/a n/a HDY0314 c,ch Tse <10 n/a 1.004 n/a n/a HDY0316ch Tse 3.408 2.2 1.011 7.138 10.1 HDY0318c,ch Tse 5.694 8.6 1.022 7.002 39.1 IRDY0303ch Tb 2.304 11.1 1.030 7.137 50.1 IRDY0403 ch Tb 4.513 1.1 1.018 6.891 5.0 SDY0306 ch Tb 5.72 1.4 1.028 7.02 6.3 SDY0307 ch Tb 7.08 0.1 1.090 7.168 0.4 SDY0308ch Tb 7.475 n/a 1.019 n/a n/a SDY0309 ch,ep Tb 5.05 5.9 1.009 7 27.2 SDY0310ch,ep Tb 5.638 2.9 1.025 7 13.2 SDY0311 ch,ep Tb 5.298 5.0 1.027 7.003 22.7 HDY0313 ch,ep Tb 5.247 8.0 1.063 7 35.0 SDY0324ch,ep Tb 3.539 1.5 1.017 7.101 6.9 SDY0325ch Tb 3.189 1.5 1.004 7.106 6.9 DYLPG0412 Tb 3.886 0.7 1.011 7.206 3.2 IRDY0103 Tpa(?) 2.06 20.9 1.025 6.98 94.8 IRDY0203 c,ch Tpa 9.9 n/a 1.011 n/a n/a SDY0312 ch Tpa 6.533 1.6 1.000 7.005 7.4 HDY0317 c,ch Tpa <11 n/a 1.017 n/a n/a SDY0326c,ch Tpa 10.918 n/a 1.018 n/a n/a SDY0327c, ch Tpa 10.983 n/a 1.020 n/a n/a IDY0328c, ch Tpa <11 n/a 1.016 n/a n/a SDY0319 ch Tig 3.907 17.1 1.012 7 78.6 SDY0320 c,ch Tig 8.846 n/a 1.007 n/a n/a HWDY0322c,ch,ep Tig 5.733 7.9 1.020 7.007 36.0 IDY0321 Td 3.3 17.5 1.006 7.002 80.9 SDY0305ch (vein) 2.132 17.8 1.040 7.02 79.6 * subscripts “c” “ch” and “ep” denote calcite, clinochlore, and epidote respectively. Acid Neutralization Capacity Test (acid titration) The ANC method used in this study is similar to that described in Shaw and others (2002) and initially described by Robertson Geoconsultants, written communication (2000). Sample preparation involves first crushing samples in a jaw-crusher to approximately 2 mm. Jaw-crushed material is sieved to less than 2 mm, and this fraction, including any clay-size material, is collected for ANC investigation. Approximately 30 grams of sample is weighed, placed in a beaker, and an equivalent amount (30 ml) of deionized
24

water is added to the sample. Nitrogen gas is vigorously bubbled through the deionized water for 1 hour prior to titration to aerate the solution and expel CO2(g). Formation of carbonic acid via CO2 hydration, especially at lower initial pH values (approx. =7.0), could affect the dissolution of several minerals. An initial pH is recorded after stirring. Incremental quantities of H2SO4 acid are added to achieve titration pH set points at whole unit pH intervals to an end point pH value of 2.00. The sample is stirred with a plastic stirrer when the titrant is delivered and the pH recorded after the pH stabilizes. The volume of total H2SO4 added to achieve pH values of approximately 3 and 2 during acid titration were converted to calcium carbonate equivalent mass units with the following formula, where total acid added in this example is 50 ml, N is the normality of acid used, grams of sample = 50 g, M is moles, formula weight for calcite (CaCO3) is 100 g: H2SO4 (0.05 liters) X 0.1 N H2SO4 X = 0.005 Equivalents CaCO3 = 0.005 Moles of CaCO3 0.005 M CaCO3 X 100 g CaCO3 = 0.50 grams of CaCO3 1 M CaCO3 0.50 g CaCO3 X 1000 g X 1000 kg CaCO3 X 1 kg CaCO3 = 10 kg/ton CaCO350 g sample 1 kg 1 ton 1000 g Note that some samples contain only chlorite and not calcite, nonetheless; the volume of
acid is converted to calcium carbonate equivalent mass units.
RESULTS Magnetic Rock Properties Volume percent magnetite calculated via the magnetic susceptibility are, on average, higher (0.7% more for the propylitically altered rocks and 0.2 % for the sericitically altered rocks) than estimates from the XRD method. Given these relatively small average differences, we conclude that estimating magnetite content from magnetic susceptibility provides a reasonable and quick measure of the magnetite content of rocks within the study area.
25
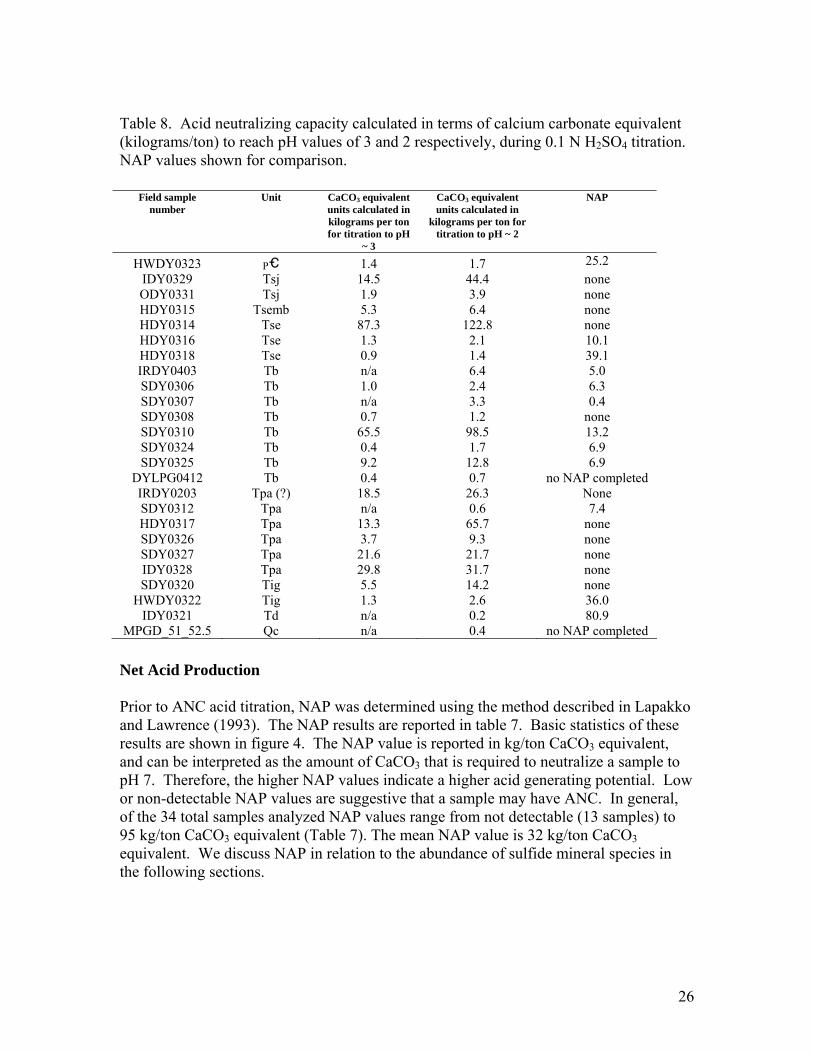
Table 8. Acid neutralizing capacity calculated in terms of calcium carbonate equivalent (kilograms/ton) to reach pH values of 3 and 2 respectively, during 0.1 N H2SO4 titration. NAP values shown for comparison.
Field sample number
Unit CaCO3 equivalent units calculated in kilograms per ton for titration to pH
~ 3
CaCO3 equivalent units calculated in
kilograms per ton for titration to pH ~ 2
NAP
HWDY0323 Pe 1.4 1.7 25.2 IDY0329 Tsj 14.5 44.4 none ODY0331 Tsj 1.9 3.9 none HDY0315 Tsemb 5.3 6.4 none HDY0314 Tse 87.3 122.8 none HDY0316 Tse 1.3 2.1 10.1 HDY0318 Tse 0.9 1.4 39.1 IRDY0403 Tb n/a 6.4 5.0 SDY0306 Tb 1.0 2.4 6.3 SDY0307 Tb n/a 3.3 0.4 SDY0308 Tb 0.7 1.2 none SDY0310 Tb 65.5 98.5 13.2 SDY0324 Tb 0.4 1.7 6.9 SDY0325 Tb 9.2 12.8 6.9
DYLPG0412 Tb 0.4 0.7 no NAP completed IRDY0203 Tpa (?) 18.5 26.3 None SDY0312 Tpa n/a 0.6 7.4 HDY0317 Tpa 13.3 65.7 none SDY0326 Tpa 3.7 9.3 none SDY0327 Tpa 21.6 21.7 none IDY0328 Tpa 29.8 31.7 none SDY0320 Tig 5.5 14.2 none
HWDY0322 Tig 1.3 2.6 36.0 IDY0321 Td n/a 0.2 80.9
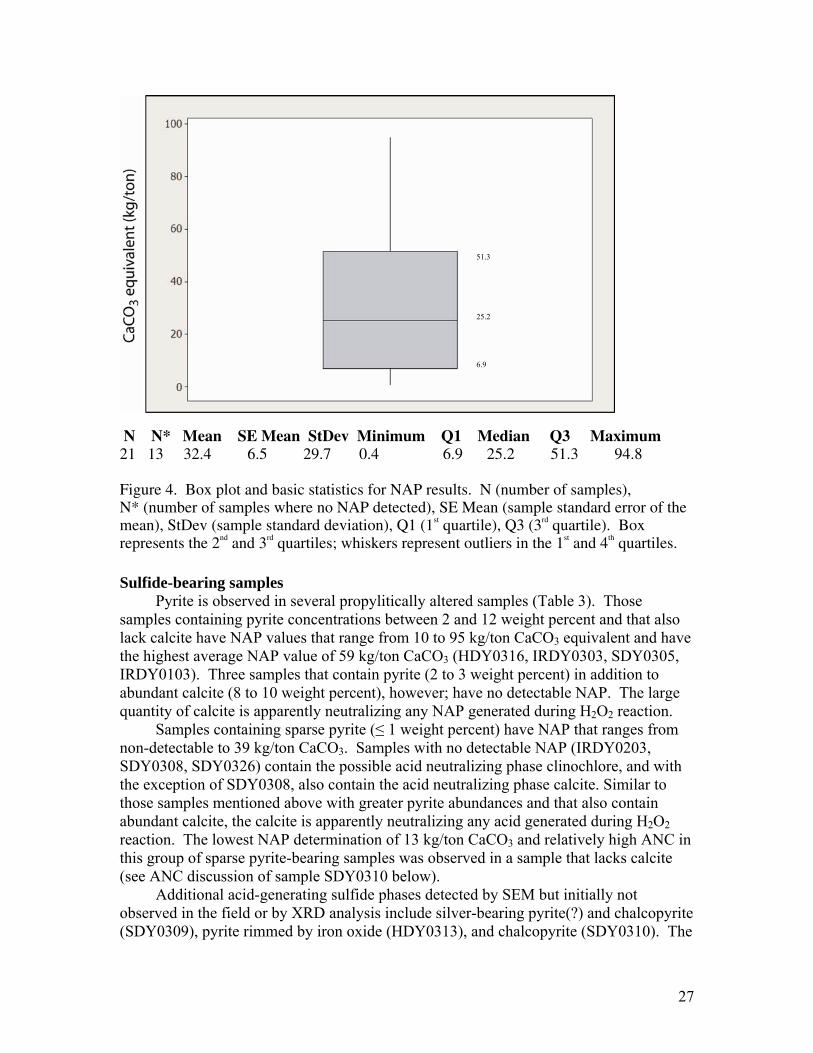
MPGD_51_52.5 Qc n/a 0.4 no NAP completed Net Acid Production Prior to ANC acid titration, NAP was determined using the method described in Lapakko and Lawrence (1993). The NAP results are reported in table 7. Basic statistics of these results are shown in figure 4. The NAP value is reported in kg/ton CaCO3 equivalent, and can be interpreted as the amount of CaCO3 that is required to neutralize a sample to pH 7. Therefore, the higher NAP values indicate a higher acid generating potential. Low or non-detectable NAP values are suggestive that a sample may have ANC. In general, of the 34 total samples analyzed NAP values range from not detectable (13 samples) to 95 kg/ton CaCO3 equivalent (Table 7). The mean NAP value is 32 kg/ton CaCO3 equivalent. We discuss NAP in relation to the abundance of sulfide mineral species in the following sections.
26
51.3
25.2
6.9
N N* Mean SE Mean StDev Minimum Q1 Median Q3 Maximum 21 13 32.4 6.5 29.7 0.4 6.9 25.2 51.3 94.8 Figure 4. Box plot and basic statistics for NAP results. N (number of samples), N* (number of samples where no NAP detected), SE Mean (sample standard error of the mean), StDev (sample standard deviation), Q1 (1st quartile), Q3 (3rd quartile). Box represents the 2nd and 3rd quartiles; whiskers represent outliers in the 1st and 4th quartiles. Sulfide-bearing samples Pyrite is observed in several propylitically altered samples (Table 3). Those samples containing pyrite concentrations between 2 and 12 weight percent and that also lack calcite have NAP values that range from 10 to 95 kg/ton CaCO3 equivalent and have the highest average NAP value of 59 kg/ton CaCO3 (HDY0316, IRDY0303, SDY0305, IRDY0103). Three samples that contain pyrite (2 to 3 weight percent) in addition to abundant calcite (8 to 10 weight percent), however; have no detectable NAP. The large quantity of calcite is apparently neutralizing any NAP generated during H2O2 reaction. Samples containing sparse pyrite (≤ 1 weight percent) have NAP that ranges from non-detectable to 39 kg/ton CaCO3. Samples with no detectable NAP (IRDY0203, SDY0308, SDY0326) contain the possible acid neutralizing phase clinochlore, and with the exception of SDY0308, also contain the acid neutralizing phase calcite. Similar to those samples mentioned above with greater pyrite abundances and that also contain abundant calcite, the calcite is apparently neutralizing any acid generated during H2O2 reaction. The lowest NAP determination of 13 kg/ton CaCO3 and relatively high ANC in this group of sparse pyrite-bearing samples was observed in a sample that lacks calcite (see ANC discussion of sample SDY0310 below). Additional acid-generating sulfide phases detected by SEM but initially not observed in the field or by XRD analysis include silver-bearing pyrite(?) and chalcopyrite (SDY0309), pyrite rimmed by iron oxide (HDY0313), and chalcopyrite (SDY0310). The
27
presence of sulfide minerals in these samples helps to explain the moderate NAP determinations that range between 13 and 35. SEM analyses revealed that sulfide grains are usually small (1 – 5 μm) and though not uncommon, are present below the ~1 to 5 weight percent X-ray diffractometry detection threshold. Non-sulfide-bearing samples (?) Anomalously high NAP results were obtained for at least one sample (SDY0311) that contains no detectable sulfide minerals based on both X-ray diffraction and SEM analyses. Similar anomalously high NAP results that lack detectable sulfides based on X-ray diffraction data were obtained for three additional samples (SDY0319, SDY0330, HWDY0323); however, SEM analyses is pending that may reveal the presence of sulfide phases. Several possible scenarios could be involved to help explain relatively high NAP determinations for samples that lack sulfide phases. The most likely scenarios involves the presence of sparse (< 1 weight percent sulfide) that is not detectable based on XRD analyses, or hydrolysis reactions of ferric iron and water. Hydrolysis reactions involving ferric iron cause the water molecule to be split while also generating hydrogen ions. The Lapakko method is designed as a non-conservative technique to estimate NAP as sulfur species are targeted for complete dissolution during boiling in H2O2. Thus, in this vigorous dissolution process, ferric iron could be liberated from a number of iron-bearing mineral species such as clinochlore, hematite, and hornblende.
An example of the type of hydrolysis reaction that involves ferric iron is as follows:
4 Fe3+ + 12 H2O → 4 Fe(OH)3 ¯ + 12 H+
Another possibility is the dissolution of finely disseminated sulfate salts that have a high surface area, readily dissolve, and thus have a high NAP. The presence of sulfate salts, while frequently abundant on surface coatings in mine waste, were not observed in rocks studied. Acid Neutralization Capacity The ANC acid titration method used in this study (Shaw and others 2002, Robertson Geoconsultants, written comm. 2000) provides an estimate of the ANC of rock and mineral particles. ANC was calculated in terms of kg/ton CaCO3 equivalent and assumes that all of the ANC is attributable to calcite. We know that this is not the case in our study as many samples contain clinochlore, some lack calcite and yet have identifiable ANC. ANC for 25 samples is reported in table 8. A sample map (Plate 1) indicates the ANC rank. Basic statistics of these results are shown in fig. 5. NAP determinations were initially used to indicate those samples that were likely candidates for further ANC study. A prerequisite for completing acid titration on a sample is that it had a low NAP value (< 10 kg/ton CaCO3); however, 4 samples were included for ANC investigation that had NAP determinations > 10 kg/ton CaCO3 and were investigated for ANC due to the
28
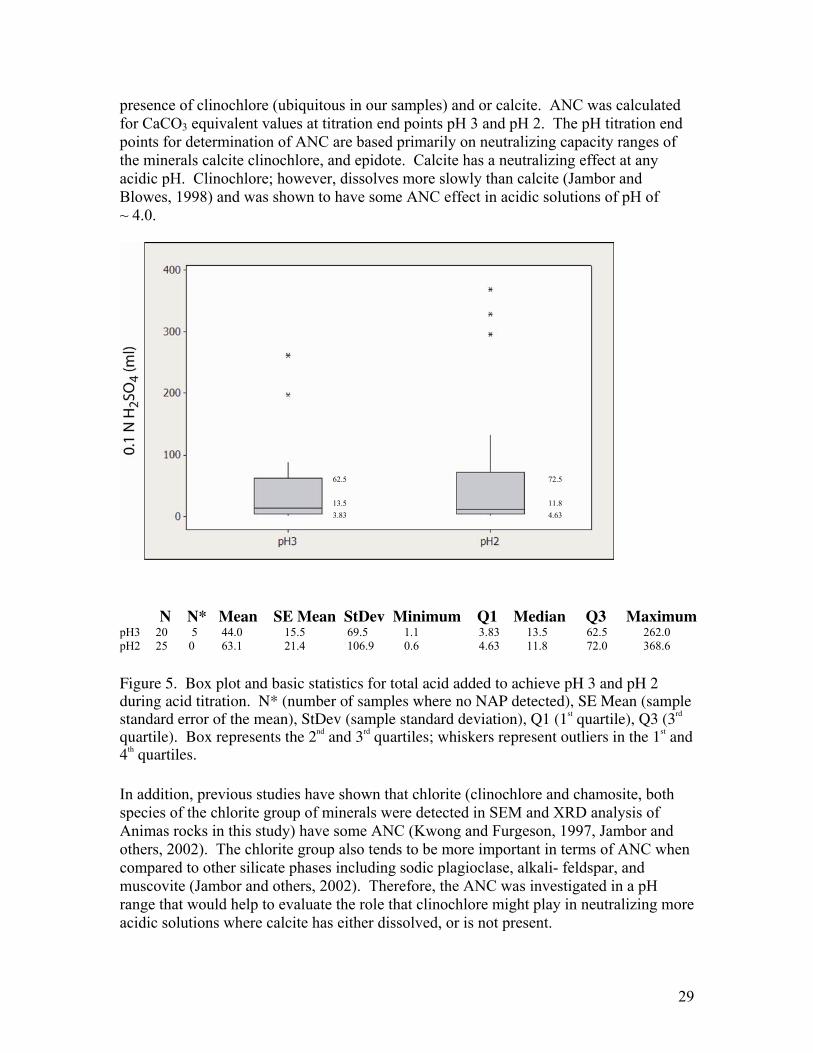
presence of clinochlore (ubiquitous in our samples) and or calcite. ANC was calculated for CaCO3 equivalent values at titration end points pH 3 and pH 2. The pH titration end points for determination of ANC are based primarily on neutralizing capacity ranges of the minerals calcite clinochlore, and epidote. Calcite has a neutralizing effect at any acidic pH. Clinochlore; however, dissolves more slowly than calcite (Jambor and Blowes, 1998) and was shown to have some ANC effect in acidic solutions of pH of ~ 4.0.
62.5 72.5
13.5 11.8 3.83 4.63
N N* Mean SE Mean StDev Minimum Q1 Median Q3 Maximum pH3 20 5 44.0 15.5 69.5 1.1 3.83 13.5 62.5 262.0 pH2 25 0 63.1 21.4 106.9 0.6 4.63 11.8 72.0 368.6
Figure 5. Box plot and basic statistics for total acid added to achieve pH 3 and pH 2 during acid titration. N* (number of samples where no NAP detected), SE Mean (sample standard error of the mean), StDev (sample standard deviation), Q1 (1st quartile), Q3 (3rd quartile). Box represents the 2nd and 3rd quartiles; whiskers represent outliers in the 1st and 4th quartiles. In addition, previous studies have shown that chlorite (clinochlore and chamosite, both species of the chlorite group of minerals were detected in SEM and XRD analysis of Animas rocks in this study) have some ANC (Kwong and Furgeson, 1997, Jambor and others, 2002). The chlorite group also tends to be more important in terms of ANC when compared to other silicate phases including sodic plagioclase, alkali- feldspar, and muscovite (Jambor and others, 2002). Therefore, the ANC was investigated in a pH range that would help to evaluate the role that clinochlore might play in neutralizing more acidic solutions where calcite has either dissolved, or is not present.
29
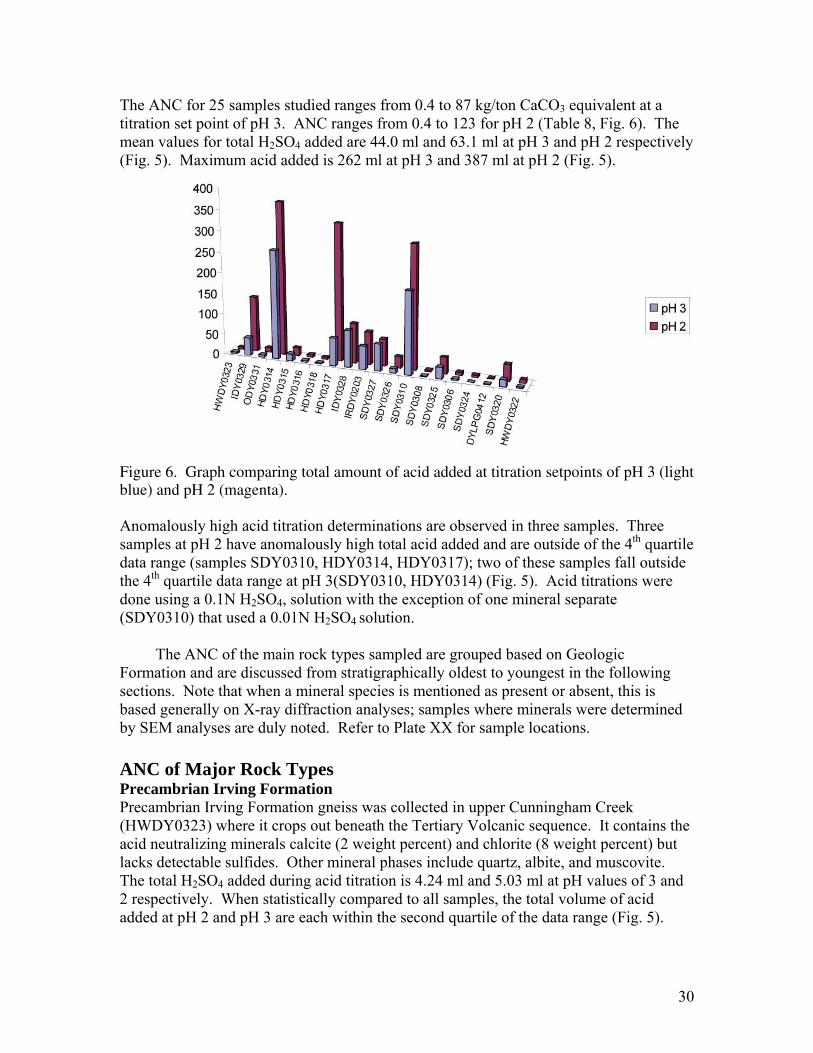
The ANC for 25 samples studied ranges from 0.4 to 87 kg/ton CaCO3 equivalent at a titration set point of pH 3. ANC ranges from 0.4 to 123 for pH 2 (Table 8, Fig. 6). The mean values for total H2SO4 added are 44.0 ml and 63.1 ml at pH 3 and pH 2 respectively
Figure 6. Graph comparing total amount of acid added at titration setpoints of p
(Fig. 5). Maximum acid added is 262 ml at pH 3 and 387 ml at pH 2 (Fig. 5).
H 3 (light
Anomalously high acid titration determinations are observed in three samples. Three tile
The ANC of the main rock types sampled are grouped based on Geologic orm owing
ed
NC of Major Rock Types
iss was collected in upper Cunningham Creek ains the
.
blue) and pH 2 (magenta).
samples at pH 2 have anomalously high total acid added and are outside of the 4th quardata range (samples SDY0310, HDY0314, HDY0317); two of these samples fall outside the 4th quartile data range at pH 3(SDY0310, HDY0314) (Fig. 5). Acid titrations were done using a 0.1N H2SO4, solution with the exception of one mineral separate (SDY0310) that used a 0.01N H2SO4 solution. F ation and are discussed from stratigraphically oldest to youngest in the follsections. Note that when a mineral species is mentioned as present or absent, this is based generally on X-ray diffraction analyses; samples where minerals were determinby SEM analyses are duly noted. Refer to Plate XX for sample locations. APrecambrian Irving Formation Precambrian Irving Formation gne(HWDY0323) where it crops out beneath the Tertiary Volcanic sequence. It contacid neutralizing minerals calcite (2 weight percent) and chlorite (8 weight percent) but lacks detectable sulfides. Other mineral phases include quartz, albite, and muscovite. The total H2SO4 added during acid titration is 4.24 ml and 5.03 ml at pH values of 3 and2 respectively. When statistically compared to all samples, the total volume of acid added at pH 2 and pH 3 are each within the second quartile of the data range (Fig. 5)
30

The shape of the titration curve is suggestive of some ANC where at pH 7, the slope begins to flatten and continues this trend to pH 5 indicating a resistance to change in pH or neutralizing capacity (Fig. 7). The slope remains gently sloping to pH 2. Despite having some ANC, the Irving Formation sample tested has a low (< 1) ratio of ANC to NAP.
Figure 7. Acid titration curve for Precambrian Irving Formation. San Juan Formation San Juan Formation lava flow (ODY0331) and volcaniclastic breccia (IDY0329) outcrops west of the Silverton caldera contain significant calcite. The lava flow contains 3 weight percent calcite and the vocaniclastic breccia contains 8 weight percent calcite. Both samples have a moderate abundance of clinochlore ranging between 9 and 12 weight percent, with the lava flow having the highest percentage. Additional mineral phases include quartz, plagioclase, secondary microcline, epidote, sericite, and magnetite in the lava flow, whereas the volcaniclastic breccia contains comparable phases but lacks potassium feldspar and epidote. The total H2SO4 added during acid titration to achieve pH 2 for the volcaniclastic breccia and the lava flow is 133 ml and 12 ml representing the 4th quartile and near the median of the data range respectively (Fig. 5). While the overall total acid added is nearly 10 times greater for the volcaniclastic breccia compared to the lava, the general shapes of the titration curves are similar (Fig. 8). Inflection points and flattening of each curve is observed just below pH 7 indicating that initially, neutralization is likely due to calcite. In addition, the titration curve slopes shallow further between pH 4 to pH 2 suggesting a relatively high ability to resist changes in pH. No NAP was detected in either sample; therefore, any available ANC will likely not be inhibited by acid generation due to sulfide oxidation.
31
Eureka and Picayune Megabreccia Members of Sapinero Mesa Tuff Eureka Member of the Sapinero Mesa Tuff (Tse) outcrop samples (HDY0314, HDY0316, HDY0318) along with Picayune Megabreccia Member of the Sapinero Mesa Tuff (HDY0315) were collected northeast of Silverton near Picayune Gulch, Animas Forks townsite, and in Placer Gulch. Those samples HDY0314 and HDY0315 having the highest abundance of calcite (5 to 6 weight percent) have variable clinochlore abundances that range between 6 and 25 weight percent respectively. Calcite is also observed in HDY0318 (2 weight percent) along with trace pyrite (< 1 weight percent). HDY0316 lacks calcite, but contains clinochlore. Additional mineral phases preserved include quartz, plagioclase, potassium feldspar, sericite, ± hematite, and intergrown magnetite and ilmenite. The largest amount of acid added for not only the unit Tse but for all samples studied is HDY0314 that required 368 ml of H2SO4 to achieve pH 2. This is equal to 123 kg/ton CaCO3 equivalent and with no detectable NAP, ranks as the sample with the highest relative ANC of those studied. Two additional Tse samples (HDY0316, HDY0318) required 6.32 and 4.27 ml of H2SO4 to achieve pH 2. Trace abundance of pyrite in HDY0318 appears to be counteracted by the presence of 2 weight percent calcite, whereas HDY0316 lacks calcite and has the highest silica content (70.1 Weight percent on a non volatile free basis) (Fig. 9) that perhaps make it more indurated and less easily weathered when compared to the other two Tse samples. Picayune Megabreccia Member of the Sapinero Mesa Tuff (Tsemb) (HDY0315) has the second highest ANC of the San Juan caldera-related rocks studied; although, this unit is composed of pre-existing rocks that caved into the San Juan caldera near its margin during caldera collapse. Many of the caldera wall rock fragments that are part of the Picayune Megabreccia Member rock matrix are likely equivalent in age and compositions to rocks of the San Juan Formation collected west of Mineral Creek and are now commingled in an ash flow tuff matrix. This sample required 19 ml of H2SO4 to reach pH 2 and similar to HDY0314 above, had no detectable NAP and thus ranks 10th in terms of its ANC. This is equivalent to 6 kg/ton CaCO3 equivalent. Comparison of the acid titration curves for Eureka Member units shows the distinct differences in ANC. The sample with the highest ANC, HDY0314 exhibits a slight flattening of the acid titration curve starting at pH 6 followed by an abrupt plateau at pH 4; the plateau continues to pH 3 where the curve becomes only slightly steeper to pH 2 (Fig. 10A). Titration curve comparison of Tse units that have relatively low ANC are shown in Figure 10B. The titration curve for Picayune Megabreccia of the Sapinero Mesa Tuff (HDY0315) indicates an initial steep drop between pH ~ 9 to pH 7, where the slope slightly flattens. Curve plateaus are seen at pH 6, and 4 with the greatest neutralizing capacity observed between pH 4 and 3. At pH 3; however, the slope steepens, indicating the neutralizing capacity of participating minerals was being eliminated by the H2SO4 titrant.
32
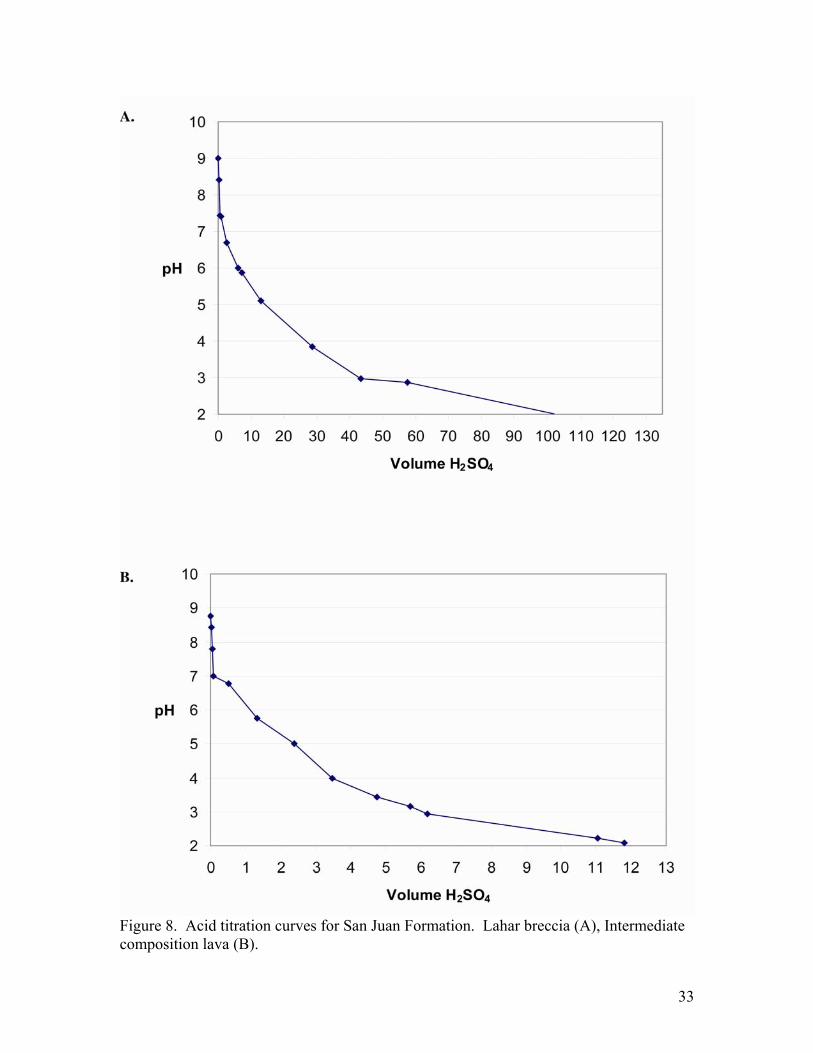
Figure 8. Acid titration curves for San Juan Formation. Lahar breccia (A), Intermediate composition lava (B).
33

Figure 9. Total alkali versus silica rock classification (LeBas and others, 1986). Green dots, San Juan Formation; blue triangles, Burns Member of the Silverton Volcanics; red squares, Pyroxene Andesite Member of the Silverton Volcanics; blue stars, Eureka Member of the Sapinero Mesa Tuff; open star, Picauyune Megabreccia Member of the Sapinero Mesa Tuff.
34
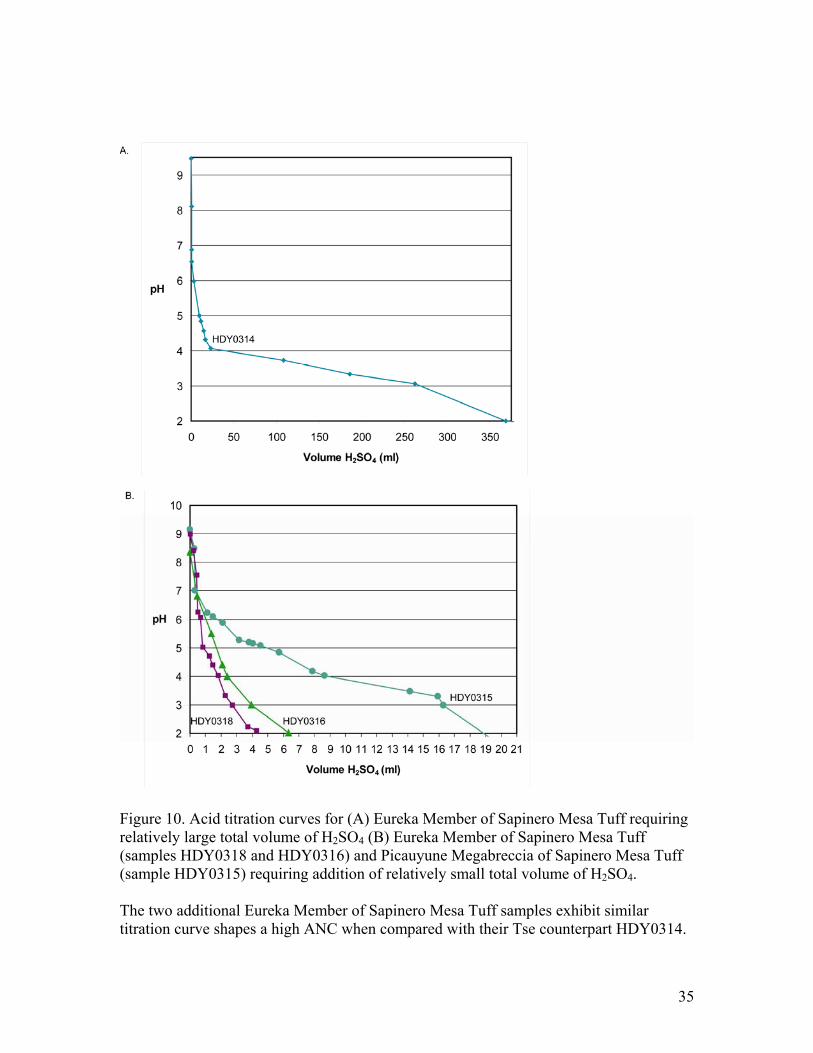
Figure 10. Acid titration curves for (A) Eureka Member of Sapinero Mesa Tuff requiring relatively large total volume of H2SO4 (B) Eureka Member of Sapinero Mesa Tuff (samples HDY0318 and HDY0316) and Picauyune Megabreccia of Sapinero Mesa Tuff (sample HDY0315) requiring addition of relatively small total volume of H2SO4. The two additional Eureka Member of Sapinero Mesa Tuff samples exhibit similar titration curve shapes a high ANC when compared with their Tse counterpart HDY0314.
35
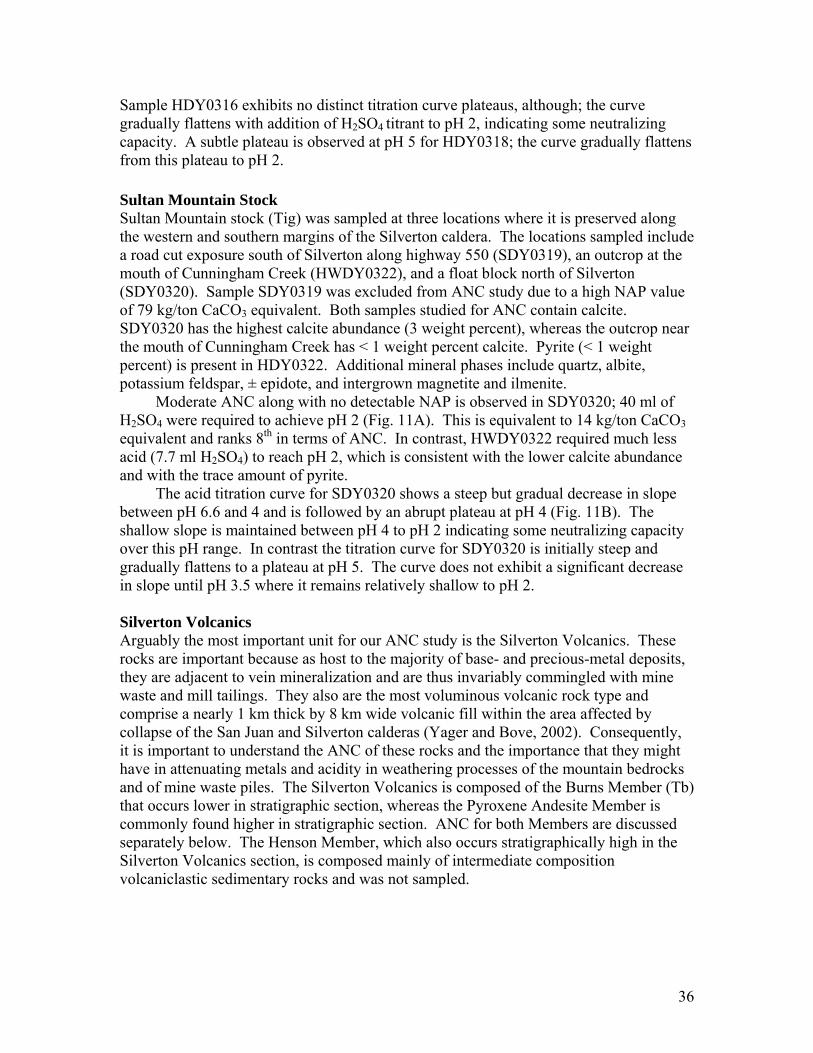
Sample HDY0316 exhibits no distinct titration curve plateaus, although; the curve gradually flattens with addition of H2SO4 titrant to pH 2, indicating some neutralizing capacity. A subtle plateau is observed at pH 5 for HDY0318; the curve gradually flattens from this plateau to pH 2. Sultan Mountain Stock Sultan Mountain stock (Tig) was sampled at three locations where it is preserved along the western and southern margins of the Silverton caldera. The locations sampled include a road cut exposure south of Silverton along highway 550 (SDY0319), an outcrop at the mouth of Cunningham Creek (HWDY0322), and a float block north of Silverton (SDY0320). Sample SDY0319 was excluded from ANC study due to a high NAP value of 79 kg/ton CaCO3 equivalent. Both samples studied for ANC contain calcite. SDY0320 has the highest calcite abundance (3 weight percent), whereas the outcrop near the mouth of Cunningham Creek has < 1 weight percent calcite. Pyrite (< 1 weight percent) is present in HDY0322. Additional mineral phases include quartz, albite, potassium feldspar, ± epidote, and intergrown magnetite and ilmenite. Moderate ANC along with no detectable NAP is observed in SDY0320; 40 ml of H2SO4 were required to achieve pH 2 (Fig. 11A). This is equivalent to 14 kg/ton CaCO3 equivalent and ranks 8th in terms of ANC. In contrast, HWDY0322 required much less acid (7.7 ml H2SO4) to reach pH 2, which is consistent with the lower calcite abundance and with the trace amount of pyrite. The acid titration curve for SDY0320 shows a steep but gradual decrease in slope between pH 6.6 and 4 and is followed by an abrupt plateau at pH 4 (Fig. 11B). The shallow slope is maintained between pH 4 to pH 2 indicating some neutralizing capacity over this pH range. In contrast the titration curve for SDY0320 is initially steep and gradually flattens to a plateau at pH 5. The curve does not exhibit a significant decrease in slope until pH 3.5 where it remains relatively shallow to pH 2. Silverton Volcanics Arguably the most important unit for our ANC study is the Silverton Volcanics. These rocks are important because as host to the majority of base- and precious-metal deposits, they are adjacent to vein mineralization and are thus invariably commingled with mine waste and mill tailings. They also are the most voluminous volcanic rock type and comprise a nearly 1 km thick by 8 km wide volcanic fill within the area affected by collapse of the San Juan and Silverton calderas (Yager and Bove, 2002). Consequently, it is important to understand the ANC of these rocks and the importance that they might have in attenuating metals and acidity in weathering processes of the mountain bedrocks and of mine waste piles. The Silverton Volcanics is composed of the Burns Member (Tb) that occurs lower in stratigraphic section, whereas the Pyroxene Andesite Member is commonly found higher in stratigraphic section. ANC for both Members are discussed separately below. The Henson Member, which also occurs stratigraphically high in the Silverton Volcanics section, is composed mainly of intermediate composition volcaniclastic sedimentary rocks and was not sampled.
36
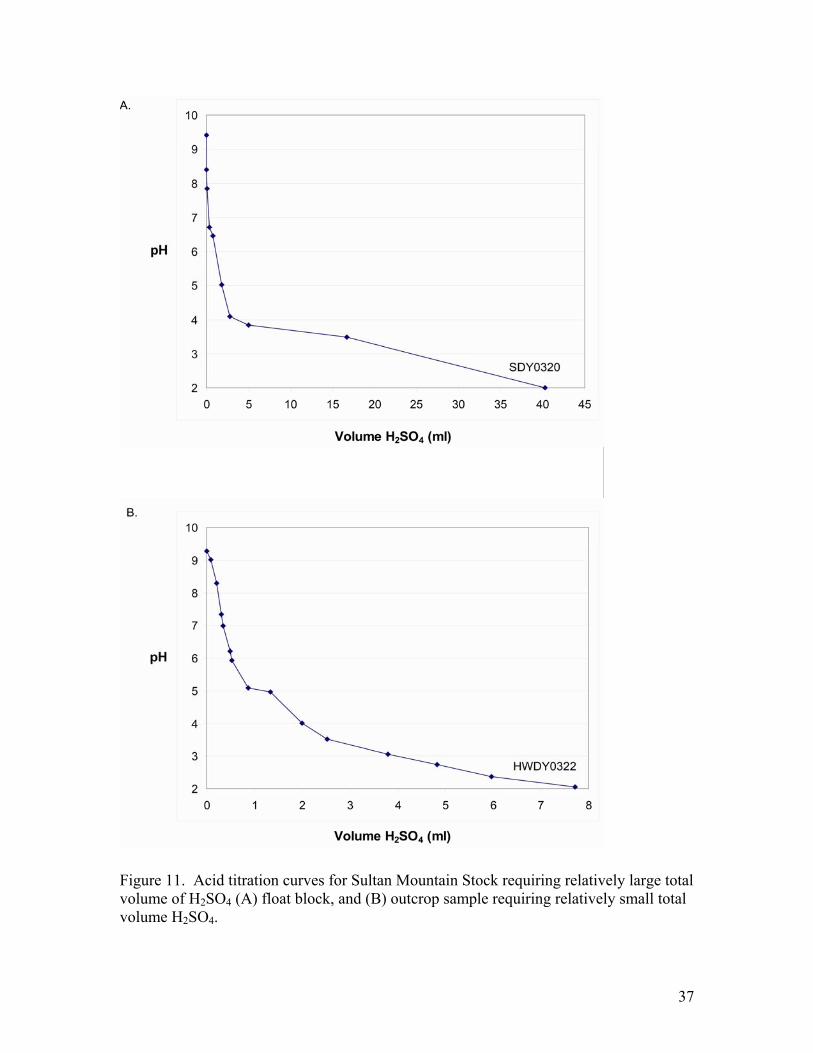
Figure 11. Acid titration curves for Sultan Mountain Stock requiring relatively large total volume of H2SO4 (A) float block, and (B) outcrop sample requiring relatively small total volume H2SO4.
37
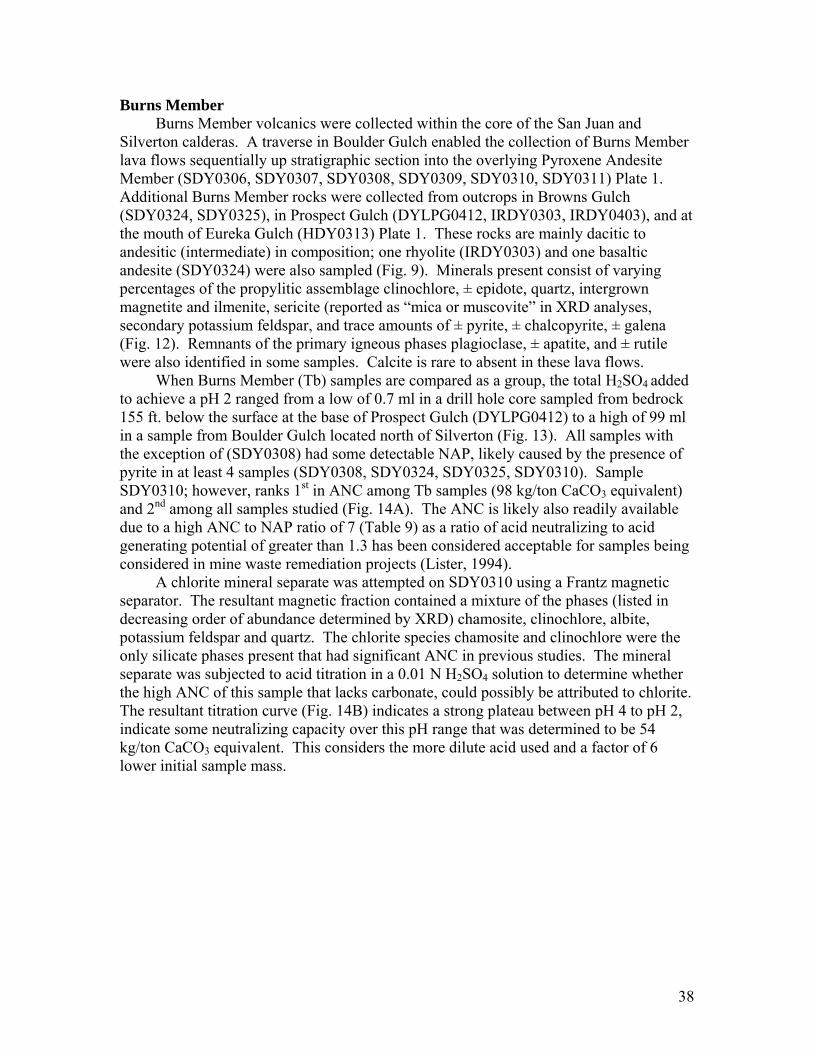
Burns Member Burns Member volcanics were collected within the core of the San Juan and Silverton calderas. A traverse in Boulder Gulch enabled the collection of Burns Member lava flows sequentially up stratigraphic section into the overlying Pyroxene Andesite Member (SDY0306, SDY0307, SDY0308, SDY0309, SDY0310, SDY0311) Plate 1. Additional Burns Member rocks were collected from outcrops in Browns Gulch (SDY0324, SDY0325), in Prospect Gulch (DYLPG0412, IRDY0303, IRDY0403), and at the mouth of Eureka Gulch (HDY0313) Plate 1. These rocks are mainly dacitic to andesitic (intermediate) in composition; one rhyolite (IRDY0303) and one basaltic andesite (SDY0324) were also sampled (Fig. 9). Minerals present consist of varying percentages of the propylitic assemblage clinochlore, ± epidote, quartz, intergrown magnetite and ilmenite, sericite (reported as “mica or muscovite” in XRD analyses, secondary potassium feldspar, and trace amounts of ± pyrite, ± chalcopyrite, ± galena (Fig. 12). Remnants of the primary igneous phases plagioclase, ± apatite, and ± rutile were also identified in some samples. Calcite is rare to absent in these lava flows. When Burns Member (Tb) samples are compared as a group, the total H2SO4 added to achieve a pH 2 ranged from a low of 0.7 ml in a drill hole core sampled from bedrock 155 ft. below the surface at the base of Prospect Gulch (DYLPG0412) to a high of 99 ml in a sample from Boulder Gulch located north of Silverton (Fig. 13). All samples with the exception of (SDY0308) had some detectable NAP, likely caused by the presence of pyrite in at least 4 samples (SDY0308, SDY0324, SDY0325, SDY0310). Sample SDY0310; however, ranks 1st in ANC among Tb samples (98 kg/ton CaCO3 equivalent) and 2nd among all samples studied (Fig. 14A). The ANC is likely also readily available due to a high ANC to NAP ratio of 7 (Table 9) as a ratio of acid neutralizing to acid generating potential of greater than 1.3 has been considered acceptable for samples being considered in mine waste remediation projects (Lister, 1994). A chlorite mineral separate was attempted on SDY0310 using a Frantz magnetic separator. The resultant magnetic fraction contained a mixture of the phases (listed in decreasing order of abundance determined by XRD) chamosite, clinochlore, albite, potassium feldspar and quartz. The chlorite species chamosite and clinochlore were the only silicate phases present that had significant ANC in previous studies. The mineral separate was subjected to acid titration in a 0.01 N H2SO4 solution to determine whether the high ANC of this sample that lacks carbonate, could possibly be attributed to chlorite. The resultant titration curve (Fig. 14B) indicates a strong plateau between pH 4 to pH 2, indicate some neutralizing capacity over this pH range that was determined to be 54 kg/ton CaCO3 equivalent. This considers the more dilute acid used and a factor of 6 lower initial sample mass.
38
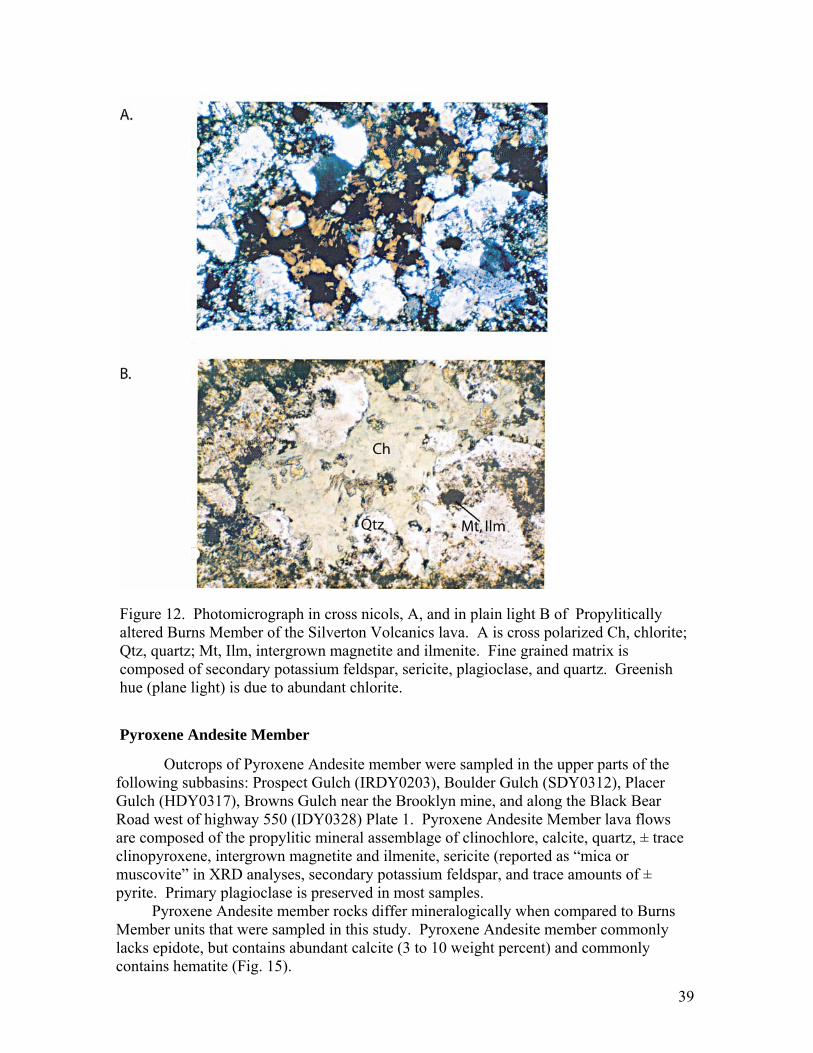
Figure 12. Photomicrograph in cross nicols, A, and in plain light B of Propylitically altered Burns Member of the Silverton Volcanics lava. A is cross polarized Ch, chlorite; Qtz, quartz; Mt, Ilm, intergrown magnetite and ilmenite. Fine grained matrix is composed of secondary potassium feldspar, sericite, plagioclase, and quartz. Greenish hue (plane light) is due to abundant chlorite.
Pyroxene Andesite Member
Outcrops of Pyroxene Andesite member were sampled in the upper parts of the following subbasins: Prospect Gulch (IRDY0203), Boulder Gulch (SDY0312), Placer Gulch (HDY0317), Browns Gulch near the Brooklyn mine, and along the Black Bear Road west of highway 550 (IDY0328) Plate 1. Pyroxene Andesite Member lava flows are composed of the propylitic mineral assemblage of clinochlore, calcite, quartz, ± trace clinopyroxene, intergrown magnetite and ilmenite, sericite (reported as “mica or muscovite” in XRD analyses, secondary potassium feldspar, and trace amounts of ± pyrite. Primary plagioclase is preserved in most samples. Pyroxene Andesite member rocks differ mineralogically when compared to Burns Member units that were sampled in this study. Pyroxene Andesite member commonly lacks epidote, but contains abundant calcite (3 to 10 weight percent) and commonly contains hematite (Fig. 15).
39
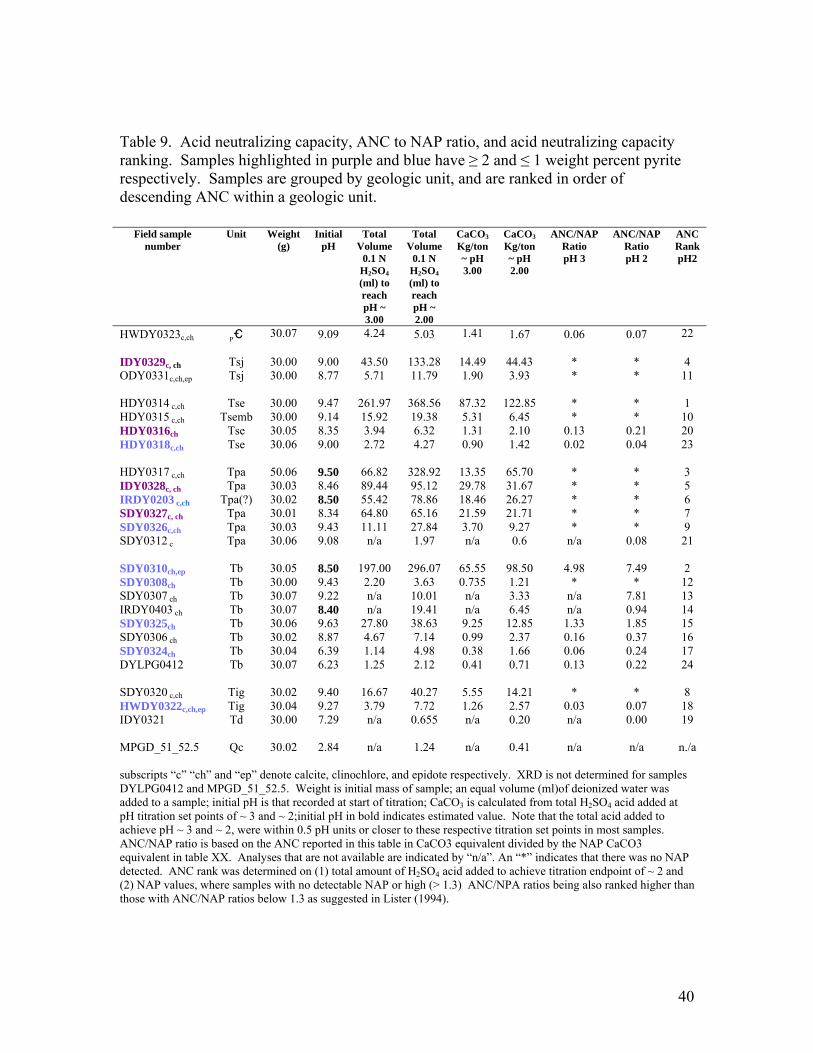
Table 9. Acid neutralizing capacity, ANC to NAP ratio, and acid neutralizing capacity ranking. Samples highlighted in purple and blue have ≥ 2 and ≤ 1 weight percent pyrite respectively. Samples are grouped by geologic unit, and are ranked in order of descending ANC within a geologic unit.
Field sample number
Unit Weight (g)
Initial pH
Total Volume
0.1 N H2SO4 (ml) to reach pH ~ 3.00
Total Volume
0.1 N H2SO4 (ml) to reach pH ~ 2.00
CaCO3
Kg/ton ~ pH 3.00
CaCO3
Kg/ton ~ pH 2.00
ANC/NAP Ratio pH 3
ANC/NAP Ratio pH 2
ANC Rank pH2
HWDY0323c,ch Pe 30.07 9.09 4.24 5.03 1.41 1.67 0.06 0.07 22 IDY0329c, ch Tsj 30.00 9.00 43.50 133.28 14.49 44.43 * * 4 ODY0331c,ch,ep Tsj 30.00 8.77 5.71 11.79 1.90 3.93 * * 11 HDY0314 c,ch Tse 30.00 9.47 261.97 368.56 87.32 122.85 * * 1 HDY0315 c,ch Tsemb 30.00 9.14 15.92 19.38 5.31 6.45 * * 10 HDY0316ch Tse 30.05 8.35 3.94 6.32 1.31 2.10 0.13 0.21 20 HDY0318c,ch Tse 30.06 9.00 2.72 4.27 0.90 1.42 0.02 0.04 23 HDY0317 c,ch Tpa 50.06 9.50 66.82 328.92 13.35 65.70 * * 3 IDY0328c, ch Tpa 30.03 8.46 89.44 95.12 29.78 31.67 * * 5 IRDY0203 c,ch Tpa(?) 30.02 8.50 55.42 78.86 18.46 26.27 * * 6 SDY0327c, ch Tpa 30.01 8.34 64.80 65.16 21.59 21.71 * * 7 SDY0326c,ch Tpa 30.03 9.43 11.11 27.84 3.70 9.27 * * 9 SDY0312 c Tpa 30.06 9.08 n/a 1.97 n/a 0.6 n/a 0.08 21 SDY0310ch,ep Tb 30.05 8.50 197.00 296.07 65.55 98.50 4.98 7.49 2 SDY0308ch Tb 30.00 9.43 2.20 3.63 0.735 1.21 * * 12 SDY0307 ch Tb 30.07 9.22 n/a 10.01 n/a 3.33 n/a 7.81 13 IRDY0403 ch Tb 30.07 8.40 n/a 19.41 n/a 6.45 n/a 0.94 14 SDY0325ch Tb 30.06 9.63 27.80 38.63 9.25 12.85 1.33 1.85 15 SDY0306 ch Tb 30.02 8.87 4.67 7.14 0.99 2.37 0.16 0.37 16 SDY0324ch Tb 30.04 6.39 1.14 4.98 0.38 1.66 0.06 0.24 17 DYLPG0412 Tb 30.07 6.23 1.25 2.12 0.41 0.71 0.13 0.22 24 SDY0320 c,ch Tig 30.02 9.40 16.67 40.27 5.55 14.21 * * 8 HWDY0322c,ch,ep Tig 30.04 9.27 3.79 7.72 1.26 2.57 0.03 0.07 18 IDY0321 Td 30.00 7.29 n/a 0.655 n/a 0.20 n/a 0.00 19 MPGD_51_52.5 Qc 30.02 2.84 n/a 1.24 n/a 0.41 n/a n/a n./a subscripts “c” “ch” and “ep” denote calcite, clinochlore, and epidote respectively. XRD is not determined for samples DYLPG0412 and MPGD_51_52.5. Weight is initial mass of sample; an equal volume (ml)of deionized water was added to a sample; initial pH is that recorded at start of titration; CaCO3 is calculated from total H2SO4 acid added at pH titration set points of ~ 3 and ~ 2;initial pH in bold indicates estimated value. Note that the total acid added to achieve pH ~ 3 and ~ 2, were within 0.5 pH units or closer to these respective titration set points in most samples. ANC/NAP ratio is based on the ANC reported in this table in CaCO3 equivalent divided by the NAP CaCO3 equivalent in table XX. Analyses that are not available are indicated by “n/a”. An “*” indicates that there was no NAP detected. ANC rank was determined on (1) total amount of H2SO4 acid added to achieve titration endpoint of ~ 2 and (2) NAP values, where samples with no detectable NAP or high (> 1.3) ANC/NPA ratios being also ranked higher than those with ANC/NAP ratios below 1.3 as suggested in Lister (1994).
40
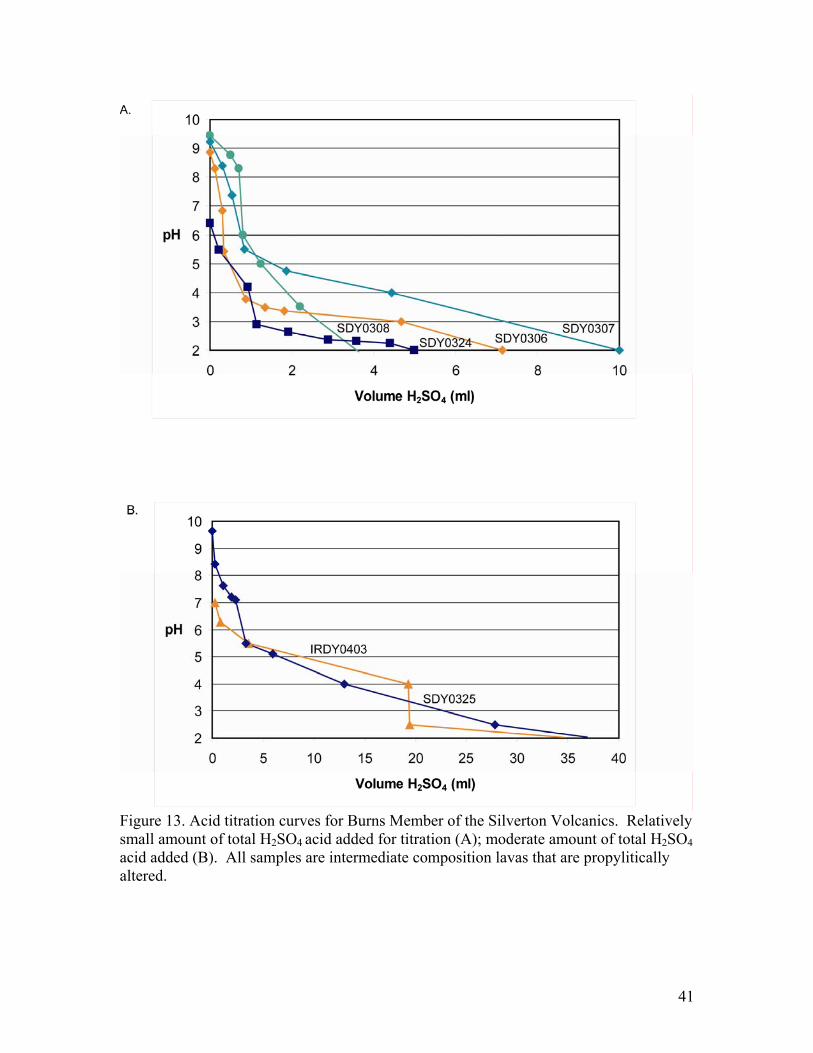
Figure 13. Acid titration curves for Burns Member of the Silverton Volcanics. Relatively small amount of total H2SO4 acid added for titration (A); moderate amount of total H2SO4 acid added (B). All samples are intermediate composition lavas that are propylitically altered.
41
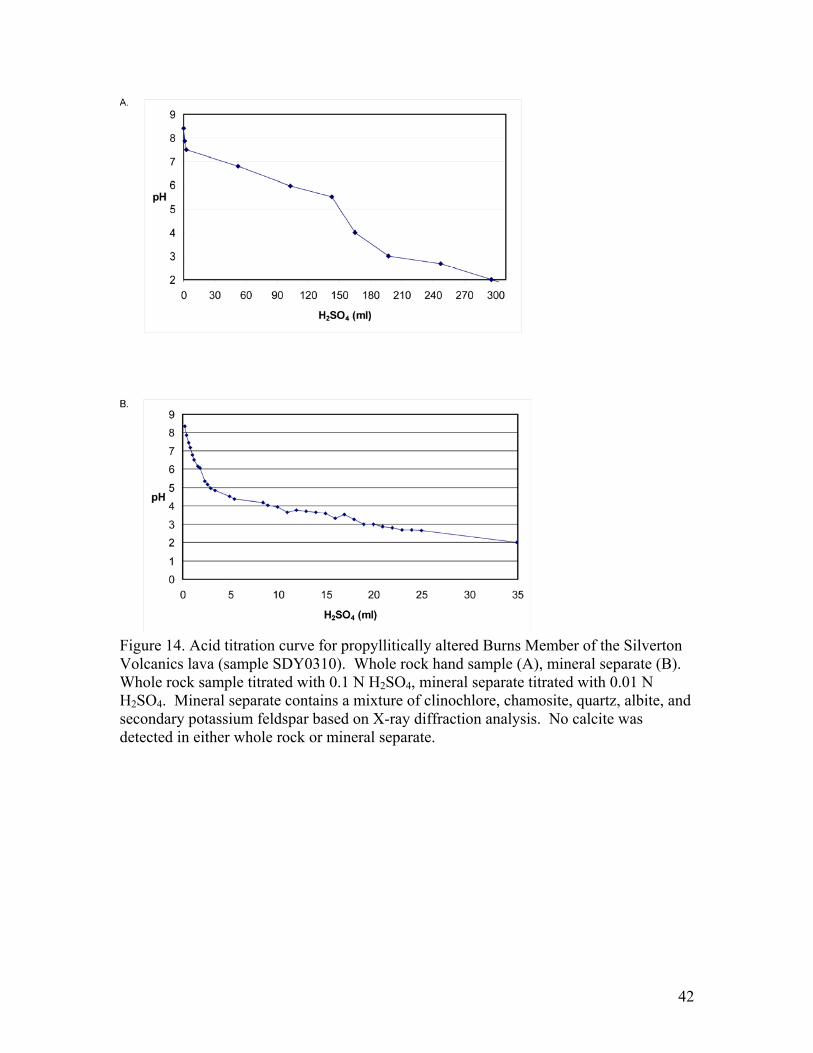
Figure 14. Acid titration curve for propyllitically altered Burns Member of the Silverton Volcanics lava (sample SDY0310). Whole rock hand sample (A), mineral separate (B). Whole rock sample titrated with 0.1 N H2SO4, mineral separate titrated with 0.01 N H2SO4. Mineral separate contains a mixture of clinochlore, chamosite, quartz, albite, and secondary potassium feldspar based on X-ray diffraction analysis. No calcite was detected in either whole rock or mineral separate.
42
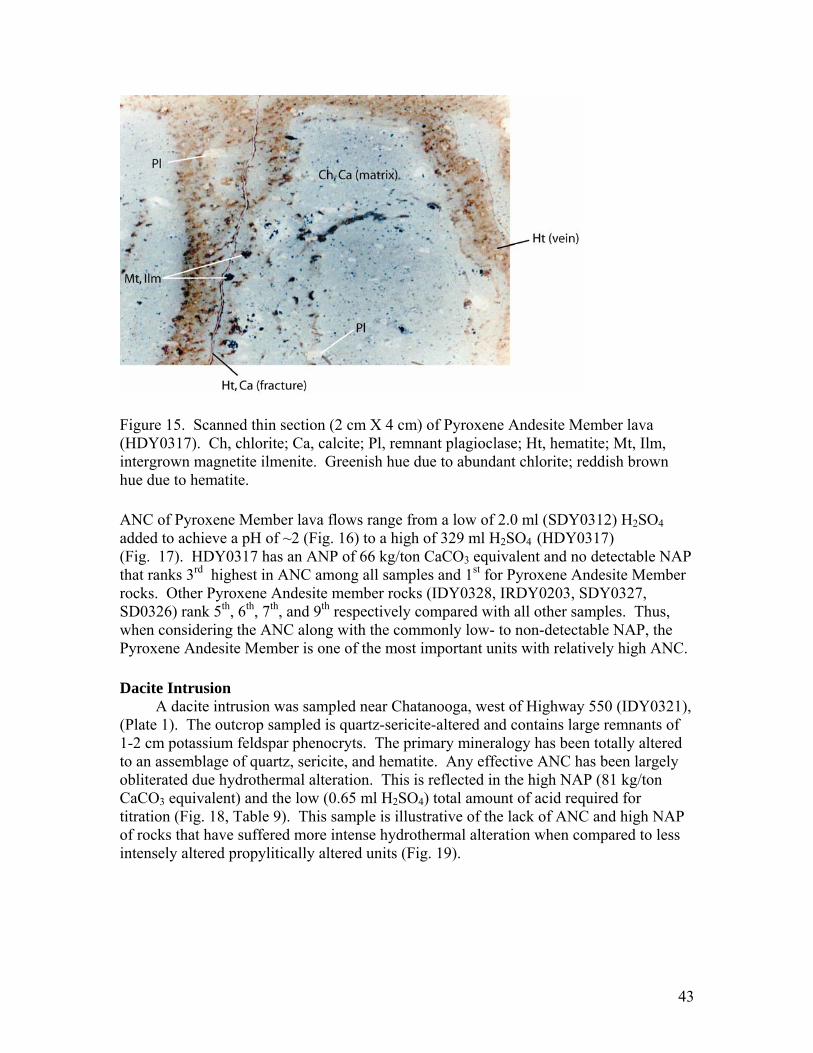
Figure 15. Scanned thin section (2 cm X 4 cm) of Pyroxene Andesite Member lava (HDY0317). Ch, chlorite; Ca, calcite; Pl, remnant plagioclase; Ht, hematite; Mt, Ilm, intergrown magnetite ilmenite. Greenish hue due to abundant chlorite; reddish brown hue due to hematite. ANC of Pyroxene Member lava flows range from a low of 2.0 ml (SDY0312) H2SO4 added to achieve a pH of ~2 (Fig. 16) to a high of 329 ml H2SO4 (HDY0317) (Fig. 17). HDY0317 has an ANP of 66 kg/ton CaCO3 equivalent and no detectable NAP that ranks 3rd highest in ANC among all samples and 1st for Pyroxene Andesite Member rocks. Other Pyroxene Andesite member rocks (IDY0328, IRDY0203, SDY0327, SD0326) rank 5th, 6th, 7th, and 9th respectively compared with all other samples. Thus, when considering the ANC along with the commonly low- to non-detectable NAP, the Pyroxene Andesite Member is one of the most important units with relatively high ANC. Dacite Intrusion A dacite intrusion was sampled near Chatanooga, west of Highway 550 (IDY0321), (Plate 1). The outcrop sampled is quartz-sericite-altered and contains large remnants of 1-2 cm potassium feldspar phenocryts. The primary mineralogy has been totally altered to an assemblage of quartz, sericite, and hematite. Any effective ANC has been largely obliterated due hydrothermal alteration. This is reflected in the high NAP (81 kg/ton CaCO3 equivalent) and the low (0.65 ml H2SO4) total amount of acid required for titration (Fig. 18, Table 9). This sample is illustrative of the lack of ANC and high NAP of rocks that have suffered more intense hydrothermal alteration when compared to less intensely altered propylitically altered units (Fig. 19).
43
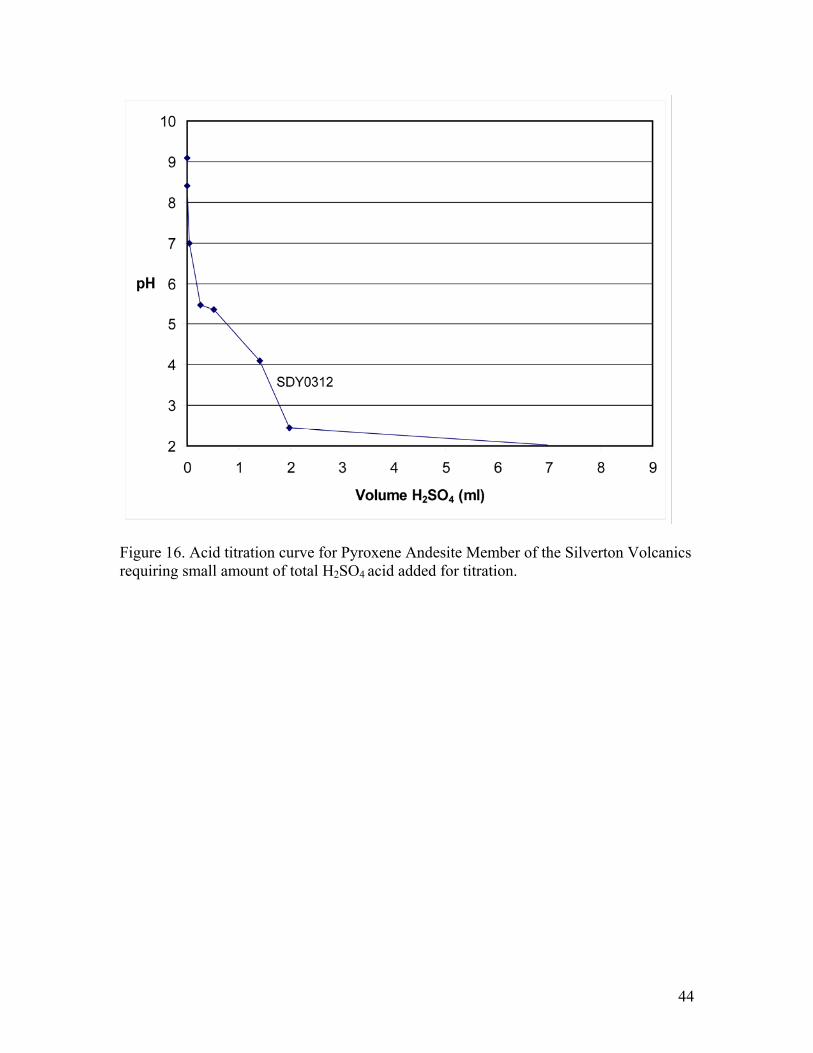
Figure 16. Acid titration curve for Pyroxene Andesite Member of the Silverton Volcanics requiring small amount of total H2SO4 acid added for titration.
44
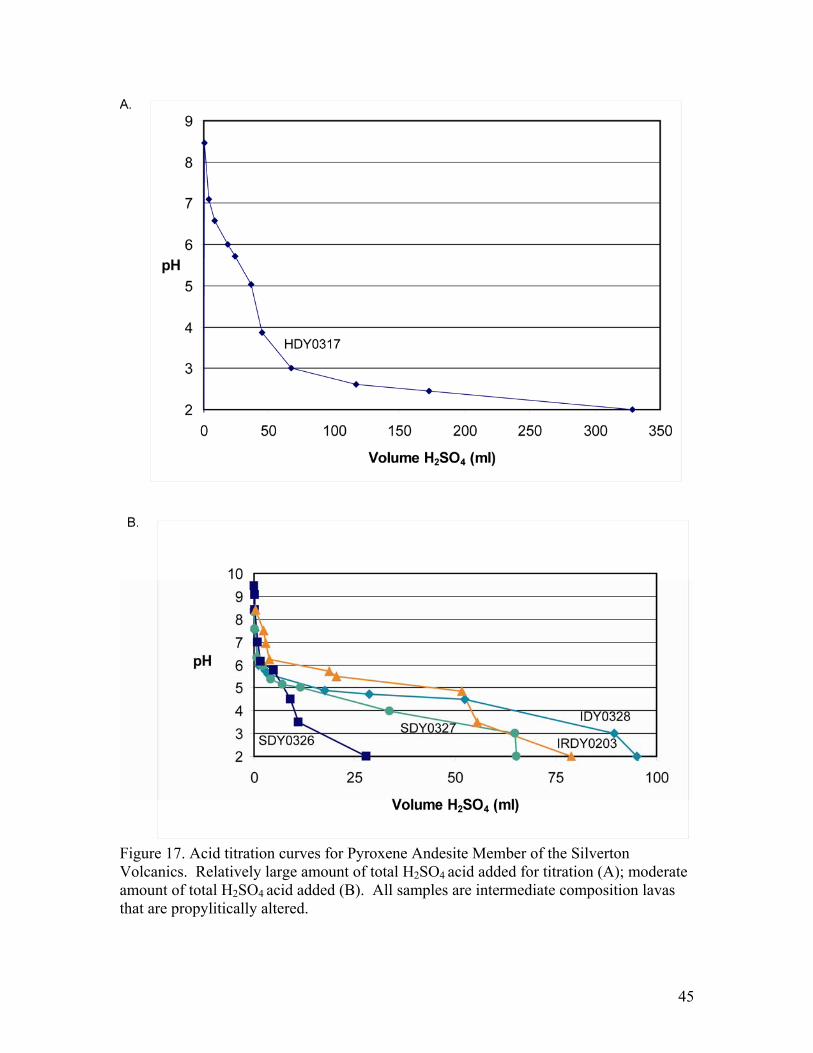
Figure 17. Acid titration curves for Pyroxene Andesite Member of the Silverton Volcanics. Relatively large amount of total H2SO4 acid added for titration (A); moderate amount of total H2SO4 acid added (B). All samples are intermediate composition lavas that are propylitically altered.
45
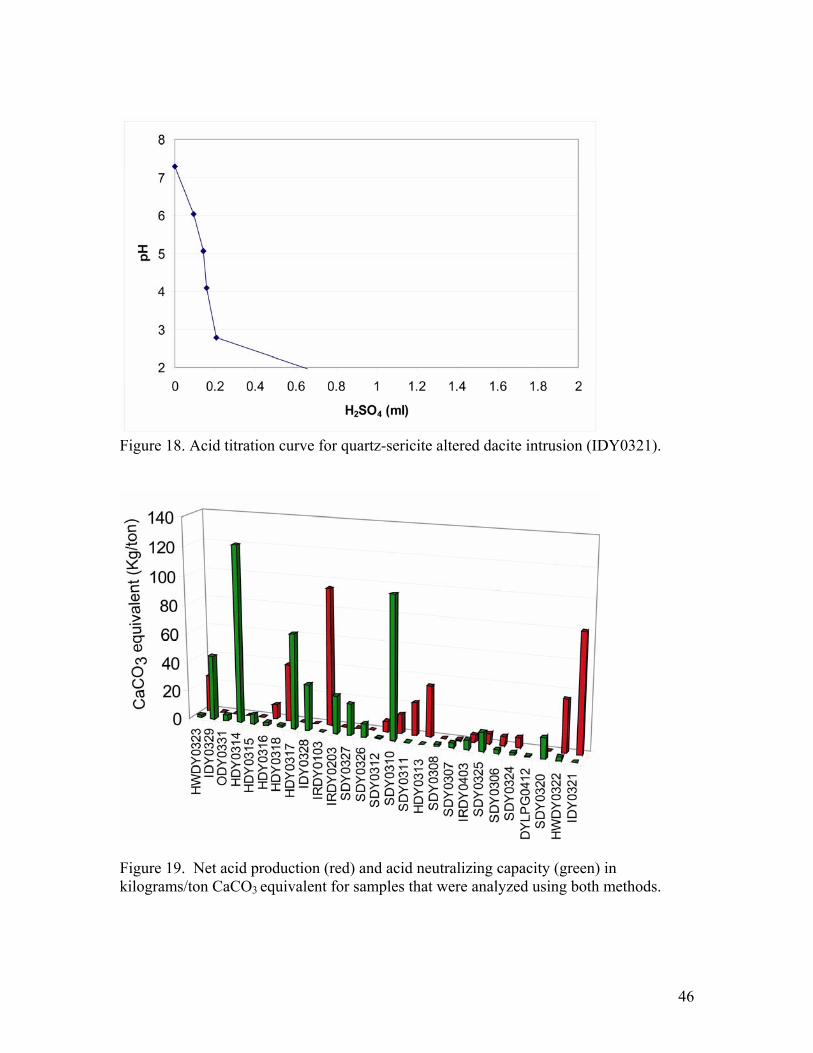
Figure 18. Acid titration curve for quartz-sericite altered dacite intrusion (IDY0321).
Figure 19. Net acid production (red) and acid neutralizing capacity (green) in kilograms/ton CaCO3 equivalent for samples that were analyzed using both methods.
46
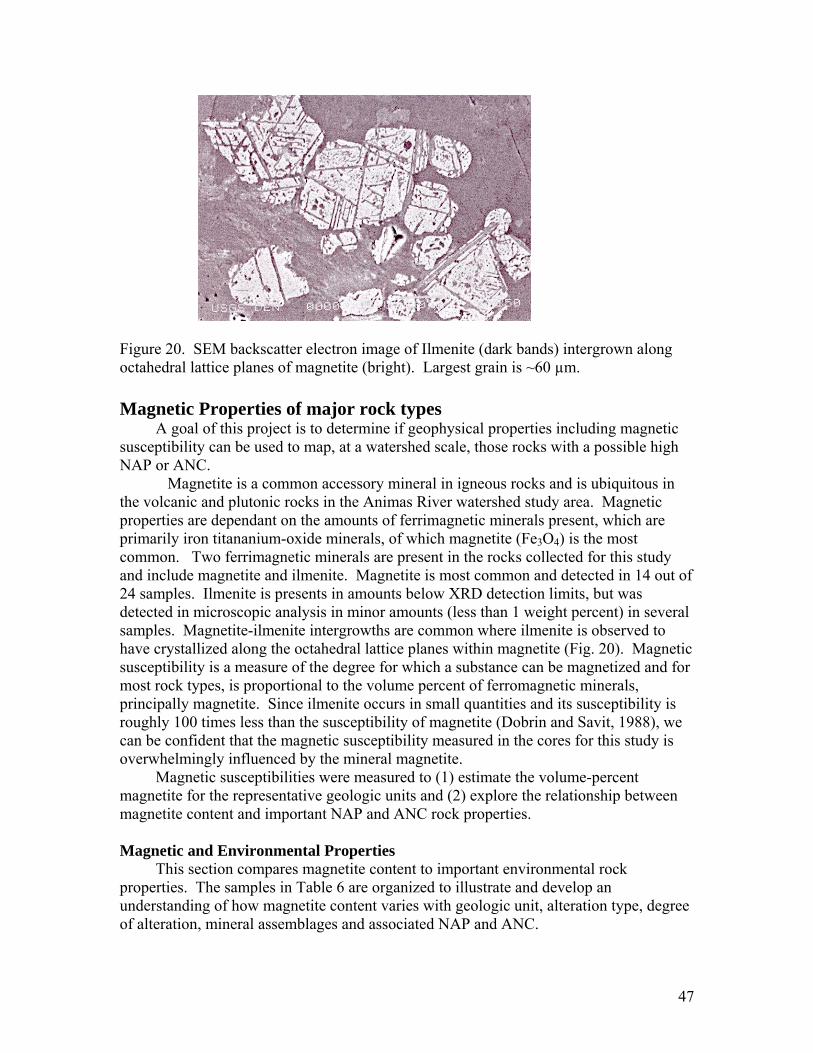
Figure 20. SEM backscatter electron image of Ilmenite (dark bands) intergrown along octahedral lattice planes of magnetite (bright). Largest grain is ~60 µm. Magnetic Properties of major rock types A goal of this project is to determine if geophysical properties including magnetic susceptibility can be used to map, at a watershed scale, those rocks with a possible high NAP or ANC. Magnetite is a common accessory mineral in igneous rocks and is ubiquitous in the volcanic and plutonic rocks in the Animas River watershed study area. Magnetic properties are dependant on the amounts of ferrimagnetic minerals present, which are primarily iron titananium-oxide minerals, of which magnetite (Fe3O4) is the most common. Two ferrimagnetic minerals are present in the rocks collected for this study and include magnetite and ilmenite. Magnetite is most common and detected in 14 out of 24 samples. Ilmenite is presents in amounts below XRD detection limits, but was detected in microscopic analysis in minor amounts (less than 1 weight percent) in several samples. Magnetite-ilmenite intergrowths are common where ilmenite is observed to have crystallized along the octahedral lattice planes within magnetite (Fig. 20). Magnetic susceptibility is a measure of the degree for which a substance can be magnetized and for most rock types, is proportional to the volume percent of ferromagnetic minerals, principally magnetite. Since ilmenite occurs in small quantities and its susceptibility is roughly 100 times less than the susceptibility of magnetite (Dobrin and Savit, 1988), we can be confident that the magnetic susceptibility measured in the cores for this study is overwhelmingly influenced by the mineral magnetite. Magnetic susceptibilities were measured to (1) estimate the volume-percent magnetite for the representative geologic units and (2) explore the relationship between magnetite content and important NAP and ANC rock properties. Magnetic and Environmental Properties This section compares magnetite content to important environmental rock properties. The samples in Table 6 are organized to illustrate and develop an understanding of how magnetite content varies with geologic unit, alteration type, degree of alteration, mineral assemblages and associated NAP and ANC.
47
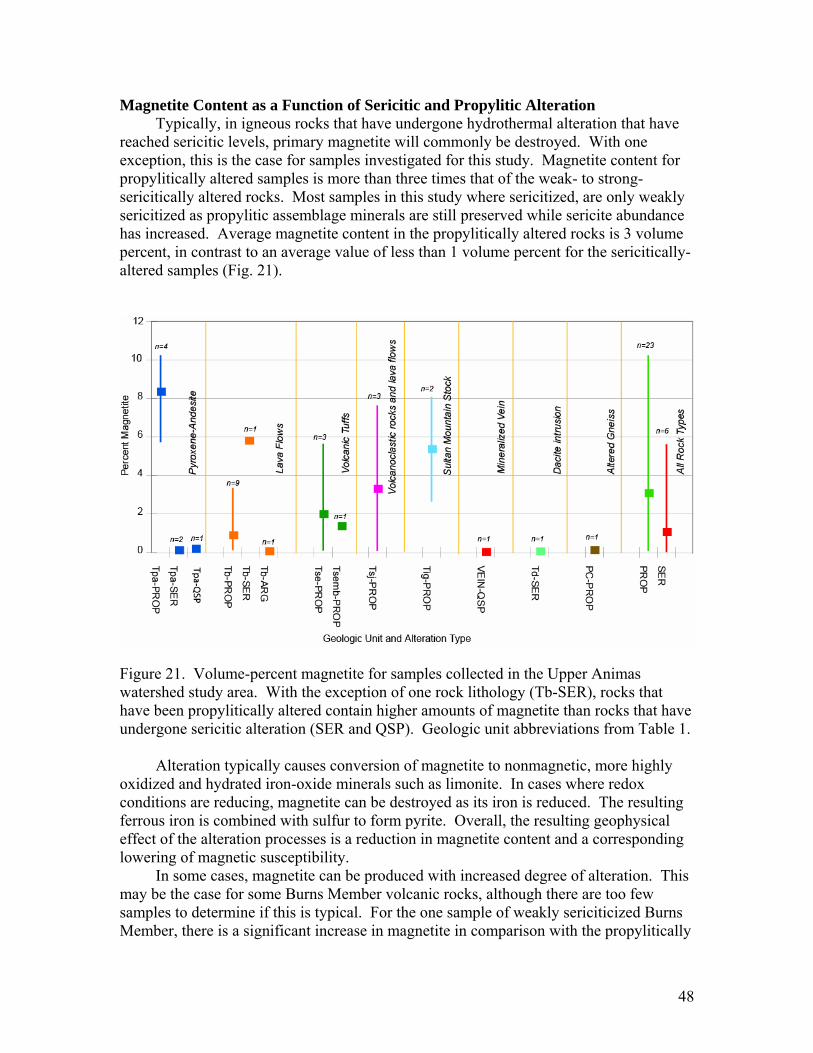
Magnetite Content as a Function of Sericitic and Propylitic Alteration Typically, in igneous rocks that have undergone hydrothermal alteration that have reached sericitic levels, primary magnetite will commonly be destroyed. With one exception, this is the case for samples investigated for this study. Magnetite content for propylitically altered samples is more than three times that of the weak- to strong-sericitically altered rocks. Most samples in this study where sericitized, are only weakly sericitized as propylitic assemblage minerals are still preserved while sericite abundance has increased. Average magnetite content in the propylitically altered rocks is 3 volume percent, in contrast to an average value of less than 1 volume percent for the sericitically-altered samples (Fig. 21).
Figure 21. Volume-percent magnetite for samples collected in the Upper Animas watershed study area. With the exception of one rock lithology (Tb-SER), rocks that have been propylitically altered contain higher amounts of magnetite than rocks that have undergone sericitic alteration (SER and QSP). Geologic unit abbreviations from Table 1. Alteration typically causes conversion of magnetite to nonmagnetic, more highly oxidized and hydrated iron-oxide minerals such as limonite. In cases where redox conditions are reducing, magnetite can be destroyed as its iron is reduced. The resulting ferrous iron is combined with sulfur to form pyrite. Overall, the resulting geophysical effect of the alteration processes is a reduction in magnetite content and a corresponding lowering of magnetic susceptibility. In some cases, magnetite can be produced with increased degree of alteration. This may be the case for some Burns Member volcanic rocks, although there are too few samples to determine if this is typical. For the one sample of weakly sericiticized Burns Member, there is a significant increase in magnetite in comparison with the propylitically
48
altered counterparts. SDY0324 is the most highly altered sample of the Burns Member lava flows collected and contains nearly 6 volume percent magnetite. In contrast, the less intenselely-altered propylitic Burns Member rocks have only 0.5 volume percent average magnetite abundance. One argillically altered sample (sample IRDY0303) is devoid of magnetite. More samples of weak-sericitically altered Burns Member lavas are needed to test the hypothesis that magnetite increases with increased alteration in this unit. Magnetite, Clay Content, Acid Generating, and Acid Consuming Minerals Alteration commonly results in substantial modification to the primary mineral phases of the original affected rock or protolith. In this section, we compare estimates for magnetite, ordered from highest to lowest values, to corresponding amounts of propylitic
49
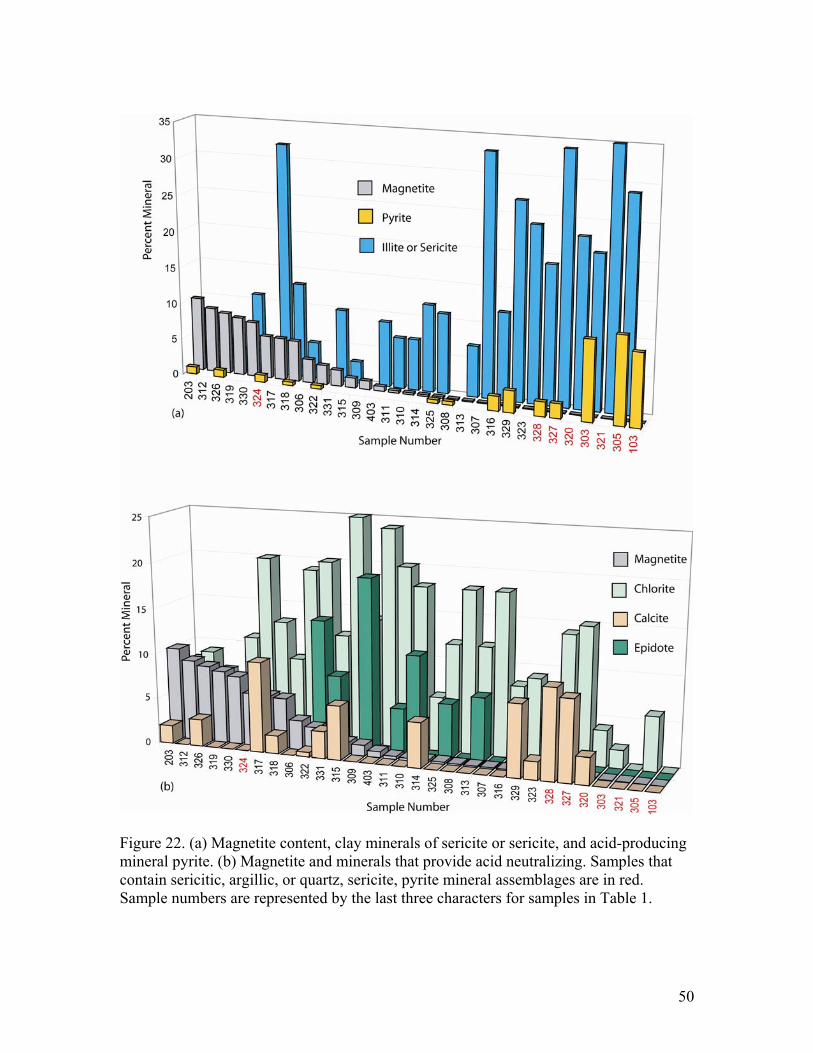
Figure 22. (a) Magnetite content, clay minerals of sericite or sericite, and acid-producing mineral pyrite. (b) Magnetite and minerals that provide acid neutralizing. Samples that contain sericitic, argillic, or quartz, sericite, pyrite mineral assemblages are in red. Sample numbers are represented by the last three characters for samples in Table 1.
50
and sericitic mineral assemblages to evaluate how magnetic mineralogy varies with variation in alteration. Pyrite is the primary mineral that is responsible for generating acidity and usually the main cause for high NAP. Clay content is another gauge for degree of alteration. In general, higher clay contents indicate a higher the degree of alteration. Mica was measured via XRD and is used here as a measure for clay minerals, either in the form of sericite or the commonly used term sericite that describes potassium clays that are similar in composition to muscovite. Clay content was compared to magnetite and pyrite content to determine the relationship between degree of alteration and magnetic properties. Magnetite content is inversely proportional to amounts of pyrite and clay minerals in most of the geologic units studied (Fig. 22). Rocks with high concentrations of magnetite are typically devoid of pyrite, although exceptions exist in two samples of propylitically altered pyroxene andesite (IRDY0203 and SDY0326) and one sample of sericitically-altered Burns volcanic rock (SDY0324). In general, however, clay and pyrite content increases with decreasing magnetite content. Higher ANC is found primarily within the propylitically altered rocks. Bove and others (in press) define two major mineral assemblages within the propylitic lithologies that include rocks dominated by calcite, epidote, and chlorite (CEC); and a second group of rocks dominated by a mineral assemblage comprised of calcite, sericite, and chlorite (CIC). Calcite, chlorite, and epidote are the main minerals responsible for providing acid consumption. Figure 22 shows these important mineral assemblages with corresponding magnetite content for all samples. The correlation between minerals with some ANC and magnetite abundance is less strong than that of the correlation between magnetite and pyrite abundance, but some generalization can be made. Three of the four samples with highest amounts of magnetite (greater than approximately 8 volume percent) are from the Pyroxene Andesite Member of the Silverton Volcanics. All the magnetite-rich samples are propylitically altered, contain less than 10 weight percent chlorite, zero to 3 weight percent calcite, and no epidote. These samples would be classified under the CIC propylitic assemblage. Rocks with moderately high to low amounts of magnetite (less than 8 to approximately 0.1 volume percent) all have chlorite present (8 to 25 weight percent, with an average of 14 weight percent), are typically propylitically altered, and a contain calcite in the range of 0 to 10 weight percent, with an average of 5.8 weight percent. Most of the samples within this range also contain epidote and would be classified under the CEC mineral assemblage. Rocks with little to no magnetite (less than 0.1 volume percent ), are typically sericitically to QSP altered, have no calcite, and little to no chlorite (0 to 6 weight percent). Magnetic Rock Properties and Mineralogy of Geologic Units Although too few samples are available to determine statistical significance, with the exception of the Burns and Pyroxene Andesite Members of the Silverton Volcanics, the rocks collected for this study were considered representative of the overall geologic unit. Consequently, we assume that the magnetic and the environmental rock properties (defined as NAP and ANC for this study) measured are generally representative for a
51
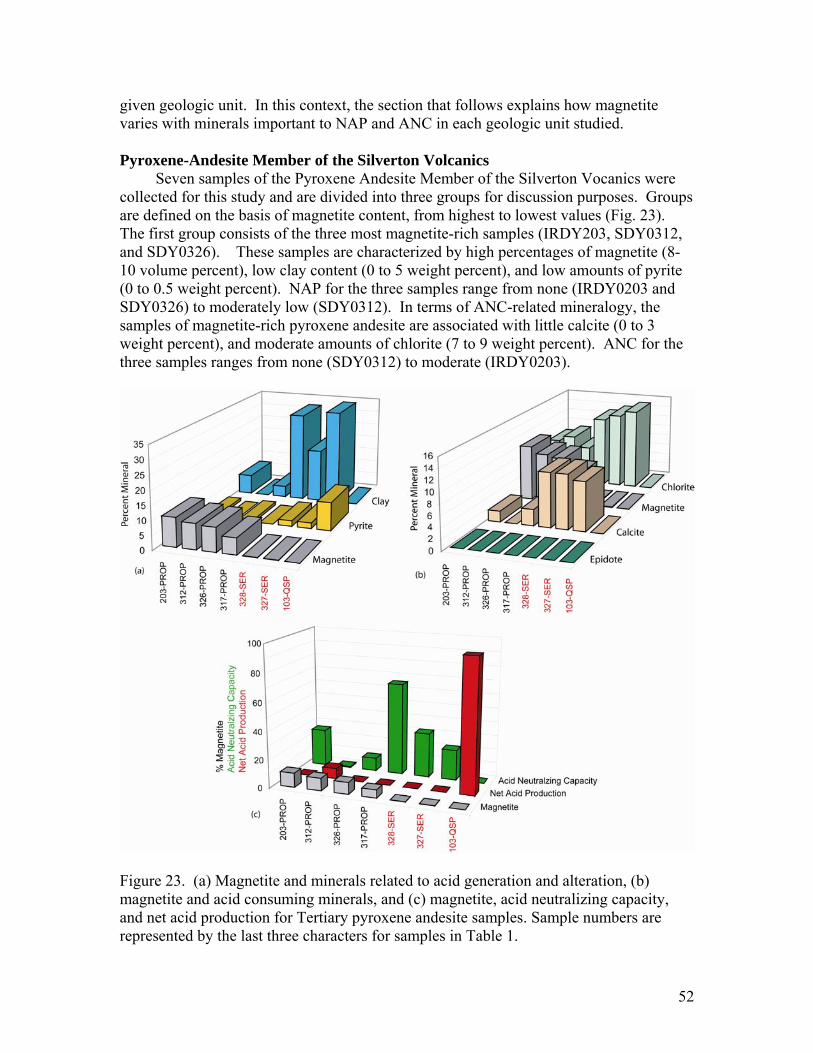
given geologic unit. In this context, the section that follows explains how magnetite varies with minerals important to NAP and ANC in each geologic unit studied. Pyroxene-Andesite Member of the Silverton Volcanics Seven samples of the Pyroxene Andesite Member of the Silverton Vocanics were collected for this study and are divided into three groups for discussion purposes. Groups are defined on the basis of magnetite content, from highest to lowest values (Fig. 23). The first group consists of the three most magnetite-rich samples (IRDY203, SDY0312, and SDY0326). These samples are characterized by high percentages of magnetite (8-10 volume percent), low clay content (0 to 5 weight percent), and low amounts of pyrite (0 to 0.5 weight percent). NAP for the three samples range from none (IRDY0203 and SDY0326) to moderately low (SDY0312). In terms of ANC-related mineralogy, the samples of magnetite-rich pyroxene andesite are associated with little calcite (0 to 3 weight percent), and moderate amounts of chlorite (7 to 9 weight percent). ANC for the three samples ranges from none (SDY0312) to moderate (IRDY0203).
Figure 23. (a) Magnetite and minerals related to acid generation and alteration, (b) magnetite and acid consuming minerals, and (c) magnetite, acid neutralizing capacity, and net acid production for Tertiary pyroxene andesite samples. Sample numbers are represented by the last three characters for samples in Table 1.
52

. Group 2 in the pyroxene andesite consists of samples HDY0317, IDY0328, and SDY0327. This group includes one propylitic and two sericitic samples. Magnetite content for the propylitic sample (HDY0317) is somewhat reduced from the Group 1 samples (5.7 volume percent) but is much higher than the magnetite content of the weakly sericitically-altered samples (IDY0328 and SDY0327), which have little to no magnetite. Aside from the magnetic mineralogy, the three samples in group 2 share mineralogical and environmental rock properties. All three are high in clay content (20 to 30 weight percent), calcite (9-10 weight percent), and chlorite (13-15 weight percent). All have no NAP and moderate to high ANC. Interestingly, in comparison with all the other geologic units sampled, only the weakly sericitically-altered Pyroxene Andesite member shows an increase in ANC with an increase in degree of sericitization. Group 3 among the Pyroxene Andesite Member samples consists of the QSP altered sample (IRDY0103). This sample is devoid of magnetite, clay, calcite, and chlorite. It has no ANC and high NAP.
53

Figure 24. (a) Magnetite and minerals related to acid generation and alteration, (b) magnetite and acid consuming minerals, and (c) magnetite, acid neutralizing capacity, and net acid production for Burns Member lava flow samples. Sample numbers are represented by the last three characters for samples in Table 1.
54
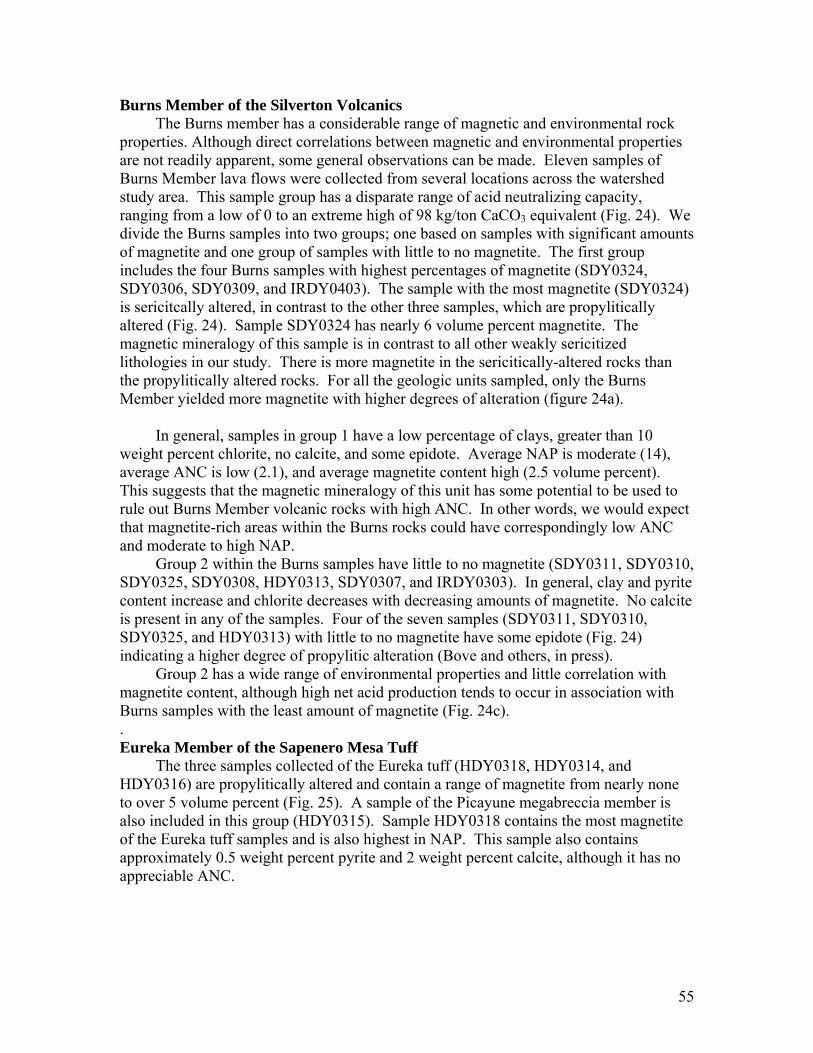
Burns Member of the Silverton Volcanics The Burns member has a considerable range of magnetic and environmental rock properties. Although direct correlations between magnetic and environmental properties are not readily apparent, some general observations can be made. Eleven samples of Burns Member lava flows were collected from several locations across the watershed study area. This sample group has a disparate range of acid neutralizing capacity, ranging from a low of 0 to an extreme high of 98 kg/ton CaCO3 equivalent (Fig. 24). We divide the Burns samples into two groups; one based on samples with significant amounts of magnetite and one group of samples with little to no magnetite. The first group includes the four Burns samples with highest percentages of magnetite (SDY0324, SDY0306, SDY0309, and IRDY0403). The sample with the most magnetite (SDY0324) is sericitcally altered, in contrast to the other three samples, which are propylitically altered (Fig. 24). Sample SDY0324 has nearly 6 volume percent magnetite. The magnetic mineralogy of this sample is in contrast to all other weakly sericitized lithologies in our study. There is more magnetite in the sericitically-altered rocks than the propylitically altered rocks. For all the geologic units sampled, only the Burns Member yielded more magnetite with higher degrees of alteration (figure 24a). In general, samples in group 1 have a low percentage of clays, greater than 10 weight percent chlorite, no calcite, and some epidote. Average NAP is moderate (14), average ANC is low (2.1), and average magnetite content high (2.5 volume percent). This suggests that the magnetic mineralogy of this unit has some potential to be used to rule out Burns Member volcanic rocks with high ANC. In other words, we would expect that magnetite-rich areas within the Burns rocks could have correspondingly low ANC and moderate to high NAP. Group 2 within the Burns samples have little to no magnetite (SDY0311, SDY0310, SDY0325, SDY0308, HDY0313, SDY0307, and IRDY0303). In general, clay and pyrite content increase and chlorite decreases with decreasing amounts of magnetite. No calcite is present in any of the samples. Four of the seven samples (SDY0311, SDY0310, SDY0325, and HDY0313) with little to no magnetite have some epidote (Fig. 24) indicating a higher degree of propylitic alteration (Bove and others, in press). Group 2 has a wide range of environmental properties and little correlation with magnetite content, although high net acid production tends to occur in association with Burns samples with the least amount of magnetite (Fig. 24c). . Eureka Member of the Sapenero Mesa Tuff The three samples collected of the Eureka tuff (HDY0318, HDY0314, and HDY0316) are propylitically altered and contain a range of magnetite from nearly none to over 5 volume percent (Fig. 25). A sample of the Picayune megabreccia member is also included in this group (HDY0315). Sample HDY0318 contains the most magnetite of the Eureka tuff samples and is also highest in NAP. This sample also contains approximately 0.5 weight percent pyrite and 2 weight percent calcite, although it has no appreciable ANC.
55
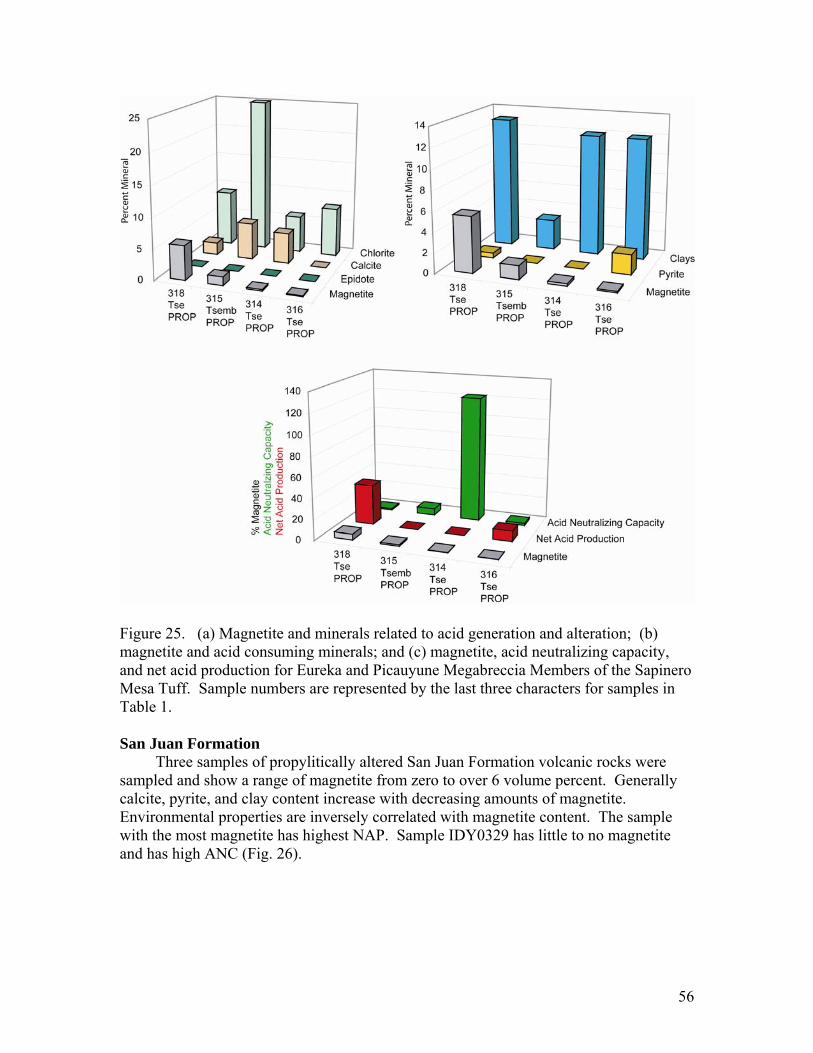
Figure 25. (a) Magnetite and minerals related to acid generation and alteration; (b) magnetite and acid consuming minerals; and (c) magnetite, acid neutralizing capacity, and net acid production for Eureka and Picauyune Megabreccia Members of the Sapinero Mesa Tuff. Sample numbers are represented by the last three characters for samples in Table 1. San Juan Formation Three samples of propylitically altered San Juan Formation volcanic rocks were sampled and show a range of magnetite from zero to over 6 volume percent. Generally calcite, pyrite, and clay content increase with decreasing amounts of magnetite. Environmental properties are inversely correlated with magnetite content. The sample with the most magnetite has highest NAP. Sample IDY0329 has little to no magnetite and has high ANC (Fig. 26).
56
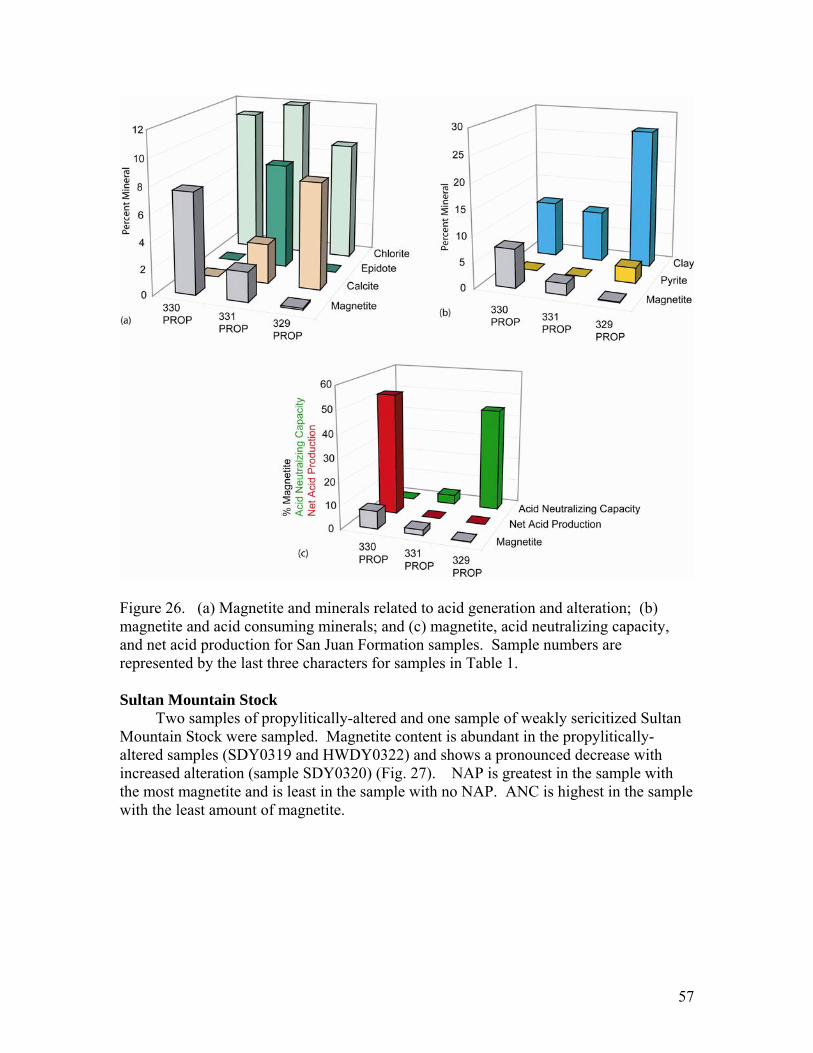
Figure 26. (a) Magnetite and minerals related to acid generation and alteration; (b) magnetite and acid consuming minerals; and (c) magnetite, acid neutralizing capacity, and net acid production for San Juan Formation samples. Sample numbers are represented by the last three characters for samples in Table 1. Sultan Mountain Stock Two samples of propylitically-altered and one sample of weakly sericitized Sultan Mountain Stock were sampled. Magnetite content is abundant in the propylitically-altered samples (SDY0319 and HWDY0322) and shows a pronounced decrease with increased alteration (sample SDY0320) (Fig. 27). NAP is greatest in the sample with the most magnetite and is least in the sample with no NAP. ANC is highest in the sample with the least amount of magnetite.
57

Figure 27. (a) Magnetite and minerals related to acid generation and alteration; (b) magnetite and acid consuming minerals; and (c) magnetite, acid neutralizing capacity, and net acid production for Sultan Mountain Stock. Sample numbers are represented by the last three characters for samples in Table 1. Mineralized Vein, Dacite Intrusion, and Precambrian Irving Formation Geologic units with only one sample include mineralized vein, dacite intrusion, and Precambrian Irving Formation gneiss. All three samples have high NAP, little to no ANP, and no magnetite (Fig. 28). Without additional sampling of this unit, it is not possible to discuss how magnetite content may vary with degree of alteration and mineralogy.
58
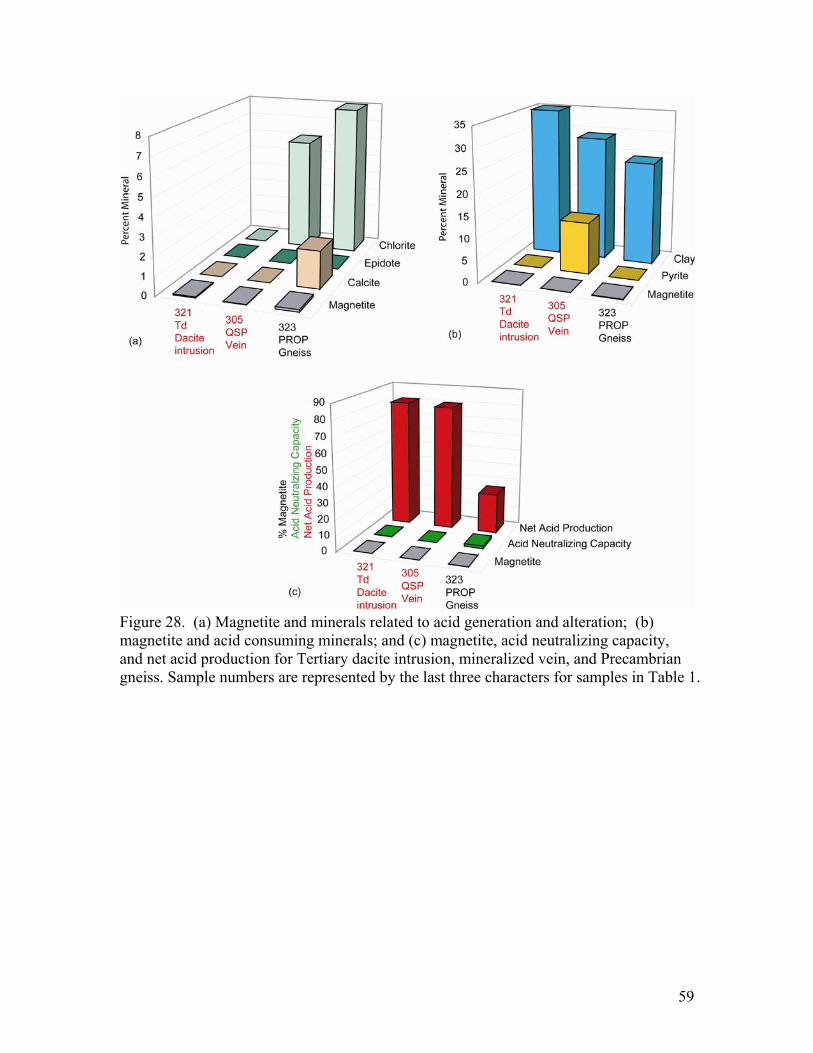
Figure 28. (a) Magnetite and minerals related to acid generation and alteration; (b) magnetite and acid consuming minerals; and (c) magnetite, acid neutralizing capacity, and net acid production for Tertiary dacite intrusion, mineralized vein, and Precambrian gneiss. Sample numbers are represented by the last three characters for samples in Table 1.
59
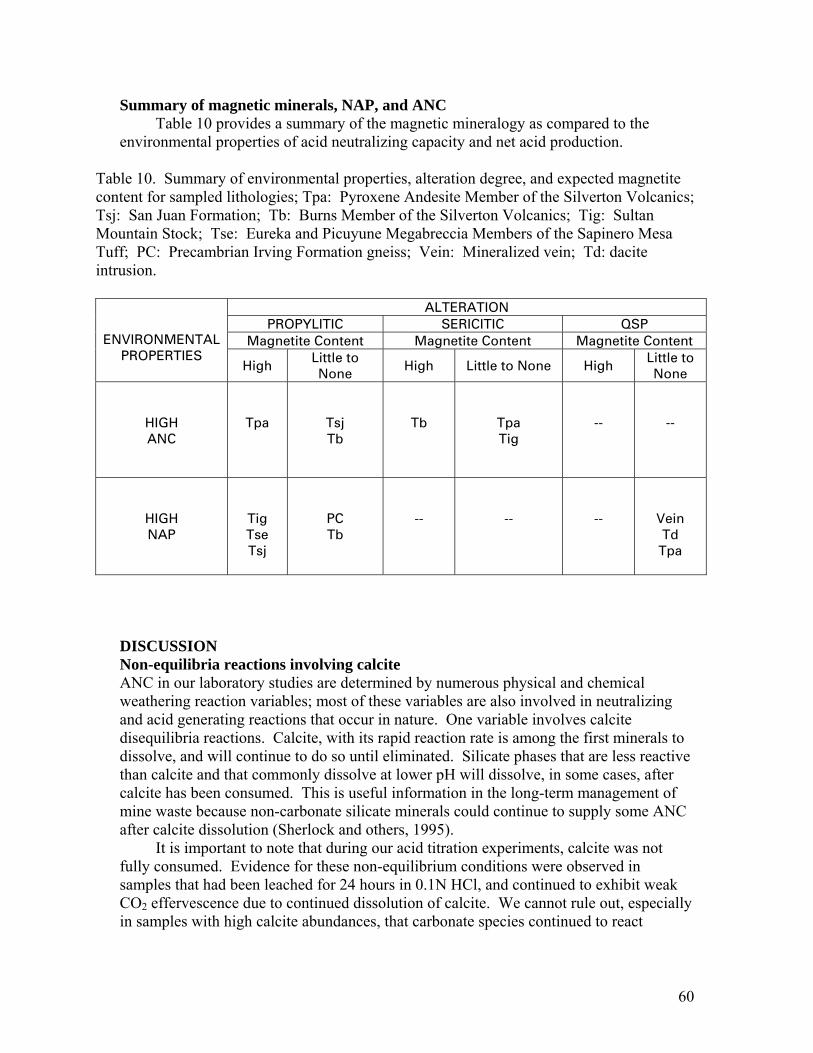
Summary of magnetic minerals, NAP, and ANC Table 10 provides a summary of the magnetic mineralogy as compared to the environmental properties of acid neutralizing capacity and net acid production.
Table 10. Summary of environmental properties, alteration degree, and expected magnetite content for sampled lithologies; Tpa: Pyroxene Andesite Member of the Silverton Volcanics; Tsj: San Juan Formation; Tb: Burns Member of the Silverton Volcanics; Tig: Sultan Mountain Stock; Tse: Eureka and Picuyune Megabreccia Members of the Sapinero Mesa Tuff; PC: Precambrian Irving Formation gneiss; Vein: Mineralized vein; Td: dacite intrusion.
ALTERATION
PROPYLITIC SERICITIC QSP Magnetite Content Magnetite Content Magnetite Content
ENVIRONMENTAL PROPERTIES
High Little to None
High Little to None High Little to None
HIGH ANC
Tpa
Tsj Tb
Tb
Tpa Tig
--
--
HIGH NAP
Tig Tse Tsj
PC Tb
--
--
--
Vein Td
Tpa
DISCUSSION Non-equilibria reactions involving calcite ANC in our laboratory studies are determined by numerous physical and chemical weathering reaction variables; most of these variables are also involved in neutralizing and acid generating reactions that occur in nature. One variable involves calcite disequilibria reactions. Calcite, with its rapid reaction rate is among the first minerals to dissolve, and will continue to do so until eliminated. Silicate phases that are less reactive than calcite and that commonly dissolve at lower pH will dissolve, in some cases, after calcite has been consumed. This is useful information in the long-term management of mine waste because non-carbonate silicate minerals could continue to supply some ANC after calcite dissolution (Sherlock and others, 1995). It is important to note that during our acid titration experiments, calcite was not fully consumed. Evidence for these non-equilibrium conditions were observed in samples that had been leached for 24 hours in 0.1N HCl, and continued to exhibit weak CO2 effervescence due to continued dissolution of calcite. We cannot rule out, especially in samples with high calcite abundances, that carbonate species continued to react
60
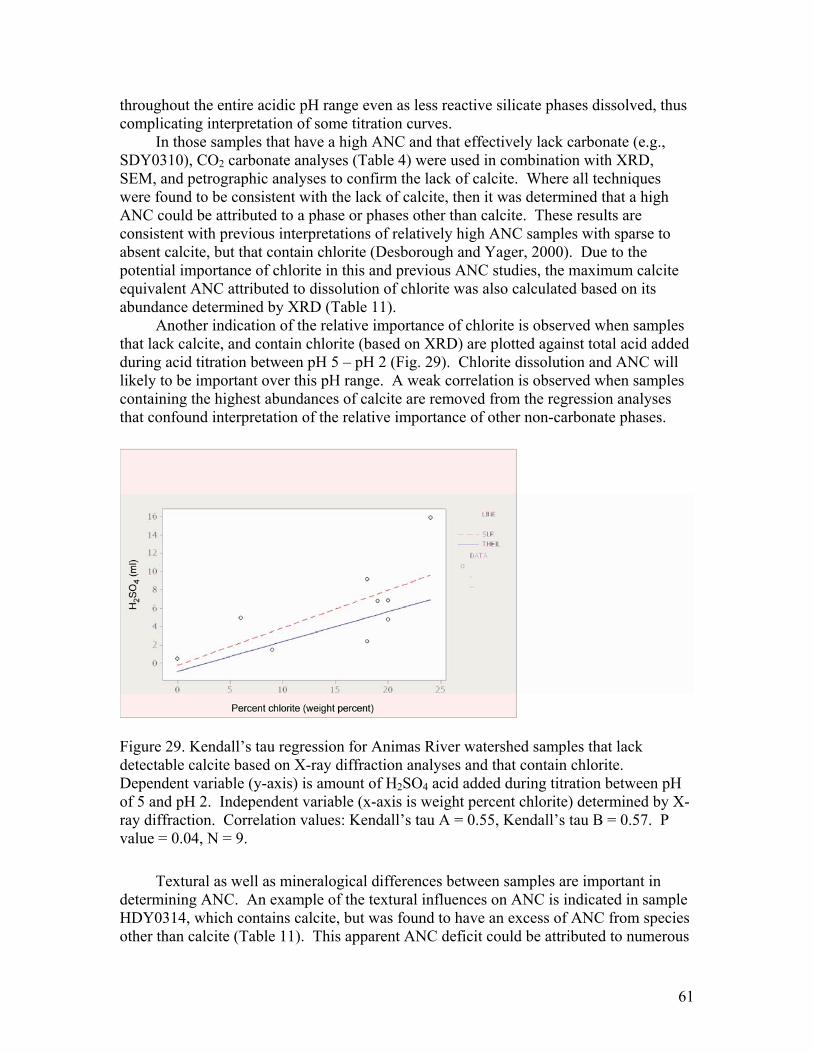
throughout the entire acidic pH range even as less reactive silicate phases dissolved, thus complicating interpretation of some titration curves. In those samples that have a high ANC and that effectively lack carbonate (e.g., SDY0310), CO2 carbonate analyses (Table 4) were used in combination with XRD, SEM, and petrographic analyses to confirm the lack of calcite. Where all techniques were found to be consistent with the lack of calcite, then it was determined that a high ANC could be attributed to a phase or phases other than calcite. These results are consistent with previous interpretations of relatively high ANC samples with sparse to absent calcite, but that contain chlorite (Desborough and Yager, 2000). Due to the potential importance of chlorite in this and previous ANC studies, the maximum calcite equivalent ANC attributed to dissolution of chlorite was also calculated based on its abundance determined by XRD (Table 11). Another indication of the relative importance of chlorite is observed when samples that lack calcite, and contain chlorite (based on XRD) are plotted against total acid added during acid titration between pH 5 – pH 2 (Fig. 29). Chlorite dissolution and ANC will likely to be important over this pH range. A weak correlation is observed when samples containing the highest abundances of calcite are removed from the regression analyses that confound interpretation of the relative importance of other non-carbonate phases.
Figure 29. Kendall’s tau regression for Animas River watershed samples that lack detectable calcite based on X-ray diffraction analyses and that contain chlorite. Dependent variable (y-axis) is amount of H2SO4 acid added during titration between pH of 5 and pH 2. Independent variable (x-axis is weight percent chlorite) determined by X-ray diffraction. Correlation values: Kendall’s tau A = 0.55, Kendall’s tau B = 0.57. P value = 0.04, N = 9.
Textural as well as mineralogical differences between samples are important in determining ANC. An example of the textural influences on ANC is indicated in sample HDY0314, which contains calcite, but was found to have an excess of ANC from species other than calcite (Table 11). This apparent ANC deficit could be attributed to numerous
61
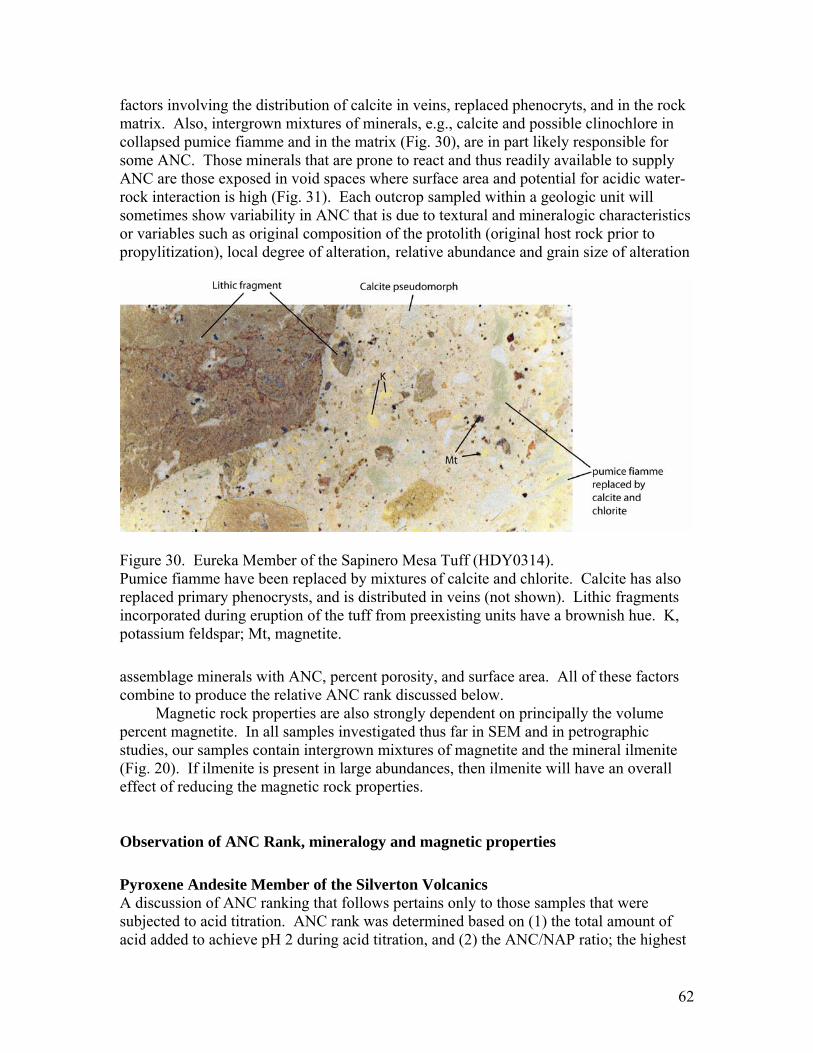
factors involving the distribution of calcite in veins, replaced phenocryts, and in the rock matrix. Also, intergrown mixtures of minerals, e.g., calcite and possible clinochlore in collapsed pumice fiamme and in the matrix (Fig. 30), are in part likely responsible for some ANC. Those minerals that are prone to react and thus readily available to supply ANC are those exposed in void spaces where surface area and potential for acidic water-rock interaction is high (Fig. 31). Each outcrop sampled within a geologic unit will sometimes show variability in ANC that is due to textural and mineralogic characteristics or variables such as original composition of the protolith (original host rock prior to propylitization), local degree of alteration, relative abundance and grain size of alteration
Figure 30. Eureka Member of the Sapinero Mesa Tuff (HDY0314). Pumice fiamme have been replaced by mixtures of calcite and chlorite. Calcite has also replaced primary phenocrysts, and is distributed in veins (not shown). Lithic fragments incorporated during eruption of the tuff from preexisting units have a brownish hue. K, potassium feldspar; Mt, magnetite. assemblage minerals with ANC, percent porosity, and surface area. All of these factors combine to produce the relative ANC rank discussed below. Magnetic rock properties are also strongly dependent on principally the volume percent magnetite. In all samples investigated thus far in SEM and in petrographic studies, our samples contain intergrown mixtures of magnetite and the mineral ilmenite (Fig. 20). If ilmenite is present in large abundances, then ilmenite will have an overall effect of reducing the magnetic rock properties. Observation of ANC Rank, mineralogy and magnetic properties Pyroxene Andesite Member of the Silverton Volcanics A discussion of ANC ranking that follows pertains only to those samples that were subjected to acid titration. ANC rank was determined based on (1) the total amount of acid added to achieve pH 2 during acid titration, and (2) the ANC/NAP ratio; the highest
62
ANC rank is assigned a number one, followed in descending order by samples with lower rank (Plate 1. Table 9). The Pyroxene Andesite Member of the Silverton Volcanics generally has little to no NAP, and has the highest mean ANC (26 kg/ton CaCO3 equivalent, n=6); however, 4 of the samples analyzed had an average ANC of 36 kg/ton CaCO3 equivalent (Table 9), with 5 samples being in the top ten in terms of ANC rank. Only one Pyroxene Andesite Member sample had detectable NAP. Thus, it is unlikely that these samples would generate acid that could interfere with acid consumption. This unit generally contains calcite, chlorite, and some pyrite but usually lacks epidote. A deficit of CaCO3 equivalent ANC is seen in Pyroxene Andesite Member samples when the calculated ANC value based on carbonate concentrations is compared with observed ANC for total acid added to pH 2 (Table 11). This is an indication that calcite may be distributed throughout the rock in such a manner that its reactivity and availability for participation in ANC reactions during acid titration may be limited. Also, trace amounts of iron or manganese in the calcite lattice could impede the reactivity of calcite; although, this has not yet been determined in microbeam analyses. The samples HDY0317 and SDY0312 that have the smallest deficit with respect to the observed and calculated ANC would imply that calcite in these samples is in the most readily available form to react and completely dissolve. While collecting samples for this study, several areas contained Pyroxene Andesite Member outcrops that were not mapped during previous studies. Outcrops were identified near the Brooklyn Mine and along the Black Bear Road near the intersection with Highway 550. This unit is relatively distinctive in the field with its dark (nearly black matrix) aphanitic texture (lacks coarse crystals) abundant hematite bands, and
63

Table 11. Calcite attributed to weight percent carbonate (Table 4), ANC determined for acid titration to pH 2, excess ANC due phases or factors other than calcite, and maximumANC for chlorite, assuming one mole of chlorite reacts to consume 16 H+ as shown in Salmon and Malmström (2004). A positive value for the column “excess ANC from other than calcite” indicates that another phase other than calcite or some chemical process may be responsible for the additional total ANC.
Field sample number
Unit ANC from
carbonate calcite
CaCO3Kg/ton ~ pH 2.00
Excess ANC from other than calcite
Maximum ANC from chlorite (Kg/ton
CaCO3
Equivalent) HWDY0323 Pe 4 1.67 -2 14 IDY0329 Tsj 83 44 -39 16 ODY0331 Tsj 18 4 -14 22 HDY0314 Tse 27 123 95 11 HDY0315 Tsemb 39 6 -33 45 HDY0316 Tse 3 2 -1 11 HDY0318 Tse 8 1 -7 16 HDY0317 Tpa 72 66 -7 23 IDY0328 Tpa 112 32 -81 25 IRDY0203 Tpa(?) 51 26 -25 14 SDY0327 Tpa 90 22 -68 27 SDY0326 Tpa 42 9 -32 13 SDY0312 Tpa 9 1 -9 16 SDY0310 Tb 1 98 98 32 SDY0308 Tb 5 1 -4 32 SDY0307 Tb 4 3 -1 32 IRDY0403 Tb 0 6 6 43 SDY0325 Tb 0 13 13 22 SDY0306 Tb 0 2 2 43 SDY0324 Tb 0 2 2 36 DYLPG0412 Tb 0 1 1 0 SDY0320 Tig 13 14 0 7 HWDY0322 Tig 4 3 -2 36 IDY0321 Td 0 0.2 0 0 MPGD_51_52.5 Qc 0 0.4 0.4 0
absence of epidote. Interestingly, the presence of epidote in the propylitic assemblage is an indicator of a higher intensity of alteration (Bove and others, in press). The Pyroxene Andesite Member, is on average, the most magnetic unit; 4 propylitically altered Pyroxene Andesite Member samples contain the highest mean volume percent magnetite (Fig. 23, Table 6). In contrast, magnetite has apparently been reduced in two samples affected by more intense alteration. The presence of phases calcite and chlorite important for their ANC, generally higher magnetite concentrations, and overall lack of epidote suggests that the Pyroxene Andesite Member lava flows that occur high in the Silverton Volcanics stratigraphic section escaped more intense
64
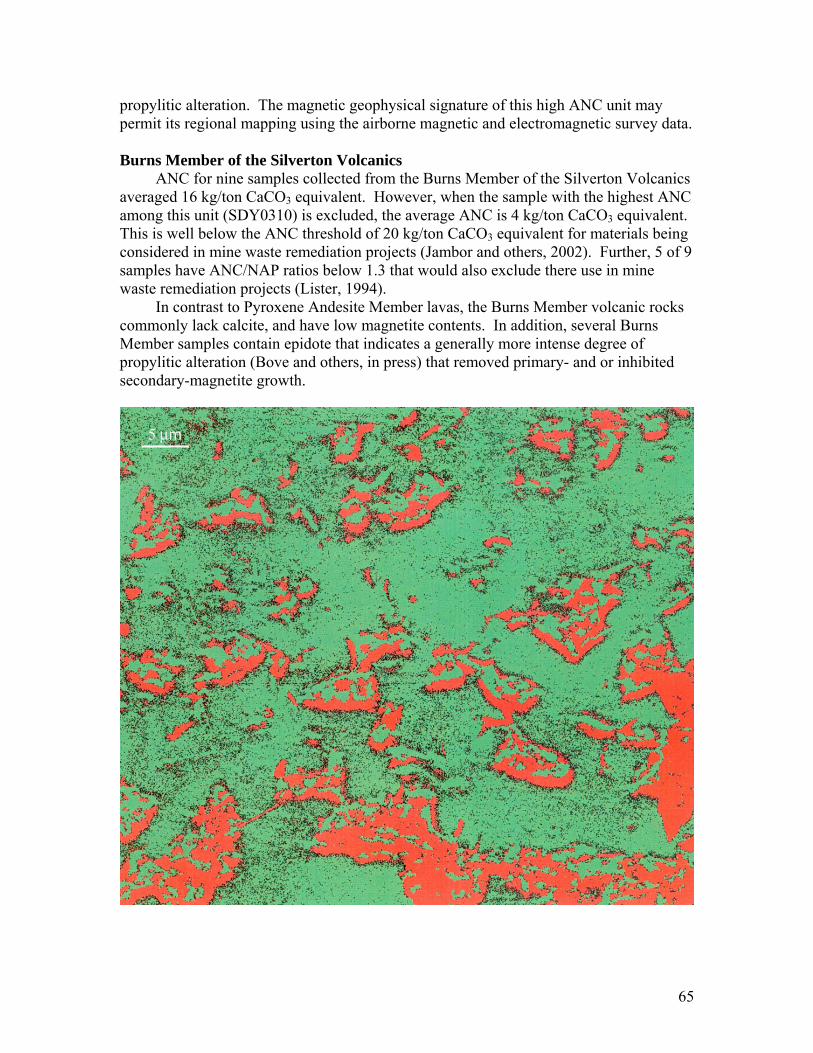
propylitic alteration. The magnetic geophysical signature of this high ANC unit may permit its regional mapping using the airborne magnetic and electromagnetic survey data. Burns Member of the Silverton Volcanics ANC for nine samples collected from the Burns Member of the Silverton Volcanics averaged 16 kg/ton CaCO3 equivalent. However, when the sample with the highest ANC among this unit (SDY0310) is excluded, the average ANC is 4 kg/ton CaCO3 equivalent. This is well below the ANC threshold of 20 kg/ton CaCO3 equivalent for materials being considered in mine waste remediation projects (Jambor and others, 2002). Further, 5 of 9 samples have ANC/NAP ratios below 1.3 that would also exclude there use in mine waste remediation projects (Lister, 1994). In contrast to Pyroxene Andesite Member lavas, the Burns Member volcanic rocks commonly lack calcite, and have low magnetite contents. In addition, several Burns Member samples contain epidote that indicates a generally more intense degree of propylitic alteration (Bove and others, in press) that removed primary- and or inhibited secondary-magnetite growth.
65

Figure 31. SEM backscatter image of sample HDY0314. Green areas are high relief; red areas are voids. A calculated maximum estimate of percent void space is 22 percent. Other geologic units Additional units that warrant additional sampling due to one or more samples having a high ANC, but that were not sampled sufficiently to make generalizations about the units overall ANC include the San Juan Formation and the Eureka Member of the Sapinero Mesa Tuff. The San Juan Formation includes one sample that is ranked 4th in ANC among all samples studied (IDY0329), contains abundant calcite, and chlorite, and has a high magnetic signature (Tables 6, 9). The authors have sampled other San Juan Formation outcrops (not analyzed in this study) that are exposed in tributary basins above Middle Fork Mineral Creek that contain abundant calcite and chlorite and likely have a high ANC. The Eureka Member of the Sapinero Mesa Tuff includes only 4 samples (this study) and incorporates a sample that has the highest ANC (HDY0314) among all samples studied. Clearly, further sampling could aid in identifying the aerial extent of the high ANC outcrops within the Eureka tuff and would help confirm the high ANC of this potentially important unit. The Eureka Member with the highest ANC rank also has a high magnetic signature that could aid in mapping those outcrops that have a potentially high ANC. The Precambrian Irving Formation in Cunningham Creek (HWDY0323) is known to contain abundant calcite, therefore, it is unclear why this sample did not produce a higher ANC rank. While HWDY0323 lacks pyrite (XRD) it also has a relatively high NAP. Therefore, additional samples could be useful in interpreting this potentially important ANC unit as the Animas River below Silverton traverses various members of the Precambrian section that could supply some ANC. Most samples of the Sultan Mountain stock were collected in areas represented by a magnetic high . Field observations near the North Star mine waste pile southwest of Siilverton (William Simon, Animas River Stakeholders Group President, personal communication, 2004) indicate re-vegetation is successful on waste rock composed mainly of Sultan Mountain stock. This waste pile occurs in an area of a magnetic low, indicating that a phase of the Sultan Mountain stock (not sampled) could supply more ANC than that observed in our study. Conclusions Regional propylitic alteration in the Animas River watershed near Silverton has introduced a mineral assemblage with varying degrees of NAP and ANC (Figures 32, 33) and magnetic properties. Where more intense alteration assemblages overprint the propylitic assemblage, this tends to remove magnetite, and thus reduce magnetic susceptibility while eliminating minerals with ANC, although important exceptions may exist in the Tertiary Burns lava flow rocks. NAP also increases when sulfide minerals are introduced. In general, our NAP and ANC studies confirm that where rocks are propylitically altered, the units have higher ANC, but where sericite has been introduced along with pyrite, then the ANC is diminished and NAP enhanced. Subtle variations in
66

degree of alteration are observed where sericite has been introduced yet the relatively high proportion of ANC minerals calcite, epidote, and chlorite have not been preserved during a weak-sericitic alteration event. These rocks generally have a higher ANC and magnetite abundances as well as lower NAP. Not surprisingly, samples that exhibit argillic and quartz-sericite-pyrite alteration have the highest NAP with pyrite being common in these assemblages; magnetite has often been eliminated.
Figure 32. Net acid production (NAP) by lithologic unit for samples collected in the Upper Animas watershed. Higher values of NAP indicate that rock’s mineralogy has a higher potential to generate acidic waters. On average, the sericitically-altered rocks (SER and QSP) lithologies have higher NAP than the propylitically-altered rocks (PROP).
67

Figure 33. Acid neutralizing capacity (ANC) by lithologic unit for samples collected in the Upper Animas watershed. Rocks with higher values of ANC have higher potential to neutralize acidic waters. With one exception, (unit Tpa), rocks that are propolytically-altered (PROP) have higher average ANC than thier sericitically (SER or QSP), argillically (ARG), or altered counterparts.
While the presence of calcite is important in quickly neutralizing acidic water, our study indicates that even though a sample may lack detectable calcite, these samples can supply some ANC when other aluminosilicate phases are present, primarily chlorite. Although not directly comparable with the reactivity and calcium carbonate equivalent as calcite, the chlorite species chamosite, clinochlore are apparently locally important in supplying some ANC; this is consistent with findings in other studies. A chlorite mineral separate and subsequent acid titration experiment clearly indicates that chamosite, and clinochlore supplied some ANC during acid titration, especially between pH 4 to pH 2. The slower reaction times involving chlorite and perhaps epidote dissolution in some samples could continue to supply ANC at lower pH ranges (below pH 4) after calcite has completely dissolved and thus could supply a longer-term source of ANC if used in mine waste remediation projects. There is a continuum in mineralogy represented in the propylitic alteration assemblage that affects the entire study area and ultimately controls environmental rock properties. Our studies show that even though a propylitically-altered outcrop might have abundant (as much as 32 weight percent) sericite, and appear to be relatively altered and or weathered in outcrop, these types of samples can have a relatively high ANC when calcite and chlorite are present. Thus, while field mapping is an important component in identifying samples with possible ANC, further detailed lab analysis is essential in determining with some certainty that a sample has a high ANC. The highest ANC of all geologic units studied is the Pyroxene Andesite Member of the Silverton Volcanics. This is a volumetrically important unit, is host along with the
68
Burns Member to much of the base- and precious-metal mineralization in the study area. Generally high magnetite contents and attendant relatively high magnetic susceptibilities permit the unit to be regionally mapped with airborne magnetic survey data. Additional mineralogic characteristics of this unit are its lack of epidote, and ubiquitous presence of chlorite and calcite. Perhaps as important as a high ANC, Pyroxene Andesite Member rocks where propylitically altered to weakly sericicitized, in most cases lack NAP. As a result, all available ANC will not be inhibited by NAP generated by sulfide oxidation. Burns Member rocks, which commonly occur stratigraphically below the Pyroxene Andesite Member volcanics have generally been subjected to slightly higher degrees of propylitization as indicated by the presence of epidote in several samples (Bove and others, in press). This, along with a general dearth of magnetite and calcite, and the presence of pyrite in several samples, imparts a low ANC and relatively high NAP. However, an anomalous Burns Member lava has the second highest ANC, contains abundant chlorite, yet lacks calcite indicating that locally, Burns Member rocks can have a relatively high ANC that is related to the mineralogical variability in the propylitic assemblage. As with other geologic units, the highest NAP determinations were observed in more intensely altered samples. Other geologic units that warrant additional study due to too few samples analyzed for ANC include the Eureka Member of the Sapinero Mesa Tuff, the San Juan Formation, and the Sultan Mountain Stock. A volcaniclastic breccia collected in the San Juan Formation has the 4th highest ANC of all samples studied, contains abundant calcite, and yet has a low magnetite content and corresponding low magnetic susceptibility. The San Juan Formation commonly has a high magnetic signature, therefore, use of the airborne magnetic survey data to identify areas of this unit that have a low magnetic signature may help to identify additional outcrops with possible high ANC. The outcrop with the highest ANC studied was collected from the Eureka Member of the Sapinero Mesa Tuff. Microscopic analysis revealed that many physical factors are in part controlling the high ANC. Calcite and chlorite are distributed throughout the sample in many textural forms. Calculated void space was also high imparting a high potential for mineral-rock dissolution. While the presence of minerals with a high ANC is important, this sample indicates that textural characteristics of how the high ANC minerals may be distributed may be important in supplying ANC. One sample of Sultan Mountain stock has a relatively high ANC and lower magnetite abundance when compared with additional Sultan Mountain Stock samples. Other Sultan Mountain Stock samples have lower silica contents compared to the relatively high ANC sample and have both higher magnetite contents and magnetic susceptibilities, therefore, similar to the San Juan Formation, use of the airborne magnetic survey data to identify areas of this unit that have a low magnetic signature may help to identify additional outcrops with a possible high ANC.
69
Future Study Directions Some items are related to the geophysical component of this study but many are related to further defining the acid neutralizing and acid generating capacities of lithologies that require additional samples and analysis to provide a statistically representative dataset for interpretation. These proposed efforts would build upon and strengthen the knowledge gained through this study resulting in a more thorough understanding of how the physical magnetic and electromagnetic properties are related to the environmental properties (ANC and NAP) of the plutonic and volcanic rocks within the Animas River watershed near Silverton. We recommend that any additional samples collected should be analyzed using the same approaches and laboratory protocols as were used for this study in order to provide consistency. The following is divided into two major categories; (1) field and laboratory efforts that would involve field sampling and laboratory analysis and (2) efforts that would involve analysis of existing geophysical map data mainly through computer analysis and modeling. Sample Strategies and Laboratory Studies
• Sample and analyze more sericitically altered Burns Member of the Silverton Volcanics to test the hypothesis that higher degrees of alteration (and hence acid generating potential) are associated with magnetite enrichment.
• Sample and analyze the Henson Member of the Silverton Volcanics; a unit that was not sampled for this study.
• Sample and analyze additional sericitized and propylitically altered Eureka and Picauyune Megabreccia Member of the Sapinero Mesa Tuff.
• Sample and analyze Sultan Mountain Stock in areas that have a lower magnetic signature than those samples analyzed in this study
• Conduct laboratory measurements of the electrical resistivity of samples collected for this study and any new samples.
• Conduct chemical analyses of leachates on a select number of samples to determine the chemical elements present due to dissolution of mineral phases at various pH units. This will help define which ANC mineral is contributing to neutralizing acidity produced by pyrite and at varying pH.
• Conduct quantitative electron microbeam analyses of chlorite species among other aluminosilicate phases are necessary to determine stoichiometry and major element ratios. These data may aid in predicting ease of dissolution or reactivity that could supply a readily available source of ANC.
• Conduct laser ablation ICP-MS analysis of carbonates that may prove useful in identifying trace constituents that could impede reaction rates.
Map Scale Efforts and Analysis
• Digitize and incorporate available (published) mapping of the Tertiary pyroxene-andesite and Tertiary Henson rock outcrops into existing digital geologic compilation (Yager and Bove, 2002; Yager and Bove, in press). Although these units are incompletely mapped for the entire study area and volcano-stratigraphic issues remain, the mapped areas that are available will provide control in
70
developing sampling strategies and airborne geophysical data analysis and interpretation.
• Further evaluate and define whether geologic units with high ANC and high NAP have characteristic airborne magnetic and electromagnetic anomaly signatures using helicopter geophysical survey data collected in 1997 (Smith and others, in press). Use these results along with the alteration mapping of Bove and others (in press) to construct a map identifying areas with high NAP and ANC.
Acknowledgments We thank Robert R. McDougal for assistance in the field. Del and Laura Smith (Silverton residents) for providing field logistical support that aided our sampling efforts. We appreciate the professional guidance on NAP and ANC methods from Kathy Smith, Stan Church, and George Desborough. Reviews by George Desborough and Philip Hageman improved a preliminary version of this report. Kay Zillich, U.S. Forest Service Hydrologist, and Stephanie O’Dell, San Juan Forest Abandoned Mine Lands Coordinator, under a U.S. Forest Service-U.S. Geological Survey interagency agreement number 04-IA-11021300-017, supported our research. Disclaimers Any use of trade names is for descriptive purposes only and does not imply endorsement by the U.S. Government. This report has not been reviewed for geologic nomenclature.
References Cited Atwood, W.W., and Mather, K.F., 1932, Physiography and Quaternary geology of the
San Juan Mountains, Colorado: U.S. Geological Survey Professional Paper 166, 176 p.
Balsley, J.R., and Buddington, A.F., 1958, Iron-titanium oxide minerals, rocks, and aeromagnetic anomalies of the Adirondack area, New York: Economic Geology, v. 53, no. 7, pp. 777-805.
Barker, Fred, 1969, Precambrian geology of the Needle Mountains, southwestern Colorado: U.S. Geological Survey Professional Paper, 644-A, p. A1-A35.
Bejnar, Waldemere, 1957, Lithologic control of ore deposits in the southwestern San Juan Mountains, in Kottlowski, F. E., and Baldwin, Brewster, eds., Guidebook of southwestern San Juan Mountains, Colorado: New Mexico Geological Society 8th Annual Field Conference Guidebook, p. 162-173.
Blair, R.W., Jr., Yager, D.B., and Church, S.E., 2002, Surficial geologic maps along the riparian zone of the Animas River and its headwater tributaries, Silverton to Durango, Colorado, with upper Animas River watershed gradient profiles: U.S. Geological Survey Digital Data Series 071.
Blowes, D.W., Ptacek, C.J., and Jurjovic, Jasna, 2003, Mill tailings: hydrogeology and geochemistry: in Mineralogical Association of Canada Short Course Series, v. 31, p. 95-116.
71

Bove, D.J., Mast, M.A., Dalton, J.B., Wright, W.G., and Yager, D.B., (in press), Major styles of mineralization and hydrothermal alteration and related solid and aqueous-phase geochemical signatures, Chapter E3: U.S. Geological Survey Professional Paper 1651, Church, S.E., and Vonguerard, Paul, eds.
Bove, D.J., Hon, Ken, Budding, K.E., Slack, J.F., Snee, L.W., and Yeoman, R.A., 2001, Geochronology and geology of late Oligocene through Miocene volcanism and mineralization in the Western San Juan Mountains, Colorado: U.S. Geological Survey Professional Paper 1642, 30 p.
Burbank, W.S., 1960, Pre-ore propylization, Silverton Caldera, Colorado, in Geological Survey Research 1960: U.S. Geological Survey Professional Paper 400-B, article 6, p. B12-B13.
Burbank, W.S., and Luedke, R.G., 1969, Geology and ore deposits of the Eureka and adjoining districts, San Juan Mountains, Colorado: U.S. Geological Survey Professional Paper 535, 73 p.
Casadevall, Thomas, and Ohmoto, H., 1977, Sunnyside mine, Eureka mining district, San Juan County, Colorado— Geochemistry of gold and base metal ore deposition in a volcanic environment: Economic Geology, v. 92, p. 1285-1320.
Chapin, C.E., and Cather, S.M., 1994, Tectonic setting of the axial basins of the northern and central Rio Grande rift: Geological Society of America Special Paper 291, p. 5-25.
Davis, J.A., and Kent, D.B., 1990, Surface complexation modeling in aqueous geochemistry: in Mineral-Water Interface Geochemistry, Hochella, M.F., Jr., and White, A.F., eds., Mineralogical Society of America Reviews in Mineralogy, v. 23, p.177-260.
Desborough, G.A., and Driscoll, R.L., 1998, Mineralogical characteristics and acid-neutralizing potential of drill core samples from eight sites considered from metal-mine related waste repositories in northern Jefferson, Powell, and Lewis and Clark counties, Montana: U.S. Geological Survey Open-File Report 98-0790, 6 p.
Desborough, G.A., and Yager, D.B., 2000, Acid-neutralizing potential of igneous bedrocks in the Animas River headwaters, San Juan County, Colorado: U.S. Geological Survey Open-File Report 00-0165, 14 p.
Dobrin, M.B., and Savit, C.H., 1988, Introduction to geophysical prospecting, Fourth Edition, New York, McGraw Hill, 867 p.
Gill, J.B., 1981, Orogenic andesites and plate tectonics: Berlin, Springer, 389 p. Gillam, M.E., 1998, Late Cenozoic geology and soils of the lower Animas River valley,
Colorado and New Mexico: Boulder, Colo., University of Colorado Ph. D. dissertation, 477 p., 3 plates.
Hoch, A.R., Reddy, M.M., and Drever, J.I., 1999, Importance of mechanical disaggregation in chemical weathering in a cold alpine environment, San Juan Mountains, Colorado: Geological Society of America Bulletin, v. 111, p. 304-314.
Hutchison, I.P.G., and Ellison, R.D., eds., 1992, Mine waste management: a resource for mining industry professionals, regulators and consulting engineers: Lewis Publishers, Inc., 672 p.
72
Jambor, J.L., 2003, Mine-waste mineralogy and mineralogical perspectives of acid-base accounting: in Environmental Aspects of Mine Wastes, Jambor, J.L., Blowes, D.W., and Ritchie, A.I.M., eds.: Mineralogical Association of Canada Short Course Series, v. 31, p. 117-145.
Jambor, J.L., and Blowes, 1998, Theory and applications of mineralogy, in environmental studies of sulfide-bearing mine wastes: in Modern Approaches to Ore and Environmental Mineralogy, Cabri, J.L., and Vaughan, D.J., eds.: Mineralogical Association of Canada Short Course Series, v. 27, p. 367-401.
Jambor, J.L., Dutrizac, J.E., Groat, L.A., and Raudsepp, Mati, 2002, Static tests of neutralization potentials of silicate and aluminosilicate minerals: Environmental Geology, v. 43, p. 1-17.
Kottlowski, F.E., 1957, Mesozoic strata flanking the southwestern San Juan Mountains Colorado and New Mexico, in Kottlowski, F. E., and Baldwin, Brewster, eds., Guidebook of southwestern San Juan Mountains, Colorado: New Mexico Geological Society 8th Annual Field Conference Guidebook, p. 138-153.
Kwong, J.Y.T., and Furgeson, K.D., 1997, Mineralogical changes during NP determinations and their implications: Proceedings of the Fourth International Conference on Acid Rock Drainage, Volume 1: Society for Mining, Metallurgy, and Exploration, Inc., p. 435-447.
LeBas, M.J., LeMaitre, R.W., Streckeisen, A., and Zanettin, B., 1986, A chemical classification of volcanic rocks based on the total alkali silica diagram: Journal of Petrology, v. 27, p. 745-750.
Lanphere, M.A., 1988, High resolution 40Ar/39Ar chronology of Oligocene volcanic rocks, San Juan Mountains, Colorado: Geochimica et Cosmochimica Acta, v. 52, p. 1425-1434.
Lapakko, Kim, and Lawrence, R.W., 1993, Modification of the net acid production (NAP) test: in Proceedings of the Seventeenth Annual British Columbia Mine Reclamation Symposium, Port Hardy, British Columbia, 1993, p. 145-159.
Leonard, Eric, Merritts, Dorothy, and Carson, Robert, 1993, Quaternary geology, upper Rio Grande drainage, San Juan Mountains, Colorado, in Wilson, M.A., compiler: Beloit Wisconsin, Beloit College, The Sixth Keck research symposium in geology, v. 6, p. 170-172.
Lipman, P.W., 1976, Geologic map of the Lake City caldera area, western San Juan Mountains, southwestern Colorado: U.S. Geological Survey Miscellaneous Investigation Series Map I-962, scale 1:48,000.
Lipman, P.W., Dungan, Michael, Bachmann, Olivier, 1997, Comagmatic granophyric granite in the Fish Canyon Tuff, Colorado— Implications for magma-chamber processes during a large ash-flow eruption: Geology, v. 25, p. 915-918.
Lipman, P.W., Steven, T.A., Luedke, R.G., and Burbank, W.S., 1973, Revised volcanic history of the San Juan, Uncompahgre, Silverton, and Lake City calderas in the western San Juan Mountains, Colorado: U.S. Geological Survey Journal of Research, v. 1, p. 627-642.
Lister, D., 1994, An assessment of acid rock drainage potential of waste rock and implications for long term weathering of the north dump at Island Cooper mine, Port
73
Hardy, B.C., Masters of Science Thesis, Vancouver, The University of British Columbia, 217 pp.
Luedke, R.G., and Burbank, W.S., 2000, Geologic map of the Silverton and Howardsville quadrangles, southwestern Colorado: U.S. Geological Survey Geologic Investigation Series Map I-2681, scale 1:24,000.
Hutchison, I.P.G., and Ellison, R.D., eds., 1992, Mine waste management: a resource for mining industry professionals, regulators and consulting engineers: Lewis Publishers, Inc., 672 p.
Nash, J.T., 2000, Geochemical studies of mines, dumps, and tailings, as sources of contamination, upper Animas River watershed, Colorado: U.S. Geological Survey Open-File Report 00-104. [1 CDROM]
Raudsepp, Mati, and Pani, Elisabetta, 2003, Application of Rietveld analysis to environmental mineralogy: in Mineralogical Association of Canada Short Course Series, v. 31, p. 165-180.
Raudsepp, Mati, Pani, Elisabetta, and Dipple, G.M., 1999, Measuring mineral abundance in skarn I: the Rietveld method using X-ray Powder diffraction data: Canadian Mineralogist, v. 37, p. 1-15.
Ringrose, C.R., 1982, Geology, geochemistry, and stable isotope studies of a porphyry-style hydrothermal system, west Silverton district, San Juan Mountains, Colorado: Aberdeen, Scotland, University of Aberdeen Ph. D. dissertation, 257 p., 19 plates.
Salmon, U.S., and Malmström, M.E., 2004, Geochemical processes in mill tailings deposits: modeling of groundwater composition: Applied Geochemistry, v. 19, p. 1-17.
Shaw, Shannon, Wels, Christoph, Robertson, Andy, and Lorinczi, Geyza, 2002, Physical and Geochemical Characterization of Mine Rock Piles at the Questa mine, New Mexico: in Tailings and Mine Waste 2002, proceedings of the Ninth International Conference on Tailings and Mine Waste, Fort Collins, Colorado, USA, 27-30 January 2002, pp. 447-458.
Sherlock, E.J., Lawrence, R.W., and Poulin, R., 1995, On the neutralization of acid rock drainage by carbonate and silicate minerals: Environmental Geology, v. 25, p. 43-54.
Smith, B.D., McDougal, R.R., Deszcz-Pan, Maryla, and Yager, D.B.., in press, Helicopter electromagnetic and magnetic surveys, Chapter E4 in Church, S.E., von Guerard, Paul, and Finger, S.E., eds., Integrated investigations of environmental effects of historical mining in the Animas River watershed, San Juan County, Colorado: U.S. Geological Survey Professional Paper 1651.
Steven, T.A., Hon, Ken, and Lanphere, M.A., 1995, Neogene geomorphic evolution of central San Juan Mountains near Creede, Colorado: Miscellaneous Investigation Series Map I-2504, scale 1:100,000.
Steven, T.A., Lipman, P.W., 1976, Calderas of the San Juan volcanic field, southwestern Colorado: U.S. Geological Survey Professional Paper, 958, 35 p.
Steven, T.A., Schmitt, L.J., Jr., Sheridan, M.J., Williams, F.E., Gair, J.E., and Klemic, H., 1969, Mineral resources of the San Juan primitive area, Colorado: U.S. Geological Survey Bulletin 1261-F, 187 p.
Wirt and others, in press
74
Yager, D.B., and Bove, D.J., in press, Geologic Framework, Chapter E1: U.S. Geological Survey Professional Paper 1651, Church, S.E., and Vonguerard, Paul, eds.
Bove, D.J., Generalized Geologic Map of Part of the Upper Animas River Watershed and Vicinity, Silverton, Colorado: U.S. Geological Survey Miscellaneous Field Studies Map, MF-2377.
Yager, D.B., Mast, M.A., Verplanck, P.L., Bove, D.J., Wright, W.G., and Hageman, P.L., 2000, Natural versus mining-related water quality degradation to tributaries draining Mount Moly, Silverton, Colorado, in ICARD 2000; Proceedings of the Fifth International Conference on Acid Rock Drainage, Volume 1: Society for Mining, Metallurgy, and Exploration, Inc., p. 535-547.
Yager, D.B., and Bove, D.J., 2002, Generalized Geologic Map of Part of the Upper Animas River Watershed and Vicinity, Silverton, Colorado: U.S. Geological Survey Professional Paper, Miscellaneous Field Studies Map MF-2377.
Young, R.A., 1993, The Rietveld Method: International Union Crystallography, Oxford University Press, New York, 298 p.
75