NESC Academy 1 Acoustic Fatigue By Tom Irvine Webinar 37.
30
NESC Academy 1 Acoustic Fatigue By Tom Irvine Webinar 37
-
Upload
archibald-hall -
Category
Documents
-
view
216 -
download
2
Transcript of NESC Academy 1 Acoustic Fatigue By Tom Irvine Webinar 37.
NESC Academy
1
Acoustic Fatigue
By Tom Irvine
Webinar 37
Vibrationdata
2
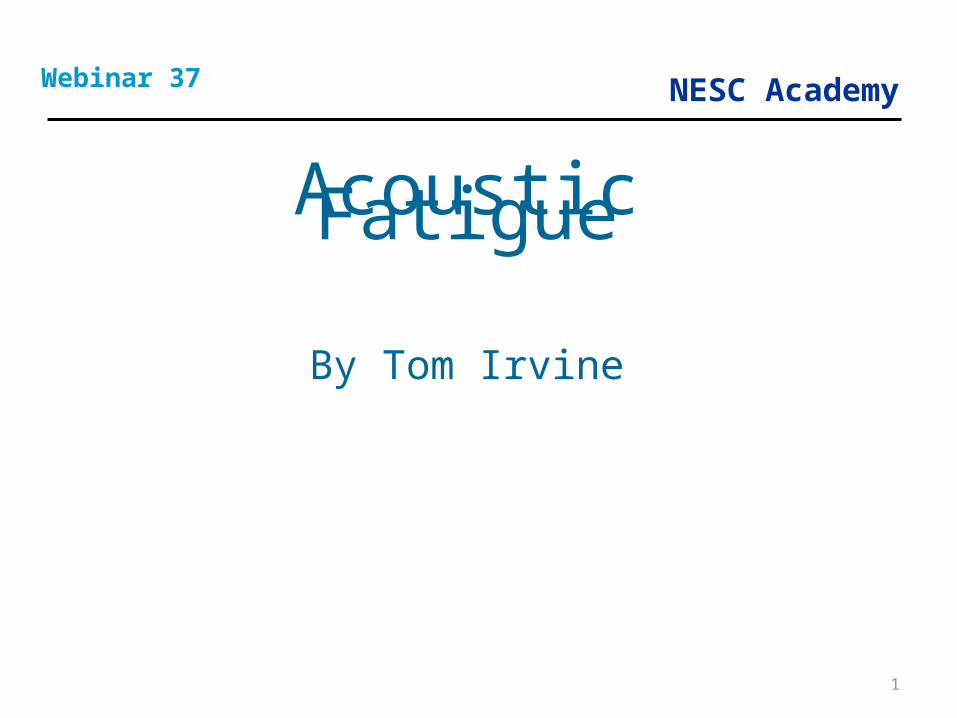
• Sound waves propagate longitudinally
Sound Waves
Vibrationdata
3
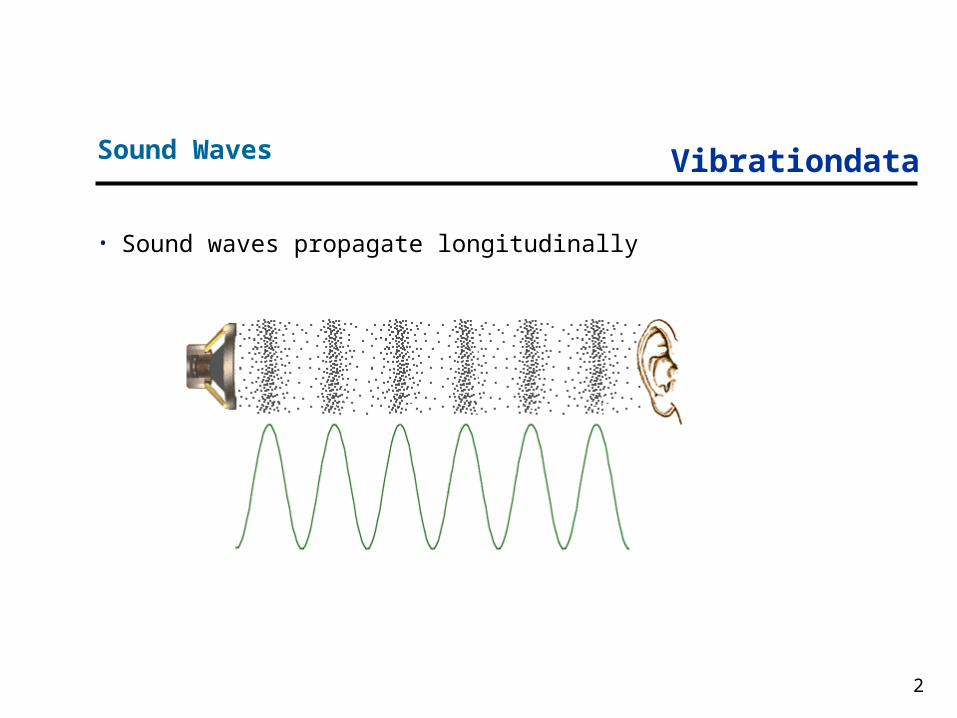
The overall sound pressure OASPL is
Sound Pressure Level Formula
PrmsOASPL 20log
Pref
where P rms is the pressure RMS
20 Pa rms for air
Pref1 Pa rms for water
The equivalent reference for air in terms of English units is :
Pref ≈ 2.9(10 -9) psi rms
dB
Vibrationdata
4
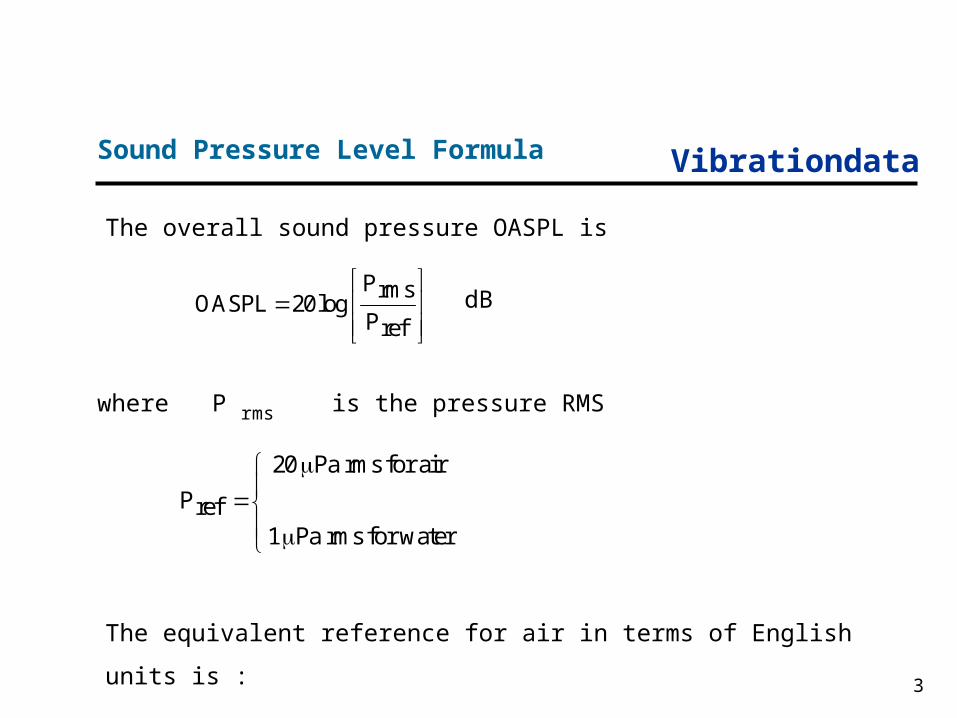
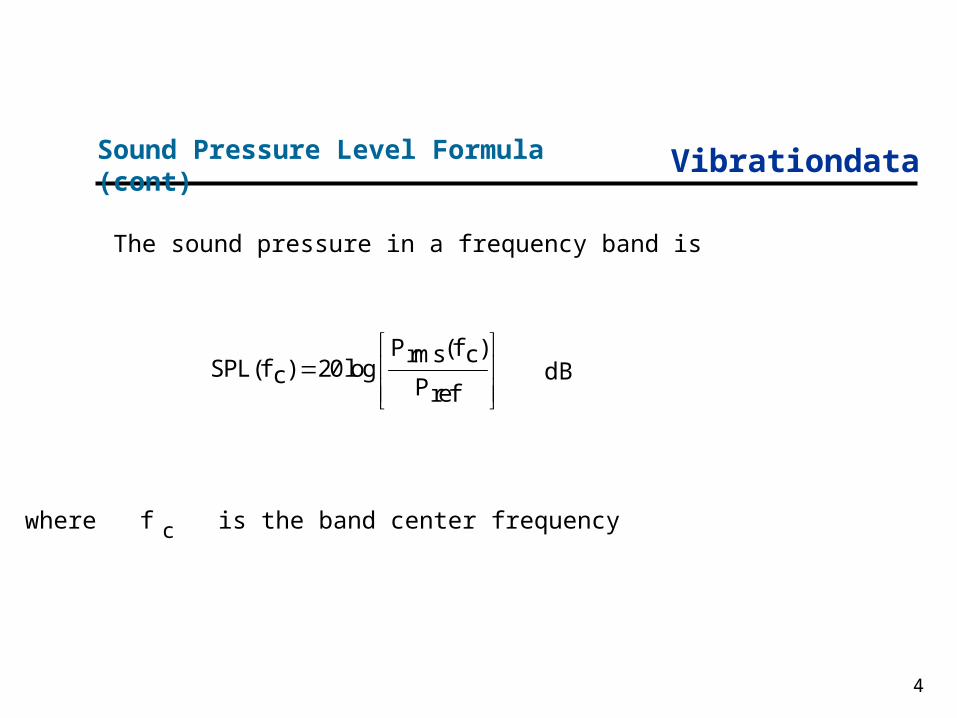
The sound pressure in a frequency band is
Sound Pressure Level Formula (cont)
P (f )rms cSPL(f ) 20logc Pref
where f c is the band center frequency
dB
Vibrationdata
5
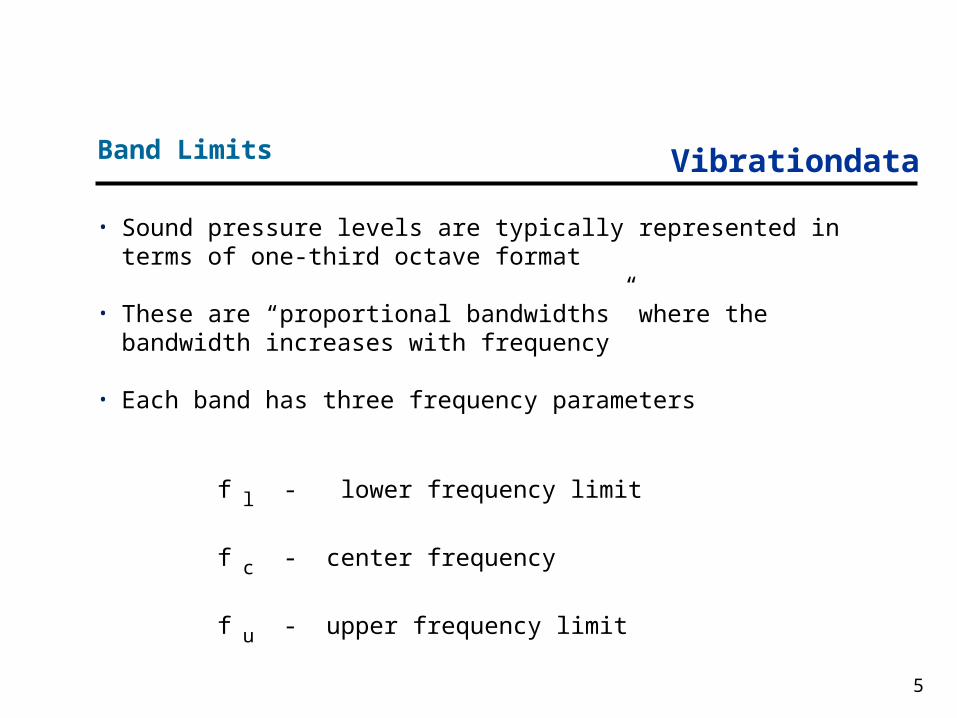
• Sound pressure levels are typically represented in terms of one-third octave format
• These are “proportional bandwidths” where the bandwidth increases with frequency
• Each band has three frequency parameters
f l - lower frequency limit
f c - center frequency
f u - upper frequency limit
Band Limits
Vibrationdata
6
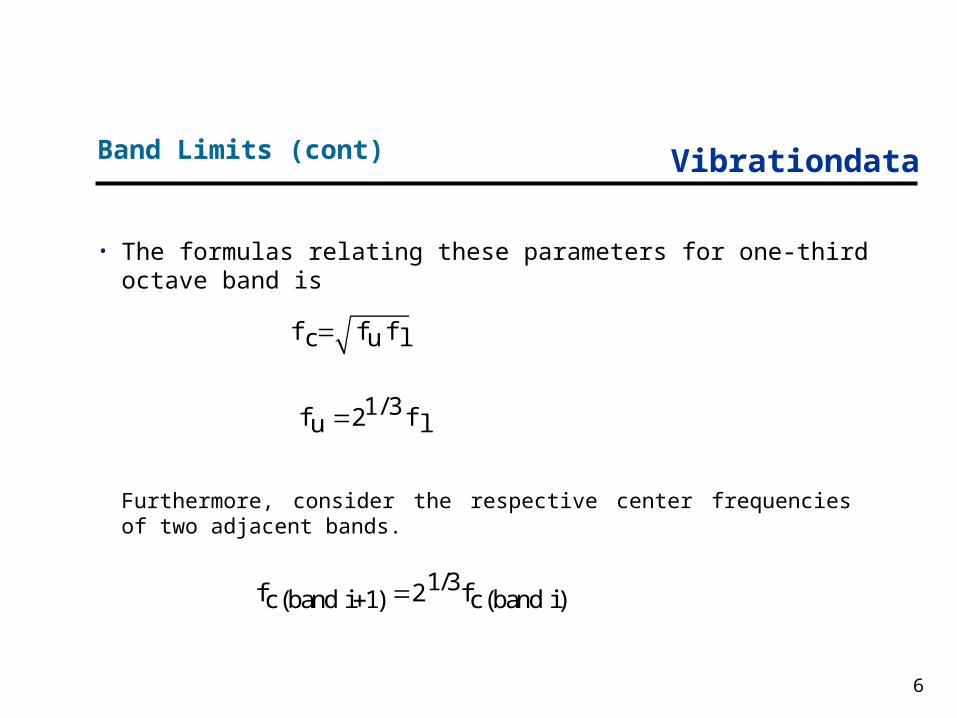
• The formulas relating these parameters for one-third octave band is
Band Limits (cont)
f f fc u l
1/ 3f 2 fu l
Furthermore, consider the respective center frequencies of two adjacent bands.
1/3f 2 fc (band i 1) c (band i)
Vibrationdata
7
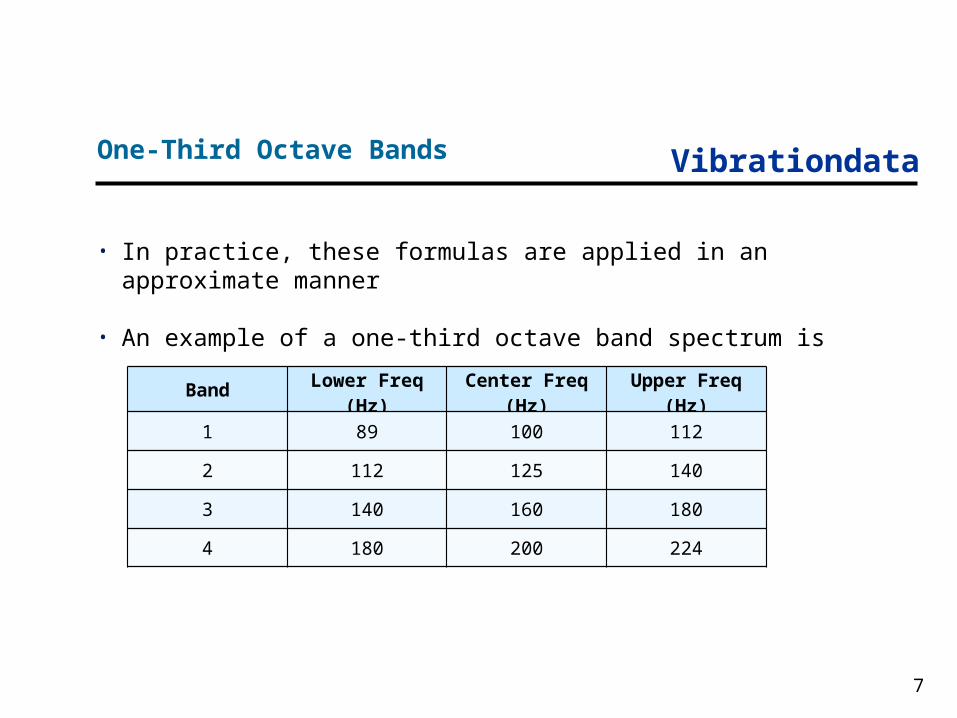
• In practice, these formulas are applied in an approximate manner
• An example of a one-third octave band spectrum is
One-Third Octave Bands
BandLower Freq
(Hz)Center Freq
(Hz)Upper Freq
(Hz)
1 89 100 112
2 112 125 140
3 140 160 180
4 180 200 224
Vibrationdata
8
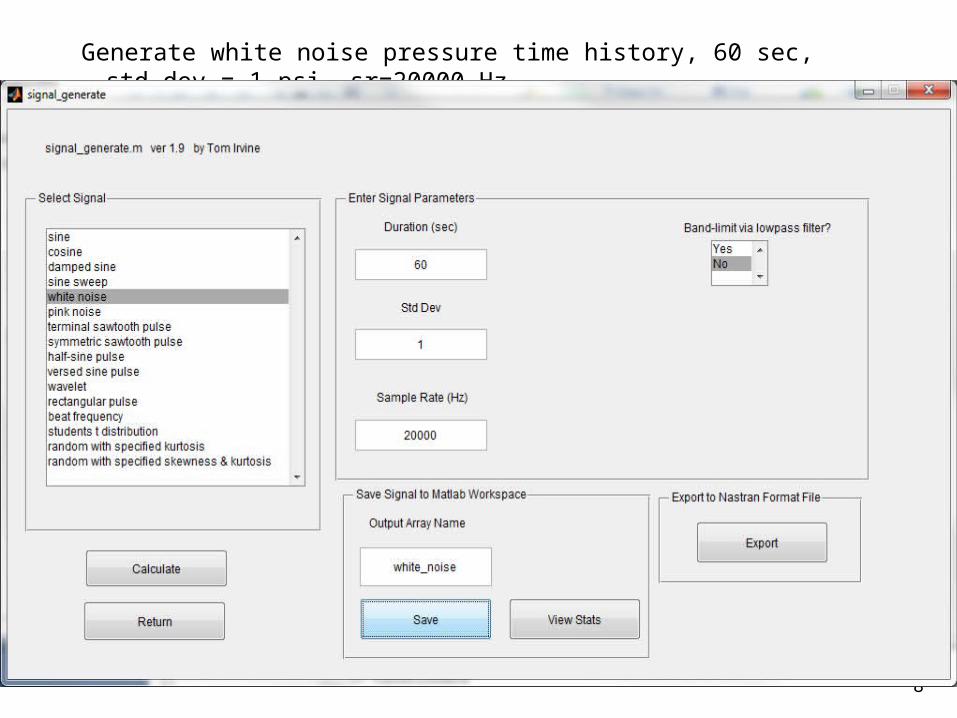
Generate white noise pressure time history, 60 sec, std dev = 1 psi, sr=20000 Hz
Objective
Vibrationdata
9
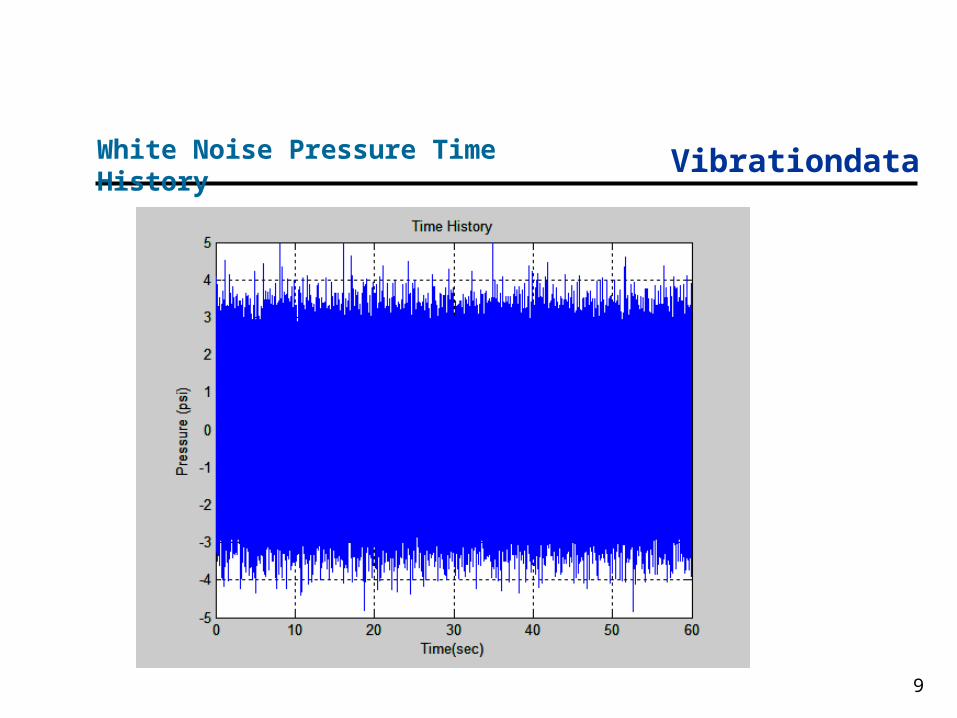
White Noise Pressure Time History
Vibrationdata
10
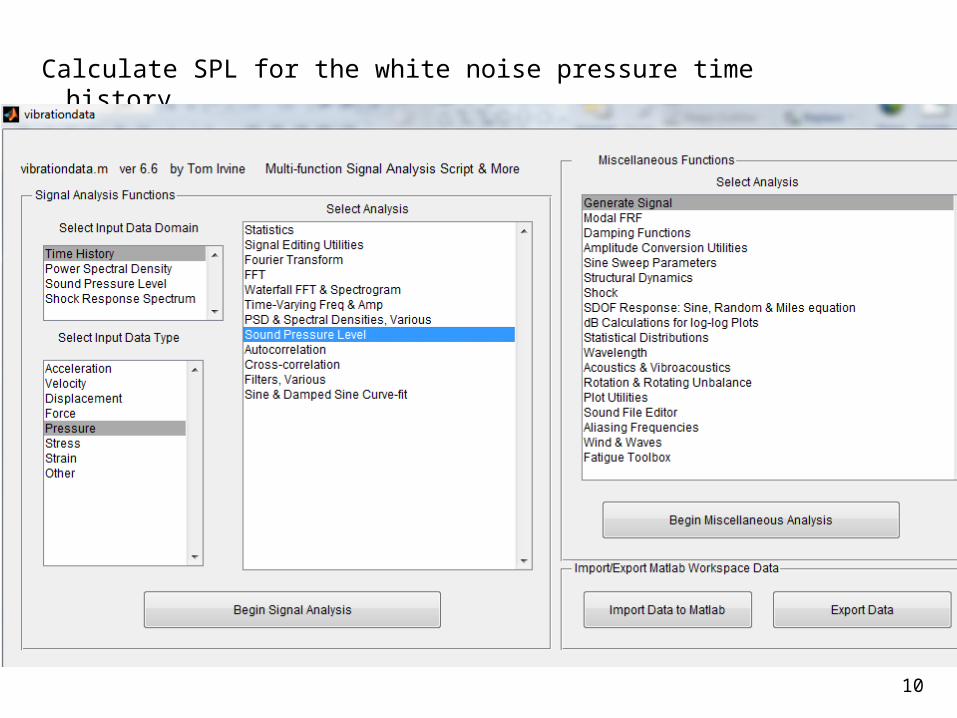
Objective
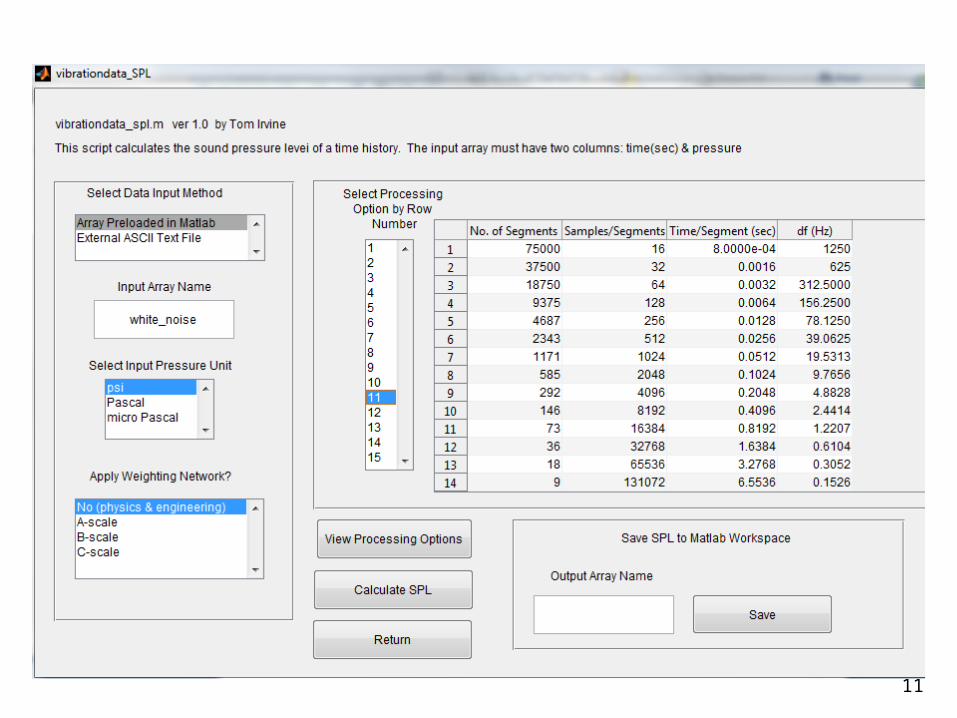
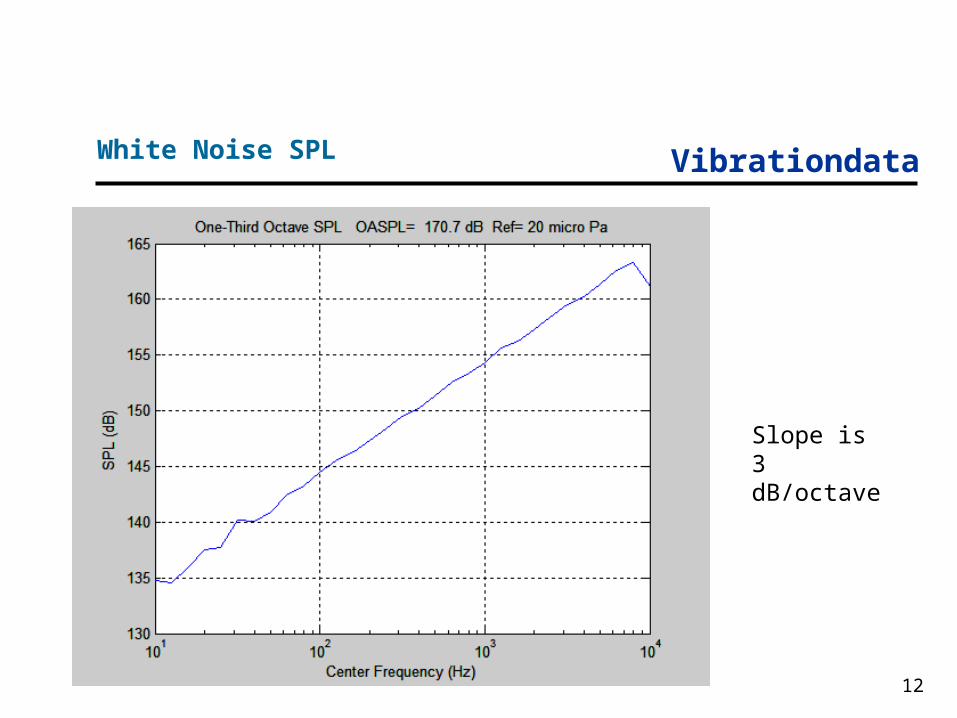
Calculate SPL for the white noise pressure time history
Vibrationdata
11
Vibrationdata
12
White Noise SPL
Slope is 3 dB/octave
Vibrationdata
13
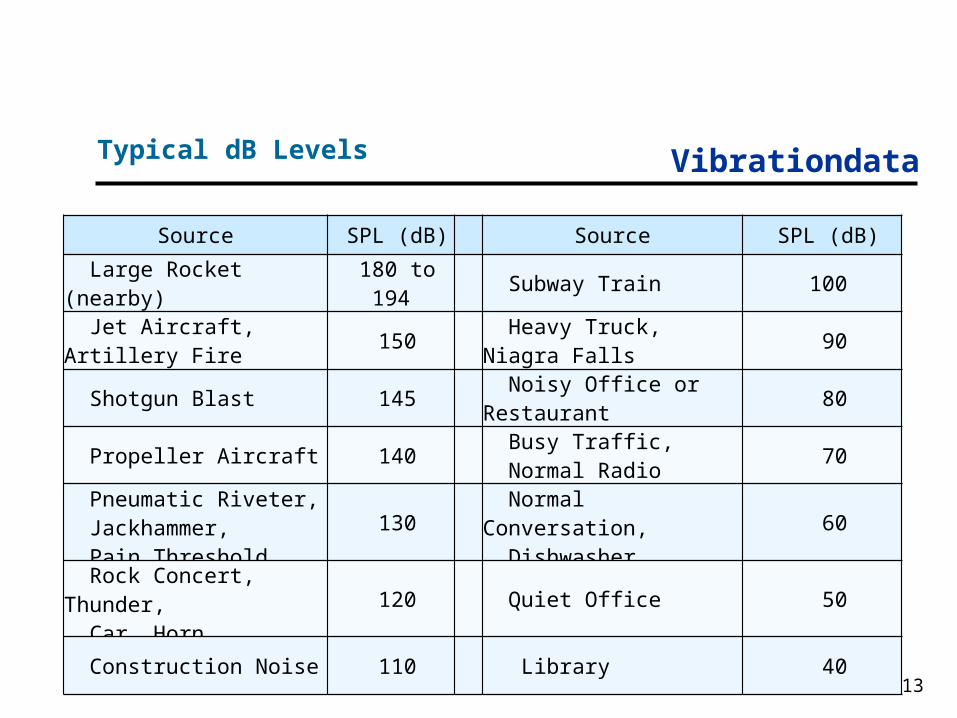
Typical dB Levels
Source SPL (dB) Source SPL (dB)
Large Rocket (nearby) 180 to 194 Subway Train 100
Jet Aircraft, Artillery Fire 150 Heavy Truck, Niagra Falls 90
Shotgun Blast 145 Noisy Office or Restaurant 80
Propeller Aircraft 140 Busy Traffic, Normal Radio 70
Pneumatic Riveter, Jackhammer, Pain Threshold
130 Normal Conversation, Dishwasher 60
Rock Concert, Thunder, Car Horn 120 Quiet Office 50
Construction Noise 110 Library 40
Vibrationdata
14
• Use frequency domain damage methods to assess acoustic fatigue damage
• Demonstrated for a rectangular plate subjected to a uniform acoustic pressure field
• Consider a baffled plate with dimensions 18 x 16 x 0.063 inches
• The material is aluminum 6061-T6
• The plate is simply-supported on all four edges
• Assume 3% damping for all modes ( Q=16.67 )
Analysis Example
Vibrationdata
15
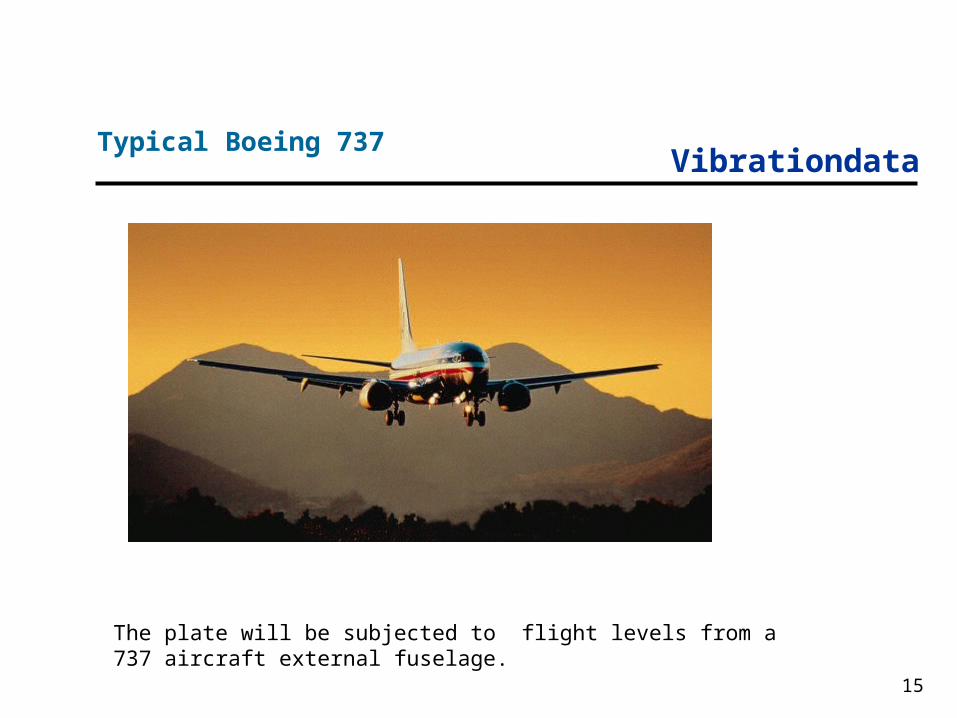
Typical Boeing 737
The plate will be subjected to flight levels from a 737 aircraft external fuselage.
Vibrationdata
16
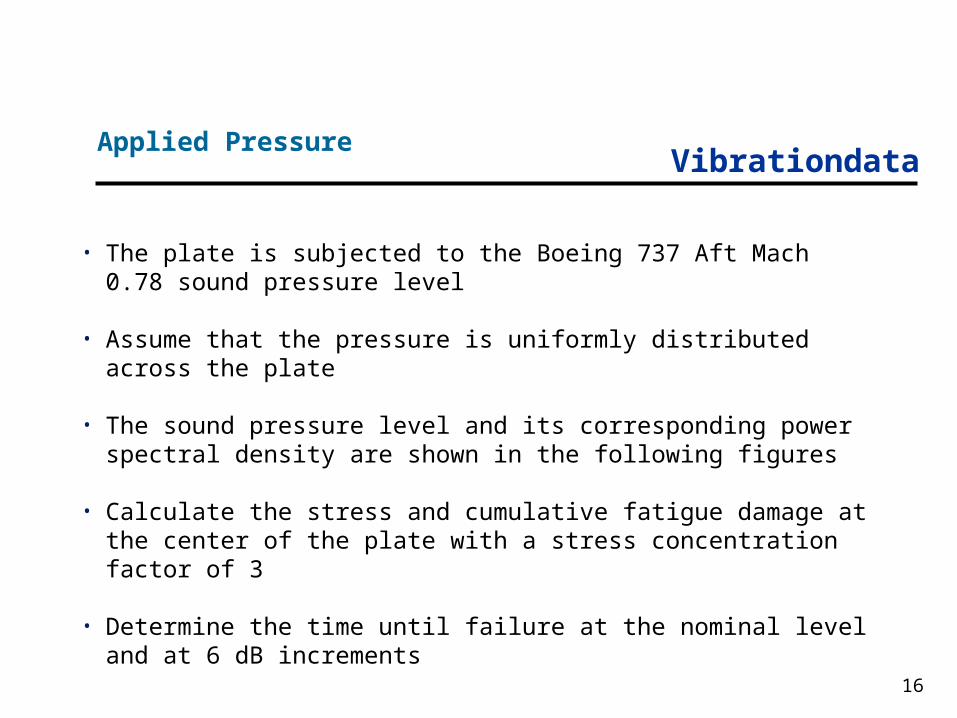
• The plate is subjected to the Boeing 737 Aft Mach 0.78 sound pressure level
• Assume that the pressure is uniformly distributed across the plate
• The sound pressure level and its corresponding power spectral density are shown in the following figures
• Calculate the stress and cumulative fatigue damage at the center of the plate with a stress concentration factor of 3
• Determine the time until failure at the nominal level and at 6 dB increments
Applied Pressure
Vibrationdata
17
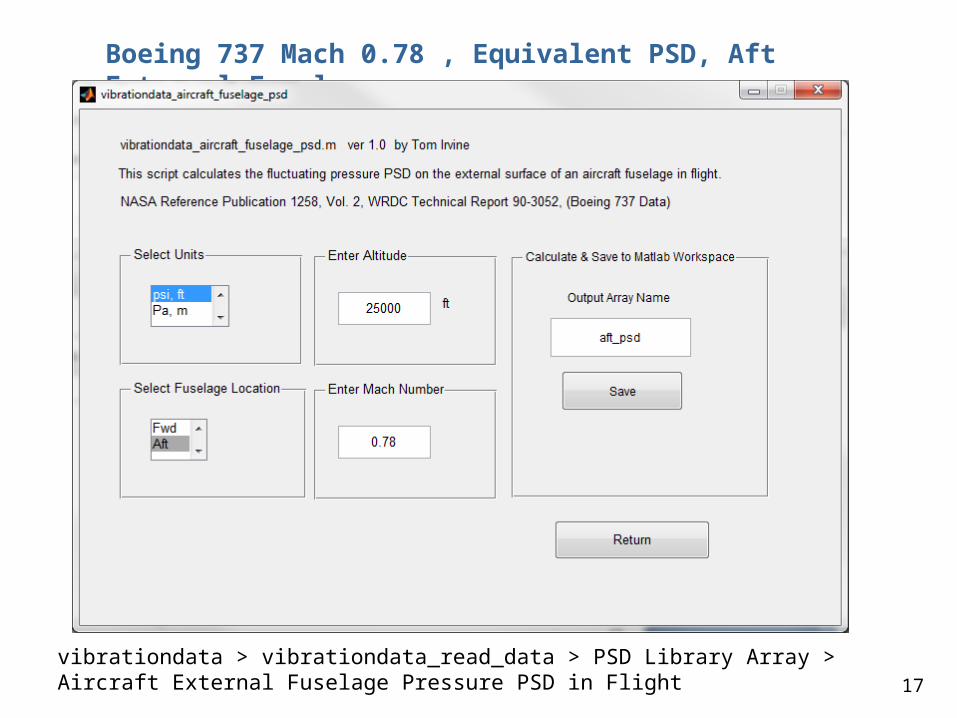
Boeing 737 Mach 0.78 , Equivalent PSD, Aft External Fuselage
vibrationdata > vibrationdata_read_data > PSD Library Array > Aircraft External Fuselage Pressure PSD in Flight
Vibrationdata
18
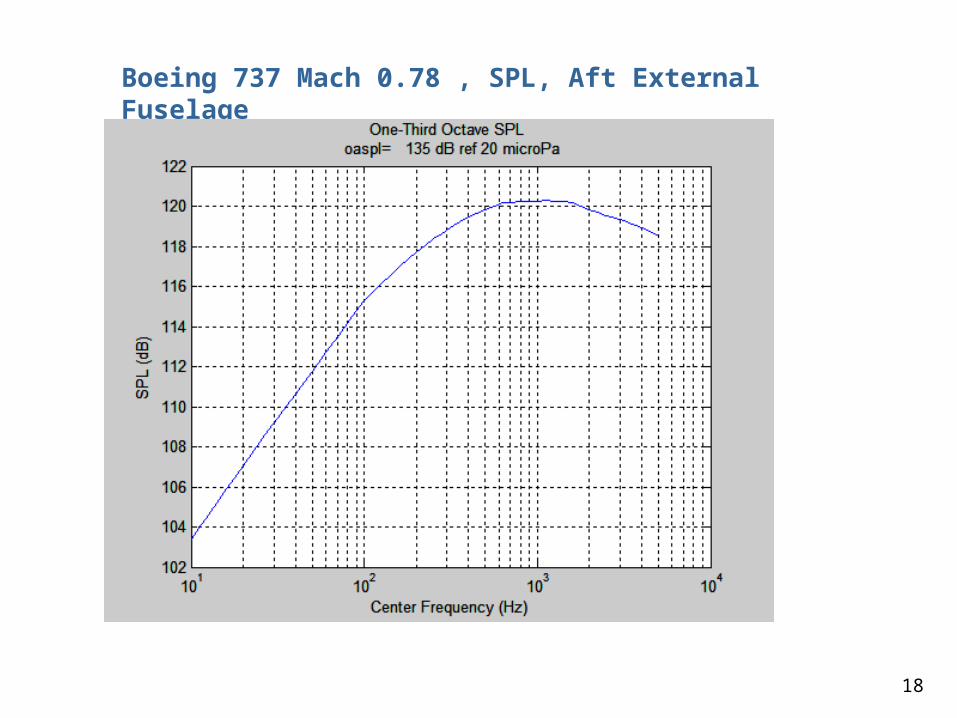
Boeing 737 Mach 0.78 , SPL, Aft External Fuselage
Vibrationdata
19
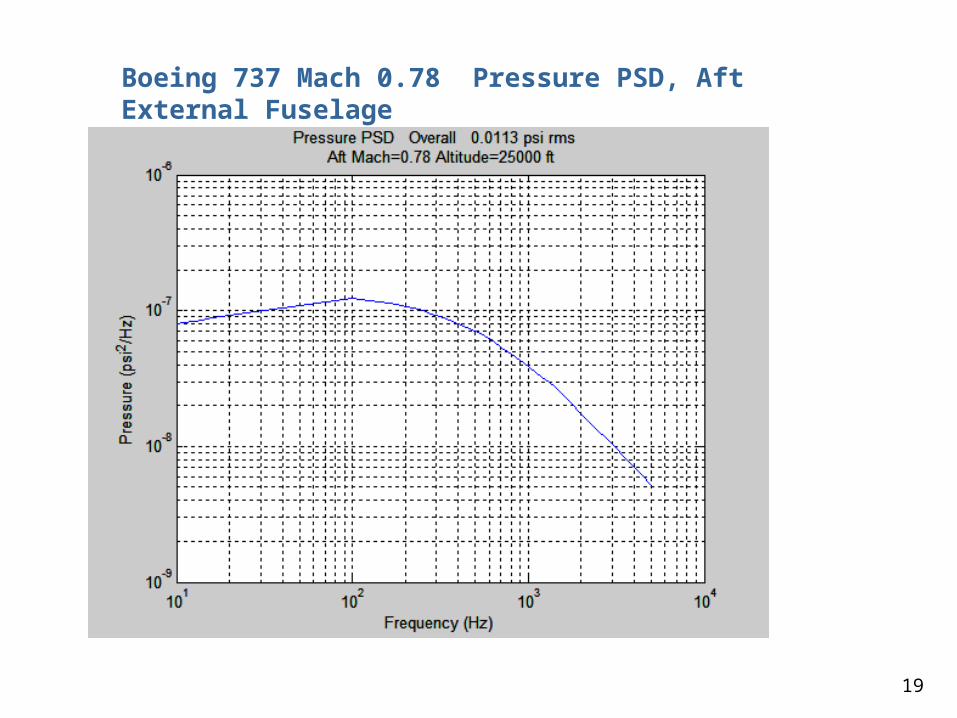
Boeing 737 Mach 0.78 Pressure PSD, Aft External Fuselage
Vibrationdata
20
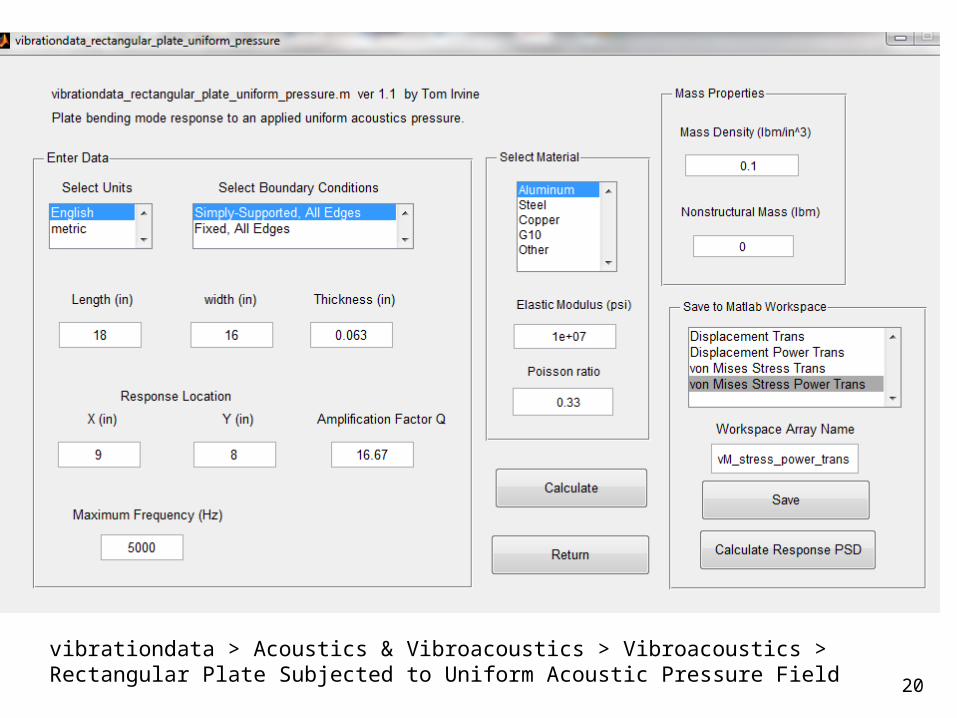
vibrationdata > Acoustics & Vibroacoustics > Vibroacoustics > Rectangular Plate Subjected to Uniform Acoustic Pressure Field
Vibrationdata
21
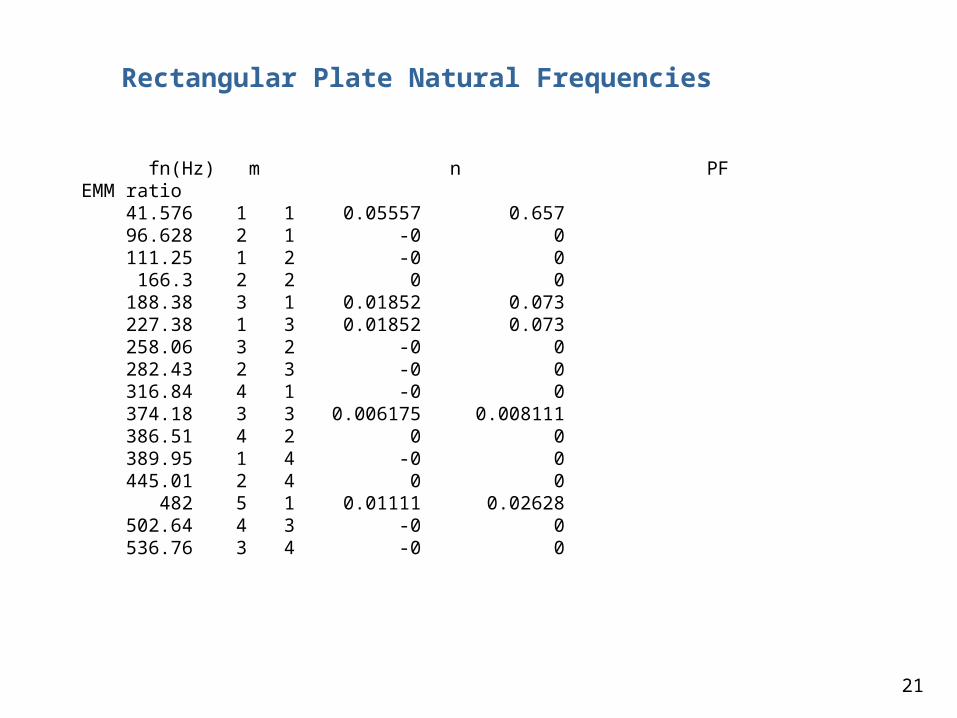
Rectangular Plate Natural Frequencies
fn(Hz) m n PF EMM ratio 41.576 1 1 0.05557 0.657 96.628 2 1 -0 0 111.25 1 2 -0 0 166.3 2 2 0 0 188.38 3 1 0.01852 0.073 227.38 1 3 0.01852 0.073 258.06 3 2 -0 0 282.43 2 3 -0 0 316.84 4 1 -0 0 374.18 3 3 0.006175 0.008111 386.51 4 2 0 0 389.95 1 4 -0 0 445.01 2 4 0 0 482 5 1 0.01111 0.02628 502.64 4 3 -0 0 536.76 3 4 -0 0
Vibrationdata
22
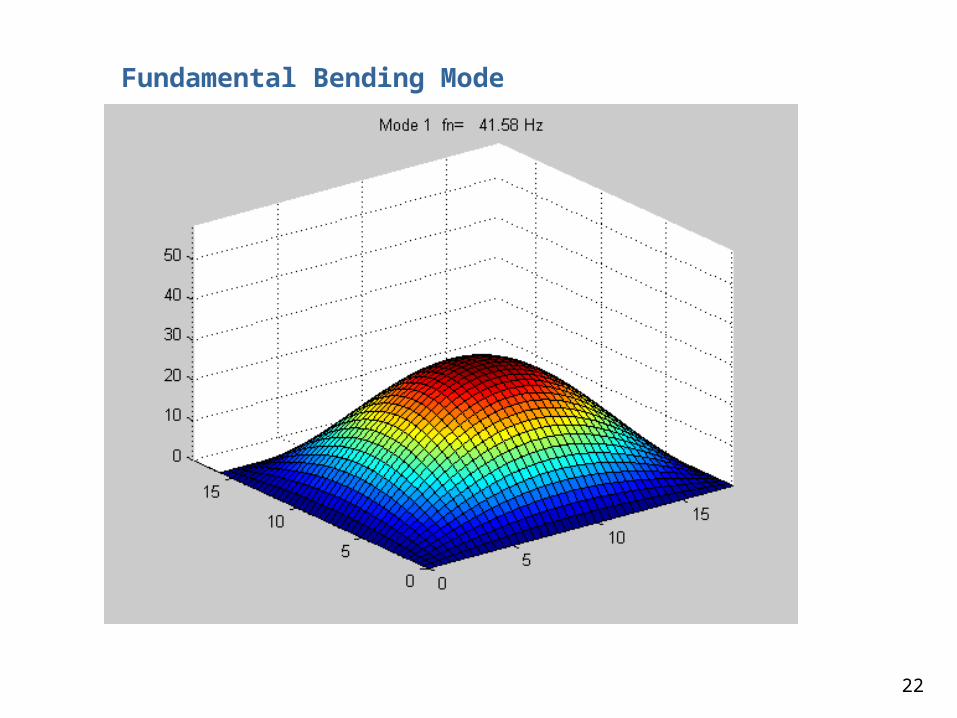
Fundamental Bending Mode
Vibrationdata
23
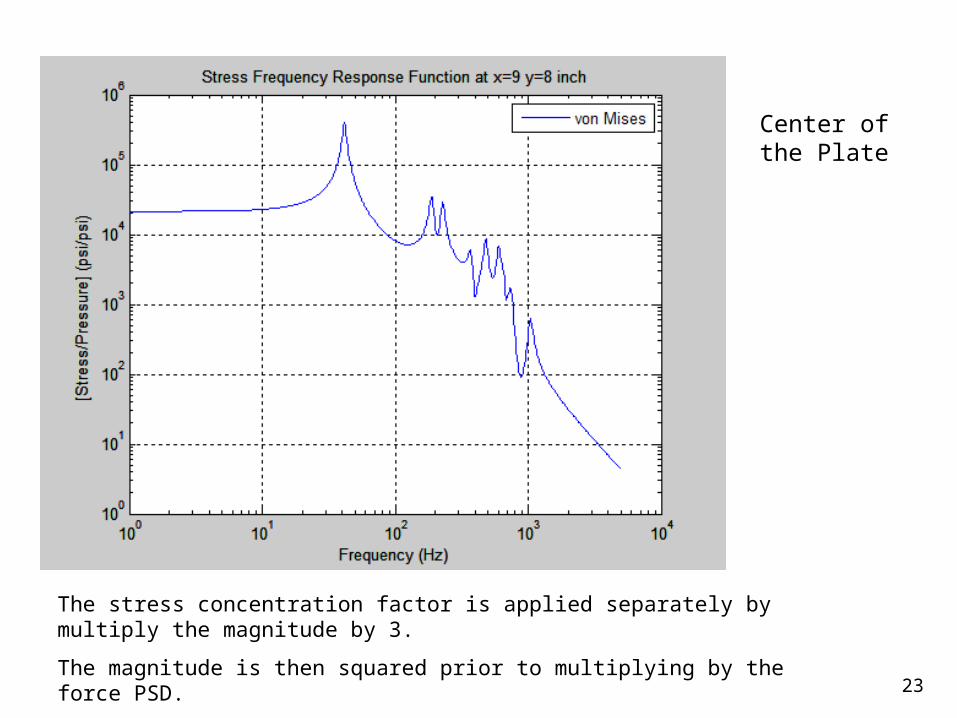
The stress concentration factor is applied separately by multiply the magnitude by 3.
The magnitude is then squared prior to multiplying by the force PSD.
Center of the Plate
Vibrationdata
24
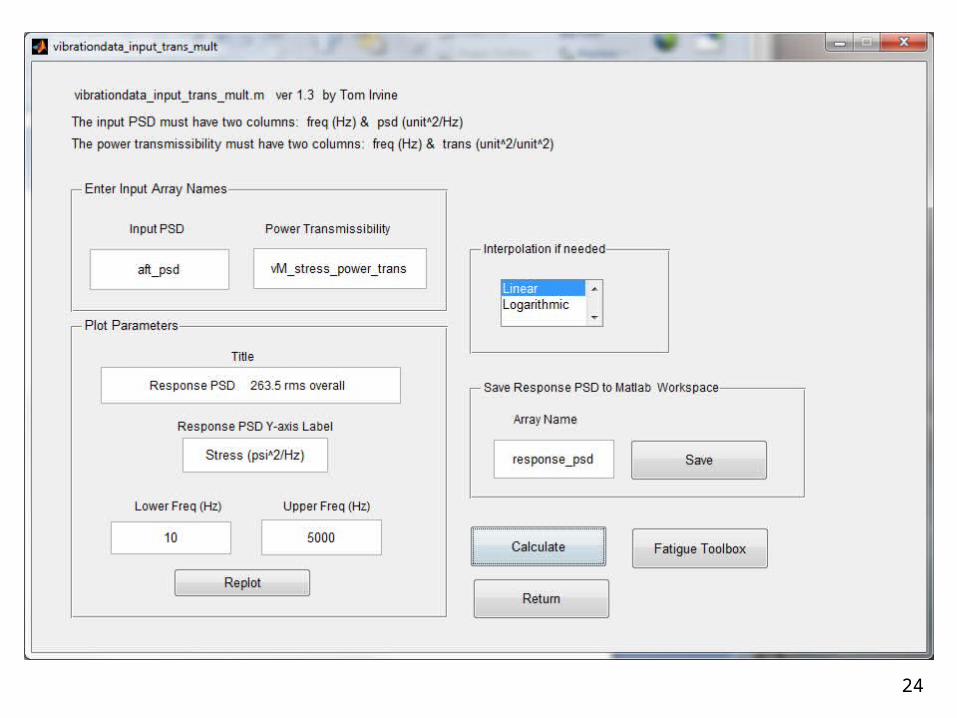
Vibrationdata
25
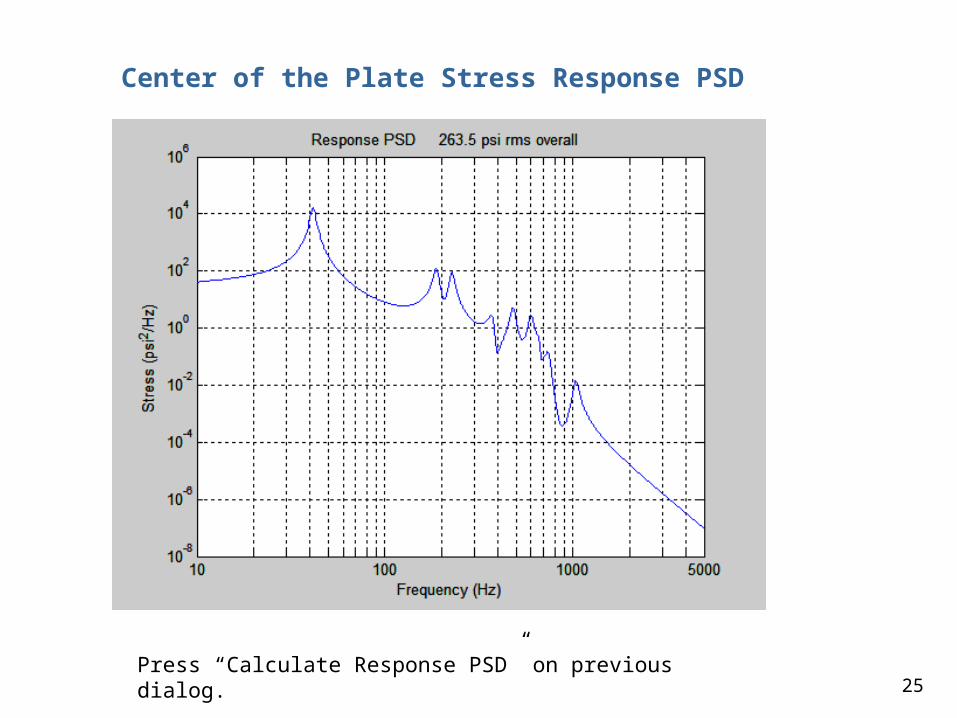
Center of the Plate Stress Response PSD
Press “Calculate Response PSD” on previous dialog.
Vibrationdata
26
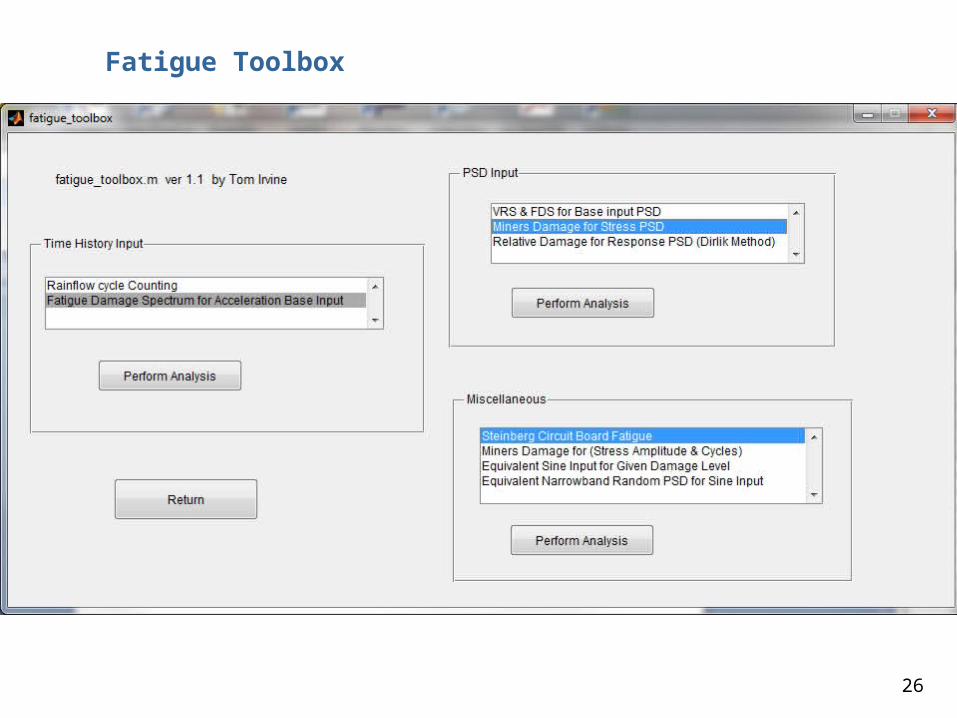
Fatigue Toolbox
Vibrationdata
27
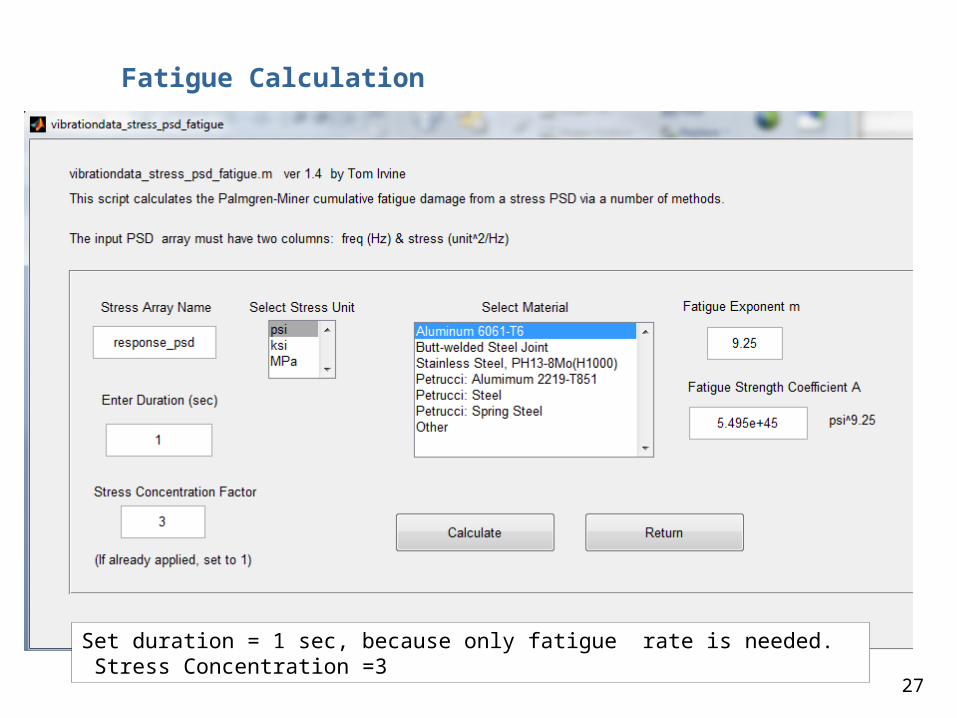
Fatigue Calculation
Set duration = 1 sec, because only fatigue rate is needed. Stress Concentration =3
Vibrationdata
28
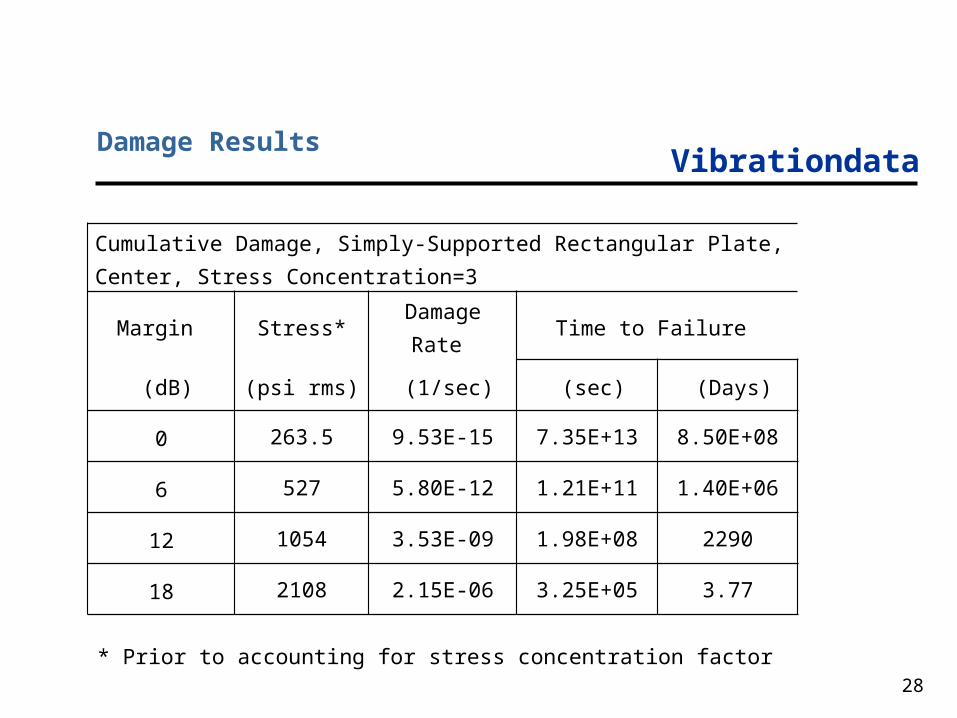
Cumulative Damage, Simply-Supported Rectangular Plate, Center, Stress Concentration=3
Margin Stress* Damage Rate Time to Failure
(dB) (psi rms) (1/sec) (sec) (Days)
0 263.5 9.53E-15 7.35E+13 8.50E+08
6 527 5.80E-12 1.21E+11 1.40E+06
12 1054 3.53E-09 1.98E+08 2290
18 2108 2.15E-06 3.25E+05 3.77
Damage Results
* Prior to accounting for stress concentration factor
Vibrationdata
29
• Aircraft fuselages undergo repetitive cycles of differential pressure with each flight
• The difference between the cabin and the external ambient pressure is about 6 or 7 psi at an altitude of 36,000 feet
• Note that cabin pressure at high altitudes is maintained at about 75% of sea level pressure, which corresponds to the air pressure at 8000 ft
• This is done by pumping air into the cabin
• Note that there is some variation in these numbers depending on the aircraft model
• Pressurization cycles along with vibration, corrosion, and thermal cycling can cause fatigue cracks to form and propagate
Pressurization Cycles
Vibrationdata
30
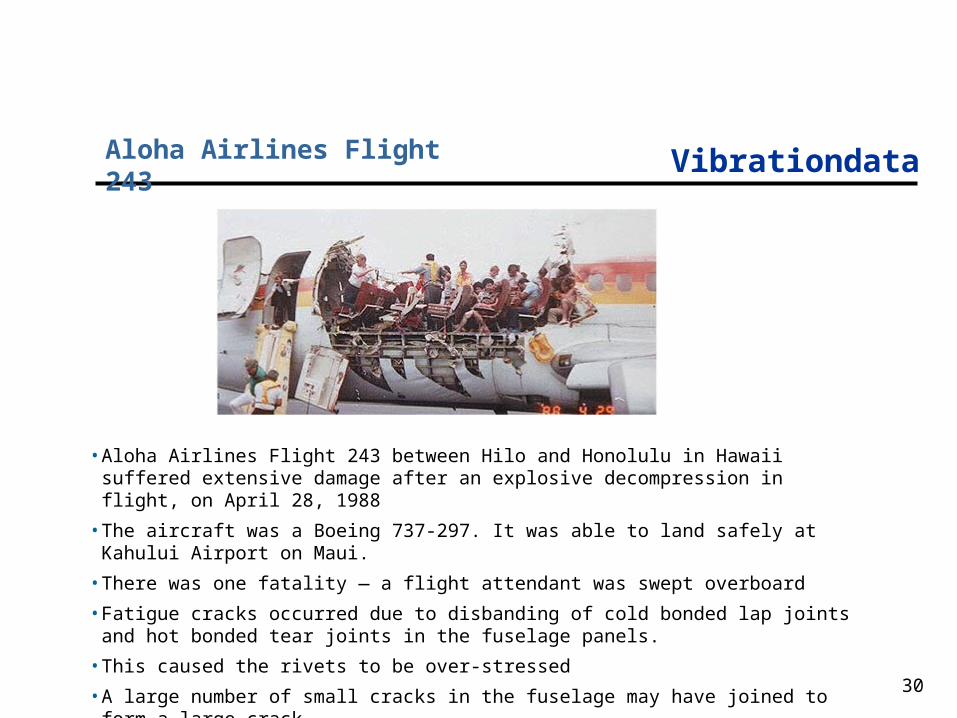
Aloha Airlines Flight 243
• Aloha Airlines Flight 243 between Hilo and Honolulu in Hawaii suffered extensive damage after an explosive decompression in flight, on April 28, 1988
• The aircraft was a Boeing 737-297. It was able to land safely at Kahului Airport on Maui.
• There was one fatality — a flight attendant was swept overboard
• Fatigue cracks occurred due to disbanding of cold bonded lap joints and hot bonded tear joints in the fuselage panels.
• This caused the rivets to be over-stressed
• A large number of small cracks in the fuselage may have joined to form a large crack
• Corrosion was also a related factor