NEPALESE TEACHERS’ ICT READINESS SURVEY UNESCO, Kathmandu March 2015.
22
NEPALESE TEACHERS’ ICT READINESS SURVEY UNESCO, Kathmandu March 2015
-
Upload
kristian-charles -
Category
Documents
-
view
223 -
download
2
Transcript of NEPALESE TEACHERS’ ICT READINESS SURVEY UNESCO, Kathmandu March 2015.

NEPALESE TEACHERS’ ICT READINESS SURVEY
UNESCO, Kathmandu
March 2015

Survey coverage
22 schools201 teachersRural (VDCs) and Urban (District Headquarter or Municipality)

Demographics of the sample teachers
Category % Category %Urban 54.2 Rural 45.8Public 73.6 Private 26.4Male 69 Female 31
Teachers of various age, teaching at different levels, teaching different subjects and having varied teaching experiences

Teachers’ knowledge and understanding of ICT policy
aware of national policy - 55.7% (112 teachers)
can describe the strengths and weaknesses of the national policy - 79%
Impact of the ICT policy in classroom practices
Responses f %It has not changed classroom practice at all 24 21.4It has rarely changed classroom practice at all 30 26.8It has changed some aspects of classroom practice 48 42.9It has changed all aspects of classroom practice 7 6.3

Teachers’ knowledge and understanding of ICT policy
aware of school policy – 44.8% Y + 38.3% N
can describe the strengths and weaknesses of the national policy - 91% (out of 90)
Impact of the ICT policy in classroom practices
Responses f %It has changed no aspects of classroom practice 7 7.8It has changed few aspects of classroom practice 26 28.9It has changed some aspects of classroom practice 33 36.7It has changed many aspects of classroom practice 22 24.4Not applicable 2 2.2

Participation in ICT policy development
national consultations focus group interview or discussion (13
teachers) survey (3 teachers) seminars/conferences (10 teachers) policy planning workshops (2 teachers) public consultation (4 teachers), and informal talk (1teacher)
10.9%

Participation in ICT policy development
school level focus group interview or discussion (55
teachers) seminars/conferences (27 teachers) policy planning workshop (2 teachers) general discussion (3 teachers) staff meeting (5 teachers), and meeting with SMC (1teacher)
39.8%

ICT infrastructure
Network
tech
nilogy fo
r prin
t/file
shar
ing am
ong teac
hers
acco
unts fro
m th
e sch
ool ser
ver
School p
rovid
e acc
ess t
o dist
ric se
rver
s
School p
rovid
e acc
ess t
o e-lib
rary
0
5
10
15
20
25
30
3530.3
14.918.9
9
Figure 2: Networking, server, and e-library support in the school
Per
cent
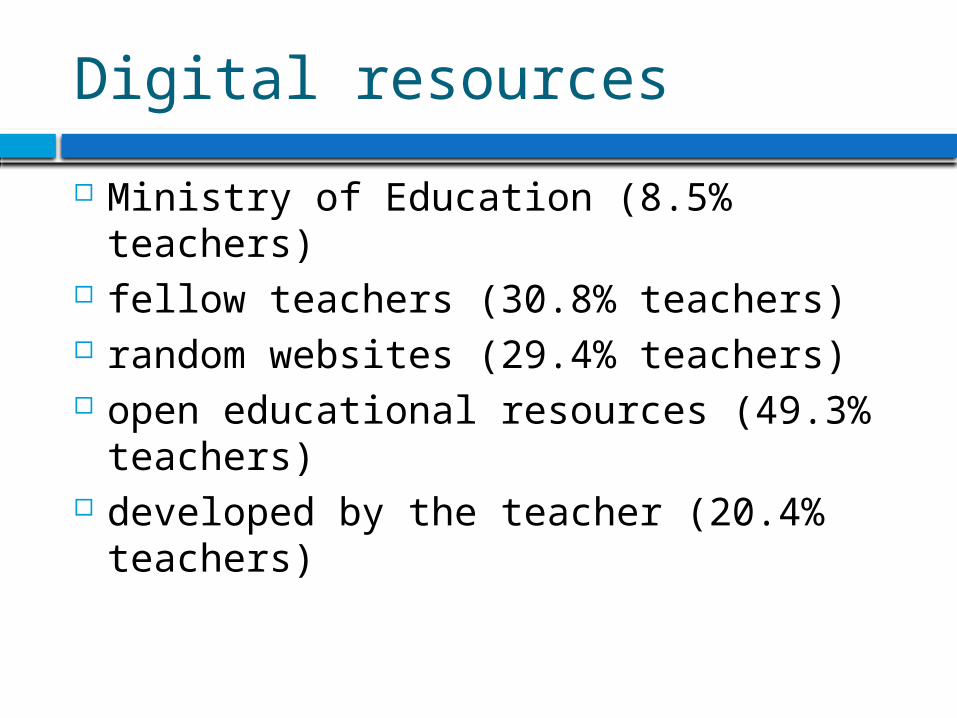
Digital resources
Ministry of Education (8.5% teachers) fellow teachers (30.8% teachers) random websites (29.4% teachers) open educational resources (49.3%
teachers) developed by the teacher (20.4%
teachers)

Technical support
in-house technical support team (26.9%) technical service from the manufacturer
(0.5%) district level technical support (5%)

Use of computer for classroom teaching
Daily 3% at least once a week 14.4% at least once a month 11.9% rarely 27.9% never 42.8%

Technology used in the classroom
TV 4.5% radio 22.9% digital camera 13.4% projector 8.5% interactive whiteboard 30.3% tablet 5.5% mobile phone 85.6% audio cassettes 3% laptop 0.5%

ICT skills of teachers
Responses Percent
Create a lesson plan using a word processor (e.g. MS Word) 43.3
Create a presentation slide for classroom teaching 28.9
Create pedagogical tools using spreadsheets 24.4
Create a web page 6.5
Create audio-visual material for teaching and learning (e.g. e-book, digital stories, movie, animation, etc.) 41.8
Create a mobile app 13.4

Teachers’ capability to use ICT
Responses PercentCreate an email account 49.8
Send email 49.8
Use videoconference application (e.g. Skype, WebEx, etc. 31.8
Create an online sharable folder (e.g. dropbox) 27.4
Choose an appropriate social network for teaching purposes 36.8
Create and maintaining a blog 9
Create a Wiki 7
Post a picture or comment on social networks (FB, Twitter, Youtube, etc.) 64.7
Use social networks for teaching (collaboration, sharing, etc.) 51.7
Communicate with students and parents online 29.4
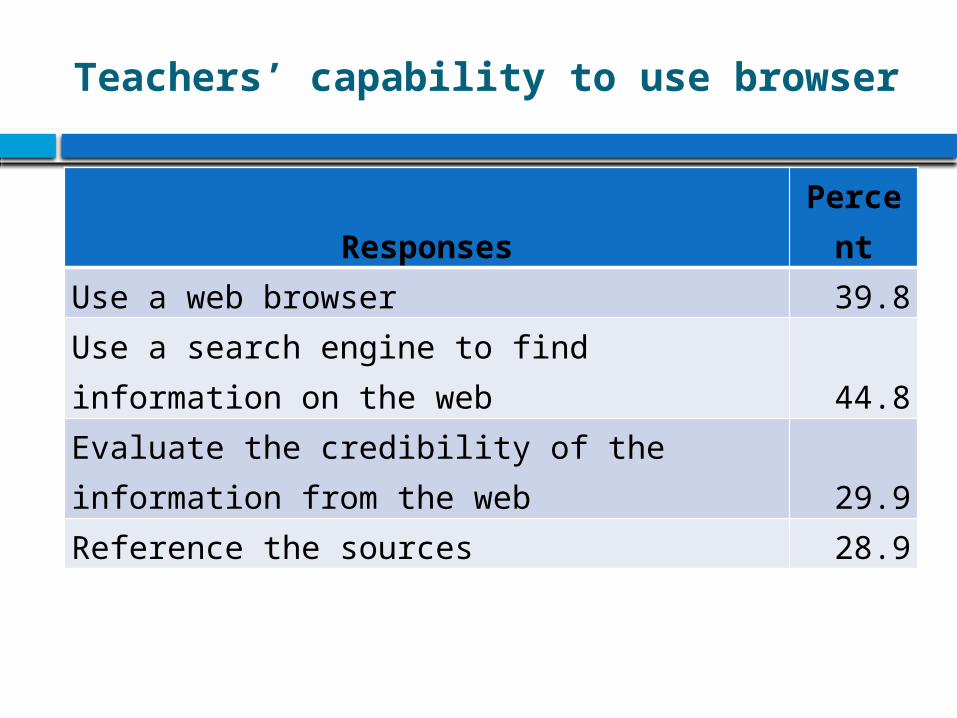
Teachers’ capability to use browser
Responses PercentUse a web browser 39.8Use a search engine to find information on the web 44.8Evaluate the credibility of the information from the web 29.9Reference the sources 28.9

Installation, spreadsheet and networked record keeping
Responses Percent
Install new software on a computer 31.3Create a spreadsheet to manage grades and data 32.3Use a networked record keeping platform to take attendance, submit grades, and maintain other student data 44.3

ICT-enhanced innovative pedagogy - Pedagogical practices of teachers
Ever
yday
Once
a wee
k
Once
a m
onth
Once
a se
mes
ter/t
erm
Never
.0
10.0
20.0
30.0
40.0
50.0
60.0
70.0
80.0
90.0
79.6
8.5 6.5
.55.0
2.5
18.9 18.9
11.9
47.8
19.9
23.4
16.4
5.0
35.3
8.0
19.420.4
15.9
36.3
16.9
23.9
18.4
6.5
34.3
Lecture with textbook Lecture with other materails Colloborative learning
Project-based learning Real-world problem solving
Perc
en
t

Professional development of teachers - ICT-related training to the teachers
Responses PercentUsing school administrative system (EMIS) 7.5Computer literacy (basic productivity tools) 47.3Using subject-specific software 6.5Teaching ICT as a subject 9.5Creating multimedia resources 6.5Using and integrating government-provided digital resources into classroom teaching 5.5Finding, adapting and evaluating resources from the Internet 17.4Planning lesson and/or projects that integrate ICT 7.0ICT-enhanced innovative pedagogy (e.g. project based learning, computer-supported collaborative learning, etc.) 8.5Using social network for teaching and learning 14.9Using ICT for assessment 10.0

ICT training in the last 12 months less than 4 hours 22.9% 5-15 hours 6.5% 16-40 hours 3% more than 40 hours 2.5%

Submitting the record or credit of training
in the school 43.3% district office 10.9% Ministry of Education 1.5% Nowhere 51.7%

Perception on training certification ICT training credits compulsory for
career advancement 11.9%
ICT training credits considered in career advancement 16.4%
ICT training credits do not affect career advancement 6%
do not know its importance 15.9%

Research and Development – Teachers’ access to the national EMIS
Response Yes NoAccess to school-level data entry to the national EMIS
15.9 84.1
Access to data retrieval from the national EMIS
27.9 72.1
Thank you


![PBL & Telecollaboration and 21 st Century Learning Design, UNESCO Kathmandu 11 Sushil Upreti 11 March, 2014 Project Based Learning [PBL]](https://static.fdocuments.in/doc/165x107/56649f095503460f94c1df39/pbl-telecollaboration-and-21-st-century-learning-design-unesco-kathmandu.jpg)