Nepal Regional Strategy for Development - Asian ... · National Planning Commission and Minister of...
89
NEPAL REGIONAL STRATEGY FOR DEVELOPMENT Harka Gurung Working Paper Series No. 3 Nepal Resident Mission June 2005
Transcript of Nepal Regional Strategy for Development - Asian ... · National Planning Commission and Minister of...

NEPALREGIONAL STRATEGY FORDEVELOPMENT
Harka Gurung
Working PaperSeries No. 3Nepal Resident MissionJune 2005

Dr. Harka Gurung is a noted development expert in Nepal. He has been Vice-Chairman of theNational Planning Commission and Minister of State for Education, Industry and Commerce,Tourism and Public Works and Transport. Dr. Gurung has published more than 30 books andmonographs and more than 500 articles/papers on culture, demography, development, envi-ronment, geography, political economy, and tourism.
June 2005
NRM Working Paper No. 3
NEPALREGIONAL STRATEGY FOR DEVELOPMENT
Harka Gurung

Opinions and materials in this publication do not necessarily reflect the official views of ADB.
In this publication, $ refers to US dollars, and NRs refers to Nepalese rupees.
Map boundaries are not necessarily authoritative.
Papers published under this series could be published as articles in professional journals orchapters in books.
© Asian Development Bank, June 2005
ii

PREFACE
This report is the outcome of the study on regional development undertaken as part of thesectoral/thematic assessments Asian Development Bank’s Nepal Resident Mission (NRM)conducted to prepare a country strategy and program (CSP) for Nepal. ADB prepares the CSPevery 5 years to guide its operations in each of its developing member countries. ADB’s NRMprepared a CSP for Nepal covering 2005–2009, which was approved by ADB’s Board of Directorsin October 2004.
The study was undertaken to examine the major issues of and constraints to balancedregional development, prepare a strategy for achieving balanced regional development, and makenecessary policy recommendations for effective implementation of regional development. Thepaper has reviewed past experiences of regional approach in Nepal’s planning, examined themagnitude of regional disparity, focused on decentralization, examined the asymmetric economicrelation of Nepal with its immediate neighboring countries and recommended ways for effectiveoperationalization of a regional strategy.
The study on Nepal Regional Strategy for Development was undertaken by Dr. Harka Gurung,a highly reputed development expert in Nepal. I thank Sungsup Ra, Senior Country ProgramsSpecialist and Head, Macroeconomics, Finance, Governance, Regional and External Relations,NRM for steering this exercise. I appreciate Arun S. Rana, Consultant for editing the report andKavita Sherchan, External Relations and Civil Society Liaison Officer, NRM for finalizing the report.
Sultan Hafeez RahmanCountry DirectorNepal Resident Mission
iii

ABBREVIATIONS
ADB Asian Development BankCBS Central Bureau of StatisticsCSP Country Strategy and ProgramDDC District Development CommitteeFY fiscal yearGDP gross domestic productHDI human development indexIRDP Integrated Rural Development ProjectLRMP Land Resources Mapping ProjectNPC National Planning CommissionNRM Nepal Resident MissionPPI population pressure indexPPP purchasing power paritySADP Small Area Development ProgrammeTAR Tibet Autonomous Region of ChinaVDC Village Development Committee
iv

CONTENTS
Page
PREFACE iv
ABBREVIATIONS v
EXECUTIVE SUMMARY ix
I. INTRODUCTION 1A. Terms of Reference 1B. Study Approach 1
II. STATUS REVIEW 3A. Strategy Initiation 3B. Distorted Interpretation 5
III. EXTENT OF DISPARITY 8A. Temporal Change 8B. Spatial Disparity 13
IV. EMERGING PATTERN 23A. Demographic Shift 23B. Development Level 26
V. SPATIAL FRAMEWORK 32A. Land Use 32B. Transport Access 34C. Industrial Location 35D. Urban System 38
VI. DECENTRALIZATION EXERCISE 39A. Critical Assessment 39B. District Consolidation 41C. Resource Mobilization 42D. Social Inclusion 44
VII. BEYOND THE BORDER 46A. India: North and East 46B. China: Tibet 49
VIII. CONCLUSION AND RECOMMENDATIONS 50A. Conclusion 50B. Recommendations 51
REFERENCES 54
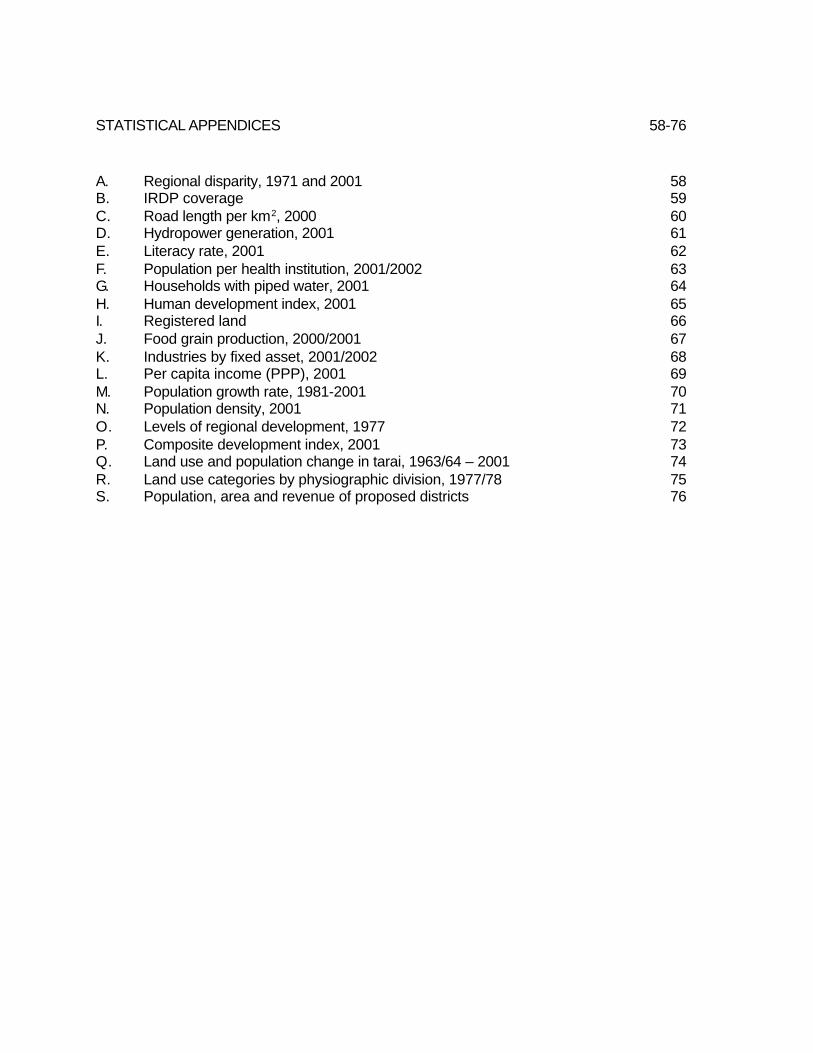
STATISTICAL APPENDICES 58-76
A. Regional disparity, 1971 and 2001 58B. IRDP coverage 59C. Road length per km2, 2000 60D. Hydropower generation, 2001 61E. Literacy rate, 2001 62F. Population per health institution, 2001/2002 63G. Households with piped water, 2001 64H. Human development index, 2001 65I. Registered land 66J. Food grain production, 2000/2001 67K. Industries by fixed asset, 2001/2002 68L. Per capita income (PPP), 2001 69M. Population growth rate, 1981-2001 70N. Population density, 2001 71O. Levels of regional development, 1977 72P. Composite development index, 2001 73Q. Land use and population change in tarai, 1963/64 – 2001 74R. Land use categories by physiographic division, 1977/78 75S. Population, area and revenue of proposed districts 76

LIST OF TABLES Page
1. Regional development areas 42. Regional variation, 1971–200 103. Development expenditure, 1978/79 and 2000/2001 114. GDP by sub region, 1984/85 and 2000 125. Select infrastructure indicators 146. Select social indicators 167. Select economic indicators 188. Inter-regional migration, 2001 249. Select demographic indicators 2510. Land use change in tarai, 1963/64–2001 2611. Levels of development, 1977, 1984/85 and 2001 2712. Land use categories 3313. Occupation in municipalities 3814. Offices and personnel, Surkhet, 1986 4115. Expedition revenue and RADP budget 4416. Indicators of social disparity 4517. Distribution of Janajati and Dalit population 4518. Customs revenue, 2000/2001 4719. Indo-Nepal Trade 4820. Nepal-Tibet Autonomous Region of China Trade 50
LIST OF MAP
Page1. Regional division 32. Growth axes 53. IRDP coverage 94. GDP by sub region, 1999/2000 125. Transport network 156. Literacy rate 197. Population per health institution 198. Piped water supply 209. Human development index 2010. Registered land 2111. Land holding 2112. Manufacturing industries 2213. Per capita income 2214. Inter-regional migration 2915. Population growth rate 2916. Population density 3017. Population pressure index 3018. Development level, 1977 3119. Composite indicators, 2001 3120 Land use categories, 1977/78 3321. Spatial framework, proposal 37

EXECUTIVE SUMMARY
The first attempt to incorporate spatial dimension in Nepal’s planning envisaged a series ofnorth-south growth axes (development corridors) linking diverse natural regions. Four growth axeswere outlined that offered the greatest prospect for integration and coordination of development asthey represented both the east-west and north-south territorial dimensions of the country. Themain reasoning behind the development of growth axes was to tie-in the economy of the tarai withthose of the hill. The best way to integrate the national economy is to establish the nature andscope of complimentarity of northern and southern parts of the growth axis in terms of circulationin trade, labor and capital.
The above regional strategy was partly adopted in the Fourth Plan, covering fiscal year(FY)1970–FY75 and much discussed as a new dimension in Nepal’s development. Such a regionalapproach was formalized with the creation of four development regions in 1972. Three elementscontributed to the distortion of this regional strategy. First, the practice of giving sanctity to theformal development regions for programming led to emphasis on balance among four regionsrather than reducing imbalance among their elevation zones (mountain, hill, and tarai). Regionalstrategy was interpreted as a wholesale dispersal instead of judicious aggregation of projects.The second element that contributed to the derailment of regional strategy was the overemphasisgiven to the Small Area Development Programme; initially proposed as a rural development adjunctto the overall design of growth axes, it was elevated to the main component of regional approach.The third element that led to the distortion in regional strategy was the expansion of various integratedrural development projects whose basic rural conceptualization, diversity in approach, and lack oftransport component made them less effective in total impact. Thereafter, regional strategy wassuperseded by succession of new concerns such as basic needs approach, environment protection,and poverty reduction.
There is increasing disparity among development regions and their sub regional components.This is due both to the region’s intrinsic locational factor and a development approach that favorsaccessible ones. Of the country’s total road length of 13,223 kilometers, the Central DevelopmentRegion leads with a share of 39.1%. Mountain sub regions of the Mid Western and the WesternDevelopment Region, covering 27,170 km2, do not have any roads. The Central Region leads withmore than half of the total hydropower generation. There is no such infrastructure in the tarai subregions of the Far Western and the Mid Western Regions.
Nepal’s adult literacy rate for 2001 was 53.7%. Among the five development regions, theWestern (56.6%) and the Eastern (53.9%) exceed the national average. The mid western mountain,with a literacy rate of 31.8%, is ranked at the bottom. The national average ratio between healthinstitution and population is 1:5,588. This varies from 1:5,332 for the Far Western Region to 1:6,294for the Central Region. The number of households with access to piped water supply is reportedas 57.5% at the national level. The Western Region leads with 71.7% of households with suchfacility, while that of the Far Western Region is only 49.1%. Total operating land holding reportedcomes to 43.7% of the registered land, indicating a large extent of such land being left fallow. TheFar Western Region has only 8.5%, compared to the Eastern Region with 30%. Disparity is mostpronounced in the regional pattern of industrial investment. Thus, the Central Region claims 74.8%of the total industrial asset, of which Kathmandu Valley alone accounts for 61.2%. The far westernhill, mid western mountain, and western mountain sub regions have no such industrial assets.
ix

The per capita income for the country in terms of purchasing power parity (PPP) is estimatedat $1,310. It is only the Central Region with $1,597 that exceeds the national average. The MidWestern Region has the lowest per capita income, $988. In 1977, those with high levels ofdevelopment included three tarai and two hill sub regions. By 2001, three hill and two tarai subregions had such levels of development. There were no tarai sub regions in the low value categoryin 1977. In 2001, two tarai sub regions fell in such a category. That the central hill replaced theeastern tarai in the top rank, and the western hill the central tarai in the second rank indicates aspatial shift in development level by elevation zone. There was no change in the ranking of centralmountain (10th), mid western mountain (14th), and far western mountain (15th). According to thedevelopment regions, the Central Development Region led both in 1977 and 2001, the WesternRegion replaced the Eastern Region in the second place, and the Mid Western Region replacedthe Far Western Region in the fourth place.
Development planning has to encompass the totality of national space. Since regions differboth in natural and human resources, the approach should address their inter relationship into acoherent spatial framework for growth and equity. Economic activity is determined by the type ofland resources available, but Nepalese plans have entirely overlooked the aspect of land use.Therefore, land use planning should constitute an essential part of national planning to optimizeexploitation of regional resources. Another important aspect of spatial framework that determinesthe future pattern of development relates to road infrastructure. In spatial planning terms, the East-West Highway should be developed as the spine of national development with the connectingnorth-south roads as a series of ribs for lateral diffusion. Some of these should be extendedfurther north giving priority to those that can provide access to future sites of hydropower generation.It is necessary to provide road access from the Tibet Autonomous Region of China (TAR) to someremote areas to exploit recent developments across the border.
The reality of the East-West Highway as the pivotal axis will also entail reconsideration onother policy areas such as industrialization and urbanization. Selected locations at the junction ofthe East-West Highway and north-south roads would be the most appropriate sites for majorindustrial clustering. Also, industrial estates should be established in some backward areas toprocess local products for export to the south or north according to the transport connection. Suchindustrial estates have to be promoted with a higher level of incentives due to their disadvantageouslocation. Urbanization characterizes a dynamic location which means more than mere populationsize—first, the definition must be rationalized to encompass other significant criteria, such asnon-primary occupation, density of population, and contiguity of built-up area; second, there shouldbe a design of rank order for urban areas to articulate functional linkages in terms of their populationsize and range of activities; the third is to integrate economic functions to the administrative centers.
Decentralization has been an incessant theme in Nepal over the last five decades, althoughpast initiatives have all foundered on the bedrock of the highly centralized governance system.One of the constraints to effective decentralization has been the obduracy of sectoral approach.Thus, decentralization remains ineffective as local administrations have no control over lineagencies, which have access to resources and technical expertise. Such a vertical commandsystem is mainly responsible for the problem of lack of integration among sectoral agencies at theoperational level. The decentralization effort in Nepal has also failed due to the economic fragility ofthe districts. District autonomy is feasible only through consolidation of their economic base with awider tax authority, and revenue sharing of income from local resource exploitation. The present
x

administrative districts have no capacity for being agents of decentralization due to their pooreconomic base, as only 11 out of 75 districts have surplus revenue. Reduction in number ofdistricts seems a logical option to economize administrative cost since there is a limit to theincrease of local revenue. The proposal of district consolidation is to reduce the number ofadministrative districts to 25, one third of the number that currently exists. Such a rationalization ofsub national political units should also be extended to the lower hierarchy—that is, drastic reductionin number of village development committees and municipalities. Consolidation of districts willconsiderably enlarge their area of coverage and reduce administrative costs by two thirds.Consolidated districts with enhanced resources could be entrusted with some local functionspresently administered by the central government. This would also imply curtailing the presenthighly centralized budgetary allocation system and instead empower districts with more taxationauthority. Another mechanism to enhance district income would be allocation of certain percent ofrevenue generated from the extraction of the district’s natural resources. Accordingly, mountain/hilldistricts with hydroelectric projects, and tarai districts with timber exports would have additionalrevenue.
In Nepal, where different regions are inhabited by distinct sociocultural groups, it is necessaryto reconcile economic and social aims within the framework of national development. The stateideology of Nepal, based on the caste system, has remained highly exclusionary. The agenda ofsocial inclusion has political, sociocultural, and economic ramifications. The political aspect needsto consider a secular constitution, proportional representation, and devolution to local governments.The sociocultural aspect should encompass religious and linguistic equality, and a reservationsystem. In the economic sphere, the need is for affirmative action in education and employmentfor disadvantaged groups.
Regional strategy needs to consider not only the economic articulation among regionswithin the country, but also the relative development level immediately across the border. TheNepalese economy is too integrated with that of India, which is the source of labor and raw materials.The strategy for the development of Nepal vis-à-vis India cannot be competitive as Nepal has toomany disadvantages. Rather, it should be complementary, providing scope for product specializationbetween the highlands (Nepal) and lowlands (India). If Nepalese development could concentrateon the specialized processing of subtropical and temperate products, these would find a readymarket in India. Similar to the asymmetric economic relation between India and Nepal, trade betweenNepal and TAR used to be dominated by Nepal. However, TAR is no longer an economic backwaterbut a vibrant region, and is presently undergoing much economic transformation. Nepal’s regionalstrategy has to consider this new reality, which provides scope for its northern border areas. Itwould take decades for many mountain districts to be linked by roads with the south; these shouldinstead be connected by road with the Tibetan prefectures of Ngari in the west, and Xigaze in theeast.
The main purpose of incorporating the regional approach in national planning is to reducespatial disparity in development. There is much scope for mobilizing external resources as well asexploiting the opportunity of regional cooperation. With careful manipulation of total resources,domestic and foreign, it is possible to mitigate the glaring spatial disparity and also promoteeconomic growth. The 20-point recommendations of this study covers the following aspects: (i)spatial orientation, (ii) land use planning, (iii) transport access, (iv) industrial location, (v) urbansystem, (vi) decentralization, (vii) social inclusion, and (viii) organizational change.
xi

I. INTRODUCTION
A. Terms of Reference
Balanced regional development has been one of the agendas of the government since theFourth Plan, covering fiscal year (FY)1970–FY1975. However, progress has beenlimited—regional disparity is much more prevalent, intense, and severe in rural areas and
the mountain zone. Government efforts for regional development have not been effective mainlydue to an inadequate policy framework to implement the concept. There is no integrated andcoherent policy framework for regional development based on a thorough assessment of regionalconditions and policies and programs are still fragmental and unfocused. A lack of clear demarcationof functional responsibilities of local bodies and the central government for regional developmenthas added more confusion since the Government initiated the decentralization program. Therehas been no attempt to examine the potential of enhancing spatial development through thepromotion of regional cooperation with neighboring countries.
The Asian Development Bank’s (ADB) Country Strategy and Program 2005–2009 (CSP)for Nepal lays emphasis on greater balance in the development of different regions of the countryso as to promote a more inclusive development process. The CSP states that in order to promotebroad-based economic growth, the key focus will be on bringing excluded regions and socialgroups into the economic mainstream by fostering connectivity between all part of the country andfacilitating trade between Nepal and its neighbors.1 The present study was done as a backgroundexercise for such a development strategy. The objectives of the study were to: (i) examine themajor issues and constraints to balanced regional development, (ii) prepare a strategy for achievingbalanced regional development, and (iii) make necessary policy recommendations for effectiveimplementation of regional development. Specific scopes to be covered were defined as: (a) extentof socioeconomic disparities across the development regions; (b) preparation of broad regionalstrategy through enhancing growth, improving service delivery and social inclusion; and (c)assessment of regional cooperation for such strategy.
The study has attempted to address the above task in the following arrangement. Theintroductory chapter deals with the study approach, clarification on regional concept, as well asthe hierarchy of regions in Nepal. Chapter II provides a review of past experiences of regionalapproach in Nepalese planning. Chapter III and IV attempt to portray the magnitude of disparity,both at the levels of the five development regions, and their 15 sub regional components. ChapterV is devoted to some important aspects that determine spatial development. Chapter VI is focusedon decentralization with some suggestions on administrative consolidation and resource sharing.Chapter VII examines the asymmetric economic relation of Nepal with its immediate neighboringcountries and the concluding chapter enumerates 20-point recommendations for effectiveoperationalization of regional strategy.
B. Study Approach
It seems necessary to clarify some notions and terms regarding regional concept in
1 ADB. 2004a. Nepal: Country Strategy and Program (2005–2009). Manila.

Nepal Regional Strategy for DevelopmentHarka Gurung
June 2005
development planning. The first notion is that regional planning is sometimes equated with urbanplanning of a metropolitan area. However, regional approach can be applicable not only for a definedsub-national area but also to the national space, and therefore, relevant in macro planning. Thesecond notion tends to consider regional planning as being distinct from economic planning owingto their difference in emphasis—equity of the former and efficiency of the latter. In fact, regionalstrategy is basically spatial planning for resource allocation based on comparative advantage.Thus, the appropriate concept would be one of regional strategy for development planning. Thethird notion relates to overt emphasis on balanced development under the rubric of regional planning.Heterogeneity in physical attribute, natural resource, and culture complex are characteristic featuresof most regions, be they large or small. It is difficult to seek balance among such diverse regionsfrom economic consideration. What development intervention should do is to reduce the existingdisparity. Therefore, the main rationale of a regional approach is to promote economic exchangeamong the diverse regions and culture areas. Thus, regional strategy should be considered moreas the pursuit for national integration.
The next task is to elucidate some terms used in the regional context. Those prevalent inNepal are ‘census regions’, ‘development regions’, and ‘eco-development regions’. Early populationcensuses of Nepal recognized three elevation zones (hill, inner tarai, tarai) and two lateral divisions(west, east). Since 1971, the census regions recognize three elevation zones (mountain, hill,tarai), and east-west division based on the number of development regions. In 1972, the countrywas divided into four development regions along the east-west axis (Eastern, Central, Western,and Far Western). In the late 1970s, the Far Western Development Region was split into two,namely the Mid Western and the Far Western Development Regions. Agricultural specializationpolicy since 1972 distinguished three ecological regions, namely the mountain for livestock, hill forhorticulture, and tarai for food grain. This writer has devised and subscribes to 13 geographicalregions for spatial analysis of Nepal. Such a division recognizes: (i) three major drainage basins(Karnali as western, Gandaki as central, and Kosi as eastern), (ii) the inner tarai as a distinctinterstice between the hill and plain zone, and (iii) separate identity of Kathmandu Valley (Tables13 and 17). However, as prescribed by the terms of reference, all data and discussion in this studyare presented on the basis of development regions and their component elevation zones or subregions.
The combination of five ‘development regions’ and three ‘ecological regions’ yields 15 arealunits that are used now as census regions and also designated as ‘eco-development regions’(Map 1). However, the so called eco-development regions present a conceptual problem. Bygeographic definition, the development regions can be considered as functional or organic regions,while the elevation zones constitute formal or natural regions. These two categories of regions arenot methodologically compatible. The resolution of the problem lies in adopting the principle ofregional hierarchy. Thus, development regions that encompass all three elevation zones can beassigned as regions of the first order, and their three elevation zone components as sub regions ofthe second order. All indicator data used in this study are presented on the basis of developmentregions (in upper case) and 15 sub regions (in lower case). According to the official 15 units orsub regions, Kathmandu Valley is included within the central hill. This tends to mask the metropolitanimportance of its three districts as evident from some sample indicators given in the table below.In this study, the data for Kathmandu Valley are given separately where available so as to highlightits pre-eminence in development.
2

NRM Working Paper Series No.3
Section IIStatus Review
Notes: FWM = far western mountain; FWM = far western hill; FWT = far western tarai;MWM = mid western mountain; MWH = mid western hill; MWT = mid western tarai; WM= western mountain; WH = western hill; WT = western tarai; KV = Kathmandu Valley;CM = central mountain; CH = central hill; CT = central tarai; EM = eastern mountain; EH= eastern hill; and EH = eastern tarai.
II. STATUS REVIEW
A. Strategy Initiation
The first attempt to incorporate spatial dimension in national development envisaged aseries of north-south growth axes or development corridors linking diverse natural regions.2 Suchjuxtaposition of elevation zones within a development corridor was to generate interregionalcirculation (Map 2). Four growth axes, which offered the greatest prospect for integration and
2 Gurung, H. 1969. Regional Development Planning for Nepal. Kathmandu: National Planning Commission.
Indicator Central Hill Central Hill KathmanduIncluding Kathmandu Excluding Kathmandu Valley Only Valley Valley
1. Human development index 0.537 0.452 0.6102. Per capita income $2,083 $1,115 $2,4583. Net migration 185,654 - 60,108 245,762
Sources: Table 6, 7 and 8.
3

Nepal Regional Strategy for DevelopmentHarka Gurung
June 2005
Table 1: Regional Development Areas
Macro Region Growth Axis Growth Centers (Geographic location)
Kosi (eastern) Section Biratnagar-Hedangna 1. Hedangna (mountain); 2. Dhankuta (hill);3. Dharan (tarai); 4. Biratnagar (tarai)
Gandaki (central) Section Bhairawa-Jomsom 1. Jomsom (mountain); 2. Pokhara (hill);3. Syangja (hill); 4. Palpa (hill); 5. Butwal (tarai);6. Bhairawa (tarai)
Metropolitan (Kathmandu) Birganj-Barabise/ 1. Dhunche (mountain); 2. Barabise (hill);Section Dhunche 3. Kathmandu (metropolitan);
4. Hetauda (inner tarai); 5. Birganj (tarai)
Karnali (western) Section Nepalganj-Jumla 1. Jumla (mountain); 2. Dailekh (hill);3. Surkhet (inner tarai); 3. Nepalganj (tarai)
Source: Gurung, H. 1969; p.17.
Development of selected growth centers would act as a demonstration for formulating adevelopment approach best suited to other areas with similar conditions. Thus, Biratnagar, Birganj,Bhairawa, and Nepalganj would exemplify development patterns for tarai towns, while Dhankuta,Palpa, Syangja, and Dailekh would be models for hill areas (Table 1). For the mountain region,Hedangna, Dhunche, Jomsom, and Jumla would clarify development models for remote areas.The aim of developing growth centers was the creation of polyfunctional settlements to cater to thediverse needs of their hinterland.
The most important aspect of a growth center approach is the positive nature of polarizeddevelopment as it takes place, whereby the growth spreads to the surrounding area—that is,areas in organic link with the growth center would gain from concentrated economic activitiesthrough the process of multiplier effect. As the economy integrates itself, and commodity andfactor markets become more efficient, the spread effect may begin to assert itself from thesenuclei of development. In identifying such growth centers, primacy was given to those areas withmaximum prospects for radiation effect to the peripheral areas. The four development corridorslinking the 4 sets of growth centers make a regular transect across Nepal at distances ofapproximately 120 to 160 km with the assumption that their lateral impact would coalesce at acertain point in time and thus cover the entire country. The process of lateral progression would befurther accelerated by transverse connections such as the Kathmandu- Pokhara road which linktwo growth axes.
coordination of development programs in that they present both the east-west and north-southterritorial dimensions of the country, were outlined (Table 1). Each of the growth axes either had aroad, or a road was being constructed or planned. These roads would link a series of growthcenters where development efforts could be concentrated in order to achieve full economy ofscale and encourage agglomeration. Since the development corridors traverse through the wholegamut of regional types, the growth centers at specific locations would act as service centers forthe regional population. The set of growth centers along the arterial link would further induce growthin terms of agricultural transformation, industrial location, and trade activities as well as socialservices.
4

NRM Working Paper Series No.3
Section IIStatus Review
The main reasoning behind the development of growth axes was to tie-in the economy ofthe tarai with those of the hill. In order to maintain and develop economic viability of the hill, andtransmit growth from one region to another, it is essential to determine and develop those productsin the northern areas for which there is demand in the south. The best way to integrate the nationaleconomy is to establish the nature and scope of complementarity of northern and southern partsof the growth axis in terms of organic circulation in trade, labor, and capital.
Apart from the north-south (hill-tarai) diversity, there are also inter-regional differences amongthe eastern (Kosi), central (Gandaki), and western (Karnali) sections. The Karnali section, whichaccounts for nearly 42% of the total area, supports only 21% of the total population. Low rainfalland extensive highlands contribute to the Karnali section being sparsely populated. This section isalso deprived of the urban advantages of the Gandaki section, and of the periodic markets presentin the Kosi section. Both the tarai and the hills of the Far Western Development Region are,therefore, comparatively less developed than those of other areas. In order to develop the economyof the Karnali section, it seems necessary to devise still another growth axis for areas not amenableto the main Nepalganj–Jumla axis. This supplemental development corridor should be alignedalong the Dhangarhi–Dandeldhura Road as a means of effectuating development activities in theFar Western districts. The above regional strategy was partly adopted in the Fourth Plan (FY1970–FY1975), with the original paper incorporated as Appendix III (pp. 281–291). Similarly, concentrationof limited resources was included as one of the plan’s five major policies.3 The plan’s transportsector envisaged the construction of four gravel roads totaling 254 kilometers along the growth
3 National Planning Commission. 1970. The Fourth Plan (1970–75). Kathmandu. The other 4 policies were: (i)mobilization of internal resources; (ii) incentive to private sector; (iii) trade; and (iv) social justice.
5

Nepal Regional Strategy for DevelopmentHarka Gurung
June 2005
axes.4 However, the implementation took place much later. The adoption of regionalstrategy was followed by field investigations to assess economic linkage along the designatedgrowth axes. One initial study proposed some regional priorities by sector activities.5 Anotherstudy examined the economic structure of Kosi section (east) based on the framework of a 40 x41 input-output table and significantly noted that organization and management problems as thecrucial bottlenecks of development rather than the lack of capital and natural resources.6 A similar,detailed regional analysis for the Kathmandu growth axis (central) was also done to evaluate theapplicability of the strategy.7 The regional approach was much discussed as a new dimension inNepal’s development8 and as being a strategy for integrated development.9 Such an approachwas formalized with the creation of four development regions in 1972. The formation of such firstorder formal regions with an east-west division was soon followed by a royal directive onspecialization of agricultural production by elevation zones. The King’s periodic residence in theregional development centers gave further impetus to the regional concept. Since the royal visitswere an exercise in development as well as political intimacy, there was less scope for emphasizingparticular areas as the growth axes for intensive development within the regions. However, theseextended royal tours did help to some extent in de-emphasizing the supra role of metropolitanKathmandu.
B. Distorted Interpretation10
The Fifth Plan (FY1975–FY1980) adopted a 4-point regional policy as specified in the originalstrategy paper.11 These were: (i) reduction of inter-regional disparity, (ii) integration of the nationaleconomy, (iii) breaking the vicious circle, and (iv) elimination of imbalances among projects. It wasthe first periodic plan to estimate resource allocation by development regions. However, there wasno integration of the socioeconomic projects/programs along the growth axes. Three elementscontributed to the distortion of the regional strategy of national economic integration. Firstly, thepractice of giving sanctity to the formal development regions for programming led to emphasis onbalance among 4 regions rather than reducing imbalance between their elevation zones (mountain,hill, and tarai). The original idea of concentrating development activities along the growth axes inorder to integrate the elevation zones with comparative advantage was replaced by a model ofdiffused activity across development regions. Regional strategy was interpreted as a wholesaledispersal instead of judicious aggregation of projects. Leading economists not only failed todistinguish between the growth center (focal point) and growth axis (area of activity) but visualized
4 ibid. op.cit. These were Nepalganj-Surkhet (77 km), Putalikhet-Baglung (80 km), Trisuli-Dhunche (25 km) andDharan-Dhankuta (72 km).
5 Okada, F. E. 1970. Preliminary Report on Regional Development Areas in Nepal. Kathmandu: NPC.6 Ojha, D. et al. 1972. Regional Analysis of Kosi Zone/Eastern Nepal: Working Method for Regional Planning in
Nepal. Berlin and Kathmandu: German Development Institute/ Centre for Economic Development andAdministration. 2 vols. Abstract in Socio-Econ. Plan. Sci. 7 (1993): 213–282.
7 Zehender, W. et al. 1975. Evaluation of a Regional Development Strategy: A Case of Kathmandu Growth Zone.Berlin: German Development Institute.
8 Pradhan, P. 1973. A New Dimension in Nepal’s Development: The Regional Approach in Planning and People-oriented Development Strategy. Kathmandu: CEDA.
9 Sanger, C. 1973. Three Strands of Rope. Ottawa: IDRC.10 Gurung, H. 1984. Nepal: Dimensions of Development. Kathmandu.; and Gurung, H. 1989a. Nepal: Dimensions of
Development. Kathmandu.11 National Planning Commission. 1975. The Fifth Plan (1975–80). Kathmandu.
6

NRM Working Paper Series No.3
Section IIStatus Review
regions as discrete subdivisions of the national territory and even proposed long-term investmentand growth models without examining regional resources.12
The second element that contributed to the derailment of regional strategy was theoveremphasis given to the Small Area Development Program (SADP) during the Fifth Plan. Initiallyproposed as a rural development adjunct to the overall design of growth axes, it was soon elevatedto the main component of regional strategy. Thus, the excellent earlier studies in regional economicanalysis13 were superseded by those concentrating on SADP areas.14 With this diversion in focus,there was not only a virtual cessation of meaningful research relating to regional development, butthe emphasis itself changed to rural development. SADP was soon to become the precursor tothe integrated rural development project (IRDP).
Thus, the third element that led to the distortion in the regional strategy was the emergenceand expansion of various IRDPs. Since the mid-1970s, 41 districts have been covered by 16IRDPs supported by 12 donors (Map 3 and Appendix B).15 As of the mid-1990s, 9 donors hadexpended over NRs 2,776 million in 30 such districts.16 The IRDPs with much external financeserved well to fulfill what the concept of growth axis lacked in program funding. Some of the IRDPssuch as those for Kosi Hill, Rasuwa-Nuwakot, and Karnali-Bheri did relate to parts of the originalgrowth axes, but their basic rural conceptualization, diversity in approach, and lack of transportcomponent made them less effective in total impact. It was with this realization that the Lamosangu-Jiri Road was made the centerpiece of the Integrated Hill Development Project after two decadesof tinkering with the Jiri Multipurpose Development Project without a road connection.
Three academic studies on regional planning done in the late 1980s have made diverseinterpretations of the concept. One of these emphasized a spatial framework with strategic activitiesfor different planning regions.17 Another study based on Marxist analysis diagnosed
12 Shrestha, B.P. and S.C. Jain. 1978. Regional Development in Nepal: An Exercise in Reality. Delhi: DevelopmentPublishers.
13 Ojha, D. et al. 1972. Regional Analysis of Kosi Zone/Eastern Nepal: Working Method for Regional Planning inNepal. Berlin and Kathmandu: German Development Institute/ Centre for Economic Development andAdministration. 2 vols. Abstract in Socio-Econ. Plan. Sci. 7 (1993): 213–282; and Zehender, W. et al. 1975.Evaluation of a Regional Development Strategy: A Case of Kathmandu Growth Zone. Berlin: GermanDevelopment Institute.
14 Centre for Economic Development and Administration (CEDA). 1975. Regional Development Study (Nepal).Part I: General Report; Part IIa: Far Western Development Region; Part IIb: Rural Development PackageProgramme Dailekh; Part IIIa: Kosi Zone; Part IIIb: Rural Development Package Programme Khandbari.Kathmandu: Mimeo, 803 pages.
15 Gurung, H. 1999. Area Planning in Nepal: Review of Experiences. Report commissioned by InternationalCenter for Integrated Mountain Development.
16 Shrestha, S. 1997. A Study Report on Integrated Rural Development Projects in Nepal: A Review Analysis.Kathmandu: IIDS.
17 Joshi, J. 1985. Regional Strategy for Development: A Case Study of Nepal. Kathmandu.
7

Nepal Regional Strategy for DevelopmentHarka Gurung
June 2005
This analysis portrays the reality of Nepal’s dependence as a periphery of India but the studyprovides no prescription to remedy such an imbalance. The third study relied heavily on the regionalmodeling of earlier economists19 and favored a concentration of development activities in the mostadvanced development regions (Eastern and Central).20
The National Planning Commission (NPC) attempted an exercise in regional approachwith a 10-year perspective covering the span of the Eighth and Ninth plans (1990–2000).21 Thisdraft document presents the development level of 15 sub regions on the basis of 25 socioeconomicindicators (Table 11). It also included a brief proposition on regional programs but these were notincorporated in the plan. Thereafter, regional strategy has been superceded by a succession ofnew development themes, such as basic needs approach, environmental concern, and povertyreduction. The Tenth Plan (2002–2007) makes reference to regional development and balancewith policy components of people’s participation, inter-regional economic linkage, and resourceallocation.22 It also refers to some program priorities by elevation zones, but there is very little oninter-sectoral integration at the regional level. For example, its transport sector includes 60 priorityroads with an allocation of NRs 20,047 million; of these, 12 remote area roads have a share of10.1% as compared to 7.6% for Kathmandu Valley roads. Thus, the backward areas still remaininaccessible as in the past.
III. EXTENT OF DISPARITY
There is much disparity among development regions and their sub regional components.This is due both to the region’s intrinsic locational factor and development activities that favoraccessible ones. The latter aspect becomes obvious when comparing the change over time acrossvarious sectors of development activity.
A. Temporal Change
Change over time has been examined here on the basis of three sets of data. The first is
18 Bhattarai, B. 2003. The Nature of Underdevelopment and Regional Structure in Nepal: A Marxist Analysis. Delhi:Adroit Publishers. This citation is based on the original dissertation completed in 1986.
19 Shrestha, B.P. and S.C. Jain. 1978. Regional Development in Nepal: An Exercise in Reality. Delhi: DevelopmentPublishers.; and Pant, Y.P. and S.C. Jain. 1980. Regional Imbalances and Process of Regional Development in
Nepal. Delhi: Development Publishers.20 Amatya, D.B. 1987. Perspectives in Regional Problems and Regional Development in Nepal. New Delhi:
Sterling Publishers.21 National Planning Commission. 1987. Chhetriye Bikashko Sthiti (Status of Regional Development). Draft in
Nepali. Kathmandu: Mimeo, 40 pages.22 National Planning Commission. 2003. The Tenth Plan (2002–2007). Kathmandu.
8
the apparently contradictory scenario of excessivepolarization around the capital city, on the one hand, andoutward orientation towards India along a north-south dendritestretching from mountain to tarai, on the other. This may becited as an example of the typical mode of spatial integrationin a semi-feudal, semi-neocolonial society.18

NRM Working Paper Series No.3
Section IIIExtent of Disparity
based on the progress of select indicators in three decades with 1971 as the base year. Thesecond is the regional pattern of development expenditure for two fiscal years two decades apart.The third is gross domestic product (GDP) by sub regions at an interval of 15 years. Table 2presents data on nine select indicators to compare their achievement of three decades in the fourdevelopment regions. Nepal had 79 more persons per square kilometer in 2001 than in 1971. Thehighest population density increase took place in the Central Region, and the lowest in the FarWestern Region; this may be taken as indicators of their relative difference in developmentadvantage. Nepal’s food grain production doubled during the period 1971–2001. Of the total increase,the Eastern Region led with 30%, while the Western Region had the lowest increase (19.9%). Theincrease in irrigated area was 4.4 times, of which the Far Western Region contributed more thanhalf and the Western Region registered the least (6.8%). Road mileage during 1971–2001 increased7.6 times; the Central Region led with 39.4%, while the Western Region registered an increase ofonly 15.3%. In 2001, there were 21 more airports than in 1971, with the Far Western Region showinga twofold increase in their numbers.
The number of industrial establishments increased 4.9 times, with the continuing dominanceof the Central Region: 68.7% in 1971 to 46.6% in 2001. The Far Western Region’s share of suchan increase was only 11.1%. Hydropower generation recorded an increase of 12 times; of this, theWestern Region led with more than half and the Eastern Region contributed the least. The numberof schools increased 4.8 times and this increase was comparatively even across developmentregions. The increase in hospital beds was 8.3 times, much of which was in the Central Regionwhile the Eastern Region recorded the least increase. Some of the above indicators show amismatch between investment and production. The increase in food grain was less than half thatof irrigated area extension (2.1 vs. 4.4 times), and the increase in industrial establishment onlyabout one-third of power generation (4.9 vs. 12.4 times). These data are related to the macro leveldevelopment regions.
9

Nepal Regional Strategy for DevelopmentHarka Gurung
June 2005
Table 2: Regional Variation, 1971–2001
Select Indicator Unit Far Westerna Western Central Eastern Nepal
1. Population density Person/km 2 +40.1 +71.6 +152.0 +89.5 +78.8
2. Food grain production 1,000 MT +829 +771 +950 +1,160 +3,865
3. Irrigated area ha. +15,280 +1,841 +3,777 +6,205 +27,102
4. Road length km. +2,596 +1,758 +4,523 +2,616 +11,492
5. Airports Number +8 +4 +4 +5 +21
6. Industrial establishments Number +284 +538 +1,043 +689 +2,554
7. Hydropower generation kW +15,189 +258,605 +206,486 +4,803 +485,083
8. Schools Number +7,132 +7,073 +8,964 +6,105 +29,274
9. Hospital beds Number +1,207 +1,278 +3,570 +824 +6,879
a The Mid Western Region was created only in 1978. Source: Appendix A
The next two data sets examine temporal change both at the development region and subregional levels. The comparison of development expenditure is based on data collected at aninterval of 22 years. In the FY1978/79, such expenditure totaled NRs 1,712 million. The CentralRegion led with a share of 54.9%, while the Eastern Region had only a 13.3% share (Table 3).Among the 15 sub regions, central hill topped with 28.1%, of which Kathmandu Valley alone claimed19.9%. Central tarai was in the second place (23%), and eastern mountain (1.2%) the last. Suchwas the situation during the period when regional approach was being emphasized in Nepaleseplanning.
More than two decades later, in FY2000/2001, the total development expenditure increased22.2 times in nominal terms (Table 3). Of the total NRs 38 billion, the share of the Central Regionwas nearly two-thirds, with that of Kathmandu Valley showing an increase from 19.9% to 53.6%—59 times that of 1978/79. As a consequence, all the other development regions had a
Table 3: Development Expenditure, 1978/79 and 2000/2001
REGION/ Sub region 1978/79a 2000/2001b Change
S.N. NRs ‘000 % NRs ‘000 % NRs ‘000 Times Increase
A. FAR WESTERN 268,364 15.7 5,563,298 14.6 5,294,934 19.71 Mountain 59,123 3.5 1,891,924 5.0 1,832,801 32.12 Hill 62,545 3.7 2,079,921 5.5 2,017,376 32.33 Tarai 146,696 8.6 1,591,453 4.2 1,444,757 9.8
B. WESTERN 276,335 16.1 3,394,683 8.9 3,118,348 12.34 Mountain 20,517 1.2 117,465 0.3 96,948 5.75 Hill 121,571 7.1 2,294,238 6.0 2,172,667 18.96 Tarai 134,247 7.8 982,980 2.6 848,733 7.3
(Continued on Next Page)10

NRM Working Paper Series No.3
Section IIIExtent of Disparity
lower share than two decades earlier. Among the sub regions, central hill led (57.5%) followed byeastern tarai (7.3%). The sub regions with the lowest share of development expenditure wereeastern mountain (0.8%) and western mountain (0.3%). Development expenditure for the CentralRegion increased 26 times compared to 22 times for the total. Increase for the other regions was20, 18, and 12 times in the Far Western, Eastern, and Western Regions, respectively. Among thesub regions, central hill led with a 45 times increase. The next in league were far western hill andfar western mountain (32 times). Those with a very small increase were the tarai sub regions ofthe Far Western, Western, and Central Development Regions.
The third temporal data set relates to GDP for FY1984/85 and FY1999/2000. Of the totalGDP of NRs 44,267 million estimated for 1984/85, the Central Region had a share of 41.8% (Table4). The next was the Eastern Region, with 28.1%. The Far Western Region had the lowest share,with only 5%. Among the sub regions, central tarai and eastern tarai each claimed a fifth of the totalGDP. Central hill came next with 19.4%. Those with very low GDP were mountain sub regions ofthe Far Western, Mid Western, and Western Development Regions.
The total GDP for FY1999/2000 was estimated at NRs 330 billion, or 6.4 times that of 1984/85 in nominal terms (Table 4). In regional distribution, the Central Region had the lion’s share with47.2%. The share of other regions was 20.4% for the Eastern, 16.5% for the Western, 9% for theMid Western, and 6.8% for the Far Western Development Regions. Among the sub regions, centralhill led with a quarter, followed by central tarai with a fifth of the total GDP. Mountain sub regions ofthe Far Western, Mid Western, and Western Development Regions recorded the lowest GDP, asthey had done 15 years earlier (Map 4).
The country’s GDP increased by 6.4 times in nominal terms during the period FY1984/85–FY1999/2000. Surprisingly, the Far Western Region led with an increase of 9.1 times (Table 4). TheCentral Region came next with a 7.4 times increase. The Mid Western and Western Regions
REGION/ Sub region 1978/79a 2000/2001b Change
S.N. NRs ‘000 % NRs ‘000 % NRs ‘000 Times Increase
C. CENTRAL 939,375 54.9 24,856,032 65.3 23,916,657 25.57 Mountain 65,238 3.8 434,558 1.1 369,320 5.78a Hill+ KVc 480,363 28.1 21,904,875 57.5 21,424,512 44.68b Hill – KVc 139,077 8.1 1,489,666 3.9 1,350,589 9.78c KVc only 341,286 19.9 20,415,209 53.6 20,073,923 58.89 Tarai 393,774 23.0 2,516,600 6.6 2,122,826 5.4
D. EASTERN 227,587 13.3 4,251,889 11.2 4,024,302 17.710 Mountain 17,063 1.0 288,416 0.8 271,353 15.911 Hill 62,322 3.6 1,186,741 3.1 1,124,419 18.012 Tarai 148,202 8.7 2,776,732 7.3 2,628,530 17.7
NEPAL 1,711,661 100.0 38,065,902 100.0 36,354,242 22.2
Source: a Banskota, M. 1979; p. 52.b Financial Comptroller General’s Office. 2002; pp. 91–93.c Kathmandu Valley.
(Table 3 continued)
11

Nepal Regional Strategy for DevelopmentHarka Gurung
June 2005
Table 4: GDP by Sub region, 1984/1985 and 1999/2000
S.No. Region 1984/85a 1999/2000b IncreaseSub region NRs (million) % Rank NRs (million) % Rank NRs (million) Times
A FAR WESTERN 2,228 5.0 E 22,463 6.8 E 20,235 9.11 Mountain 291 0.7 13 2,907 0.9 13 2,616 9.02 Hill 613 1.4 12 6,948 2.1 10 6,335 10.33 Tarai 1,324 3.0 8 12,608 3.8 9 11,284 8.5
B MID WESTERN 3,885 8.8 D 29,855 9.0 D 25,970 6.74 Mountain 247 0.6 14 2,635 0.8 14 2,388 9.75 Hill 1,323 3.0 9 12,658 3.8 8 11,335 8.66 Tarai 2,315 5.2 7 14,562 4.4 7 12,247 5.3
C WESTERN 7,228 16.3 C 54,644 16.5 C 47,416 6.77 Mountain 103 0.2 15 724 0.2 15 621 6.08 Hill 3,268 7.4 5 28,606 8.7 4 25,338 7.89 Tarai 3,857 8.7 4 25,314 .7 5 21,457 5.6
D CENTRAL 18,494 41.8 A 155,911 47.2 A 137,417 7.410 Mountain 737 1.7 10 6,626 2.0 11 5,889 8.011a Hill 8,571 19.4 3 82,651 25.0 1 73,990 8.612 Tarai 9,186 20.8 1 66,634 20.2 2 57,448 6.3
E EASTERN 12,432 28.1 B 67,391 20.4 B 54,959 4.413 Mountain 676 1.5 11 5,627 1.7 12 4,951 7.314 Hill 2,813 6.4 6 19,531 5.9 6 16,718 5.915 Tarai 8,943 20.2 2 42,233 12.8 3 33,290 3.7
NEPAL 44,267 100.0 330,264 100.0 285,997 6.4
Source: a National Planning Commission. 1989; table 2.1. b United Nations Development Programme. 2002; p. 144, table A3.
12

NRM Working Paper Series No.3
Section IIIExtent of Disparity
both registered an increase of 6.7 times, while the Eastern Region trailed with a 4.4 times increase.Among the sub regions, far western hill gained most in GDP, with a 10.3 times increase. The nextwere mid western mountain and far western mountain. Central hill’s increase of 8.6 times wasclose to mid western hill and far western tarai. The sub region with the lowest GDP increase waseastern tarai (3.7 times).
B. Spatial Disparity
The extent of the current disparity among the five development regions and 15 sub regionsis presented on the basis of 11 select indicators. Of these, three are related to infrastructure, fourto social, and four to economic sectors.
(i) Infrastructure: The indicators of infrastructure development used here are road length,airports, and hydropower generation (Table 5). Of the country’s total road length of 13,223 kilometers,the Central Region leads with a share of 39.1%. The Eastern Region comes next with 22.6%, andthe Far Western Region last with 8.6%. Central hill is the leading sub region with 18.2% of the totalroad mileage. The next sub region in road mileage is central tarai, followed by eastern tarai.Kathmandu Valley, with an area of 899 km2, has more road mileage than the other 12 sub regionswith roads. Mountain sub regions of the Mid Western and Western Regions, covering 27,170 km2,do not have any roads (Map 5).
Of the 49 airports in the country, the Eastern and Mid Western Regions claim nearly a half,with 12 each; the Far Western Region has 10, the Central Region, 8, and the Western Region, 7.Among the sub regions, mid western mountain has the highest number, with 6 followed by easternmountain, with 5. In general, there are more airports in the mountain and hill zones less served byroads as an alternative transport system.
The Central Region leads with more than half of the total hydropower generation. The nextwith such infrastructure is the Western Region. Hydropower generation from the other three regionsis only about 5% of the total. Western hill is the leading sub region with 43.4% of the total generation.The next is central hill region. There is no such infrastructure in the tarai sub regions of the FarWestern and the Mid Western Regions.
13

Nepal R
egional Strategy for D
evelopment
Harka G
urung
June 2005
Tab
le 5: Select In
frastructu
re Ind
icators
S.N
o.R
EG
ION
/Sub region
Ro
ad L
eng
th, 2001
a A
irpo
rt, 2002b
Hyd
rop
ow
er Gen
eration
c
Km
. % N
um
ber
KW
%
AFA
R W
ES
TER
N 1,132
8.6 10
1600 0.3
1M
ountain 59
0.4 3
700 0.1
2H
ill 524 4.0
4 900
0.23
Tarai 549
4.2 3
- -
BM
ID W
ES
TER
N 1,697 12.8
12 13,895
2.54
Mountain
- - 6
900 0.2
5H
ill 720 5.4
4 12,995
0.46
Tarai 977 7.4
2 -
-
CW
ES
TER
N 2,236 16.9
7 239,490
43.67
Mountain
- - 2
365 0.1
8H
ill 1,409
10.7 4
238,101 43.4
9Tarai
827 6.3 1
10,224 0.2
DC
EN
TRA
L 5,169 39.1
8 282,422
51.410
Mountain
468 3.5
3 73,600
13.411a
Hill + K
Vd
2,401 18.2 1
193,822 35.3
11bH
ill - KV
d 1,141 8.6
0 192,682
35.111c
KV
d only 1,260
9.5 1
1,140 0.2
12Tarai
2,300 17.4
4 15,000
2.1
EE
AS
TER
N 2,989 22.6
12 11,794
2.713
Mountain
34 0.3
5 1,375
0.314
Hill
785 5.9
4 7,219
1.315
Tarai 2,170
16.4 3
3,200 0.6
NEPA
L 13,223 100.00
49 549,201
100.0
Sources: a A
ppendix C; b C
ivil Aviation A
uthority of Nepal, m
ap; c Appendix D
. d K
athmandu V
alley.
14

Sec
tion
VS
patia
l Fra
mew
ork
NR
M W
orki
ng P
aper
Ser
ies
No.
315

Nepal Regional Strategy for DevelopmentHarka Gurung
June 2005
Table 6: Select Social Indicators
S.No. REGION/ Literacy ratea Population/Health HH with piped Human DevelopmentSub region 2001 Institutionsb, 2001/02 waterc, 2001 2001
A. FAR WESTERN 46.7 5,332 49.1 0.4041 Mountain 39.5 3,343 59.8 0.3552 Hill 44.8 3,583 54.4 0.4033 Tarai 55.9 14,414 33.2 0.450
B. MID WESTERN 43.7 5,332 51.2 0.4024 Mountain 31.8 3,343 55.0 0.3475 Hill 45.8 3,583 59.1 0.4176 Tarai 53.5 14,414 39.4 0.440
C. WESTERN 56.6 4,980 71.7 0.4917 Mountain 55.8 2,273 88.9 0.4888 Hill 60.3 4,270 79.2 0.4899 Tarai 53.5 9,926 46.9 0.494
D. CENTRAL 48.1 6,294 63.2 0.49010 Mountain 41.6 3,626 82.8 0.42711a Hill + KVe 58.8 6,892 74.5 0.54711b Hill - KVe 51.8 5,115 58.1 0.46611c KVe only 72.2 11,504 73.9 0.61212 Tarai 43.9 6,460 32.2 0.451
E. EASTERN 53.9 5,662 52.5 0.49313 Mountain 50.6 3,137 76.4 0.47714 Hill 56.4 4,028 64.6 0.50015 Tarai 54.7 8,087 16.4 0.491
Nepal 53.7 5,588 57.5 0.471
Source: a Appendix E; b Appendix F; c Appendix G; d Appendix H. e Kathmandu Valley.
(ii) Social: The indicators of social development taken are literacy rate, population perhealth institution, households with piped water, and human development index (Table 6). Ac-cording to the population census 2001, Nepal’s adult literacy rate was 53.7%. Among the fivedevelopment regions, the Western (56.6%) and the Eastern (53.9%) exceed the national aver-age (Map 6), while the Mid Western has the lowest literacy rate (43.7%). The sub region withhighest literacy rate is western hill (60.3%), followed by central hill (58.8%). Mid western moun-tain, with 31.8% literacy rate, is ranked at the bottom.
The national average ratio between health institution and population is 1:5,588 (Table 6).This varies from 1:5,332 for the Far Western, to 1:6,294 for the Central Region (Map 7). All threedevelopment regions west of Kathmandu have a lower population/health institution ratio than thenational average. The sub region with the lowest population per health institution is westernmountain while central hill presents the reverse case. Despite the favorable situation indicatedfor mountain and hill sub regions in terms of such a ratio, they are handicapped by poor accessto health services.
16

NRM Working Paper Series No.3
Section IIIExtent of Disparity
The number of households with access to piped water supply is reported to be 57.5% atthe national level (Table 6). The Western Region leads with 71.7% of households with such afacility. The Central Region comes next with 63.2%. The other three regions register numbersbelow the national average, the lowest being for the Far Western Region (49.1%). Western mountain(88.9%) and central mountain (82.8%) are the better placed among the sub regions as regardssuch facilities (Map 8). With the exception of the Mid Western Region, all regions have a pattern ofbetter piped water access with increasing elevation zone. The sub region with the lowest accessto piped water is eastern tarai (16.4%), which is traditionally dependent on tube-wells.
The number of households with access to piped water supply is reported to be 57.5% atthe national level (Table 6). The Western Region leads with 71.7% of households with such afacility. The Central Region comes next with 63.2%. The other three regions register numbersbelow the national average, the lowest being for the Far Western Region (49.1%). Western mountain(88.9%) and central mountain (82.8%) are the better placed among the sub regions as regardssuch facilities (Map 8). With the exception of the Mid Western Region, all regions have a pattern ofbetter piped water access with increasing elevation zone. The sub region with the lowest accessto piped water is eastern tarai (16.4%), which is traditionally dependent on tube-wells.
The latest human development index (HDI) estimated for the country is 0.461 (Table 6 andMap 9). Accordingly, the HDI value by development regions decreases westward from the EasternRegion (0.485) to the Far Western Region (0.393). In terms of sub regions, central hill supercedesall with 0.537, of which Kathmandu Valley alone contributes with 0.610. Those with low HDI valuesare the far western hill, far western mountain, and mid western mountain sub regions.
(iii) Economic: The indicators included to compare economic status across regions andsub regions are registered land, land holding, industrial asset, and per capita income in terms ofPPP (purchasing power parity) (Table 7). The country has 6 million hectares of land registeredthrough cadastral survey. The proportion of such land by regions is progressively higher from thedrier west to the humid east (Map 10). Thus, the Eastern Region has 27% and the Far WesternRegion only 12.7%. Among the sub regions, western hill leads with 16.1%, followed by mid westernhill and eastern hill, each with 12.7%. Western mountain’s share is less than 1%, while the smallKathmandu Valley accounts for 1.2%.
The total operating land holding reported is 2.7 million hectares (Table 7). This comes to43.7% of the registered land. Such a wide divergence in area indicates that a considerable extentof registered land is either nonfarm or left fallow. The regional distribution of land holding has apattern similar to that of registered land (Map 11); that is, progressive increase of proportion fromthe west to the east. The Far Western Region has only 8.5% compared to the 30% of the EasternRegion. Eastern tarai leads among the sub regions, with 17.7% of the total land holding. Centraltarai comes next, followed by western tarai. Western mountain, as in the case of registered land,has the least share in such a holding.
The total asset of industrial establishments comes to NRs 39 billion (Table 7). The disparityis most pronounced in the regional pattern of such investment (Map 12). Thus, the Central Regionclaims 74.8% of the total industrial asset, of which Kathmandu Valley alone accounts for 61.2% .The Eastern Region comes next, with a 15.3% share. The Western Region has 7.5%, while theshare of the Mid Western and the Far Western Regions are only nominal. Among sub regions,
17

Nepal Regional Strategy for DevelopmentHarka Gurung
June 2005
central hill leads with 64.3%. The next sub regions are eastern tarai (14.6%) and centraltarai (10.5%). There is no such industrial investment in far west hill, mid west mountain, and westmountain sub regions.
The per capita income in terms of PPP for the country is estimated at $1,310 (Table 7). It isonly the Central Region, with $1,597, that exceeds the national average (Map 13). The WesternRegion comes second ($1,254), and the Eastern Region third ($1,202) in rank. The Mid WesternRegion has the lowest per capita income ($988). Surprisingly, western mountain leads all subregions in per capita income ($2,505); this could be partly due to tourism activity. The sub regionwith the second highest per capita income is central hill, mainly due to the very high income forKathmandu Valley ($2,458). The next group includes most of the tarai sub regions, which arebetteroff than their adjoining hill sub regions. Mountain and hill sub regions of the Far Western and theMid Western Regions have the lowest per capita income, the least being for mid western hill($ 879). Table 7: Select Economic Indicators
S.No. REGION/ Registered Landa Land Holdingb Industrial Assetc Per CapitaSub region ha.’ 000 % ha.’ 000 % NRs Million % Income
(PPP)d US dollar
A. FAR WESTERN 771.9 12.7 225.4 8.5 992,908 0.5 1,0791 Mountain 288.5 4.7 40.3 1.5 269 0.0 9392 Hill 374.0 6.2 70.6 2.7 - - 9453 Tarai 109.4 1.8 114.6 4.3 992,639 0.4 1,244
B. MID WESTERN 1,110.7 18.3 370.7 14.0 47,908 1.9 9884 Mountain 150.0 2.5 38.8 1.5 - - 9405 Hill 774.7 12.7 171.7 6.5 11,549 0.0 8796 Tarai 186.0 3.1 160.2 6.0 36,359 1.9 1,130
C. WESTERN 1,267.0 20.9 512.2 19.3 5,724,640 7.5 1,2547 Mountain 26.4 0.4 2.4 0.1 - - 2,5058 Hill 981.2 16.1 302.8 11.4 634,939 0.7 1,1989 Tarai 259.5 4.3 207.0 7.8 5,089,701 6.8 1,277
D. CENTRAL 1,283.3 21.1 750.2 28.6 21,002,198 74.8 1,59710 Mountain 273.2 4.5 67.8 2.6 255,037 0.0 1,15711a Hill + KVe 497.4 8.2 237.0 8.9 10,247,721 64.3 2,08311b Hill – KVe 425.5 7.0 208.0 7.8 2,252,175 3.1 1,11511c KVe only 71.9 1.2 29.0 1.1 7,995,546 61.2 2,45812 Tarai 512.7 8.4 445.4 16.8 10,499,440 10.5 1,222
E. EASTERN 1,643.3 27.0 795.5 30.0 12,152,266 15.3 1,20213 Mountain 357.7 5.9 69.4 2.6 867 0.0 1,27614 Hill 771.7 12.7 256.6 9.7 1,711,407 0.6 1,05715 Tarai 513.9 8.5 469.5 17.7 10,439,992 14.6 1,266
Nepal 6,076.2 100.0 2,654.0 100.0 39,919,920 100.0 1,310
Sources: a Appendix I; bCentral Bureau of Statistics. 2003; p.22, table 5; c Appendix K; dAppendix L. eKathmandu Valley.
18

NRM Working Paper Series No.3
Section IIIExtent of Disparity
19
Source: Table 6
Source: Table 6

Nepal Regional Strategy for DevelopmentHarka Gurung
June 200520

NRM Working Paper Series No.3
Section IIIExtent of Disparity
21
Source: Table 7
Source: Table 6

Nepal Regional Strategy for DevelopmentHarka Gurung
June 200522
Source: Table 7
Source: Table 7

NRM Working Paper Series No.3
Section IVEmerging Pattern
IV. EMERGING PATTERN
Economic development without spatial consideration may induce population redistributionwith major consequences. This is what has happened in the case of Nepal.23 Before planningstarted in Nepal, the tarai plain in 1952/54 had 29.1% of the total population. According to thecensus 2001, the tarai now supports 44.5% of the total population. During the period 1952/54–2001, the population of the country increased 2.8 times; however, the population of the tarai increased4.3 times. This was mainly due to migration from the economically depressed highlands to thelowlands as a spatial adjustment between population and resources.
A. Demographic Shift
The volume of inter-regional migration doubled from 1.0 million in 1981 to 2.0 million in2001. This migratory trajectory has been directed mainly from the hill to the tarai (Map 14). All fivetarai sub regions gained in population through net migration (Table 8). The situation was reversefor all mountain and hill sub regions except central hill, due to the net gain of Kathmandu Valley.The largest volume of out-migration originated in western and eastern hills, while their adjoiningtarai sub regions had the largest net gain.
Inter-regional migration by development regions indicates the broad pattern of such populationshift. Of the total out-migration, a third was from the Eastern Region and one-fourth from theWestern (Table 8). That from the Central Region was one-fifth, while that from the Mid Westernwas 10%. The Central Region claimed a third of all in-migration while a quarter was destined to theEastern Region. The Mid Western Region had the lowest in-migration among the developmentregions. The Western Region experienced a net loss of 161,577, and the Eastern of 152,420through migration. The Central Region had a net gain of 264,737, mainly through in-migration intoKathmandu Valley. Without this surplus, the Central Region would be a net loser (-130,082). TheMid Western Region was a net loser, while the Far Western Region was a net gainer, an indicationof the trajectory directed to the low density far western tarai.
The consequence of such migration was varying rate of population growth across theregions and sub regions (Map 15). Nepal’s growth rate of population during 1991-2001 averaged2.25 per annum. The Central Region led with 2.61, while the Eastern had the lowest of 1.84 (Table9). The Western Region had a lower growth than the national average, while that of the Far Westernand Mid Western Regions were just above the average. Far western tarai had the highest growthrate (3.86) among the sub regions. The sub regions with the next highest growth rates were midwestern tarai and western tarai, followed by central tarai.
23 Gurung H. 1989b. Regional Patterns of Migration in Nepal. Honolulu: East-West Centre.
23

Nepal Regional Strategy for DevelopmentHarka Gurung
June 2005
Table 8: Inter-Regional Migration, 2001
REGION/ In-Migration Out-Migration Net MigrationS.N. Sub region Number % Number % Number
A. FAR WESTERN 306,129 14.95 254,340 12.42 +51,789
1 Mountain 8,353 0.41 58,123 2.84 -49,770
2 Hill 18,394 0.90 182,933 8.94 -164,539
3 Tarai 279,382 13.65 13,284 0.65 +266,098
B. MID WESTERN 201,710 9.85 204,239 9.98 -2,529
4 Mountain 2,710 0.13 23,139 1.13 -20,429
5 Hill 34,711 1.70 136,983 6.69 -102,272
6 Tarai 164,289 8.02 44,117 2.15 +120,172
C. WESTERN 351,970 17.19 513,547 25.08 -161,577
7 Mountain 3,716 0.18 4,977 0.24 -1,261
8 Hill 54,442 2.66 470,994 23.01 -416,552
9 Tarai 293,812 14.35 37,576 1.84 +256,236
D CENTRAL 665,595 32.51 400,858 19.58 +264,737
10 Mountain 11,991 0.59 81,145 3.96 -69,154
11a Hill + KVa 362,536 17.71 176,882 8.64 +185,654
11b Hill - KVa 32,733 1.60 92,841 4.53 -60,108
11c KVa only 329,803 16.11 84,041 4.10 +245,762
12 Tarai 291,068 14.22 142,831 6.98 +148,237
11 EASTERN 521,946 25.49 674,366 32.94 -152,420
13 Mountain 15,957 0.78 130,446 6.37 -114,489
14 Hill 70,330 3.44 403,380 19.70 -333,050
15 Tarai 435,659 21.28 140,540 6.86 +295,119
NEPAL 2,047,350 100.00 2,047,350 100.00 0
a Kathmandu Valley. Source: Central Bureau of Statistics, Census 2001.
24

NRM Working Paper Series No.3
Section IVEmerging Pattern
Nepal’s average population density in 2001 was 175.9 persons per square kilometer (Table9). Among the development regions, the Central Region had the highest (252), and the Mid West-ern the lowest (103). The population density of the Eastern and Western Regions exceeded thenational average. Eastern tarai and central tarai had the highest density among sub regions, ex-ceeding 450 persons per km2 (Map 16). Western tarai came next with a density of 343 persons perkm2. Western mountain had only 4 persons per km2, while that of far western mountain and midwestern mountain were 51 and 24 persons per km2 respectively. Among hill sub regions, centralhill had the highest density followed by western hill. The population density of Kathmandu Valleywas 1830 per km2.
The estimation of population pressure index (PPI) is based on calories available from fivebasic crops and potato.24 The 15 sub regions can be categorized into four groups according to the
25
Table 9: Select Demographic Indicators
S.N. REGION/ Pop. Growth Ratea Pop. Densityb Pop. Pressure Indexc
Sub region 1991-2001 2001, Km2 2001
A. FAR WESTERN 2.26 127.6 0.85
1 Mountain 1.78 50.7 0.842 Hill 1.75 119.0 0.853 Tarai 3.86 213.0 -3.38
B. MID WESTERN 2.26 103.3 13.384 Mountain 1.71 23.8 1.265 Hill 1.89 116.1 0.396 Tarai 2.80 170.0 -2.18
C. WESTERN 1.92 179.5 -5.017 Mountain 2.23 4.0 -13.098 Hill 1.43 181.8 1.569 Tarai 2.76 352.7 -3.56
D. CENTRAL 2.61 252.1 1.2910 Mountain 1.64 80.7 0.6311a Hill + KVd 2.79 224.3 1.0711b Hill - KVd 1.78 186.7 -11c KVd only 4.23 1,829.9 23.3412 Tarai 2.60 451.4 -3.01
E. EASTERN 1.84 217.0 -0.8013 Mountain 1.12 38.7 0.2414 Hill 1.40 156.0 0.4615 Tarai 2.16 456.2 -3.09
Nepal 2.25 175.9 1.60
d. Kathmandu Valley Source: a Appendix M; b Appendix N; c New ERA. 2003, map 25.

Nepal Regional Strategy for DevelopmentHarka Gurung
June 2005
PPI value. The value categories are 1.07 to 1.58 (fairly high), 0.24 to 0.85 (moderately high), -2.18to -3.56 (low) and -13.09 (extremely low) (Table 9). The three sub regions in the fairly high categoryare western hill, mid western mountain, and central hill (Map 17). The six with moderately high PPIare all in the highlands: three mountain and three hill sub regions. All five tarai sub regions fall in thelow PPI category. As an exception, western mountain has extremely low PPI (-13.09). In contrast,Kathmandu Valley in central hill has an extremely high PPI (23.34).
The low population pressure in the tarai is due to extension of agricultural land as most ofthe inter-regional migration has been rural to rural. This is apparent from the pattern of land usechange in recent decades. Since 1963/64, tarai plains have lost 31.9% in forest and shrub landand gained 47.2% in agricultural and grass land (Table 10). Forest land depletion has been mostextensive in the eastern and central tarai from whence the East-West Highway constructioncommenced. On the other hand, agricultural land expansion has been more pronounced in the farwestern tarai, which has become the new destination of migrants from various sub regions (Map14) and contributing to the highest growth rate (Map 15).
B. Development Level
Regions and sub regions vary in their level of development over time according to themethodology used as exemplified here by four sample data. The first exercise was made on
24 New ERA. 2003. Study Report on Population Pressure Index (PPI) in Nepal. Kathmandu: UNFPA.
26
Table 10: Land Use Change in Tarai, 1963/64 - 2000
SECTION 1963/64a 2001b ChangeHectare Hectare Hectare %
FAR WESTERN Forest + shrub 631,800 489,490 -142,310 -22.5 Agri. + grass 112,845 358,991 +246,146 +218.1
WESTERN Forest + shrub 240,293 191,463 -48,830 -20.3 Agri. + grass 211,323 308,707 +97,384 +46.1
EASTERN + CENTRAL Forest + shrub 654,298 358,074 -296,224 -45.3 Agri. + grass 826,028 1,024,979 +198,951 +24.1
TOTAL Forest + shrub 1,526,391 1,039,027 -487,364 -31.9 Agri. + grass 1,150,196 1,692,677 +542,481 +47.2
Sources: aForest Resources Survey. 1967; p 17; bJapan Forest Technology Association. 2001; pp. 30–31 andsummarized in Appendix Q.

NRM Working Paper Series No.3
Section IVEmerging Pattern
the basis of 40 socioeconomic variables with reference to data of 1977.25 Eastern tarai was rankedfirst among the 15 sub regions (Table 11). Central tarai came next, followed by central hill in thethird place (Map 18). All tarai sub regions were ranked higher than hill and mountain sub regions.Mid western mountain was ranked 14th and far western mountain 15th. Among the five developmentregions, the Central Region led all the others in development level. This was mainly due to the highvalue for Kathmandu Valley (2,327). The Eastern Region was ranked second, and the WesternRegion third. The Mid Western Region was ranked the lowest.
25 Shrestha, R.K. and P. Sharma. 1980. Nepal: Atlas of Economic Development. Kathmandu: NCST.
27
Table 11: Levels of Development, 1977, 1984/85 and 2001
Regional Development Composite CompositeDevelopment Level Development Indicators,1977a 1984/85b Index, 2001c 2001d
S.No. REGION/ Value Rank Value Rank Value Rank Value RankSub region
A. FAR WESTERN 1,160 D 658.5 D 0.36 E 0.2359 E1 Mountain 714 XV 251.0 XIV 0.26 XIV 0.1677 XV2 Hill 1,056 XII 224.0 X 0.30 XIII 0.2574 XIII3 Tarai 1,710 V 183.5 VII 0.52 VIII 0.2826 XII
B. MID WESTERN 1,039 E 679.5 E 0.39 D 0.2771 D4 Mountain 714 XIV 278.5 XV 0.22 XV 0.1877 XIV5 Hill 800 XIII 225.5 XI 0.40 XII 0.3569 VI6 Tarai 1,603 VI 175.5 V 0.55 VII 0.2866 XI
C. WESTERN 1,470 C 532.0 A 0.56 A 0.4363 B7 Mountain 1,166 IX 192.0 IX 0.60 I 0.3208 VIII8 Hill 1,521 VII 180.0 VI 0.58 II 0.6741 II9 Tarai 1,724 IV 160.0 III 0.50 IX 0.3141 IX
D CENTRAL 1,587 A 528.0 B 0.47 C 0.5086 A10 Mountain 1,159 X 249.5 XIII 0.44 X 0.2963 X11 Hill + KVe 1,730 III 115.0 I 0.57 III 0.7420 I12 Tarai 1,873 II 163.5 IV 0.41 XI 0.4876 IV
E EASTERN 1,506 B 554.0 C 0.55 B 0.4332 C13 Mountain 1,142 XI 233.0 XII 0.56 V 0.3426 VII14 Hill 1,375 VIII 186.0 VIII 0.56 IV 0.4602 V15 Tarai 2,002 I 153.0 II 0.55 VI 0.4970 III
NEPAL 1,353 0.47 0.3782
Source: aAppendix O; bNational Planning Commission. 1987; p. 37, table 19; cAppendix P; dTables 5, 6 and 7. eKathmandu Valley

Nepal Regional Strategy for DevelopmentHarka Gurung
June 2005
The second exercise refers to rank-order matrix using 25 socioeconomic indicators toassess levels of regional development for the FY1984/85.26 Accordingly, central hill was rankedfirst and eastern tarai second among the sub regions (Table 11). Except in the Central Region, alltarai sub regions were ranked higher than their adjoining hill sub region. All mountain sub regionswere ranked low, with the mid western mountain ranked the lowest. Among the development regions,the Western Region led, followed by the Central. The Mid Western Region, as in 1977, remainedthe least developed.
A recent exercise on indicators of development at the district level provides comparativedata for regional comparison.27 The indicators used were indexes of (i) economic/infrastructuredevelopment, (ii) empowerment, and (iii) poverty. According to the derived composite value ofdevelopment, western mountain, which was ranked ninth both in 1977 and FY1984/85, is rankedfirst among the sub regions (Table 11). Western hill, which was sixth in the earlier two exercises,is ranked second. Central hill (including Kathmandu Valley) is ranked third. Mid western mountainis ranked last, followed by far western mountain. Unlike in the earlier years, there is no generaldominance of tarai sub regions over their adjoining hill sub regions. The Western Region leadsamong the development regions, as in FY1984/85, and the Eastern Region is placed second. TheFar Western Region emerges as the least developed region in place of the Mid Western.
The present study has used 11 infrastructural, social, and economic indicators to assessregional disparity (Tables 5, 6 and 7). The composite value of these indicators places central hill asthe top ranked followed by western hill (Table 11 and Map 19). The other sub regions exceeding theaverage composite value are eastern tarai, central tarai, and eastern hill. Mountain sub regions ofthe Mid Western and the Far Western Regions are ranked 14th and 15th respectively. Amongdevelopment regions, as in 1977, the Central ranks first. The second place is taken by the WesternRegion superseding the Eastern. The Far Western Region now ranks last, replacing the MidWestern, which was placed so in 1977.
What is the emerging pattern of regional level of development over the quarter century? In1977, those with high level of development included three tarai and two hill sub regions. By 2001,such level of development included three hill and two tarai sub regions. There were no tarai subregions in the low value category in 1977. In 2001, two tarai sub regions fall in such category. Thatcentral hill replaced eastern tarai in the top rank, and western hill eastern tarai in the secondindicates a spatial shift in development level by elevation zone. There has been no change in theranking of central mountain (10th), mid western mountain (14th), and far western mountain (15th).According to the development regions, the Central Region led both in 1977 and 2001; the Westernreplaced the Eastern in the second place, and the Mid Western Region replaced the Far Westernin the fourth.
26 National Planning Commission. 1987. Chhetriye Bikashko Sthiti (Status of Regional Development). Draft inNepali. Kathmandu: Mimeo, 40 pages.
27 International Center for Integrated Mountain Development (ICIMOD). 2003. Districts of Nepal: Indicators ofDevelopment, Update 2003. Kathmandu.
28

NRM Working Paper Series No.3
Section IVEmerging Pattern
LEGEND
2.79 – 3.86
2.16 - 2.76
1.12 – 1.89
Source: Table 9
High
Medium
Low
1.78
1.75
3.86
1.71
1.89
2.80
2.23
1.43
2.76
1.64
2.79
2.60
1.12
1.40
2.16
4.23
29

Nepal Regional Strategy for DevelopmentHarka Gurung
June 200530
Source: Table 9

NRM Working Paper Series No.3
Section IVEmerging Pattern
31
Source: Table 11
Source: Table 11

Nepal Regional Strategy for DevelopmentHarka Gurung
June 2005
V. SPATIAL FRAMEWORK
Development planning has to encompass the totality of national space since regions varyin natural endowment and human resources. Regional approach should address theirinterrelationship into a coherent spatial framework for growth and equity. This chapter deals withfour significant aspects for regional strategy in national planning: (a) land use, (b) road infrastructure,(c) industrial location, and (d) urban system.
A. Land Use
Economic activity is determined by the type of land resources available. With the exceptionof a rare case of a policy statement in the Fifth Plan (1975–80), Nepalese plans have entirelyoverlooked the aspect of land use. Even the Agricultural Perspective Plan that makes a strongcase for linking agriculture productivity with road access makes no reference to this crucial basisof agriculture. Since land use data have been very little used in planning, there has been persistentconflict among the various sectoral master plans, be they of agriculture, forestry or irrigation.28 Forinstance, the tarai has been much emphasized both for agriculture and forestry but has undergonesignificant land use change since the commencement of the malaria control program in late 1950s.During the period 1963/64–2000, the tarai experienced a decrease of 31.9% in forest land againstan increase of 47.2% in agricultural land (Appendix R). The cause was in-migration, and theconsequence was progressive accentuation of population from the east to far western tarai.
The first scientific assessment of Nepal’s land use status was made available through theLand Resources Mapping Project (LRMP).29 The LRMP data, based on aerial photographs takenduring 1977/78 and mapped at scale of 1:50,000, are available by physiographic regions at thedistrict level. Unfortunately, the designation of some physiographic regions is inappropriate.30 Infact, the so-called ‘High Himalaya’ and ‘High Mountain’ can be collapsed into the mountain zone,while ‘Middle Mountain’ actually corresponds to the hill zone (Table 12A and Appendix R). The‘Siwalik’ refers to the foothill zone, including the inner tarai. According to the LRMP data, 42.8% oftotal land surface of Nepal was categorized as forest land. The remaining major land use categorieswere agriculture (cultivated) 20.1%, agriculture (non-cultivated) 6.7%, ‘grazing’31 11.9%, and others18.5% (Table 12A). Forest land was distributed as 34.9% in hill zone, 32.8% in foothill and tarai,and 32.3% in mountain zone. The hill and tarai zones each had a share of 41% of cultivated land.Over two-thirds of non-cultivated agricultural land was confined to the hill zone. Of the 2.9 millionhectares of cultivated land, 28.3% was in the Eastern Region (Table 12B). The Central Region hadover one-fourth and the Western Region a fifth (Map 20). The Far Western Region had only about10% of such land. The proportion of non-cultivated agricultural land similarly increased progressivelyfrom west to east. ‘Grazing land’ was very extensive in the Mid Western Region, while it was lessimportant in the Central Region. The Mid Western Region also led in forest land as well as in the‘others’ type of land use category.
28 Gurung, H. 2000. Nepal: Land use in mountain environment. Environment and Agriculture. Jha, P.K. et al. eds.Kathmandu: ECOS: 269–280.
29 Kenting Earth Sciences. 1986. Land Resources Mapping Project: Economics Report. Kathmandu.30 Gurung, H. 2000. Nepal: Land use in mountain environment. Environment and Agriculture. Jha, P.K. et al. eds.
Kathmandu: ECOS: 269–280.31 The more appropriate designation would be grassland.
32

NRM Working Paper Series No.3
Section VSpatial Framework
Table 12A: Land Use Categories by Physiographic Division, 1977/78(%)
S.No. Physiographic Agriculture, Agriculture, Grazing Forest Others Total Divisiona Cultivated Non-Cultivated
1 High Himalaya 0.3 0.2 50.5 3.5 81.8 22.72 High Mountain 8.3 14.9 29.1 28.8 9.0 20.13 Middle Mountain 41.2 67.5 16.7 34.9 2.2 30.14 Siwalik 8.7 5.6 1.2 23.4 2.7 12.85 Terai 41.6 11.9 2.7 9.4 4.3 14.3
Total 100.0 100.0 100.0 100.0 100.0 100.0
Row 20.1 6.7 11.9 42.8 18.5 100.0
aLRMP designation;Source: Appendix Q
33
Source: Table 12

Nepal Regional Strategy for DevelopmentHarka Gurung
June 2005
Table 12B: Land Use Categories by Development Region, 1977/78(%)
S.No. Development Agriculture, Agriculture, Grazing Forest OthersRegion Cultivated Non-Cultivated
1 Far Western 9.7 11.3 12.2 16.6 10.12 Mid Western 15.3 17.9 44.6 27.4 41.73 Western 19.9 23.0 24.9 16.8 22.74 Central 26.6 23.8 8.1 21.1 8.75 Eastern 28.3 24.0 10.1 18.1 16.9
Total 100.0 100.0 100.0 100.0 100.0
Row % 20.1 6.7 11.9 43.8 18.5
Source: Appendix Q
The purpose of this recapitulation of forestry and LRMP data is to highlight the importanceof land use planning for economic development. Such base-line data are the very tools of economicplanning. The most significant finding of the LRMP mapping is that 986,658 hectares, or one-thirdof the total agricultural land, remains non-cultivated. This is also evidence of registered landexceeding cultivated holdings by a factor of 2.3:1 (Table 7). These data raise some relevantquestions on the non-use of such agricultural land. Is it due to agricultural extension on marginalland or depopulation of such areas? These questions are important for a country that is said to beoverpopulated (Table 9 and Fig. 17). Therefore, land use planning should constitute an essentialpart of national planning for optimum utilization of available land resources.
B. Transport Access
Another important aspect of spatial framework relates to transport infrastructure, whichdetermines the future pattern of development. The north-south road linkages have now becomemore extended than when the concept of growth axes was first mooted, and these have beensuperseded by the East-West Highway with considerable change in the arterial route system. Yet,there is a lack of economic articulation based on such a vast infrastructural investment. In spatialplanning terms, the East-West Highway should be developed as the spine of national development,with the north-south roads as a series of ribs for lateral diffusion.32 Most north-south roads still endup as cul-de-sacs in the hill zone. Some of these should be extended further north, giving priorityto those that can provide access to future sites of hydropower generation and to TAR. There wouldhave been no controversy on the cost and environmental aspects of Arun-III if the 104 km accessroad had been in place as envisaged in the Fourth Plan (1970–1975). It is also necessary toprovide road access from TAR to some remote areas for export of their products. The priority onesidentified are Hyulsa-Simikot, Nyechung-Beni, Rasuwagarhi-Shyabrubensi, and Dhankuta-Kimathangka (Map 21). The reality of the East-West Highway as the pivotal axis will also entailreconsideration on other policy areas, such as industrialization and urbanization, which arediscussed below in Sections C and D.
32 Gurung H. 1989b. Regional Patterns of Migration in Nepal. Honolulu: East-West Centre.
34

NRM Working Paper Series No.3
Section VSpatial Framework
A study on goods transit from India and China through Nepal has identified three possibleroutes: (i) Birganj-Tatopani, (ii) Biratnagar-Tatopani, and (iii) Bhairawa-Tatopani.33 All three routesare assumed to pass through Kathmandu and exit at Tatopani. This scheme has overlooked theproblem of Kathmandu as an emerging bottleneck and the advantage of other alternative routes,such as the Bardibas-Banepa and the Galchhi-Shyabrubensi roads. A more rational strategyrecommended, in order to avoid the congestion of Kathmandu, is a direct passage from Bardibas-Banepa to Tatopani and Galchhi-Shyabrubensi to Rasuwagarhi.
A recent ADB agreement on north-south road connectivity refers to Birganj-Rasuwagarhicorridor through Kathmandu.34 This proposed road connectivity should bypass Kathmandu as aGalchhi–Shyabrubensi alignment would provide a more direct link. Similarly, the above agreementhas endorsed the feeder road, Basantpur-Khandbari via-Chainpur in eastern hill; however, it seemsto ignore the advantage of a valley alignment against a ridge road. The most cost effective alignmentwould be from Pakhribas to Khandbari along the Arun valley.
One infrastructure asset that has remained under-utilized in Nepal is air transport.35 Thecountry has a high density of airports, an average of 3000 km2 per airport (including Short TakeoffLanding). The 49 airports cover 37 districts, of which Solu-Khumbu (3), Chitwan (2) and Kailali (2)have more than one. Despite the presence of a dozen domestic airlines, the movement of passengerand cargo is very low due to the poor capacity of private carriers and preference for tourist-orientedroutes. There is a need for better regulation of private airlines in the domestic sector.
C. Industrial Location
Industrial development in Nepal commenced from ‘gateway towns’ near railheads alongthe Indian border.36 Subsequently, a number of industrial estates were established, but with awrong interpretation of the concept. Originally, ‘industrial estates’ were devised to revive the economyof depressed areas (U.K.), and industrial de-concentration from large cities (India). In Nepal, theconcept was implemented in reverse, that is, at the most advantaged locations (Kathmandu,Patan, Dharan, Hetauda, and Nepalgunj) and also for large-scale industries. There was no deliberateattempt of industrialization with an estate package for backward hill areas.
Presently, incentives for industrial location are provided on the basis of administrative districtsgrouped into five categories.37 Income tax rebates vary from 10% for more developed areas to60% for the least developed areas. In the case of excise duty, the rebates range from 10% for theformer to 35% for the latter. The above levels are too marginal to influence the choice of industriallocation, considering the immense administrative, infrastructural, marketing, and export advantagesof Kathmandu and tarai towns. Moreover, categorization of incentives by administrative districtsinstead of specific locations is unscientific.
33 Shrestha, A. 2003. A Study on Transit of India Goods to TAR Autonomous Region of China through Nepal. Reportto Nepal Intermodal Transport Development Board. Kathmandu.
34 ADB. 2004b. Aide Memoire on Road Network Development Project and Transport Connectivity Project. Manila.35 Okada, F. E. 1970. Preliminary Report on Regional Development Areas in Nepal. Kathmandu: NPC. The estimate
of transport cost per ton per mile was NRs 11.10 by air, compared to NRs 15.00 by porter.36 Sharma, P. 1989. Urbanization in Nepal. Honolulu: East-West Centre.37 Nepal Gazette. 1992. Industrial Enterprises Act 2049. Kathmandu: His Majesty’s Government of Nepal.
35

Nepal Regional Strategy for DevelopmentHarka Gurung
June 2005
The scheme proposed for industrial location includes two components: industrial complex andindustrial estate. The first type, Industrial Complex, to be located at road junctions along the East-West Highway, should be provided with full range of infrastructure facilities (energy, water, finance)and maximum fiscal incentives. Map 21 indicates eight such potential locations for large-scaleindustries to process goods both for domestic consumption and export. These are from west toeast, Atariya, Kohalpur, Lamahi, Butwal, Bharatpur, Hetauda, Dhalkebar, and Itahari. The secondtype, Industrial Estate, an agglomeration of small and medium size industries, should be for hill andmountain areas, since movement of goods along the north-south roads has been mostly one waywith very little export from these hinterlands. Such places could be Patan (Baitadi), Dipayal, Jumla,Jomsom, Batar, Panchkhal, and Khandbari for processing local products for export to the south ornorth according to the transport connection (Map 21). Among these, Batar and Panchkhal shouldbe developed for deflection of industries from Kathmandu Valley. These industrial estates, due totheir disadvantageous location, should be promoted with a higher level of incentives than industrialcomplexes of the first type.
36

Sec
tion
VS
patia
l Fra
mew
ork
NR
M W
orki
ng P
aper
Ser
ies
No.
337

Nepal Regional Strategy for DevelopmentHarka Gurung
June 2005
D. Urban System
The last aspect of spatial framework is related to the urban system. Traditional towns ofNepal have been parasitic nodes, basically for the retailing of Indian commodities. The expansionof road networks in the hills without complementary economic activities has further reinforced thissouthward orientation. There is yet another problem regarding many settlements that have beendesignated as urban: the high increase in urban population reported in the censuses is due not tothe change in their economic structure as such but to the dubious definition of urban areas. InNepal, urban areas are designated primarily on the basis of population size (+10,000), and thenumber of such designated municipalities increased from 33 in 1991 to 58 in 2001. Most of thesesettlements are rural in character but have been upgraded to municipal status because theirboundaries have been gerrymandered so as to qualify for a larger population size. This is evidentfrom their functional character based on the economic activity of their resident population. Of thetotal urban population of 58 designated localities, one-third is still involved in primary occupation(Table 13A). In the case of hill municipalities, nearly half the population is involved in such occupation.Of the 20 hill municipalities, only three have one third of their population involved in non-primaryoccupation (Table 13B). In the tarai, 12 out of 25 municipalities fall in this category of higher level ofurbanization. In Kathmandu Valley, three out five municipalities have less than one-third of populationin non-primary occupation.
Table 13A: Occupation in Municipalities, 2001Economically active population 10+ yrs.
(%) Hill Kathmandu Inner Tarai Tarai Total
Valley
Primary(Agri. / Forestry / Mining) 49.0 14.7 42.1 34.5 32.2Secondary(Manufacturing / Construction) 15.9 24.6 20.5 21.5 21.2Trade(Retail / Hotel) 18.4 27.6 18.7 22.8 22.9Services(Transport / Education / Health) 16.4 32.3 18.5 21.1 23.3
Total 100.0 100.0 100.0 100.0 100.0
Table 13B: Occupation in Municipalities, 2001Proportion in Primary Occupation
(%)
Proportion Hill Kathmandu Inner Tarai Tarai TotalValley
Over 50% 15 - 2 7 2433-50% 2 2 4 6 14Less than 33% 3 3 2 12 20
Total 20 5 8 25 58
38

NRM Working Paper Series No.3
Section IVDecentralization Exercise
Urbanization characterizes a dynamic region, which encompasses more than mere populationsize. First, the definition must be rationalized to encompass other significant criteria, such as non-primary occupation, density of population, and contiguity of built-up area.38 Second, there shouldbe a design of rank order for urban areas to articulate functional linkages in terms of their populationsize and range of activities. This will need more rigorous analysis of spatial economic structurethan that is presently available from traffic and price data. The third is to integrate economicfunctions to the administrative centers, such as regional and district headquarters, most of whichare no more than civil service colonies. A field survey in 1974/75 of Pokhara, the regional center ofthe Western Development Region, estimated the number of government employees to be aboutone-third, and possibly more, of all wage workers in the town.39 In the late 1970s, Pokhara had 67offices of regional, zonal, and district levels with an annual expenditure of NRs 10 million in salaryand allowances.40 Surkhet, renamed Birendranagar, was a mere hamlet until it was designatedthe regional center of the Far Western Development Region in 1972. It recorded a population of13,859 in 1981. In 1986, it had 81 regional and district level offices, with 2,031 administrativepersonnel (Table 14). The suggestion for consolidation of districts is to have less of suchadministrative towns but create the few into poly-functional ones. They are devised into threehierarchies: the first hierarchy consists of five towns, including Kathmandu, which are to functionas regional centers. The next hierarchy includes the district headquarters, which would number20, excluding the five regional centers. Of these, 11 are new sites proposed for their advantageouslocation (Map 21). The headquarters of former districts (designated as Ilaqa or sub-district), divestedof administrative status (63), should form the third hierarchy as service centers.
VI. DECENTRALIZATION EXERCISE
Decentralization has been an incessant theme in Nepal over the last five decades. Pastinitiatives, though, have all foundered on the bedrock of the highly centralized governance systemof the country. Even now, the central government and the traditional bureaucracy do not seemamenable to some form of local autonomy. This chapter commences with a critical review ofdecentralization efforts in Nepal. It is followed by suggestions on district consolidation and resourcemobilization to strengthen the process, and also observations on social inclusion as mandated inthe study’s terms of reference.
A. Critical Assessment
The Decentralization Act, 1982, and its Rules, 1984, entrusted districts the responsibility ofpreparing annual and periodic plans. In the past, such legal provisions had remained mere proceduralformality. However, the Dhading District Development Project in 1983 came with budget supportfor local development programs, all of whose activities were co-coordinated through the DistrictPanchayat aided by a technical office. The experience of the Dhading District Development Project
38 Sharma, P. 1989. Urbanization in Nepal. Honolulu: East-West Centre. Appendix 2 cites the case of India, whereurban localities are defined on the basis of minimum population of 5,000, occupation structure with over 75% innon-agriculture, and continuous built-up area.
39 Blaikie, P., J. Cameron, and D. Seddon. 1977. The Effects of Roads in West Central Nepal. Norwich: Report toODA.
40 Gurung, Harka. 1978. Distribution pattern and cost of administration in Nepal. Development and AdministrativeStudies. 1(1): 1–18.
.39

Nepal Regional Strategy for DevelopmentHarka Gurung
June 2005
was replicated in the districts of Gorkha and Lamjung. The project emphasis was on horizontallinkage through a facilitating of interrelationship between organizations and beneficiaries, as wellas between elected, governmental, nongovernment organizations, and private sector entities.
Participatory planning received further impetus with United Nations DevelopmentProgramme involvement in local governance through a series of projects. This commenced witha technical support component in 1985 that became the Strengthening Decentralization PlanningProject in 1989.41 Some new initiatives have been taken towards decentralization since therestoration of democracy in 1990. The Constitution of Nepal, 1990, enshrines the concept of popularparticipation through decentralization as one of its basic principles. Acts and Rules relating todistrict development committees (DDC), village development committees (VDC), and municipalitieswith increased authority and responsibility were promulgated in 1992. With the legitimization oflocal authorities by democratic parliament in 1992, the Strengthening Decentralization PlanningProject was designated as Decentralization Support Project. The project objectives included: (i)assistance in implementation of decentralization policy, (ii) support to districts in planning andmonitoring, and (iii) decentralized development management.
In 1995, the Decentralization Support Project was replaced by the Participatory DistrictDevelopment Project. This Project was aimed at enhancing the capacities of DDCs and VDCs aswell as helping them establish linkages with local organizations, line agencies, nongovernmentorganizations and the private sector. Collection and analysis of data at the grassroots level, usingGIS, and basic planning and monitoring techniques were made the routine activities of the DDCs.Handbooks on good governance and decentralization were prepared for the VDC level. It hassince been expanded under the name of Local Governance Programme. These measures werefollowed by the promulgation of Local Self-Governance Act, 1999. It is too early to conjecture onthe effectiveness of this Act, as its provisions are more in the nature of delegation of authorityrather than devolution of power.
One of the constraints to effective decentralization has been the obduracy of the sectoralapproach. The line agencies are an extension of sectoral ministries whose programming is basicallyincremental (some increase over the preceding year) and not according to the needs of districts.Their program targets are also based on disaggregation of sectoral budget ceiling withoutconsideration to local requirements. Thus, decentralization remains ineffective as the localadministration have no control over the line agencies, which have access to resources and technicalexpertise. Such a vertical command system is mainly responsible for the problem of lack ofintegration among sectoral agencies at the operational level. Since the formation of developmentregions in 1972, various ministries established their regional offices at the designated regionalcenters (Kathmandu, Dhankuta, Pokhara, and Surkhet). In Surkhet, for instance, there were 23such offices with 484 personnel (Table 14). However, there was no adequate delegation of authority,thereby leading to these regional offices becoming a redundant hierarchy between the central anddistrict levels.
41 Lundberg, P. 1997. UNDP Support to Democratic Decentralization in Nepal. Islamabad.
40

NRM Working Paper Series No.3
Section IVDecentralization Exercise
The regional offices were established after the dismantling of Directorate-General officesof the various sectoral ministries. However, some of the Directorate General offices have nowbeen revived, thus, making the regional hierarchy superfluous. Programming of activities by theNPC continues to be sectoral according to the work division of members (agriculture/forestry,transport, social service, etc.). Thus, NPC’s periodic reviews, carried out on a sectoral basis,make no consideration of the impact of development activities at the regional level. Similarly,budget allocation and data presentation of the Finance Ministry, in the Budget Speech and EconomicSurvey, are done entirely according to activity sectors and make no reference to the developmentregions. Again, development regions exist only in formality without any functional authority forcoordination of activities. The recent appointment of Regional Administrators has been motivatedmainly from security urgency rather than development concern.
There has been little breakthrough in decentralization despite numerous initiatives, andone observer refers to more than 13 high-level commissions and task forces in this endeavor.42
The problem lies with the highly centralized government structure of Nepal that is loathe to delegateauthority. In other words: The people who control power are evidently afraid of actually allowingpeople to share this power.43 Thus, legislations with preambles of devolution and local governancehave become instruments of delegation of responsibility not authority. A realistic approach towardsdecentralization needs first to clarify the confusion between delegation of central functions anddevolution of authority to local entities. This implies a drastic change in concept on the relationshipbetween the central government and the district hierarchy. Decentralization effort in Nepal hasfailed due to the command system and economic fragility of the districts. District autonomy isfeasible only through consolidation of their economic base with a wider tax authority and revenuesharing of income from local resources.
B. District Consolidation
The districts cannot exercise autonomy without an adequate resource base. Therefore,the problem of decentralization has less to do with the legal framework or implementation strategyfor local governance. It is basically related to the economic strength of the districts.
42 Gurung, H. 1999. Area Planning in Nepal: Review of Experiences. Report commissioned by InternationalCenter for Integrated Mountain Development.
43 Mikesell, S.L. 1999. Class, State and Struggle in Nepal: Writings 1989–1995. New Delhi: Manohar.
41
Table 14: Offices and personnel, Surkhet, 1986
Personnel
Category of Office No. of Gazetted Non-gazetted Total PersonnelOffices
1. Regional level 23 105 379 4842. District level 20 34 779 8133. Others (corps, bank, projects, etc.) 38 61 673 734
Total 81 200 1,831 2,031
Source: Regional Planning Office, Surkhet, Personal communication, dated 16 November 1987.

Nepal Regional Strategy for DevelopmentHarka Gurung
June 2005
The Rana regime managed the then road-less country with 33 districts. In 1963, the number ofdistricts was increased to 75 under a zonal hierarchy, with the objective of wider political mobilizationfor the Panchayat regime.44 Such a proliferation of district units did not consider the economicfactor and they have ever remained dependent on the central subsidy. Thus, fragile districts havebecome the bedrock against which decentralization efforts have floundered. It is futile to conceiveof decentralization, least of all autonomy, when local bodies have to subsist on central dole.
The present administrative districts have no capacity for being agents of decentralizationdue to their poor economic base. According to their annual income and regular expenditure status,only 11 out of 75 districts are in surplus. These are Kathmandu, Lalitpur, Sindhu-Palchok, Chitwan,Banke, Kapilvastu, Rupandehi, Bara, Dhanusa, Morang, and Jhapa.45 With the exception of Chitwan,with its income from national park revenue, the surplus of other districts is entirely due to customsrevenue (Table 18). A reduction in number of districts seems a logical option to economizeadministrative expenses, since there is a limit to an increase in local revenue. At the same time,there has been much extension of roads, airports, and telecommunication facilities. These havenarrowed geographic space in terms of travel time, enabling the administration of much largerareas. The proposal of district consolidation is to reduce the number of administrative districts to25, one-third of the number that presently exists. The new districts are based on regrouping of twoto four current districts that are geographically contiguous (Map 21 and Appendix S). The present75 districts should be relegated to the status of Ilaka, or sub-district level, with their headquartersconverted to service centers. Regulatory functions of the government should be located only in theheadquarters of the enlarged districts. Such a consolidation will directly contribute to the reductionof wide divergence among districts in their size, population and revenue. The average area of adistrict will increase from 1,962 km2 to 5,887 km2, and their average population size from 209,529to 928,585 persons. Average district revenue will be NRs 1,715 million, compared to NRs 572million of 75 districts. Savings in annual regular expenditure will be NRs 23,016 million.
Such a rationalization of sub-national political units should also be extended to the lowerhierarchy: VDCs. The number of VDCs has fluctuated from 3,912 since 1963, to 3,000 after theSecond Amendment of the Constitution (1975), to 4,023 in 1982, and 3,908 presently. Of the totalbudget of NRs 630 million allocated in 1998/99 to the districts, 30.2% was for VDC secretaries. Ifthe number of VDCs were to be reduced by half, there would be a regular budget saving of NRs 95million annually.
C. Resource Mobilization
The basic problem of decentralization has to do with the fragile economic base of localbodies, be it at the district or village level. This has a direct implication on their extent of clout in thecontest of power-sharing as well as capacity to finance the plans they formulate. The hard realityis that the income of most districts is abysmally low. A sample survey of 15 districts, representative
44 Thapa, B. (Chairman). 1961. Report of the Committee on Development District and ZonalDivision. Kathmandu: National Guidance Ministry.
45 Gurung, H. 2002. Fragile districts: Futile decentralization. Readings on Governance and Development.pp. 1–27; published as monograph by SID/Nepal, 2003.
42

NRM Working Paper Series No.3
Section IVDecentralization Exercise
three elevation zones and five development regions, showed their average annual income to beNRs 2.9 million for a 5-year period (1992/93–1996/97).46 Over a third of this income was from‘other’ sources, about a quarter from land revenue, and a fifth from contract fees. The averagefive-year income of DDCs, by elevation zones, varied from NRs 0.57 million in mountain, NRs 1.93million in hill, and NRs 6.21 million in tarai districts. The major part of even their administrative costwas provided through the central budget, even more so in the case of VDCs.
The proposal to reduce the number of districts will considerably enlarge their area ofcoverage. It will reduce their administrative cost by two-thirds, with a saving of over NRs 23,000million in annual recurring expenditure. A larger area would also mean a wider revenue base. Butthe important agenda of district consolidation needs to be resource mobilization. This would requiredelegation of more functions to local bodies instead of expansion of central administration, whichhas stunted local initiative and capability. Consolidated districts with enhanced resource could beentrusted with some localized functions presently administered by the central government.
Remote mountain districts have the lowest revenue. Yet, they generate much resourcewhich is diverted to the central exchequer. If the scheme of revenue sharing, as in the buffer zoneof national parks, was to be adopted, districts with tourism activities would be much richer.47 Thiscan be exemplified by the by the case of two districts: in 1995, the Everest area generated tourismrevenue of $869,120 through climbing royalty, trekking fee, and park entrance fee. This amountedto NRs 44.2 million, or 2.6 times more than the district’s total revenue. If half of this was to beretained in Solu-Khumbu, the amount would be 7.6 times that of the central grant to the district.Similarly, upper Mustang yielded $737,100 from 1,053 trekkers in 1998. It amounted to NRs 51million, or 12.2 times that of the district’s total revenue. Of this income, 3.3% went to the AnnapurnaConservation Area Project and the rest to the central exchequer. If this amount was to be shared,Mustang would have eight times more revenue than the central grant to the district.
There is even the case of poor mountain districts subsidizing the central government.Designated mountain districts have been receiving project grants under the Remote AreaDevelopment Programme since 1969. For the four years, 1998/99-2001/2002, this grant totaledNRs 310 million (Table 15). During the same period, royalty from climbing expeditions was NRs460 million that went to the government. Each year, the government income from climbing royaltyexceeded that of its grant to mountain districts. In other words, such mountain districts yieldedover NRs 37 million annually to the central exchequer.
Districts can function as autonomous bodies only if they have an adequate resource base.This would mean curtailing the present highly centralized budgetary allocation system, insteadempowering districts with more taxation authority. Another mechanism to enhance district rev-enue would be the allocation of a certain percent of revenue generated from the extraction of thedistrict’s natural resources. Accordingly, mountain/hill districts with hydroelectric projects and taraidistricts with commercial timber would have considerable revenue even with a nominal percent-age share.
46 Institute of Sustainable Development (ISD). 1998. A Study on the Status of Human Priority Concerns at Sub-regional Level. Kathmandu.
47 New ERA. 2004. Impact Assessment of Buffer Zone Programme in Nepal. Kathmandu: UNDP.
43

Nepal Regional Strategy for DevelopmentHarka Gurung
June 2005
D. Social Inclusion48
The state ideology of Nepal, based on the caste system, has remained highly exclusionary.It has religious, linguistic and cultural dimensions. The first refers to the primacy of the Hindureligion, which sanctifies the caste system. State advocacy of a particular religion militates againstequality in practicing other faiths. While the western concept of ‘race’ has a connotation of color,the Hindu version of untouchability also has a racial basis, as impure status is based on one’sbirth. This ideology perpetuates a high caste hegemony in politics, which further marginalizes lowcastes and ethnic groups in the economic sphere. Other major discriminations are related toculture and language, whereby ethnic and regional groups are marginalized. The State’s alignmentto Hindu religion, and the continued social exclusion of millions of people has economic and politicalramifications. Since most of the marginalized remain poor, they have less access to education andare trapped in a vicious circle of poverty.
The hill high castes constitute 31.1% of Nepal’s total population. Their literacy rate isabove the national average (Table 16). They also constitute 62.2% of the highly educated and66.2% of the governance elite. The proportion of their population living below the poverty line is 34–50%. At the other extreme are the Dalit, with very low literacy level, only a few in governance, andhigh poverty levels of 65–68%. The Newar of the capital region are the most advantaged, with highliteracy and a large share in governance, and with only one-fourth of their households below thepoverty line. The Janajati constitute 30.1% of the total population but only 8% among the governanceelite. Their situation has been alleviated partly due to mercenary service and remittance. Table 18also highlights the importance of education, in that the proportion of graduates and governanceelite show close correspondence. However, that hill high castes, with less than one-third of thetotal population, constitute two-thirds of the governance elite is indicative of their entrenchedmonopoly in the power structure. In Nepal, where different regions are inhabited by variedsociocultural groups, it is necessary to reconcile economic and social aims within the frameworkof national development. However, the Hindu ideology of Nepal is discriminatory to two particularsocial groups in Nepal. These are the indigenous people (Janajati), on the basis of culture, and the
48 Gurung, H. Forthcoming. Inclusive human development. Chapter III in Nepal: Readings in HumanDevelopment. Kathmandu: UNDP.
Table 15: Expedition Revenue and RADPa Budget(NRs ‘000)
Fiscal Year (A) Climbing royaltyb (B) RADPc budget B as % of A
1998/99 84,989 68,944 81.21999/2000 119,839 57,595 48.12000/2001 127,394 90,442 71.02001/2002 128,185 93,912 73.3
Total 460,407 310,893 65.5Increase, 1998/99 – 2001/2002 50.8 36.2
a Remote Area Development ProgrammeSource: b Finance Ministry. 2002; table 9.16 c Finance Ministry budget allocation by fiscal year.
44
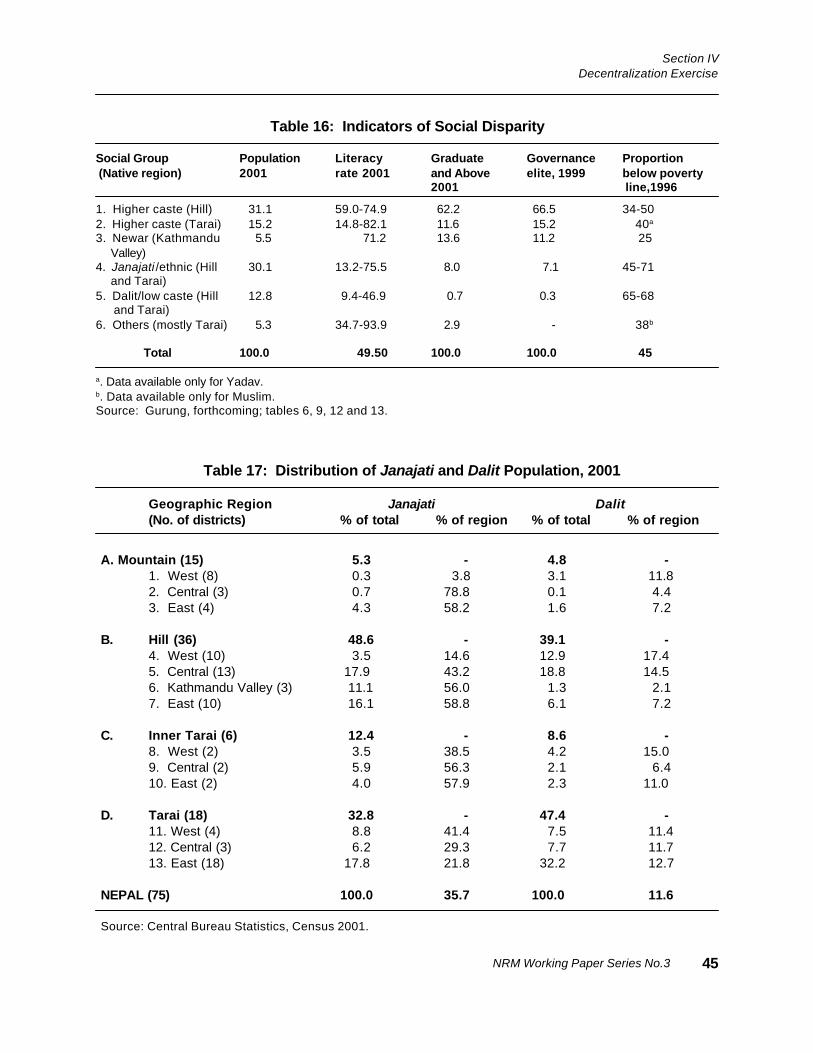
NRM Working Paper Series No.3
Section IVDecentralization Exercise
45
Table 17: Distribution of Janajati and Dalit Population, 2001
Geographic Region Janajati Dalit(No. of districts) % of total % of region % of total % of region
A. Mountain (15) 5.3 - 4.8 -1. West (8) 0.3 3.8 3.1 11.82. Central (3) 0.7 78.8 0.1 4.43. East (4) 4.3 58.2 1.6 7.2
B. Hill (36) 48.6 - 39.1 -4. West (10) 3.5 14.6 12.9 17.45. Central (13) 17.9 43.2 18.8 14.56. Kathmandu Valley (3) 11.1 56.0 1.3 2.17. East (10) 16.1 58.8 6.1 7.2
C. Inner Tarai (6) 12.4 - 8.6 -8. West (2) 3.5 38.5 4.2 15.09. Central (2) 5.9 56.3 2.1 6.410. East (2) 4.0 57.9 2.3 11.0
D. Tarai (18) 32.8 - 47.4 -11. West (4) 8.8 41.4 7.5 11.412. Central (3) 6.2 29.3 7.7 11.713. East (18) 17.8 21.8 32.2 12.7
NEPAL (75) 100.0 35.7 100.0 11.6
Source: Central Bureau Statistics, Census 2001.
Table 16: Indicators of Social Disparity
Social Group Population Literacy Graduate Governance Proportion (Native region) 2001 rate 2001 and Above elite, 1999 below poverty
2001 line,1996
1. Higher caste (Hill) 31.1 59.0-74.9 62.2 66.5 34-502. Higher caste (Tarai) 15.2 14.8-82.1 11.6 15.2 40a
3. Newar (Kathmandu 5.5 71.2 13.6 11.2 25 Valley)4. Janajati /ethnic (Hill 30.1 13.2-75.5 8.0 7.1 45-71 and Tarai)5. Dalit/low caste (Hill 12.8 9.4-46.9 0.7 0.3 65-68 and Tarai)6. Others (mostly Tarai) 5.3 34.7-93.9 2.9 - 38b
Total 100.0 49.50 100.0 100.0 45
a. Data available only for Yadav.b. Data available only for Muslim.Source: Gurung, forthcoming; tables 6, 9, 12 and 13.
Nepal Regional Strategy for DevelopmentHarka Gurung
June 2005
low castes (Dalit), on the basis of untouchability. One may consider whether their problem ofexclusion could be mitigated through decentralization. This would obviously depend on the spatialdistribution pattern of these disadvantaged groups. The pattern refers not to their spread acrossregions and sub regions but their proportion within the political units (district or VDC). Such aspatial pattern, however, would have relevance only for the Janajati who constitute a significantproportion (+40%) of population in ten geographic regions and are in majority in five (Table 17). TheDalit as artisan dependents of the high castes happen to be in absolute minority in all regions anddistricts. They are in substantial proportion, 13–19%, only in the central and western hill sub regions.The pattern of their range of population by region and districts can be used as an indicator forfocusing target programs. But intervention measures for social inclusion would have to addressthe basic issues of a State ideology that perpetuates sociocultural discrimination.
The agenda of social inclusion has political, sociocultural, and economic ramifications.The political aspect needs to consider a secular constitution, proportional representation, andmore authority to local governments. Such autonomy should be more than delegation of authorityand, instead, be for devolution. The sociocultural aspect should encompass religious and linguis-tic equality and a reservation system. In the economic sphere, the need is for affirmative action ineducation and employment for the disadvantaged groups. Affirmative action should be targeted atthe most disadvantaged within the categorized social groups. There are two rationales as to whysocial inclusion through such measures deserves serious consideration: first, social exclusion isnot the problem of the Janajati and the Dalit alone. Since these social groups constitute half of thetotal population, it is a national problem, as the country’s intrinsic human resource is emasculated;second, targeting development towards these marginalized groups would directly contribute topoverty reduction, as most of them happen to be poor due to social discrimination.
VII. BEYOND THE BORDER
This chapter attempts to outline Nepal’s development strategy in a wider regional context.However, one also needs to consider the complex nature of state relationship. As most internationalboundaries traverse a shared culture area, statements on the commonality in language and religionare mere rhetoric. The historical reality is that political conflicts are more like to occur amongstneighboring states, since competition for resources occurs between proximate countries. It issuch a heritage of contest that constraints regional cooperation in most cases. Regional strategyhas to consider not only the economic articulation among regions within the country but also therelative development level immediately across the border. Nepal is sandwiched between Chinaand India and there is substantial difference in the nature of its boundary with these two giantneighbors. The northern one, with China (1,111 km), lies across high mountains and is regulatedby a passport system. The Indo-Nepal border (1,808 km) to the west, south, and east is mostlyalong the plains and unrestricted for human movement, according to the Treaty of Peace andFriendship 1950. In geopolitical terms, the northern one is a ‘boundary’ while that along India is a‘frontier’. The contrast between these two types of borders is dramatized by Nepal’s southernorientation economically, as evidenced by customs revenue.
46

NRM Working Paper Series No.3
Section VIIBeyond the Border
Of the total revenue of FY2000/2001, NRs 10,724 million, or 87.3%, was from the 19customs points along the Indian border (Table 18). Most of customs revenue along the southernborder was from points close to railheads. The nine customs points along the TAR border yieldedNRs 863 million, or 7.0% of the total. Most of this revenue was from Tatopani on the Arniko Highway,with none from three customs points.
Table 18: Customs Revenue, 2000/2001(NRs ‘000)
S.N. Location
A. TAR Border 863,1741. Yari (Humla) 452. Mugu 363. Nyechung (Mustang) -4. Larke (Gorkha) 135 Rasuwagarhi 846. Tatopani (Sindhupalchowk) 862,9917. Lamobagar (Dolakha) -8. Kimathangka (Sankhuwa-sabha) -9. Walung (Taplejung) 5
B. Indian Border 10,724,78810. Jhulaghat (Baitadi) 86211 Gaddachowki (Kanchanpur) 11,08912. Dhangadi (Kailali) 135,19213. Rajapur (Bardia) 2,22214. Nepalganj (Banke) 384,16015. Koilabas (Dang) 5016. Krishnagar (Kapilvastu) 382,12217. Sidarthanagar (Rupandehi) 1,463,65718. Birganj (Parsa) 6,334,48719. Gaur (Rautahat) 9,84820. Malangawa (Sarlahi) 9,41521. Jajeswar (Mohottari) 29,85222. Janakpur (Dhanusa) 31,41023. Siraha 4,84824. Rajbiraj 11,65625. Sahebgunj (Sunsari) 3,38326. Jogabani (Morang) 1,403,45727. Kakarbhita (Jhapa) 505,49928. Pashupatinagar (Ilam) 1,579
C. Kathmandu 695,54329. Tribhuvan Airport 693,56330. Foreign Post Office 1,980
Total 12,283,525
47
49 These rates were Bihar 1.1%, U.P. 1.24%, as compared to Tamilnadu 5%, Maharastra 6.1% and Gujarat 7.6%;Far Eastern Economic Review, 14 September 2000.
Source: Department of Customs. 2001. Nepal.

Nepal Regional Strategy for DevelopmentHarka Gurung
June 2005
the adjoining tarai of Nepal in terms of infrastructure, agricultural productivity, and industrial output,despite the inflow of migrants from there into Nepalese urban areas. The reverse flow of Nepaleselabor into the hill states of Uttarakhand and Sikkim, and Darjeeling district is indicative of the pooreconomic status of Nepal. In fact, the Nepalese economy is too integrated with that of India, whichis the source of labor and raw materials. Most urban areas outside Kathmandu developed as‘gateway towns’ along the Indian border for export of timber, grain, hide, and herbs, and import ofmanufactured products. India is a major trading partner of Nepal, accounting for 36.0% of the totalimport and 40.7% of the total export (Table 19). Despite some improvement in exports to India afterthe 1996 Trade Treaty, following the Gujaral doctrine of reciprocity, Nepal had an annual tradedeficit of NRs 19,180 million with India, which accounts for one-third of the total deficit. During theFY1997/98 and FY1998/1999, Nepal’s export to India was 21 times than that to Tibet, and importfrom India 49 times that from TAR (Tables 19 and 20).
Nepalese plans continue to emphasize the development of the tarai as the most favorablearea, as compared to the hill and mountain zones. But when related to the adjacent plains of India,with which it has to compete for market, its locational disadvantages becomes apparent. Sincethe soil fertility of the tarai is poorer than that of the Bihar and U.P. plains, owing to pedagogicaldifferences inherent in foothill residual soils and alluvial silt of the plain, it is doubtful if tarai agriculturalproductivity can compete with that of north India.50 Even in the industrial sector, the small scale ofthe economy would tend to limit the efficient growth of tarai industries. It does seem incongruentthat a hill country like Nepal should emphasize on ‘plains economy’ only to compete with a similarbut better endowed Gangetic plain. The strategy for the development of Nepal, vis-à-vis, Indiacannot be competitive as Nepal has too many disadvantages. Rather, it should be complementary,providing scope for specialization between the products of the highlands (Nepal) and the lowlands(India). The advantages of such a wider regional complementarity seem realistic if one notes thatthe Ganges plain contiguous to Nepal is one of the most densely populated areas of the world, and
50 Gurung, H. 1971. Rationale for hill area development. Nepal Industrial Digest. 1971: 17–24.51 Kathmandu Post. 16 November 2004
Table 19: Indo-Nepal Trade, 1997/98-2000/2001(NRs Million)
Fiscal Year Export to % of total Import % of total Trade balance, % ofIndia (F.o.b.) export from import India total
India (c.i.f)
1997/1998 8,794.4 32.0 27,331.0 30.7 -18,536.6 30.11998/1999 12,530.7 35.1 32,119.7 36.7 -19,589.0 37.81999/2000 21,220.7 42.6 39,660.1 36.6 -18,439.4 31.32000/2001 26,030.2 46.8 45,211.0 39.1 -19,180.8 32.0
48
Source: Central Bureau of Statistics. 2003a; p. 201, table 10.2.
A. India: North and East
The Indian states that adjoin Nepal are Uttarakhand in the west, Uttar Pradesh and Bihar tothe south, and West Bengal and Sikkim in the east. Uttar Pradesh and Bihar have the lowestgrowth rate in per capita income among Indian states.49 However, they are better placed than
NRM Working Paper Series No.3
Section VIIBeyond the Border
that there are 14 cities larger than Kathmandu between Delhi and Calcutta. If Nepalese developmentcould concentrate on the specialized processing of sub-tropical and temperate products, thesewould find a ready market in India.
The contest for advantage among neighboring countries is illustrated by the current talksbetween India and Nepal on transit routes. The former’s request to provide transit routes to Chinathrough Nepal has been stalled by the latter with the excuse that alternate routes must be identified,the Arniko Highway having being classified as being too inadequate.51 Similarly, Nepal’s request toprovide a cargo-train transit from Birganj Inland Customs Department to Rangpur-Singbad andBangladesh was evaded by India, who laid the emphasis on the more effective utilization of thealready agreed-upon Kakarbhita-Phulhari-Banglabadh transit route. Regional cooperation can beenhanced only if the neighboring countries are more accommodating. Nepal should allow Indo-Chinese trade along the Arniko Highway and then consider other alternative routes later on.Otherwise, such an entrepot advantage may be preempted by Indo-Chinese trade directly throughNathu La on which negotiations have started. On India’s part, the casualness about increasingbilateral trade between Bangladesh and Nepal is tied-up with her monopolistic interest, and isagainst the spirit of South Asian Growth Quadrangle and the South Asia Sub Regional EconomicCooperation.52
B. China: Tibet Autonomous Region
Similar to the asymmetric economic relation between India and Nepal, trade between Nepaland TAR used to be dominated by Nepal. In the past, Newar traders monopolized business inLhasa and trade flourished during the summer along the border. The decline in such transactions,as shown in Table 20, was the consequence of three factors. The first was the disruption in tradeafter the establishment of the communist regime, which discouraged the barter system, in TAR in1959. The second was the displacement of Tibetan salt by iodized salt with the extension of roadsand subsidies on its transport by air. The third was the decline in food grain surplus in the Nepalihills; this constituted the major trade commodity against Tibetan imports. The economic deprivationof Nepal’s mountain areas has been compounded by the ‘restricted area’ policy since the 1960s.Such restrictions were the outcome of Nepal’s willingness to cooperate with the Chinese in theirpolicy of insulating TAR from adverse political influences. TAR was opened for tourism in 1979, butin Nepal, 44 village development committees of 13 mountain districts adjoining TAR still remainedas restricted areas until 2003.
Nepal–TAR trade, at present, is mostly confined to the transit point at Tatopani on theArniko Highway (Table 19). Nepal exports more than 70 commodities to TAR, of which wheat flourand vegetable ghee account for over 80% of the total value.53 Similarly, TAR exports 71 commoditiesto Nepal, among which raw wool, live animals, and manufactured goods are important. Table 20shows the volume of trade between Nepal and TAR in such major items (15 from Nepal, 22 fromTAR). During the four fiscal years, 1995/96–1998/99, export value from Nepal increased by 68.9%and that from the TAR by 16.3%. But there was fluctuation in the annual trade balance with overallsurplus of NRs 380.2 million in favor of TAR. In recent years, there has been significant increase inimports from TAR both in volume and value.
52 ADB. 2004a. Nepal: Country Strategy and Program (2005–2009). Manila.53 Federation of Nepalese Chambers of Commerce and Industry (FNCCI). 2000. Nepal-China Trade, Economic
and Cultural Cooperation. Kathmandu.
49

Nepal Regional Strategy for DevelopmentHarka Gurung
June 2005
TAR is presently undergoing much economic transformation and Nepal’s regional strategyhas to consider this new reality, which provides much scope for Nepal’s northern border areas. Asin Nepal, TAR had no roads until 1951. It has now 22,000 kilometers of road networks.
Table 20: Trade between Nepal and the Tibet Autonomous Region of China(NRs Million)
Fiscal Year Export to TAR Export to Nepal Trade Balance In Favor of
1995/96 293.0 635.0 342.0 TAR1996/97 545.8 383.5 162.3 Nepal1997/98 544.2 486.0 58.2 Nepal1998/99 480.1 738.8 258.7 TAR
Total 1,863.1 2,243.3 380.2 TARIncrease % 68.5 16.3No. of items 15 22
Source: Tatopani Customs Office, cited in Federation of Nepalese Chambers of Commerce and Industry. 2000;p. 25 and 28.
The volume of goods transported via highways increased 15.6 times in 1996, compared to 1965.During the five year period (1995-2000), TAR received 8.02 billion yuan, involving 716 projects, ineconomic assistance from the central government and other provinces.54 The annual economicgrowth rate during the period was 10.7%. The allocation for the subsequent five years (2001-2004)is said to be 31.2 billion yuan ($3.76 billion). The average peasant’s per capita income in TARincreased by 48.3% during 1991-2002.55 The per capita income reached 1,040 yuan for rural, and5,130 yuan for urban areas. It is to be noted that tourism activity was nonexistent in TAR prior to1979. From 1980 to 1998, some 597,800 overseas tourists visited TAR, generating 178.9 millionyuan. In 1988 alone, the region received 96, 444 overseas visitors; this generated a foreign exchangeincome of $33 million. TAR’s annual GDP increase was 11.9% during 1991-1997.
TAR is no longer an economic backwater but a vibrant region. It would seem logical, then,to orient Nepal’s remote areas towards the north, as the transport of goods from Kodari to Humlaby road through TAR is cheaper than that from Nepalganj by air. Many mountain districts wouldtake decades to have links to the south by road. These should, instead, be connected by road withthe Tibetan prefectures of Ngari in the west and Xigaze in the east.
VIII. CONCLUSION AND RECOMMENDATIONS
A. Conclusion
The main purpose of incorporating a regional approach in national planning is to reducespatial disparity in development. Such disparity may be inherent due to physical constraints, as
54 Anonymous. 2000b. Information on Tibet Autonomous Region. Beijing: Mimeo, 16 pages.55 Zhong, Z. 2000. China’s Tibet. Beijing: China Intercontinental Press.56 Gurung, H. 1971. Rationale for hill area development. Nepal Industrial Digest. 1971: 17–24.
50

NRM Working Paper Series No.4
Section VIConclusion and Recommendations
well as be induced by bias towards advantaged areas. As the absorptive, or, rather, consumptivecapacity of developed areas increase, lesser is the propensity for diverting resources to backwardareas. The question is whether the ‘poor areas’ are indeed poor or whether it is reflective of indigencein planning. After all, planning should be directed not towards accentuating disparity but, rather, itshould be a conscious effort towards minimizing regional differentials.56 Development planning isno more a closed system of hard choice among regions and sectors There is much scope formobilizing external resources and exploiting the opportunity of regional cooperation. With carefulmanipulation of total resources, domestic and foreign, it is possible to mitigate the glaring spatialdisparity and also promote economic growth.
Regional approach was initiated in Nepal during the Fourth Plan (1970–75) with the creationof formal development regions. Since then, periodic plans have continued to allude to regionalbalance merely as an objective but without spatial integration of projects/ programs. While theregional concept was distorted to a dispersal of project activities, programming has continued tobe highly sectoral. The consequence has been an accentuation of disparity among developmentregions and sub regions. The Central Region continues to dominate in development expenditureand concomitant benefits in all sectors, while the Mid Western and the Far Western remainneglected. Similarly, most mountain and hill sub regions languish in poverty, while KathmanduValley has been pampered beyond its absorptive capacity. Such a skewed pattern of developmenthas influenced the trajectory of population shift, which is directed mostly towards the lowlands andthe capital region.
A lack of regional approach is evident in some aspects that determine the spatial frameworkfor development. The first aspect is the utter neglect of land use planning to resolve sectoralconflict in space allocation. The second aspect is the imbalance in road networks, with a vast tractof highlands still inaccessible. The country has a very high density of airports, but this alternativetransport potential remains under-utilized. The third aspect is the lopsided pattern of industriesdue to inadequate legal framework to induce their location. The fourth aspect concerns the spuriousdefinition of ‘urban areas’ without functional consideration and absence of designed hierarchy. Inaddition to these problems of internal spatial framework, the traditional southern orientation hasignored the potential of a northern link in the wider regional context.
There are two factors that constrain the application of regional perspective in Nepalesedevelopment exercise. One is the highly centralized governance system, and another the primacyof the sectoral approach. There has been little breakthrough in various efforts of decentralizationdue to the entrenched command system. Planning and budgeting continues to be influenced bysectoral activities, without consideration to their cumulative impact at the regional and sub regionallevels. Such conventional approaches need to be changed with a regional perspective, asdiscussed in Chapters V, VI and VII. Some of these recommendations are recapitulated below.
B. Recommendations
The following 20-point recommendations on policy initiatives and implementation mechanismare related to eight aspects. These are: (i) spatial orientation, (ii) land use planning, (iii) transportaccess, (iv) industrial location, (v) urban system, (vi) decentralization, (vii) social inclusion, and(viii) organizational change.
51

Nepal Regional Strategy for DevelopmentHarka Gurung
June 2005
Spatial Orientation: Conventional approach in Nepalese planning that favors advantaged areashas accentuated the disparity among regions and sub regions. There is need for reorientation fora more balanced development through:
1. Integration of highland and lowland economies based on product specialization; and
2. Extension of TAR connection for development of remote mountain areas.
Land Use Planning: Nepal has immense physical diversity but there is lack of planning to deviseoptimum use of varied land resources. Forest conservation in the tarai has a bleak prospect due toincreasing access for alternative land use. On the other hand, erosion-prone highlands have becomemore amenable to environmental conservation, aided by low population pressure due to out-migration. Macro land use planning is essential to:
3. Devise rational allocation and use of land resources; and
4. Resolve the conflict among sectoral master plans (forestry, agriculture, irrigation).
Transport Access: The uneven pattern of road networks has stunted the development of mosthighland areas whose temperate products have much export value. The alternative mode of airtransport also remains highly under-utilized. The priorities for transport access should be:
5. Extension of roads to link TAR,
6. Road access to potential hydro-project sites, and
7. Expansion of air service with better regulation of domestic airlines.
Industrial Location: The pattern of industrial location is highly skewed, with industries locatedprimarily in southern border towns and Kathmandu Valley. Two categories of location arerecommended for deliberate urbanization:
8. ‘Industrial complex’ at major road junctions along the East-West Highway for large-scaleindustries. The suggested locations are Atariya, Kohalpur, Lamahi, Butwal, Bharatpur,Dhalkebar and Itahari; and
9. ‘Industrial district’ for small and medium scale industries in appropriate locations in thehighlands. The sites proposed are Dipayal, Surkhet, Jumla, Chaurajahari, Jomsom, Bidur,Panchkhal and Khandbari.
Considering the environmental deterioration of Kathmandu Valley due to over-concentrationof industries:
10. Large and medium size industries should be diverted outside the Valley by levying a highenvironmental surcharge.
52

NRM Working Paper Series No.4
Section VIConclusion and Recommendations
Urban System: The increase in number of settlements designated as urban is unrealistic, beingbased merely on manipulation of their boundary for a larger population aggregation. Moreover,there is lack of a functional hierarchy among the designated urban localities. The recommendationsto rationalize the urban system are:
11. Locations should be designated as urban on a functional basis e.g., where a majority ofeconomically active population are engaged in nonfarm occupation, and
12. Establish a three-tier urban hierarchy of regional centers, district headquarters, and servicecenters.
Decentralization: There is proliferation in the number of administrative districts, villagedevelopment committees and municipalities. They have very poor resource bases, and inadequatetax authority that make them unsustainable. The recommendations include:
13. Consolidation of administrative districts from the present 75 to 25, and drastic reduction inthe number of VDCs and municipalities;
14. Devolution of functions to DDCs and VDCs with more tax authority; and
15. Local authorities to be given a share of revenue generated from extraction of resourceswithin their area.
Social Inclusion: Nepal’s state ideology based on caste hierarchy is the main source of socialexclusion, which in turn influences economic and political inequality. Full social equality will becontingent on constitutional changes, such as a secular state, multilingual policy, and proportionalrepresentation. Within the scope of regional strategy, the relevant agenda for social inclusion are:
16. Affirmative action for indigenous people, Dalit and other disadvantaged groups in educationand employment; and
17. Targeting programs for the socially excluded according to the area of their populationconcentration.
Organizational Change: The centralized structure of government functioning has constrainedthe regional approach in development planning. While the sectoral ministries have their definedjurisdiction, the composition of the NPC is also aligned according to sectoral groupings. Meanwhile,there is no entity to articulate the development needs of theregions. The recommendations on the organizational aspect are:
18. Change the NPC’s functional divisions from sectoral to regional assignment,
19. Strengthen regional offices of the ministries with delegation of adequate authority, and
20. Establish a Regional Development Council in each region for coordination of developmentactivities. Additionally, an autonomous regional authority needs to be created for the mostbackward five districts of the Karnali Zone.
53
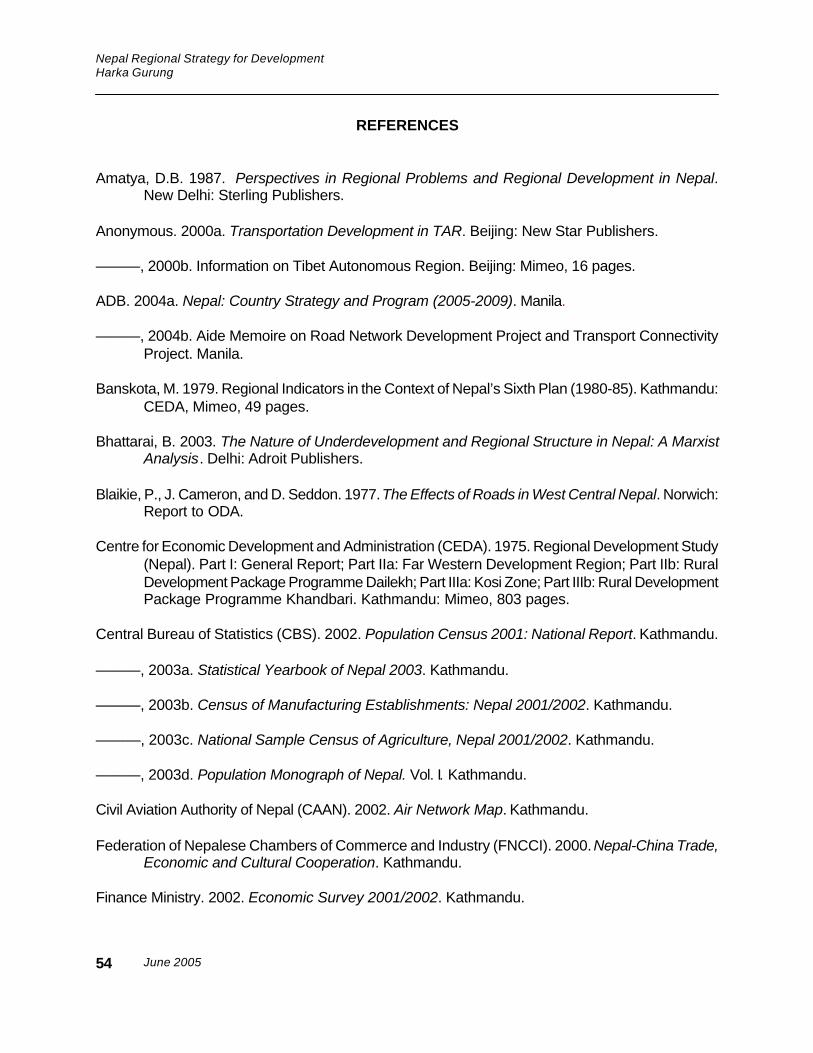
Nepal Regional Strategy for DevelopmentHarka Gurung
June 2005
REFERENCES
Amatya, D.B. 1987. Perspectives in Regional Problems and Regional Development in Nepal.New Delhi: Sterling Publishers.
Anonymous. 2000a. Transportation Development in TAR. Beijing: New Star Publishers.
———, 2000b. Information on Tibet Autonomous Region. Beijing: Mimeo, 16 pages.
ADB. 2004a. Nepal: Country Strategy and Program (2005-2009). Manila.
———, 2004b. Aide Memoire on Road Network Development Project and Transport ConnectivityProject. Manila.
Banskota, M. 1979. Regional Indicators in the Context of Nepal’s Sixth Plan (1980-85). Kathmandu:CEDA, Mimeo, 49 pages.
Bhattarai, B. 2003. The Nature of Underdevelopment and Regional Structure in Nepal: A MarxistAnalysis. Delhi: Adroit Publishers.
Blaikie, P., J. Cameron, and D. Seddon. 1977. The Effects of Roads in West Central Nepal. Norwich:Report to ODA.
Centre for Economic Development and Administration (CEDA). 1975. Regional Development Study(Nepal). Part I: General Report; Part IIa: Far Western Development Region; Part IIb: RuralDevelopment Package Programme Dailekh; Part IIIa: Kosi Zone; Part IIIb: Rural DevelopmentPackage Programme Khandbari. Kathmandu: Mimeo, 803 pages.
Central Bureau of Statistics (CBS). 2002. Population Census 2001: National Report. Kathmandu.
———, 2003a. Statistical Yearbook of Nepal 2003. Kathmandu.
———, 2003b. Census of Manufacturing Establishments: Nepal 2001/2002. Kathmandu.
———, 2003c. National Sample Census of Agriculture, Nepal 2001/2002. Kathmandu.
———, 2003d. Population Monograph of Nepal. Vol. I. Kathmandu.
Civil Aviation Authority of Nepal (CAAN). 2002. Air Network Map. Kathmandu.
Federation of Nepalese Chambers of Commerce and Industry (FNCCI). 2000. Nepal-China Trade,Economic and Cultural Cooperation. Kathmandu.
Finance Ministry. 2002. Economic Survey 2001/2002. Kathmandu.
54

NRM Working Paper Series No.3
References
Financial Comptroller General’s Office. 2002. Consolidated Financial Statement of HMG/Nepal:Fiscal Year 2000/2001. Kathmandu.
Forest Resources Survey. 1967. Forest Statistics for the Terai and Adjoining Regions. Kathmandu:Department of Forests.
Gautam, U. ed. 2003. South Asia and China: Towards Inter-regional Cooperation. Kathmandu:China Study Centre.
Gurung, H. 1969. Regional Development Planning for Nepal. Kathmandu: National PlanningCommission.
———, 1971. Rationale for hill area development. Nepal Industrial Digest, 1971: 17–24.
———, 1978. Distribution pattern and cost of administration in Nepal. Development andAdministrative Studies. 1(1): 1–18.
———, 1984. Nepal: Dimensions of Development. Kathmandu.
———, 1989a. Nepal: Dimensions of Development. Kathmandu.
———, 1989b. Regional Patterns of Migration in Nepal. Honolulu: East-West Centre.
———, 1999. Area Planning in Nepal: Review of Experiences. Report commissioned by InternationalCenter for Integrated Mountain Development.
———, 2000. Nepal: Land use in mountain environment. Environment and Agriculture. Jha, P.K.et al. eds. Kathmandu: ECOS: 269–280.
———, 2002. Fragile districts: Futile decentralization. Readings on Governance and Development.pp. 1–27; published as monograph by SID/Nepal, 2003.
———, 2003. Trident and Thunderbolt: Cultural Dynamics in Nepalese Politics. The MaheshChandra Regmi Lecture 2003. Lalitpur: Social Science Baha.
———, forthcoming. Inclusive human development. Chapter III in Nepal: Readings in HumanDevelopment. Kathmandu: UNDP.
Gurung, S. B. 1998. Rural Development Approaches in Nepal: Some Experiences. Kathmandu:DEVA.
International Center for Integrated Mountain Development (ICIMOD). 2003. Districts of Nepal:Indicators of Development, Update 2003. Kathmandu.
Institute of Sustainable Development (ISD). 1998. A Study on the Status of Human Priority Concernsat Sub-regional Level. Kathmandu.
55

Nepal Regional Strategy for DevelopmentHarka Gurung
June 2005
Japan Forest Technology Association (JAFTA). 2001. Activity Report of Wide Area Tropical ForestResources Survey (Kingdom of Nepal). Tokyo.
Joshi, J. 1985. Regional Strategy for Development: A Case Study of Nepal. Kathmandu.
Kenting Earth Sciences. 1986. Land Resources Mapping Project: Economics Report. Kathmandu.
Lundberg, P. 1997. UNDP Support to Democratic Decentralization in Nepal. Islamabad.
Mikesell, S.L. 1999. Class, State and Struggle in Nepal: Writings 1989–1995. New Delhi: Manohar.
National Planning Commission. 1970. The Fourth Plan (1970–75). Kathmandu.
———, 1975. The Fifth Plan (1975–80). Kathmandu.
———, 1987. Chhetriye Bikashko Sthiti (Status of Regional Development). Draft in Nepali.Kathmandu: Mimeo, 40 pages.
———, 1989. Chhetriya Bikash Guruyojanako Atharbhut Pakchhya (Basic Aspect of RegionalDevelopment Master Plan, 1999–2000). Draft in Nepali. Kathmandu: Mimeo, 80 pages.
———, 2003. The Tenth Plan (2002–07). Kathmandu.
Nepal Gazette. 1992. Industrial Enterprises Act 2049. Kathmandu: His Majesty’s Government ofNepal.
New ERA. 2003. A Study Report on Population Pressure Index (PPI) in Nepal. Kathmandu: UNFPA.
———, 2004. Impact Assessment of Buffer Zone Programme in Nepal. Kathmandu: UNDP.
Ojha, D. et al. 1972. Regional Analysis of Kosi Zone/Eastern Nepal: Working Method for RegionalPlanning in Nepal. Berlin and Kathmandu: German Development Institute/ Centre forEconomic Development and Administration. 2 vols. Abstract in Socio-Econ. Plan. Sci. 7(1993): 213–282.
Okada, F. E. 1970. Preliminary Report on Regional Development Areas in Nepal. Kathmandu:NPC.
Pant, Y.P. and S.C. Jain. 1980. Regional Imbalances and Process of Regional Development inNepal. Delhi: Development Publishers.
Pradhan, P. 1973. A New Dimension in Nepal’s Development: The Regional Approach in Planningand People-oriented Development Strategy. Kathmandu: CEDA.
Sanger, C. 1973. Three Strands of Rope. Ottawa: IDRC.
56

NRM Working Paper Series No.3
References
Sharma, P. 1989. Urbanization in Nepal. Honolulu: East-West Centre.
Shrestha, A. 2003. A Study on Transit of India Goods to TAR Autonomous Region of China throughNepal. Report to Nepal Intermodal Transport Development Board. Kathmandu.
Shrestha, B.P. and S.C. Jain. 1978. Regional Development in Nepal: An Exercise in Reality. Delhi:Development Publishers.
Shrestha, R.K. and P. Sharma. 1980. Nepal: Atlas of Economic Development. Kathmandu: NCST.
Shrestha, S. 1997. A Study Report on Integrated Rural Development Projects in Nepal: A ReviewAnalysis. Kathmandu: IIDS.
Thapa, B. (Chairman). 1961. Report of the Committee on Development Districtand Zonal Division. Kathmandu: National Guidance Ministry.
UNDP. 2002. Nepal Human Development Report 2001. Kathmandu.
———, 2004. Nepal Human Development Report 2004: Empowerment and Poverty Reduction.Kathmandu.
Varjracharya, C. 1976. Application of Growth Centre and Location Quotient Techniques in SADPsof Nepal: A Case Study. Kathmandu: Mimeo, 32 pages.
Zehender, W. et al. 1975. Evaluation of a Regional Development Strategy: A Case of KathmanduGrowth Zone. Berlin: German Development Institute.
Zhong, Z. 2000. China’s Tibet. Beijing: China Intercontinental Press.
57

Appendix A
June 2005
Regional D
isparity, 1971 and 2001
58
FAR
WE
ST
WE
ST
CE
NTR
AL
EA
ST
NEPA
L
Select In
dicato
rU
nit1971
20011971
20011971
20011971
20011971
2001
1. Population density
km2
44 84.1
83.9 155.5
141 293
98.3187.8
78.5 157.3
2. Foodgrain P
roductiona
1,000 t 678 1,507
703 1,4741,204
2,154 902
2,0623,486
71713. Irrigated area
b1,000 ha
29 15,309 25
1,866 62
3,839 63
6,2681,802
7282
4. Road length
ckm
233 2,829 478
2,236 646
5,169 373
2,9891,731 13,223
5. Airports
Num
ber 8
16 5
9 5
9 6
11 24
456. Industrial E
stablishment d
Num
ber 25
309 45
583 453
1,496 136
825 659
3213
7. Hydropow
er generatione
kW 306 15,495 1,885 260,490 33,436 23,9922
6,9911,794 42,618 52,7701
8. Schools
fN
umber
1,675 8,807 2,103 9,176
2,435 11,399 2,0798,184
8,292 37,5669. H
ospital bedsg
Num
ber 125 1,332
326 1,604
1,275 4845
291 1115
2017 8,896
Sources:F
or 1971: Gurung, 1973; pp. 14-16
For 2001:
a CB
S. 2003a; T
able 2.1b C
BS
. 2003a; Table 14.2
c Dept. of R
oad; Map 2001
d CB
S. 2003b; T
able 13.2e C
BS
. 2003a; Table 14.4
f CB
S. 2003a; T
able 8.1-8.3g D
ept. of Health S
ervices

App
endi
x B
NR
M W
orki
ng P
aper
Ser
ies
No.
3
S.N
.D
ura
tion
Pro
ject
Nam
eD
onor
sP
roje
ctD
istr
icts
1.19
74-9
0In
tegr
ated
Hill
Dev
. Pro
ject
(IH
DP
)S
ATA
(S
witz
erla
nd)
1. D
olak
ha,2
. Sin
dhup
alch
ok (
east
)
2.19
76-9
2R
asuw
a/N
uwak
otW
orld
Ban
k1.
Ras
uwa,
2. N
uwak
ot
3.19
78-8
9S
agar
mat
haA
DB
, IFA
D, E
EC
1. U
daya
pur,
2. S
atar
i 3. S
iraha
4.19
79-8
9M
ahak
ali
Wor
ld B
ank,
UN
DP
1. D
arch
ula,
2 B
aita
di 3
. Dad
eldh
ura
5.19
79-9
2K
osi H
ills
Are
a R
ural
Dev
. Pro
ject
OD
A (U
K)
1. S
ankh
uwa-
Sab
ha, 2
. Bho
jpur
,(K
HA
RD
EP
)3.
Dha
nkut
a, 4
. Ter
hath
um
6.19
80-9
7R
apti
US
AID
1. R
ukum
, 2. R
olpa
3. S
alya
n,4.
Pyu
than
5. D
ang-
Deu
khur
i
7.19
81-9
7K
arna
li-B
heri
CID
A (C
anad
a)1.
Jum
la, 2
. Dai
lekh
3. S
urkh
et
8.19
83-9
8D
hadi
ng D
istr
ict D
ev. P
roje
ctG
TZ
(Ger
man
y)1.
Dha
ding
9.19
86-9
5S
eti Z
one
Asi
an D
ev. B
ank
1. B
ajha
ng, 2
. Baj
ura
3. D
oti,
4. A
chha
m,5
. Kai
lali
10.
1987
-M
echi
Hill
Irrig
atio
n an
d R
elat
edS
NV
(N
ethe
rlan
ds)
1. T
aple
jung
, 2. P
anch
thar
, 3. I
lam
Dev
. Pro
ject
11.
1987
-G
ulm
i/Arg
hakh
anch
iE
EC
1. G
ulm
i, 2.
Arg
hakh
anch
i
12.
1989
-U
pper
Sag
arm
atha
Asi
an D
ev. B
ank
1. S
oluk
hum
bu, 2
. Okh
aldh
unga
,3.
Kho
tang
13.
1991
-G
orkh
a D
istr
ict D
ev. P
roje
ctG
TZ1.
Gor
kha
14.
1993
-K
arna
li Lo
cal D
ev. P
roje
ctS
NV
(Net
herla
nd)
1. K
alik
ot, 2
. Mug
u, 3
.Hum
la
15.
1994
-La
mju
ng D
istr
ict D
ev. P
roje
ctG
TZ1.
Lam
jung
16.
1997
-B
hojp
ur/S
ankh
uwa-
Sab
haG
TZ1.
Bho
jpur
,2. S
ankh
uwa-
Sab
ha
Tota
l12
41
Sou
rce:
Gur
ung,
H. 1
999;
p.1
3.
IRD
P C
ove
rag
e
59

Appendix C
June 2005
Road N
etwork, 2000
60
AFA
R W
ES
T K
mB
MID
WE
ST
Km
CW
ES
T K
m D
CE
NTR
AL
Km
EE
AS
T K
m T
otal
IM
ou
ntain
59IV
Mo
un
tain 0
VII
Mo
un
tain 0 X
Mo
un
tain 468
XIII
Mo
un
tain 34
5611
Darchula
21 10H
umla
-25
Mustang - 41
Rasuw
a 102
60S
olu- -
Khum
bu2
Bajhang
38 11M
ugu -
26M
anang - 42
Sindhu-
216 61
Sankhuw
a- 2P
alchokS
ava3
Bajura
- 12K
alikot -
43D
olakha 150
62T
aplejung 32 13
Jumla
- 14
Dolpo
-II
Hill
524V
Hill
720V
IIIH
ill 1,409 X
IH
ill 2,401
XIV
Hill
785 5,839
4B
aitadi 168 15
Dailekh
8227
Argha
132 CW
ith KV
2,401 63
Okhal-
17K
hanchidhunga
5D
adheldhura125 16
Jajarkot -28
Palpa
238 Ca
Without K
V 1,141
64K
hotang -
6D
oti159 17
Rukum
-29
Gulm
i 165 44
Makw
anpur 326
65B
hojpur -
7A
chham 72 18
Surkhet
30030
Baglung
22 45D
hading 157
66U
dayapur 175 19
Salyan
160 31
Myagdi
13 46N
uwakot
220 67
Dhankuta 111
20R
olpa 57
32P
arbat 38 47
Kabhre-
352 68
Terhathum
32P
alanchok 21
Pyuthan
12133
Kaski
309 48R
amechhap
26 69
Panchthar 157
34S
yangja 138 49
Sindhuli
60 70
Ilam 293
35T
anahu 231 C
bK
athmandu 1,260
Valley
36Lam
jung 54 50K
athmandu
70537
Gorkha
69 51Lalitpur
383 52
Bhaktapur
172III
Tarai549 V
ITarai
977 IX
Tarai 827 X
IITarai
2,300 XV
Tarai 2,170
6,8238
Kanchanpur
205 22B
ardiya214
38K
apilvastu 326 53C
hitwan
569 71
Siraha
2409
Kailali
344 23B
anke295
39R
upandehi 260 54P
arsa 297
72S
aptari 293
24D
ang-Deukhuri
46840
Naw
alparasi 241 55B
ara 209
73S
unsari 436 56
Rautahat
141 74
Morang
608 57
Sarlahi
374 75
Jhapa 593
58M
ahotari 346
59D
ha
nu
sa 364
Total 1,132
Total 1,697
Total 2,236Total
5,169Total
2,989 13,223N
epal
13,223
Source: D
ept. of Road m
ap 2000
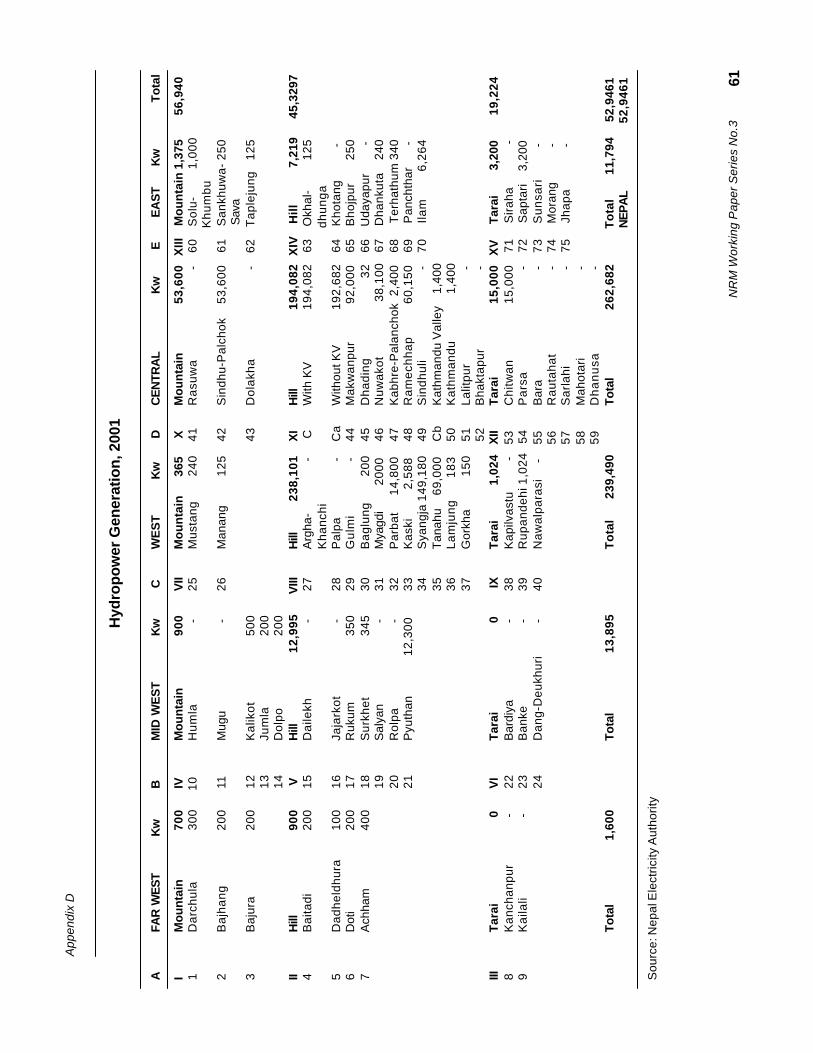
App
endi
x D
NR
M W
orki
ng P
aper
Ser
ies
No.
3
Hyd
ropo
wer
Gen
erat
ion,
200
1
61
AFA
R W
ES
TK
wB
MID
WE
ST
K
w
CW
ES
T
K
w
DC
EN
TRA
L
Kw
E
EA
ST
Kw
T
otal
IM
ou
nta
in 7
00IV
Mo
un
tain
90
0 V
IIM
ou
nta
in
36
5
XM
ou
nta
in 5
3,60
0 X
III
Mo
un
tain
1,3
75 5
6,94
01
Dar
chul
a 3
00
10
Hum
la
-
25
Mus
tang
240
4
1R
asuw
a
-
60
S
olu-
1,
000
K
hum
bu2
Baj
hang
200
11M
ugu
- 2
6M
anan
g
1
25
42
Sin
dhu-
Pal
chok
53,
600
61
S
ankh
uwa-
250
Sav
a3
Baj
ura
200
12K
alik
ot
500
4
3D
olak
ha
-
62
T
aple
jung
125
13Ju
mla
20
014
Dol
po
200
IIH
ill 9
00 V
Hill
12,
995
VIII
Hill
238,
101
X
IH
ill19
4,08
2 X
IV
Hill
7,21
9
45,
3297
4B
aita
di 2
0015
Dai
lekh
- 2
7A
rgha
-
-
C
With
KV
194,
082
63
O
khal
- 1
25K
hanc
hi
dhu
nga
5D
adhe
ldhu
ra 1
0016
Jaja
rkot
- 2
8P
alpa
-
Ca
With
out K
V19
2,68
2
64
Kho
tang
-6
Dot
i 2
0017
Ruk
um
350
29
Gul
mi
-
44
Mak
wan
pur
92,
000
65
B
hojp
ur 2
507
Ach
ham
400
18S
urkh
et
345
30
Bag
lung
200
4
5D
hadi
ng
3
2
66
Uda
yapu
r
-
19S
alya
n
-
31
Mya
gdi
2
000
4
6N
uwak
ot
38
,100
67
D
hank
uta
24
020
Rol
pa
-
32
Par
bat
14,
800
4
7K
abhr
e-P
alan
chok
2,4
00
68
Ter
hath
um 3
4021
Pyu
than
12,3
00 3
3K
aski
2
,588
4
8R
amec
hhap
60,
150
69
P
anch
thar
- 3
4S
yang
ja14
9,18
0
49
Sin
dhul
i
-
70
I
lam
6,
264
35
Tan
ahu
69,
000
C
bK
athm
andu
Val
ley
1,
400
36
Lam
jung
183
5
0K
athm
andu
1
,400
37
Gor
kha
150
5
1La
litpu
r
-
5
2B
hakt
apur
-III
Tar
ai
0
VI
Tar
ai
0
IX
Tar
ai
1,0
24
XII
Tar
ai 1
5,00
0 X
V
Tar
ai
3
,200
19,
224
8K
anch
anpu
r
-
22B
ardi
ya
-
38
Kap
ilvas
tu
-
53C
hitw
an 1
5,00
0
71
Sira
ha
-
9K
aila
li
-
23B
anke
- 3
9R
upan
dehi
1,0
24
54P
arsa
-
72
Sap
tari
3,
200
24D
ang-
Deu
khur
i
-
40
Naw
alpa
rasi
-
55
Bar
a
-
73
S
unsa
ri
-
56
Rau
taha
t
-
74
M
oran
g
-
57
Sar
lahi
-
75
Jha
pa
-
58
Mah
otar
i
-
59
Dh
an
usa
-To
tal
1,6
00To
tal
13,
895
To
tal
2
39,4
90To
tal
262,
682
T
ota
l
11
,794
5
2,94
61
NEP
AL
52,
9461
Sou
rce:
Nep
al E
lect
ricity
Aut
horit
y

Appendix E
June 2005
Literacy Rate, 2001
62
A FA
R W
ES
TL
ite racy BM
ID W
ES
TL
iteracy CW
ES
T L
iteracy DC
EN
TRA
LL
iteracy EE
AS
T L
iteracyTotal
Rate
Rate
Rate
Rate
Rate
I Mountain
39.47 IV
Mo
un
tain31.8
VII
Mo
un
tain 55.85 X
Mo
un
tain41.6
XIII
Mo
un
tain 50.6
43.861 D
archula 49.4
10H
umla
26.625
Mustang 51.8 41
Rasuw
a 34
60S
olu- 45.8
Khum
bu2 B
ajhang 35.3
11M
ugu 27.8
26M
anang 59.9 42
Sindhu-
40.2 61
Sankhuw
a- 53.8P
alchokS
ava3 B
ajura 33.7
12K
alikot 37.5
43D
olakha50.6
62T
aplejung 52.2 13
Jumla
32.4 14
Dolpo
34.7II H
ill 44.78 V
Hill
45.84 VIII
Hill
60.35 XI
Hill
8.77 XIV
Hill
56.453.22
4 Baitadi
51.5 15
Dailekh
47.427
Argha
55.9 CW
ith KV
58.77 63
Okhal 49.1
Khanchi
dhunga5 D
adheldhura 51.6 16
Jajarkot 39.428
Palpa
66 Ca
Without K
V 51.78
64K
hotang 49.8
6 Doti
42.6 17
Rukum
39.729
Gulm
i 57.5 44
Makw
anpur 63.2
65B
hojpur 54.5
7 Achham
33.4 18
Surkhet
62.530
Baglung
61.4 45D
hading 43.5
66U
dayapur 53.3 19
Salyan
48.131
Myagdi
55.7 46N
uwakot
51.2 67
Dhankuta 64
20R
olpa 37.2 32
Parbat
56.8 47K
abhre- 63.7
68T
erhathum 59
Palanchok
21P
yuthan 46.6 33
Kaski
71.9 48R
amechhap
39 69
Panchthar 55.3
34S
yangja 66.3 49
Sindhuli
50.1 70
Ilam 66.2
35T
anahu 61.7 C
bK
athmandu 72.73
Valley
36Lam
jung 56.6 50K
athmandu
77.1 37
Gorkha
53.9 51Lalitpur
70.8 52
Bhaktapur
70.3III Tarai
55.9 VI
Tarai
53.5 IX
Tarai
53.5 XII
Tarai
43.86X
VT
arai 54.72
52.30 K
anchanpur 59.7 22
Bardiya
45.438
Kapilvastu 41.5 53
Chitw
an 70.8
71S
iraha 40.3
9 Kailali
52.123
Banke
57.439
Rupandehi 66 54
Parsa
42.4 72
Saptari
49.324
DangD
eukhuri57.7
40N
awalparasi 53 55
Bara
42.4 73
Sunsari 60.4
56R
autahat 32.4
74M
orang 56.7
57S
arlahi 36.2
75Jhapa
66.9 58
Mahotari
34.4 59
Dh
an
usa
48.4Total
46.71Total
43.71Total
56.56Total
48.10Total
53.9149.79
NEPA
L 53.7
Source: C
BS
. 2002.

App
endi
x F
NR
M W
orki
ng P
aper
Ser
ies
No.
3
Pop
ulat
ion
Per
Hea
lth In
stitu
tion,
200
1/20
02
63
A
FA
R W
ES
TP
op
/Ins.
B
MID
WE
ST
P
op
/Ins.
C
WE
ST
P
op
/Ins.
DC
EN
TRA
L
Pop
/Ins.
A
E
AS
T
P
op/In
s.
Tota
l
I
Mou
ntai
n
3,3
43
IVM
ou
nta
in
2,2
73
VII
Mo
un
tain
7
67.7
5 X
Mo
un
tain
3
,626
.26
XIII
M
ou
nta
in 1
37.4
0
2,97
1.58
1
Dar
chul
a
2,9
05
10H
umla
1
,561
25
Mus
tang
832
4
1R
asuw
a 2
,354
60
S
olu-
307
7
Khu
mbu
2
Baj
hang
3
,409
1
1M
ugu
1,6
90
26M
anan
g
68
5
42
Sin
dhu-
3,8
72 6
1
San
khuw
a- 4
082
Pal
chok
S
ava
3
Baj
ura
3
,885
12
Kal
ikot
3
,519
43
Dol
akha
3 ,7
13 6
2
Tap
leju
ng 2
494
13
Jum
la
2,9
81
14D
olpo
1
,231
II
Hill
3
,583
V
Hill
4,2
69.6
3 V
IIIH
ill
4,3
30.5
1X
IH
ill
6,
892.
48
XIV
H
ill
4,02
7.56
4,
801.
464
B
aita
di
3,3
97
15D
aile
kh
3,6
92
27A
rgha
4,
846
CW
ith K
V
6,
892.
48 6
3
Okh
al2,
798
d
hung
a5
D
adhe
ldhu
ra
4,8
52
16Ja
jark
ot
3,7
46
28P
alpa
4,
069
C
aW
ithou
t KV
5,
114.
94 6
4
Kho
tang
3,00
56
D
oti
3
,907
17
Ruk
um
4,0
96
29G
ulm
i
3,66
2
44
Mak
wan
pur
8,3
53 6
5
Bho
jpur
3,17
27
A
chha
m
3,0
84
18S
urkh
et
5,4
44
30B
aglu
ng
4,13
7
45
Dha
ding
6,5
13 6
6
Uda
yapu
r5,
994
19
Sal
yan
4
,448
31
Mya
gdi
2,
861
4
6N
uwak
ot 4
,306
67
D
hank
uta
4,38
1
20R
olpa
4
,039
32
Par
bat
2,
870
4
7K
abhr
e- 4
,060
68
T
erha
thum
3,42
8P
alan
chok
21
Pyu
than
4
,336
33
Kas
ki
7,76
6
48
Ram
echh
ap 3
,862
69
P
anch
thar
4,8
11 3
4S
yang
ja
4,66
6
49
Sin
dhul
i 5
,088
70
Ila
m5,
656
35
Tan
ahu
6,
707
C
bK
athm
andu
1
1,50
4.13
Val
ley
36
Lam
jung
2,9
04
50
Kat
hman
du
14,
620
37
Gor
kha
4,
116
5
1La
litpu
r
7,
506
52
Bha
ktap
ur 9
,394
III
Tar
ai
14,4
14
VI
Tar
ai
9
,926
.36
IX
Tar
ai
7,6
22.8
9
XII
Tar
ai
6,
459.
90
XV
T
arai
8,0
87.3
6 7
,786
.43
8
Kan
chan
pur
16,
430
22
Bar
diya
1
0,93
2.83
38
Kap
il-
6,1
79.1
8
53
Chi
twan
1
0,97
7.86
71
S
iraha
5,0
21va
stu
9
Kai
lali
13,
406
23
Ban
ke
8
,038
.33
39
Rup
an-
9
,839
.15
5
4P
arsa
5,78
1.62
72
Sap
tari
4,83
3de
hi
24D
ang-
1
1,27
7.56
40
Naw
al-
7,0
35.8
75
55
Bar
a
5,
591.
3573
S
unsa
ri
11,
375
Deu
khur
ipa
rasi
56
Rau
taha
t
5,50
6.38
74
Mor
ang
12,2
21
5
7S
arla
hi
6,
294.
7075
J
hapa
13
,233
58
Mah
otar
i
7,2
82.6
5
59
Dha
nusa
6
,455
.42
To
tal
5
,331
.70
Tota
l
4,9
80.1
24To
tal
5,0
39.7
06To
tal
6,29
4.38
T
ota
l
5,6
61.5
2
5,58
8.08
N
EPA
L
5,5
88
Dep
artm
ent o
f Hea
lth S
ervi
ces
Ann
ual R
epor
t, 20
01/2
002;
p.3
44.

Appendix G
June 2005S
ource: CB
S. 2002.
Housholds w
ith Piped W
ater, 2001
64
AFA
R W
ES
T%
BM
ID W
ES
T % C
WE
ST
% D
CE
NTR
AL
%E
EA
ST
% Total
I M
ou
ntain
59.76IV
Mo
un
tain 54.98 V
IIM
ou
ntain
88.85 X
Mo
un
tain 82.83
XIII
Mo
un
tain 76.4
72.561
Darchula
71.2 10H
umla
64.2 25M
ustang 84.3 41
Rasuw
a 84.8
60S
olu- 76.5
Khum
bu2
Bajhang
43.511
Mugu
55.1 26M
anang 93.4
42S
indhu- 81.4
61S
ankhuwa- 62.4
Palchok
Sava
3B
ajura 64.6 12
Kalikot
45.5 43
Dolakha
82.3 62
Taplejung 90.3
13Jum
la 73.9
14D
olpo 36.2
IIH
ill54.38
VH
ill 59.09 V
IIIH
ill 79.236
XI
Hill
74.49X
IVH
ill 64.58
66.354
Baitadi
59.415
Dailekh
36.6 27A
rgha 66.4
CW
ith KV
74.49 63
Okhal
70.1K
hanchidhunga
5D
adheldhura 64.8
16Jajarkot 48.9 28
Palpa
84.7C
aW
ithout KV
74.783 64
Khotang
64.26
Doti
49.417
Rukum
63.1 29G
ulmi
79.3 44
Makw
anpur 77.1 65
Bhojpur
57.37
Achham
43.918
Surkhet
69.1 30B
aglung 88
45D
hading 79.2 66
Udayapur 26.9
19S
alyan 65.4 31
Myagdi
83.8 46
Nuw
akot 85 67
Dhankuta 80.7
20R
olpa 62 32
Parbat
84 47
Kabhre-
80 68
Terhathum
72.7P
alanchok21
Pyuthan
68.5 33K
aski 86.9
48R
amechhap 72
69P
anchthar 69.1 34
Syangja
81.4 49
Sindhuli 55.4
70Ilam
75.6 35
Tanahu
68.9C
bK
athmandu 221.7
Valley
36Lam
jung 84.3 50
Kathm
andu 84.1 37
Gorkha
63.9 51
Lalitpur 63
52B
haktapur 74.6III
Tarai
33.15V
IT
arai 39.43 IX
Tarai
46.87 X
IIT
arai 32.23
XV
Tarai
16.4 33.62
8K
anchanpur 23.4 22
Bardiya
23.8 38K
apil- 42.5
53C
hitwan
30.671
Siraha
15.9vastu
9K
ailali 42.9 23
Banke
41 39R
upan- 62.8
54P
arsa 42.4
72S
aptari 7.2
dehi 24
Dang-
53.5 40N
awal
35.3 55
Bara
24.673
Sunsari 19.9
Deukhuri
parasi 56
Rautahat 34.7
74M
orang 13.8
57S
arlahi 28.8
75Jhapa
25.2 58
Mahotari 34.5
59D
hanusa 30Total
49.10Total
51.17Total
71.65Total
63.18Total
52.46 57.51
NEPA
L 57.5

App
endi
x H
NR
M W
orki
ng P
aper
Ser
ies
No.
3
Hum
an D
evel
opm
ent I
ndex
, 200
1
65
AFA
R W
ES
TH
DI
BM
ID W
ES
TH
DI
CW
ES
TH
DI
DC
EN
TRA
LH
DI
EE
AS
TH
DI
Tota
l
I M
ou
nta
in0.
355
IVM
ou
nta
in0.
347
VII
Mo
un
tain
0.48
8X
Mo
un
tain
0.42
3X
IIIM
ou
nta
in0.
474
0.38
6
1D
arch
ula
0.42
410
Hum
la0.
367
25M
usta
ng0.
482
41R
asuw
a0.
394
60S
olu-
Khu
mbu
0.47
92
Baj
hang
0.33
111
Mug
u0.
304
26M
anan
g0.
502
42S
indh
u-P
alch
ok0.
414
61S
ankh
uwa-
Sav
a0.
481
3B
ajur
a 0
.31
12K
alik
ot0.
322
43D
olak
ha 0
.45
62T
aple
jung
0.46
713
Jum
la0.
348
14D
olpo
0.37
1II
Hill
0.40
3V
Hill
0.41
7V
IIIH
ill0.
489
XI
Hill
0.54
7X
IVH
ill
0.5
0.51
24
Bai
tadi
0.39
115
Dai
lekh
0.38
127
Arg
ha0.
471
CW
ith K
V0.
547
63O
khal
dhun
ga0.
481
Kha
nchi
5D
adhe
ldhu
ra0.
434
16Ja
jark
ot0.
343
28P
alpa
0.48
6C
aW
ithou
t KV
0.46
664
Kho
tang
0.44
26
Dot
i0.
402
17R
ukum
0.38
629
Gul
mi
0.46
744
Mak
wan
pur
0.47
965
Bho
jpur
0.47
27
Ach
ham
0.3
518
Sur
khet
0.48
630
Bag
lung
0.49
245
Dha
ding
0.4
166
Uda
yapu
r0.
488
19S
alya
n0.
399
31M
yagd
i0.
498
46N
uwak
ot0.
463
67D
hank
uta
0.50
720
Rol
pa0.
384
32P
arba
t0.
504
47K
abhr
e-0.
543
68T
erha
thum
0.52
3P
alan
chok
21P
yuth
an0.
416
33K
aski
0.59
348
Ram
echh
ap0.
434
69P
anch
thar
0.48
434
Sya
ngja
0.53
549
Sin
dhul
i0.
469
70Ila
m0.
521
35T
anah
u0.
524
Cb
Kat
hman
du0.
612
Val
ley
36La
mju
ng0.
492
50K
athm
andu
0.65
237
Gor
kha
0.45
451
Lalit
pur
0.58
852
Bha
ktap
ur0.
595
IIIT
arai
0.
45V
IT
arai
0.4
4 IX
Tar
ai0.
494
XII
Tar
ai0.
451
XV
Tar
ai0.
491
0.47
88
Kan
chan
pur
0.46
322
Bar
diya
0.42
938
Kap
ilvas
tu0.
437
53C
hitw
an0.
518
71S
iraha
0.42
79
Kai
lali
0.44
223
Ban
ke0.
479
39R
upan
dehi
0.54
654
Par
sa0.
448
72S
apta
ri0.
453
24D
ang-
0.40
940
Naw
alpa
rasi
0.48
255
Bar
a0.
465
73S
unsa
ri
0.5
Deu
khur
i56
Rau
taha
t0.
409
74M
oran
g0.
531
57S
arla
hi0.
408
75Jh
apa
0.49
458
Mah
otar
i0.
407
59D
ha
nu
sa0.
449
Tota
l0.
404
Tota
l0.
402
Tota
l0.
491
Tota
l 0
.49
Tota
l0.
493
0.47
1N
EPA
L0.
471
Sou
rce:
UN
DP
. 200
4; A
ppen
dix
2.1,
Tab
le 1
, pp.
141–
143.

Appendix I
June 2005
Reg
istered L
and
66
AFA
R W
ES
T ha
BM
ID W
ES
Tha
CW
ES
T ha
DC
EN
TRA
L ha E
EA
ST
ha Total
I M
ou
ntain
28,8475 IV
Mo
un
tain 150,010
VII
Mo
un
tain 26,405 X
Mo
un
tain 273,159 X
III Mo
un
tain 357,704 1,095,753
1D
archula 80,947
10H
umla
12,12925
Mustang 11,092 41
Rasuw
a 30,437 60
Solu-
127,196 K
humbu
2B
ajhang 131,931
11M
ugu 9,525
26M
anang 153,13 42
Sindhu-
138,496 61 S
ankhuwa- 129,560
Palchok
Sava
3B
ajura 75,597
12K
alikot70,971
43D
olakha 104,226 62
Taplejung 100,948
13Jum
la 47,745
14D
olpo 9,640
IIH
ill 37,4094
VH
ill 774,736 V
IIIH
ill 981,169 X
IH
ill 497,442 X
IV H
ill 771,734 3,399,175
4B
aitadi 11,2821
15D
ailekh 125,650
27A
rgha 97,310 C
With K
V 497,442 63
Okhal- 105,945
Khanchi
dhunga5
Dadheldhura
15,69716
Jajarkot 129,85328
Palpa
128,740 Ca
Without K
V 425,508 64
Khotang 157,187
6D
oti 108,753
17R
ukum 133,652
29G
ulmi
105,318 44M
akwanpur 58,812 65
Bhojpur 137,310
7A
chham 136,823
18S
urkhet 51,268
30B
aglung 105,828 45
Dhading 76,657 66
Udayapur 69,968
19S
alyan 134,199
31M
yagdi 30,632 46
Nuw
akot 69,445 67 D
hankuta 85,23620
Rolpa
74,80232
Parbat
45,456 47K
abhre- 126,034 68
Terhathum
59,145P
alanchok21
Pyuthan
125,31233
Kaski
80,600 48R
amechhap 67,637 69
Panchthar 50,536
34S
yangja 94,876 49
Sindhuli 26,923 70
Ilam 106,407
35T
anahu 81,657 C
bK
athmandu 71,934
Valley
36Lam
jung 79,925 50K
athmandu 33,544
37G
orkha 130,827 51
Lalitpur 27,376
52B
haktapur 11,014III
Tarai
109,364 V
IT
arai 185,956
IXT
arai 259,468 X
IIT
arai 51,2651 X
V T
arai 51,3886
581,3258
Kanchanpur
35,383 22B
ardiya 53,274
38K
apilvastu 91,652 53C
hitwan
52,574 71 S
iraha 95,7159
Kailali
7,398123
Banke
50,75839
Rupandehi 98,206 54
Parsa
52,176 72 S
aptari 108,55124
Dang-
81,92440
Naw
al- 69,610 55
Bara
69,290 73 S
unsari 81,269D
eukhuriparasi
56R
autahat 89,528 74 M
orang 109,238 57
Sarlahi
88,722 75 Jhapa 119,113
58M
ahotari 80,549 59
Dhanusa 79,812
Total 771,933
Total 1,110,702
Total 1,267,042
Total 1,283,252
To
tal 1,643,324 6,076,253
NEPA
L 7,311,973
Source: D
ept. of Land Managem
ent.

App
endi
x J
NR
M W
orki
ng P
aper
Ser
ies
No.
3
Est
imat
ed F
oodg
rain
Pro
duct
ion,
200
0/20
01
67
S.N
.Fo
od C
rop
FAR
WE
ST
MID
WE
ST
WE
ST
CE
NTR
AL
(K
V)
EA
ST
To
tal
%
1P
addy
350
,050
414
,080
798
,939
1,
285,
108
-9
2,57
9
1,39
3,28
84,
216,
465
52.8
2M
aize
7
1,78
6 2
60,9
57 3
47,6
25 4
18,1
32
-38,
104
385
,612
1,48
4,11
220
.73
Whe
at 1
54,8
40 2
03,0
21 2
17,9
89 3
75,0
19
-31,
820
207
,296
1,15
7,86
516
.14
Mill
et
10,
551
2
3,33
1 1
03,0
96
71,
365
-
2,89
0
74,5
09
282,
852
3.9
5B
arle
y
5
,641
1
2,56
8
6,
234
3,96
4
-
333
2,08
1
30
,488
0.4
Tota
l 5
92,8
68 9
13,9
57
1
,473
,883
2,
153,
588
-16
5,72
6
2,06
2,78
67,
171,
782
100
Row
%
8.3
12
.7
2
0.5
3
0
-2.3
27.
8
100
Pop
ulat
ion
2001
2,1
91,3
30
3,01
2,97
5
4,
571,
013
8,0
31,6
29
-
1,64
5,09
1
5,34
4,47
6 2
3,15
1,42
3R
ow%
9
.5
13
19.
7
3
4.7
-7
.1
2
3.1
1
00F
ood
grai
n av
aila
bilit
y P
erso
n/kg
.
27
30
32
2
7
-10
3
9
3
0
Sou
rce:
CB
S. 2
003a
; Tab
le 2
.1, p
p.48
–72.

Appendix K
June 2005
Industries by Gross Fixed A
ssets, 2001/2002
68
A FA
R W
ES
T NR
s B
MID
WE
ST N
Rs
C W
ES
T NR
sD
CE
NTR
AL
NR
s E E
AS
T NR
s Grand Total
‘000 ‘000
‘000 ‘000
‘000
I Mo
un
tain 269
IV M
ountain 0 V
II Mo
un
tain 0
X M
ou
ntain
255,037 XIII M
ou
ntain
867 256,1731 D
archula 10 H
umla
25 Mustang
- 41 Rasuw
a 240,955 60 S
olu- 861
Khum
bu2 B
ajhang - 11 Mugu
- 26 M
anang 0 42 S
indhu- 5,647 61 S
ankhuwa-
- P
alchok S
ava3 B
ajura 269 12 K
alikot -
43 Dolakha
8,435 62 T
aplejung 6
13 Jumla
- 14 D
olpo -
II Hill
0 V
Hill
11,549 V
III Hill
634,939 XI H
ill 10,247,721 X
IV H
ill 1,711,407 12,605,6164 B
aitadi 15 D
ailekh 112
27 Argha
3,034C
With K
V 10,247,721 63 O
khaldhunga5 D
adheldhura - 16 Jajarkot
- 28 Palpa
28,893 C
a Without- 2,252,175 64 K
hotang 937
KV
6 Doti
- 17 Rukum
- 29 Gulm
i - 44 M
akwan 1,926,935 65 B
hojpur -
pur7 A
chham - 18 S
urkhet 11,437 30 B
aglung -
45 Dhading 22,992 66 U
dayapu 1,604,934 19 S
alyan -
31 Myagdi
- 46 N
uwakot 5,025 67 D
hankuta 44,579
20 Rolpa
32 Parbat
- 47 K
abhre- 297,223 68 Terhathum
2,788 P
alanchok 21 P
yuthan -
33 Kaski
385,032 48 R
amechhap
- 69 Panchthar 15,427
34 Syangja 5,934
49 Sindhuli
- 70 Ilam 42,742
35 Tanahu 26,910
Cb K
athmandu 7,995,546
Valley
36 Lamjung 1,069
50 Kathm
andu 6,057,634 37 G
orkha 184,067 51 Lalitpur 1,455,765 52 B
haktapur 482,147III T
arai 992,639 V
I Tarai 36,359
IX T
arai 5,089,701 XII T
arai 10,499,440 X
V T
arai 10,439,992 27,058,1318 K
anchan129,105
22B
ardiya -
38 Kapil 600,996 53
Chitw
an 1,169,322 71 Siraha
116,0369 K
ailali 863,534 23 B
anke - 39 R
upan 1,587,496 54 Parsa 2,463,575 72 S
aptari 78,363
dehi24
Dang-
36,35940 N
awal- 2,901,209 55
Bara 4,223,384 73 S
unsari 4,706,372 D
eukhuri parasi
56 Rautahat 881,282 74 M
orang 4,540,818
57 S
arlahi 707,479 75 Jhapa 998,403
58 Mahotari 652,380
59 D
hanusa 402,018 T
otal
992,908 T
otal
47,908T
otal 5,724,640 Total 21,002,198 T
otal
12,152,266 39,919,920 N
EPAL
39,919,920
Source: C
BS
. 2003b; Table 1A
, pp.1–31.

App
endi
x L
NR
M W
orki
ng P
aper
Ser
ies
No.
3
Per
Cap
ita In
com
e (P
PP
), 20
01
69
AFA
R W
ES
T
$B
MID
WE
ST
$
CW
ES
T
$ D
CE
NTR
AL
$
EE
AS
T
$
Tota
l
IM
ou
nta
in 9
39 IV
Mo
un
tain
94
0V
IIM
ou
nta
in2,
505
XM
ou
nta
in1,
157
XIII
Mo
un
tain
1,27
61,
114
1D
arch
ula
1,1
7510
Hum
la1,
014
25M
usta
ng2,
466
41R
asuw
a1,
802
60
Sol
u-K
hum
bu1,
455
2B
ajha
ng 8
2511
Mug
u1,
105
26M
anan
g2,
746
42S
indh
u-P
alch
ok1,
194
61
San
khuw
a-1,
257
Sav
a3
Baj
ura
907
12K
alik
ot
775
43D
olak
ha
965
62
Tap
leju
ng1,
169
13Ju
mla
1,10
414
Dol
po1,
279
IIH
ill 9
45 V
Hill
87
9
VIII
Hill
1,19
8 X
IH
ill2,
083
XIV
Hill
1,05
71,
424
4B
aita
di 8
9015
Dai
lekh
67
927
Arg
ha1,
130
CW
ith K
V2,
083
63
Okh
aldh
unga
95
2K
hanc
hi5
Dad
held
hura
1,3
2116
Jaja
rkot
83
928
Pal
pa1,
167
Ca
With
out K
V1,
115
64
Kho
tang
95
46
Dot
i 9
4517
Ruk
um1,
002
29G
ulm
i
760
44M
akw
anpu
r1,
836
65
Bho
jpur
1,00
27
Ach
ham
770
18S
urkh
et1,
088
30B
aglu
ng1,
145
45D
hadi
ng1,
075
66
Uda
yapu
r
975
19S
alya
n
791
31M
yagd
i1,
209
46N
uwak
ot1,
237
67
Dha
nkut
a1,
102
20R
olpa
87
732
Par
bat
1,22
047
Kab
hre-
1,57
2 6
8T
erha
thum
1,24
6P
alan
chok
21P
yuth
an
754
33K
aski
1,70
748
Ram
echh
ap1,
009
69
Pan
chth
ar1,
072
34S
yang
ja1,
333
49S
indh
uli
1,07
9 7
0Ila
m1,
215
35T
anah
u1,
188
Cb
Kat
hman
du2,
458
Val
ley
36La
mju
ng1,
284
50K
athm
andu
3,43
837
Gor
kha
1,21
951
Lalit
pur
2,05
952
Bha
ktap
ur1,
862
IIIT
arai
1
,244
VI
Tar
ai1,
130
IXT
arai
1,27
7X
IIT
arai
1,22
2X
VT
arai
1,26
61,
235
8K
anch
anpu
r
1,34
122
Bar
diya
,96
938
Kap
ilvas
tu1,
121
53C
hitw
an1,
715
71
Sira
ha
880
9K
aila
li
1
,184
23B
anke
1,37
039
Rup
ande
hi1,
358
54P
arsa
1,40
6 7
2S
apta
ri
939
24D
ang-
1,06
140
Naw
alpa
rasi
1,31
055
Bar
a2,
156
73
Sun
sari
1,38
1D
eukh
uri
56R
auta
hat
87
1 7
4M
oran
g1,
617
57S
arla
hi
802
75
Jhap
a1,
302
58M
ahot
ari
78
959
Dh
an
usa
99
4To
tal
1079
Tota
l 9
88To
tal
1,
254
Tota
l1,
597
Tota
l1,
202
1,31
0N
EPA
L1,
310
Sou
rce:
UN
DP
. 200
4; A
ppen
dix
2.1,
Tab
le 1
0, p
p.15
4–15
7.

Appendix M
June 2005
Population G
rowth R
ate 1991–2001
70
AFA
R W
ES
T%
BM
ID W
ES
T%
CW
ES
T%
DC
EN
TRA
L%
EE
AS
T%
I M
ou
ntain
1.78IV
Mo
un
tain1.71
VII
Mo
un
tain2.23
XM
ou
ntain
1.64X
IIIM
ou
ntain
1.12
1D
archula1.82
10H
umla
1.6625
Mustang
0.4741
Rasuw
a1.97
60S
olu-Khum
bu1.02
2B
ajhang1.83
11M
ugu1.89
26M
anang5.81
42S
indhu-Palchok
1.5961
Sankhuw
a-Sava
1.153
Bajura
1.6712
Kalikot
1.7343
Dolakha
1.6562
Taplejung
1.1513
Jumla
1.6314
Dolpo
1.67II
Hill
1.75 V
Hill
1.89V
IIIH
ill1.43
XI
Hill
2.79X
IVH
ill 1.4
4B
aitadi1.55
15D
ailekh1.84
27A
rgha Khanchi
1.42 C
With K
V2.79
63O
khaldhunga0.17
5D
adheldhura1.87
16Jajarkot
1.6828
Palpa
1.28C
aW
ithout KV
1.7864
Khotang
0.696
Doti
2.1417
Rukum
1.9229
Gulm
i1.08
44M
akwanpur
2.2265
Bhojpur
0.957
Achham
1.5418
Surkhet
2.4530
Baglung
1.4645
Dhading
1.9766
Udayapur
2.6319
Salyan
1.6131
Myagdi
1.2946
Nuw
akot1.62
67D
hankuta 2.1
20R
olpa1.56
32P
arbat0.95
47K
abhre-Palanchok
1.7368
Terhathum
1.2921
Pyuthan
1.9133
Kaski
2.6248
Ram
echhap1.22
69P
anchthar1.43
34S
yangja0.78
49S
indhuli2.23
70Ilam
2.135
Tanahu
1.62C
bK
athmandu V
alley4.23
36Lam
jung1.42
50K
athmandu
4.7137
Gorkha
1.3251
Lalitpur2.73
52B
haktapur2.65
IIIT
arai3.86
VI
Tarai
2.8 IX
Tarai
2.76X
IIT
arai 2.6
XV
Tarai
2.168
Kanchanpur
3.8222
Bardiya
2.7638
Kapilvastu
2.653
Chitw
an2.86
71S
iraha2.17
9K
ailali3.89
23B
anke3.01
39R
upandehi3.05
54P
arsa2.89
72S
aptari2.03
24D
ang-2.66
40N
awalparasi
2.5555
Bara
2.9673
Sunsari
3D
eukhuri56
Rautahat
2.7574
Morang
2.2357
Sarlahi
2.5575
Jhapa1.48
58M
ahotari2.29
59D
ha
nu
sa2.11
Total2.26
Total2.26
Total1.92
Total2.61
Total1.84
NEPA
L2.25
Source: C
BS
. 2003d; Table 2.5.
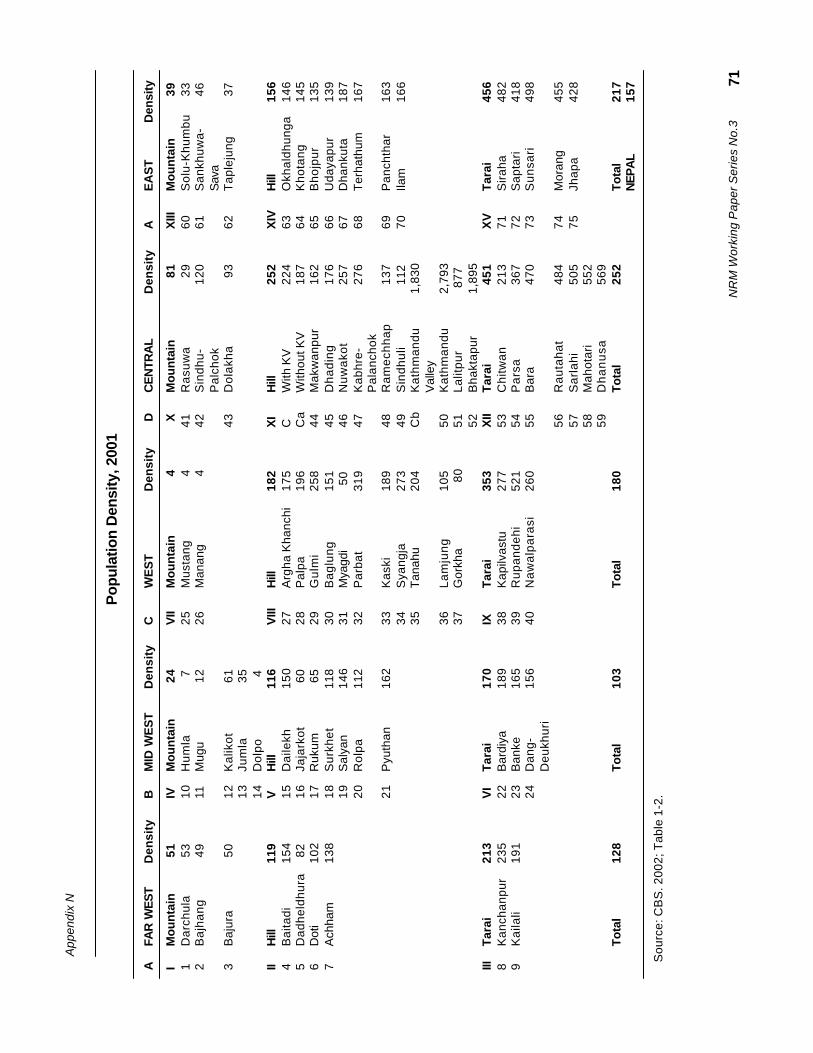
App
endi
x N
NR
M W
orki
ng P
aper
Ser
ies
No.
3
Pop
ulat
ion
Den
sity
, 200
1
71
AFA
R W
ES
TD
ensi
tyB
MID
WE
ST
Den
sity
CW
ES
TD
ensi
ty D
CE
NTR
AL
Den
sity
AE
AS
T
Den
sity
IM
ou
nta
in 5
1IV
Mo
un
tain
24
VII
Mo
un
tain
4
XM
ou
nta
in
81
XIII
Mo
un
tain
39
1D
arch
ula
53
10H
umla
7
25M
usta
ng
441
Ras
uwa
2
960
Sol
u-K
hum
bu 3
32
Baj
hang
49
11M
ugu
12
26M
anan
g
442
Sin
dhu-
12
061
San
khuw
a- 4
6P
alch
okS
ava
3B
ajur
a 5
012
Kal
ikot
61
43D
olak
ha
93
62T
aple
jung
37
13Ju
mla
35
14D
olpo
4
IIH
ill11
9V
Hill
116
VIII
Hill
182
XI
Hill
25
2X
IVH
ill15
64
Bai
tadi
154
15D
aile
kh15
027
Arg
ha K
hanc
hi17
5C
With
KV
22
463
Okh
aldh
unga
146
5D
adhe
ldhu
ra 8
216
Jaja
rkot
60
28P
alpa
196
Ca
With
out K
V
187
64K
hota
ng14
56
Dot
i10
217
Ruk
um 6
529
Gul
mi
258
44M
akw
anpu
r
162
65B
hojp
ur13
57
Ach
ham
138
18S
urkh
et11
830
Bag
lung
151
45D
hadi
ng
176
66U
daya
pur
139
19S
alya
n14
631
Mya
gdi
50
46N
uwak
ot
257
67D
hank
uta
187
20R
olpa
112
32P
arba
t31
947
Kab
hre-
27
668
Ter
hath
um16
7P
alan
chok
21P
yuth
an16
233
Kas
ki18
948
Ram
echh
ap
137
69P
anch
thar
163
34S
yang
ja27
349
Sin
dhul
i
112
70Ila
m16
635
Tan
ahu
204
Cb
Kat
hman
du1,
830
Val
ley
36La
mju
ng10
550
Kat
hman
du2,
793
37G
orkh
a
8051
Lalit
pur
877
52B
hakt
apur
1,89
5III
Tar
ai21
3V
IT
arai
170
IXT
arai
353
XII
Tar
ai
451
XV
Tar
ai45
68
Kan
chan
pur
235
22B
ardi
ya18
938
Kap
ilvas
tu27
753
Chi
twan
21
371
Sira
ha48
29
Kai
lali
191
23B
anke
165
39R
upan
dehi
521
54P
arsa
36
772
Sap
tari
418
24D
ang-
156
40N
awal
para
si26
055
Bar
a
470
73S
unsa
ri49
8D
eukh
uri
56R
auta
hat
48
474
Mor
ang
455
57S
arla
hi
505
75Jh
apa
428
58M
ahot
ari
55
259
Dh
an
usa
56
9To
tal
128
Tota
l10
3To
tal
180
Tota
l
252
Tota
l21
7N
EPA
L15
7
Sou
rce:
CB
S. 2
002;
Tab
le 1
-2.
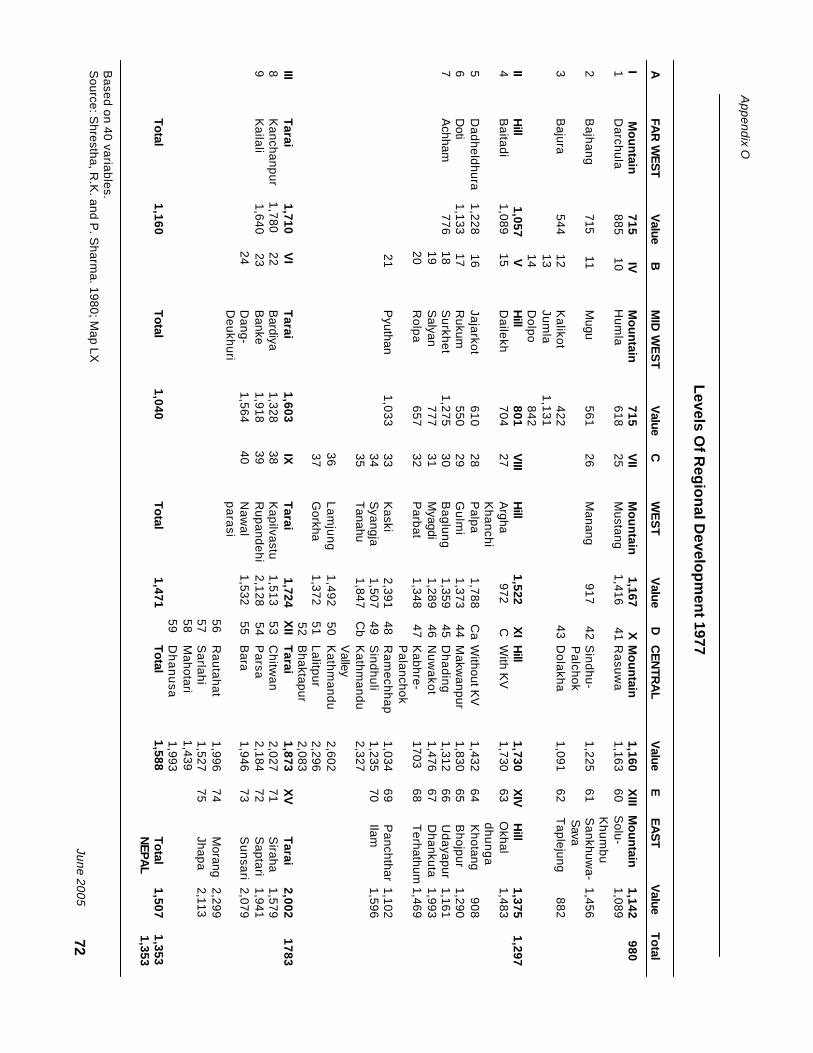
Appendix O
June 2005
Levels O
f Reg
ion
al Develo
pm
ent 1977
72
AFA
R W
ES
TV
alueB
MID
WE
ST
Value
CW
ES
T V
alue DC
EN
TRA
LV
alueE
EA
ST
Value
Total
I M
ou
ntain
715IV
Mo
un
tain715
VII
Mo
un
tain 1,167 X
Mo
un
tain1,160
XIII M
ountain 1,142 980
1D
archula885 10 H
umla
61825
Mustang 1,416 41
Rasuw
a1,163
60 Solu-
1,089 K
humbu
2B
ajhang715 11
Mugu
56126
Manang
917 42S
indhu-1,225
61 Sankhuw
a- 1,456
Palchok
Sava
3B
ajura544 12
Kalikot
422 43
Dolakha
1,09162 T
aplejung 882
13Jum
la 1,131
14D
olpo842
IIH
ill 1,057 V
Hill
801V
IIIH
ill 1,522 X
IH
ill1,730
XIV
Hill
1,375 1,297
4B
aitadi 1,089 15
Dailekh
70427
Argha
972 CW
ith KV
1,73063 O
khal 1,483
Khanchi
dhunga5
Dadheldhura 1,228 16
Jajarkot610
28P
alpa 1,788 C
aW
ithout KV
1,43264 K
hotang 908
6D
oti 1,133 17
Rukum
55029
Gulm
i 1,373 44
Makw
anpur1,830
65 Bhojpur
1,2907
Achham
776 18S
urkhet 1,275
30B
aglung 1,359 45
Dhading
1,31266 U
dayapur 1,161
19S
alyan777
31M
yagdi 1,289 46
Nuw
akot1,476
67 Dhankuta
1,993 20
Rolpa
65732
Parbat
1,348 47K
abhre-1703
68 Terhathum
1,469P
alanchok 21
Pyuthan
1,03333
Kaski
2,391 48R
amechhap
1,03469 P
anchthar 1,10234
Syangja
1,507 49S
indhuli1,235
70 Ilam 1,596
35T
anahu 1,847 C
bK
athmandu
2,327V
alley 36
Lamjung 1,492 50
Kathm
andu2,602
37G
orkha 1,372 51
Lalitpur2,296
52B
haktapur2,083
IIIT
arai 1,710 V
IT
arai 1,603
IXT
arai 1,724 X
IIT
arai1,873
XV
Tarai
2,002 1783
8K
anchanpur 1,780 22B
ardiya 1,328 38
Kapilvastu 1,513 53
Chitw
an2,027
71S
iraha 1,579
9K
ailali 1,640 23
Banke
1,918 39R
upandehi 2,128 54P
arsa2,184
72S
aptari 1,941
24D
ang- 1,564 40
Naw
al 1,532 55
Bara
1,94673
Sunsari 2,079
Deukhuri
parasi 56
Rautahat
1,99674
Morang
2,299 57
Sarlahi
1,52775
Jhapa 2,113
58M
ahotari 1,439 59
Dh
an
usa
1,993Total
1,160Total
1,040Total
1,471Total
1,588Total
1,507 1,353N
EPAL
1,353
Based on 40 variables.
Source: S
hrestha, R.K
. and P. S
harma. 1980; M
ap LX

App
endi
x P
NR
M W
orki
ng P
aper
Ser
ies
No.
3
Com
posi
te D
evel
opm
ent I
ndex
,200
1
73
AFA
R W
ES
TIn
dex
BM
ID W
ES
TIn
dex
CW
ES
T
In
dex
D
CE
NTR
AL
Inde
xE
E
AS
TIn
dex
Tota
l
I M
ou
nta
in0.
26IV
Mo
un
tain
0.22
VII
Mo
un
tain
0
.60
XM
ou
nta
in0.
44X
III
Mou
ntai
n0.
56
0
.41
1D
arch
ula
0.38
10H
umla
0.18
25M
usta
ng
0
.57
4
1R
asuw
a0.
460
S
olu-
0.55
K
hum
bu2
Baj
hang
0.18
11M
ugu
0.13
26M
anan
g
0.
63
42
Sin
dhu-
0.42
61
San
khuw
a-0.
58P
alch
ok
Sav
a3
Baj
ura
0.22
12K
alik
ot0.
24
43
Dol
akha
0.49
62
Tap
leju
ng0.
5413
Jum
la0.
2514
Dol
po0.
29II
Hill
0.30
VH
ill0.
40V
IIIH
ill
0
.58
X
IH
ill0.
57X
IV
Hill
0.56
0.4
84
Bai
tadi
0.33
15D
aile
kh0.
3327
Arg
ha
0
.48
C
With
KV
0.57
63
O
khal
0.51
Kha
nchi
dhun
ga5
Dad
held
hura
0.39
16Ja
jark
ot0.
3628
Pal
pa
0
.65
C
aW
ithou
t KV
0.50
64
K
hota
ng0.
516
Dot
i0.
2917
Ruk
um0.
3629
Gul
mi
0.5
6
44
Mak
wan
pur
0.56
65
B
hojp
ur0.
547
Ach
ham
0.20
18S
urkh
et0.
5530
Bag
lung
0.5
6
45
Dha
ding
0.47
66
U
daya
pur
0.48
19S
alya
n0.
4631
Mya
gdi
0.5
6
46
Nuw
akot
0.52
67
D
hank
uta
0.65
20R
olpa
0.32
32P
arba
t
0
.57
4
7K
abhr
e-0.
668
Ter
hath
um0.
58P
alan
chok
21
Pyu
than
0.41
33K
aski
0.6
8
48
Ram
echh
ap0.
4169
Pan
chth
ar0.
5634
Sya
ngja
0.6
4
49
Sin
dhul
i0.
4170
Ilam
0.63
35T
anah
u
0
.60
C
bK
athm
andu
0.71
Val
ley
36La
mju
ng
0
.57
50
Kat
hman
du
0.7
737
Gor
kha
0.5
4
51
Lalit
pur
0.68
5
2B
hakt
apur
0.69
IIIT
arai
0.52
VI
Tar
ai0.
55IX
Tar
ai
0
.50
X
IIT
arai
0.41
XV
Tar
ai0.
51
0
.50
8K
anch
anpu
r
0
.52
22
Bar
diya
0.52
38K
apilv
astu
0
.39
5
3C
hitw
an0.
6971
Sira
ha0.
389
Kai
lali
0.51
23
Ban
ke0.
5539
Rup
ande
hi
0.61
5
4P
arsa
0.41
72
S
apta
ri0.
4324
Dan
g-0.
5740
Naw
al
0
.51
5
5B
ara
0.39
73
S
unsa
ri0.
61D
eukh
uri
para
si
56R
auta
hat
0.26
74
M
oran
g0.
63
57S
arla
hi0.
3575
Jha
pa0.
69
58M
ahot
ari
0.3
59
Dh
an
usa
0.44
Tota
l0.
36To
tal
0.39
Tota
l
0.
56To
tal
0.47
Tota
l0.
55
0
.47
NEP
AL
0.4
7
Sou
rce:
Inte
rnat
iona
l Cen
ter
for
Inte
grat
ed M
ount
ain
Dev
elop
men
t. 20
03; M
ap 2
.

Appendix Q
June 2005
Land Use and P
opulation Change in Terai, 1963/64 -2000
74
S.N
o.
Particu
larFA
R W
ES
TW
ES
TE
AS
T + CE
NTR
AL
To
tal
I.F
orest area d
ecrease
11963/64 - 1978/79
-0.9 -3.4
-38.1 -17.2
21978/79 - 2001
-21.8 17.5
-11.7 17.7
31963/64 - 2001
-22.5 -20.3
-45.3 -31.9
II.F
orest area, %
of reg
ion
41963/64
72 48.8
40.5 51.1
51978/79
67.5 44.7
28.1 43.7
62001
55.7 36.1
24.7 36.3
III.A
gri. L
and
increase
71963/64 - 1978/79
+120.7+23.9
12.3 25.1
81978/79 - 2001
+44.1+17.9
+10.5 17.7
91963/64 - 2001
+218.1+46.1
+24.9 +47.2
IV.
Ag
ri.land
, % o
f regio
n 10
1963/64 12.8
43.8 51.1
38.5 11
1978/79 26.8
50.4 64.3
49.8 12
2001 40.9
58.2 70.6
59.2V
.P
op
ulatio
n in
crease % 13
1961 - 1981 206.1
129 91.6
107.7 14
1981 - 2001 113.6
82.6 60.2
71.1 15
1961 - 2001 553.8
318.2 207
255.5V
I.A
s % o
f total P
op
ulatio
n 16
1961 2.9
4.4 23.5
30.8 17
1981 5.5
6.4 28.2
40.1 18
2001 7.6
7.5 29.3
44.5
Sources: F
orest Resources S
urvey. 1967; and Japan Forest T
echnology Association. 2000.

App
endi
x R
NR
M W
orki
ng P
aper
Ser
ies
No.
3
Land
Use
Cat
egor
ies
by P
hsio
grap
hic
Div
isio
n, 1
977/
78
75
Dev
. Reg
ion/
Ag
ricu
ltu
reA
gri
cult
ure
Gra
zing
Fore
st
O
ther
s
T
otal
S.N
.P
hysi
ogra
phic
Div
.C
ult
ivat
ed
N
on-C
ultiv
ated
A.
FAR
WE
ST
293
,198
111,
671
214
,901
1,04
9,92
9
274
,411
1,
944,
110
1H
igh
Him
alay
a
282
72
5
3,74
7
17,8
82
19
7,02
2
26
9,00
52
Hig
h M
ount
ain
37
,542
20,
910
7
7,42
8 2
38,7
60
4
9,13
6
42
3,77
63
Mid
dle
Mou
tain
140
,259
73,
514
6
9,13
4 4
21,4
10
1
2,12
2
71
6,43
94
Siw
alik
9,88
5
4,70
6
964
177
,806
4
,088
197,
449
5Te
rai
105
,230
12,
469
1
3,62
8 1
94,0
71
1
2,04
3
33
7,44
1B
.M
ID W
ES
T 4
53,9
00
1
77,0
45 7
83,8
44
1,
726,
986
1,1
38,4
27
4,28
0,20
26
Hig
h H
imal
aya
1,43
2
4
13 4
24,1
30
57,
425
1,0
19,1
30
1,50
2,53
07
Hig
h M
ount
ain
9
0,36
2 5
3,79
4 2
53,0
46 6
70,4
36
7
9,83
2
1,14
7,47
08
Mid
dle
Mou
tain
175
,199
97,
195
9
6,23
9
427,
28
7,4
15
80
3,32
99
Siw
alik
8
6,37
4 1
3,36
5
5,
101
447
,475
17,
887
570,
202
10Te
rai
100
,533
12,
278
53
8 1
24,3
69
1
4,16
3
25
6,67
1C
.W
ES
TER
N 5
91,7
2022
6,51
6 4
37,8
82
1
,061
,037
6
18,3
58
293
5,51
311
Hig
h H
imal
aya
5,42
7
1
,091
290
,248
5
7,36
4
528
,739
882,
869
12H
igh
Mou
ntai
n
39,
274
23,
471
78,
954
288
,974
59,
114
489,
787
13M
iddl
e M
outa
in 3
08,6
53
1
77,5
17
63,1
66 4
51,0
12
1
1,43
7
1,01
1,78
514
Siw
alik
3
2,05
6
9,9
37
2,5
14 1
82,3
23
1
0,40
5
23
7,23
515
Tera
i 2
06,3
10 1
4,50
0
3,0
00
81,
364
8,
663
313,
837
D.
CE
NTR
AL
790
,667
235
,025
142
,453
1,3
27,7
42
238
,241
2,
734,
128
16H
igh
Him
alay
a
52
1
1
53,5
38
26,
240
1
44,4
21
22
4,26
217
Hig
h M
ount
ain
3
3,28
1 2
0,95
6
37,7
68 2
53,2
14
2
1,72
6
36
6,94
518
Mid
dle
Mou
tain
279
,664
154
,785
2
6,04
6 4
56,5
73
1
4,12
8
93
1,19
619
Siw
alik
9
8,21
2 2
0,81
9
11,
354
466
,685
32,
588
629,
655
20Te
rai
379
,458
38,
454
1
3,74
7 1
25,0
30
2
5,37
8
56
2,06
7E.
EA
STE
RN
838
,532
236
,401
178
,080
1,1
40,7
66
460
,147
2,
853,
926
21H
igh
Him
alay
a
540
150
6
2,69
3
62,
550
3
44,6
20
47
0,55
322
Hig
h M
ount
ain
4
4,30
0 2
7,75
2
62,
500
361
,684
34,
883
531,
119
23M
iddl
e M
outa
in 3
18,5
48
1
62,5
12
38,
105
446
,112
15,
586
960,
863
24S
iwal
ik
32,
366
6
,384
82
8 2
02,3
41
4,30
3
25
1,22
225
Tera
i 4
42,7
78 3
9,60
3
13,
954
6
8,07
9
55
,755
620,
369
Tota
l
2
,968
,017
986,
658
1,75
7,16
06,
306,
460
2,72
9,58
4
14,7
47,8
79
Sou
rce:
Ken
ting
Ear
th S
cien
ces.
198
6; A
ppen
dix
5, p
.11.

Nepal R
egional Strategy for D
evelopment
Harka G
urung
June 2005
Source: G
urung, H. 2002; p.27.
Population
Area
Revenue
S.N
o.R
EG
ION
/ DIS
TRIC
TE
levation Zone (2001) (km
2)(1999/2000), N
Rs‘000
I.FA
R-W
ES
T 2,307,741
21,280 472,221
1B
yasrishiM
ountain/Hill
483,717 5,379
78,0192
Saipal
Mountain/H
ill 376,335
5,447 14,657
3M
alikaM
ountain/Hill
447,767 5,609
9,2614
Mohana
Tarai 999,922
4,845 370,284
II.M
ID-W
ES
T 2,916,430
40,637 791,428
5K
arnaliM
ountain 204,007
19,610 15,264
6B
abaiH
ill/Tarai
1,290,555 8,315
640,9387
Bheri
Hill
535,581 6,569
20,3018
Sw
argadwari
Hill/Inner T
arai 886,287
6,143 114,925
III.W
ES
T 4,569,622
29,3983,455,400
9D
haulagiriM
ountain 129,931
5,870 16,358
10R
iriH
ill 775,467
4,126 63,312
11S
rinagarH
ill/Tarai
2,016,718 6,633
2,881,13112
Annapurna
Hill
1,172,550 5,221
458,89913
Manaslu
Mountain/H
ill 474,956
7,548 35,700
IV.C
entral
8,059,050 27,411
33,736,62014
Trisuli
Mountain/H
ill 671,652
4,591 43,915
15K
athmandu
Hill
1,656,951 899
21,960,63416
Rapti
Inner Tarai
860,005 4,644
1,678,92017
Sailung
Mountain/H
ill 1,108,554
7,676 961,106
18S
imaraon
Tarai 1,599,191
3,6698,251,342
19K
amala
Inner Tarai/T
arai 2,162,697
5,932 840,703
V.E
AS
T 5,363,395
28,4571,574,083
20S
agarmatha
Mountain/H
ill 496,441
6,146 41,051
21C
haudandiInner T
arai/Tarai
1,438,153 4,614
278,54022
Arun
Mountain/H
ill 530,577
6,044 44,767
23B
ijayapurTarai
1,471,953 3,112
321,36624
Tam
orM
ountain/Hill
452,276 5,232
35,10025
Kankai
Hill/T
arai 973,995
3,309 853,259
NEPA
L 23,216,238 147,183
40,029,752
Po
pu
lation
, Area an
d R
evenu
e of P
rop
osed
Districts
76

77
NRM WORKING PAPER SERIES
(Published in-house; Available through ADB/NRM and online at www. adb.org/nrm;Free of charge)
No. 1 Nepal Macroeconometric Model—Sungsup Ra and Chang Yong Rhee, June 2005
No. 2 Measuring the Economic Costs of Conflict: The Effect of Declining DevelopmentExpenditures on Nepal’s Economic Growth—Sungsup Ra and Bipul Singh, June 2005
No. 3 Nepal Regional Strategy for Development—Harka Gurung, June 2005
No. 4 Ethnic and Caste Diversity: Implications for Development—Rajendra Pradhan and Ava Shrestha, forthcoming

Nepal Resident MissionSrikunj, Kamaladi, Ward No. 31Post Box 5017Kathmandu, NepalTel: +977 1 422 7779Fax: +977 1 422 [email protected]/nrm