Nelcast Limited CMP - Spark Capitalmailers.sparkcapital.in/uploads/Mukesh/Nelcast_June 2015.pdf ·...
13
Nelcast Limited CMP Rs. 35 Stock Performance (%) 1m 3m 12m Nelcast -14% 5% 0% Sensex -2% -7% 5% BSE Auto -4% -7% 21% Financial Summary Year Revenues (Rs. mn) EBITDA (Rs. mn) EBITDA Margin Adj. PAT (Rs. mn) Adj. EPS (Rs.) P/E(x) EV/EBITDA(x) FY15 5,466 469 8.6% 219 2.5 13.9 7.3 FY16E 6,583 625 9.5% 333 3.8 9.2 5.5 FY17E 7,952 875 11.0% 517 5.9 5.9 3.7 Date June 19, 2015 Market Data SENSEX 26833 Nifty 8092 Bloomberg NELC IN Shares o/s 87mn Market Cap Rs. 3bn 52-wk High-Low Rs. 48-26 3m Avg. Daily Vol Rs. 2mn Index member BSESMCAP Latest shareholding (%) Promoters 74.4 Institutions 0.1 Public 25.5 Company Update Nelcast is India’s largest iron casting manufacturer, supplying primarily to tractors (~40% of revenue) and MHCVs (~60%). FY12 was the last year when both the tractors and MHCV industry recorded a positive growth; we believe Nelcast is well poised to benefit from the expected recovery in both tractors (from 2HFY16) and MHCVs in FY16 and FY17. This coupled with the company’s expected growth in exports and non-auto (rail) is expected to drive steep revenue growth. Furthermore, scrap steel (key raw material) prices have weakened considerably, providing margin cushion. We believe the stock is attractively placed at sub-6x FY17 P/E (FY15 PE at 14x) Key beneficiary of growth in multi-axle CVs: Nelcast primarily supplies wheel hubs, differential carriers and axle housings to CVs. These parts are typically load bearings components and are not expected to move to aluminum castings (globally iron castings are used). Moreover, content per vehicle increases significantly as the number of axles/wheels per vehicle increases. Multi-axle (MAV) CAGR (FY13-FY15) was 3% vs. de-growth of 16% for MHCVs. We expect MAVs to continue outgrowing overall CVs. Nelcast caters to ~60% of Ashok Leyland’s requirement and recently started supplies to Bharat Benz. We expect overall MHCV volume CAGR of 21% from FY15-FY17 and hence the growth for Nelcast’s MHCV revenues should be higher. We factor in 20% CV revenue CAGR for Nelcast and believe there is an upside to our estimate. Tractors to see recovery in 2HFY16: Use of iron casting is higher in tractors vs. CVs as typically users prefer tractors to be as heavy as possible. Key components supplied include transmission case, axle housing, hydraulic lift cover among others. Nelcast caters to ~60% of TAFE’s requirement and also supplies to Escorts and other smaller players. Supply to M&M is negligible as the company sources iron castings primarily from group company, Mahindra Hinoday. We expect tractor volumes to recover from 2HFY16 and post a ~7% CAGR from FY15-FY17. Margins to improve in-line with recovery: Over the last 15 years, we have seen Nelcast’s margin record a steep pick-up in-line with cyclical recovery in tractors and CVs. We have witnessed the company’s EBITDA margin peak at ~12.5% in FY08 and in FY12. Current capacity utilization stands at ~50% and with improving volumes for MHCVs and Tractors, we conservatively expect EBITDA to improve to 11% in FY17 from 8.6% in FY15. With improvement in higher tonnage vehicles, the variable expenses are also expected to reduce as a % of sales and hence there is an upside to our estimate. Exports and others: Currently exports and other segments are negligible, however with new orders from Daimler and American Axles (Thailand), the company expect a steep growth in exports. Nelcast has also recently started supplies of ‘base plates’ for metro rail. The company targets ~10% of revenues from exports and other segments by FY17. Good balance sheet with a net debt/equity of 0.1x, negligible capex requirement over the next two years bode well for the company. We expect post tax RoCEs to improve to 13% in FY17 from ~7% in FY15 (~15% in FY12) Levered to recovery in MHCV and tractors MUKESH SARAF [email protected] +91 44 4344 0041 ROHIT KRISHNA [email protected] +91 44 4344 0020 Find Spark Research on Bloomberg (SPAK <go>), Thomson First Call, Reuters Knowledge and Factset Page 1
Transcript of Nelcast Limited CMP - Spark Capitalmailers.sparkcapital.in/uploads/Mukesh/Nelcast_June 2015.pdf ·...
Nelcast Limited CMP
Rs. 35
Stock Performance (%)
1m 3m 12m
Nelcast -14% 5% 0%
Sensex -2% -7% 5%
BSE Auto -4% -7% 21%
Financial Summary
Year Revenues (Rs. mn) EBITDA (Rs. mn) EBITDA Margin Adj. PAT (Rs. mn) Adj. EPS (Rs.) P/E(x) EV/EBITDA(x)
FY15 5,466 469 8.6% 219 2.5 13.9 7.3
FY16E 6,583 625 9.5% 333 3.8 9.2 5.5
FY17E 7,952 875 11.0% 517 5.9 5.9 3.7
Date June 19, 2015
Market Data
SENSEX 26833
Nifty 8092
Bloomberg NELC IN
Shares o/s 87mn
Market Cap Rs. 3bn
52-wk High-Low Rs. 48-26
3m Avg. Daily Vol Rs. 2mn
Index member BSESMCAP
Latest shareholding (%)
Promoters 74.4
Institutions 0.1
Public 25.5
Company Update Nelcast is India’s largest iron casting manufacturer, supplying primarily to tractors (~40% of revenue) and MHCVs
(~60%). FY12 was the last year when both the tractors and MHCV industry recorded a positive growth; we believe
Nelcast is well poised to benefit from the expected recovery in both tractors (from 2HFY16) and MHCVs in FY16
and FY17. This coupled with the company’s expected growth in exports and non-auto (rail) is expected to drive
steep revenue growth. Furthermore, scrap steel (key raw material) prices have weakened considerably, providing
margin cushion. We believe the stock is attractively placed at sub-6x FY17 P/E (FY15 PE at 14x)
Key beneficiary of growth in multi-axle CVs: Nelcast primarily supplies wheel hubs, differential carriers and axle
housings to CVs. These parts are typically load bearings components and are not expected to move to aluminum castings
(globally iron castings are used). Moreover, content per vehicle increases significantly as the number of axles/wheels per
vehicle increases. Multi-axle (MAV) CAGR (FY13-FY15) was 3% vs. de-growth of 16% for MHCVs. We expect MAVs to
continue outgrowing overall CVs. Nelcast caters to ~60% of Ashok Leyland’s requirement and recently started supplies to
Bharat Benz. We expect overall MHCV volume CAGR of 21% from FY15-FY17 and hence the growth for Nelcast’s MHCV
revenues should be higher. We factor in 20% CV revenue CAGR for Nelcast and believe there is an upside to our estimate.
Tractors to see recovery in 2HFY16: Use of iron casting is higher in tractors vs. CVs as typically users prefer tractors to
be as heavy as possible. Key components supplied include transmission case, axle housing, hydraulic lift cover among
others. Nelcast caters to ~60% of TAFE’s requirement and also supplies to Escorts and other smaller players. Supply to
M&M is negligible as the company sources iron castings primarily from group company, Mahindra Hinoday. We expect
tractor volumes to recover from 2HFY16 and post a ~7% CAGR from FY15-FY17.
Margins to improve in-line with recovery: Over the last 15 years, we have seen Nelcast’s margin record a steep pick-up
in-line with cyclical recovery in tractors and CVs. We have witnessed the company’s EBITDA margin peak at ~12.5% in
FY08 and in FY12. Current capacity utilization stands at ~50% and with improving volumes for MHCVs and Tractors, we
conservatively expect EBITDA to improve to 11% in FY17 from 8.6% in FY15. With improvement in higher tonnage
vehicles, the variable expenses are also expected to reduce as a % of sales and hence there is an upside to our estimate.
Exports and others: Currently exports and other segments are negligible, however with new orders from Daimler and
American Axles (Thailand), the company expect a steep growth in exports. Nelcast has also recently started supplies of
‘base plates’ for metro rail. The company targets ~10% of revenues from exports and other segments by FY17.
Good balance sheet with a net debt/equity of 0.1x, negligible capex requirement over the next two years bode well for the
company. We expect post tax RoCEs to improve to 13% in FY17 from ~7% in FY15 (~15% in FY12)
Levered to recovery in MHCV and tractors
MUKESH SARAF [email protected] +91 44 4344 0041
ROHIT KRISHNA [email protected] +91 44 4344 0020 Find Spark Research on Bloomberg (SPAK <go>),
Thomson First Call, Reuters Knowledge and Factset
Page 1

Nelcast Limited CMP
Rs. 35
Corporate Factsheet
Promoter Background
Nelcast Limited was set up in 1985 by Mr. Radhakrishna Reddy and is engaged in the business of manufacture of ferrous
castings. The company has a production capacity of 150,000 MT per annum and can produce parts ranging from 0.5 to 260
Kgs. Machining division was set up in 2008.
Business The company primarily caters to the heavy commercial vehicle and tractor segment. Product portfolio includes wheel hubs,
axle housing, brackets, cylinder heads and blocks.
Management
Mr. P. Deepak – Managing Director
Double masters in Engineering from Northwestern University, USA and MBA at Kellogg School of Management; four years of
industrial experience including at Federal-Mogul Corp, USA
Mr. Vijaya Bhaskar Reddy – Dy. Managing Director
Graduate in Law and Member of Institute of Chartered Accountants of India; he has been with Nelcast since its inception and
has a total of 32 years of experience
Presence The company has manufacturing facilities at Gudur, Andhra Pradesh and Ponneri, Tamil Nadu.
Corporate Structure The promoters’ stake in Nelcast Limited 74.4% as of March 2015. Nelcast has 97.5% in NC Energy which is in the business of
development and sale of power plant.
Revenue Model The company derived 60% of its revenue in FY15 from the heavy commercial vehicle segment and 37% from the tractors
segment. Non-auto and exports contributed to ~Rs.50mn in FY15.
Key Success Factors One of the biggest players in the segment, long standing relationship with most OEMs, conservative and prudent management
Credit Rating ICRA A (Long-term) and A1 (Short-term)
Corporate Bankers State Bank of India, Kotak Mahindra, Standard Chartered, HSBC
Auditors J.B. Reddy, Hyderabad
Corporate Office TTK Road, Alwarpet, Chennai
Page 2

Nelcast Limited CMP
Rs. 35
TYPES OF
CASTING
Sand Casting Die Casting
Centrifugal Casting
Used for production of large parts
Mold shaped using natural or synthetic
sand and mold cavity is made of metal or
wood
Surface of sand castings are rough due to
surface impurities
Machining is mostly required
Metal is forced into mold at a high pressure
Used for production of multiple identical
parts
Better surface finish and increased
dimensional accuracy
Might not require machining to get the
dimensions
Die casting molds take longer time to
produce are expensive as it is made from
hardened steel Used for industrial applications where durabilty
of parts are very important
As molten metal is poured a permanent mold
spins at high speeds around its axis
Molten metal moves towards the mold walls
due to centrifugal force, solidifies after cooling,
producing a fine part
Parts produced this way are usually resistant to
atmospheric corrosion
Nelcast primarily does Sand Casting
Page 3

Nelcast Limited CMP
Rs. 35 Product Portfolio
Page 4
Commercial Vehicles
Wheel Hubs Brake Drums Differential Carriers & Axle Housing
Slide Support Shackles Brackets
Railways
Inserts/Shoulders for Concrete Sleepers
Tractors
Transmission Case Centre Housing Rear Axle Housing Hydraulic Lift Cover

Nelcast Limited CMP
Rs. 35
Growth in CVs and Tractor industries has mostly moved in the same direction, leading to high revenue volatility
Source: SIAM, Spark Capital
Segment Breakup between CV and Tractor
Source: Company, Spark Capital
Revenue growth remains volatile driven by end markets
Source: Company, Spark Capital
Primarily caters to CV and Tractor markets
CV 80%
Tractors 20%
CV 60%
Tractors 40%
-30%
-20%
-10%
0%
10%
20%
30%
40%
50%
60%
70%
0
1000
2000
3000
4000
5000
6000
7000
Revenue Revenue yoy %
-40%
-30%
-20%
-10%
0%
10%
20%
30%
40%
50%
FY00 FY01 FY02 FY03 FY04 FY05 FY06 FY07 FY08 FY09 FY10 FY11 FY12 FY13 FY14 FY15
Tractors yoy % HCV yoy %
Page 5
FY 05 FY 15

Nelcast Limited CMP
Rs. 35
Realization has gone up with steel prices, higher share of machining
and better product mix with increased share of Ductile iron
Source: Company, Spark Capital
0
10,000
20,000
30,000
40,000
50,000
60,000
70,000
80,000
90,000
FY86 FY96 FY01 FY07 FY08 FY09 FY10 FY11 FY12
Realization (Rs per MT)
Grey Iron and Ductile Iron
Grey Iron and Ductile Iron (also known as Spheroidical Graphite Iron)
are two different types of Cast Irons with differences in the type or
structure of the carbon present in them.
Both are prepared by adding carbon in the hot beds but in the case of
ductile iron, magnesium is also added.
Ductile iron can be drawn into wires whereas grey iron can not be
elongated.
The tensile strength of grey iron is 20,000 psi (pound per square inch)
whereas that of ductile iron is 60,000 psi.
Thermal Conductivity is lower in ductile iron.
Grey iron dampens vibrations more as compared to ductile iron, and
therefore is used in the manufacturing of milling machines.
Total weight of iron castings
– 400 Kgs
Primarily Grey Iron
Grey Iron realization lower
owing to its properties
(lower in value chain)
Also, unorganized capacity
in grey iron is very high
Top customer is TAFE;
caters to 60% of the
company’s requirement
Other customers include
Escorts and Sonalika
M&M primarily sources
from its group company and
Kirloskar
Total weight of iron castings
– 750 Kgs
Primarily Ductile Iron
Realization is therefore
higher
Bigger and heavier parts in
ductile iron small players
can not make
Top customers in this
segment are AL and Tata
Motors
Supply to ~60% of AL’s and
a smaller share of Tata
Motor’s requirement
Daimler has the best
realization followed by AL
and then TTMT
Page 6
Top customers are TAFE and Ashok Leyland

Nelcast Limited CMP
Rs. 35
Export and Rail segments to account for ~10% of overall revenue
Source: Company, Spark Capital
59% 55%
39% 35%
0%
10%
20%
30%
40%
50%
60%
70%
80%
90%
100%
FY15 FY17
HCV Tractors Exports Rail
Revenue to move in line with MHCV
tonnage growth
Source: SIAM, Spark Capital
Page 7
Railways
Nelcast has recently commenced supplying base plate for the railway
markets to both Pandol (UK) and Vossloh (Germany) (both global
leaders in the rail technology segment). Although, this segment is
currently small, it has the potential to scale to about 5% of the total
revenue by FY17.
Exports
Nelcast supplies Axle box to American Axle (for UVs in Thailand) and
Daimler having been satisfied with the performance of the company’s
product in the domestic market would now be giving orders for their
overseas business as well. Exports expected to be account for at least
5% of revenue in FY17.
-60%
-40%
-20%
0%
20%
40%
60%
80%
Sep-1
3
Nov-1
3
Jan-1
4
Mar-
14
May-1
4
Jul-14
Sep-1
4
Nov-1
4
Jan-1
5
Mar-
15
May-1
5
CV Volume growth % Tonnage growth %
Axle box and components
account for a predominant
share of the supplies to the CV
segment. Sale of these
products are correlated to the
number of axles in a vehicle.
Since Jan-14, the tonnage
growth has outpaced that of
volume growth in the MHCV
segment. This would
favourably benefit the
company as higher tonnage
vehicles would have more
axles.
On an average movement of steel prices more than 5% have
been passed through to the customers
Source: Bloomberg, Spark Capital
Exports and Rail business to contribute 10% by FY17
20.0%
25.0%
30.0%
35.0%
40.0%
45.0%
50.0%
0
100
200
300
400
500
600
FY10 FY11 FY12 FY13 FY14 FY15
Scrap Steel Gross Margin
Nelcast Limited CMP
Rs. 35
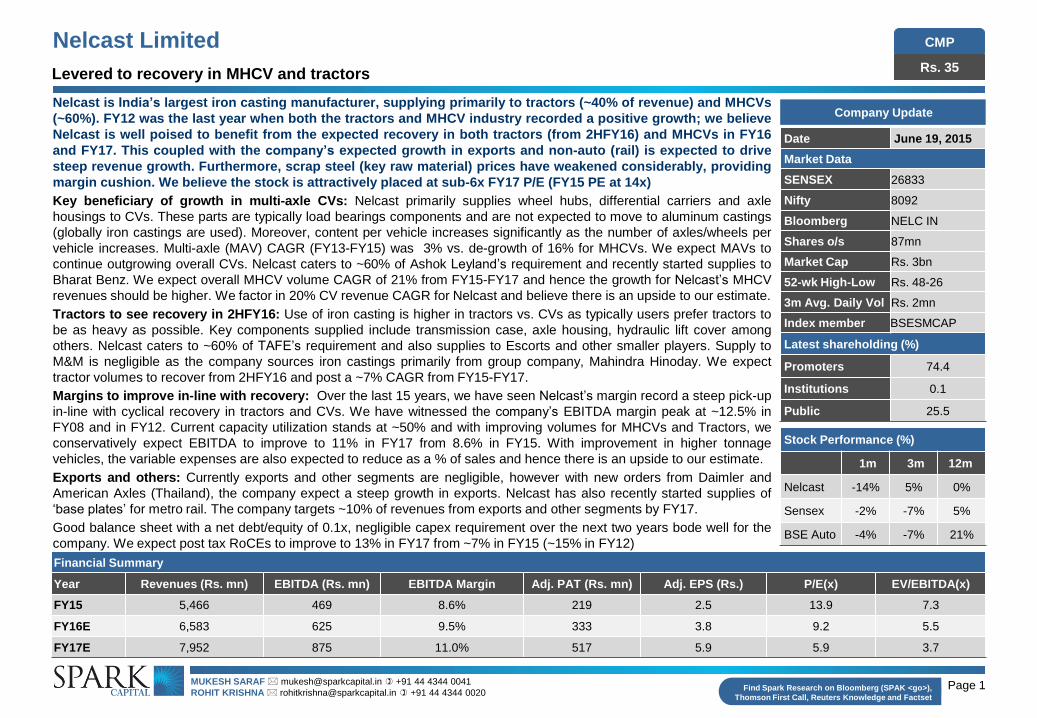
EBITDA % has moved closely with the revenue growth; expect non-
linear growth in EBITDA in the next two years
Source: Company, SIAM, Spark Capital
Power and fuel cost contribute the most in ‘other expenditure’
Source: Company, Spark Capital
Power cost does not proportionately increase with production; hence
as utilization improves expect power cost % to reduce
Source: Company, Spark Capital
0.0%
5.0%
10.0%
15.0%
20.0%
25.0%
30.0%
0
100
200
300
400
500
600
700
FY
00
FY
01
FY
02
FY
03
FY
04
FY
05
FY
06
FY
07
FY
08
FY
09
FY
10
FY
11
FY
12
FY
13
FY
14
Net Sales Power cost %
12.3% 17.2% 16.2%
6.1%
6.8% 6.6% 3.6%
3.2% 2.6%
0.0%
5.0%
10.0%
15.0%
20.0%
25.0%
30.0%
35.0%
FY 2012 FY 2013 FY 2014
Power and fuel Mfg Expenses Consumption of stores
Repairs Freight and forwarding Others
Page 8
Operating leverage to lead to sharp uptick in profitability
0%
2%
4%
6%
8%
10%
12%
14%
FY
00
FY
01
FY
02
FY
03
FY
04
FY
05
FY
06
FY
07
FY
08
FY
09
FY
10
FY
11
FY
12
FY
13
FY
14
FY
15
FY
16E
FY
17E
EBITDA %
-40%
-20%
0%
20%
40%
60%
80%
100%
FY
00
FY
01
FY
02
FY
03
FY
04
FY
05
FY
06
FY
07
FY
08
FY
09
FY
10
FY
11
FY
12
FY
13
FY
14
FY
15
FY
16E
FY
17E
Revenue yoy % Tractors yoy % MHCV yoy %

Nelcast Limited CMP
Rs. 35
Return metrics to improve sharply as profitability improves
Source: Company, Spark Capital
Growth in end market segments to drive growth in revenue as well as
EBITDA %
Source: Company, Spark Capital
Working capital has remained comfortable and stable
Source: Company, Spark Capital
Healthy capital structure with D/E under 0.3x
Source: Company, Spark Capital
Return metrics to improve significantly as profitability improves
Page 9
-
0.05
0.10
0.15
0.20
0.25
0.30
0.35
0.40
0.45
0
100
200
300
400
500
600
700
800
900
1,000
FY11 FY12 FY13 FY14 FY15 FY16E FY17E
Debt Debt/Equity
0
10
20
30
40
50
60
70
FY11 FY12 FY13 FY14 FY15 FY16E FY17E
Debtor Days Inventory Days Creditor Days
0.0%
2.0%
4.0%
6.0%
8.0%
10.0%
12.0%
14.0%
16.0%
18.0%
20.0%
FY11 FY12 FY13 FY14 FY15 FY16E FY17E
RoCE RoNW
-
0.50
1.00
1.50
2.00
2.50
3.00
0.0%
2.0%
4.0%
6.0%
8.0%
10.0%
12.0%
14.0%
FY11 FY12 FY13 FY14 FY15 FY16E FY17E
EBITDA % Fixed Asset Turnover

Nelcast Limited CMP
Rs. 35 Valuation Summary
Promoter
Nelcast
NC Energy
74.4%
97.5%
Page 10
Nelcast had invested in NC Energy for
developing a power plant in Tamil Nadu
and in FY11 the plant was sold for a
profit of ~Rs.760 mn. The company has
now reinvested a portion of the
proceeds in developing another power
plant.
This project has however seen some
delays due to issues in land acquisition.
We do not expect any further
investment in this project and
management believe that the power
plant would be developed and sold in
the next three years.
12M Trailing P/E
Source: Bloomberg, Spark Capital
0.00
5.00
10.00
15.00
20.00
25.00
1-Apr-10 1-Apr-11 1-Apr-12 1-Apr-13 1-Apr-14 1-Apr-15
12M Trailing P/E
Capex requirement remains low
Source: Company, Spark Capital
Strong operating cash flows
Source: Company, Spark Capital
-
100
200
300
400
500
600
700
800
900
FY11 FY12 FY13 FY14 FY15 FY16E FY17E
Operating Cash Flow
0
100
200
300
400
500
600
FY11 FY12 FY13 FY14 FY15 FY16E FY17E
Capex
Nelcast Limited CMP
Rs. 35
Page 11
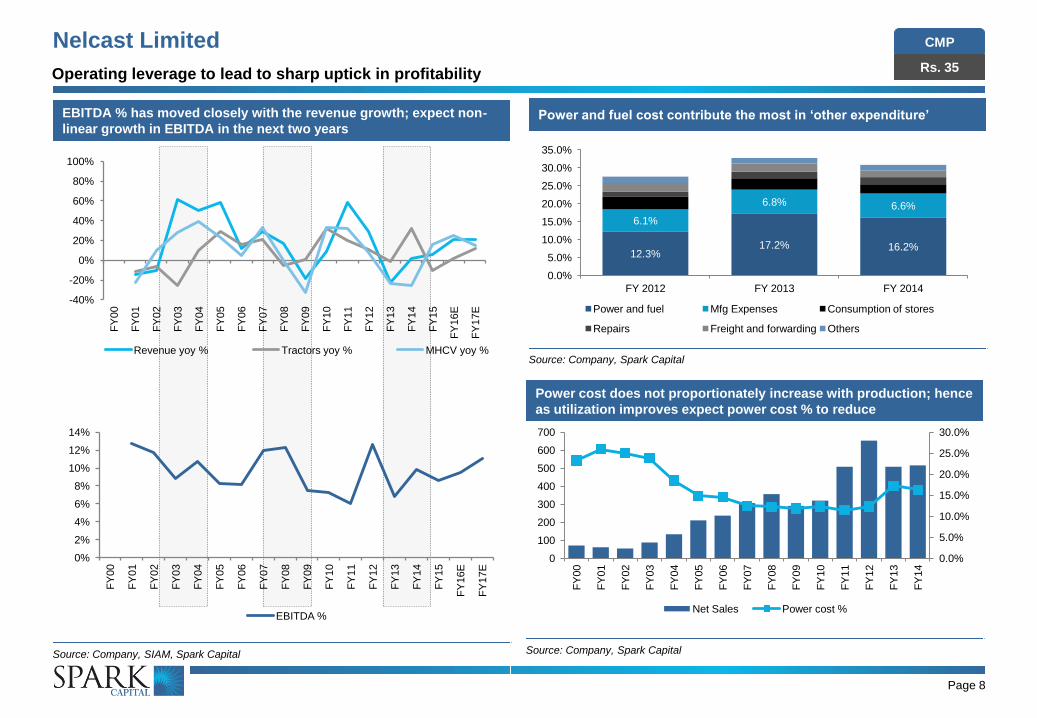
Financial Summary
Abridged Financial Statements Key metrics
Rs. mn FY12 FY13 FY14 FY15E FY16E FY17E FY12 FY13 FY14 FY15E FY16E FY17E
Profit & Loss Growth ratios
Revenues 6,543 5,095 5,176 5,466 6,583 7,952 Revenues 29.0% -22.1% 1.6% 5.6% 20.4% 20.8%
Manufacturing & Other Expenses 5,719 4,747 4,666 4,997 5,958 7,077 EBITDA 167.4% -57.7% 46.2% -8.0% 33.4% 39.9%
EBITDA 824 349 510 469 625 875 PAT 57.1% -69.9% 61.7% -2.4% 51.6% 55.5%
Depreciation 110 111 128 127 132 134 Margins
EBIT 714 238 381 342 493 741 EBITDA 12.6% 6.8% 9.8% 8.6% 9.5% 11.0%
Net Interest Exp / (inc) 36 31 19 47 31 22 EBIT 10.9% 4.7% 7.4% 6.3% 7.5% 9.3%
Profit Before Tax 679 207 363 295 462 719 PAT 7.1% 2.7% 4.3% 4.0% 5.1% 6.5%
Tax 216 68 138 76 129 201 Leverage & WC ratios
Adjusted Net Profit 463 139 225 219 333 517 Debt to equity (x) 0.3 0.4 0.3 0.3 0.2 0.1
Balance Sheet (Rs. mn) Current ratio (x) 2.1 1.9 2.1 2.0 2.1 2.1
Shareholders Equity 2,660 2,516 2,670 2,816 3,029 3,341 Debtor days (Sales) 43 44 49 47 45 45
Loan funds 850 894 892 892 692 492 Inventory days (Sales) 32 32 32 37 40 45
Sources of funds 3,509 3,655 3,877 4,052 4,065 4,177 Creditor Days (Sales) 38 41 34 31 30 35
Net block 1,902 1,870 2,332 2,355 2,373 2,289 Performance & turnover ratios
Investments 6 205 256 316 316 316 RoACE 14.3% 4.5% 6.3% 6.4% 8.8% 12.9%
Capital WIP 37 435 19 47 47 47 RoAE 18.4% 5.4% 8.7% 8.0% 11.4% 16.2%
Current assets, loans & advances 2,442 1,883 1,984 2,140 2,227 2,645 Total asset turnover (x) 1.4 1.0 1.0 1.0 1.1 1.3
Current liabilities & provisions 877 740 713 806 898 1,119 Fixed asset turnover (x) 2.7 2.0 1.8 1.7 1.9 2.2
Net Current Assets 1,565 1,144 1,271 1,334 1,329 1,526 Valuation metrics
Application of funds 3,509 3,655 3,877 4,052 4,065 4,177 Current price (Rs.)
Cash Flows (Rs. mn) Shares outstanding (mn) 87.0 87.0 87.0 87.0 87.0 87.0
Cash flows from operations 625 604 427 267 274 445 Market capitalisation (Rs. mn) 3,045 3,045 3,045 3,045 3,045 3,045
Capex (327) (486) (174) (150) (150) (50) Enterprise value (Rs. mn) 3,268 3,457 3,416 3,444 3,428 3,238
Free Cash Flow 298 119 254 117 124 395 EV/EBIDTA (x) 4.0 9.9 6.7 7.3 5.5 3.7
Cash flows from investments (322) (665) (213) (210) (150) (50) Adj. Per-share earnings (Rs.) 5.3 1.6 2.6 2.5 3.8 5.9
Cash flows from financing (200) (84) (175) (73) (320) (405) Price-earnings multiple (x) 6.6 21.9 13.5 13.9 9.2 5.9
Cash & Cash equivalents 626 481 520 504 309 299 Dividend yield (%) 5.1% 1.4% 2.0% 2.0% 3.3% 5.6%
35

Nelcast Limited CMP
Rs. 35 Disclaimer
Spark Disclaimer
Spark Capital Advisors (India) Private Limited (Spark Capital) and its affiliates are engaged in investment banking, investment advisory and institutional equities and
infrastructure advisory services. Spark Capital is registered with SEBI as a Stock Broker and Category 1 Merchant Banker.
We hereby declare that our activities were neither suspended nor we have defaulted with any stock exchange authority with whom we are registered in the last five years. We
have not been debarred from doing business by any Stock Exchange/SEBI or any other authorities, nor has our certificate of registration been cancelled by SEBI at any point of
time.
Spark Capital has a subsidiary Spark Investment Advisors (India) Private Limited which is engaged in the services of providing investment advisory services and is registered
with SEBI as Investment Advisor. Spark Capital has also an associate company Spark Infra Advisors (India) Private Limited which is engaged in providing infrastructure
advisory services.
This document does not constitute or form part of any offer or solicitation for the purchase or sale of any financial instrument or as an official confirmation of any transaction.
This document is provided for assistance only and is not intended to be and must not alone be taken as the basis for an investment decision. Nothing in this document should
be construed as investment or financial advice, and nothing in this document should be construed as an advice to buy or sell or solicitation to buy or sell the securities of
companies referred to in this document.
Each recipient of this document should make such investigations as it deems necessary to arrive at an independent evaluation of an investment in the securities of companies
referred to in this document (including the merits and risks involved), and should consult its own advisors to determine the merits and risks of such an investment. This
document is being supplied to you solely for your information and may not be reproduced, redistributed or passed on, directly or indirectly, to any other person or published,
copied, in whole or in part, for any purpose. This report is not directed or intended for distribution to or use by any person or entity who is a citizen or resident of or located in
any locality, state, country or other jurisdiction, where such distribution, publication, availability or use would be contrary to law, regulation or which would subject Spark Capital
and/or its affiliates to any registration or licensing requirement within such jurisdiction. The securities described herein may or may not be eligible for sale in all jurisdictions or to
a certain category of investors. Persons in whose possession this document may come are required to inform themselves of and to observe such applicable restrictions. This
material should not be construed as an offer to sell or the solicitation of an offer to buy any security in any jurisdiction where such an offer or solicitation would be illegal.
Spark Capital makes no representation or warranty, express or implied, as to the accuracy, completeness or fairness of the information and opinions contained in this
document. Spark Capital , its affiliates, and the employees of Spark Capital and its affiliates may, from time to time, effect or have effected an own account transaction in, or
deal as principal or agent in or for the securities mentioned in this document. They may perform or seek to perform investment banking or other services for, or solicit
investment banking or other business from, any company referred to in this report.
This report has been prepared on the basis of information, which is already available in publicly accessible media or developed through an independent analysis by Spark
Capital. While we would endeavour to update the information herein on a reasonable basis, Spark Capital and its affiliates are under no obligation to update the information.
Also, there may be regulatory, compliance or other reasons that prevent Spark Capital and its affiliates from doing so. Neither Spark Capital nor its affiliates or their respective
directors, employees, agents or representatives shall be responsible or liable in any manner, directly or indirectly, for views or opinions expressed in this report or the contents
or any errors or discrepancies herein or for any decisions or actions taken in reliance on the report or the inability to use or access our service in this report or for any loss or
damages whether direct or indirect, incidental, special or consequential including without limitation loss of revenue or profits that may arise from or in connection with the use of
or reliance on this report.
Absolute
Rating
Interpretation
BUY Stock expected to provide positive returns of >15% over a 1-year horizon REDUCE Stock expected to provide returns of <5% – -10% over a 1-year
horizon
ADD Stock expected to provide positive returns of >5% – <15% over a 1-year
horizon SELL Stock expected to fall >10% over a 1-year horizon
Page 12

Nelcast Limited CMP
Rs. 35 Disclaimer (Cont’d)
Spark Capital and/or its affiliates and/or employees may have interests/positions, financial or otherwise in the securities mentioned in this report. To enhance transparency,
Spark Capital has incorporated a disclosure of interest statement in this document. This should however not be treated as endorsement of views expressed in this report:
Disclosure of interest statement Yes/No
Analyst financial interest in the company No
Group/directors ownership of the subject company covered No
Investment banking relationship with the company covered No
Spark Capital’s ownership/any other financial interest in the company covered No
Associates of Spark Capital’s ownership more than 1% in the company covered No
Any other material conflict of interest at the time of publishing the research report No
Receipt of compensation by Spark Capital or its Associate Companies from the subject company covered for in the last twelve months:
Managing/co-managing public offering of securities
Investment banking/merchant banking/brokerage services
products or services other than those above
in connection with research report
No
Whether Research Analyst has served as an officer, director or employee of the subject company covered No
Whether the Research Analyst or Research Entity has been engaged in market making activity of the Subject Company; No
Analyst Certification of Independence
The views expressed in this research report accurately reflect the analyst’s personal views about any and all of the subject securities or issuers; and no part of the research
analyst’s compensations was, is or will be, directly or indirectly, related to the specific recommendation or views expressed in the report.
Additional Disclaimer for US Institutional Investors
This research report prepared by Spark Capital Advisors (India) Private Limited is distributed in the United States to US Institutional Investors (as defined in Rule 15a-6 under
the Securities Exchange Act of 1934, as amended) only by Auerbach Grayson, LLC, a broker-dealer registered in the US (registered under Section 15 of Securities Exchange
Act of 1934, as amended). Auerbach Grayson accepts responsibility on the research reports and US Institutional Investors wishing to effect transaction in the securities
discussed in the research material may do so through Auerbach Grayson. All responsibility for the distribution of this report by Auerbach Grayson, LLC in the US shall be borne
by Auerbach Grayson, LLC. All resulting transactions by a US person or entity should be effected through a registered broker-dealer in the US. This report is not directed at you
if Spark Capital Advisors (India) Private Limited or Auerbach Grayson, LLC is prohibited or restricted by any legislation or regulation in any jurisdiction from making it available
to you. You should satisfy yourself before reading it that Auerbach Grayson, LLC and Spark Capital Advisors (India) Private Limited are permitted to provide research material
concerning investment to you under relevant legislation and regulations;
Page 13