Www.soran.edu.iq Radiative Transfer Chapter 6 Radiative Transfer.

Nebular-phase radiative transfer of Type Ia SNeLuke Shingles (Queen’s University Belfast)
Collaborators: Stuart Sim (Queen’s University Belfast) Markus Kromer (Stockholm University) Mattia Bulla (Queen’s University Belfast)
Why is the nebular phase important?
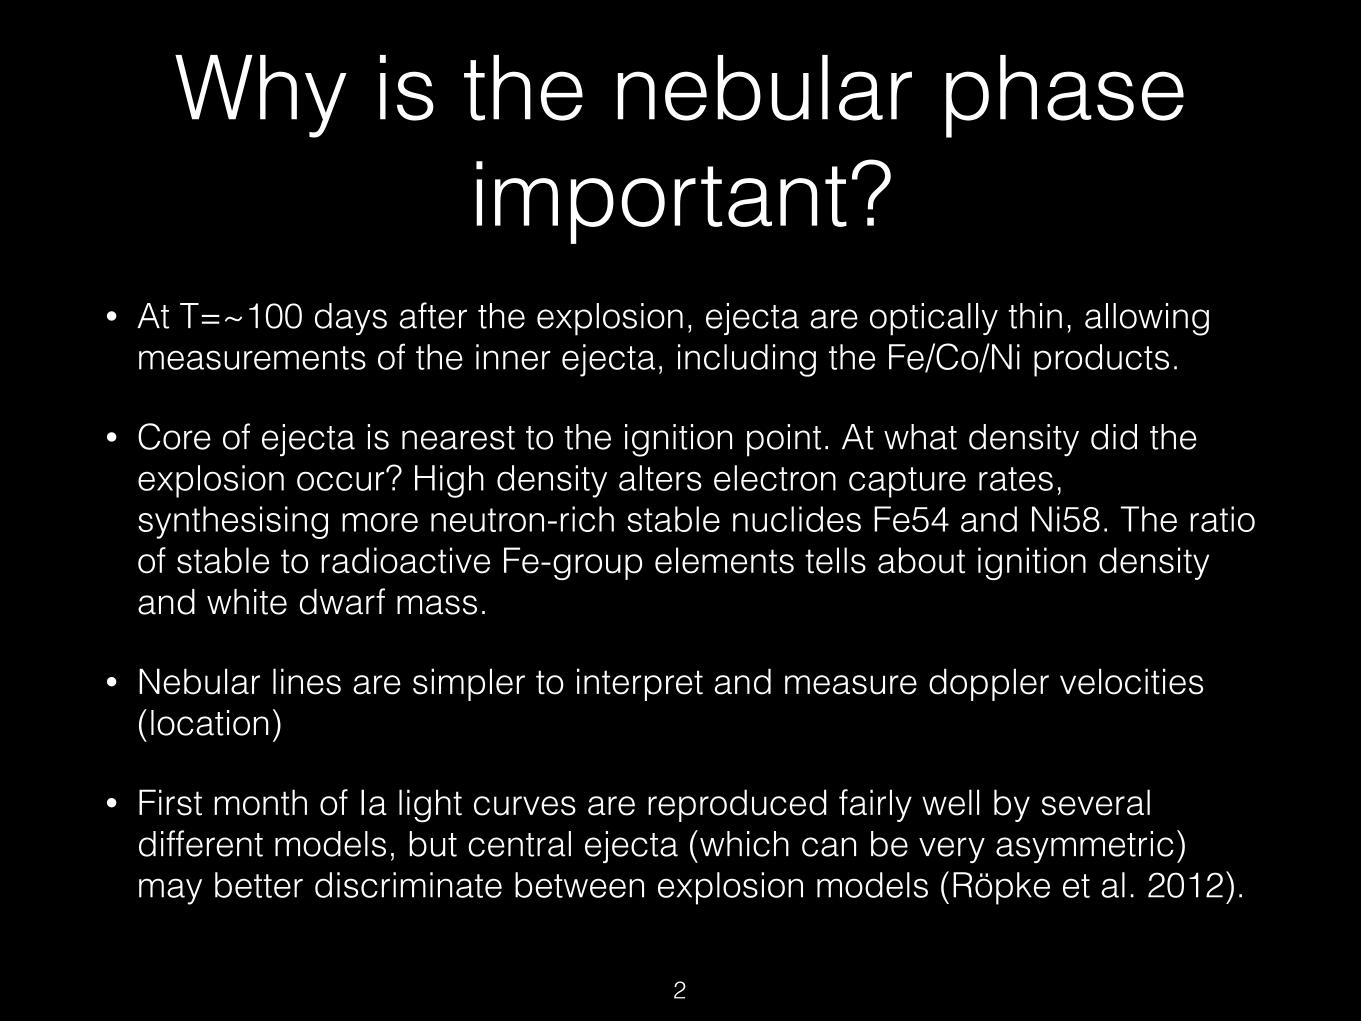
• At T=~100 days after the explosion, ejecta are optically thin, allowing measurements of the inner ejecta, including the Fe/Co/Ni products.
• Core of ejecta is nearest to the ignition point. At what density did the explosion occur? High density alters electron capture rates, synthesising more neutron-rich stable nuclides Fe54 and Ni58. The ratio of stable to radioactive Fe-group elements tells about ignition density and white dwarf mass.
• Nebular lines are simpler to interpret and measure doppler velocities (location)
• First month of Ia light curves are reproduced fairly well by several different models, but central ejecta (which can be very asymmetric) may better discriminate between explosion models (Röpke et al. 2012).
2
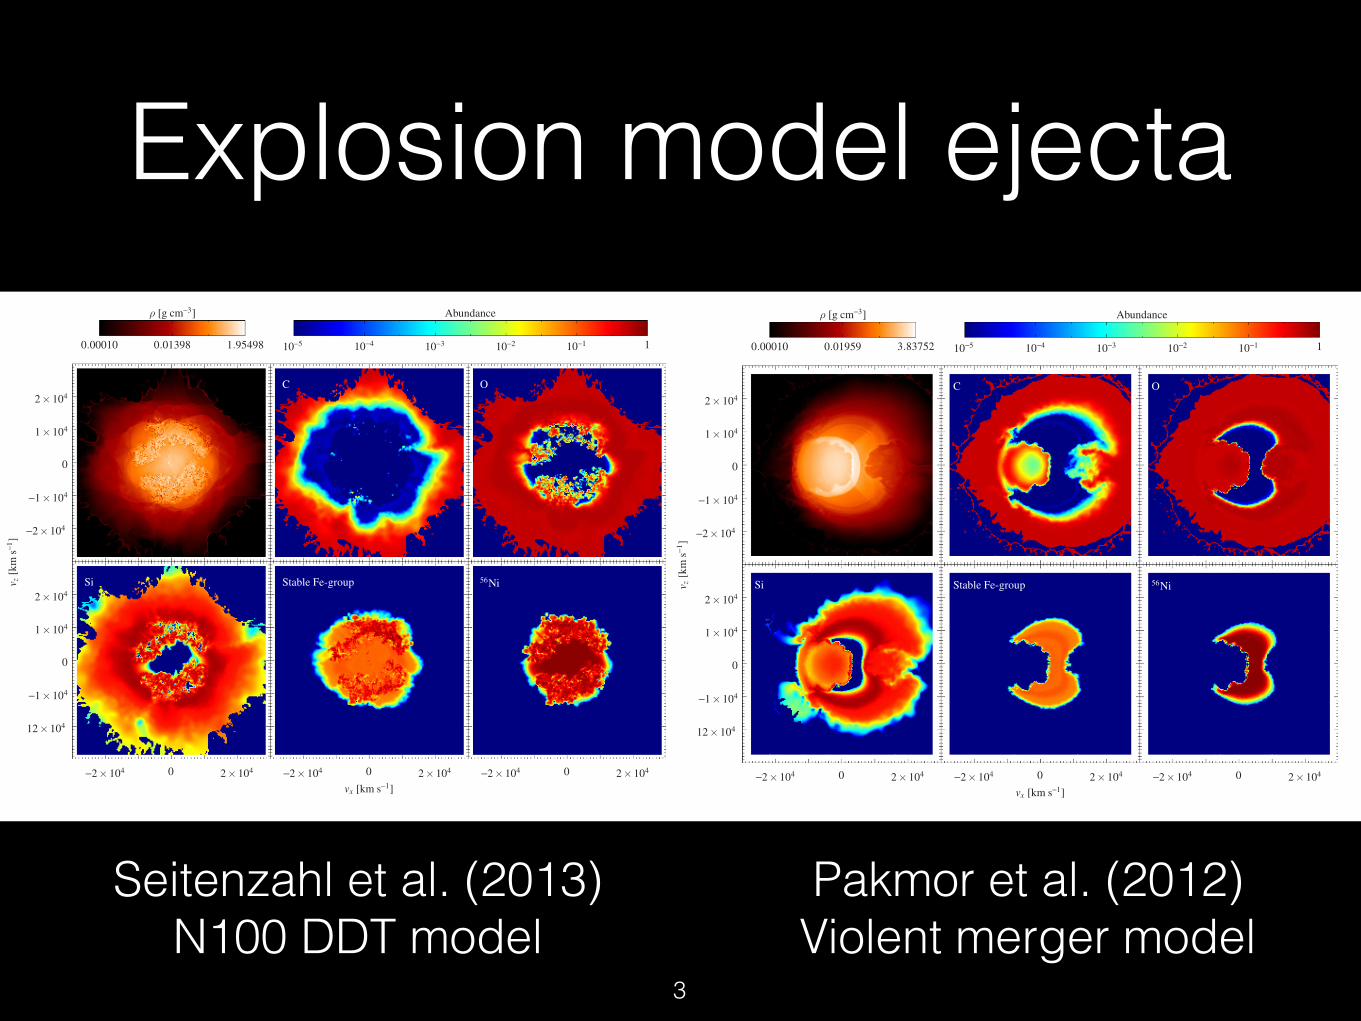
Explosion model ejecta
Pakmor et al. (2012) Violent merger model
The Astrophysical Journal Letters, 750:L19 (7pp), 2012 May 1 Ropke et al.
v z[k
ms−1
]
vx [km s−1]
ρ [g cm−3] Abundance
0.00010 0.01398 1.95498 10−5 10−4 10−3 10−2 10−1 1
−2×10⁴ 0 2×10⁴ −2×10⁴ 0 2×10⁴ −2×10⁴ 0 2×10⁴
2×10⁴
1×10⁴
0
−1×10⁴
−2×10⁴
2×10⁴
1×10⁴
0
−1×10⁴
12×104
OC
Si Stable Fe-group 56Ni
Figure 1. Slices through our delayed-detonation model N100 in the x–z-plane showing the density (top left) and abundance distribution of selected species at 100 safter explosion.
two merging stars is controversial. Simulations with sufficientlyhigh numbers of SPH particles, such as those presented here,show the formation of a hot spot, and we assume a detonation totrigger at this location when the temperature exceeds 2.5×10⁹ Kin material of ρ ≈ 2 × 10⁶ g cm−3, relying on the microscopicsimulations of detonation initiation by Seitenzahl et al. (2009a).Again, the evolution was followed up to 100 s and the composi-tion of the ejecta was determined in a post-processing step. Theresults of this simulation are given in Table 1.
Density and composition of both models in homologousexpansion are visualized in Figures 1 and 2. We note thatthe ejecta structure resulting from the WD–WD merger differsfundamentally from that of N100. This is because the explosionof the secondary WD happens shortly after that of the primary.Therefore, the outer ejecta material originates from the primary.At the onset of the explosion, the primary had a radius below0.02 R⊙, making our violent merger scenario consistent withthe constraint on the radius of the exploding object derived byBloom et al. (2012).
3. COMPARISON WITH SPECTRA OF SN 2011fe
From the nucleosynthesis tracer particles we constructeddetailed abundance distributions of the explosion ejecta at 100 sand mapped them to 503 Cartesian grids. These grids were thenused to derive synthetic light curves and spectra with the Monte
Carlo RT code Artis (Kromer & Sim 2009; Sim 2007). To thisend, we simulated the propagation of 108 photon packets from 2to 120 days after explosion using the cd23_gf-5 atomic data setof Kromer & Sim (2009), which is based on the lines containedin the CD23 compilation of Kurucz & Bell (1995). To accountfor higher ionization at early times, we added the ionizationstages vi and vii for Sc to Ni, leading to a total of ∼5 × 10⁵
atomic lines.Both our models yield a B-band peak magnitude of −19.0,
roughly in agreement with that observed for SN 2011fe. Theirrise times, however, differ: while N100 reaches B-band maxi-mum after 16.6 days, the merger takes 20.8 days (further param-eters of our synthetic light curves are given in Table 1). Thus,neither of the models gives a perfect match to the light curvesof SN 2011fe but both are sufficiently close to warrant furtherinvestigation.
In Figure 3, we compare synthetic spectra from our mod-els with flux-calibrated spectra of SN 2011fe taken by theSNfactory collaboration with the SNIFS instrument (Alderinget al. 2002) on the University of Hawaii 2.2 m telescope onMauna Kea. To our knowledge, this is the first direct com-parison of consistent three-dimensional SN Ia models with aspectrophotometric time series. Overall, the spectra of both ex-plosion scenarios reproduce the main features of the observedspectra and the flux level reasonably well (note that these are
3
The Astrophysical Journal Letters, 750:L19 (7pp), 2012 May 1 Ropke et al.
v z[k
ms−1
]
vx [km s−1]
ρ [g cm−3] Abundance
0.00010 0.01959 3.83752 10−5 10−4 10−3 10−2 10−1 1
−2×10⁴ 0 2×10⁴ −2×10⁴ 0 2×10⁴ −2×10⁴ 0 2×10⁴
2×10⁴
1×10⁴
0
−1×10⁴
−2×10⁴
2×10⁴
1×10⁴
0
−1×10⁴
12×104
OC
Si Stable Fe-group 56Ni
Figure 2. Same as Figure 1 but for the merger model.
not fits but predictions from “first-principle” models and thatabsolute fluxes are compared). In detail, however, there areproblems in both models.
The predicted absorption features are blueshifted with respectto the observations. Although this effect is stronger in N100, it isalso visible for the merger, indicating too high ejecta velocitiesin the models. Since the mass of the exploding object is verydifferent in the two cases, the nuclear energy release is likely toohigh in both explosion processes. A potential way to cure thisproblem is to increase the oxygen abundance in the progenitorWDs at the expense of carbon, thus increasing the averagenuclear binding energy of the fuel.
While N100 is only marginally too bright at the earlyepochs, the merger is clearly too faint. This corresponds to theshorter/longer rise time of the respective model (see Ta-ble 1) compared to SN 2011fe. Around the B-band maxi-mum at ∼18 days the merger compares favorably to the ob-served spectra. The flux level and the overall shape of itssynthetic spectra match the data better than those of N100.After maximum the agreement with the observations deterio-rates for both models, although the effect is more drastic forN100. In particular, the models fail to reproduce the spec-tral features between 5000 Å and 6000 Å. Moreover, bothmodels become redder faster than the observation. Again, thistrend is more pronounced in N100, but is also visible in themerger.
Figures 1 and 2 show that iron-group elements (IGEs) extendsignificantly beyond velocities of 10,000 km s−1 in N100 butalso in some directions in the merger. The W7 model of Nomotoet al. (1984), which is known to reproduce observables of SNeIa well, does not contain IGEs at such high velocities. However,they are reported in abundance tomographies of the normal SNe2002bo (Stehle et al. 2005) and 2004eo (Mazzali et al. 2008) andNugent et al. (2011b) identify iron in the earliest spectra of SN2011fe at velocities of 16,000 km s−1. Our synthetic spectra donot show mismatches with observed lines that can be directlyattributed to high-velocity IGEs. It is possible, however, thatthey contribute to the fast reddening of the models. As for thehigh ejecta velocities, a decreased carbon/oxygen ratio in theexploding WDs may alleviate this problem.
An important difference between the two models is also vis-ible from Figures 1 and 2: N100 is—apart from small-scaleanisotropies—roughly spherical (see also Blondin et al. 2011).In contrast, the merger shows pronounced large-scale asymme-tries. This is reflected in a strong viewing-angle dependence inits spectra which increases after maximum due to the growingasymmetry of the inner ejecta for smaller radii. As demonstratedin the lower plot of Figure 3 individual line-of-sight spectra fromthe merger reproduce the observation at least as well as the angleaverage. Nevertheless, the high level of asymmetry in the mergercould be in conflict with the observed spectral homogeneity ofnormal SNe Ia and the low level of continuum polarization
4
Seitenzahl et al. (2013) N100 DDT model
3
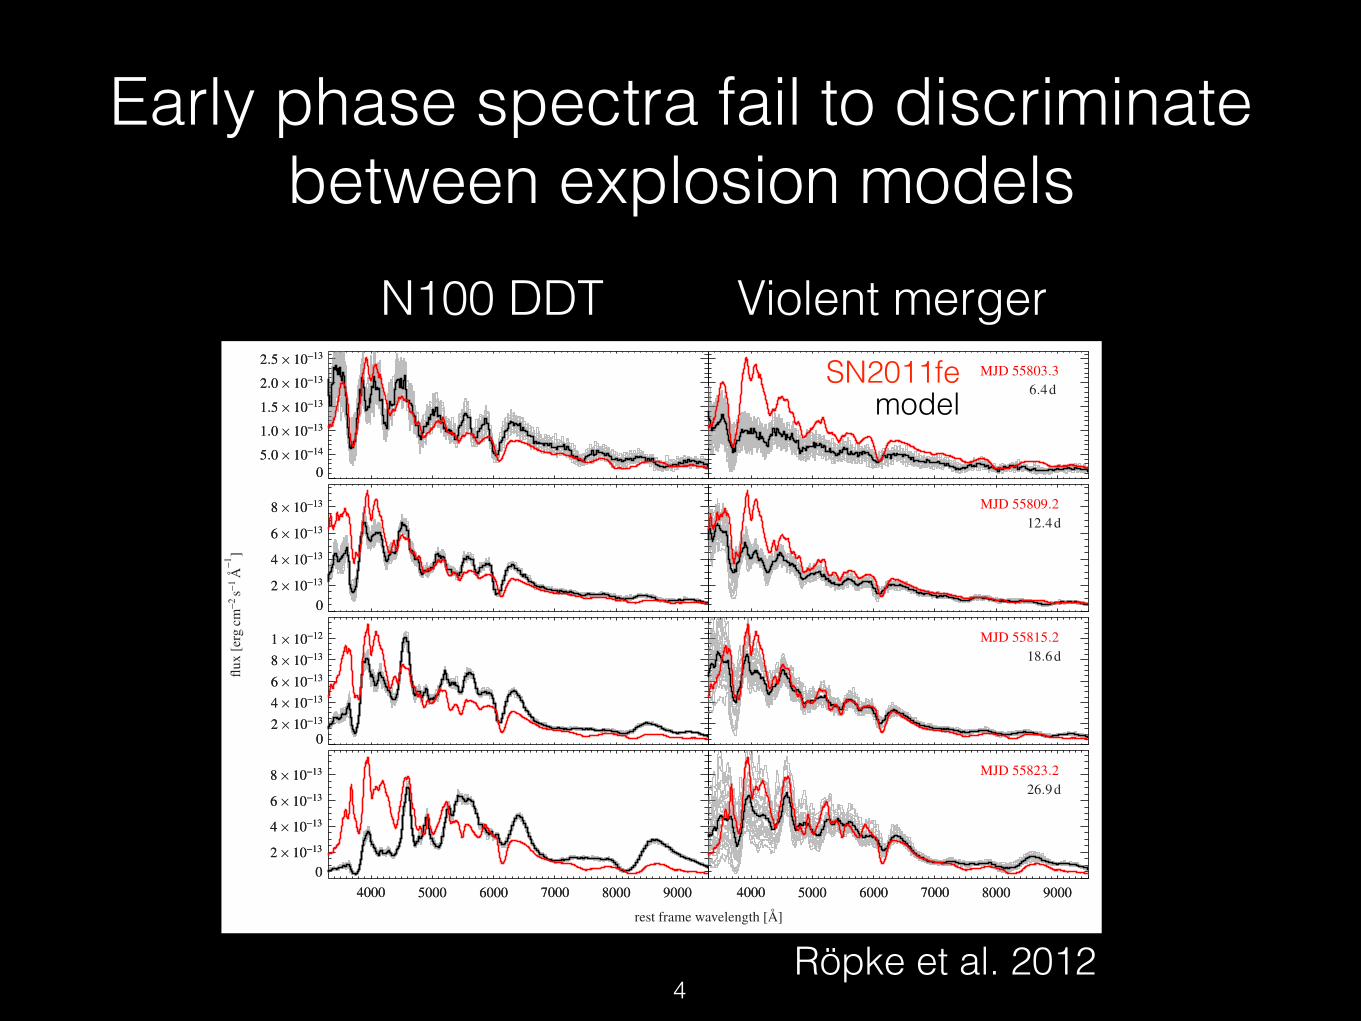
Early phase spectra fail to discriminate between explosion models
The Astrophysical Journal Letters, 750:L19 (7pp), 2012 May 1 Ropke et al.
flux
[erg
cm−2
s−1Å
−1]
rest frame wavelength [Å]
6.4d
12.4d
18.6d
26.9d
MJD 55803.3
MJD 55809.2
MJD 55815.2
MJD 55823.2
4000400040004000 500050005000 00060005 600060006000 7000700070007000 800080008000 00090008 900090009000
2.5×10−132.5×10⁻¹³
2.0×10−132.0×10⁻¹³
1.5×10−131.5×10⁻¹³
1.0×10−131.0×10⁻¹³
5.0×10−145.0×10⁻¹⁴
00
8×10−138×10−13
6×10−136×10−13
4×10−134×10−13
2×10−132×10−13
00
1×10−121×10−12
8×10−138×10−13
6×10−136×10−13
4×10−134×10−13
2×10−132×10−13
00
8×10−138×10−13
6×10−136×10−13
4×10−134×10−13
2×10−132×10−13
00
flux
[erg
cm−2
s− 1Å
−1]
rest frame wavelength [Å]
18.6dMJD 55815.2
4000 5000 6000 7000 8000 9000
1×10⁻¹²
8×10⁻¹³
6×10⁻¹³
4×10⁻¹³
2×10⁻¹³
0
Figure 3. Spectral evolution of our delayed detonation N100 (left) and merger model (right) from 6 to 27 days after the explosion. The angle-averaged spectrum isplotted in black, while 25 spectra for representative viewing angles are shown in gray (the variability with viewing angle of the earliest spectra is dominated by MonteCarlo noise in both models). For comparison the observed spectra of SN 2011fe are overplotted in red assuming an explosion date at August 23.7 (MJD 55796.7;Nugent et al. 2011b). The observations were corrected for Galactic reddening assuming E(B − V )Gal = 0.009 mag (Schlegel et al. 1998) and de-redshifted accordingto a heliocentric radial velocity vhel = 241 km s−1 given by de Vaucouleurs et al. (1991). Reddening from the host is negligible. The bottom panel compares theobserved spectrum of SN 2011fe near B-band maximum (red) with synthetic spectra from the merger corresponding to three different viewing angles (blue colors)and the angle average (black).
observed (Wang & Wheeler 2008). Currently, our RT simula-tions do not include polarization. Note, however, that Smith et al.(2011) report a continuum polarization of 0.2%–0.4% for SN2011fe, which they interpret as a sign of persistent asymmetryin the last-scattering surface.
The fact that the merger reproduces the observed spectrabetter than N100 at maximum light (and later) suggests thatthe chemical structure of its deeper ejecta, which dominatethe spectrum formation at this epoch, is closer to that of SN
2011fe. Since neither of the models matches the optical dataof early epochs perfectly, our comparison gives slight pref-erence to a WD merger scenario over a delayed detonationin a Chandrasekhar-mass WD as an explanation for this ob-ject. But as there are major shortcomings in both models,a definitive conclusion cannot be drawn. Observables otherthan maximum-light spectra may, however, have more dis-criminating power. We discuss promising possibilities in thefollowing.
5
N100 DDT Violent merger
Röpke et al. 2012
SN2011fe
4
model
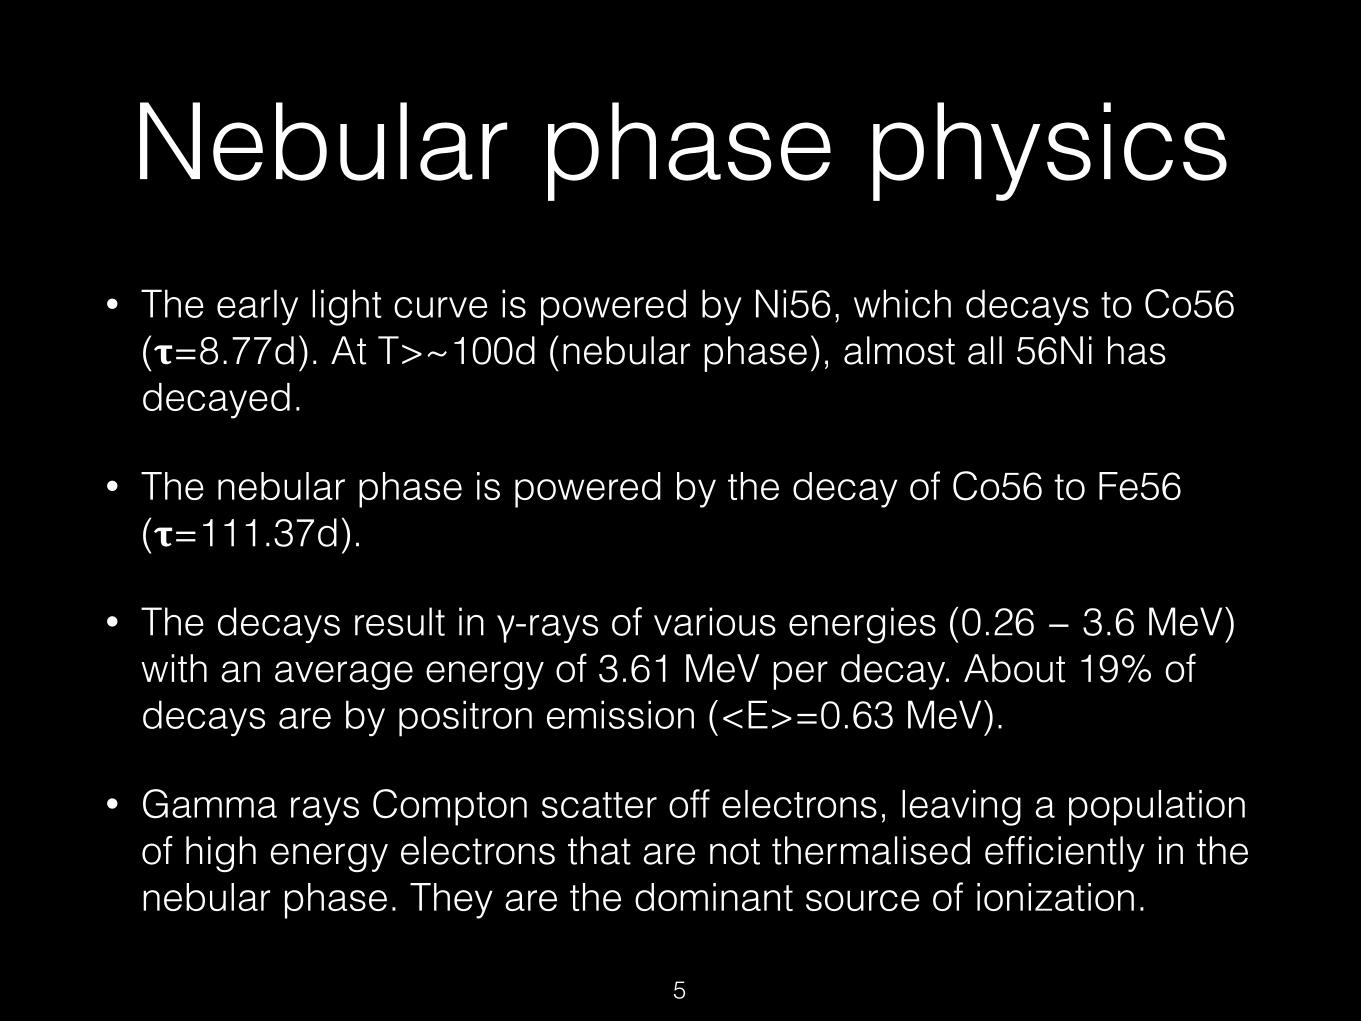
Nebular phase physics• The early light curve is powered by Ni56, which decays to Co56
(!=8.77d). At T>~100d (nebular phase), almost all 56Ni has decayed.
• The nebular phase is powered by the decay of Co56 to Fe56 (!=111.37d).
• The decays result in γ-rays of various energies (0.26 − 3.6 MeV) with an average energy of 3.61 MeV per decay. About 19% of decays are by positron emission (<E>=0.63 MeV).
• Gamma rays Compton scatter off electrons, leaving a population of high energy electrons that are not thermalised efficiently in the nebular phase. They are the dominant source of ionization.
5
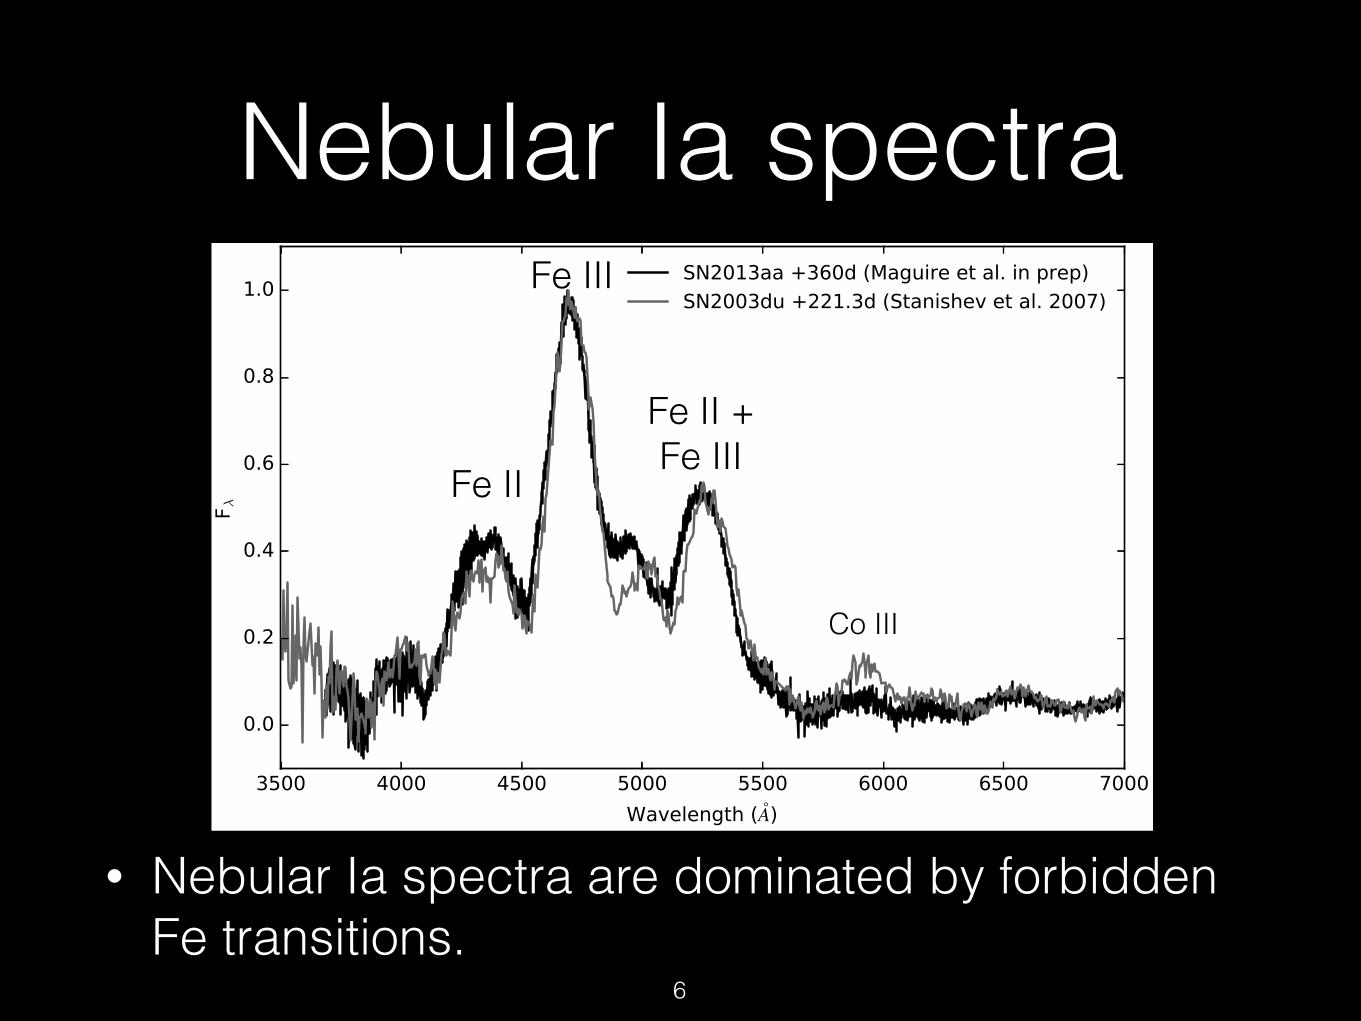
Nebular Ia spectra
• Nebular Ia spectra are dominated by forbidden Fe transitions.
Fe III
Fe II
Fe II + Fe III
6
Co III
ARTIS code• ARTIS is a 3D Monte Carlo radiation transport code
(Kromer & Sim 2009) using indivisible energy packets (Lucy 2002).
• Current best nebular Ia spectra with other codes (Dessart, Hiller) is based on 1D explosion models, which lack the fluid instabilities to mix ash to the surface.
• With some development work, we can use ARTIS for 3D radiative transfer of 3D hydrodynamic Ia explosion models in the nebular phase.
7
ARTIS developments• Atomic levels and transitions from John Hiller’s
CMFGEN compilation (Kurucz for Fe). We now include forbidden transitions.
• Photoionisation cross-sections from NORAD-Atomic-Data (Nahar et al., Ohio State) with photoionisation to (and recombination from) excited states.
• High energy approximation for non-thermal ionisation rate (Maurer 2010)
8
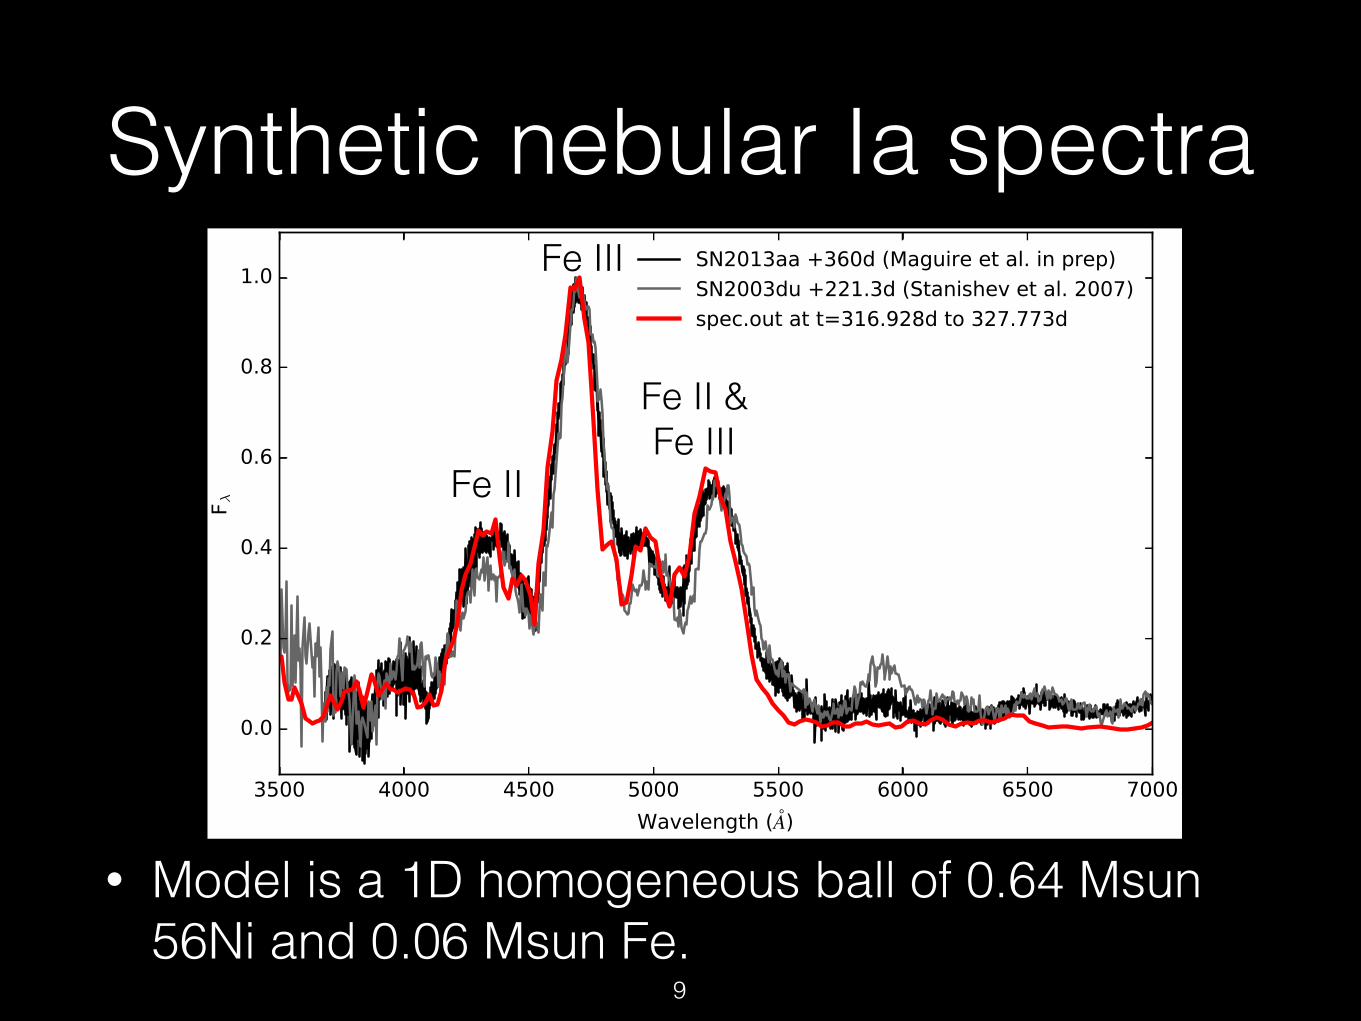
Synthetic nebular Ia spectra
• Model is a 1D homogeneous ball of 0.64 Msun 56Ni and 0.06 Msun Fe.
Fe III
Fe II
Fe II & Fe III
9
2010lpThe Astrophysical Journal Letters, 775:L43 (5pp), 2013 October 1 Taubenberger et al.
In this Letter, we present a late-time spectrum of the sublumi-nous SN Ia 2010lp that shows a prominent emission feature at∼6300 Å, probably due to [O i] λλ6300, 6364. We analyze theline profile to constrain the spatial distribution of the emittingmaterial, and consider what an [O i] emission implies in termsof explosion scenarios. Finally, we discuss under what circum-stances unburned material in the center of SN Ia ejecta may ormay not produce an observable signature in form of late-time[O i] λλ6300, 6364 emission.
2. SN 2010lp
SN 2010lp was discovered on ut 2010 December 29.16 byCox et al. (2010) in the course of the Puckett ObservatorySupernova Search at an apparent unfiltered magnitude of 16.7.It was located at α = 02h54m03.s50, δ = +02◦57′43.′′4 (J2000),13.2 arcsec east of the center of NGC 1137, at a heliocentricredshift z = 0.010 (Huchra et al. 1999). Based on a spectrumtaken on ut 2010 December 30–31, Prieto & Morrell (2011)classified SN 2010lp as a subluminous SN Ia resemblingSN 2007on (Stritzinger et al. 2011) around maximum light.
Given the peculiar nature of the supernova (SN), its relativeproximity, and the availability of early-time follow-up observa-tions (G. Pignata et al., in preparation), we selected SN 2010lpas a target for our program on nebular SN Ia spectroscopy withVLT + FORS2. Spectra were taken on ut 2011 September 27–29(grism 300V) and ut 2011 September 29–30 (grism 300I) witha 1.0 arcsec slit, an atmospheric-dispersion corrector, and expo-sure times of 3 × 2700 s for each grism. They were pre-reducedfollowing standard recipes within iraf, followed by an optimal,variance-weighted extraction (Horne 1986). The dispersion so-lution was established using arc-lamp exposures and checkedagainst isolated nightsky lines. Observations of spectrophoto-metric standard stars obtained during the same nights were usedto calibrate the spectra in flux and to remove telluric absorptions.Given the late phase of the SN (264 days after maximum light;G. Pignata 2011, private communication), no relevant evolutionis expected over the three days of our observations. We there-fore combined all spectra to increase the signal-to-noise ratioand maximize the wavelength coverage.
As in other SNe Ia at late epochs, the resulting spectrum(Figure 1) is dominated by forbidden emission lines of Fe, butthe ionization state of the ejecta is low. [Fe iii] lines, normallythe hallmark features of nebular SN Ia spectra, are weak orabsent, similar to what is observed in other subluminous SNe Ia(Mazzali et al. 1997; Mazzali & Hachinger 2012). Instead, theblue part of the spectrum up to ∼5500 Å is dominated by pseudo-continuous emission from [Fe ii] lines. A strong emission featureat 7000–7500 Å can be attributed to a combination of [Fe ii]lines (most notably [Fe ii] λ7155) and [Ca ii] λλ7291, 7323.The strength of this feature is another indication of a low ejectaionization, since in normal SNe Ia calcium is predominantlydoubly ionized at those epochs.
Unprecedented in subluminous SNe Ia is the emission fea-ture seen at ∼6300 Å. In SNe Ib/c, this feature is typicallythe most prominent emission line at nebular epochs, and regu-larly attributed to [O i] λλ6300, 6364 (e.g., Maeda et al. 2008;Taubenberger et al. 2009). The presence or absence of this fea-ture has often been considered the sharpest observational dis-crimination between core-collapse and thermonuclear SNe (e.g.,Filippenko 1997). In SN 2010lp, we observe it in an SN thatis decidedly an SN Ia as judged from its early-time spectrum(Prieto & Morrell 2011) and the dominance of forbidden Fe linesin the nebular spectrum. We attribute the well-isolated emission
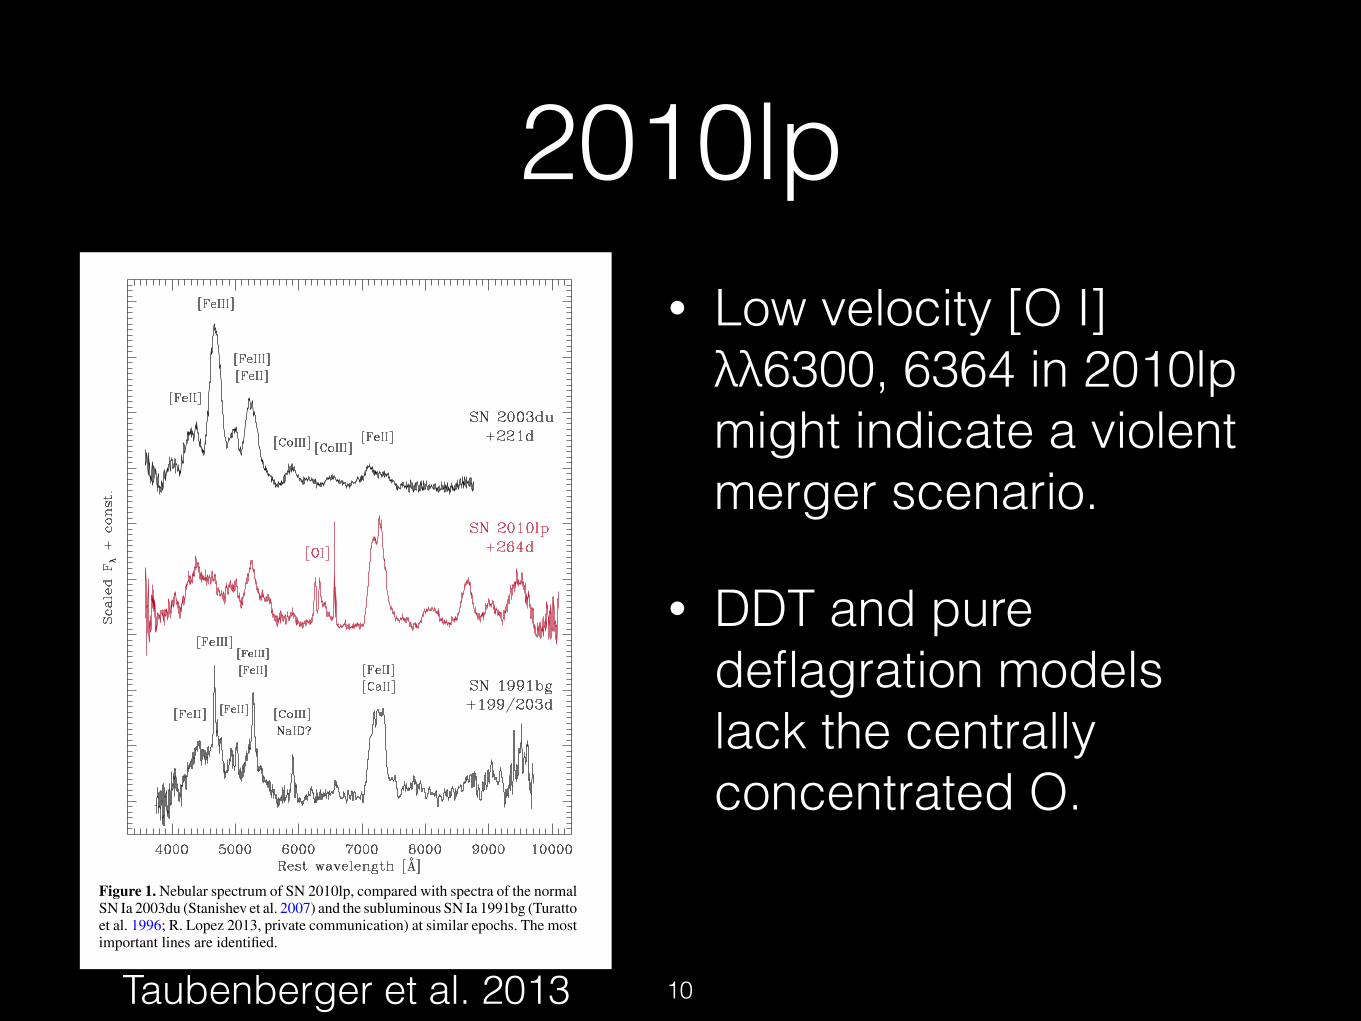
Figure 1. Nebular spectrum of SN 2010lp, compared with spectra of the normalSN Ia 2003du (Stanishev et al. 2007) and the subluminous SN Ia 1991bg (Turattoet al. 1996; R. Lopez 2013, private communication) at similar epochs. The mostimportant lines are identified.(A color version of this figure is available in the online journal.)
(Figure 1—compare with SN 1991bg) to [O i] as in core-collapseSNe; IGEs, which are dominant in other parts of the spectrum,are—owing to their complex level structure—unlikely to pro-duce single isolated features.
3. DISCUSSION
3.1. [O i] Line Profile
Line profiles in nebular spectra are one-dimensional line-of-sight projections of the three-dimensional (3D) emissivitydistribution in the ejecta. Analyzing line profiles thus constrainsthe geometry of the emission region, i.e., that part of the ejectawhere (1) the emitting chemical species is abundant, (2) hasthe correct ionization state, and (3) the upper level of the re-spective transition is sufficiently populated. At the given epoch,the ionization and excitation state are largely determined bycollisions of atoms with fast electrons and positrons originatingfrom the decay of radioactive elements such as 56Co. This meansthat, besides the oxygen distribution, the spatial distribution of56Ni/56Co is relevant. For [O i] λλ6300, 6364 line-profile anal-yses are complicated by the doublet nature of the line, withan intensity ratio depending on the ambient matter density(e.g., Leibundgut et al. 1991; Spyromilio & Pinto 1991). Inthe following analysis, we assume the ratio of [O i] λ6300 to[O i] λ6364 to be ∼3:1, appropriate for the optically thin limit.This is supported by the non-detection of [O i] λ5577, whichwould be prominent if densities were higher. We fit the pro-file of the [O i] λλ6300, 6364 feature with multiple components
2
Taubenberger et al. 2013
• Low velocity [O I] λλ6300, 6364 in 2010lp might indicate a violent merger scenario.
• DDT and pure deflagration models lack the centrally concentrated O.
10
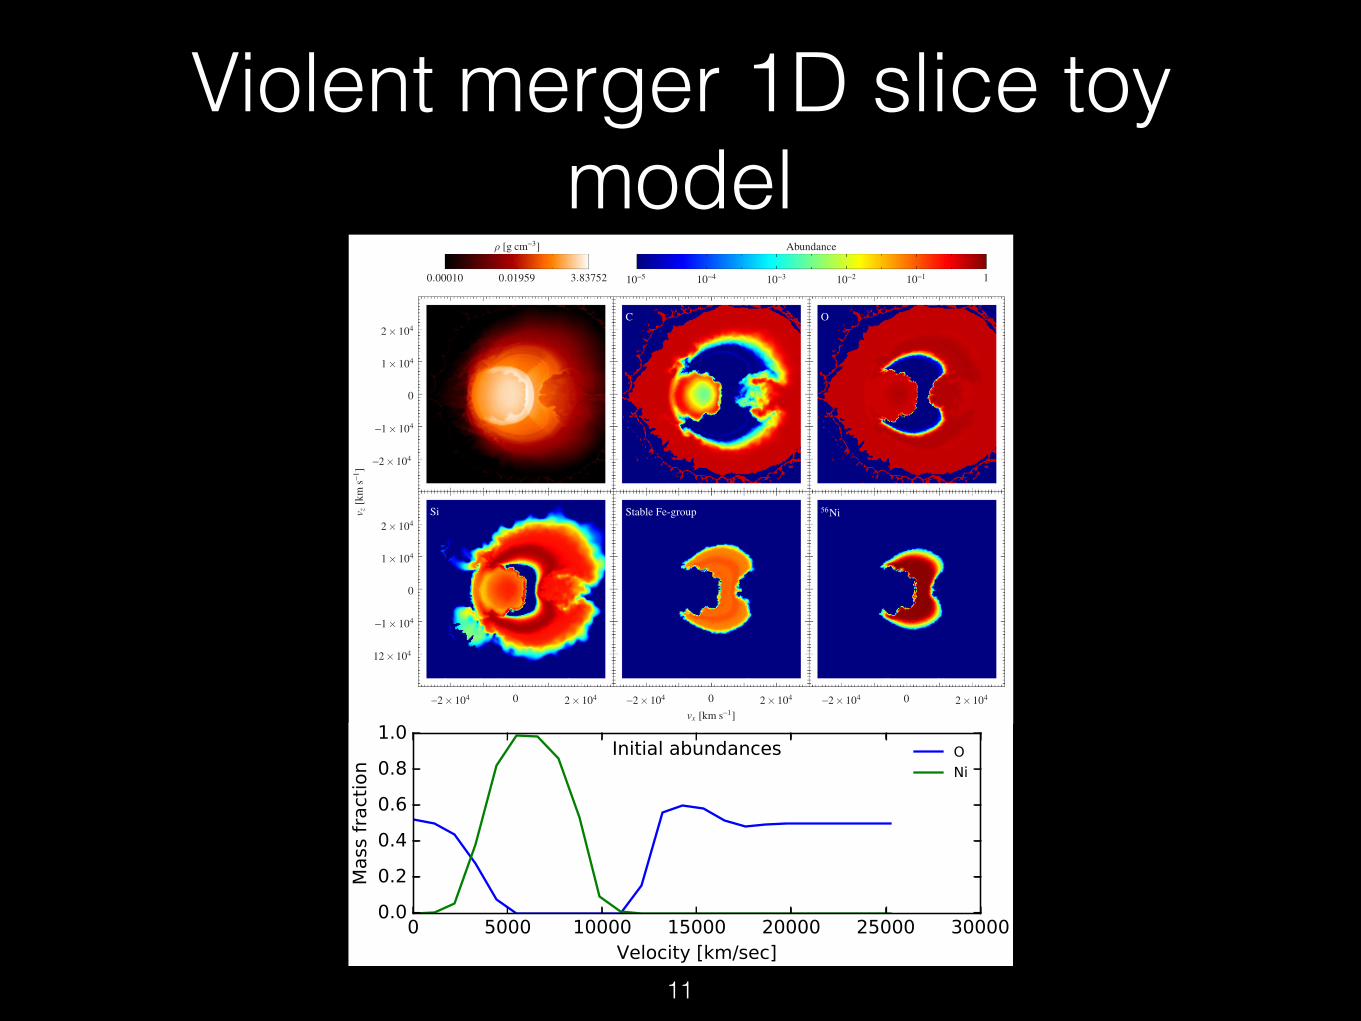
Violent merger 1D slice toy model
The Astrophysical Journal Letters, 750:L19 (7pp), 2012 May 1 Ropke et al.
v z[k
ms−1
]
vx [km s−1]
ρ [g cm−3] Abundance
0.00010 0.01959 3.83752 10−5 10−4 10−3 10−2 10−1 1
−2×10⁴ 0 2×10⁴ −2×10⁴ 0 2×10⁴ −2×10⁴ 0 2×10⁴
2×10⁴
1×10⁴
0
−1×10⁴
−2×10⁴
2×10⁴
1×10⁴
0
−1×10⁴
12×104
OC
Si Stable Fe-group 56Ni
Figure 2. Same as Figure 1 but for the merger model.
not fits but predictions from “first-principle” models and thatabsolute fluxes are compared). In detail, however, there areproblems in both models.
The predicted absorption features are blueshifted with respectto the observations. Although this effect is stronger in N100, it isalso visible for the merger, indicating too high ejecta velocitiesin the models. Since the mass of the exploding object is verydifferent in the two cases, the nuclear energy release is likely toohigh in both explosion processes. A potential way to cure thisproblem is to increase the oxygen abundance in the progenitorWDs at the expense of carbon, thus increasing the averagenuclear binding energy of the fuel.
While N100 is only marginally too bright at the earlyepochs, the merger is clearly too faint. This corresponds to theshorter/longer rise time of the respective model (see Ta-ble 1) compared to SN 2011fe. Around the B-band maxi-mum at ∼18 days the merger compares favorably to the ob-served spectra. The flux level and the overall shape of itssynthetic spectra match the data better than those of N100.After maximum the agreement with the observations deterio-rates for both models, although the effect is more drastic forN100. In particular, the models fail to reproduce the spec-tral features between 5000 Å and 6000 Å. Moreover, bothmodels become redder faster than the observation. Again, thistrend is more pronounced in N100, but is also visible in themerger.
Figures 1 and 2 show that iron-group elements (IGEs) extendsignificantly beyond velocities of 10,000 km s−1 in N100 butalso in some directions in the merger. The W7 model of Nomotoet al. (1984), which is known to reproduce observables of SNeIa well, does not contain IGEs at such high velocities. However,they are reported in abundance tomographies of the normal SNe2002bo (Stehle et al. 2005) and 2004eo (Mazzali et al. 2008) andNugent et al. (2011b) identify iron in the earliest spectra of SN2011fe at velocities of 16,000 km s−1. Our synthetic spectra donot show mismatches with observed lines that can be directlyattributed to high-velocity IGEs. It is possible, however, thatthey contribute to the fast reddening of the models. As for thehigh ejecta velocities, a decreased carbon/oxygen ratio in theexploding WDs may alleviate this problem.
An important difference between the two models is also vis-ible from Figures 1 and 2: N100 is—apart from small-scaleanisotropies—roughly spherical (see also Blondin et al. 2011).In contrast, the merger shows pronounced large-scale asymme-tries. This is reflected in a strong viewing-angle dependence inits spectra which increases after maximum due to the growingasymmetry of the inner ejecta for smaller radii. As demonstratedin the lower plot of Figure 3 individual line-of-sight spectra fromthe merger reproduce the observation at least as well as the angleaverage. Nevertheless, the high level of asymmetry in the mergercould be in conflict with the observed spectral homogeneity ofnormal SNe Ia and the low level of continuum polarization
4
11
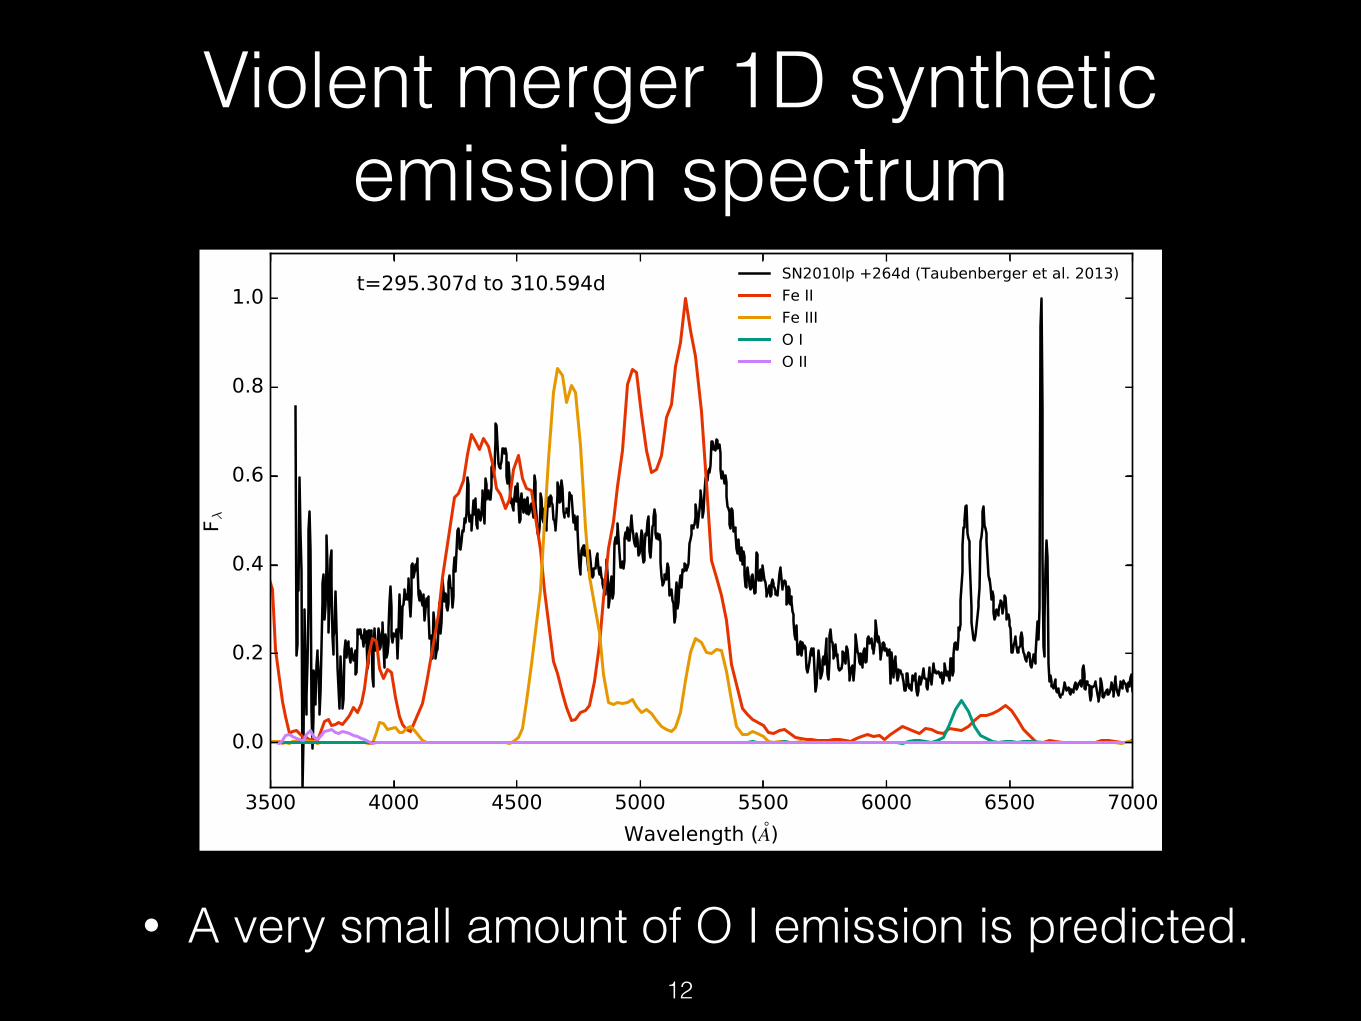
Violent merger 1D synthetic emission spectrum
• A very small amount of O I emission is predicted.12
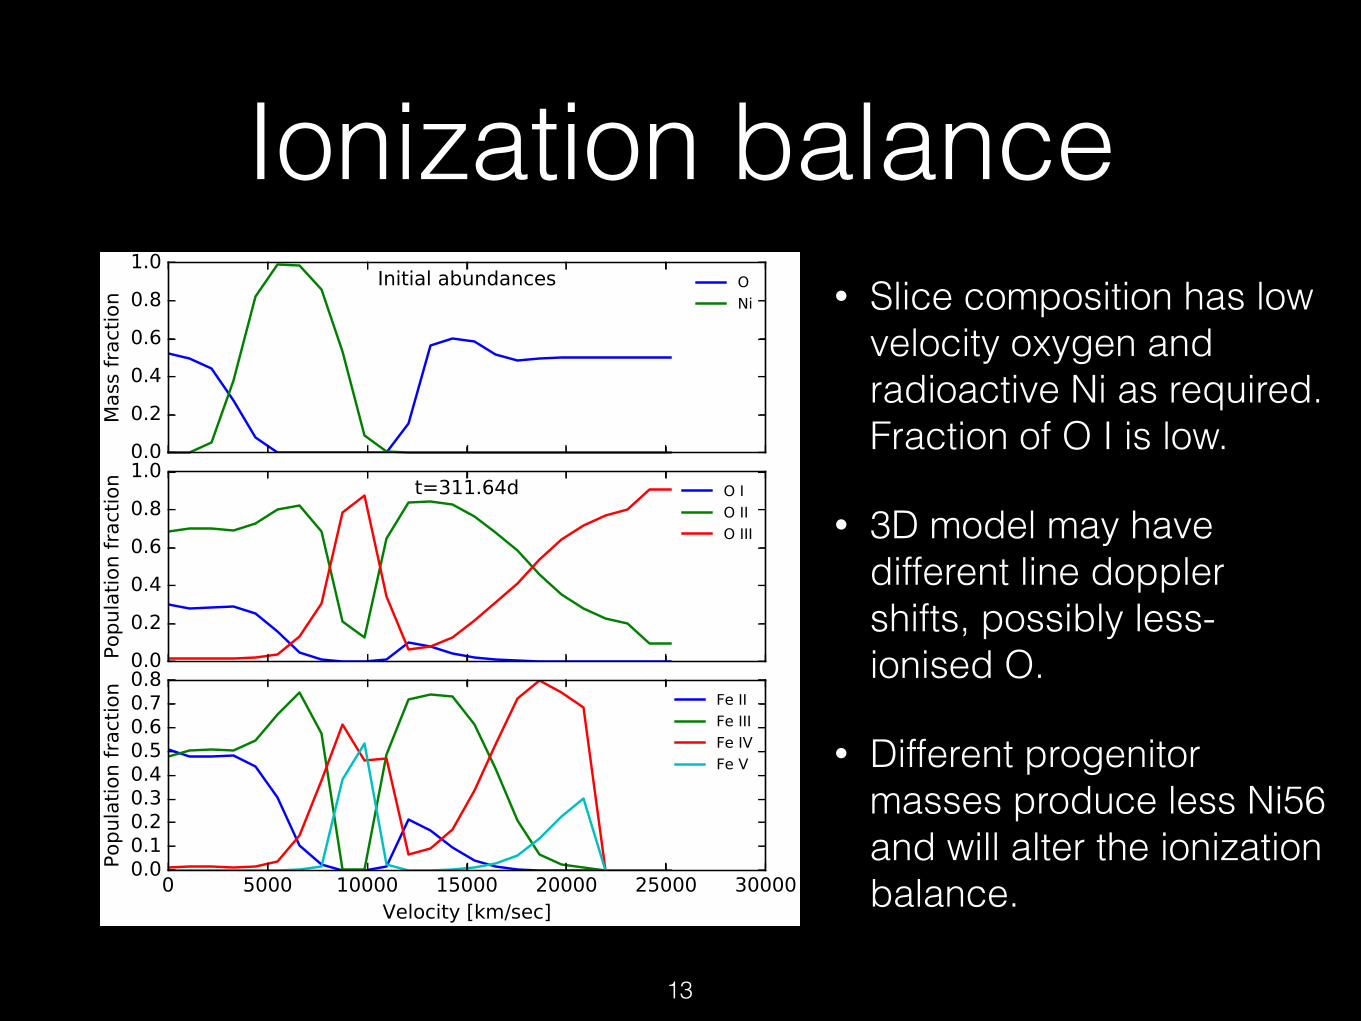
Ionization balance• Slice composition has low
velocity oxygen and radioactive Ni as required. Fraction of O I is low.
• 3D model may have different line doppler shifts, possibly less-ionised O.
• Different progenitor masses produce less Ni56 and will alter the ionization balance.
13