Nearest Neighbor Classifiers - Oregon State...
24
Nearest Neighbor Classifiers CS434
Transcript of Nearest Neighbor Classifiers - Oregon State...
Nearest Neighbor Classifiers
CS434

When classifying an email to be spam or non-spam, one possible strategy is to look at existing emails that are similar to the email in question, and see if they are spams or not – this is the philosophy behind what we call nearest neighbor classifiers

Nearest Neighbor Classifier• Store all training examples S• Given a new example x to be classified, search for the
training example <xi, yi> whose xi is most similar (orclosest in distance) to x, and predict yi
New example

Similarity/distance
• How do we measure the similarity or distance between two examples?
• The most commonly used measure is Euclidean distance (straight line distance)
jijj
iT
i
ii
xx
D
2)(
)()(
),(
xxxx
xxxx

Decision Boundaries: The Voronoi Diagram
• Given a set of points, a Voronoi diagram describes the areas that are nearest to any given point.
• These areas can be viewed as zones of control.

Voroni diagram
• Applet:http://www.cs.cornell.edu/Info/People/chew/Delaunay.html

Decision Boundaries: Subset of the Voronoi Diagram
• Each example controls its own neighborhood
• Create the voroni diagram
• Decision boundary are formed by only retaining these line segments separating different classes.
• The more training examples we have stored, the more complex the decision boundaries can become
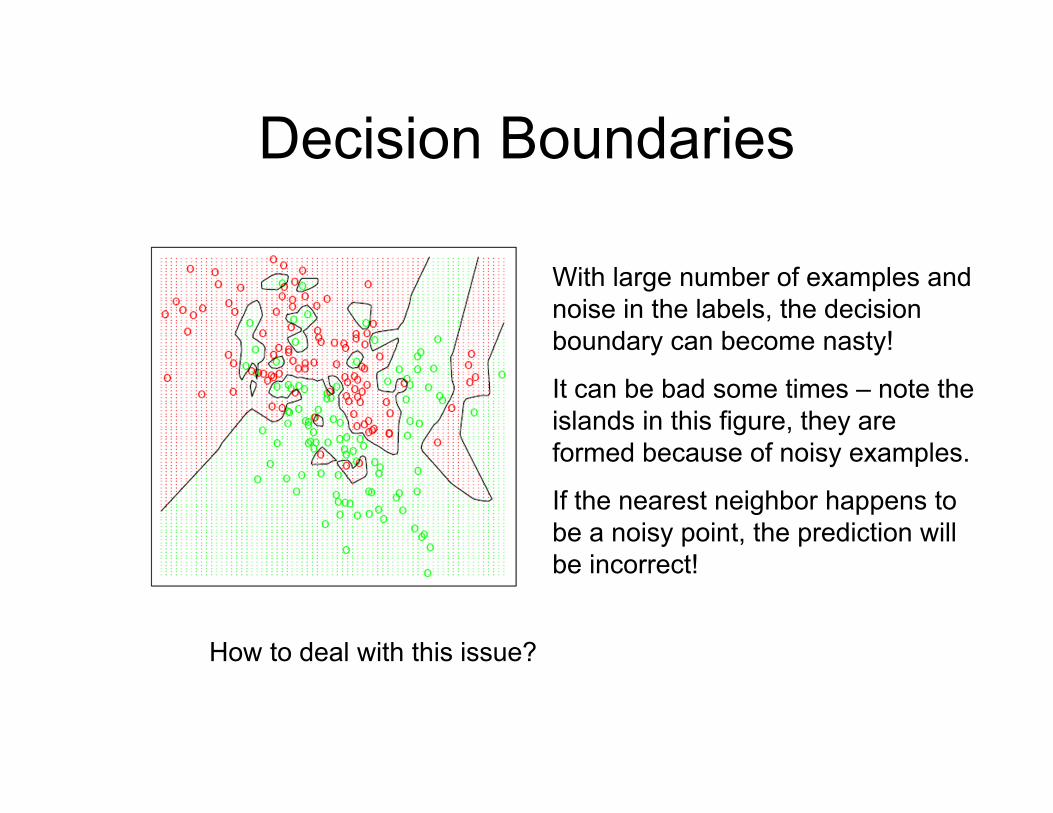
Decision Boundaries
With large number of examples and noise in the labels, the decision boundary can become nasty!
It can be bad some times – note the islands in this figure, they are formed because of noisy examples.
If the nearest neighbor happens to be a noisy point, the prediction will be incorrect!
How to deal with this issue?
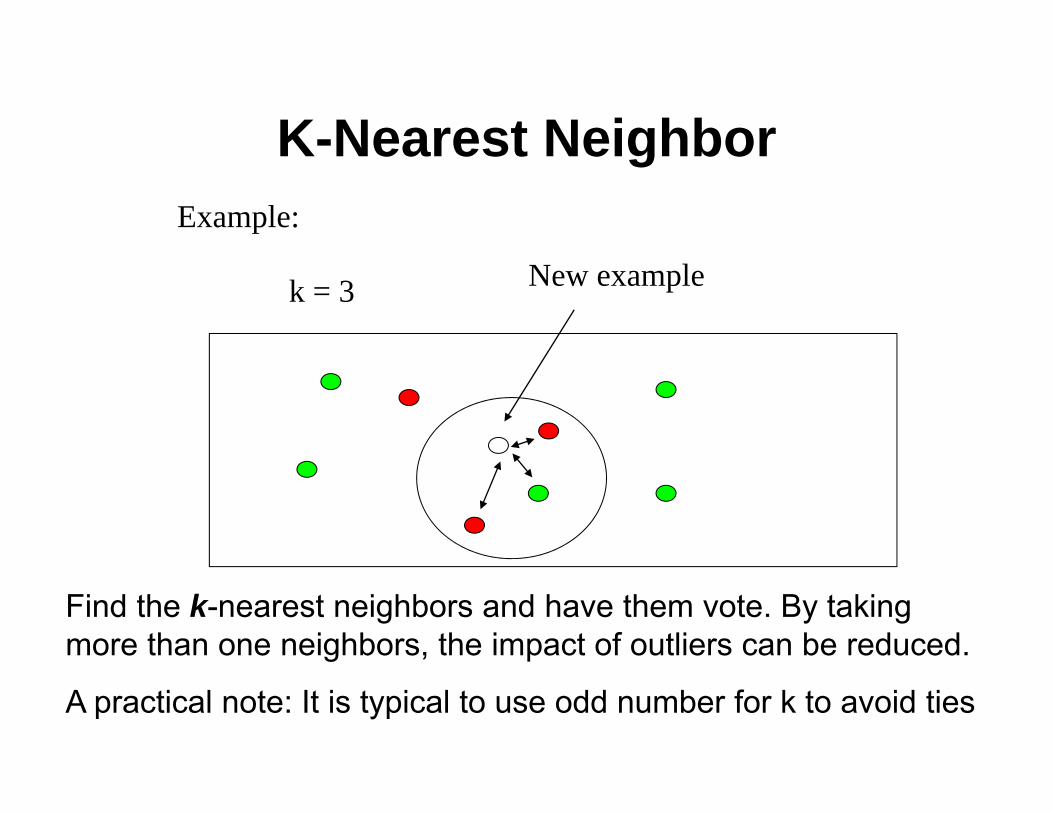
K-Nearest NeighborExample:
k = 3 New example
Find the k-nearest neighbors and have them vote. By taking more than one neighbors, the impact of outliers can be reduced.
A practical note: It is typical to use odd number for k to avoid ties

K-Nearest Neighbor
What if we set k=8 (or 7)?
• We will always predict green because regardless of the location of the point, the k-nearest neighbors will contain more green points than red, simply because there are more greens than reds
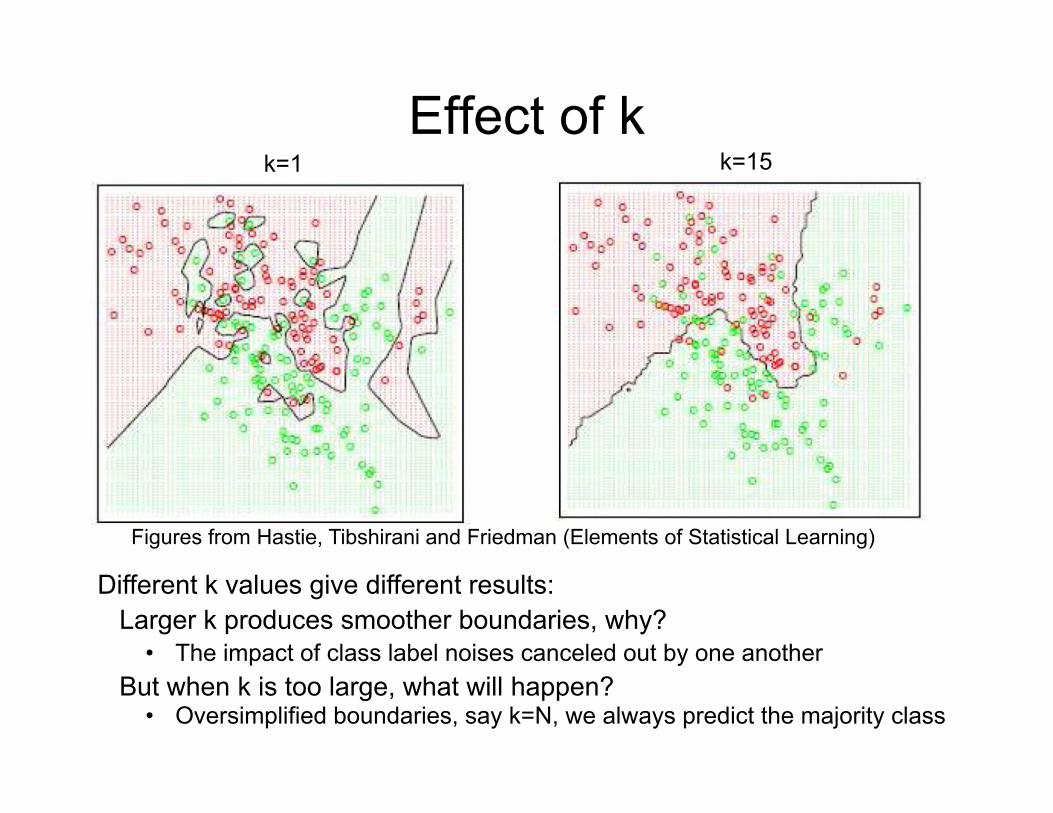
Effect of k
Figures from Hastie, Tibshirani and Friedman (Elements of Statistical Learning)
k=1 k=15
Different k values give different results:Larger k produces smoother boundaries, why?
• The impact of class label noises canceled out by one anotherBut when k is too large, what will happen?
• Oversimplified boundaries, say k=N, we always predict the majority class
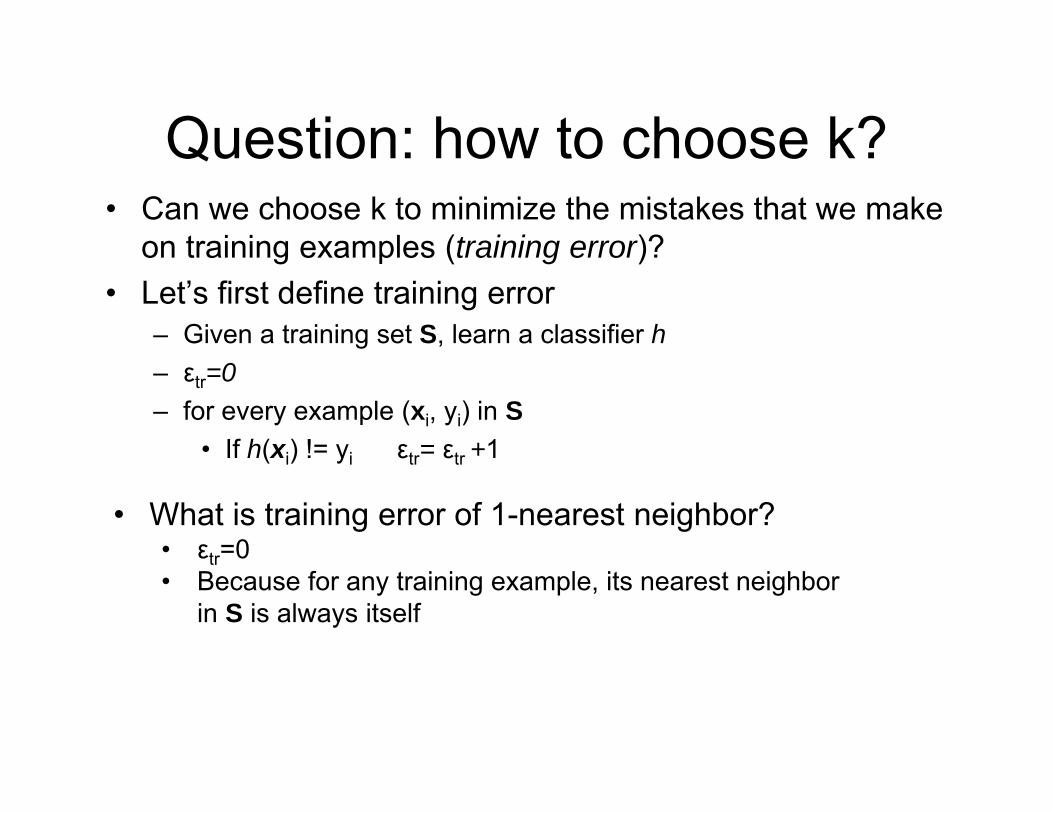
Question: how to choose k?• Can we choose k to minimize the mistakes that we make
on training examples (training error)?• Let’s first define training error
– Given a training set S, learn a classifier h– εtr=0– for every example (xi, yi) in S
• If h(xi) != yi εtr= εtr +1
• What is training error of 1-nearest neighbor?• εtr=0• Because for any training example, its nearest neighbor
in S is always itself
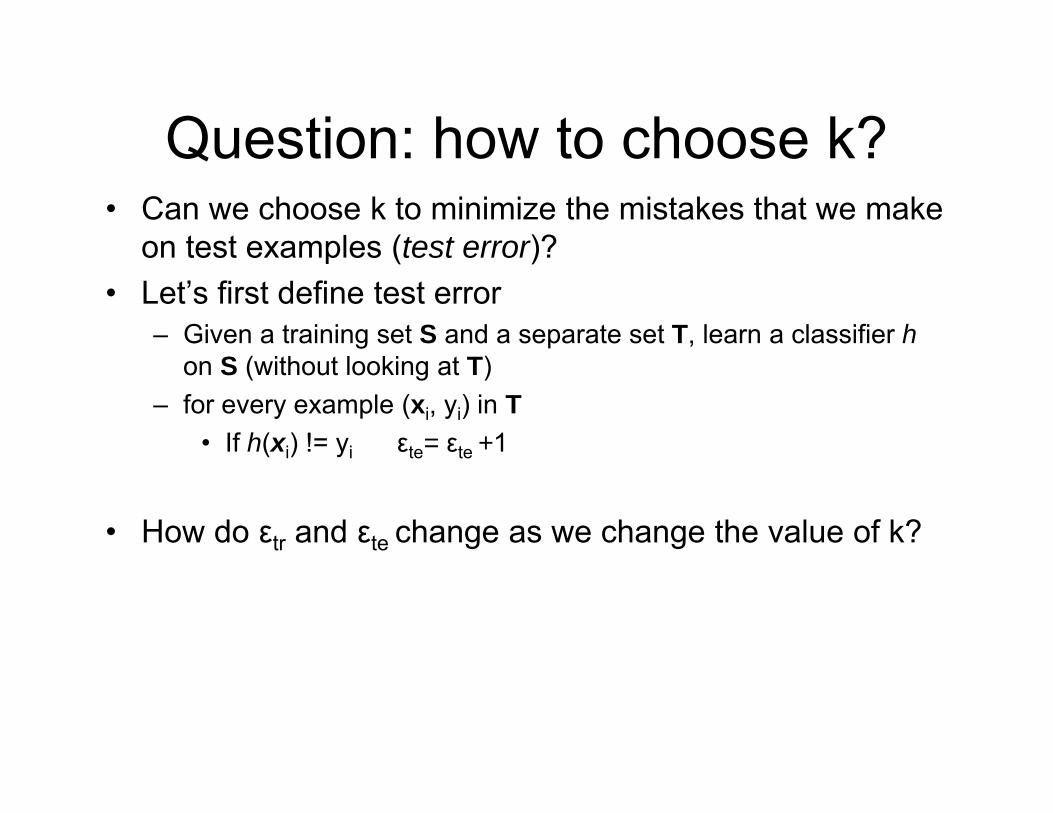
Question: how to choose k?• Can we choose k to minimize the mistakes that we make
on test examples (test error)?• Let’s first define test error
– Given a training set S and a separate set T, learn a classifier h on S (without looking at T)
– for every example (xi, yi) in T• If h(xi) != yi εte= εte +1
• How do εtr and εte change as we change the value of k?
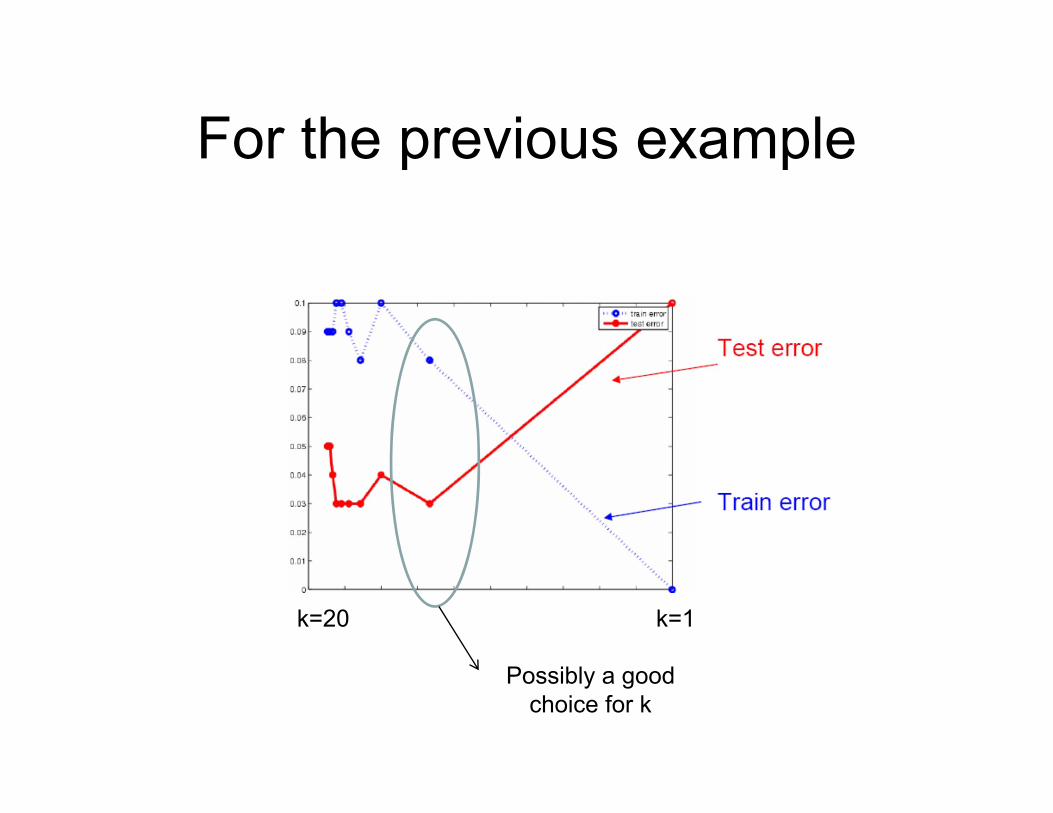
For the previous example
k=1k=20
Possibly a good choice for k
Model Selection• Choosing k for k-nn is just one of the many model selection problems
we face in machine learning• Model selection is about choosing among different models
– linear regression vs. quadratic regression– choosing k-nn over LTU– Choosing one set of features vs another– heavily studied in machine learning, crucial importance in practice
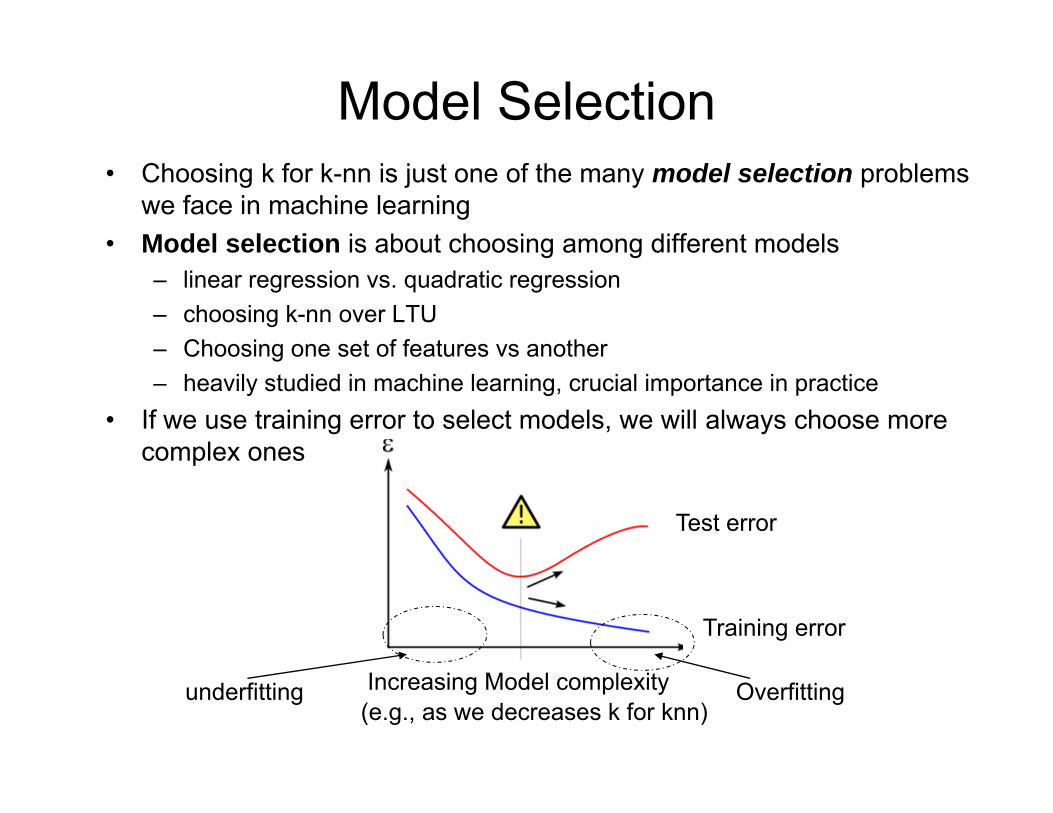
• If we use training error to select models, we will always choose more complex ones
Increasing Model complexity(e.g., as we decreases k for knn)
Overfittingunderfitting
Test error
Training error
Overfitting• Overfitting can be interpreted as:
– Fitting to the particularities of the data• E.g. we want to learn the gender distribution of the machine
learning class• We observe from my training set, that all students are male• Conclude that all machine learning students are male
– Fitting too many parameters with too few data points• E.g. fitting a line to a single data point
• Over fitting can be worsened with– Too many parameters (or over-complex model)– Too few training examples

Use Validation Set• We can keep part of the labeled data apart as
validation data• Evaluate different k values based on the
prediction accuracy on the validation data• Choose k that minimize validation error
Training Validation Testing
Validation can be viewed as another name for testing, but the name testing is typically reserved for final evaluation purpose, whereas validation is mostly used for model selection purpose.

• If we only reserve one point in our validation set, should we trust the validation error as a reliable estimate of our classifier’s performance?
• No. The larger the validation set, the more reliable our model selection choices are
• When the total labeled set is small, we might not be able to get a big enough validation set – leading to unreliable model selection decisions
The impact of validation set size
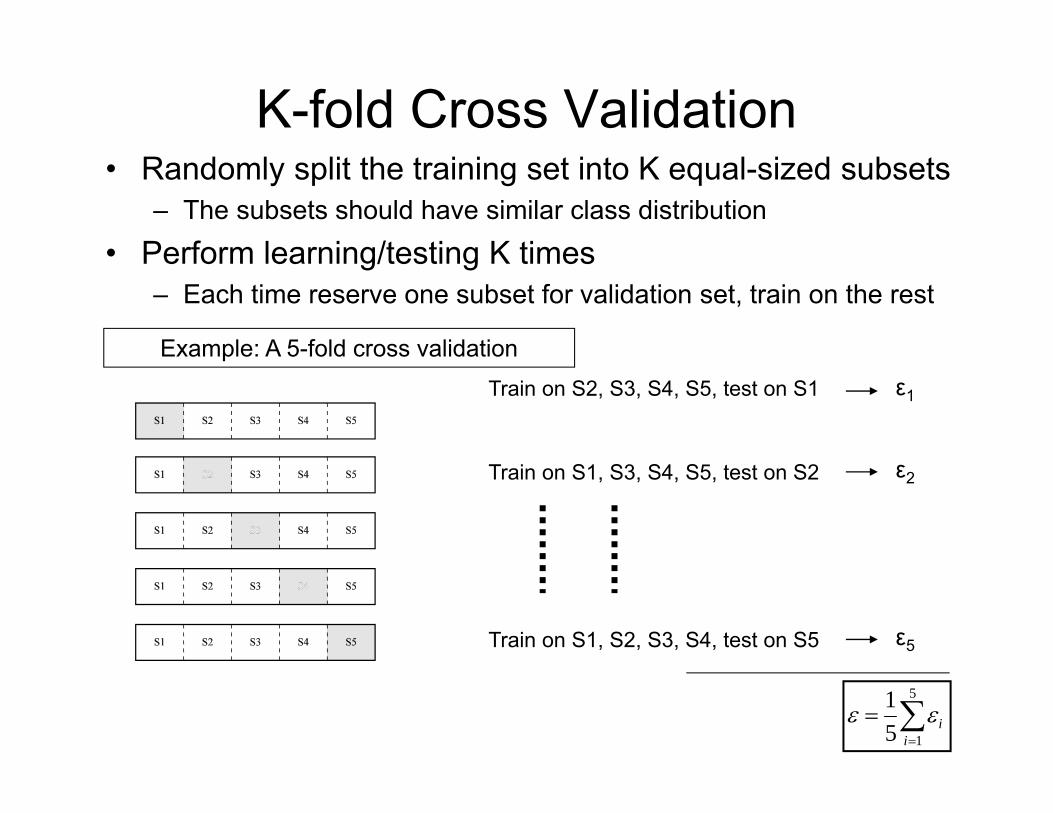
K-fold Cross Validation• Randomly split the training set into K equal-sized subsets
– The subsets should have similar class distribution
• Perform learning/testing K times– Each time reserve one subset for validation set, train on the rest
Train on S2, S3, S4, S5, test on S1
Train on S1, S3, S4, S5, test on S2
Train on S1, S2, S3, S4, test on S5
ε1
ε2
ε5
5
151
ii
Example: A 5-fold cross validation

Leave-one-out Cross Validation
• If we set K=n=|S|, we end up with what we call leave-out-out cross validation
• Each time we leave one example out for validation
What is the leave-one-out error of 1-nearest neighbor on this data set?
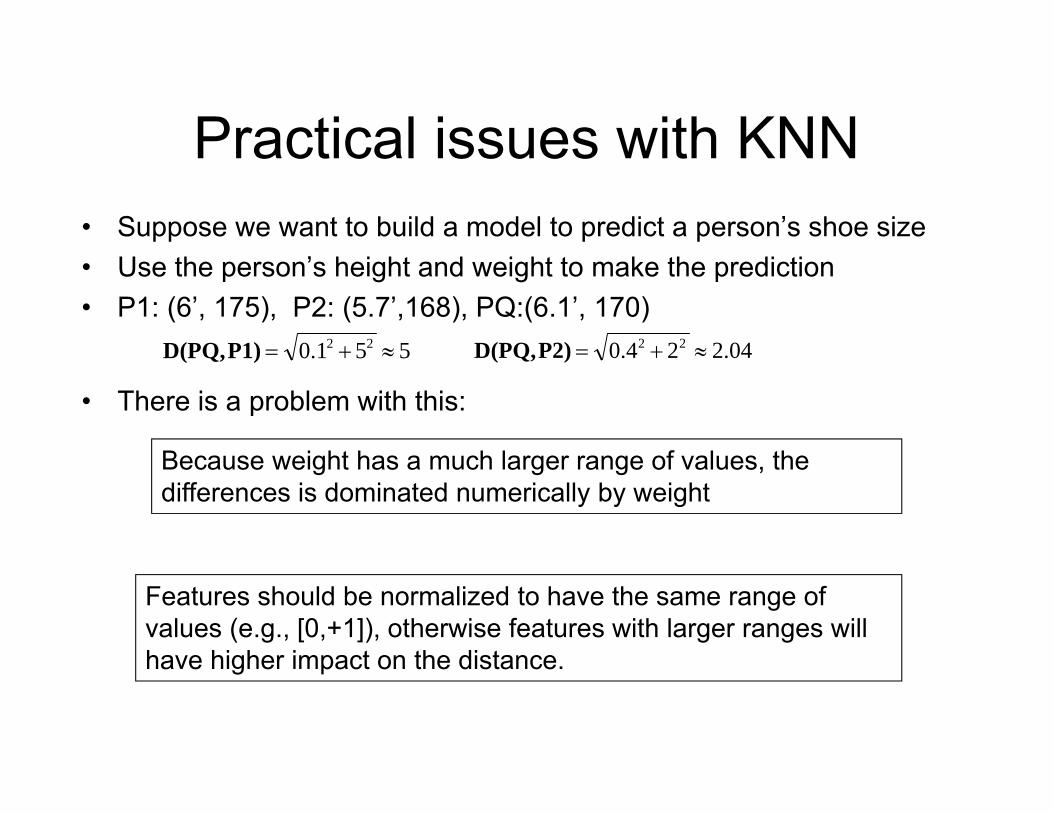
Practical issues with KNN• Suppose we want to build a model to predict a person’s shoe size• Use the person’s height and weight to make the prediction• P1: (6’, 175), P2: (5.7’,168), PQ:(6.1’, 170)
• There is a problem with this:
551.0 22 P1)D(PQ, 04.224.0 22 P2)D(PQ,
Because weight has a much larger range of values, the differences is dominated numerically by weight
Features should be normalized to have the same range of values (e.g., [0,+1]), otherwise features with larger ranges will have higher impact on the distance.

Practical issues with KNN
• Our data may also contain the GPAs• Should we include this attribute into the calculate?• When collecting data, people tend to collect as much
information as possible regardless whether they are useful for the question in hand
• Recognize and remove such attributes when building your classification models
• Curse of dimensionality:– In high dimensional space (e.g., over 20), data becomes so
sparse that the nearest neighbor is still very far, not informative any more

Other issues• It can be computationally
expensive to find the nearest neighbors!– O(Nd) for every test point (as
opposed to O(d) for linear classifier)
– Speed up the computation by using smart data structures to quickly search for approximate solutions
• For large data set, it requires a lot of memory– Remove unimportant examples
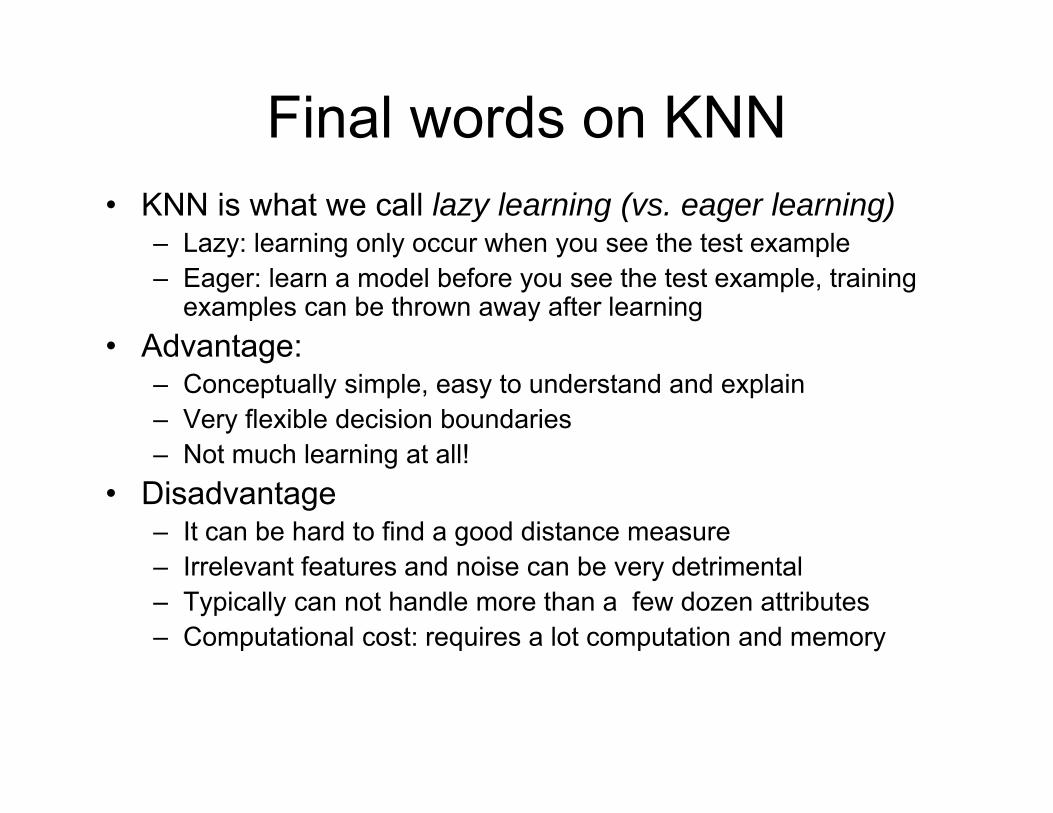
Final words on KNN• KNN is what we call lazy learning (vs. eager learning)
– Lazy: learning only occur when you see the test example– Eager: learn a model before you see the test example, training
examples can be thrown away after learning• Advantage:
– Conceptually simple, easy to understand and explain– Very flexible decision boundaries– Not much learning at all!
• Disadvantage– It can be hard to find a good distance measure– Irrelevant features and noise can be very detrimental– Typically can not handle more than a few dozen attributes– Computational cost: requires a lot computation and memory