
NDRWSA WW AMP 2021 - Read-Only
30
5/24/2021 1 Water System O&M Training ■ May 25 – Medora ■ May 26 – Stanley ■ May 27 – Rugby ■ June 22 – Lincoln ■ June 23 – Mapleton ■ June 24 – Park River ■ July 20 – Beulah ■ July 21 – Harvey ■ July 22 – Mayville Watch your mail or visit www.ndrw.org for more info! 35 th Annual Water Systems EXPO February 1-3, 2022 Delta by Marriott-Fargo SUSTAINABLY MANAGING INFRASTRUCTURE ND Rural Water May 18 & 20 Topics to be Covered Today ■ System Sustainability ■ Asset Management ■ Utility Rates 1 2 3 4 5 6
Transcript of NDRWSA WW AMP 2021 - Read-Only

5/24/2021
1
Water System O&M Training■ May 25 – Medora■ May 26 – Stanley■ May 27 – Rugby■ June 22 – Lincoln■ June 23 – Mapleton■ June 24 – Park River■ July 20 – Beulah■ July 21 – Harvey■ July 22 – MayvilleWatch your mail or visit www.ndrw.org for more info!
35th Annual Water Systems EXPO
February 1-3, 2022Delta by Marriott-Fargo
SUSTAINABLY MANAGING INFRASTRUCTURE
ND Rural WaterMay 18 & 20
Topics to be Covered Today
■System Sustainability■Asset Management■Utility Rates
1 2
3 4
5 6

5/24/2021
2
Common WW O&M Issues
■ Overall Age (Tired)
■ Lift Station Corrosion
■ Replacement & Repair of Deteriorated Pipe
■ Off Set Joints
■ Protruding Service Lines
■ Roots
■ Dips/Low Areas■ Inflow & Infiltration■ Riprap Protection■ Control of Vegetation■ Infrequent Removal of
Primary Lagoon Biosolids (Sludge)
■ Seasonal Odors
National Wastewater Overview
16,000 WW Treatment Plants
in the U.S.
800,000 miles of Public Sewers
500,000 miles of Lateral Sewers
$3B in 2019, $18/customer to
replace 4,700 miles of pipe
Infrastructure Gap is $81B
Water & WW Gap by 2029 will be
$434B
ND Wastewater Overview
755,000 Residents
350 Municipal WW Systems
Most are considered Small
60% of the Population served by Mechanical WW Plants
40% served by Ponds or Septic Systems
ND Project Priority List
$345M Total Need
$42.3M for I&I Reduction
$106.4M for Sewer Rehab
$42.5M for New Sewers
$50.85M for Storm Sewers
$99.73M for Secondary Treatment
$2.4M for Advanced Treatment
Wastewater Infrastructure Grades from the ASCE Report Card
■ Nationwide = D+■ North Dakota = C-
7 8
9 10
11 12

5/24/2021
3
Recommendations to Raise the Grade:■ Systems should strive to develop asset
management plans.
■ Systems should ensure their rates cover the full cost of service including O&M, and capital needs; clearly communicate rate increases to the public; and balance local issues with affordability.
Drinking Water
Overview
1M miles of pipe across the USA
240,000 water main breaks per year
2 Trillion gallons of DW wasted
$1 Trillion needed to maintain and expand service to meet demand in the next 25 years.
0.5% replacement rate = 200 years
Drinking Water
Overview
Consumption has declined by 5% this decade.
1st time in 40 years
EPA sets legal limits for over 90 contaminants.
ASCE Infrastructure Report Card C-
Let’s Take a Poll!
What Size of Community do you Represent?
Less than 500500-1,000
1,000-3,3003,300-10,000
Greater than 10,000
How many have a Dollar General?Do you have any Old, Aging,
Broken, Not Working Efficiently, Well Past its Useful Life, Never Really Worked Right in the First
Place, Can’t Get Parts For Anymore or Duck Taped
Infrastructure?
13 14
15 16
17 18

5/24/2021
4
AWWA’s Buried No Longer draws the following conclusions:
1. Utility bills will increase.
2. Utilities need investment year after year for decades, and delaying investment makes the problem worse.
3. Investment needs will fall mostly heavily on small systems.
4. Slow or negative growth complicates investment for some Midwestern systems.
Sustainable Systems & Effective Utility Management
Effective Utility Management
■ 360° look at your utility and sets priorities■ Moves you from reacting to the “hot priorities” of
the day to proactively planning for the future
■ Engages your staff in the process of assessing and charting your own course for the future
■ It is simple, actionable, affordable, and scalable to meet the needs of all utilities
19 20
21 22
23 24

5/24/2021
5
The Ten Areas ■ Product Quality
■ Customer Satisfaction
■ Infrastructure Stability
■ Community Sustainability & Economic Development
■ Stakeholder Understanding and Support
■ Employee Leadership and Development
■ Operational Optimization – Energy and Water Efficiency
■ Operational Resiliency
■ Water Resource Adequacy
■ Financial Viability
The Ten Areas
■ Provide a clear set of reference points– Measurable– “You can’t improve what you don’t measure”
Product Quality
■ Clean and safe water
■ Produce potable water, treated effluent, and process residuals:– Full compliance with regulatory and reliability
requirements– Consistent with customer, public health, and ecological
needs– Consistent with local economic development and
business needs
25 26
27 28
29 30

5/24/2021
6
Customer Satisfaction
■ Know what your customers expect in service, water quality, and rates
■ Set goals to meet these expectations
■ Help your customers understand the value of water
■ Develop a way to gather feedback from your customers, review the feedback, and then act on it
Employee Leadership and Development■ Enable a workforce that is competent, motivated, adaptive,
and safe working
■ Ensure employee institutional knowledge is retained and improved on over time
■ Create opportunities for professional and leadership development
Operational Optimization
■ Ensure on-going, timely, cost-effective, and reliable performance improvements in all facets of operations (i.e., continual improvement culture)
■ Minimize resource use, loss, and impacts from day-to-day operations (e.g., energy and chemical use, water loss)
■ Maintain awareness of information and operational technology developments to anticipate and support timely adoption of improvements
Financial Viability
■ Ensure revenues adequate to recover costs, fund timely maintenance, repair, and replacement of assets, and provide for reserves
■ Establish predictable rates, consistent with community expectations and acceptability –discuss rate requirements with customers, board members, and other key stakeholders
Infrastructure Stability■ Understand costs and condition for each system
component
■ Understand operational performance factors (e.g., pressure)
■ Plan for system component repair and replacement over the long-term at the lowest possible cost
■ Coordinate asset repair, rehabilitation, and replacement within the community to minimize disruptions and other negative consequences
31 32
33 34
35 36

5/24/2021
7
Operational Resiliency■ Identify threats to the system (legal, financial, non-
compliance, environmental, safety, security, and natural disaster) – conduct all hazards vulnerability assessment
■ Establish acceptable risk levels that support system reliability goals
■ Identify how you will manage risks and plan response actions – prepare all-hazards emergency response plan
Wing Freeze up 2019
Community Sustainability & Economic Development■ Be active in your community
– Be aware of, or participate in, discussions of community and economic development
– Get to know local business needs and be aware of opportunities for new residential or business customers
■ Align Utility Goals: to be attentive to the impacts utility decisions will have on current and future community and watershed health
■ Align Utility Goals: to promote community economic vitality and overall improvement
Water Resource Adequacy
■ Ensure water availability consistent with current and future customer needs:– Long-term resource supply and demand analysis– Conservation– Public education
■ Understand the system role in water availability
■ Manage operations to provide for long-term aquifer and surface water sustainability and replenishment
Stakeholder Understanding and Support■ Create understanding and support from oversight bodies, community
and watershed interests, and regulatory bodies:– Service levels
– Rate structures
– Operating budgets
– Capital improvement programs
– Risk management decisions
■ Actively engage with the community and customers:– Understand needs and interests
– Promote the value of clean and safe water
SYSTEM IMPROVEMENT PRIORITIES:SELF ASSESSMENTTime to Go to Work!
37 38
39 40
41 42

5/24/2021
8
Getting Started
■ Step 1: RATE your system’s level of achievement (practice and performance) for each management area
■ Step 2: RANK the importance of each area
■ Step 3: PLOT the results
■ Step 4: IMPROVE by exploring high achievement-related practices
Step 1: RATING AreasScale from Low to High Achievement
■ Select Low if your system has no workable practices in place for addressing this area – very low capacity and performance.
■ Select Medium if your system has some workable practices in place with moderate achievement, but could improve –some capacity in place.
■ Select High if your system has effective, standardized, and accepted practices in place. It either usually or consistently achieves goals – capacity is high and in need of very little or no further development.
Step 2: RANKING AreasScale from Low to High Priority
■ Current or expected challenges
■ Customer or stakeholder impact: reliability; quality; timeliness
■ Consequences of not improving: compliance; cost; credibility; health; safety
■ Urgency – near or long term need
■ Community priorities
Steps 2 & 3: RATING and RANKING AreasSelf Assessment Demonstration
Step 4: PLOTTING ResultsSelf Assessment Demonstration
Steps 4 & 5: PLOTTING Results and FOCUSING AttentionSelf Assessment Demonstration
43 44
45 46
47 48

5/24/2021
9
Self Assessment Discussion Questions■ Where is your utility strong? Why?■ Where is there the most room for improvement? Why?■ What are your areas of focus?
– Why are they a priority?– Why is performance low?
■ Technical capacity?■ Financial capacity?■ Managerial capacity?
■ What are the commonalities and differences among table participants?
ASSET MANAGEMENT
Simple Definition of an “Asset”
■ A valuable person or thing
■ Property owned by a person or company, regarded as having value
Challenges faced by Utilities■ Determining the best (or optimal) time to
rehabilitate/repair/replace aging assets.
■ Increasing Demand for services or Decreasing demand
■ Overcoming resistance to rate increases.
■ Diminishing resources.
■ Rising service expectations of customers.
■ Increasingly stringent regulatory requirements.
■ Responding to emergencies as a result of asset failures.
■ Protecting assets.
Asset Management Definition■ Maintaining a desired level of service for what you
want your assets to provide at the lowest life cycle cost.
■ Lowest life cycle cost refers to the best appropriate cost for rehabilitating, repairing or replacing an asset.
Repair, Rehabilitate or Replace?
49 50
51 52
53 54
5/24/2021
10
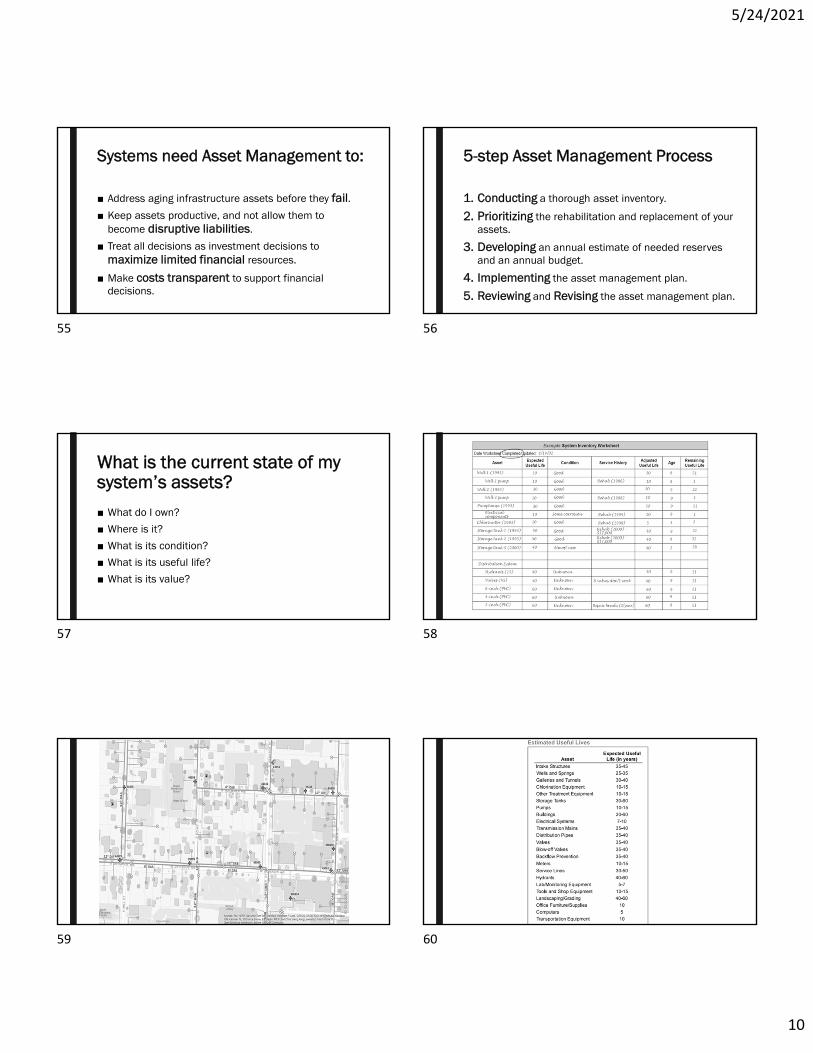
Systems need Asset Management to:
■ Address aging infrastructure assets before they fail.■ Keep assets productive, and not allow them to
become disruptive liabilities.
■ Treat all decisions as investment decisions to maximize limited financial resources.
■ Make costs transparent to support financial decisions.
5-step Asset Management Process
1. Conducting a thorough asset inventory.
2. Prioritizing the rehabilitation and replacement of your assets.
3. Developing an annual estimate of needed reserves and an annual budget.
4. Implementing the asset management plan.
5. Reviewing and Revising the asset management plan.
What is the current state of my system’s assets?
■ What do I own?
■ Where is it?
■ What is its condition?
■ What is its useful life?
■ What is its value?
58
55 56
57 58
59 60

5/24/2021
11
How Do I Prioritize My Assets?
■ How soon will you have to replace an asset (its remaining useful life).
■ Existing threat to public health, safety, or environment;■ Potential public health, safety, or environmental
concern;■ Internal safety concern or public nuisance;■ Improved system operations & maintenance (O&M)
efficiency; and■ It would be nice to have...
How Do I Plan for the Future?
■ Determine how much it will cost to rehabilitate and replace your assets as they deteriorate.
How Do I Carry Out This Plan?
■ Preparing a financial forecast (next 5 years) will help you determine if you will need to supplement your revenues to carry out your asset management plan.
Budgeting Worksheet
■ Your system’s annual revenues from fees, loans and grants, interest from any accounts, and other sources of income.
■ Your annual expenditures on maintenance, utilities, salaries and benefits, office supplies, professional services, taxes, and loan payments.
■ Your net income.■ How much additional funding you will need to
continue to operate and maintain your system and replace and repair your assets.
61 62
63 64
65 66

5/24/2021
12
What is my best long-term funding strategy?■ Do we have enough funding to maintain our assets for
our required level of service?■ Revising the rate structure.■ Funding a dedicated reserve from current revenues (i.e.,
creating an asset annuity).■ Financing asset rehabilitation, repair, and replacement
through borrowing or other financial assistance.
Making the Commitment■ Asset management requires an investment in time and
resources.
■ Asset management is not a 1-year project, or even a 5-year project.
■ It is a continual, fundamental change in the way infrastructure assets are managed.
Do not let the TTWWADI Syndrome Hold you back?
Barriers to implementing an Asset Management Program may include:
■ Expecting to see immediate results.
■ Changing from a focus on operations to a focus on assets.
■ Reconciling a short-term focus (e.g., rate increases) with long-term view of system sustainability.
In Summary…
67 68
69 70
71 72

5/24/2021
13
Asset management will enable your system to:
■ Have more efficient and focused operations.
■ Choose capital projects that meet the system’s true needs.
■ Base rates on sound operational decisions.
■ Improve its financial health.
■ Reduce environmental violations due to failed or poorly performing assets.
■ Improve the security and safety of infrastructure assets.
Role of Rate Setting
■ A utility’s rates provide a price signal to customers about the cost consequences of their usage decisions.
■ Utilities must charge “just & reasonable prices” and they must do so in “equitable & nondiscriminatory fashion”.
Role of Rate Setting
■ All things that are done by a utility must be done in the context of how that action serves customers and ratepayers.
■ Actions you take should serve them, or at least not be a disservice to them.
Utilities and Football■ Utilities serve us very well when they are both efficient and
effective – Touchdown!
■ They serve us pretty well if they are effective but not efficient –they win but they win ugly.
■ They serve us poorly if they are efficient, but not effective – they gain lots of yards but never cross the goal line.
■ Utilities can do it cheap, but if they don’t satisfy our needs, they have failed us.
Full Cost Pricing
■ Recouping the entire costs through rates, fees, charges and other revenue derived from sales
■ Entire cost refers to O&M, reserves, repair, and ultimate replacement of the infrastructure
■ Reinvesting in the System is KEY!
Full Cost Pricing
■ Every sustainable utility, like every other sustainable endeavor, must have adequate reserves.
■ To NOT have reserves is irresponsible, but inadequate reserves can be fixed.
■ Strive to “break even” and you will go broke.
73 74
75 76
77 78

5/24/2021
14
Rates Basics■ Full Cost Pricing
■ Future Planning: 1 – 5 – 10 – 20 years■ Self-Sufficient■ Rates have a short life span
Rate Goals & Objectives
■ Revenue Sufficiency
■ Revenue Stability
■ Equity & Fairness
■ Easy to Understand & Administer
Rates are a delicate Balancing Act
■ Expenses vs Income
■ Proper Ratios vs Affordability
Cost, Price, and Value:Not the Same■ Cost
– Refers to the expense of collection/treatment of a unit of sewer.
■ Price– Refers to the rate charged to a customer for
handling that unit of sewer.
■ Value– Customer’s Maximum willingness to pay
Full Cost Circle
Price Demand
Cost System Design
Full Cost Circle
■ Price & Demand: According to the law of demand, when price increases, the amount of services demanded decreases (and vice versa).
■ Demand & System Design: Just like electric systems, sewer systems are designed to meet demand loads.
79 80
81 82
83 84

5/24/2021
15
Full Cost Circle
■ System Design & Cost: The design of the system affects the cost of service.
■ Cost & Price: The costs of providing service are recovered through charging of sewer rates.
System Capacity
■ The ability to plan for, achieve, and maintain compliance with clean water standards.
■ Capacity has three components
■ Technical, Managerial, Financial
Truths Concerning Ratepayers
1. Ratepayers need their service.
2. Ratepayers want their service relatively inexpensive.
3. Almost 100% of your ratepayers don’t want to think about you or the utility at all.
4. A persistent, tiny minority of your ratepayers want to think about you all the time, and not in a good way, regardless of what you do or say.
Ratepayers
■ Some ratepayers also do not know, do not appreciate, or simply want to dismiss the fact that providing utility services costs money, their money.
■ They would like to pay nothing for the service, or at least, as little as possible.
85 86
87 88
89 90

5/24/2021
16
How can a system increase income without raising rates?
■ Revise system policies– Front End Charges• Connection, Tap, Impact, Membership Fees
– Deposits/Admin Fee– Delinquent/Late Payments– Shut-off Policy– Disconnect & Reconnect Policy– Seasonal/part time users/lots with water or sewer– Renters, Apartments…
Sewer Policies
What is a board’s job?
■ “The board’s job is to keep rates down!”
■ “They’d vote us out if we raised rates!”
■ “We haven’t raised rates in 15 years, and we’re proud of it!”
■ “We have a lot of folks on fixed incomes who can’t afford to pay more!”
■ “Government should do more with less!”
91 92
93 94
95 96

5/24/2021
17
3 Main Questions to Ask
■ Where are we?
■ Where do we want to be?
■ How do we get there?
More Questions?■ Do our rates cover current costs?■ Will our rates cover future costs?■ Are our rates fair to our customers?■ Are we fully funding reserve accounts?■ Are we going to apply for grants and loans?■ What if the economy, inflation and interest rates
change?■ Is our population growing or declining?■ Do operating revenues meet or exceed operating cost?
Initial Rate Adjustments
■ Generally, you should do an initial rate adjustment. Follow that with across the board increases each year for several years. Eventually, do a new initial rate adjustment, restarting the cycle.
Rates in the Simplest Form■ True and Full Sewer System Expenses
■ # of Customers■ # of Gallons Entering the Sewer System■ 12 Months in a year■ Rough Repair & Replacement Schedule■ Current Rates
■ Collection % and Amounts■ System Demand Data■ Socioeconomic Conditions
Rates Background
■ Monthly Minimum– This should account for your fixed cost– Does not depend on the amount of service a customer
receives– Covers non-production costs
■ “Availability Cost”– Customers being able to access the sewer system– Billed to all customers equally– Guarantees Revenue
Fixed Cost Examples
■ Insurance
■ Admin Time
■ Billing
■ Accounting
■ Legal
■ Contracts
■ Debt
97 98
99 100
101 102

5/24/2021
18
Rates Background■ Usage Charge (per 1000 gallons)
– Should cover the variable costs– Variable costs occur because the system gets used
■ The more volume a customer uses the more variable costs they should pay
■ Assessed on each 1000 gallons of sewer usage as a unit charge
Variable Cost Examples
■ Salaries & Benefits for O&M Staff■ Chemicals■ Electricity■ Purchased Water■ Operating Supplies & Equipment■ Regular Maintenance & Repairs
Reserve Accounts
■ Emergency Operating Reserve
■ Debt Service Reserve
■ Planned Repair/Replacement Reserve
■ Capital Improvement Reserve
Emergency Operating Reserve
■ Unexpected expenses
■ Amount varies from system to system
■ Typically 10-15% of the operating expenses
■ Sometimes called the Working Capital Goal
Debt Service Reserve■ Required by Lenders
■ Allows systems to continue making debt payments should other funds be unavailable
■ 1.20 for SRF, 1.90 for Bonds
■ 20% or 1.20 additional revenue than expenses
Planned R&R Reserve
■ Planned repair, rehab, or replacement of short-lived assets.
103 104
105 106
107 108

5/24/2021
19
Capital Improvement Reserve
■ Dedicated to the payment of LARGE, future capital projects.
■ Upgrades or New Construction
■ Often only a part of the cost is included
■ The other part is financed
How often should a system adjust rates?■ When an Analysis/Review shows it is time
■ When circumstances occur
■ Before you start losing money
■ Rate Indexing to at least keep up with inflation
Inflation Definition
■ A general and progressive increase in prices; “with inflation, everything gets more valuable except money”.
■ The inflation rate is calculated from the difference between Current Consumer Price Index and the Consumer Price Index a year ago.
Consumer Price Index
■ The Consumer Price Index, or CPI, is a monthly/yearly measurement of inflation.
■ It reports on the price changes of 80,000 items that represent a cross-section of goods and services purchased by urban households.
■ These metropolitan consumers represent 87% of the U.S. population.
109 110
111 112
113 114

5/24/2021
20
Inflation
■ Average annual inflation rate is 3.10%.
■ That doesn't sound too bad until we realize that at that prices will double every 23.2 years.
■ Current Inflation Rate 4.16%
Social Security Cost-Of-Living Adjustments (COLA)
2009 0.0%2010 0.0%2011 3.6%2012 1.7%2013 1.5%2014 1.7%
2015 0.0%2016 0.3%2017 2.0%2018 2.8%2019 1.6%2020 1.3%
Depreciation
■ Is a non-cash expense that reduces the value of an asset over time.
■ Due to obsolescence or use
Utility Asset Depreciation
■ Each time you operate a piece of equipment, you subject it to wear and tear, thereby reducing its value.
115 116
117 118
119 120

5/24/2021
21
Utility Asset Depreciation
■ Unless you actually deposit the amount being depreciated into a savings account of some sort, depreciation is not real money.
■ An Equipment Replacement Reserve is the real-world equivalent of depreciation
■ Failure to contribute to that reserve fund each year is a failure to properly calculate the “FULL” Cost of doing business.
Financial Indicators
■ Operating Ratio
■ Coverage Ratio
■ Working Capital Goal
■ Affordability Index
Rate Odds and Ends■ Energy Audits
■ Run Your System Like a Good Business
■ Raising Revenues without Raising Rates
■ Full Cost Pricing
■ Plan for the Future
■ Reinvest in your System
■ Pull the trigger on inflationary increases every year
Final Thoughts
■ Small increases are better than large increases
■ Scheduled, small increases are even better
■ Rate Shocking is never fun
BREAK! Demos
■ Sewer Camera Demo
■ Smoke Testing Demo
■ Sludge Testing Demo
■ Aerial & Aquatic Drone Demos
■ Collection System Flushing
■ Lift Station O&M
121 122
123 124
125 126

5/24/2021
22
127 128
129 130
131 132

5/24/2021
23
133 134
135 136
137 138

5/24/2021
24
139 140
141 142
143 144

5/24/2021
25
145 146
147 148
149 150

5/24/2021
26
151 152
153 154
155 156

5/24/2021
27
157 158
159 160
161 162

5/24/2021
28
Any Burning Questions?
163 164
165 166
167 168

5/24/2021
29
169 170
171 172
173 174

5/24/2021
30
175