NCDOT State of the Practice Update: Models, Data ...ncampo.org/1-NCDOT State of the Practice Update...
48
NCDOT State of the Practice Update: Models, Data, Statistics, and Uses NCAMPO Conference - May 2016 Brian Wert, PE, Amar Pillai, John Burris, PTP
Transcript of NCDOT State of the Practice Update: Models, Data ...ncampo.org/1-NCDOT State of the Practice Update...
NCDOT State of the Practice Update: Models, Data, Statistics, and Uses
NCAMPO Conference - May 2016
Brian Wert, PE, Amar Pillai, John Burris, PTP
Transportation
Presentation Goals
Compare and contrast different information Provide a snap shot of current tools General use of items in practice
•“Mile wide and half an inch deep”
2

Transportation
Disclaimer
This is a generalized set of slides. The general process must be adopted to the specific area and project. It is incorrect to draw conclusions about a specific process based on this set of slides without more information and expertise. Every process is unique, like every game of chess is unique. Same rules, different permutations.
3

Transportation
Agenda
•Data vs. Statistics •Types Volume Information •Overview of Travel Demand Models in NC
•Current Practices (State of practice? NCHRP 716 and 765?)
4

Transportation
Data vs. Statistics
5
Transportation
Data vs. Statistics: Definitions
Data – facts or information used usually to calculate, analyze, or plan something Statistic – a number that represents a piece of information; a collection of quantitative data Definitions courtesy of M-W.com
6

Transportation
Data vs. Statistics: Differences
In general, a statistic provides information about data or a set of data. Transportation planning frequently reports statistics. Examples of statistics: •AADT •Model volumes •Forecast volumes
7

Transportation
Data vs. Statistics: General Notes
Statistics are only as accurate as the data they are based on. Data is very hard to gather with 100% accuracy. Inherent limits to accuracy of data and statistics.
8
Transportation
Types of Volume Information
9

Transportation
Types of Volume Information: AADT Data
10
AADT is Average Annual Daily Traffic Represents and average day not just an average weekday Based on count and seasonal adjustment factors or continuous count stations Good starting point and for comparisons between facilities
Transportation
Types of Volume Information: AAWT Data
11
AAWT is Average Annual Weekday Traffic Represents and average weekday (excludes weekends) Based on count and seasonal adjustment factors or continuous count stations Good starting point and for comparisons between facilities May be higher or lower than AADT depending on land uses

Transportation
Types of Volume Information: Link Based Model Data
12
Link Based model data generally represents a daily volume • Be wary of peak period model information Can be AADT or AAWT • Check documentation (frequently AWDT) Useful for comparing multiple scenarios Not to be used for absolute data • Calibration occurs at the network level not the link level
Models provide planning level data

Transportation
Types of Volume Information: System Model Data
13
System model data generally represents a daily volume • Be wary of peak period model information Can be AADT or AAWT • Check documentation System data is the sum of the link based data Useful for absolute data • Calibration occurs at the network level Can also be used to compare scenarios
Models provide planning level data

Transportation
Types of Volume Information: Long Range Plan/CTP Projections
14
Begins with system AADT data Typically applies generalized growth rates: • Rough percentage • Unadjusted model growth trends 20 to 30 year horizon Not as precise as forecasts or estimates Good for identifying potential deficiencies Not for decisions beyond lane calls • Even lane call decisions should be verified later
Transportation
Types of Volume Information: SPOT Future Year Volume Information
15
10 year projection of volume Starts with AADT or count data Data shifted to peak month conditions (PADT) Growth from county averages from the NCSTM Good for comparing projects to one another Not consistent with other traffic projections • Mixes link and system data Not to be used in place of a traffic forecast/estimate

Transportation
Types of Volume Information: Traffic Estimate
16
Traffic Estimates quickly ground truth model information with readily available data Readily available data includes: • AADT Data • Previously collected count data
20 to 30 year horizon Less detailed than a forecast Excellent for: • Lane calls • Alternative screenings • General intersection/interchange treatments • Cost estimation developments or refinements
Transportation
Types of Volume Information: Traffic Forecast
17
Traffic Forecasts provide detailed project specific information based on recently collected field data and scrutinized growth projections Based on field collected data 20 to 30 year horizon In depth analysis of micro and macro growth trends Information gathered from numerous sources: • Travel Demand Models • State agencies • Local planners • Local land owners
Only product sufficient to ensure a quality design

Transportation
Overview of Travel Demand Models in NC
18

Transportation
Planning for the Future
Transportation Planning
The process of defining future policies, goals, investments and designs to prepare for future
needs to move people and goods to destinations.
19

Transportation
Planning for the Future
“The best way to predict your future is to create it.”
― Abraham Lincoln 20

Transportation
Why Travel Demand Model?
21
Realm of Possibilities
Time
Gro
wth
Base Year Future Year
Trend
Transportation
Planning for the Future
Travel Demand Model building involves understanding trip characteristics of the region.
Trip characteristics? Trip Purpose Temporal distribution Spatial distribution Modal splits
Models are created based on the these characteristics to
analyze different “What if” scenarios
22

Transportation
Travel Demand Model –Mechanism & Components
23
Land-Use
Transportation
Transportation
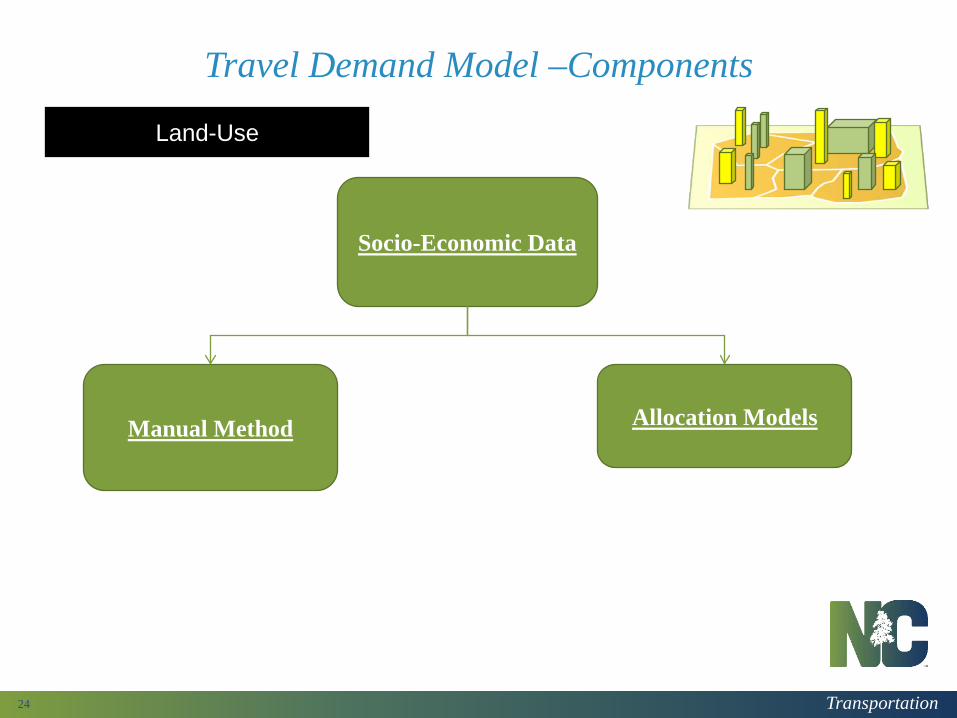
Travel Demand Model –Components
24
Land-Use
Socio-Economic Data
Manual Method
Allocation Models
Transportation
Overview of Travel Demand Models in NC: Land Use Models
25
Land Use Models help allocate growth Inputs are growth totals and land availability Growth is allocated based on attractiveness/suitability These are not developed by NCDOT
Transportation
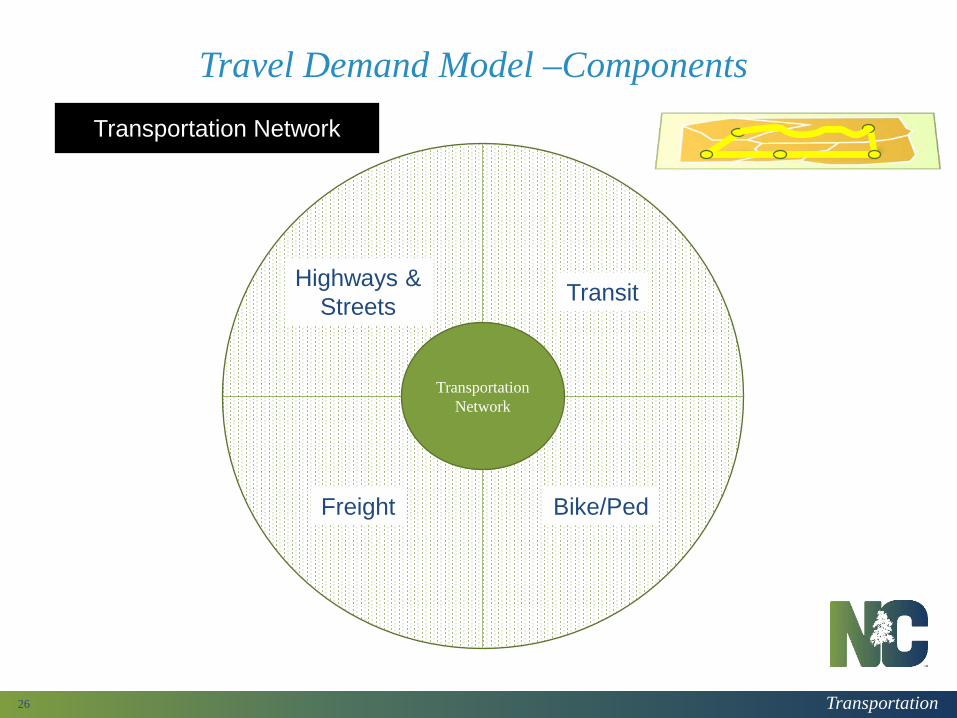
Travel Demand Model –Components
26
Transportation Network
Transit Highways & Streets
Freight Bike/Ped
Transportation Network

Transportation
Models In North Carolina
27
General Classification: Statewide Model
Regional models
MPO and Small area models
Transportation
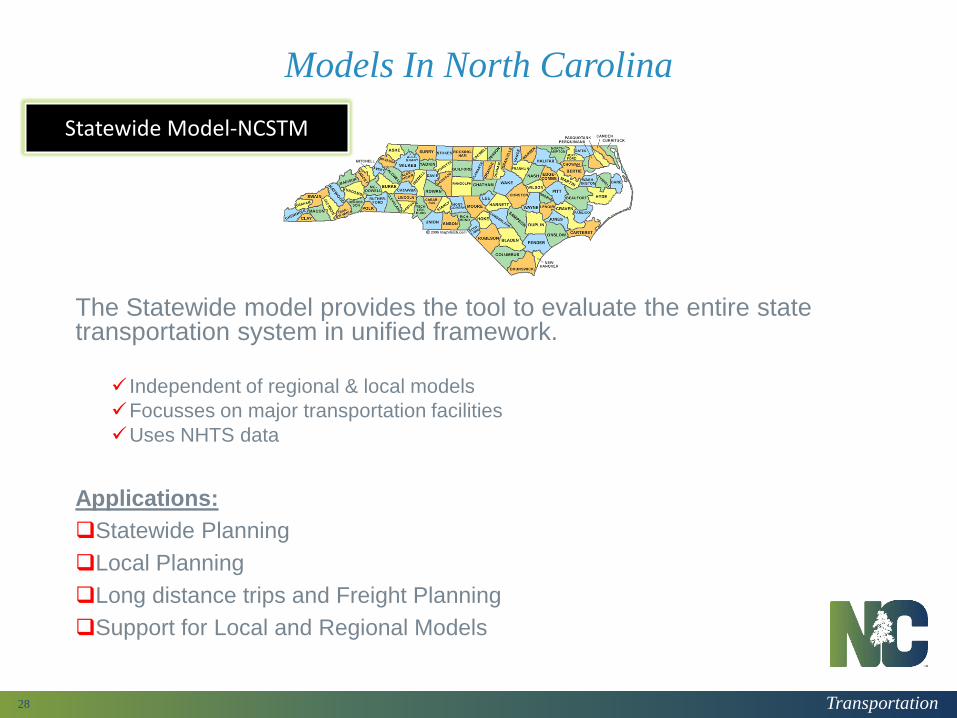
Models In North Carolina
The Statewide model provides the tool to evaluate the entire state transportation system in unified framework.
Independent of regional & local models Focusses on major transportation facilities Uses NHTS data
Applications: Statewide Planning Local Planning Long distance trips and Freight Planning Support for Local and Regional Models
28
Statewide Model-NCSTM
Transportation
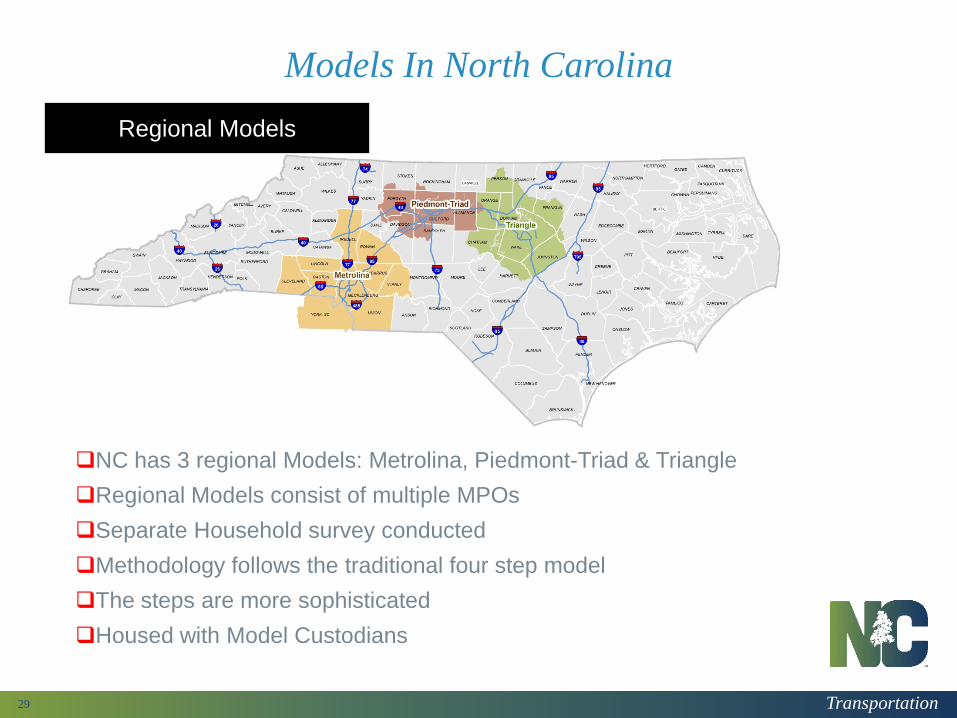
Models In North Carolina
29
NC has 3 regional Models: Metrolina, Piedmont-Triad & Triangle Regional Models consist of multiple MPOs Separate Household survey conducted Methodology follows the traditional four step model The steps are more sophisticated Housed with Model Custodians
Regional Models
Transportation
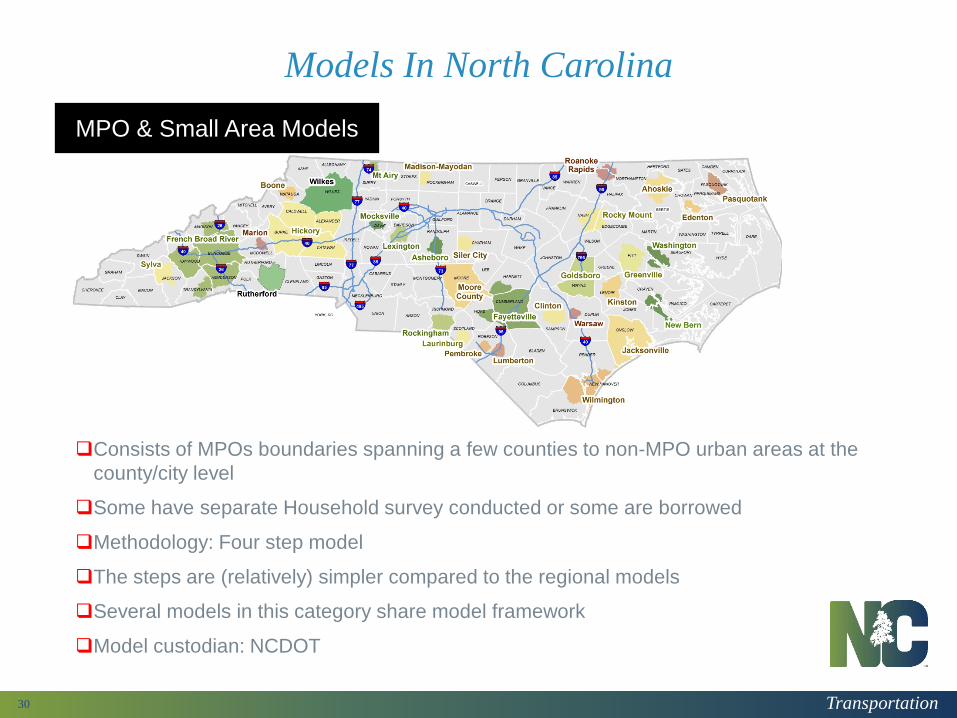
Models In North Carolina
30
Consists of MPOs boundaries spanning a few counties to non-MPO urban areas at the county/city level
Some have separate Household survey conducted or some are borrowed
Methodology: Four step model
The steps are (relatively) simpler compared to the regional models
Several models in this category share model framework
Model custodian: NCDOT
MPO & Small Area Models

Transportation
What Makes a Good Travel Demand Model?
Any model that can answer the relevant questions Relevance is more important that sophistication. Sophisticated doesn’t necessarily mean better
Tailor-made to answer questions unique to the issues faced by that region.
31

Transportation
Models In North Carolina
32
Regional Models
Metrolina
Geographic Boundary: 11 Counties
Models consists of: 3 MPOs
Household Trip Characteristics: Based on Household Survey
Network Capacity Methodology: Link-based with node included
Additional Network Features: Tolls, Managed Lanes &Transit
Land-use Features: Major Urban Area
Mode Choice: Inlcudes 5 modes
Model Custodian: Charlotte Department of Transportation
Triad
Geographic Boundary: 3 Full and 6 Partial Counties
Models consists of: 4 MPOs
Household Trip Characteristics : Based on Household Survey
Network Capacity Methodology: Link-Based
Additional Network Features: Tolls, Managed Lanes &Transit
Land-use Features: Major Urban Area
Mode Choice: gfghfh
Model Custodian: Piedmont Authority for Regional Transportation
Triangle
Geographic Boundary: 3 Full and 7 Partial Counties
Models consists of: 2 MPOs
Household Trip Characteristics : Based on Household Survey
Network Capacity Methodology: Link-based
Additional Network Features: Tolls, Managed Lanes &Transit
Land-use Features: Major Urban Area
Mode Choice: gfghfh
Model Custodian: Institute of Transportation Research and Education
Transportation
Models In North Carolina
33
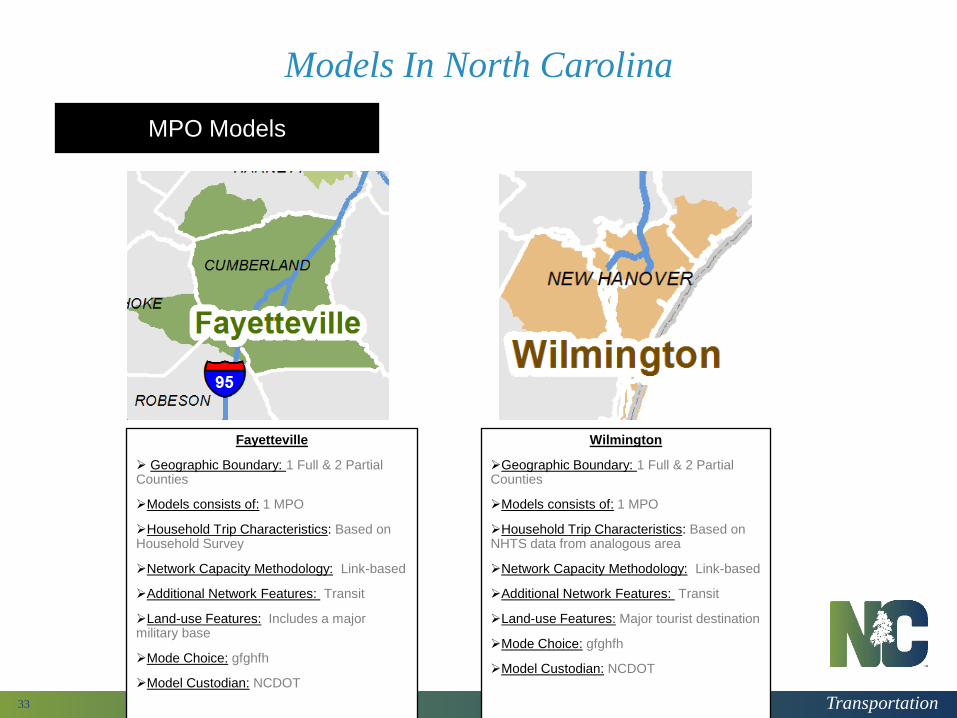
MPO Models
Fayetteville
Geographic Boundary: 1 Full & 2 Partial Counties
Models consists of: 1 MPO
Household Trip Characteristics: Based on Household Survey
Network Capacity Methodology: Link-based
Additional Network Features: Transit
Land-use Features: Includes a major military base
Mode Choice: gfghfh
Model Custodian: NCDOT
Wilmington
Geographic Boundary: 1 Full & 2 Partial Counties
Models consists of: 1 MPO
Household Trip Characteristics: Based on NHTS data from analogous area
Network Capacity Methodology: Link-based
Additional Network Features: Transit
Land-use Features: Major tourist destination
Mode Choice: gfghfh
Model Custodian: NCDOT

Transportation
Models In North Carolina
34
MPO Models
Greater Hickory
Geographic Boundary: 4 Full Counties
Models consists of: 1 MPO
Household Trip Characteristics: Based on Household Survey
Network Capacity Methodology: Link-based
Additional Network Features: Transit
Land-use Features: Major tourist destination
Mode Choice: gfghfh
Model Custodian: NCDOT
French Broad River
Geographic Boundary: 1 Full & 4 partial Counties
Models consists of: 1 MPO
Household Trip Characteristics: Based on Household Survey
Network Capacity Methodology: Link-based
Additional Network Features: Transit & Recreational Vehicles
Land-use Features: Major tourist destination
Mode Choice: gfghfh
Model Custodian: NCDOT

Transportation
Models In North Carolina
Goldsboro Greenville Rocky Mount Jacksonville New Bern
• Based on North Carolina Small Area Model (NCSAM) Platform • No Transit Component • Combined Survey database • Generally meant for smaller non-MPO urban areas
35
Other MPO Models
Small Area models

Transportation
Future Model Enhancements
Tour based models: Better representation of travel patterns Freight component: Improved model of flow of goods Transferability: Don’t have to reinvent the wheel. What can be used in one place can
have applications in other places? Are there unique and different land-uses? Military bases? Tourist destinations? New Data Sources: Cell Phones, GPS, Blue-tooth?
36

Transportation
Model Outputs
Typical Model Outputs:
Volume
Congested Speeds
Volume to Capacity ratio
Vehicle Miles Travelled
Vehicle Hours Travelled
Level of Service
Origin-Destination Data
Transit ridership
The outputs are numbers that describe the usage and level of
congestion on the transportation system
37
Transportation
Traffic Forecasting
Planners use these numbers to assess the system needs…. build a case for potential solutions….create a narrative…improve the transportation system.
Forecasting is one of the tools that provides this.
38

Transportation
Current Practices
39

Transportation
Current Practices: Applications and Pitfalls
40
TDMs can be used to help inform: •Policy and Network Analysis •Conformity and MOVES •CTP •LRTP/MTP •Corridor Planning •Traffic Estimates •Project Level Traffic Forecasting
Transportation
Current Practices: Policy and Network Analysis
41
Big picture questions can be answered • Specifics need additional analysis or tools Utilize network data: • VMT • VHT • Travel pattern changes • Relative travel times
Be mindful of data limitations • Use planning level data for planning level decisions • Avoid using absolute link information • Can apply traffic estimate procedures on larger areas to help
make conclusions
Transportation
Current Practices: Conformity and MOVES
42
Similar to Policy questions VMT and VHT statistics region wide should be used What not to use the model for Daily vs. Peak Period Info

Transportation
Current Practices: CTP
43
Utilizes models to help identify capacity deficiencies. Develops local goals and objectives. Identifies solutions to address capacity deficiencies Includes high level environmental avoidance Not fiscally constrained

Transportation
Current Practices: LRTP/MTP
44
Tests various development strategies Further refines local goals beyond CTP Identifies project list based on funding constraints Lawsuit outcomes drive integration of planning and NEPA NEPA practicitioners are having to revisit more planning decisions
Transportation
Current Practices: Traffic Estimates
45
Use to screen alternatives and verify purpose and need Use to save time over a full forecast Not sufficient for design • Lacks design data • Lacks intersection turning movements • Less precise than a forecast Can be useful for atypical situations • Multiple period analysis • Toll/express lane testing
Transportation
Current Practices: Project Level Traffic Forecasts
46
Multiple uses: • Screen alternatives • Inform operational analysis • Document purpose and need • Air and noise modeling
Highly precise Can be overkill • Other products can inform decisions
Need for a forecast should include a risk assessment

Transportation
Current Practices: Corridor Planning
47
TDM and Micro-sim Coordination Our TDMs are not highly responsive to minor land use and network changes •Similar network produce similar results •Similar SE data produce similar results •This is consistent with driver behvior

Transportation
Summary/Conclusion
48