NCAT Report 17-07 PAVEMENT ME DESIGN – A SUMMARY OF …
98
NCAT Report 17-07 PAVEMENT ME DESIGN – A SUMMARY OF LOCAL CALIBRATION EFFORTS FOR FLEXIBLE PAVEMENTS By Dr. Mary M. Robbins Dr. Carolina Rodezno Dr. Nam Tran, P.E., LEED GA Dr. David H. Timm, P.E. August 2017
Transcript of NCAT Report 17-07 PAVEMENT ME DESIGN – A SUMMARY OF …
NCATReport17-07
PAVEMENTMEDESIGN–ASUMMARYOFLOCAL
CALIBRATIONEFFORTSFORFLEXIBLEPAVEMENTS
ByDr.MaryM.RobbinsDr.CarolinaRodezno
Dr.NamTran,P.E.,LEEDGADr.DavidH.Timm,P.E.
August2017

PAVEMENTMEDESIGN–ASUMMARYOFLOCALCALIBRATIONEFFORTSFORFLEXIBLEPAVEMENTS
Dr.MaryM.Robbins*ResearchEngineer
OhioResearchInstituteforTransportationandtheEnvironment(*WorkcompletedwhileatNationalCenterforAsphaltTechnology)
Dr.CarolinaRodezno
AssistantResearchProfessorNationalCenterforAsphaltTechnology
Dr.NamTran,P.E.
AssociateResearchProfessorNationalCenterforAsphaltTechnology
Dr.DavidH.Timm,P.E.
BrasfieldandGorrieProfessorofCivilEngineeringPrincipalInvestigator
SponsoredbyNationalAsphaltPavementAssociationStateAsphaltPavementAssociations
August2017

iii
ACKNOWLEDGEMENTSThe authorswish to thank theNational Asphalt PavementAssociation and the StateAsphaltPavementAssociationsforsponsoringthisresearchaspartoftheOptimizingFlexiblePavementDesign and Material Selection research project and for providing technical review of thisdocument.
DISCLAIMERThecontentsof this reportreflect theviewsof theauthorswhoareresponsible for the factsandaccuracyofthedatapresentedherein.Thecontentsdonotnecessarilyreflecttheofficialviews or policies of the sponsoring agencies, the National Center for Asphalt Technology orAuburn University. This report does not constitute a standard, specification, or regulation.Commentscontained inthispaperrelatedtospecifictestingequipmentandmaterialsshouldnotbeconsideredanendorsementofanycommercialproductorservice;nosuchendorsementisintendedorimplied.

iv
TABLEOFCONTENTS1 Introduction...........................................................................................................................142 LocalVerification,Calibration,andValidation.......................................................................153 SummaryofMethodologiesFollowedforLocalCalibration..................................................203.1 MethodologyusedinEffortsforArizona(10).................................................................223.2 MethodologyusedinEffortsforColorado(11)...............................................................233.3 MethodologyusedinEffortsforIowa.............................................................................233.4 MethodologyusedinEffortsforMissouri(14)................................................................243.5 MethodologyusedinEffortsforNortheasternStates(15).............................................253.6 MethodologyusedinEffortsforNorthCarolina.............................................................253.7 MethodologyusedinEffortsforOhio(18)......................................................................263.8 MethodologyusedinEffortsforOregon(19).................................................................263.9 MethodologyusedinEffortsforTennessee(20)............................................................263.10 MethodologyusedinEffortsforUtah(21,22)................................................................273.11 MethodologyusedinEffortsforWashington(23)..........................................................273.12 MethodologyusedinEffortsforWisconsin....................................................................28
4 ResultsofVerification,Calibration,andValidationEfforts....................................................284.1 SummaryofVerificationandCalibrationResults............................................................284.2 FatigueCracking..............................................................................................................29
4.2.1 FatigueCracking–VerificationResults....................................................................294.2.2 FatigueCracking–CalibrationResults.....................................................................30
4.3 Rutting.............................................................................................................................334.3.1 Rutting–VerificationResults...................................................................................334.3.2 Rutting–CalibrationResults....................................................................................38
4.4 TransverseCracking.........................................................................................................424.4.1 TransverseCracking–VerificationResults...............................................................424.4.2 TransverseCracking–CalibrationResults................................................................43
4.5 IRI.....................................................................................................................................454.5.1 IRI–VerificationResults...........................................................................................454.5.2 IRI–CalibrationResults............................................................................................46
4.6 LongitudinalCracking......................................................................................................484.6.1 LongitudinalCracking–VerificationResults............................................................484.6.2 LongitudinalCracking–CalibrationResults.............................................................48
5 SummaryAndConclusions.....................................................................................................496 Recommendations.................................................................................................................57References....................................................................................................................................59AppendixAPerformanceModelsforFlexiblePavementDesign.................................................61A.1 Introduction....................................................................................................................61A.2 RutDepthforAsphaltandUnboundLayers...................................................................61A.3 Transverse(Thermal)Cracking.......................................................................................62A.4 Alligator(Bottom-UpFatigue)Cracking.........................................................................64A.5 Longitudinal(Top-Down)Cracking.................................................................................66A.6 InternationalRoughnessIndex(IRI)...............................................................................66
AppendixBSummaryofCalibrationMethodologies...................................................................68

v
B.1 MethodologyusedinEffortsforArizona(10).................................................................68B.2 MethodologyusedinEffortsforColorado(11)..............................................................68B.3 MethodologyusedinEffortsforIowa.............................................................................69B.4 MethodologyusedinEffortsforMissouri(14)...............................................................71B.5 MethodologyusedinEffortsforNortheasternStates(15).............................................72B.6 MethodologyusedinEffortsforNorthCarolina.............................................................73B.7 MethodologyusedinEffortsforOhio(18).....................................................................74B.8 MethodologyusedinEffortsforOregon(19).................................................................76B.9 MethodologyusedinEffortsforTennessee(20)............................................................77B.10 MethodologyusedinEffortsforUtah(21,22)...............................................................78B.11 MethodologyusedinEffortsforWashington(23)..........................................................79B.12 MethodologyusedinEffortsforWisconsin(24).............................................................79
AppendixCSummaryofVerificationandCalibrationResults......................................................80C.1 FatigueCracking(Alligator/Bottom-up)..........................................................................80
C.1.1 Arizona(10)..............................................................................................................80C.1.2 Colorado(11)............................................................................................................80C.1.3 Iowa(13)..................................................................................................................80C.1.4 Missouri(14)............................................................................................................80C.1.5 NortheasternStates(15)..........................................................................................81C.1.6 NorthCarolina..........................................................................................................81C.1.7 Ohio(18)...................................................................................................................82C.1.8 Oregon(19)..............................................................................................................82C.1.9 Utah(21)..................................................................................................................82C.1.10 Washington(23).......................................................................................................83C.1.11 Wisconsin.................................................................................................................83
C.2 Rutting.............................................................................................................................83C.2.1 Arizona(10)..............................................................................................................83C.2.2 Colorado(11)............................................................................................................84C.2.3 Iowa(13)..................................................................................................................84C.2.4 Missouri(14)............................................................................................................85C.2.5 NortheasternStates(15)..........................................................................................85C.2.6 NorthCarolina..........................................................................................................86C.2.7 Ohio(18)...................................................................................................................87C.2.8 Oregon(19)..............................................................................................................88C.2.9 Tennessee(20).........................................................................................................88C.2.10 Utah(21)..................................................................................................................89C.2.11 Washington(23).......................................................................................................89C.2.12 Wisconsin.................................................................................................................90
C.3 Thermal(Transverse)Cracking........................................................................................90C.3.1 Arizona(10)..............................................................................................................90C.3.2 Colorado(11)............................................................................................................90C.3.3 Iowa(13)...................................................................................................................91C.3.4 Missouri(14,27).......................................................................................................91C.3.5 NortheasternStates(15)..........................................................................................92

vi
C.3.6 Ohio(18)...................................................................................................................92C.3.7 Oregon(19)..............................................................................................................92C.3.8 Utah(21)...................................................................................................................93C.3.9 Washington(23).......................................................................................................93C.3.10 Wisconsin.................................................................................................................93
C.4 IRI.....................................................................................................................................93C.4.1 Arizona(10)..............................................................................................................93C.4.2 Colorado(11)............................................................................................................94C.4.3 Iowa(13)...................................................................................................................94C.4.4 Missouri(14).............................................................................................................95C.4.5 NortheasternStates(15)..........................................................................................95C.4.6 Ohio(18)...................................................................................................................95C.4.7 Tennessee(20).........................................................................................................96C.4.8 Utah(21)...................................................................................................................96C.4.9 Washington(23).......................................................................................................97C.4.10 Wisconsin.................................................................................................................97
C.5 Top-Down(Longitudinal)Cracking..................................................................................97C.5.1 Iowa(13)..................................................................................................................97C.5.2 NortheasternStates(15)..........................................................................................97C.5.3 Oregon(19)..............................................................................................................98C.5.4 Washington(23).......................................................................................................98

vii
LISTOFFIGURESFigure1BasicStepsofPavementMEDesign...............................................................................16Figure2ImprovementofBiasandPrecisionthroughLocalCalibration......................................17Figure3LocalCalibrationofPavementMEDesign......................................................................19LISTOFTABLESTable1CoefficientstobeAdjustedforEliminatingBiasandReducingStandardError(3,5).....20Table2StandardErroroftheEstimate(3,5)...............................................................................20Table3SummaryofVerification/CalibrationEffortsbyState(10-25,27)...................................21Table4CriteriaforDeterminingModelsAdequacyforColoradoConditions(11)......................23Table5SummaryofVerificationEffortsforFatigue(Alligator)CrackingModel(4,10,11,13,15,17,19,23,24)...............................................................................................................................30Table6SummaryofCalibrationEffortsforFatigue(Alligator)CrackingModel(4,10,11,13,15,17,19,23).....................................................................................................................................32Table7SummaryofVerificationEffortsforTotalRuttingPredictions(10,11,13,14,17-24,27)......................................................................................................................................................36Table8SummaryofCalibrationEffortsforTotalRuttingPredictions(10,11,13,14,17-24,27)40Table9SummaryofVerificationandCalibrationResultsfortheTransverse(Thermal)CrackingModel(4,11,13,14,19,24,25,27).............................................................................................44Table10SummaryofVerificationandCalibrationResultsfortheIRIModel(4,10,11,13,14,15,18,21,24,25,27).........................................................................................................................47Table 11 Summary of Verification and Calibration Results for the Longitudinal (Top-down)CrackingModel(4,13,15,19,23)................................................................................................49Table12NumberofVerification/CalibrationStudiesandSummaryofCalibrationResults........54
viii
EXECUTIVESUMMARY
Many state highway agencies have considered adopting theMechanistic-Empirical PavementDesignGuide(MEPDG)andtheaccompanyingAASHTOWarePavementMEDesignsoftwaretosupplementorreplacetheempiricalAmericanAssociationofStateHighwayandTransportationOfficials (AASHTO) Pavement Design Guides and the widely used DARWin pavement designsoftware. In flexible pavement design, the software “mechanistically” calculates pavementresponses(stressesandstrains)basedontheinputsandtrialdesigninformationandusesthoseresponsestocomputeincrementaldamageovertime.Itthenutilizesthecumulativedamageintransfer functions to “empirically” predict pavement distresses for each trial pavementstructure.The MEPDG was nationally calibrated using Long-term Pavement Program (LTPP) pavementsectionsasarepresentativedatabaseofpavementtestsitesacrossNorthAmerica.Whiletheresulting performance models are representative of national-level conditions, they do notnecessarily represent construction and material specifications, pavement preservation andmaintenancepractices,andmaterialsspecifictoeachstate.Itisexpectedthatsuchparameterswould affect field performance. Therefore, local calibration studies should be conducted toaddress these differences and to adjust, if necessary, local calibration coefficients of thetransferfunctionsusedtopredictpavementperformanceinthePavementMEDesignsoftwaretobetterreflectactualperformance.Withoutproperlyconductedlocalcalibrationefforts,theimplementationofMEPDGwillnotimprovethepavementdesignprocessandmayyielderrorsinpredictedthicknessofasphaltpavements.Recognizingtheimportanceoflocalcalibrationofflexiblepavementperformancemodels,thisstudywasconductedto reviewthegeneralapproachundertaken forstatehighwayagencies,the results of those efforts, and recommendations for implementing thenationally or locallycalibratedmodels.While it is often referred to as “local calibration,” theprocessmay include local verification,calibration, and validation of the MEPDG. As a minimum, the local verification process isneeded to determine if state practices, policies, and conditions significantly affect designresults.Inthisprocess,thedistressespredictedbythePavementMEDesignsoftwareusingthenationally calibrated coefficients are compared with measured distresses for selectedpavement sections. If the difference between the predicted and measured distresses isacceptabletotheagency, thePavementMEDesigncanbeadoptedusingthedefaultmodelsandcoefficients;otherwise,itshouldbecalibratedtolocalmaterialsandconditions.If local calibration iswarranted, it is important that it addresses both the potential bias andprecision of each transfer function in the PavementMEDesign software. FigureA illustrateshow the bias and precision terms can be improved during the local calibration process. Inpracticalterms,biasisthedifferencebetweenthepredicteddistressatthe50%reliabilitylevelandthemeanmeasureddistress.Precisiondictateshowfarthepredictedvaluesataspecifieddesignreliabilitylevelwouldbefromthecorrespondingpredictedvaluesatthe50%reliability

ix
prediction.Thelocallycalibratedmodelsarethenvalidatedusinganindependentsetofdata.Themodelsare considered successfully validated to local conditions if thebiasandprecisionstatisticsofthemodelsaresimilartothoseobtainedfrommodelcalibrationwhenappliedtoanewdataset.
FigureA:ImprovementofBiasandPrecisionthroughLocalCalibration
While the AASHTO calibration guide details a step-by-step procedure for conducting localcalibration,itwasfoundthattheactualproceduresutilizedvaryfromagencytoagency,andinsomewaysdeviatedfromtherecommendedprocedures.This ispartiallyduetothetimingofthepublicationrelativetotheinitiationofsucheffortsandthereleaseofnewversionsofthesoftware.Thispresentschallengesforstateagencies,aslocalcalibrationisacumbersomeandintensive process and the software and embedded distress models are evolving faster thanlocal calibration can be completed. Therefore, it is recommended that ongoing and futurecalibrationeffortsarecompletedinaccordancewiththeAASHTOcalibrationguideandcurrentperformancemodelsandtheircoefficientsareverified.In reviewing calibration efforts for asphalt concrete (AC) pavements conducted across thecountry,itwasfoundthatcalibrationwastypicallyattemptedbylookingatthepredictedandmeasureddistress for a setof roadway segments and reducing theerrorbetweenmeasuredand predicted values by optimizing the local calibration coefficients. However, otherapproaches were taken. Although a minimum number of roadway segments necessary toconduct the local calibration for each distress model is provided in the AASHTO calibrationguide, the step for estimating sample size for assessing the distressmodels was not alwaysreported.Forthoseeffortsthatdidreportasamplesize,someweresmallerthantheminimumamountrecommended.The AASHTO calibration guide recommends conducting statistical analyses to determinegoodnessof fit, spreadof thedata,aswell as thepresenceofbias in themodelpredictions.Threehypothesistestsarerecommended:1)toassesstheslope,2)toassesstheinterceptofthemeasuredversuspredictedplot,and3)apaired t-test todetermine if themeasuredandpredictions populations are statistically different. In a few cases local calibration efforts
Higherbias
Lowerprecision
Lowerbias
Higherprecision
Pred
icted
Pred
icted
Measured Measured
Local
Calibration
x
included all three hypothesis tests for each performance model. However, some studiesevaluated only one or two of the statistical tests and others relied only on qualitativecomparisons of measured versus predicted distresses. When qualitative analyses wereconducted, it was due to inadequate data. It is recommended that the calibration guide befollowedtoestablishadatasetwithadequatedatanecessarytoconductquantitativestatisticalanalysis. Statistical parameters help to determine if local calibration has reduced bias andimproved precision and if implementation iswarranted. Thiswill also help in identifying anyweaknessesthatmayexistinthemodelthatmustbeconsideredduringthedesignprocess.The table below denotes the number of verification, calibration, and validation effortsconductedforeachperformancemodel.Inevaluatingthenationallycalibratedmodels,notallof the studies evaluated the presence of bias; however, for those that did, results varied bymodel and by study. Bias was most frequently reported for the nationally calibrated totalruttingmodel.Althoughunder-predictionwasreportedforsomestates,themajorityreportedthatthedefaultMEPDGmodelover-predictedtotalrutting.Consequently,thismodelwasalsothemostcalibrated,withall twelveverificationefforts resulting in local calibrationattempts.Thelongitudinalcrackingmodelwasfoundtohavethepoorestprecision.Giventhesignificantspreadreportedforthecurrentdefault longitudinalcrackingmodel,thismodelshouldnotbeusedfordesign.ItisanticipatedthatanewmodelwillbedevelopedundertheongoingNCHRP1-52project.The results of the local calibration efforts are also summarized in the table. For asphaltpavements, the ruttingmodelwas themost commonlycalibratedmodel.The transverseandlongitudinal crackingmodelswere calibrated the least. General improvements in predictionswererealizedwith localcalibration,however, thedegreetowhichthose improvementsweremadevariedbystate.The intentofMEPDGandtheAASHTOWare®PavementMEsoftware isto improvepavementdesign. Local calibration and validation of the performance models are essential to theimplementation of this design framework. However, the software continues to evolve withfuture refinements of transfer models, such as the longitudinal cracking model, expected.Calibration efforts will also need to be completed as the use of unconventional materialsbecomesmorecommonplace.Therefore,itisexpectedthatcalibrationeffortswillbe,inmanyways, ongoing. Local calibration can be a time consuming and labor-intensive process;therefore, an agency may need to consider the implications of conducting local calibrationeffortswhiletheembeddedmodelsandsoftwarecontinuetoberefined.

xi
TableANumberofVerification/CalibrationStudiesandSummaryofCalibrationResultsModel Verification Calibration Validation ResultsofCalibrationFatigueCracking
[10]AZ,CO,IA,MO,NE
states,NC,OR,UT,WA,
WI
[6]AZ,CO,NEstates,NC,OR,WA
[1]NC
• Allseveneffortsresultedinimprovementsinpredictions.
• Twostudies(AZ,CO)resultedinsizeableincreasesinR2comparedtoR2inverificationeffort.BothstudieshadR2
valuesmuchgreaterthanthedevelopmentoftheglobalmodel(R2=27.5%)butwereonlymoderatelyhigh(50%and62.7%).
• Reductionoreliminationofbiaswasreportedinfour(AZ,CO,NC,OR)ofthesevenstudies.
• Onestudy(NEstates)reportedonlytheSumoftheSquaredError(SSE),whichwasreducedwithcalibration.
• Twoefforts(WA,WI)werequalitativeanalyses.Bothresultedinpredictionscloselymatchingmeasureddata.
TotalRutting
[12]AZ,CO,IA,MO,NE
states,NC,OH,OR,TN,UT,WA,WI
[12]AZ,CO,IA,MO,NE
states,NC,OH,OR,TN,UT,WA,WI
[2]IA,NC
• Generally,improvementsinpredictionswerereportedwithcalibratedmodels.
• Fourefforts(AZ,MO,NC,UT)resultedinanincreaseinR2.Twoefforts(CO,OH)sawdecreasesinR2.
• Overall,R2remainedlowfortheeffortsthatreportedit,rangingfrom14.4%to63%,withonlyonegreaterthantheR2(57.7%)reportedinthedevelopmentofthedefaultmodel.
• Eightstudies(AZ,IA,MO,NC,OH,OR,TN,UT)resultedinimprovementsinstandarderroroftheestimate,Se,while

xii
onestudy(CO)resultedinanincreaseinSe.
• Eventhoughmostsawimprovementsinstandarderror,Seremainedgreaterthan0.107,theSeforthedevelopmentofthedefaultmodel,infourstudies(AZ,CO,NC,OR).
• Biaswaseliminatedorreducedinatleasteightstudies(AZ,CO,IA,MO,NC,OR,UT,WI).Oneeffort(OH)showedbiasremaineddespitecalibration.
• Threeefforts(NEstates,TN,WA)didnotreportonbias,butallfourresultedinimprovementsinpredictions.
TransverseCracking
[10]AZ,CO,IA,MO,NE
states,OH,OR,UT,WA,
WI
[5]AZ,CO,MO,OR,
WI
[0] • Twostudies(CO,MO)resultedinimprovementsinR2withbothvalues(43.1%and91%)greaterthantheR2reportedinthedevelopmentofthedefaultmodelataLevel1analysis(34.4%).
• Twocalibrationattempts(AZ,OR)wereunsuccessfulinimprovingtransversecrackingpredictions,andtherefore,werenotrecommendedforuse.
• Predictionswerereasonableforonestudy(CO)withtheeliminationofbias.Twostudies(MO,WI)resultedingoodpredictionswithslightbias.
IRI [10]AZ,CO,IA,MO,NE
states,OH,TN,UT,WA,
WI
[6]AZ,CO,MO,NE
states,OH,WI
[1]IA
• Generally,improvementsinIRIpredictionswererealizedwithlocallycalibratedmodels,especiallyforWI.
• Threeefforts(AZ,CO,OH)resultedinanimprovementinR2,rangingfrom64.4%to
xiii
82.2%,allofwhichweregreaterthantheR2forthedevelopmentofthedefaultmodel(56%).
• OnlySSEwasreportedforonestudy(NEstates),whichindicatedanimprovementinpredictionswiththecalibratedmodel
• Biaswasremovedthroughthreeefforts(AZ,CO,WI),whilethebiasthatremainedintwoefforts(MO,OH)wasconsideredreasonable.
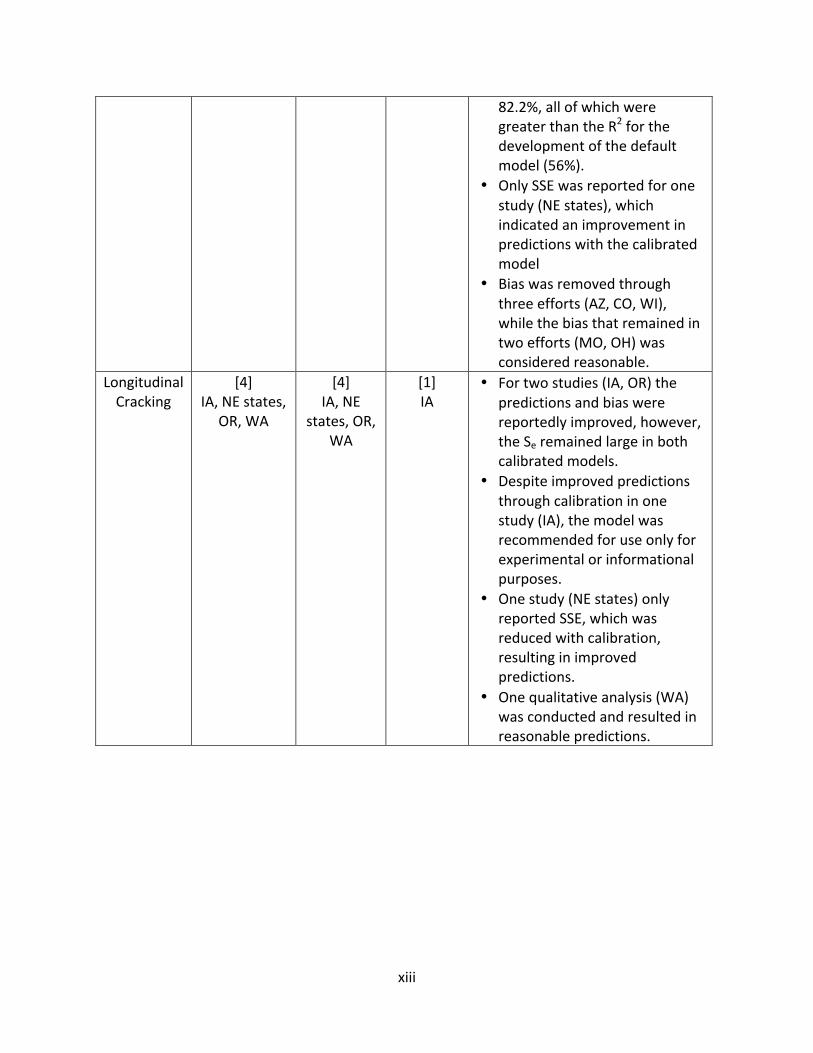
LongitudinalCracking
[4]IA,NEstates,
OR,WA
[4]IA,NE
states,OR,WA
[1]IA
• Fortwostudies(IA,OR)thepredictionsandbiaswerereportedlyimproved,however,theSeremainedlargeinbothcalibratedmodels.
• Despiteimprovedpredictionsthroughcalibrationinonestudy(IA),themodelwasrecommendedforuseonlyforexperimentalorinformationalpurposes.
• Onestudy(NEstates)onlyreportedSSE,whichwasreducedwithcalibration,resultinginimprovedpredictions.
• Onequalitativeanalysis(WA)wasconductedandresultedinreasonablepredictions.

14
1 INTRODUCTION
Many state highway agencies have considered adopting theMechanistic-Empirical PavementDesignGuide(MEPDG)andtheaccompanyingAASHTOWarePavementMEDesignsoftwaretosupplementorreplacetheempiricalAmericanAssociationofStateHighwayandTransportationOfficials (AASHTO) Pavement Design Guides and the widely used DARWin pavement designsoftware(1,2).AsurveyofstateagenciesconductedbyPierceandMcGovernin2013indicatedthat43agencieswereevaluatingtheMEPDGand15agenciesplannedtoimplementthenewdesignprocedure inthenexttwoyears(3).The implementationplansoftheseagencieshavethefollowingelements(3,4):
• Scopeofimplementation.Thescopeidentifiesthetypesofpavementdesigns(e.g.,newconstruction or rehabilitation for asphalt and concrete pavements) that will beconductedusingthePavementMEDesignsoftwareonceimplemented.
• Designinputs.ThiselementdescribestheinputsrequiredforthePavementMEDesignsoftwareandidentifiesthesourceofavailableinformation.Thiselementalsoincludesaplanforadditionaltestingoranalysisneededtoprovidecriticalinputsthatarecurrentlynotavailable.
• Localverification,calibration,andvalidation.Thiselementincludesaplanforverifyingthe distresses predicted by the Pavement ME Design software with the distressesmeasured in the field for a number of representative pavement sections. If thepredicted and measured distresses are reasonably comparable, the new designprocedure can be adopted; otherwise, local calibration and validation are needed asrecommendedintheAASHTOGuidefortheLocalCalibrationoftheMEPDG(5).
• Design thresholds and reliability levels. This element provides proposed levels ofdistress, International Roughness Index (IRI), and reliability for acceptable pavementdesigns.
• Softwareanddesignmanuals. Thesedocumentsareprepared tomeet theneedsanddesignpoliciesoftheindividualstateagencies.
• Training. A training program may be developed in-house or through universities,consultants,ornationalprogramstotrainthestaffinpavementdesign.
• Concurrentdesigns.Beforefullimplementation,concurrentdesignsareoftenconductedto compare the results of the Pavement ME Design with those of previous designprocedures. This effort helps the staff become more familiar with the software andimprovetheirconfidenceinthePavementMEDesignresults.
Toprepareforimplementation,stateagencieshaveconductedstudiesfocusingon(1)buildinglibraries for important input parameters; (2) conducting local verification, calibration,validation, and selecting design thresholds and reliability levels; and (3) preparing designmanualsandmaterialsfortrainingstaff.Resources are available to help state highway agencies train staff and establish plans forbuildingmaterials libraries.Throughpooled fundstudiesandnational implementationeffortsledbytheFederalHighwayAdministration(FHWA),statehighwayagenciescanacquiretestingequipment and set up an experimental plan to develop important material libraries by
15
themselvesor througha researchorganization(s) in their statesandaccess trainingmaterialsonline(6,7).The remaining implementation activities—conducting local verification, calibration, andvalidationandselectingdesign thresholdsand reliability levels—often requiremore timeandfinancial resources. While the AASHTO MEPDG calibration guide is available to help stateagenciesplan and conduct local calibration, it requires competent statistical andengineeringknowledgetounderstandtheconceptsandtoproperlyconductlocalcalibration.Stateagenciesarealsorequiredtocollectmaterialsandpavementperformancedataforthelocalcalibration.Thus, even though the local calibration process is needed for implementation, highwayagencies are still reluctant to invest in this activity (3). Without properly conducting localcalibration,theimplementationofMEPDGwillnotimprovethepavementdesignprocess.Ithasbeen reported that use of the globally calibrated Pavement ME Design software may yieldthicker,overdesignedasphaltpavements(8,9).Recognizingthe importanceof localcalibration, this reportdiscussesthegeneralapproachtolocalcalibrationundertakenforstateagencies forasphaltconcrete (AC)pavements, followedby results of the local calibration efforts and where possible, the recommendations forimplementingthegloballyorlocallycalibratedmodels.2 LOCALVERIFICATION,CALIBRATION,ANDVALIDATION
TheMEPDG was developed to design new and rehabilitated pavement structures based onmechanistic-empirical principles. Basic steps of the Pavement ME Design are illustrated inFigure1.Basedonthe inputsandtrialdesign information,thePavementMEDesignsoftware“mechanistically” calculates pavement responses (stresses and strains) and uses thoseresponses to compute incremental damage over time. The program then utilizes thecumulative damage to “empirically” predict pavement distresses for each trial pavementstructure. The mechanistic analysis utilizes the Enhanced Integrated Climatic Model (EICM),structural response models, and time-dependent material property models. The empiricalanalysis uses the transfer (regression)models to relate the cumulative damage to observedpavement distresses. While the mechanistic models are assumed to be accurate and tocorrectly simulate field conditions, inaccuracies still exist and affect transfer functioncomputationsandfinaldistresspredictions(5).Thelocalverification,calibration,andvalidationprocessisoftenrelatedtothetransferfunctions,butitessentiallyaddressestheerrorsofboththemechanisticandempiricalmodels.

16
Figure1BasicStepsofPavementMEDesign
Under the NCHRP 1-37A and 1-40 projects, the MEPDG was “globally” calibrated using arepresentativedatabaseofpavementtestsitesacrossNorthAmerica.Mostofthesetestsiteshave beenmonitored through the Long Term Pavement Performance (LTPP) program. TheywereusedbecauseoftheconsistencyinthemonitoreddataovertimeandthediversityoftestsectionsspreadthroughoutNorthAmerica.However,constructionandmaterialspecifications,pavementpreservationandmaintenancepractices,andmaterialsandclimaticconditionsvarywidely across North America. These differences can significantly affect distress andperformance.However,theyarenotcurrentlyconsidereddirectlyinthePavementMEDesignsoftwarebutindirectlyconsideredthroughlocalcalibrationinwhichthecalibrationcoefficientsoftransferfunctionsintheMEDesignsoftwarecanbeadjusted(5).While it is often referred to as “local calibration”, theprocessmay include local verification,calibration, and validation of the MEPDG. As a minimum, the local verification process isneeded to determine if state practices, policies, and conditions significantly affect designresults. Inthis localverificationprocess, thedistressespredictedbythePavementMEDesignsoftwareusingthegloballycalibratedcoefficientsarecomparedwiththedistressesmeasuredin the field for selected pavement sections. If the difference between the predicted andmeasureddistressesisnotsignificant,thePavementMEDesigncanbeadopted;otherwise,itshould thenbe calibrated to local conditions since these conditions were not considered inthe global calibration process. If local calibration is warranted, it is important that it addressesboththepotentialbiasandprecision of each transfer function in the PavementMEDesign software. Figure 2 illustrateshow the bias and precision terms can be improved during the local calibration process. Inpracticalterms,biasisthedifferencebetweenthe50%reliabilitypredictionandthemeasured
Traffic
Foundation
Climate
Materials
TrialDesignStructuralResponse
Models
DistressPredictionModels
MeetDesignCriteria?
FinalDesign
No
No
YesInputs
Analysis
Results

17
mean. Precision dictates how far the predicted values at a specified design reliability levelwouldbefromthecorrespondingpredictedvaluesatthe50%reliabilityprediction.Thelocallycalibrated models are then validated using an independent set of data. The models areconsidered successfully validated to local conditions if thebias andprecision statisticsof themodels are similar to those obtained frommodel calibrationwhen applied to the validationdataset.
Figure2ImprovementofBiasandPrecisionthroughLocalCalibration
Adetailedstep-by-stepprocedureforlocalcalibrationisdescribedintheAASHTOGuidefortheLocalCalibrationoftheMEPDG(5).Thekeystepsofthisprocedureareasfollows:
1. Select hierarchical input level for each input parameter. This is likely a policy-baseddecision that can be influenced by several factors, including the agency’s field andlaboratory testing capabilities, material and construction specifications, and trafficcollection procedures and equipment. Agencies can refer to the MEPDG Manual ofPractice(4)forrecommendationsonselectingthehierarchicalinputlevelforeachinputparameter.
2. Develop experimental design. An experimental plan ormatrix is set up in this step tohelpselectpavementsegmentsthatrepresentthepavementdistressesobservedinthestate and local factors thatmay affect the observed distresses, such as the agency’sdesign and construction practices and materials, as well as traffic and climaticconditions.
3. Estimatesamplesizeforassessingdistressmodels.Thisstepistoestimatethenumberof pavement segments, including replicates, which should be included in the localcalibrationprocesstoprovidestatisticallymeaningfulresults.Theminimumnumberofpavementsegmentsrecommendedforeachdistressmodelisasfollows:
• Totalrutting:20roadwaysegments• Load-relatedcracking:30segments• Non-loadrelatedcracking:26segments• Reflectioncracking(asphaltsurfaceonly):26segments
Higherbias
Lowerprecision
Lowerbias
Higherprecision
Pred
icted
Pred
icted
Measured Measured
Local
Calibration

18
4. Selectroadwaysegments.Appropriateroadwaysegmentsandreplicatesare identifiedin this step to satisfy the experimental plan developed in Step 2. The pavementsegments selected are recommended to have at least three condition surveysconductedinthepast10years.
5. Extractandevaluatedata.Theinputsavailableforeachroadwaysegmentarecompiledandverifiedinthisstep.DatanotcompatiblewiththeformatrequiredforthePavementMEDesign softwarewill be converted accordingly.Missing datawill be identified forfurthertestingtobeconductedinStep6.
6. Conduct field and forensic investigations of test sections. This step encompasses fieldsampling and testing of the selected pavement segments to obtain missing data asidentified in Step 5. The level of testing should be selected appropriately so that thedata generated are compatible with the hierarchical input level selected in Step 1.Forensic investigations are necessary to confirm assumptions in the MEDPG, at thediscretionof theagency. Investigations suggested include test cores,and trenching toidentifylocation,initiation,andpropagationofdistressesinthepavementstructure.
7. Assess local bias. The PavementMEDesign softwarewith global calibration factors isconductedtodesignpavementsusingtheinputsavailablefromtheselectedpavementsegmentsat50%reliability.Foreachdistressmodel,thepredicteddistressesareplottedandcomparedwith themeasureddistresses forwhich linear regression isperformed.Diagnosticstatistics,bias,andthestandarderroroftheestimate(Se),aredetermined.Bias is determined by performing linear regression using the measured and MEPDGpredicted distress and comparing it to the line of equality. Three hypotheses, listedbelow, are tested to determine if bias is present. If bias exists the predictionmodelshouldberecalibrated(seeStep8).Ifthedifferenceisnotsignificant,thestandarderroroftheestimateisassessed(seeStep9).
• Assess if the measured and predicted distress/IRI represents the samepopulationofdistress/IRIusingapairedt-test.
• Assessifthelinearregressionmodeldevelopedhasaninterceptofzero.• Assessifthelinearregressionmodelhasaslopeofone.
8. Eliminatelocalbias.Ifsignificantbiasexists(asdeterminedinStep7),thecauseshouldbe determined. Inputs that may cause prediction bias include traffic, climate, andmaterial characteristics (3). If possible, the bias should be removed by adjusting thecalibrationcoefficientslistedinTable1.Figure3illustratesbasicstepsfordetermininglocalcalibrationcoefficients.Then,thesameanalysisconductedinStep7isperformedusingtheadjustedcalibrationfactors.
9. Assessstandarderroroftheestimate.Inthisstep,theSevaluesdeterminedinStep7or8basedonthepredictedandmeasureddistresses(localSe)arecomparedwiththeSevaluesof theglobally calibrateddistressmodelsprovided in thePavementMEDesignsoftware(globalSe).ModelswhoselocalSevaluesaregreaterthantheglobalSevaluesshouldberecalibratedinanattempttolowerthestandarderror(seeStep10).Fortheothermodels,thelocalSevaluescanbeusedforpavementdesign.TheSevaluesfoundto be reasonable based on the global calibration process are provided in Table 2 forreference.

19
10. Reducestandarderroroftheestimate.Table1liststhecalibrationcoefficientsthatcanbeadjustedtoreducethestandarderroroftheestimateforeachdistressmodel.IftheSecannotbereduced,theagencycandecidewhetheritshouldacceptthehigherlocalSeor lowerglobal Se values forpavementdesign. Thisdecision should take intoaccountthedifferenceinsamplesizeusedintheglobalandlocalcalibrationprocesses.
11. Interprettheresultsanddecideontheadequacyofcalibrationparameters.Theagencyshouldreviewtheresultsandcheckiftheexpectedpavementdesignlifeis“reasonable”fortheperformancecriteriaandreliabilitylevelsusedbytheagency.
Figure3LocalCalibrationofPavementMEDesign
LocalTraffic
Foundation
LocalClimate
LocalMaterials
M-EAnalysis
AdjustingCalibrationCoefficients
MeetAllowableTolerance?
FinalCalibrationCoefficients
No
Yes
PredictedStresses
MeasuredDistresses

20
Table1CoefficientstobeAdjustedforEliminatingBiasandReducingStandardError(3,5)
Distress EliminateBias ReduceStandardError
Totalrutdepthkr1=-3.35412βr1 =1 βs1=1
kr2=1.5606kr3=0.4791βr2 =1βr3 =1
Alligatorcracking*kf1=0.007566
C2=1
kf2=-3.9492kf3=-1.281
C1=1
Longitudinalcracking*kf1=0.007566
C2=3.5
kf2=-3.9492kf3=-1.281
C1=7
Transversecrackingβt3 =1kt3=1.5
βt3 =1kt3=1.5
IRI C4=0.015C1=40C2=0.4C3=0.008
*CoefficientsareconsistentwiththeManualofPractice;seeAppendixA.4andA.5forcoefficientslistedinthePavementMEDesignsoftware
Table2StandardErroroftheEstimate(3,5)
PerformancePredictionModel StandardError(Se)TotalRutting(in) 0.10
AlligatorCracking(%lanearea) 7LongitudinalCracking(ft/mi) 600TransverseCracking(ft/mi) 250ReflectionCracking(ft/mi) 600
IRI(in/mi) 173 SUMMARYOFMETHODOLOGIESFOLLOWEDFORLOCALCALIBRATION
TheGuidefortheLocalCalibrationoftheMEPDGprovidesdirectionontheprocedureforlocalcalibration (5). Despite this AASHTO publication,many calibration efforts did not follow thisprocedureor the terminologyused in theguide, inpartdue to the timingof thepublication(2010)relativetothetimingofcalibrationeffortsineachstateandthetimededicatedtosuchefforts. Table 3 summarizes the verification efforts and calibration attempts for each of thetwelvelocalorregionalcalibrationstudiesincludedinthisreport,aswellasthetimingofeachstudy.Somestudieswerepublishedpriortoandsomeafter2010,theyeartheGuidefortheLocalCalibrationoftheMEPDGwasreleased.However,thesestudiesoftentakeseveralyearstocomplete,beginningatleastonetotwoyearsinadvanceoftheactualdateofpublication.
21
Table3SummaryofVerification/CalibrationEffortsbyState(10-25,27)
State/RegionSponsoringAgency
YearofPublication
Verification(V)/Calibration(C)EffortsFatigueCracking Rutting
TransverseCracking IRI
LongitudinalCracking
V C V C V C V C V CAZ AZDOT*/
FHWA** 2014 ü ü ü ü ü ü ü ü
CO CODOT 2013 ü ü ü ü ü ü ü ü IA IADOT 2013 ü ü ü ü ü ü ü
MO MODOT 2009 ü ü ü ü ü ü ü Northeastern
StatesNYStateDOT 2011 ü ü ü ü ü ü ü ü ü
NC NCDOT 2011 ü ü ü ü OH OHDOT 2009 ü ü ü ü ü OR ORDOT/
FHWA 2013 ü ü ü ü ü ü ü ü
TN TNDOT 2013 ü ü ü UT UTDOT 2009/2013 ü ü ü ü ü WA WAState
DOT 2009 ü ü ü ü ü ü ü ü
WI WIDOT/FHWA
2009/2014 ü ü ü ü ü üü
*DOT:DepartmentofTransportation**FHWA:FederalHighwayAdministrationIn thissection, thedefinitionsofverification,calibration,andvalidationsused in theAASHTOcalibrationguidearefirstpresented.Next,themethodologyusedbyeachstateissummarized.TheresultsoftheeffortsbyperformancemodelarethenpresentedinSection4.Verification: “Verification of a model examines whether the operational model correctlyrepresentstheconceptualmodelthathasbeenformulated.”Itshouldalsobenotedthatfielddata are not needed in the verification process, as it is “primarily intended to confirm theinternalconsistencyorreasonablenessofthemodel.Theissueofhowwellthemodelpredictsrealityisaddressedduringcalibrationandvalidation”(5).Calibration: “A systematic process to eliminate any bias and minimize the residual errorsbetweenobservedormeasuredresultsfromtherealworld(e.g.,themeasuredmeanrutdepthinapavementsection)andpredictedresults fromthemodel (e.g.,predictedmeanrutdepthfromapermanentdeformationmodel).Thisisaccomplishedbymodifyingempiricalcalibrationparameters or transfer functions in the model to minimize the differences between thepredictedandobservedresults.Thesecalibrationparametersarenecessarytocompensateformodelsimplificationandlimitationsinsimulatingactualpavementandmaterialbehavior”(5).
22
Validation:“Asystematicprocessthatre-examinestherecalibratedmodeltodetermineifthedesired accuracy exists between the calibrated model and an independent set of observeddata.Thecalibratedmodelrequiredinputssuchasthepavementstructure,trafficloading,andenvironmentaldata.Thesimulationmodelmustpredictresults(e.g.,rutting,fatiguecracking)thatare reasonablyclose to thoseobserved in the field.Separateand independentdatasetsshould be used for calibration and validation. Assuming that the calibrated models aresuccessfullyvalidated,themodelscanthenberecalibratedusingthetwocombineddatasetswithout theneed foradditionalvalidation toprovideabetterestimateof the residualerror”(5).Theprocessofcalibrationgenerallyconsistsofthreesteps:(1)verificationorevaluationoftheexisting global model to determine howwell themodel represents actual distresses and toevaluatetheaccuracyandbias;(2)calibrationofthemodelcoefficientstoimprovethemodeland reduce bias, typically using the same dataset as used in the verification step; and (3)validation of the newly calibrated model using a separate dataset. The AASHTO calibrationguide specifically states that the verificationproceduredoesnotneed toutilize fielddata toassessifthemodelisreliableandconsistent(5).Itissuggestedthatthisshouldbeaddressedinthecalibrationandvalidationsteps;however,itbecomesratherconfusingwhenreportingtwosets of results (results for the statistical comparison with measured data for performancepredicted using the nationally calibrated model and those results for the performancepredictedbythelocallycalibratedmodel)inthecalibrationprocedure.Todistinguishbetweenthevariousresultsreportedforeachcalibrationeffort,themorecommonlyusedterminologyisutilizedinthisreportsuchthat:verificationreferstotheapplicationofthegloballycalibratedmodelfortheavailabledatausedindesignandcomparedwithactualfieldperformancedatatoassessbiasandaccuracy; results reportedunder thecalibrationsteparetheresults fromthelocal calibration of the model coefficients and compared with the field performance data;validationrefers totheapplicationof thenewlycalibratedmodel toanewdataset (andfieldperformance data), separate from the dataset used to calibrate the model. The followingsubsections summarize the methodology used in the calibration efforts documented in thisstudywithmoredetailedsummariesprovidedinAppendixB.3.1 MethodologyusedinEffortsforArizona(10)
Verificationand local calibrationeffortswerecompletedbyAppliedResearchAssociates, Inc.(ARA) ina2014studysponsoredbyArizonaDepartmentofTransportation (DOT)andFHWA.Researchers utilizedDARWinME (versionof the softwarewasnot stated) for the study. Thepavementsectionsintheirstudyincludednewpavements(ACovergranularlayer,thinACoverjointedplainconcretepavement(JPCP))andrehabilitatedpavements(ACoverACandACoverJPCP) thatcoverednorthern,central,andsouthernregionswith lowandhighelevations.Theasphalt materials used in the study included conventional and Superpave mixtures withthicknesses above and below 8 inches. Material properties were characterized at differentlevels.Forexample,HMAcreepcompliancewasatLevel1whileeffectivebindercontentwasatLevel 3. The base and subgrade materials were typically granular and coarse-grained,respectively.

23
3.2 MethodologyusedinEffortsforColorado(11)
A2013studyconductedbyARAutilizedVersion1.0oftheMEPDGtocompleteverificationandlocal calibration efforts for ColoradoDOT.A variety of newandoverlay asphaltmix sectionswereusedwithneat andmodifiedbinders.HMA layer thicknesses varied, butmost of themwerelessthan8inches.Theclimaticzonesrangefromhottoverycoollocations.The asphalt material properties were characterized at Levels 2 or 3 depending on theinformationavailable.Forexample,HMAdynamicmodulususedLevel2,butothervolumetricproperties used Level 3. MEPDG global models were calibrated using nonlinear modeloptimizationtools(SASstatisticalsoftware).ThecriteriausedfordeterminingmodeladequacyforColoradoconditionsarepresentedinTable4.Table4CriteriaforDeterminingModelsAdequacyforColoradoConditions(11)
Criterion TestStatistics R2Range/ModelSEE Rating
GoodnessofFit
R2,percent(forallmodels)
81-100 VeryGood64-81 Good49-64 Fair<49 Poor
GlobalHMAAlligatorCrackingmodelSEE
<5percent Good5-10percent Fair>10percent Poor
GlobalHMATotalRuttingmodelSEE
<0.1in Good0.1-0.2in Fair>0.2in Poor
GlobalHMAIRImodelSEE<19in/mi Good19-38in/mi Fair>38in/mi Poor
Bias
Hypothesistesting-SlopeofLinearmeasuredvs.PredictedDistress/IRImodel(β1=slope)H0:β1=0
p-value Rejectifp-valueis<0.05
Pairedt-testbetweenmeasuredandpredicteddistress/IRI p-value Rejectifp-valueis
<0.053.3 MethodologyusedinEffortsforIowa
Aninitialverificationstudywasconductedin2009forIowaDOTbyresearchersattheCenterfor Transportation Research and Education at Iowa State University. The study aimed toevaluatetheHMAperformancemodelsembeddedintheMEPDGsoftwareVersion1.0(12).Inthis study,a Level3analysiswasconducted,andpredictedperformancewascomparedwithmeasured performance data for rutting and IRI. As a result, bias was reported for bothpredictedruttingandIRI.

24
Localcalibrationwasconductedin2013inanIowaDOT-sponsoredstudybyresearchersattheInstituteforTransportationatIowaStateUniversity.Thestudyincludedaverificationefforttoevaluateandassessthebiasassociatedwithglobalperformancemodels inVersion1.1oftheMEPDGsoftware (13).Accuracyof theglobalperformancemodelswasevaluatedbyplottingthe measured performance measures against the predicted performance measures andobservingthedeviation fromthe lineofequality.Additionally, theaveragebiasandstandarderror were determined and used to evaluate the nationally calibrated and locally calibratedmodels.
Local calibrationwas attempted for alligator (fatigue) cracking, rutting, thermal (transverse),IRI,andlongitudinalcracking(13).Forthecalibrationeffort,atotalof35representativeHMAsectionswerechosen,oneofwhichwasanIowaLTPPsection.Aspartofthecalibrationeffort,asensitivityanalysiswasfirstconductedtounderstandtheeffectofeachcalibrationcoefficientonperformancepredictionsandtomoreeasily identifycoefficientsthatshouldbeoptimized.Newcalibrationcoefficientswerethendeterminedthroughlinearandnon-linearoptimization.Non-linearoptimizationwasutilized for local calibrationof the cracking and IRI performancemodels. To reduce the large number of computations associated with the trial-and-errorprocedure, linear optimizationwas chosen for fatigue, rutting, and thermal fracturemodels.Accuracyandbiasoftherecalibratedmodelswereevaluatedinthesamemanneraswasdoneinassessingtheglobalmodels.Aportionofthedatasetwasreservedforuseinvalidationoftherecalibratedmodelcoefficients(13).3.4 MethodologyusedinEffortsforMissouri(14)
Verification and local calibration efforts were completed for Missouri DOT in a 2009 studyconductedbyARA.Version1.0oftheMEPDGwasutilizedforthestudy.ThepavementsectionsusedinthestudyincludedneworreconstructedHMA,HMAoverHMA,andHMAoverPCCwithdifferentthicknesses.Materialpropertieswerecharacterizedatdifferent levelsdependingonthe information available. For example, dynamic modulus was at Level 2 and volumetricpropertieswereatLevel1.Whenpossible,astatisticalapproachwastakenforevaluatingthenationallycalibratedmodelsandforlocalcalibration.Modelpredictioncapabilitieswereevaluatedbycomparingmeasuredvalueswithvaluespredictedusingtheglobalcalibration(default)coefficients.Thecoefficientofdetermination, R2, and the standard error of the estimate, Se, were used to compare themeasured and predicted values. Using the same statistics for evaluation, R2 and Se, globalcoefficientswerecalibratedforMissourimaterialsandconditions.Biaswasevaluatedbyfirstidentifying the linear regression between measured values and distress predicted by theMEPDG.Once identified, the threehypothesis tests recommended in theManual of Practicewerecarriedoutusingalevelofsignificanceof0.05,suchthattherejectionofanyhypothesisindicates themodel is biased. Local calibration resulted in changes to the thermal cracking,rutting,andIRImodels.Anon-statisticalapproachwasusedwhenthemeasureddistress/IRIwaszeroorclosetozerofor thesectionsunderevaluation.Comparisonsbetweenpredictedandmeasureddistress/IRI

25
were conducted by categorizing them into groups. The evaluation consisted of determininghow often measured and predicted distress/IRI remained in the same group. This is anindicationofreasonableandaccuratepredictionswithoutbias.A second local calibration effort is currently underway with special emphasis on thin HMAoverlaysusingreclaimedmaterialsandotherbindermodifications.3.5 MethodologyusedinEffortsforNortheasternStates(15)
Ina2011studyconductedattheUniversityofTexasatArlingtonandsponsoredbyNewYorkStateDepartmentofTransportation,calibrationwasattemptedfortheNortheasternstates.Forthis effort, seventeen LTPPpavement sections in thenortheastern (NE) regionof theUnitedStates were selected to best represent conditions in New York State. LTPP sites from thefollowingsstateswerechosen:Connecticut,Maine,Massachusetts,NewJersey,Pennsylvania,andVermont.UsingVersion 1.1 of theMEPDG, verificationwas performedby executing theMEPDG models with the default, nationally calibrated coefficients, and by comparing thepredicteddistresseswiththemeasureddistressesforeachmodel.Fivemodelswereevaluated:permanent deformation (rutting), bottom-up fatigue (alligator) cracking, top-down fatigue(longitudinal) cracking, smoothness (IRI) model, and transverse (thermal) cracking. Thesemodels,exceptforthethermalcrackingmodel,werethencalibrated.3.6 MethodologyusedinEffortsforNorthCarolina
A2008studywasconductedusingMEPDGVersion1.0todetermineifthenationalcalibrationcoefficients could capture the rutting and alligator cracking on North Carolina asphaltpavements (16). More recently, verification was conducted as part of a calibration effortcompletedin2011(17).BothstudiesweresponsoredbyNorthCarolinaDOTandcompletedbyresearchersatNorthCarolinaStateUniversity.The2011studyusedVersion1.1oftheMEPDGandcompletedlocalcalibrationforthepermanentdeformation(rutting),andalligatorcrackingmodel. Additionally, material-specific calibration was also conducted for the twelve mostcommonlyusedasphaltmixturesinNorthCarolina.Thematerial-specificglobalfieldcalibrationcoefficients,kr1,kr2,kr3,intheruttingmodel,(asshowninequationA.1),andthefatiguemodelcoefficients, kf1, kf2, kf3, (as shown inequationA.12)weredetermined foreachof the twelveasphaltmixtures.Thesematerial-specificcalibrationcoefficientswereusedintherecalibrationprocedureforthelocalcalibrationcoefficientsinboththefatiguecrackingandruttingmodels.Atotaloftwenty-twopavementsectionswereusedforthecalibrationofthefatiguecrackingand rutting models, while twenty-four pavement sections were used for validation of therecalibrated models (17). The level of inputs used in the software ranged from Level 2 forasphalt mixtures to Level 3 for the unbound materials. Two approaches were taken inperforming local calibration. The first approach considered a large factorial of calibrationcoefficients(βr2andβr3 fortheruttingmodelandβf2andβf3 forthealligatorcrackingmodel)andconsistedofexecutingthesoftwarenumeroustimesforeachmodelwhilstoptimizingtheremaining coefficients for each model. The second approach utilized a genetic algorithmoptimization technique for each model to optimize the coefficients simultaneously. Model

26
adequacy for the global performance models and locally calibrated models (in both thecalibrationandvalidationstage)wereevaluatedwiththecoefficientofdetermination,standarderroroftheestimate,ratioofstandarderroroftheestimatetothestandarddeviationofthemeasuredperformance,andthep-valuefornullhypothesisinwhichtheaveragebiasiszeroatthe95%confidencelevel(17).3.7 MethodologyusedinEffortsforOhio(18)
AlocalcalibrationstudywasconductedforOhioDOTin2009byresearchersatARA.Thestudyincluded a verification effort todetermine if the globalmodels inVersion1.0of theMEPDGsoftware were sufficient in predicting performance for selected pavements in Ohio. Fourperformancemodelswere evaluated: alligator cracking, rutting, transverse cracking, and IRI.Measuredperformance from thirteen LTPPnewor reconstructed pavement sections inOhiowereusedfortheverificationandcalibrationefforts.InsimulatingthesesectionsintheMEPDGsoftware, thehierarchical input levels varied. For example, dynamicmoduluswasenteredatLevel2,whileunitweightandvolumetricpropertiesof theasphaltmixtureswereenteredatLevel1.Aspartof theverificationeffort, theglobalperformancemodelswereevaluated forpredictioncapability,accuracy,andbiasusingthecoefficientofdetermination,standarderroroftheestimate,andthethreehypothesistestsrecommendedintheAASHTOcalibrationguide,respectively.Thelocallycalibratedmodelswereevaluatedinasimilarmanner.3.8 MethodologyusedinEffortsforOregon(19)
Verification and local calibration studies using DarwinM-E (Version 1.1)were conducted forOregon DOT in a 2013 study completed at by the Institute for Transportation at Iowa StateUniversity. The calibration was based on a Level 3 analysis. Pavement work conducted byOregon DOT mainly involves rehabilitation of existing pavements; hence, calibration wasconductedforrehabilitationofexistingstructures.Pavementsectionswereselectedbasedontheir location (Coastal, Valley, or Eastern), type (HMA over aggregate base, HMA inlay oroverlayoveraggregatebase,HMAinlayoroverlayovercementtreatedbase,orHMAoverlayof CRCP), traffic level (low or high), and pavement performance (very good/excellent, asexpected,orinadequate).3.9 MethodologyusedinEffortsforTennessee(20)
In a 2013 study conducted at the University of Tennessee at Knoxville and sponsored byTennesseeDOTeffortswereaimedatdevelopinglocalcalibrationfactorsforTennessee(20).Inthisstudy,aninitialverificationoftheruttingandroughnessmodelsfornewpavementdesignwereevaluatedandwhereapplicable, localcalibrationwasperformedusingVersion1.100oftheMEPDGsoftware.Focusofthelocalcalibrationwasplacedonexistingpavementsthathadreceived an overlay, as pavement rehabilitation was a large portion the pavement activitiesconducted in Tennessee. The nineteen pavement sections used for verification and eighteensections used for local calibration were mostly Interstate pavements and consisted of ACpavements without an overlay, AC pavements with an AC overlay, and Portland cementconcrete (PCC) pavements with an AC overlay. In the initial verification process, twohierarchical input levels were considered: “Level 1.5,” which looked at Level 1 for material

27
propertiesofAC layersandLevel2 inputs for thebaseandsubgrade,and“Level2.5,”whichconsisted of Level 3 inputs for AC layers and Level 2 for base and subgrade properties. Theroughnessmodelwasevaluatedbyconsideringroughness intermsofPSI,which isconsistentwithTennesseeDOT’smethodforcharacterizationofroughness.Inevaluatingandcalibratingtheruttingmodel, threedifferentcategoriesofpavementswereconsidered: asphalt pavements and asphalt pavement overlaidwithAC; concrete pavementsoverlaidwithAC for lowvolume traffic (0-1,000AverageAnnualDailyTruckTraffic (AADTT));andconcretepavementsoverlaidwithACforheavytraffic(1,000-2,500AADTT). InevaluatingthePCCpavementswithACoverlays,onlyruttinginthesurface(AC)layerwasconsidered.ForACpavementswithACoverlays,thesectionsweretreatedasnewasphaltpavementsbecauseasphaltoverlayswerenotincludedinthenationalcalibrationoftheruttingmodel.Therefore,newasphaltpavementsandasphaltpavementswithACoverlaysweregroupedtogetherandtotal rutting (as opposed to rutting in the surface layer) was evaluated for that dataset.Validation of the locally calibrated rutting model was conducted for AC pavement sectionsoverlaidwithAC.3.10 MethodologyusedinEffortsforUtah(21,22)
UtahDOT sponsored a verification and local calibration study thatwas completedbyARA in2009usinganearly version,Version0.8,of theMEPDG.Thepavement sections in the studyincluded new HMA and HMA over HMAwith different thicknesses, butmost of themwerebetween 4-8 inches.Most of thematerial propertieswere characterized as Level 3with theexception of the subgrade that used a Level 1 (backcalculated using deflection data). Localcalibration was conducted using linear and non-linear regression procedures (SAS statisticalsoftware).Optimizationwasperformed to select local calibration coefficients tomaximizeR2andminimizeSe,bothgoodnessoffitandbiaswerechecked,andalimitedsensitivityanalysiswasperformed.Theruttingmodelsforallthelayerswererecalibratedin2013utilizingthetestsectionsusedinthe 2009 local calibration (except for those that had been overlaid) and fourmore years ofruttingdata (2009-2012).The recalibrationanalysiswasconducted in thesamemanneras inthe 2009 local calibration. Themain difference in coefficients is for the subgradewhere the2013recalibrationwillyieldlowersubgraderutting(22).3.11 MethodologyusedinEffortsforWashington(23)
A study for Washington State DOT (WSDOT) was conducted through a joint effort withengineersatWSDOTandAppliedPavementTechnology,Inc.in2009(23).UsingVersion1.0oftheMEPDG,verificationandlocalcalibrationeffortswerecompletedforconditionsspecifictoWashingtonState.Itwasreportedthatthecalibrationprocessfollowsacombinationofasplit-sampleapproachandajackknifetestingapproachperrecommendationinthedraftreportforNCHRPProject1-40A(RecommendedPracticeforLocalCalibrationoftheMEPavementDesignGuide).Forthecalibrationprocedure,datafromtheWashingtonStatePavementManagementSystem (WSPMS) was used. The calibration efforts focused on fatigue damage, longitudinal

28
cracking, alligator cracking, and ruttingmodels. First, an elasticity analysiswas conducted toassess the sensitivityofeachdistressmodel toeachof its calibrationcoefficients; thehigherabsolute elasticity value, the greater impact of the factor on the model. A set of sensitivecalibrationfactorswerethenselected,andthedesignsoftwarewasconductedbyvaryingthecalibrationfactorsfortworepresentativepavementsections,oneeachineasternandwesternWashington. The predicted distresseswere then comparedwith themeasured distresses forthetwosections.Asetofacceptablecalibrationfactorswiththeleastrootmeansquareerrors(RMSE)wasselected.Thecalibratedmodelswerethentestedagainsteachofthevalidationsections,whichincludedfive sections from a previous study, six representative sections from WSPMS for severaliterations,andtwosectionsinWashingtonStatethathadbeenusedinthenationalcalibrationeffortof theMEPDG.Thecalibration factorswere slightly changedbetween the iterations toreducetheRMSEbetweentheMEDPGpredictionandWSPMSmeasurements.Finalcalibrationfactors with the least RMSE were selected and reported, but no statistics were presented.When asked to comment onWSDOT’s local calibration efforts, a senior pavement engineerfromWSDOT said, “ThemajordistressonWSDOT's asphaltpavements is top-downcracking,which is not properly modeled in the MEPDG. In other words, the MEPDG cannot besuccessfully calibrated for WSDOT asphalt pavements unless the model is properlyredeveloped.”3.12 MethodologyusedinEffortsforWisconsin
AstudyonthePavementMEDesignlocalcalibrationwascompletedforWisconsinDOTbyARAin2009(24),andtheresultswereupdatedandpublishedinadraftusermanualcompletedin2014 (25). The2009 studywas conductedusing the LTPP sections inWisconsin.Mostof theinputs required for theverificationandcalibrationeffortswere from theLTPPdatabasewithsome inputs using national defaults in the software. A designwas conducted for each LTPPsectiontopredictpavementdistressesandIRI.ThePavementMEDesignpredictionswerethencomparedwiththemeasureddistressesintheLTPPdatabasetodeveloprecommendationsforWisconsinDOT(24).Resultsof themodelverificationsummarized inthisreportarefromthe2009report(24),andtheupdatedmodelcoefficientsreportedinthisreportarefromthedraftusermanual(25),whichdoesnotincludethemodelcalibrationstatistics.4 RESULTSOFVERIFICATION,CALIBRATION,ANDVALIDATIONEFFORTS
The previous section summarized local calibration studies conducted for numerous statehighwayagencies.Thissectionpresentstheresultsofthosestudiesdividedaccordingtomajordistresstype.Thedistressesincludefatiguecracking,rutting,transverse(thermal)cracking,andIRI.SummariesoftheresultsofeachindividuallocalcalibrationeffortcanbefoundinAppendixC.4.1 SummaryofVerificationandCalibrationResults
The results of the previously discussed verification efforts have been summarized in thefollowing subsections for each performancemodel: fatigue (alligator) cracking, total rutting,
29
transverse (thermal) cracking, IRI, and longitudinal (top-down) cracking. National calibrationcoefficientsconsideredarenoted,aswellasanyreportedresultsofstatisticalcomparisonswithfield measured data. The local calibration results are also tabulated, noting the new localcalibration coefficients as well as the results of statistical comparisons with field measureddata,whereapplicable.4.2 FatigueCracking
Tables 5 and 6 summarize the results of verification and/or local calibration of the fatiguecracking model, respectively. Also listed in the tables are the calibration coefficients andstatistical parameters reported for the development of the nationally calibrated modelreportedintheManualofPractice.Itshouldbenoted,asshowninAppendixA.4,coefficientskf2andkf3fortheglobalmodelarelistedasnegativevaluesintheManualofPracticebutareshownas positive values in the PavementMEDesign softwaredue to a slight change in theformoftheequation.4.2.1 FatigueCracking–VerificationResultsOf the states investigated for this report, ten conducted verification exercises, such thatpredictions from thenationally calibrated fatiguemodelwere comparedwith field-measuredfatiguecracking(Table5).Fourstates:Missouri,Utah,WashingtonandWisconsinwereunableto assess the nationally calibrated fatigue cracking model with statistical measures. ThenationallycalibratedmodelwasfoundtopredicttheobservedfatiguecrackingreasonablywellforUtah,whileslightoverandunder-predictionswerereportedforMissouri.Asaresult,localcalibrationwasnotrecommendedforeitherstate.VerificationresultsforWashingtonshowedthe model tended to under-predict alligator cracking and therefore, local calibration wasrecommended.ForWisconsin,verificationresults indicatedgoodpredictionsbythemodel,asmostofthemeasuredandpredictedalligatorcrackingfellwithinthesamecategory;thus,nolocalcalibrationwaswarranted.In the verification process, the coefficient of determination, R2, was only reported for twostates,forwhichthehighestR2wasonly17.5%,wellbelowthe27.5%reportedindevelopmentoftheglobalmodel.Anotherstatesimplyreporteditas“poor”andtheremainingstatesdidnotreportitatall.AlthoughR2wasnotreportedforIowa’sandWisconsin’sverificationresults,thenationallycalibratedmodelresultedingoodestimatesofthemeasuredfatiguecrackinganddidnot require local calibration. Inadequateestimateswith thenationally calibratedmodelwerereportedforArizona,Colorado,andWashington.Verificationeffortsforthosethreestates,aswell as North Carolina, the Northeastern states, and Oregon, all showed the global modelgenerallyresultedinunder-predictionsofobservedcracking.

30
Table5SummaryofVerificationEffortsforFatigue(Alligator)CrackingModel(4,10,11,13,15,17,19,23,24)
CalibrationCoefficient
GlobalModel
(ManualofPractice)
AZ CO IA NEStates NC OR WA WI
kf1 0.007566 0.007566 0.0076NR NR
0.0076NR NR
0.007566kf2 -3.9492 -3.9492 -3.9492 -3.9492 -3.9492kf3 -1.281 -1.281 -1.281 -1.281 -1.281βf1 1 1 1 1
NR
1
NR
1 1
βf2 1 1 1 1 1 1 1
βf3 1 1 1 1 1 1 1C1 1 1 1 1 1 1 1 1 1C2 1 1 1 1 1 1 1 1 1C4 6,000 6,000 6,000 6,000 6,000 6,000 6,000 6,000 6,000
StatisticalParameters-VerificationR2,% 27.5 8.2 17.5 NR
NR
“poor” NR
NR NR
Se 5.01 14.3 0.175 1.22 19.498 3.384N 405 363 50 327 124 NR
p-value(pairedt-test)
NR NR 0.0059 NR 0.000 NR
p-value(slope) NR NR <0.0001 NR NR NR
NR:NotReported
4.2.2 FatigueCracking–CalibrationResultsLocalcalibrationprocedureswereconducted forsixstateagencies (AZ,CO,NC,OR,andWA)and regionally for theNortheastern states. Generally, improvements in themodel estimateswerefoundwithlocalcalibration.Thisisespeciallyevidentforthoseeffortsforwhichstatisticalmeasureswere reported, as listed in Table 6.No statisticswere reported in theWashingtonStatestudy;however,itwasreportedthatlocalcalibrationresultedinpredictionsthatmatchedwell with the WSPMS measured data. For the Northeastern states study, only the sum ofsquared error (SSE) was reported. It was found that the SSE was reduced and improvedpredictions were found with regional calibration. For Arizona and Colorado, the only twostudies that reportedR2, a large improvementwas found in the coefficientof determinationovertheverificationeffortandtheR2reportedforthedevelopmentofthenationallycalibratedmodel. The locally calibrated coefficients for Colorado resulted in amodel that accounts fornearly 63% of the variability in the data, whereas the nationally calibrated model onlyaccounted for 17.5% of the variability in Colorado’s dataset. Although an improvement infatiguecrackingpredictionsandareductioninbiaswerereportedwiththeresultsofthelocalcalibration effort in North Carolina (shown in Table 6 as “NC Cal”), the coefficient of

31
determinationwas still considered “poor”, indicating that the locally calibratedmodelwas apoor predictor of the observed fatigue cracking. This was also the case when researchersappliedthelocallycalibratedmodeltoanewdatasettovalidatethemodel,showninTable6as“NC Val”. Although the standard error was reduced with locally calibrated coefficients andmaterial-specificcalibrationfactors,itwasstilltwiceaslargeasthestandarderrorreportedinthedevelopmentofthemodel,indicatingsubstantialamountofscatterremainedinthefatiguecrackingpredictions.Transferfunctioncoefficients(C1andC2)werethemostcommoncoefficientstobecalibrated,withfiveofthesevencalibrationeffortsalteringthesecoefficients.Thesecoefficientsarebothfixed at 1.0 in the nationally calibrated model. As a result of the local calibration effortssummarized in this report, calibrated values for C1 rangedbetween -0.06883 and1.071, andbetween0.225 and 4.5 for C2. Local calibration coefficients (βf1 andβf3)were the nextmostfrequently calibrated coefficients.Although calibrated values forβf3 rangedbetween0.6 and1.233,remainingincloseproximitytotheglobalcalibrationvalueof1.0,substantialdeviationsfromtheglobalcalibrationwereseen forβf1.The largestvalue forβf1 reportedasa resultoflocal calibrationwasnearly250 times larger than theglobal calibration factorof1.0. Theβf2termwasalteredinthreecalibrationefforts,asnotedinTable6.Thekf-termswerecalibratedindependentlyfortwelveasphaltmixturesintheeffortconductedforNorthCarolina,theonlyefforttoconsideralteringthesecalibrationcoefficients.
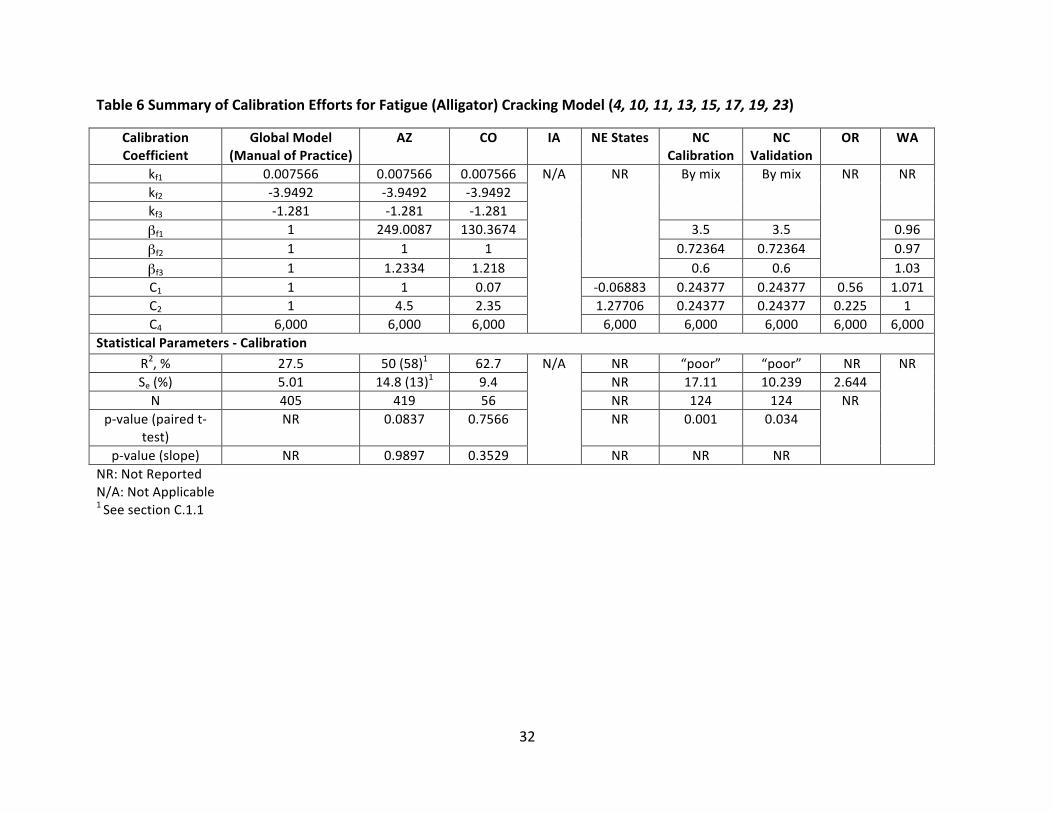
32
Table6SummaryofCalibrationEffortsforFatigue(Alligator)CrackingModel(4,10,11,13,15,17,19,23)
CalibrationCoefficient
GlobalModel(ManualofPractice)
AZ CO IA NEStates NCCalibration
NCValidation
OR WA
kf1 0.007566 0.007566 0.007566 N/A NR Bymix Bymix NR NR
kf2 -3.9492 -3.9492 -3.9492
kf3 -1.281 -1.281 -1.281
βf1 1 249.0087 130.3674 3.5 3.5 0.96
βf2 1 1 1 0.72364 0.72364 0.97
βf3 1 1.2334 1.218 0.6 0.6 1.03
C1 1 1 0.07 -0.06883 0.24377 0.24377 0.56 1.071
C2 1 4.5 2.35 1.27706 0.24377 0.24377 0.225 1
C4 6,000 6,000 6,000 6,000 6,000 6,000 6,000 6,000
StatisticalParameters-CalibrationR2,% 27.5 50(58)1 62.7 N/A NR “poor” “poor” NR NR
Se(%) 5.01 14.8(13)1 9.4 NR 17.11 10.239 2.644
N 405 419 56 NR 124 124 NR
p-value(pairedt-
test)
NR 0.0837 0.7566 NR 0.001 0.034
p-value(slope) NR 0.9897 0.3529 NR NR NR
NR:NotReported
N/A:NotApplicable1SeesectionC.1.1
33
4.3 Rutting
4.3.1 Rutting–VerificationResultsVerificationefforts conducted for total ruttingpredictionsof thenationally calibrated ruttingmodelaresummarizedinTable7,alongwiththenationallycalibratedcoefficientsintheglobalmodel,asshowninVersion2.1oftheAASHTOWarePavementMEDesignsoftware.Statisticsaresummarizedforthecomparisonoffield-measureddatawithtotalruttingpredictionswiththe global model. Statistical parameters for the development of the global model are alsoshown, as reported in the Manual of Practice. It is important to note that the nationallycalibrated coefficients reported in the Manual of Practice are not consistent with thosereportedandpresumablyusedasthedefaultcoefficientsfortheACandgranularmaterialsinthe AASHTOWare PavementME Design Software Version 2.1.While theManual of Practicereportsvaluesof0.4791and1.5606forAClayercoefficientskr2andkr3,respectively(alsolistedas k2r and k3r in the Manual of Practice, respectively), the values for these coefficients arereversedinthesoftware.Itislikelythatthevaluesforcoefficientskr2andkr3weremistakenlyreversedinpreviousversionsoftheManualofPracticeaspreviousversionsofthesoftwarelistthecoefficientsastheyareshowninTable7fortheGlobalModel.VerificationeffortsforthreeStateHighwayAdministrations(SHAs)(Missouri,Ohio,andUtah)reportednationallycalibratedcoefficients for rutting in the HMA layer consistent with the Manual of Practice, while theremaining efforts either did not report the values of the nationally calibrated coefficients ortheywereconsistentwithvaluesshowninthesoftware.BoththeManualofPracticeandcurrentandpreviousversionsofthesoftwareshowthesamevalue for ks1 of the fine-gradedmaterial as 1.35. However, the Research Results Digest 308,which summarizes the changesmade to theMEPDGasa resultof theNCHRPProject1-40D,shows “BrSG = 1.67” under “new rutting calibration factors” (26). Given the context of thedocument,thisisbelievedtorepresenttheks1termforthefine-gradedmaterial.Aswas the casewith the twok-terms for theAC layers and theks1 term for the fine-gradedsubmodel,therealsoappearstobeerroneousvaluesreportedintheManualofPracticeforthegranularsubmodel.Theks1termforgranularmaterialislistedas1.67intheManualofPractice(4);however,thistermisshownas2.03inpreviousversionsoftheMEPDG(1.003and1.1),andthe Research Results Digest reports “BrGB = 2.03” under “new rutting calibration factors”,believed to represent the ks1 term for granular material (26). The current version of thePavementMEDesignsoftware(2.1)liststheks1valueas2.03.Itispresumedthatthevalue2.03isthecorrectvalueasitisshowninthesoftware;therefore,Table7liststhisvaluefortheks1termforgranularmaterialintheglobalmodel.While thereareobviousdiscrepancies in the reportingof thecalibrationcoefficientvalues inthe documents reviewed in this study, the statistical comparison between measured andpredicted ruttingare consistent. Theplotof averagemeasured total rutting versuspredictedtotal rutting in theResearchResultsDigest 308 is identical to that shownonpage38of theManual of Practice (4, 26). The statistical parameters, R2, numberof datapoints (N), Se, andSe/Syarealsoconsistentbetweenthetwodocuments.Therefore,thestatisticalparametersfor
34
theglobalmodelarereportedinTables7and8astheyareshownintheManualofPractice.Only one effort, whichwas completed for North Carolina DOT, utilized ks1 values consistentwith the Research Results Digest 308. Coefficients listed in Table 7 reflect the reports fromwhich theyare referencedunlessotherwisenoted.Efforts for fourSHAs (Colorado,Missouri,Ohio,andUtah)reportednationallycalibratedcoefficients(ks1)consistentwiththeManualofPractice for the finegradedandgranular submodels.Twoof these studiesare the same twoSHAs forwhich reportedkr2 andkr3 valueswerealso consistentwith theManualofPractice;coincidentally, many of the same authors were common among the calibration reports forthese studies. The remaining efforts either did not report the values or reported valuesconsistentwiththesoftware.VerificationeffortswereconductedforelevenSHAsandregionallyforthenortheasternstates.AspartoftheeffortforTennesseeDOT,ruttingwasevaluatedforthreedifferentcategoriesofpavements: asphalt pavements and asphalt pavement overlaidwithAC; concrete pavementsoverlaidwithACforlowvolumetraffic(0-1,000AADTT),listedas“AC+PCClow”inTables7and8; and concrete pavements overlaidwith AC for heavy traffic (1,000-2,500 AADTT), listed as“AC+PCChigh”inTables7and8.ForACoverlaysonPCCpavements,predictedruttingintheACoverlay was compared with measured rutting of the pavement surface, and for asphaltpavementsandasphaltpavementoverlaidwithAC,predictedtotalruttingwascomparedwithmeasuredruttingonthepavementsurface.InthestudyconductedforUtahDOT,verificationofthenationalruttingmodelwasconductedfor older pavement that used viscosity graded asphalt (68 data points), and for newerpavement that used Superpave mixes (86 data points), as well as both mix types pooledtogether.While the predictions for the older pavementswere adequate, predictions for thenewer Superpavemixeswerepoor and therefore required local calibration. Statistical valueslisted in Table 7 reflect the verification effort for the Superpavemixes, as these pavementswerethefocusofthelocalcalibrationeffort.Results ranged widely among the verification efforts for the comparison of measured totalruttingandpredictedtotalruttingusingtheglobalmodel.Itshouldbenotedthatthelevelofstatistical evaluation conducted to assess the quality of the predictions with the nationallycalibrated model varied. While three studies did not report any statistical parameters, thecoefficient of determination, R2,was reported for approximately half of theevaluations, andthemajorityreportedthestandarderroroftheestimate(Se).Sixoftheeffortsquantifiedtheevaluationofthegoodnessoffitwiththecoefficientofdetermination,R2.ThehighestR2valuewasreportedfortheverificationeffortsforOhioDOT,inwhichthecoefficientofdeterminationwas reported as 64%. Thiswas also theonly study to showanR2 at or above57.7%, theR2foundinthedevelopmentoftheglobalmodel.TheworstfitwasreportedineffortsforArizonaDOT, for which R2 of 5% was reported. Efforts conducted for North Carolina DOT did notquantifythegoodnessoffitoftheglobalmodel;rather,itwassimplyreportedas“poor.”Inevaluatingbiasintheexistingglobalmodel,onlyfourstudiesconductedhypothesistesting.Ifthehypothesis is rejected,meaningthep-valuewas less thanthesignificance level, than it is
35
impliedthattheparameterbeingtested(slopeor intercept) issignificantlydifferentfromthevalue forwhich it is being tested. In the case of the slope, this valuewould be 1.0 and theintercept value would be 0. For the hypothesis test for the paired t-test, rejecting the nullhypothesis implies that themeasured and predicted distress are from different populations,andassuch,biasexists.AsshowninTable7,hypothesistestingfortheinterceptshowedthatthe p-values for all four studies (Colorado, Missouri, Ohio, and Utah) were very small. Thisimplies that the intercept was significantly different from zero; therefore, bias exists in thenationallycalibratedmodelwhenappliedtodataspecifictothesestates.Althoughnotallof thestudiesspecificallycommentedonexistingbias in theMEPDGdefaulttotal rutting model, an examination of the reports and any plots presented in each studyenabledthefollowingsummarytobemade.Thetotalruttingestimatesmadewiththeglobalmodelwerefoundtobeoverestimatesofmeasuredruttinginmanyoftheverificationefforts(Arizona,Missouri,Ohio,Oregon,Wisconsin,andfornewACpavementsandACoverlaysonACpavements inTennessee,andSuperpavemixes inUtah).Although themajorityof theeffortsconducted showed over-prediction of total rutting, under-prediction of total rutting wasreportedineffortsforNorthCarolinaandWashingtonState.Bias,intheformofover-orunder-prediction,wasreportedinmanyofthestudies;however,thedirectionofthebiaswasnotasevident in some studies. Authors of the Colorado verification/calibration report stated (page128) there was “a significant bias” in the global rutting model (11). However, there is noobvious trendevident in theplotofmeasuredversuspredicted total rutting (Figure82,page126of the referenceddocument (11)),as itappears that for somemagnitudesof rutting theglobalmodelover-predictsandforothermagnitudes(highandlow)theglobalmodeltendstounder-predict total rutting. In Iowa, verification efforts indicated the model provided goodpredictionsoftotalrutting(13).Theauthorsdidnotstatewhetheranybiasexistedinthetotalrutting predictions; however, the plot of measured versus predicted total rutting shown inFigure10(13)appearstoshowsomeover-prediction.AuthorsoftheNortheasternstatesstudydidnotexplicitly statewhetherunder-orover-predictionwasnotedwith thenationalmodel(15).However,basedon theplotofmeasuredversuspredicted total ruttingusing theglobalcoefficients(showninFigure4.7of(15)), itappearsthenationaldefaultruttingmodelunder-predictedtotalruttingatthehighend(above0.4inches).

36
Table7SummaryofVerificationEffortsforTotalRuttingPredictions(10,11,13,14,17-24,27)
ParameterCategory
CalibrationCoefficient
GlobalModel
(SoftwareVersion2.1)
AZ CO IA MO NC NEStates OH OR
HMARutting
kr1 -3.35412 -3.35412 -3.3541NR
-3.35412 -3.35412NR
-3.35412 -3.35412kr2 1.5606 1.5606 1.5606 0.4791 1.56061 0.4791 1.5606kr3 0.4791 0.4791 0.4791 1.5606 0.47911 1.5606 0.4791βr1 1 1 1 1 1 1 1 1 1βr2 1 1 1 1 1 1
NR1 1
βr3 1 1 1 1 1 1 1 1Fine
GradedSubmodel
ks1 1.35 1.35 1.35 NR 1.35 1.67 NR 1.35 1.35
βs1 1 1 1 1 1 1 1 1 1
GranularSubmodel
ks1 2.03 2.03 1.673 NR 1.673 2.03 NR 1.673 2.03βb1 1 1 1 1 1 1 1 1 1
GoodnessofFit
R2,% 57.7 4.6 45.1 NR 32 PoorNR
64 NRSe 0.107 0.31 0.134 0.08 0.11 0.129 0.035 0.568N 334 479 155 NR 183 235 101 NR
Bias
p-value(pairedt-test)
NR NR<0.0001
NR<0.0001 0.000
NR<0.0001
NRp-value(intercept) NR 0.0003
NR<0.0001
p-value(slope) <0.0001 <0.0001 <0.0001
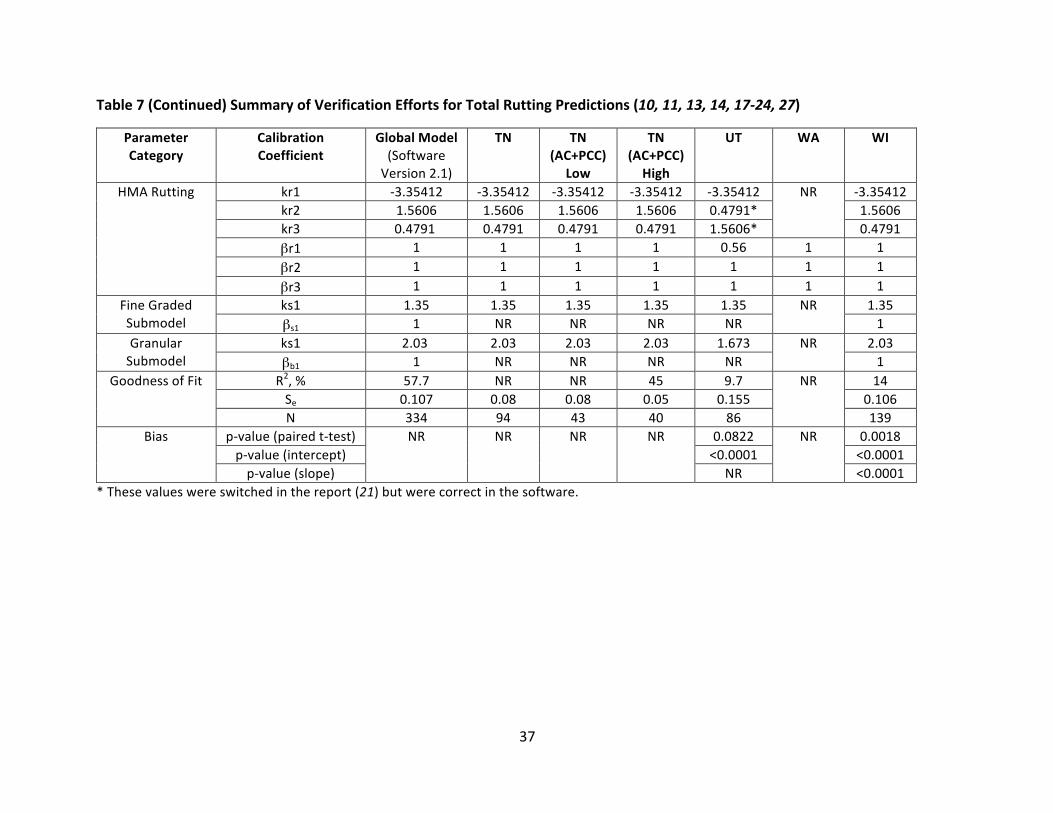
37
Table7(Continued)SummaryofVerificationEffortsforTotalRuttingPredictions(10,11,13,14,17-24,27)
ParameterCategory
CalibrationCoefficient
GlobalModel(SoftwareVersion2.1)
TN TN(AC+PCC)
Low
TN(AC+PCC)
High
UT WA WI
HMARutting kr1 -3.35412 -3.35412 -3.35412 -3.35412 -3.35412 NR -3.35412kr2 1.5606 1.5606 1.5606 1.5606 0.4791* 1.5606kr3 0.4791 0.4791 0.4791 0.4791 1.5606* 0.4791βr1 1 1 1 1 0.56 1 1βr2 1 1 1 1 1 1 1βr3 1 1 1 1 1 1 1
FineGradedSubmodel
ks1 1.35 1.35 1.35 1.35 1.35 NR 1.35βs1 1 NR NR NR NR 1
GranularSubmodel
ks1 2.03 2.03 2.03 2.03 1.673 NR 2.03βb1 1 NR NR NR NR 1
GoodnessofFit R2,% 57.7 NR NR 45 9.7 NR 14Se 0.107 0.08 0.08 0.05 0.155 0.106N 334 94 43 40 86 139
Bias p-value(pairedt-test) NR NR NR NR 0.0822 NR 0.0018p-value(intercept) <0.0001 <0.0001p-value(slope) NR <0.0001
*Thesevalueswereswitchedinthereport(21)butwerecorrectinthesoftware.

38
4.3.2 Rutting–CalibrationResultsOnlyoneoftheverificationeffortsindicatedthatcalibrationwasnotnecessary,specifictooneof three pavement types evaluated for Tennessee. As a result, calibration efforts wereconducted for all of the eleven SHAs and the northeastern states. The most commoncoefficients to be altered in the calibration processwereβr1 for theHMA layers,βs1 for thegranularmaterial,andβs1forfine-gradedsubgradematerial.Amongthosestudiesthatalteredtheβr1termaspartofthelocalcalibrationprocedure,theresultingtermrangedfrom0.477to2.2.Forthoseeffortsthatvariedtheβs1termforthegranularsubmodel,resultsrangedfrom0to2.0654;similarly,valuesfortheβs1termforthefine-gradedsubmodelwerebetween0and1.5.Resultsofthecalibrationeffortswerevariedamongthetwelvestudies.Althoughmoststudiesreported improvements in the total rutting predictions with locally calibrated coefficients,correlations betweenmeasured and predicted ruttingwere still poor. Thiswas certainly thecase with the study for Arizona DOT and the 2009 study for Utah DOT. After the 2013recalibration,theruttingpredictionwassignificantlyimprovedwithR2=43%andSEE=0.07inUtah.ThehighestR2 reportedwith locallycalibratedcoefficientswas63%forOhioDOT.ThiswasactuallyslightlylowerthanthecoefficientofdeterminationreportedwhenthenationallycalibratedmodelwasappliedtotheOhiodataset(asshowninTable7).However,coefficientofdeterminationistheonlymeasureoffitanddoesnotassessbias.InthestudyforOhio,itwasreportedthatimprovementsweremadeinthepredictioncapabilityofthemodelbyconductinglocal calibration; this is evident in the reduction in the standard error of the estimate, Se.Furthermore,theSethatresultedfromlocalcalibrationforOhioDOTwasnotablylessthantheSe reported in the development of the nationally calibrated model. Although R2 was notreportedfortheOregonstudy,asignificantreductioninSewasreportedafterlocalcalibration.Intheverificationeffort,aSeof0.568wasreportedforOregon;thiswasreducedthroughlocalcalibrationtoavalueof0.180,avaluemuchclosertotheSereportedforthedevelopmentoftheglobalmodel.AlthoughnostatisticswerereportedintheWashingtonstudy,itwasreportedthatthelocallycalibratedmodelresultedinpredictionsthatmatchedwellwithWSPMSdatainmagnitudeandprogression andwas an improvement over predictionsmadewith the defaultmodel. In theNortheastern states study, the only statistic reported, SSE, was reported to have decreasedwith local calibration, and the regional calibration coefficients gave a better fit betweenmeasuredandpredictedruttinginalllayers.InthestudyconductedforTennessee,calibrationof theruttingmodel forACoverlaysonPCCpavementswith lowtraffic resulted in improvedpredictionsofruttingintheACoverlay(localcalibrationcoefficientsinthebaseandsubgradelayerswereset to zero to fixpredicted rutting in theunderlying layers to zero).Additionally,improvementswerereportedintheTennesseestudyfortotalruttingpredictionsasaresultoflocalcalibrationforasphaltpavementandasphaltpavementwithACoverlays.Inadditionto improvements inoverallgoodnessof fit, some improvements inbiaswerealsorealized with local calibration efforts. In the study conducted for North Carolina, significantreduction inbiaswasreported.Nosignificantbiaswas foundfor the locallycalibratedmodel
39
forMissouri. Itwas reported forArizona that theover-predictionbiaswas removed throughlocal calibration. Additionally, for Colorado and Utah, the “significant bias” reported for thenationallycalibratedmodelwaseliminatedthroughlocalcalibration.Thep-valuesreportedforArizona, Colorado, Missouri, and Utah also indicate reduction of bias as a result of localcalibration.Althoughslight,areductioninbiasforthetotalruttingpredictionwasnotedwithlocal calibration in Iowa. In the same study, improvementswerealso found inpredictionsofrutting for each layer with the locally calibrated model. Although there were no statisticsreportedorhypothesestestingcompletedfortheOregonDOTstudy,itwasreportedthatbiaswas reduced with local calibration of the rutting model. Also, even though there were nostatistics reported, it was expected that the predictions were improved for the recalibratedmodelsfortheWisconsinstudy.Whilesomestudiesresultedinreductioninbias,Ohioreportedthatsignificantbiasremainedinthepredictionsdespitetherecalibrationeffort.
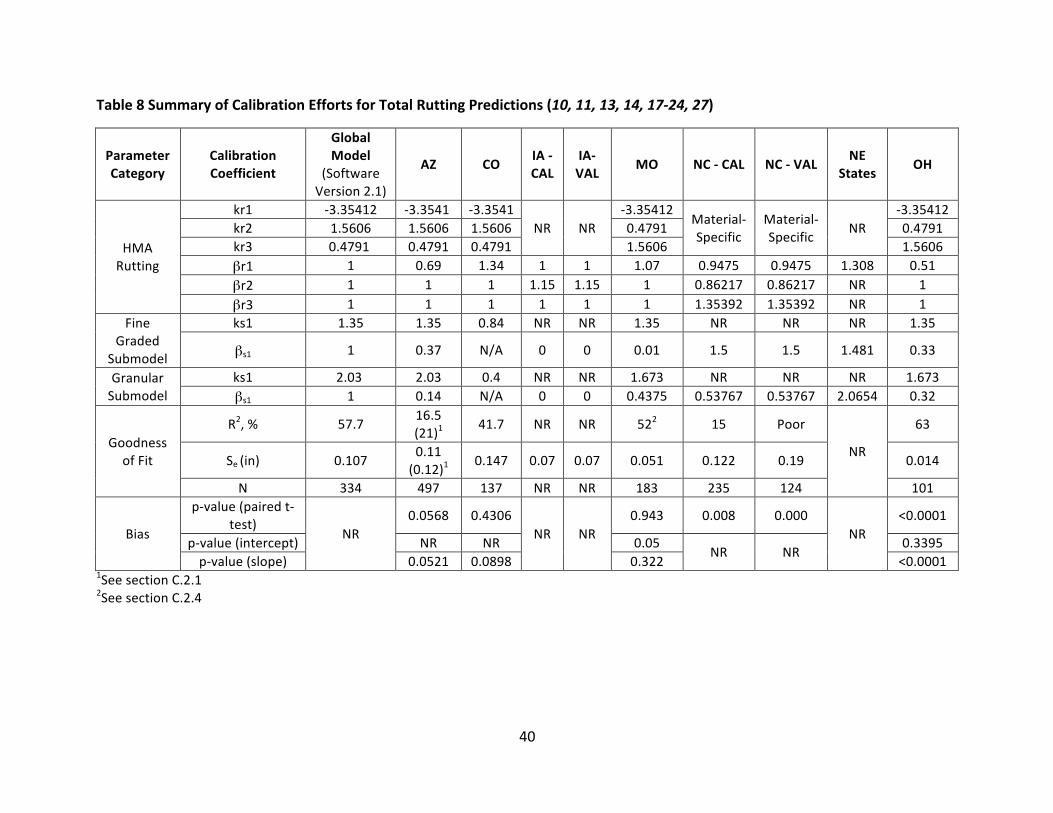
40
Table8SummaryofCalibrationEffortsforTotalRuttingPredictions(10,11,13,14,17-24,27)
ParameterCategory
CalibrationCoefficient
GlobalModel
(SoftwareVersion2.1)
AZ CO IA-CAL
IA-VAL MO NC-CAL NC-VAL NE
States OH
HMARutting
kr1 -3.35412 -3.3541 -3.3541NR NR
-3.35412Material-Specific
Material-Specific NR
-3.35412kr2 1.5606 1.5606 1.5606 0.4791 0.4791kr3 0.4791 0.4791 0.4791 1.5606 1.5606βr1 1 0.69 1.34 1 1 1.07 0.9475 0.9475 1.308 0.51βr2 1 1 1 1.15 1.15 1 0.86217 0.86217 NR 1βr3 1 1 1 1 1 1 1.35392 1.35392 NR 1
FineGraded
Submodel
ks1 1.35 1.35 0.84 NR NR 1.35 NR NR NR 1.35
βs1 1 0.37 N/A 0 0 0.01 1.5 1.5 1.481 0.33
GranularSubmodel
ks1 2.03 2.03 0.4 NR NR 1.673 NR NR NR 1.673βs1 1 0.14 N/A 0 0 0.4375 0.53767 0.53767 2.0654 0.32
GoodnessofFit
R2,% 57.7 16.5(21)1 41.7 NR NR 522 15 Poor
NR
63
Se(in) 0.107 0.11(0.12)1 0.147 0.07 0.07 0.051 0.122 0.19 0.014
N 334 497 137 NR NR 183 235 124 101
Bias
p-value(pairedt-test)
NR0.0568 0.4306
NR NR0.943 0.008 0.000
NR<0.0001
p-value(intercept) NR NR 0.05NR NR
0.3395p-value(slope) 0.0521 0.0898 0.322 <0.0001
1SeesectionC.2.12SeesectionC.2.4
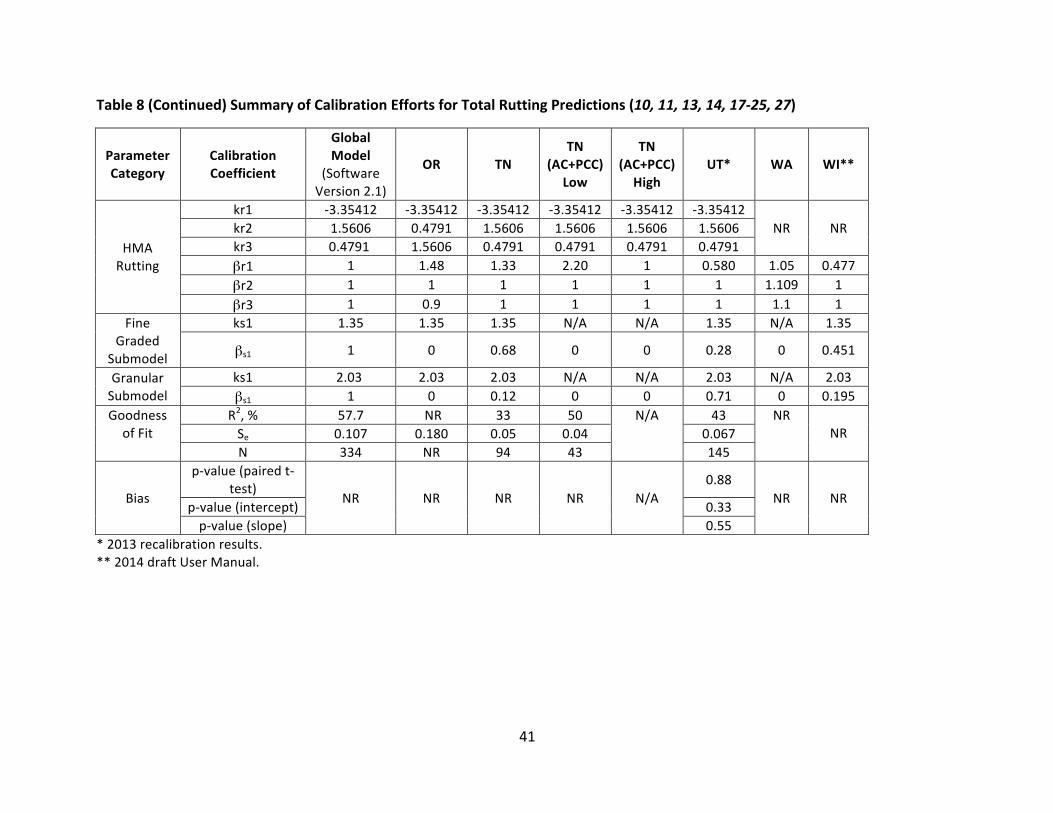
41
Table8(Continued)SummaryofCalibrationEffortsforTotalRuttingPredictions(10,11,13,14,17-25,27)
ParameterCategory
CalibrationCoefficient
GlobalModel
(SoftwareVersion2.1)
OR TNTN
(AC+PCC)Low
TN(AC+PCC)
HighUT* WA WI**
HMARutting
kr1 -3.35412 -3.35412 -3.35412 -3.35412 -3.35412 -3.35412NR NRkr2 1.5606 0.4791 1.5606 1.5606 1.5606 1.5606
kr3 0.4791 1.5606 0.4791 0.4791 0.4791 0.4791βr1 1 1.48 1.33 2.20 1 0.580 1.05 0.477βr2 1 1 1 1 1 1 1.109 1βr3 1 0.9 1 1 1 1 1.1 1
FineGraded
Submodel
ks1 1.35 1.35 1.35 N/A N/A 1.35 N/A 1.35
βs1 1 0 0.68 0 0 0.28 0 0.451
GranularSubmodel
ks1 2.03 2.03 2.03 N/A N/A 2.03 N/A 2.03βs1 1 0 0.12 0 0 0.71 0 0.195
GoodnessofFit
R2,% 57.7 NR 33 50 N/A 43 NR NR
Se 0.107 0.180 0.05 0.04 0.067N 334 NR 94 43 145
Bias
p-value(pairedt-test)
NR NR NR NR N/A0.88
NR NRp-value(intercept) 0.33p-value(slope) 0.55
*2013recalibrationresults.**2014draftUserManual.

42
4.4 TransverseCracking
4.4.1 TransverseCracking–VerificationResultsNineverificationeffortsfortransversecrackingwereconductedandcalibrationwasconductedforfourSHAs.Table9summarizestheverificationandcalibrationresults.Unlike the other performance prediction models, the calibration coefficients used in thetransversecrackingmodelaredependentonthelevelofdesignselectedbytheuser.ListedinTable9aretwosetsofcalibrationcoefficients:thosevaluesinitiallyestablishedandpresentedintheManualofPracticeandolderversionsofthesoftware,andthosevaluespresentedinthecurrentsoftware,PavementMEDesignVersion2.1.Althoughitisunclearatwhatpointintimeitoccurred (orwhichversionof thesoftware thechangewasmade),anupdate to the initialequations utilized to determine transverse cracking was completed. Appendix A.3 presentsboth sets of performancepredictionmodels and the associated calibration coefficients.Onlygoodnessoffitforthetransversecrackingmodelandtheassociatedcalibrationcoefficients,asdescribedintheManualofPractice,weredocumented,andassuchonlyR2valuesfortheolderperformancemodelandcalibrationcoefficientsarepresentedinTable9.Verification was attempted for the Northeastern states and eight SHAs: Arizona, Colorado,Iowa, Missouri, Ohio, Oregon, Utah, Washington, and Wisconsin. More than half of theverification efforts were conductedwith non-statistical analyses. In the study conducted forArizona, a Level3designwasutilized inanon-statistical comparisonofmeasured transversecrackingversuspredictedtransversecracking.Therewerediscrepancies inthereportedvalueofthecoefficient,K,forLevel3;seeSectionC.3.1formoredetails.AlthoughnostatisticswerereportedintheArizonastudy,itwasreportedthatpredictionswiththeglobalmodelgenerallyunder-predicted measured values. Verification was attempted for the Northeastern states;however, itwas speculated that the transverse crackingmeasurementsweremade in error;therefore, prediction capabilities could not be quantified. A non-statistical comparison wasconducted for Ohio using measured and predicted transverse cracking to verify the model,revealing an adequate performance of the global transverse cracking model. Although themodelwasverified, itwas recommendedthatdue to the limitedscaleof transversecrackingmeasurements,amoredetailedevaluationshouldbeconducted in the future.Resultsof thenon-statisticalapproachusedforUtahindicatedthatthenationallycalibratedmodelpredictedcracking well for mixes designed with Superpave binders but significantly under-predictedtransverse cracking for mixes with conventional binders. Local calibration was notrecommendedforUtah.EffortscompletedforWashingtonStateDOTfoundtheglobalmodeltoprovide reasonable estimates of transverse cracking. For Wisconsin DOT, a non-statisticalcomparison of measured and predicted transverse cracking indicated that the transversecracking model using default calibration factors over-predicted transverse cracking inWisconsin.LocalcalibrationwaswarrantedforWisconsin.Fortheremainingeffortsthatutilizedstatisticalanalysestoevaluatethenationallycalibratedmodel,thepredictionsweregenerallynotadequate.VerificationeffortsforColoradoindicatedthattheglobaltransversecrackingmodelresultedinpoorgoodnessoffitandbiasintheform

43
ofunder-predictionofmeasuredvalues.ThenationallycalibratedLevel3modelwasevaluatedforIowa,resultinginalargeSe,anddespitesignificantmeasuredtransversecracking,themodelunder-predicted with minimal cracking estimated. Missouri evaluated transverse crackingpredictionsatbothLevels1and3designsandfoundthatdespitethehigherR2value,Level3resulted in significant under-predictions. Predictions at the Level 1 design also showedsignificantbias,andinsomecasesresultedinsignificantover-predictionsofmeasuredvalues.VerificationoftheLevel3modelwasalsoconductedforOregon.Althoughfewstatisticswerereported inthatstudy,fromaplotpresentedinthecalibrationreport, itcanbe inferredthatthenationallycalibratedmodelunder-predictedtransversecrackinginOregon.4.4.2 TransverseCracking–CalibrationResultsAlthough the recommendation for Arizonawas to recalibrate the transverse crackingmodel,researcherswereunable tosuccessfullycalibrate themodel to local conditions.Ultimately, itwasrecommendedthatthemodelnotbeusedasoneofthedesigncriteriainArizona.Ofthefoureffortsthatusedstatisticalanalysestoverifytheglobalmodel,three(Colorado,Missouri,andOregon)recommendedandattemptedrecalibration.RecalibrationwasnotrecommendedforIowaduetothelargedisparitybetweenmeasuredandpredictedvaluesandlargebias.The only statistic reported for Oregon was Se and it was found that the calibration effortresulted in an increase in Se. While the predictions in the Oregon study were found to bereasonable, there was no improvement when compared to the nationally calibratedmodel.Calibration efforts for Colorado and Missouri utilized a Level 1 design and found animprovement in the predictions with the calibrated coefficients. For Colorado, “reasonable”predictionswerereportedandthesignificantbiasfoundinthenationallycalibratedmodelwaseliminated.InthestudyconductedforMissouri,excellentpredictionswerereportedbutwereslightlybiased.Finally,thelocallycalibratedmodelcoefficientsreportedinadraftusermanualare presented in Table 9 forWisconsin. The draft user manual does not include calibrationstatisticsforthemodel.

44
Table9SummaryofVerificationandCalibrationResultsfortheTransverse(Thermal)CrackingModel(4,11,13,14,19,24,25,27)
State K R2,% Se(ft/mi) N p-value(pairedt-test) p-value(slope) p-value(intercept)
GlobalModel(ManualofPractice)
Level1:5.0 34.4NR NR NRLevel2:1.5 21.8
Level3:3.0 5.7GlobalModel
(SoftwareVersion2.1)
Level1:1.5Level2:0.5Level3:1.5
NR NR NR NR
VerificationResultsCO Level1:1.5 39.1 0.00232 NR 0.0123 <0.0001 NRIA Level3:1.5 NR 1203 NR NR NR NR
MOLevel1:1.51 Level1:52 Level1:459
49
Level1:<0.0001
Level1:<0.0001 Level1:<0.0001
Level3:1.51 Level3:78 Level3:2812 Level3:0.0001 Level3:
<0.0001 Level3:0.125
OR Level3:1.5 NR 121 NR NRWI Level3:3.0 NR NR 94 NR
CalibrationResultsCO Level1:7.5 43.1 194 12 0.529 0.339 NRIA N/AMO Level11:0.625 Level1:91 51.4 49 0.0041 <0.0001 0.907OR 10 NR 751 15 NR
WILevel1:3.0Level2:0.5Level3:3.0
NR NR NR NR
1Inconsistencyinreportinginreferencedocument,seesectionC.3.42Inconsistencyinreportinginreferencedocuments,seesectionC.3.4

45
4.5 IRI
4.5.1 IRI–VerificationResultsVerification efforts were conducted for seven SHAs and the northeastern states for theInternationalRoughness Index (IRI)model.Sixof theseefforts resulted in recalibration.Table10summarizestheresultsoftheverificationandcalibrationeffortsbyagency.InverifyingthenationallycalibratedIRImodelinMissouri,researchersutilizedpredictionsfromindividuallocallycalibrateddistressmodelsfortheinputsratherthanthenationallycalibrateddistressmodels.This resulted in reasonablepredictionswithaslightbias (under-estimatesathighermagnitudesofIRI).AsimilarapproachwastakeninIowa.First,verificationeffortswereconducted using predictions with individual global distress models (rut depth, load relatedcracking,and thermal cracking) for inputs to thenationally calibratedmodel.This resulted ingood estimation of field measurements. Iowa also utilized a separate dataset to conduct avalidationofthenationallycalibratedIRImodelwithglobaldistressmodelinputs.Additionally,distressespredictedwithlocallycalibratedmodelswereusedinconjunctionwiththenationallycalibrated coefficients in the IRI model for the two datasets. This method resulted in goodestimation of measured values for both the verification dataset and the validation dataset.ResearcherstookasimilarapproachinverifyingtheIRImodel inWashingtonState.EstimatesforcrackingandruttingmadewithlocallycalibratedmodelswereusedasinputsinthedefaultIRImodel, resulting inunder-predictionsof actual roughness, although itwasnoted that thedifferences were small. While it was believed the under-prediction inWashington could beresolvedthroughcalibrationoftheIRImodel,softwarebugsreportedlypreventedsuchefforts.TheverificationeffortconductedforUtahutilizedruttingpredictionsfromthelocallycalibratedmodelstoestimatetherutdepthinputneededforthenationallycalibratedIRImodel.Basedonadequate goodness of fit, acceptable standard error, and only slight bias evident at IRIapproachingzero,recalibrationofthenationallycalibratedmodelwasnotnecessaryforUtah.SimilartotheapproachusedinUtah,theIRIpredictionmodelwasverifiedforWisconsin.WhiletheR2andSEEwerefoundtobereasonable,thenationallycalibratedIRImodelgenerallyover-predictedIRIwhenitwaslessthan70in/miandunder-predictedIRIwhenitwasgreaterthan70 in/mi,and thedifferencebetween thepredictedandmeasured IRIvalueswasstatisticallysignificant.AlocalcalibrationoftheIRImodelwasrecommendedforWisconsin.Theremainingefforts did not state that any locally calibrated distress models were utilized to determineinputsforthenationallycalibratedIRImodel.ThecorrelationbetweenpredictedandmeasuredIRIdescribedbyR2variedwidely,from0.8%to 67%, with all but two efforts resulting in a value less than the 56% reported for thedevelopmentofthenationallycalibratedmodel.DespitethevariationinreportedR2values,allreportedSevaluesfellbelowthatdeterminedinthemodeldevelopment,indicatingthatthereismoreprecisionwhenappliedtoastate’sconditionsbutlessaccuracythanwhendevelopedat the national level. Predicted IRI was converted to PSI and compared with measured PSIvalues in Tennessee. For lower levels of traffic (cumulative ESALs less than 4.5 million),pavement roughness (IRI converted to PSI) was under-predicted by the default model. Forhigherlevels(cumulativeESALsbetween4.5millionand9million),highvariabilityinpredicted
46
roughnesswasobserved.Basedontheresultsoftheverificationofthedefault IRImodel (nostatisticswerereported),calibrationwasrecommendedbutnotconductedforTennessee.OnlySSE was reported in the Northeastern states study, which indicated that the correlationbetweenmeasuredandpredictedvaluesforthenationallycalibratedIRImodelwasverypoor.In the Arizona study, bias in the form of large over-predictions for lower IRI and under-predictionsforhigherIRIwasobserved.Similarly,intheOhiostudy,thedefaultIRImodelwasfoundtoover-predictIRIforlowermagnitudes(lessthan80inches/mile)andunder-predictathigher measured IRI values (greater than 80 inches/mile). Although it was reported in theColoradostudythatthenationallycalibratedmodelover-predictsforhighermagnitudesofIRI,theplotofmeasuredversuspredictedIRIvaluesshowninthereferenceddocumentshowsthatthemodelunder-predictsforhighermagnitudesofIRI.4.5.2 IRI–CalibrationResultsFor the following states, calibration was recommended after verification: Arizona, Colorado,Missouri,NortheasternStates,Ohio,andWisconsin.Localcalibrationresultedinimprovementsin the goodness of fit for Arizona, Colorado,Missouri, andOhio. In Arizona, local calibrationresultedinaverygoodR2valueandtheeliminationofthelargeover-predictionbiasfoundwiththe global model. Although Se increased slightly after calibration in Colorado, the R2 saw anotableincreaseandtheunder-predictionbiaswasremoved,resultinginimprovedpredictionswiththecalibratedmodel.AreasonablecorrelationbetweenmeasuredandpredictedIRIwiththe locally calibrated IRImodelwas found forMissouri.Additionally, somebias in the locallycalibratedmodelwasreported,however,itwasconsideredreasonable.Only the SSE was reported for the Northeastern states study, and it was reported that theregional calibration improved the IRI predictions and resulted in a reduction in SSE.ImprovementsinIRIpredictionswerereportedwithlocalcalibrationinOhio,resultinginanR2of69%,andalthoughbiasremained,itwasreportedtobemorereasonablethanthebiasinthenationally calibrated model. Finally, the IRI model was recalibrated to remove the biasidentified in themodel verificationprocess. The recalibratedmodel coefficients presented inTable10forWisconsinarefromadraftusermanual,whichdoesnotreportmodelcalibrationstatistics.

47
Table10SummaryofVerificationandCalibrationResultsfortheIRIModel(4,10,11,13,14,15,18,21,24,25,27)
State C1 C2 C3 C4 R2,% Se(in/mi)
N p-value(pairedt-test)
p-value(intercept)
p-value(slope)
GlobalModel 40 0.4 0.008 0.015 56 18.9 1,926 NRVerificationResultsAZ 401 0.4 0.008 0.0151 30 18.7 675 NRCO 402 0.4 0.008 0.0152 35.5 15.9 343 0.553 0.0001 NRIA-GlobalDistress+NatlCalCoeff
40 0.4 0.008 0.015 NR 12.35 NR NR
IA-ValidationGlobalDistress+NatlCalCoeff
40 0.4 0.008 0.015 NR 13.23 NR NR
IA-LocallyCalDistress+NatlCalCoeff
40 0.4 0.008 0.015 NR 10.79 NR NR
IA–ValidationLocallyCalDistress+NatlCalCoeff
40 0.4 0.008 0.015 NR 12.83 NR NR
MO 40 0.4 0.008 0.015 54 13.2 125 0.0182 0.0037 0.0953NEStates 40 0.4 0.008 0.015 NR NROH 40 0.4 0.008 0.015 0.8 9.84 134 <0.0001 <0.0001 0.78UT 40 0.4 0.008 0.015 67 16.6 162 0.179 0.1944 <0.0001WI 40 0.4 0.008 0.015 62.7 5.694 142 0.0004 <0.0001 0.0161CalibrationResultsAZ 1.2281 0.1175 0.008 0.028 82.2(80)3 8.7(8)3 559 0.1419 NR 0.7705CO 35 0.3 0.02 0.019 64.4 17.2 343 0.1076 NR 0.3571MO 17.7 0.975 0.008 0.01 535 13.25 1255 0.6265 0.0092 0.225NEStates 51.6469 0.000218 0.0081 -0.9351 NR NROH 0.066 1.37 0.01 17.6 69 15.9 134 0.455 <0.0001 <0.0027WI 8.6733 0.4367 0.00256 0.0134 NR NR1Inconsistencyinreportinginreferencedocument,seesectionC.4.12Inconsistencyinreportinginreferencedocument,seesectionC.4.23Inconsistencyinreportinginreferencedocument,seesectionC.4.1
4Inconsistencyinreportinginreferencedocument,seesectionC.4.65Inconsistencyinreportinginreferencedocument,seesectionC.4.4

48
4.6 LongitudinalCracking
VerificationandcalibrationeffortsofthelongitudinalcrackingmodelwereconductedforthreeSHAs and the Northeastern states, as summarized in Table 11. This table also shows thenationallycalibratedcoefficients intheglobalmodelasshownintheAASHTOWarePavementMEDesignsoftwareVersion2.1.Whiletheseeffortsevaluatedthecurrentdefaultlongitudinalcrackingmodel,itisanticipatedanewlongitudinalcrackingmodelwillbedevelopedaspartoftheNCHRP1-52project.4.6.1 LongitudinalCracking–VerificationResultsFewstatisticswere reported in theverificationefforts conducted for the threeSHAsand theNortheasternstates.InthecaseofWashingtonState,nostatisticswerereported;however, itwasreportedthatthedefaultmodeltendedtounder-predictmeasuredvalues.InthestudyfortheNortheasternstates,theonlystatisticreportedwasSSE(58.18)forthenationallycalibratedmodel, which was shown to severely under-predict measured longitudinal cracking. Inverification efforts for the other two agencies, Iowa and Oregon, only Se was reported. ForIowa,itwasreportedthattheglobalmodelseverelyunder-predictedtheextentoflongitudinalcracking.4.6.2 LongitudinalCracking–CalibrationResultsAsaresultoftheverificationefforts,calibrationwasconductedinallfourstudies.Ofthefourstudies that carried out local calibration, only one varied all three coefficients, and theremaining three varied only C1 and C2. In theNortheastern states study, an improvement inlongitudinal cracking predictions was found through regional calibration exhibited by areductioninSSEfrom58.18to25.67.ForIowaandOregon,itwasreportedthatthepredictionsand bias after calibrationwere improved, but standard errorwas still large. Itwas indicatedthat for Washington, the calibrated model was able to reasonably estimate longitudinalcrackingandshowedthelevelandprogressionofcrackingagreedwithmeasuredvalues.Iowaattemptedavalidationofthelocallycalibratedmodel;however,theonlystatisticalparameterreported,Se,remainedmuchlargerthantheSedeterminedinthedevelopmentofthedefaultmodel.The Iowastudy recommended thatpredictionsof longitudinal cracking in theMEPDGshouldbeusedonlyforexperimentalorinformationalpurposesuntiltheongoingrefinementofthemodel is complete and it is fully implemented. In general, “improvements” in themodelpredictions were reported, but the lack of statistics or poor statistics presented make theassessmentofthecalibrationprocessdifficult.

49
Table 11 Summary of Verification and Calibration Results for the Longitudinal (Top-down)CrackingModel(4,13,15,19,23)
State C1 C2 C4 R2,% Se(ft/mile) N p-value
(pairedt-test)p-value
(intercept)p-value(slope)
GlobalModel 1 1 1,000 54.4 582.8 31
2 NR
VerificationResultsIA 7 3.5 1,000 NR 3,039 NR NRNEStates 7 3.5 1,000 NR NROR 7 3.5 1,000 NR 3,601 NR NRWA 7 3.5 1,000 NR NRCalibrationResultsIA-Cal. 0.82 1.18 1,000 NR 2,767 NR NRIA-Val. 0.82 1.18 1,000 NR 2,958 NR NRNEStates -1 2 1,856 NR NROR 1.453 0.097 1,000 NR 2,569 NR NRWA 6.42 3.596 1,000 NR NR5 SUMMARYANDCONCLUSIONS
ThisreportsummarizedevaluationsofthenationallycalibrateddistressmodelsintheMEPDGforthepurposeofconductinglocalcalibration.Theresultsofsuchlocalcalibrationeffortswerealsosummarized.Thenationallycalibratedtransfermodelsevaluatedincludedfatiguecracking,rutting,transversecracking,IRI,andlongitudinalcracking.TheGuidefortheLocalCalibrationoftheMEPDGdescribestherecommendedproceduresforverificationandlocalcalibrationofthenationallycalibrateddistressmodelsembeddedwithintheMEPDG(5).Forthisreport,verificationreferstotheprocessofpredictingdistressthroughtheMEPDGusingthenationallycalibratedmodelsalongwithproject-specific informationandthen comparing those predictions to measured values. These comparisons are necessary toevaluatetheaccuracyofthemodel,thespread,andwhetherbiasexists inthepredictions. Indoing so, it indicates whether a model’s prediction capabilities are acceptable or if a localcalibration is required. If local calibration is necessary, the results of the verification provideinsightintowhichcoefficientsshouldbefocusedontoimproveaccuracyand/orbias.The following can be summarized regarding the verification efforts for default nationallycalibratedmodelsfortheMEPDG:
• Forthemajorityofthestudiessummarizedherein,thefatigue(alligator)crackingmodelresulted in poor or inadequate estimates of measured values, with seven of the teneffortsrecommendinglocalcalibration.Additionally,thedefaultfatiguecrackingmodelcommonly showed bias with seven of the ten efforts reporting under-prediction ofobservedvalues.

50
• Alltwelvestudiesevaluatedthedefaultruttingmodels,andasaresult,localcalibrationofthetotalruttingmodelwasrecommendedinalltwelvestudies.Biasinthenationallycalibratedmodelwascommonlyobservedwiththemajorityreportingover-prediction.Onlytwostudiesreportedunder-predictionoftotalruttingwiththeglobalmodel.
• Inevaluatingthenationallycalibratedtransversecrackingmodel,morethanhalfofthestudiesconductednon-statisticalanalyses.Onestudywasnotabletoproperlyevaluatethemodeldue topossibleerrors inmeasuredvalues.Only threestudies reported themodelpredictionstobeadequate.Biaswasreportedinmorethanhalfofthestudies,andwasgenerallyintheformofunder-predictionoftransversecracking,althoughonestudydidfindthemodelover-predictedataLevel1designinsomecases.
• In verifying the nationally calibrated IRImodel, four studies utilized locally calibrateddistress models for inputs in the nationally calibrated model. Of these four studies,three found the predictions to be adequate, two of which reported adequatepredictions with only slight bias. The one study that found the predictions to beinadequatereportedsmallunder-predictionsofIRI.
• In theremaining IRIstudies,all fivestudies foundthepredictionstobe inadequateorpoor.Biaswas reported in fourof these fivestudies: twostudies reportedbias in theformofover-predictionsatlowmagnitudesandunder-predictionsathighmagnitudes,onestudyshowedunder-predictionsforhighermagnitudesofIRI,andonestudyfoundpavementroughnesstobeunder-predictedforrouteswithcumulativeESALsbetween0and4.5million.
• Thedefaultlongitudinalcrackingmodelwasfoundtoproduceinadequateestimatesinall fourof the studies summarizedherein. Three studies reportedunder-predictionoflongitudinalcracking,whileonestudyreportedconsiderableoverandunder-prediction.
While the AASHTO calibration guide details a step-by-step procedure for conducting localcalibration, the actual procedures utilized for calibration of the models to state-specificconditionsvaryfromagencytoagency.DifferencesinthecalibrationproceduresrelativetotheAASHTOcalibrationguidewereobserved:
• Minimumnumberof roadwaysegmentsnecessary toconduct the localcalibration foreachdistressmodelisprovidedintheAASHTOcalibrationguide;however,thestepforestimatingsamplesize forassessing thedistressmodelswasnotalways reported.Forthose efforts that did report a sample size, some were smaller than the minimumrecommended in the calibration guide. For example, the ruttingmodel for Tennesseewas calibrated utilizing 18 pavement segments, two less than the recommendedminimum of 20. Furthermore, as shown in the verification and calibration summarytables (Tables 5-11), the number of data points used in the evaluations were notreported inmanyof theefforts summarizedherein,making itdifficult toassess if theresultingstatisticalparametersaremeaningful.
• Typically,calibrationwasattemptedby lookingat thepredictedvaluesandassociatedmeasured distress for a collective set of roadway segments and reducing the errorbetweenmeasuredandpredictedvaluesbyoptimizingthelocalcalibrationcoefficients.However,otherapproachesweretaken.ForNorthCarolinaDOT,theglobalcalibration

51
coefficients in theruttingand fatiguecrackingmodelswererecalibrated for thestate,whilethematerial-specificcoefficientsfortheruttingandfatiguecrackingmodelswererecalibrated to better predict performance for the asphalt concretemixes commonlyusedinNorthCarolina.
• TheAASHTOcalibrationguiderecommendsconductingstatisticalanalysestodeterminegoodness of fit, spread of the data, as well as the presence of bias in the modelpredictions(5).Threehypothesistestsarerecommendedinthecalibrationguide:1)toassesstheslope,2)toassesstheinterceptofthemeasuredversuspredictedplot,and3)apairedt-testtodetermineifthemeasuredandpredictionspopulationsarestatisticallydifferent.Despite these recommendations, thenumberofhypothesis tests conductedvaried from all three to none, with many of the efforts relying on qualitativecomparisonsofmeasuredversuspredicteddistresses.
Thedifferencesnotedabovemaybedue,inpart,tothetimingofthepublicationrelativetotheinitiation of such efforts and the release of new versions of the software. The AASHTOcalibrationguidewaspublishedin2010;however,appendicesdetailingthemodelsembeddedwithintheMEPDGwerepublishedin2004aspartofthedraftFinalReport,andtheManualofPracticewaspublishedin2008.From2004topresent,thesoftwaresupportingtheMEPDGhasundergonemanyiterationsfromtheinitialversion(whichsawanumberofversionsbeforetherelease of the DarWIN ME software), to the current AASHTOWare Pavement ME Designsoftware, now in its second version. This presents challenges for state agencies, as localcalibration is a cumbersome and intensive process and the software and embedded distressmodelsareevolvingfasterthanlocalcalibrationcanbecompleted.The hypothesis testingmentioned is used to evaluate the level of bias in the existing globalmodelsastheyapplytostate-specificdataandthelevelofbiasinthelocallycalibratedmodels.Thesehypothesistestsincludetestsforbiasbythedeviationfromthelineofequalityinslope,and intercept. Additionally, the AASHTO calibration guide recommends a paired t-test todetermine if the populations are significantly different (5). However, few calibration effortssummarized in this report conducted such testing for bias. Rather, in those efforts that didevaluate bias, it was often qualitatively evaluated through visual examination of measuredversuspredictedplots.TheresultsofthecalibrationeffortsreviewedinthisreportaresummarizedforeachdistressmodelinTable12.Thetablealsodenotesthenumberofverification,calibration,andvalidationefforts conducted for each performance model and the state for which the efforts werecompleted.The ruttingmodelwas themost commonlycalibratedmodel.The transverseandlongitudinal crackingmodels were calibrated the least, with the longitudinal crackingmodelhavingasignificantspread.The main goal of local calibration is to improve model predictions by reducing bias andincreasingprecision.Thecoefficientofdetermination (R2)andstandarderrorof theestimate(Se) are typically used to assess precisionof themodel predictions. Comparing the Se andR2values for the locally calibratedmodelwith those valuesdetermined in verification (applying

52
the nationally calibrated model to state specific data) can be done to assess the relativeimprovement in model predictions. The R2 and Se associated with the development of thenationallycalibratedmodelsarealsoimportantbenchmarksthatshouldbeusedforassessingimprovement.ReasonableSevaluesforeachmodelhavebeensuggestedinpreviousliteratureandarelistedinTable2(3,5).Thesevaluesshouldbetakenintoconsiderationwhenevaluatingtheperformanceofthelocallycalibratedmodels.Generally,localcalibrationshouldresultinanincrease in the R2 value and a reduction in the Se value.With these guidelines inmind, thefollowingobservationsregardingthecalibrationstudiesweremade:
• OnlytwostudiesreportedR2priortoandafterlocalcalibrationforfatiguecracking.Inbothcases,applyingstate-specificdatatothenationallycalibratedmodelresultedinR2values below 27.5%, the R2 value reported in the development of the global fatiguemodel. For these two studies, a significant improvement in the R2 for the locallycalibrated model was noted. Despite these improvements, three of the four localcalibrationefforts resulted inSevaluesgreater thanthat found inthedevelopmentofthemodel,aswellasthe7%consideredreasonable.Thus,evenwith localcalibration,substantialspreadexistsinthosemodelpredictions.
• Opposite of the fatigue crackingmodel, results for the local calibration of the ruttingmodel showed that only one of the eight reported R2 values was greater than thatreported for thedevelopmentof theglobalmodel.However, threeof the fiveeffortsthatreportedanR2valueforboththeverificationandcalibrationeffortsshowedhigherR2 values for the local calibration results than the verification results, indicating thatsome level of relative improvement was found through local calibration. One effortindicated the globalmodel resulted in a “poor” goodness of fit and only 15% of thevariability in thedatawasexplainedby the locally calibratedmodel. For the ten localcalibrationeffortsconductedthatreportedSe,allbutoneeffortsawanimprovementinSe (Se was reduced). Six calibration efforts (including two efforts completed forTennessee)resultedinSevalueslessthanthereasonableSevalue(asshowninTable2)of0.10inches.
• Only two of the four local calibration attempts of the transverse cracking modelreportedR2values,bothweregreaterthanthatdeterminedinthedevelopmentofthemodelataLevel1analysis.DuetothelimitedR2valuesreportedforlocalcalibration,itis difficult to surmise the relative improvement experienced by conducting localcalibration. However, a Se value of 250 feet for the transverse cracking model isconsideredreasonable,andallthreeeffortsthatreportedSewerelessthan250feet.
• InlocallycalibratingtheIRImodel,onlythreeofthefiveeffortsreportedR2.AllthreeR2valueswerehigherforthelocalcalibrationmodelthantheapplicationofthenationallycalibratedmodel,indicatingarelativeimprovementinmodelaccuracy.Additionally,theSevalueforthe locallycalibratedmodelwasreported in fourefforts, revealingthat intwo cases the calibratedmodelwas lessprecise (an increase in Se).All butone studythatreportedSeresultedinreasonableprecision(Selessthan17in/mile).
• The only parameter (R2, bias, or Se) reported for the local calibration efforts of thelongitudinalcrackingmodelwasSe,anditwasonlyreportedfortwoofthefourefforts.Inbothcases,asignificantamountofspreadexistedinthecalibratedmodel,withbothfarexceeding600ft/mile,anSevaluethatisconsideredreasonable.

53
While the AASHTO calibration guide recommends a quantitative statistical analysis thatprovidesinsight intonotonlyaccuracy,butalsospreadandbiasofthepredictionsrelativetomeasuredvalues,predictioncapabilitywasinlargepartassessedwithqualitativedescriptions(5). Inmany cases inwhichqualitative analysiswas conducted, thedatawere inadequate toperform the recommended statistical analysis. For those efforts that did complete statisticalanalysis, thenumberofparameters thatwerereportedranged,and includedoneormoreofthe following:R2, Se, Se/Sy, SSE,orp-values for thehypothesis tests forbias.Goodnessof fit,characterizedbyR2,wasreportedinsomeoftheefforts.Generally,R2valueswerefoundtobelowwhentheglobalmodelswereappliedtostatedata,withthehighestR2valueof67%foundfortheIRImodel inthestudycompletedforUtah.While inmanycases itwas improvedovertheglobalmodels, theR2values (wherereported) for the locallycalibratedmodelswerealsorelatively low,with thehighestvalue reportedas82% for the locally calibrated IRImodel forArizona. However, due to the inconsistency in reporting for the statistical parameters it isdifficult to assess the quality of the predictions or effectiveness of local calibration for eachmodel.
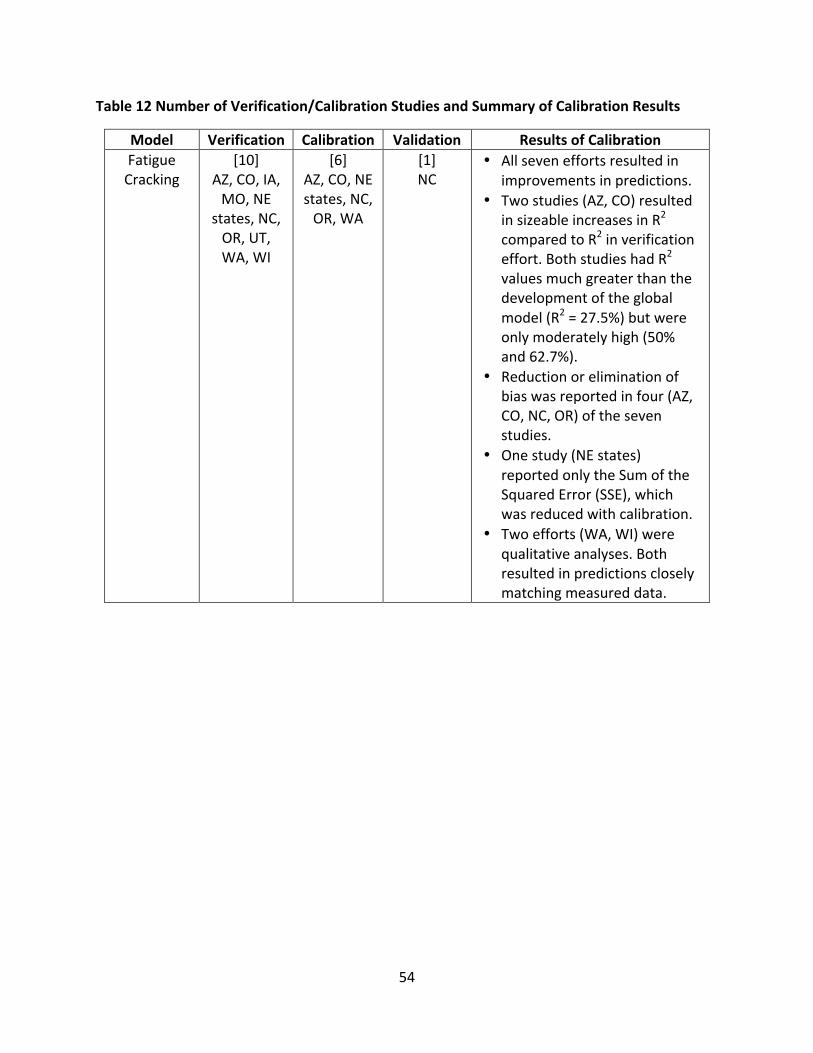
54
Table12NumberofVerification/CalibrationStudiesandSummaryofCalibrationResults
Model Verification Calibration Validation ResultsofCalibrationFatigueCracking
[10]AZ,CO,IA,MO,NE
states,NC,OR,UT,WA,WI
[6]AZ,CO,NEstates,NC,OR,WA
[1]NC
• Allseveneffortsresultedinimprovementsinpredictions.
• Twostudies(AZ,CO)resultedinsizeableincreasesinR2comparedtoR2inverificationeffort.BothstudieshadR2
valuesmuchgreaterthanthedevelopmentoftheglobalmodel(R2=27.5%)butwereonlymoderatelyhigh(50%and62.7%).
• Reductionoreliminationofbiaswasreportedinfour(AZ,CO,NC,OR)ofthesevenstudies.
• Onestudy(NEstates)reportedonlytheSumoftheSquaredError(SSE),whichwasreducedwithcalibration.
• Twoefforts(WA,WI)werequalitativeanalyses.Bothresultedinpredictionscloselymatchingmeasureddata.

55
Model Verification Calibration Validation ResultsofCalibrationTotalRutting
[12]AZ,CO,IA,MO,NE
states,NC,OH,OR,TN,UT,WA,WI
[12]AZ,CO,IA,MO,NE
states,NC,OH,OR,TN,UT,WA,WI
[2]IA,NC
• Generally,improvementsinpredictionswerereportedwithcalibratedmodels.
• Fourefforts(AZ,MO,NC,UT)resultedinanincreaseinR2.Twoefforts(CO,OH)sawdecreasesinR2.
• Overall,R2remainedlowfortheeffortsthatreportedit,rangingfrom14.4%to63%,withonlyonegreaterthantheR2(57.7%)reportedinthedevelopmentofthedefaultmodel.
• Eightstudies(AZ,IA,MO,NC,OH,OR,TN,UT)resultedinimprovementsinstandarderroroftheestimate,Se,whileonestudy(CO)resultedinanincreaseinSe.
• Eventhoughmostsawimprovementsinstandarderror,Seremainedgreaterthan0.107,theSeforthedevelopmentofthedefaultmodel,infourstudies(AZ,CO,NC,OR).
• Biaswaseliminatedorreducedinatleastsevenstudies(AZ,CO,IA,MO,NC,OR,UT)Oneeffort(OH)showedbiasremaineddespitecalibration.
• Fourefforts(NEstates,TN,WA,WI)didnotreportonbias,butallfourresultedinimprovementsinpredictions.

56
Model Verification Calibration Validation ResultsofCalibrationTransverseCracking
[10]AZ,CO,IA,MO,NE
states,OH,OR,UT,WA,WI
[5]AZ,CO,MO,OR,
WI
[0] • Twostudies(CO,MO)resultedinimprovementsinR2withbothvalues(43.1%and91%)greaterthantheR2reportedinthedevelopmentofthedefaultmodelataLevel1analysis(34.4%).
• Twocalibrationattempts(AZ,OR)wereunsuccessfulinimprovingtransversecrackingpredictions,andtherefore,werenotrecommendedforuse.
• Predictionswerereasonableforonestudy(CO)withtheeliminationofbias.Twostudies(MO,WI)resultedingoodpredictionswithslightbias.
IRI [10]AZ,CO,IA,MO,NE
states,OH,TN,UT,WA,
WI
[5]AZ,CO,MO,NE
states,OH,WI
[1]IA
• Generally,improvementsinIRIpredictionswererealizedwithlocallycalibratedmodels.
• Threeefforts(AZ,CO,OH)resultedinanimprovementinR2,rangingfrom64.4%to82.2%,allofwhichweregreaterthantheR2forthedevelopmentofthedefaultmodel(56%).
• OnlySSEwasreportedforonestudy(NEstates),whichindicatedanimprovementinpredictionswiththecalibratedmodel
• Biaswasremovedthroughthreeefforts(AZ,CO,WI),whilethebiasthatremainedintwoefforts(MO,OH)wasconsideredreasonable.
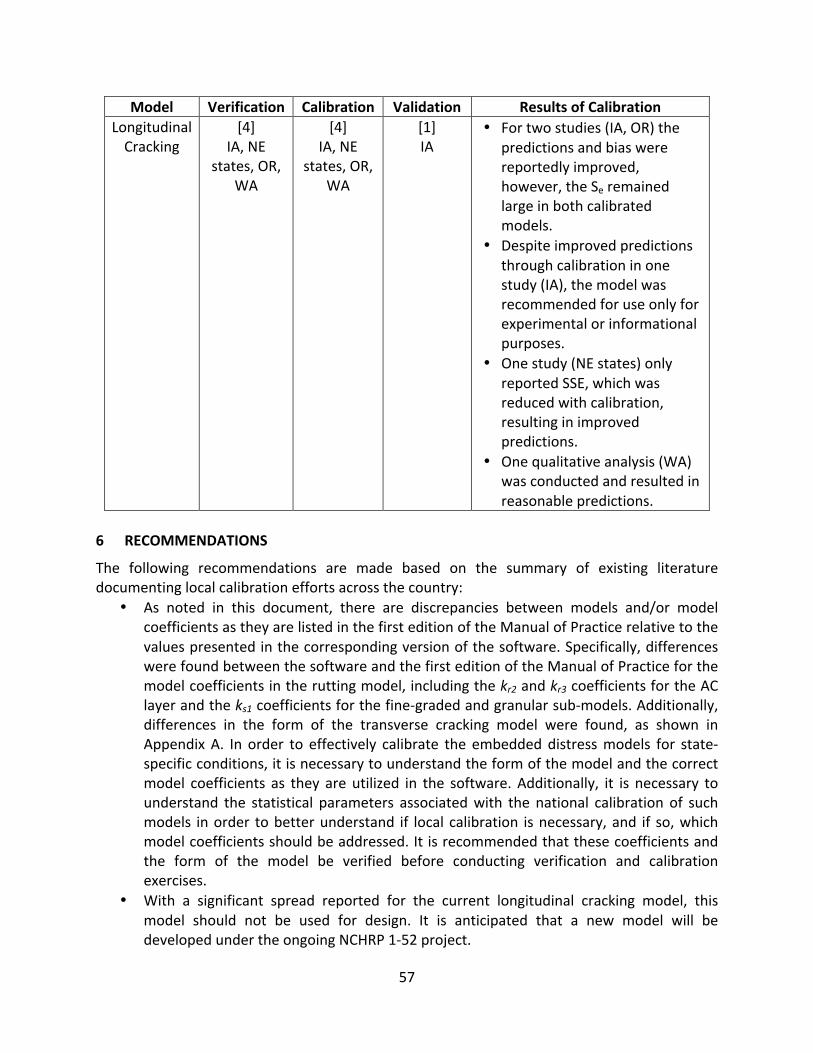
57
Model Verification Calibration Validation ResultsofCalibrationLongitudinalCracking
[4]IA,NE
states,OR,WA
[4]IA,NE
states,OR,WA
[1]IA
• Fortwostudies(IA,OR)thepredictionsandbiaswerereportedlyimproved,however,theSeremainedlargeinbothcalibratedmodels.
• Despiteimprovedpredictionsthroughcalibrationinonestudy(IA),themodelwasrecommendedforuseonlyforexperimentalorinformationalpurposes.
• Onestudy(NEstates)onlyreportedSSE,whichwasreducedwithcalibration,resultinginimprovedpredictions.
• Onequalitativeanalysis(WA)wasconductedandresultedinreasonablepredictions.
6 RECOMMENDATIONS
The following recommendations are made based on the summary of existing literaturedocumentinglocalcalibrationeffortsacrossthecountry:
• As noted in this document, there are discrepancies between models and/or modelcoefficientsastheyarelistedinthefirsteditionoftheManualofPracticerelativetothevaluespresentedinthecorrespondingversionofthesoftware.Specifically,differenceswerefoundbetweenthesoftwareandthefirsteditionoftheManualofPracticeforthemodelcoefficientsintheruttingmodel,includingthekr2andkr3coefficientsfortheAClayerandtheks1coefficientsforthefine-gradedandgranularsub-models.Additionally,differences in the form of the transverse cracking model were found, as shown inAppendixA. In order to effectively calibrate the embeddeddistressmodels for state-specificconditions,itisnecessarytounderstandtheformofthemodelandthecorrectmodel coefficients as they are utilized in the software.Additionally, it is necessary tounderstand the statistical parameters associatedwith the national calibration of suchmodels inorder tobetterunderstand if local calibration isnecessary,and if so,whichmodelcoefficientsshouldbeaddressed.Itisrecommendedthatthesecoefficientsandthe form of the model be verified before conducting verification and calibrationexercises.
• With a significant spread reported for the current longitudinal cracking model, thismodel should not be used for design. It is anticipated that a new model will bedevelopedundertheongoingNCHRP1-52project.

58
• AsrecommendedintheGuidefortheLocalCalibrationoftheMEPDG,themechanismofthedistress,particularly,fatiguecracking,shouldbeaccuratelyidentified.Inevaluatingandcalibratingcrackingmodels,itisimportanttodifferentiatebetweentop-downandbottom-upcrackinginmeasuredfieldperformance.
• The software continues to evolve, as noted above the form for at least one transferfunction has been revised in newer versions of the software. Future refinements oftransfermodels, such as the longitudinal crackingmodel, are expected. Furthermore,local calibration canbe a time consuming and intensive process, therefore an agencymayneedtoconsiderthe implicationsofconducting localcalibrationeffortswhiletheembeddedmodels and software continue to be refined. One approach agenciesmayconsideristoestimatethereturnoninvestmentofcalibratingeachperformancemodel.
• Although the calibration efforts for some agencies began prior to the publication ofAASHTO’s guide for local calibration, it is recommended that any future or on-goingcalibrationeffortsbecompletedinaccordancewiththecurrentAASHTOGuidefortheLocalCalibrationoftheMEPDG.WithaconsistentprocessbeingutilizedamongSHAs,amore complete evaluation of pavement performance could be conducted on thenationallevel.
o Althoughitwasnotconductedinthedevelopmentofthetransfermodels(5)orexplicitly stated in the calibrationefforts reviewed for this report, it shouldbenotedthatforensicinvestigationsarenecessarytoadequatelyidentifythetypeand location of distress within the pavement structure. The Guide for LocalCalibrationoftheMEPDGaddressesthisinStep6ofthestep-by-stepprocedureinwhichforensicinvestigations,suchascoring,andtrenching,aresuggested.
• Conductingstatisticalanalysesasoutlined intheGuidefortheLocalCalibrationoftheMEPDG is recommended, such analyses enable a quantitative assessment of thecalibrationresults.Specifically,theparametershelptodetermineiflocalcalibrationhasreducedbiasand improvedprecision,aswellasanyweaknessesthatmayexist in themodelthatmustbeconsideredduringthedesignprocess.
59
REFERENCES
1. AASHTO Guide for Design of Pavement Structures. American Association of State andHighwayTransportationOfficials,WashingtonD.C.,1993.
2. ARA, Inc., ERES Consultants Division.Guide forMechanistic-Empirical Design of New andRehabilitated Pavement Structures. Final report, NCHRP Project 1-37A. TransportationResearch Board of the National Academies, Washington, D.C., 2004.http://www.trb.org/mepdg/guide.htm
3. Pierce,L.M.andG.McGovern.NCHRPSynthesisReport457:ImplementationoftheAASHTOMechanistic-Empirical Pavement Design Guide and Software. TRB, National ResearchCouncil,Washington,D.C.,2014,pp.81.
4. Mechanistic-Empirical Pavement Design Guide, Interim Edition: A Manual of Practice.AASHTO,Washington,D.C.,2008.
5. Guide for the Local Calibration of the Mechanistic-Empirical Pavement Design Guide.AASHTO,Washington,D.C.,2010.
6. FHWA.TPF-5(178):ImplementationoftheAsphaltMixturePerformanceTester(AMPT)forSuperpave Validation. http://www.pooledfund.org/details/study/405. Accessed May 13,2013.
7. FHWA.DGITWorkshopsandTraining:AASHTOWarePavementMEDesignWebinarSeries.http://www.fhwa.dot.gov/pavement/dgit/dgitwork.cfm#nhi.AccessedMay13,2013.
8. Carvalho, R. and C. Schwartz. Comparisons of Flexible Pavement Designs: AASHTOEmpirical Versus NCHRP Project 1-37AMechanistic-Empirical. In Transportation ResearchRecord: Journal of the Transportation Research Board, No. 1947, TRB, National ResearchCouncil,Washington,D.C.,2006,pp.167-174.
9. Timm, D., X. Guo,M. Robbins, and C.Wagner.M-E Calibration Studies at the NCATTestTrack.AsphaltPavementMagazine,Vol.17,No.5,NationalAsphaltPavementAssociation,2012,pp.45-51.
10. Darter,M.I.,L.Titus-Glover,H.VonQuintus,B.Bhattacharya,andJ.Mallela.CalibrationandImplementationoftheAASHTOMechanistic-EmpiricalPavementDesignGuideinArizona.ReportFHWA-AZ-14-606,ArizonaDepartmentofTransportation,Phoenix,Ariz.,2014.
11. Mallela,J.,L.Titus-Glover,S.Sadasivam,B.Bhattacharya,M.Darter,andH.VonQuintus.ImplementationoftheAASHTOMechanisticEmpiricalPavementDesignGuideforColorado.ReportCDOT-2013-4,ColoradoDepartmentofTransportation,Denver,Colo.,2013.
12. Ceylan,H.,S.Kim,K.Gopalakrishnan,andO.Smadi.MEPDGWorkPlanTaskNo.8:ValidationofPavementPerformanceCurvesfortheMechanistic-EmpiricalPavementDesignGuide.CTREProject06-274FinalReport,CenterforTransportationResearchandEducation,IowaStateUniversity,Ames,Iowa,2009.
13. Ceylan,H.,S.Kim,K.Gopalakrishnan,andD.Ma. IowaCalibrationofMEPDGPerformancePrediction Models. InTrans Project 11-401, Institute for Transportation, Iowa StateUniversity,Ames,Iowa,2013.
14. Mallela,J.,L.Titus-Glover,H.VonQuintus,M.Darter,M.Stanley,C.Rao,andS.Sadasivam.ImplementingtheAASHTOMechanisticEmpiricalPavementDesignGuideinMissouri,Vol.1

60
StudyFindings,ConclusionsandRecommendations.MissouriDepartmentofTransportation,JeffersonCity,Mo.,2009.
15. Momin,S.A.LocalCalibrationofMechanisticEmpiricalPavementDesignGuideforNorthEasternUnitedStates.MSthesis.UniversityofTexasatArlington,2011.
16. Muthadi,N.R.andY.R.Kim.LocalCalibrationofMechanistic-EmpiricalPavementDesignGuideforFlexiblePavementDesign.InTransportationResearchRecord:JournaloftheTransportationResearchBoard,No.2087,TransportationResearchBoardoftheNationalAcademies,Washington,D.C.,2008,pp.131-141.
17. Kim,Y.R.,F.M.Jadoun,T.Hou,andN.Muthadi.LocalCalibrationoftheMEPDGforFlexiblePavementDesign.FinalReport,FHWA-NC-2007-07,NorthCarolinaDepartmentofTransportation,Raleigh,N.C.,2011.
18. Glover,L.TandJ.Mallela.GuidelinesforImplementingNCHRP1-37AM-EDesignProceduresinOhio:Volume4–MEPDGModelsValidationandRecalibration.FinalReport:FHWA/OH-2009/9D,OhioDepartmentofTransportation,Columbus,Ohio,2009.
19. Williams,C.andR.Shaidur.Mechanistic-EmpiricalPavementDesignGuideCalibrationForPavementRehabilitation.ReportFHWA-OR-RD-13-10,OregonDepartmentofTransportation,Salem,Ore.andFederalHighwayAdministration,WashingtonD.C.,2013.
20. Zhou,C.InvestigationintoKeyParametersandLocalCalibrationonMEPDG.PhDdissertation.UniversityofTennessee,Knoxville,2013.
21. Darter,M.I.,L.T.Glover,andH.L.VonQuintus.DraftUser'sGuideforUDOTMechanistic-EmpiricalPavementDesignGuide.ReportUT-09.11a,UtahDepartmentofTransportation,SaltLakeCity,Utah,2009.
22. Titus-Glover,L.,B.Bhattacharya,H.VonQuintus,andM.Darter.UtahRecalibrationofFlexiblePavementRuttingModelAASHTOMEDesignProcedure.UtahDepartmentofTransportation,SaltLakeCity,Utah,2013.
23. Li,J.,L.M.Pierce,andJ.Uhlmeyer.CalibrationofFlexiblePavementinMechanistic-EmpiricalPavementDesignGuideforWashingtonState.InTransportationResearchRecord:JournaloftheTransportationResearchBoard,No.2095,TransportationResearchBoardoftheNationalAcademies,Washington,D.C,2009,pp.73–83.
24. Mallela,J.,L.Titus-Glover,H.VonQuintus,M.Darter,F.Fang,andH.Bahia.ImplementationoftheMechanistic-EmpiricalPavementDesignGuideinWisconsin.FinalReport,WisconsinDepartmentofTransportation,Madison,WI,2009.
25. Mallela,J.,L.Titus-Glover,andB.Bhattacharya.AASHTOPavementMEDesignUserManualforWisconsin.DraftUserManual,ARA,Champaign,Ill.,2014.
26. Darter,M.I.,J.Mallela,L.Titus-Glover,C.Rao,G.Larson,A.Gotlif,H.VonQuintus,L.Khazanovich,M.Witczak,M.El-Basyouny,S.El-Badawy,A.Zborowski,andC.Zapata.ChangestotheMechanistic-EmpiricalPavementDesignGuideSoftwareThroughVersion0.900,July2006.NCHRPResearchResultsDigest308,TransportationResearchBoard,Washington,D.C.,2006.
27. Mallela,J.,L.Titus-Glover,H.VonQuintus,M.Stanley,andC.Rao.ImplementingtheAASHTOMechanistic-EmpiricalPavementDesignGuideinMissouri,VolumeII:MEPDGModelValidationandCalibration.MissouriDepartmentofTransportation,JeffersonCity,MO,2009.
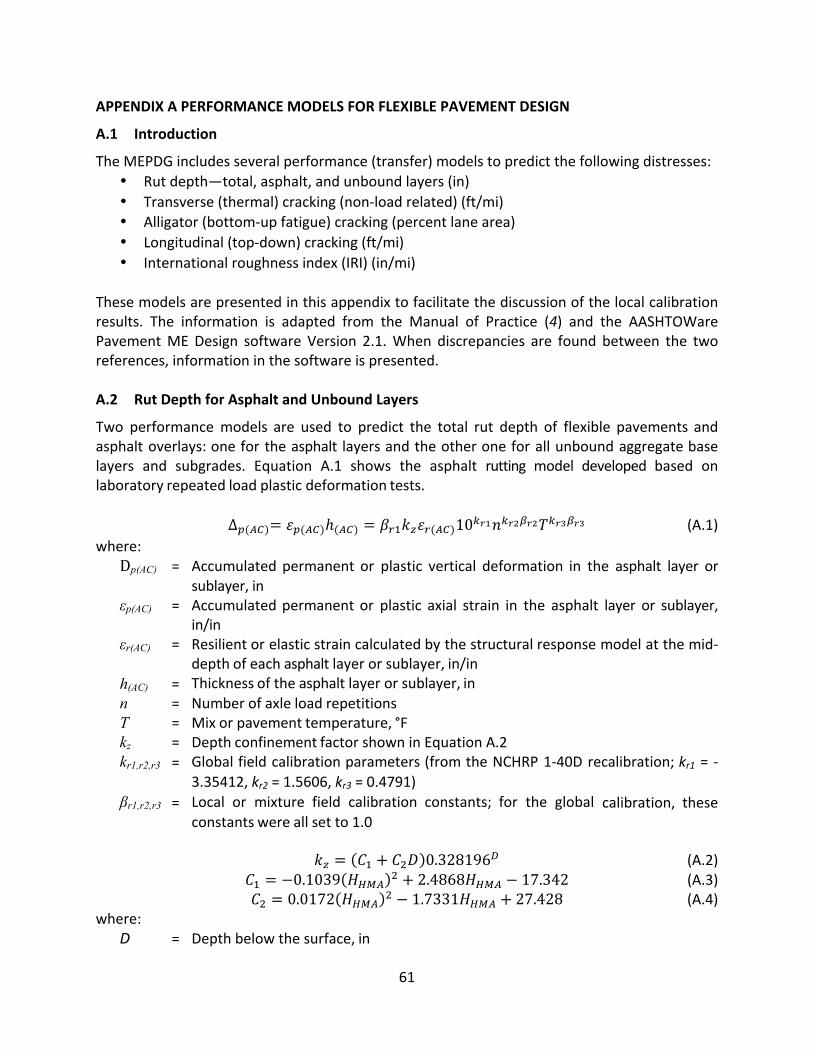
61
APPENDIXAPERFORMANCEMODELSFORFLEXIBLEPAVEMENTDESIGN
A.1 Introduction
TheMEPDGincludesseveralperformance(transfer)modelstopredictthefollowingdistresses:• Rutdepth—total,asphalt,andunboundlayers(in)• Transverse(thermal)cracking(non-loadrelated)(ft/mi)• Alligator(bottom-upfatigue)cracking(percentlanearea)• Longitudinal(top-down)cracking(ft/mi)• Internationalroughnessindex(IRI)(in/mi)
Thesemodelsarepresentedinthisappendixtofacilitatethediscussionofthelocalcalibrationresults. The information is adapted from the Manual of Practice (4) and the AASHTOWarePavementMEDesign software Version 2.1.When discrepancies are found between the tworeferences,informationinthesoftwareispresented.A.2 RutDepthforAsphaltandUnboundLayers
Two performancemodels are used to predict the total rut depth of flexible pavements andasphaltoverlays:onefortheasphalt layersandtheotheroneforallunboundaggregatebaselayers and subgrades. Equation A.1 shows the asphalt rutting model developed based onlaboratoryrepeatedloadplasticdeformationtests. ∆!(!")= !!(!")ℎ(!") = !!!!!!!(!")10!!!!!!!!!!!!!!!!! (A.1)where: Dp(AC) = Accumulatedpermanent or plastic vertical deformation in the asphalt layer or
sublayer,in εp(AC) = Accumulatedpermanentor plastic axial strain in the asphalt layer or sublayer,
in/in εr(AC) = Resilientorelasticstraincalculatedbythestructuralresponsemodelatthemid-
depthofeachasphaltlayerorsublayer,in/in h(AC) = Thicknessoftheasphaltlayerorsublayer,in n = Numberofaxleloadrepetitions T = Mixorpavementtemperature,°F kz = DepthconfinementfactorshowninEquationA.2 kr1,r2,r3 = Globalfieldcalibrationparameters(fromtheNCHRP1-40Drecalibration;kr1 =-
3.35412,kr2=1.5606,kr3=0.4791) βr1,r2,r3 = Local or mixture field calibration constants; for the global calibration, these
constantswereallsetto1.0 !! = !! + !!! 0.328196! (A.2) !! = −0.1039 !!"# ! + 2.4868!!"# − 17.342 (A.3) !! = 0.0172 !!"# ! − 1.7331!!"# + 27.428 (A.4)where: D = Depthbelowthesurface,in
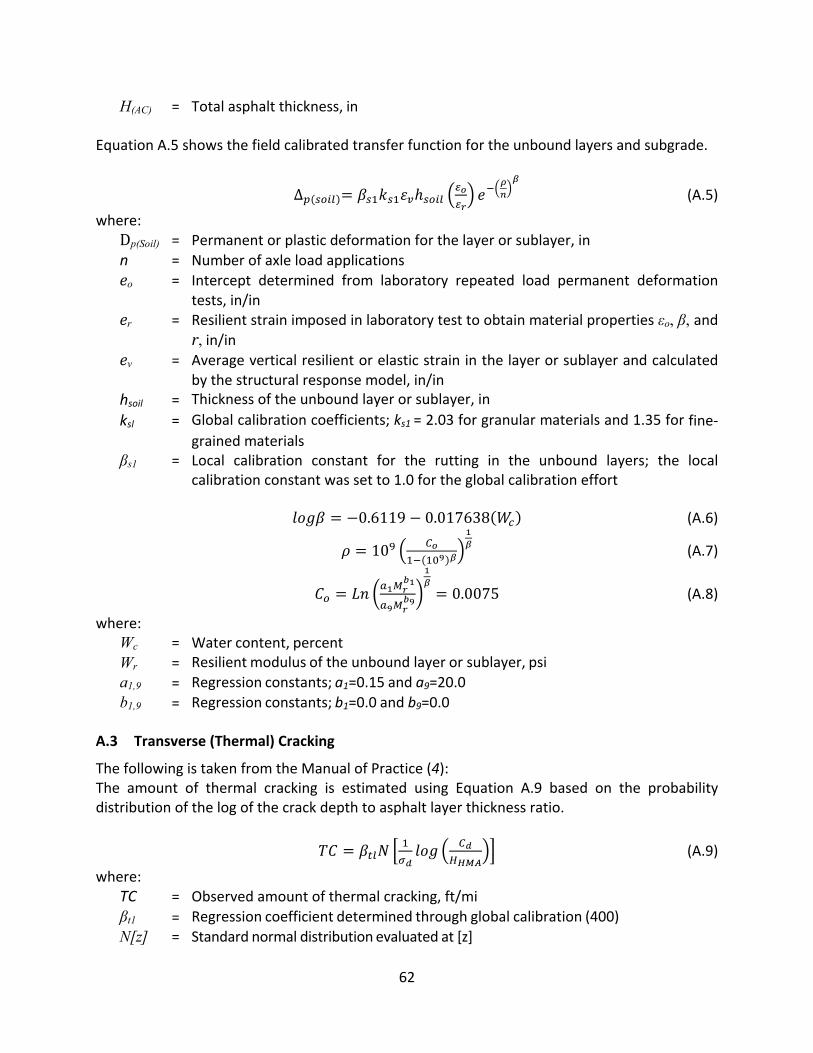
62
H(AC) = Totalasphaltthickness,inEquationA.5showsthefieldcalibratedtransferfunctionfortheunboundlayersandsubgrade.
∆! !"#$ = !!!!!!!!ℎ!"#$ !!!!
!!!!! (A.5)
where: Dp(Soil) = Permanentorplasticdeformationforthelayerorsublayer,in n = Numberofaxleloadapplications eo = Intercept determined from laboratory repeated load permanent deformation
tests,in/in er = Resilientstrainimposedinlaboratorytesttoobtainmaterialproperties εo, β, and
r, in/in ev = Averageverticalresilientorelasticstraininthelayerorsublayerandcalculated
bythestructuralresponsemodel,in/in hsoil = Thicknessoftheunboundlayerorsublayer,in ksl = Globalcalibrationcoefficients;ks1=2.03forgranularmaterialsand1.35forfine-
grainedmaterials βs1 = Local calibration constant for the rutting in the unbound layers; the local
calibrationconstantwassetto1.0fortheglobalcalibrationeffort !"#$ = −0.6119− 0.017638 !! (A.6)
! = 10! !!!! !"! !
!! (A.7)
!! = !" !!!!!!
!!!!!!
!! = 0.0075 (A.8)
where: Wc = Watercontent,percent Wr = Resilientmodulusoftheunboundlayerorsublayer,psi a1,9 = Regressionconstants;a1=0.15anda9=20.0 b1,9 = Regressionconstants;b1=0.0andb9=0.0 A.3 Transverse(Thermal)Cracking
ThefollowingistakenfromtheManualofPractice(4):The amount of thermal cracking is estimated using Equation A.9 based on the probabilitydistributionofthelogofthecrackdepthtoasphaltlayerthicknessratio. !" = !!"! !
!!!"# !!
!!"# (A.9)
where: TC = Observedamountofthermalcracking,ft/mi βt1 = Regressioncoefficientdeterminedthroughglobalcalibration(400) N[z] = Standardnormaldistributionevaluatedat[z]

63
σd = Standarddeviationofthelogofthedepthofcracksinthepavement(0.769),in Cd = Crackdepth,in HHMA = Thicknessofasphaltconcretelayers,inThecrackdepth(Cd)inducedbyagiventhermalcoolingcycleisestimatedusingtheParislawofcrackpropagation,asshowninEquationA.9. ∆! = ! ∆! ! (A.9)where: DC = Changeinthecrackdepthduetoacoolingcycle DK = Changeinthestressintensityfactorduetoacoolingcycle A,n = FractureparametersfortheHMAmixture,whichareobtainedfromtheindirect
tensilecreep-complianceandstrengthoftheasphaltmixtureusingEquationA.10 ! = 10!!!! !.!"#!!.!"!"# !!"!!! (A.10)where: ! = 0.8 1+ !
! kt = Coefficientdeterminedthroughglobalcalibrationforeachinputlevel (Level1=5.0;Level2=3.0;andLevel3=1.5) EAC = Asphaltconcreteindirecttensilemodulus,psi sm = Mixturetensilestrength,psi m = M-valuederivedfromtheindirecttensilecreepcompliancecurve βt = Localormixturecalibrationfactor(setto1.0)Thestressintensityfactor,K,isdeterminedusingEquationA.11. ! = !!"# 0.45+ 1.99 !! !.!" (A.11)where: s tip = Far-fieldstressfrompavementresponsemodelatdepthofcracktip,psi Co = Currentcracklength,ftThe following equations for transverse (thermal) cracking are according to theAASHTOWarePavementMEDesignsoftwareVersion2.1:
!! = 400×!!"# !
!!"! (A.12)
where: Cf = Observedamountofthermalcracking,(ft/500ft) N[z] = Standardnormaldistributionevaluatedat[z] C = Crackdepth,in hac = Thicknessofasphaltconcretelayers,in σ = Standarddeviationofthelogofthedepthofcracksinthepavements
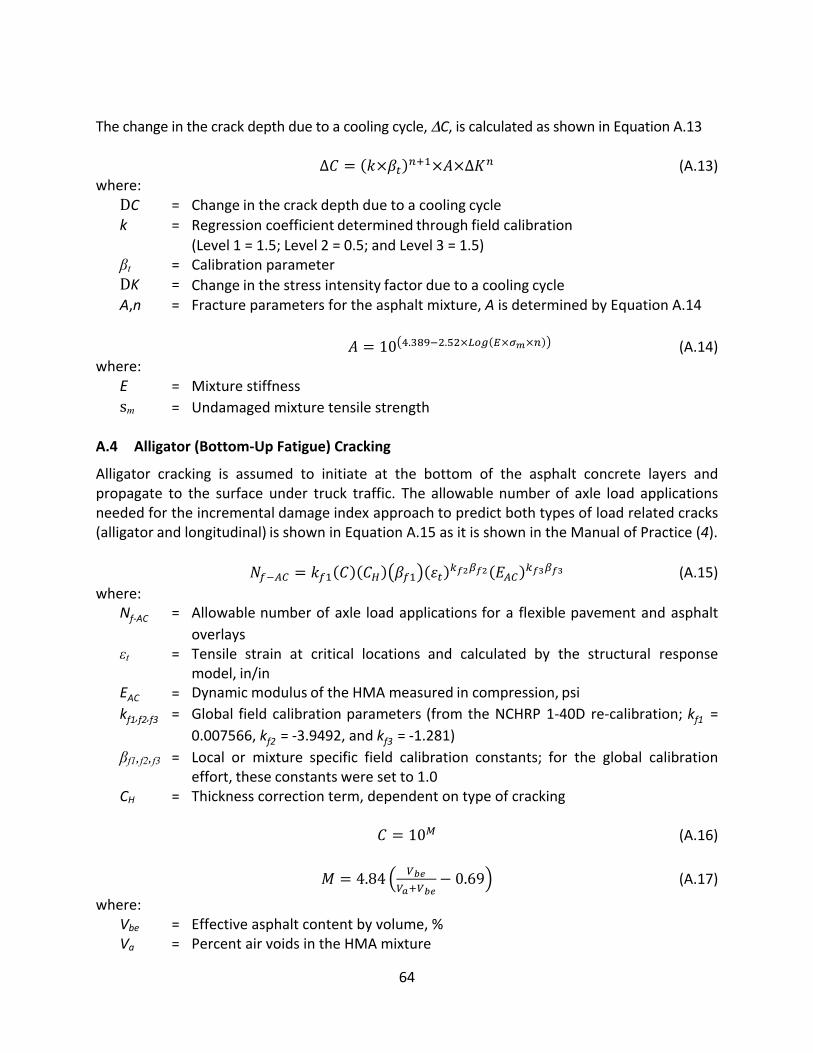
64
Thechangeinthecrackdepthduetoacoolingcycle,ΔC,iscalculatedasshowninEquationA.13 ∆! = !×!! !!!×!×∆!! (A.13)where: DC = Changeinthecrackdepthduetoacoolingcycle k = Regressioncoefficientdeterminedthroughfieldcalibration (Level1=1.5;Level2=0.5;andLevel3=1.5) βt = Calibrationparameter DK = Changeinthestressintensityfactorduetoacoolingcycle A,n = Fractureparametersfortheasphaltmixture,AisdeterminedbyEquationA.14
! = 10 !.!"#!!.!"×!"# !×!!×! (A.14)where: E = Mixturestiffness sm = UndamagedmixturetensilestrengthA.4 Alligator(Bottom-UpFatigue)Cracking
Alligator cracking is assumed to initiate at the bottom of the asphalt concrete layers andpropagate to the surface under truck traffic. The allowablenumberof axle load applicationsneededfortheincrementaldamageindexapproachtopredictbothtypesofloadrelatedcracks(alligatorandlongitudinal)isshowninEquationA.15asitisshownintheManualofPractice(4). !!!!" = !!! ! !! !!! !! !!!!!! !!" !!!!!! (A.15)where: Nf-AC = Allowablenumberofaxle loadapplicationsfora flexiblepavementandasphalt
overlays εt = Tensile strain at critical locations and calculated by the structural response
model,in/in EAC = DynamicmodulusoftheHMAmeasuredincompression,psi kf1,f2,f3 = Global fieldcalibrationparameters(fromtheNCHRP1-40D re-calibration;kf1 =
0.007566,kf2=-3.9492,andkf3=-1.281) βf1,f2,f3 = Local or mixture specific field calibration constants; for the global calibration
effort,theseconstantsweresetto1.0CH = Thicknesscorrectionterm,dependentontypeofcracking
! = 10! (A.16)
! = 4.84 !!"!!!!!"
− 0.69 (A.17)
where: Vbe = Effectiveasphaltcontentbyvolume,% Va = PercentairvoidsintheHMAmixture
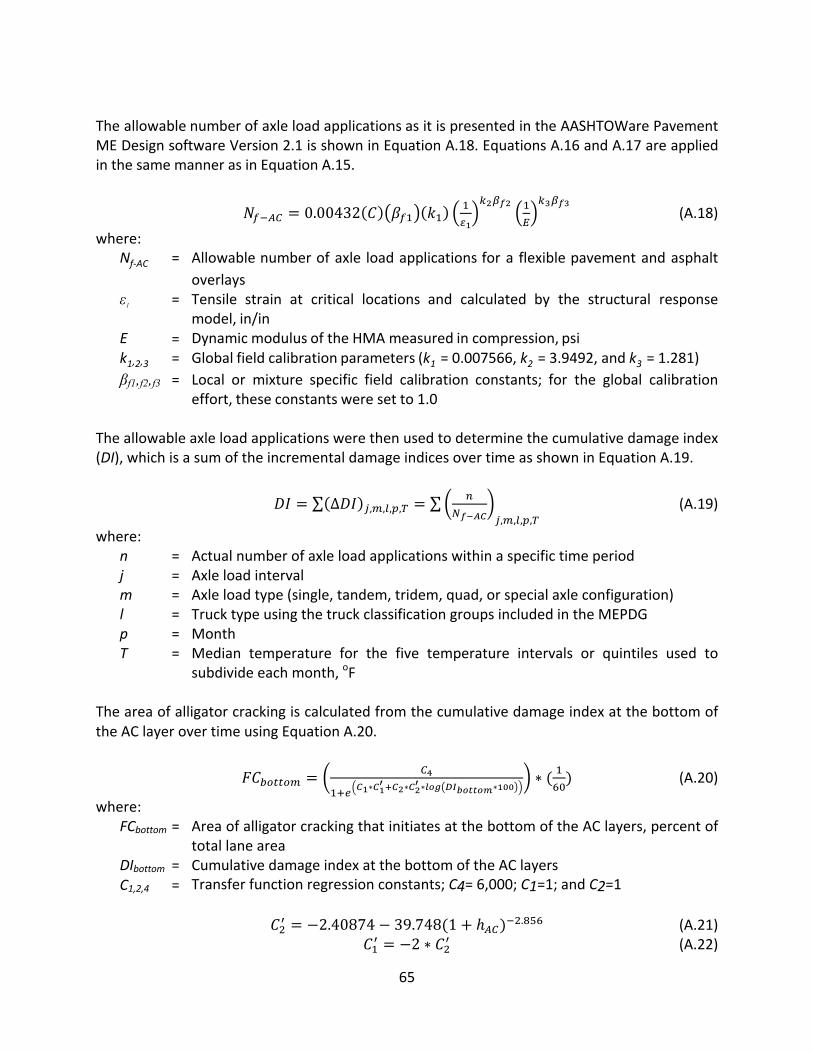
65
TheallowablenumberofaxleloadapplicationsasitispresentedintheAASHTOWarePavementMEDesignsoftwareVersion2.1isshowninEquationA.18.EquationsA.16andA.17areappliedinthesamemannerasinEquationA.15.
!!!!" = 0.00432 ! !!! !! !!!
!!!!! !!
!!!!! (A.18)
where: Nf-AC = Allowablenumberofaxle loadapplicationsfora flexiblepavementandasphalt
overlays ε1 = Tensile strain at critical locations and calculated by the structural response
model,in/in E = DynamicmodulusoftheHMAmeasuredincompression,psi k1,2,3 = Globalfieldcalibrationparameters(k1=0.007566,k2=3.9492,andk3=1.281) βf1,f2,f3 = Local or mixture specific field calibration constants; for the global calibration
effort,theseconstantsweresetto1.0Theallowableaxleloadapplicationswerethenusedtodeterminethecumulativedamageindex(DI),whichisasumoftheincrementaldamageindicesovertimeasshowninEquationA.19.
!" = ∆!" !,!,!,!,! = !!!!!" !,!,!,!,!
(A.19)
where: n = Actualnumberofaxleloadapplicationswithinaspecifictimeperiod j = Axleloadinterval m = Axleloadtype(single,tandem,tridem,quad,orspecialaxleconfiguration) l = TrucktypeusingthetruckclassificationgroupsincludedintheMEPDG p = Month T = Median temperature for the five temperature intervals or quintiles used to
subdivideeachmonth,oFTheareaofalligatorcrackingiscalculatedfromthecumulativedamageindexatthebottomoftheAClayerovertimeusingEquationA.20.
!"!"##"$ = !!!!! !!∗!!!!!!∗!!! ∗!"# !"!"##"$∗!"" ∗ ( !!") (A.20)
where: FCbottom= AreaofalligatorcrackingthatinitiatesatthebottomoftheAClayers,percentof
totallanearea DIbottom= CumulativedamageindexatthebottomoftheAClayers C1,2,4 = Transferfunctionregressionconstants;C4=6,000;C1=1;andC2=1 !!! = −2.40874− 39.748(1+ ℎ!")!!.!"# (A.21) !!! = −2 ∗ !!! (A.22)
66
where: hAC = totalthicknessofasphaltlayer,inA.5 Longitudinal(Top-Down)Cracking
Longitudinal cracks are assumed to initiate at the surface and propagate downward. TheManualofPracticeusesEquationsA.15andA.19tocalculatetheallowablenumberofaxleloadapplications and cumulative damage index for fatigue and longitudinal cracks. TheAASHTOWarePavementMEDesign softwareVersion2.1usesA.18 andA.19 to calculate theallowable number of axle load applications and cumulative damage index for fatigue andlongitudinalcracks.ThelengthoflongitudinalcrackingisthendeterminedusingEquationA.23.
!"!"# = !!
!!! !!!!!∗!"# !"!"#∗ 10.56 (A.23)
where: FCtop = Lengthoflongitudinalcrackingthatinitiatesatthesurface,in DItop = Cumulativedamageindexatthesurface,percent C1,2,4 = Transferfunctionregressionconstants;C4=1,000;C1=7;andC2=3.5A.6 InternationalRoughnessIndex(IRI)
TheMEPDG uses Equation A.24 to predict IRI over time for AC pavements. This regressionequationwasdevelopedbasedondatafromtheLTPPprogram. !"! = !"!! + !! !" + !! !"!"#$% + !! !" + !!(!") (A.24)where: IRI0 = InitialIRIafterconstruction,in/mi RD = Averagerutdepth,in FCTotal = Total area of load-related cracking (combined alligator, longitudinal, and
reflectioncrackinginthewheelpath),percentofwheelpatharea TC = Length of transverse cracking (including the reflection of transverse cracks in
existingHMApavements),ft/miC1,2,3,4 = Regressionconstants;C1=40;C2=0.4;C3=0.008;C4=0.015 SF = Sitefactor(EquationA.25) !" = !"#$%ℎ + !"#$$% ∗ !"#!.! (A.25)where: IRI0 = InitialIRIafterconstruction,in/mi Age = pavementage,year !"#$%ℎ = !"[ !"#$%& + 1 ∗ !"#$% ∗ (!" + 1)] (A.26) !"#$$% = !"[ !"#$%& + 1 ∗ !"#$ ∗ (!" + 1)] (A.27) !"#$% = !!"#$ + !"#$ (A.28)

67
where: PI = subgradesoilplasticityindex,percent Precip = averageannualprecipitationorrainfall,in

68
APPENDIXBSUMMARYOFCALIBRATIONMETHODOLOGIES
B.1 MethodologyusedinEffortsforArizona(10)
1. DARWinME(versionnotstated)2. Materialproperties
a. AsphaltmaterialsincludedconventionalandSuperpavemixes.HMAthicknessesincluded:<8inand≥8in.
b. Basematerialstypicallyincludedgranularmaterials(A-1andA-2);subgradetypicallyincludedcoarsegrainedmaterial(A-1throughA-3)
c. HMAdynamicmodulusLevel2d. HMAcreepcomplianceLevel1e. IndirecttensilestrengthLevel3f. EffectivebindercontentLevel3g. HMAcoefficientofthermalcontractionLevel2and3h. Basetype/ModulusLevel2i. SubgradetypeLevel1
3. Pavementsectionsincluded:newpavements(AC/granular,thinAC/JPCP)andrehabilitated(AC/ACandAC/JPCP)
4. Climatelocationsincluded:northern,central,andsouthernregionsofthestatewithlowandhighelevations.
B.2 MethodologyusedinEffortsforColorado(11)
1. Version1.0oftheMEPDG(Reportdate:July2013)2. MaterialpropertieshierarchicalinputlevelsforMEPDGcalibration:
a. HMAdynamicmodulusLevel2(Computedusingmaterialgradation,airvoid,bindertype,etc.data)
b. HMAcreepcompliance&indirecttensilestrengthLevel2(Computedusingmaterialgradation,airvoid,bindertype,etc.data)
c. VolumetricpropertiesLevel3(CDOTdefaults)d. HMAcoefficientofthermalcontractionLevel3(MEPDGdefaults)e. UnitweightLevel3(MEPDGdefaults)f. Poisson’sratioLevel3(MEPDGdefaults)g. Otherthermalproperties;conductivity,heatcapacity,surfaceabsorptivityLevel
3(MEPDGdefaults)3. AvarietyofnewandoverlayHMAsectionswereusedformodelcalibration:
a. HMAthicknessesincluded:lessthan4inches;thicknessesbetween4and8inchesandgreaterthan8incheswithmostsectionslessthan8inchesthick.
b. Bindertype:neatandmodifiedc. Climatezones:hot/moderate,cool,andverycool.
4. CalibrationoftheMEPDGglobalmodelswasdoneusingnonlinearmodeloptimizationtools(SASstatisticalsoftware).

69
5. ThecriteriathatwereusedfordeterminingmodelsadequacyforColoradoconditionsispresentedinTableB.1.
TableB.1CriteriaforDeterminingModelsAdequacyforColoradoConditions(11)
Criterion TestStatistics R2Range/ModelSEE Rating
GoodnessofFit
R2,percent(forallmodels)
81-100 VeryGood64-81 Good49-64 Fair<49 Poor
GlobalHMAAlligatorCrackingmodelSEE
<5percent Good5-10percent Fair>10percent Poor
GlobalHMATotalRuttingmodelSEE
<0.1in Good0.1-0.2in Fair>0.2in Poor
GlobalHMAIRIModelSEE<19in/mi Good19-38in/mi Fair>38in/mi Poor
Bias
Hypothesistesting-SlopeofLinearmeasuredvs.PredictedDistress/IRIModel(b1=slope)H0:b1=0
p-value Rejectifp-value<0.05
Pairedt-testbetweenmeasuredandpredicteddistress/IRI
P-value Reject if p-value is<0.05
B.3 MethodologyusedinEffortsforIowa
1. InitialverificationoftheHMAperformancemodelswasconductedin2009usingMEPDG
Version1.0(12).a. Level3analysestoevaluatetheMEPDGgloballycalibratedperformancefor
Iowaconditionsbasedonstatisticalmeasureswereconducted.b. Performancepredictionswerecomparedwithactualperformancedataforthe
fiveHMAsectionsusedfortheverificationstudy.PerformancepredictionsevaluatedincludedruttingandIRI.AlligatorandtransversecrackingwerenotincludedduetothedifferenceinmeasurementsofthesedistressesbyIowaDOTandtheunitofmeasurementusedintheMEPDG.Longitudinalcrackingwasexcludedduetolackofaccuracyinthepredictions,asfoundintheirliteraturereview.
c. Apairedt-testwasusedtocheckforbiasbetweenpredictionsfromthegloballycalibratedperformancemodelsandmeasureddistressvalues.

70
d. BiaswasreportedforruttingandIRI,althoughtherewasgoodagreementbetweenactualIRImeasurementsandIRIpredictions.
2. LocalcalibrationwasperformedusingtheMEPDGVersion1.13. Procedureusedforlocalcalibration(13):
a. Selecttypicalpavementsectionsaroundthestate.b. Identifyavailablesourcestogatherinputdataanddeterminehierarchicalinput
level.c. Prepareinputdatafromavailablesources:IowaDOTPMIS,materialtesting
records,designdatabase,andpreviousresearchreportsrelativetoMEPDGimplementationinIowa.
d. Assesslocalbiasassociatedwithnationalcalibrationfactors.e. Determinelocalcalibrationfactorsbyconductingsensitivityanalysisand
optimizationofcalibrationcoefficients.f. Determinetheadequacyoflocalcalibrationfactors.
4. Atotalof35representativeHMAsectionswerechosenforthelocalcalibrationeffort,oneofwhichwasanIowaLTPPsection(13).
5. ForHMAmaterialproperties,inputsnecessaryfortheMEPDGweretakenfromanIowaDOTmixdesigndatabase.Forsectionswherethemixdesigninformationwasnotavailable,LTPPBindwasusedtodeterminetheasphaltbindergrade,andtypicalaggregategradationbasedonaverageHMAaggregategradationsintheIowaDOTmixdesigndatabasewasused(13).
6. Asensitivityanalysiswasconductedtounderstandtheeffectofeachcalibrationcoefficientonperformancepredictionsandtomoreeasilyidentifycoefficientsthatshouldbeoptimized(13).
7. Non-linearoptimizationwasutilizedforlocalcalibrationofthecrackingandIRIperformancemodels.Linearoptimizationwasutilizedforfatigue,rutting,andthermalfracture(13).
a. Linearoptimizationwasusedtoreducethelargenumberofcomputationsassociatedwiththetrial-and-errorprocedure.
8. Localcalibrationwasattemptedforthefollowingdistresses(13):a. Alligatorcrackingb. Ruttingc. Thermal(transverse)crackingd. IRIe. Longitudinalcracking
9. Althoughitisnotexplicitlystatedinthe2013report,itcanbeinferredthatthesamepercentageofthedatausedforcalibrationandvalidationusedforJPCPpavementswasalsousedforHMApavements.Itisstatedthat“about70%ofthetotalselectedsectionswereutilizedtoidentifythelocalcalibrationfactorswhiletheremaining30%,asanindependentvalidationset,wereutilizedtoverifytheidentifiedlocalcalibrationfactors”(13).Thenumberofdatapointsineachsetwasnotreported.
10. Accuracyoftheperformancepredictionswereevaluatedbyplottingthemeasuredperformancemeasuresagainstthepredictedperformancemeasuresandobservingthedeviationfromthelineofequality.Additionally,theaveragebiasandstandarderror

71
weredeterminedandusedtoevaluatethenationallycalibratedandlocallycalibratedmodelsusingthefollowingequations(13):
a. !"#$%&# !"#$ = (!!!"#$%&"'!!!!"#$%&'#$)!
!!!!
b. !"#$%#&% !""#" = (!!!"#$%&"'!!!!"#$%&'#$)!!
!!!!
11. Aspartofthesamestudy,simulationswerecompletedintheMEPDGandDARWin-MEsoftwaretocompareperformancepredictionsforthesamedesigns.Insomecases,significantdifferencesexist,suggestingtheneedforfurtherinvestigation/verificationofperformancepredictionmodelsintheDARWin-ME(currentlyreferredtoasAASHTOwarePavementMEsoftware)(13).
B.4 MethodologyusedinEffortsforMissouri(14)
1. Version1.0oftheMEPDG(Reportdate:July2013)2. MaterialPropertieshierarchicalinputlevelsforMEPDGcalibration:
i. HMAdynamicmodulusLevel2ii. HMAcreepcompliance&indirecttensilestrengthLevel3iii. VolumetricpropertiesLevel1(MoDOTspecificdefaultsandLTPPmaterials
databaseandMoDOTtestingprogram)iv. HMAcoefficientofthermalcontractionLevel3v. UnitweightLevel1vi. Otherthermalproperties;conductivity,heatcapacity,surfaceabsorptivityLevel
33. HMApavementincluded:NeworreconstructedHMA,HMAoverlaidoverHMA,HMA
overlaidoverPCC.4. AllHMAthicknesseswereincluded.5. The general procedure formodel validation-calibration (either statistical approach or
non-statisticalapproach)wasasfollows:
Statisticalapproach:
1. Evaluatemodelspredictioncapabilitiesbydeterminingthecorrelationbetweenmeasureandpredictedvaluesusingglobalcalibration(default)coefficients.ThestatisticstomakethiscomparisonincludedcoefficientofdeterminationR2andthestandarderroroftheestimate(Se).
2. Ifpredictionsarenotadequate,localcalibrationisrecommended.3. Modelcoefficientsarelocallycalibratedandthesamestatistics,R2andSe,areused
toassesstheadequacyofthenewcoefficients.4. BiasisdeterminedbyperforminglinearregressionusingthemeasuredandMEPDG
predicteddistress;threehypothesistestsareevaluated:a. Hypothesis1:Assessifthelinearregressionmodeldevelopedhasaninterceptof
zero.

72
b. Hypothesis2:Assessifthelinearregressionmodelhasaslopeofone.c. Hypothesis3:Assessifthemeasuredandpredicteddistress/IRIrepresentsthe
samepopulationofdistress/IRIusingapairedt-test.Thelevelofsignificanceusedwas0.05.Arejectionofanyhypothesisindicatesthatthemodelisbiased.Non-StatisticalApproachThisapproachwasusedwhen themeasureddistress/IRIwaszeroorclose tozero forthe sections under evaluation. Comparisons between predicted and measureddistress/IRIwasconductedbycategorizingthemintogroups.Theevaluationconsistedondetermininghowoftenmeasuredandpredicteddistress/IRI remained in the samegroup.Thisisanindicationofreasonableandaccuratepredictionswithoutbias.
B.5 MethodologyusedinEffortsforNortheasternStates(15)
1. Version1.1oftheMEPDGwasutilized.2. SeventeenLTPPpavementsectionsfromGPS-1andGPS-2projectsinthenortheastern
(NE)regionoftheUnitedStateswereselectedforuseinthecalibrationproceduretobestrepresentconditionsinNewYorkState.LTPPsitesfromthefollowingstateswerechosen:Connecticut,Maine,Massachusetts,NewJersey,Pennsylvania,andVermont.
3. Verification was completed by executing the MEPDG models with the default,nationally calibrated coefficients and comparing the predicted distresses with themeasureddistressesforeachmodel.
4. Verificationexerciseswereperformedforthefollowingmodels:a. Permanentdeformationmodel(rutting)b. Bottom-upfatigue(alligator)crackingmodelc. Top-downfatigue(longitudinal)crackingmodeld. Smoothness(IRI)modele. Transverse(thermal)crackingmodel
5. Calibration was performed by minimizing the difference between predicted andmeasureddistressvaluesrepresentedbythesumofthesquaresoftheerror(SSE).
6. Localcalibrationwasperformedforfourofthefivemodelsevaluated:a. Alligatorcrackingb. Ruttingc. IRId. Longitudinalcracking
7. This work was reported in the form of a thesis conducted at University Texas atArlingtonandwassponsoredbyNewYorkStateDepartmentofTransportation(15).

73
B.6 MethodologyusedinEffortsforNorthCarolina
Previous Level 3 verification was conducted using MEPDG Version 1.0 to determine if thenational calibration coefficients could capture the rutting and alligator cracking on NorthCarolinaasphaltpavements(16).
Morerecently,verificationwasconductedaspartofacalibrationeffortcompletedin2011(17).Thefollowingdetailsthemethodologyutilizedinthateffort.
1. Version1.1oftheMEPDGwasutilized.2. Localcalibrationwasperformedforthefollowingmodels:
a. Permanentdeformation(rutting)b. Alligatorcracking
3. Material-specificcalibrationoftheglobalfieldcalibrationcoefficients(kr1,kr2,andkr3)inthe rutting model, as shown in equation A.1, was completed for the twelve mostcommonlyusedasphaltmixturesinNorthCarolina.
a. Triaxialrepeatedloadpermanentdeformation(TRLPD)testingwasconductedatthreetemperatures,fromwhichthepermanentandresilientstrainvaluesweredeterminedateachloadingcycle,N.
b. Plots were developed for the logarithm of the ratio of permanent strain toresilientstrain,log(εp/εr),versuslog(N),fromwhichtheslopeswereemployedinnumericaloptimization to, in turn,determineaconstant thatclosely replicatesTRPLDresults.
c. The constant, log(A), was then plotted with the logarithm of the testtemperature,log(T),todeterminetheslopeandintercept.
d. The slope and intercept were then used to determine the material-specificcalibration coefficients, k’r1, k’r2, k’r3 unique to each of the twelve commonasphaltmixturesusedinNorthCarolina.
4. Material-specificcalibrationwasalsoconductedforthefatiguemodelcoefficients,(kf1,kf2, and kf3) as shown in equationA.12 for the same twelve asphaltmixtures aswereconsideredfortheruttingcoefficientcalibration.
a. Viscoelasticcontinuumdamage(VECD)fatiguetestingwasconductedatvarioustemperaturesandstrainlevels.
b. The simplified VECD (S-VECD) model was applied to the results to simulatestrain-controlled direct tension fatigue testing and traditional bending beamfatiguetesting.
c. Material-specific coefficients were determined from the empirical modeldevelopedforthedirecttensionfatiguetestingsimulation.
5. Using the same twelve commonasphaltmixtures and theassociatedmaterial-specificcalibrationcoefficients, localcalibrationwasthenconductedbycalibratingcoefficientsfortheruttingmodel,βr1,βr2,βr3,βs1(forgranularbase,andsubgrade)andthealligatorcracking model, βf1 βf2, βf3, C1, and C2. Two approaches were taken in the localcalibrationefforts:

74
a. ApproachI involvedusinga largefactorialofcalibrationcoefficients:βr2andβr3for the rutting model, and βf2 and βf3 for the alligator cracking model, andexecuting the software numerous times for each model. In doing so, theremainingcalibrationcoefficientswereoptimizedusingMicrosoftExcelSolverbydeterminingthecombinationofcoefficientsthatproducedthesmallestsumofsquarederrors (SSE)betweenmeasuredandpredicteddistress.Thisprocedurewasconductedforeachmodelinvestigated.
b. Approach II involved a simultaneous optimization procedure. This procedureincluded the genetic algorithm (GA) optimization technique conducted usingMATLAB®suchthatallmodelcoefficientswereoptimizedsimultaneously.
6. Since MEPDG Version 1.1 does not incorporate material-specific coefficients for theruttingmodel,ahybridversionoftheMEPDGwasdevelopedandutilizedtoaccountformaterialspecificruttingcalibrationcoefficients.
7. Model verification, calibration, and validation were evaluated with the followingparameters:
a. Thestandarderroroftheestimate,Seb. Theratioofthestandarderroroftheestimate(alsoreferredtoasthestandard
deviation of the residual error) to the standard deviation of the measuredperformance,SydescribedbySe/Sy
i. “A ratio that is smaller than one indicates that the variability in thepredictedresidualerrorissmallerthanthatinthemeasureddata.”
c. Coefficientofdetermination,R2d. Thep-valueforthenullhypothesis
i. The null hypothesis, H0, was that the average bias, or residual error,between the predicted and measured values is zero at the 95%confidencelevel,asdescribedbelow:
!! : !"#$%&"' − !"#$%&'#$ = 08. Level 2 inputswere utilized for asphaltmixtures and subgradematerials and Level 3
inputs(nationaldefaultvalues)wereappliedforunboundbasematerials.9. Twenty-twoLTPPsites,6SPSsites,and16GPSsiteswereutilizedforcalibrationofthe
ruttingandalligatorcrackingmodels.10. Twenty-four non-LTPP asphalt pavement sectionswere reserved for validation of the
locally calibratedmodels; as a result, 25 distress datasets from 1993 and 1999wereutilizedinadditiontomorerecentdistressdatacollectedin2010.
B.7 MethodologyusedinEffortsforOhio(18)
1. Version1.0oftheMEPDG2. Globallycalibratedmodelswereevaluatedandre-calibrationwasconductedusingdata
from13LTPPprojects.3. Verificationexerciseconductedforneworreconstructedflexiblepavementsto
determineifnationally(globally)calibratedmodelsweresufficientinpredicting

75
performanceforselectedpavementsinOhiowithavailableandhigh-qualitytraffic,foundation,design,materials,andperformancedata.
a. 13LTPPprojectswereusedwithACthicknessesof4or7inches.b. TwoLTPPflexiblepavementprojectcategories:SPS-1andSPS-9c. Onelocationinthestatewasselected:a3.3milesectionofUS23inDelaware
County,about25milesnorthofColumbus.4. AsphaltconcretematerialpropertieshierarchicalinputlevelsforMEPDGcalibration:
a. HMAdynamicmodulusLevel2,usingLTPPdatab. HMAcreepcomplianceandIndirectTensileStrengthLevel3(fromOhioMEPDG
relatedliteratureorMEPDGdefaults)c. Volumetricproperties,Level1fromLTPPd. HMAcoefficientofthermalexpansion,Level3(usingMEPDGdefaults)e. Unitweight,Level1,determinedfromLTPPdataf. Poisson’sratio,Level1and3,computedfrom(fromOhioMEPDGrelated
literatureorMEPDGdefaults)g. Otherthermalproperties;conductivity,heatcapacity,surfaceabsorptivityLevel
3(MEPDGdefaults)5. Thefollowingdistresseswereevaluated:
a. Load-relatedalligatorcracking,bottominitiatedcracksb. Totalrutdepthc. Transverse“thermal”crackingd. Smoothness(measuredasInternationalRoughnessIndex[IRI])
6. Modeladequacywasevaluatedeitherbynon-statisticalmethodsorstatisticalmethods,forstatisticalmethodsthefollowingprocedurewasfollowed:
a. MEPDGexecutedforeachLTPPprojectstopredictdistressesandIRIb. Predicteddistressandroughnessdata(IRI)extractedforcomparisonwith
measuredLTPPdistress/IRIc. Statisticalanalysesconductedtocheckadequacyofperformancemodels
(predictioncapability,accuracy,andbias)d. Wherenecessary,localcalibrationofMEPDGmodelsconductede. Sensitivityanalysesofrecalibratedmodelsperformedf. Resultsofverificationofglobalmodelsandlocalcalibration(includingrevised
modelcoefficients)aresummarized7. Modelpredictioncapabilitywasassessedbydeterminingthecorrelationbetween
measuredandpredicteddistress/IRIusingcoefficientofdetermination,R2.ThereasonablenessoftheestimatedR2wasdeterminedbasedonthefollowingcategories,suchthatapoorcorrelationimpliedthemodelwasnotpredictingdistressorIRIreasonablyandmayrequirerecalibration:
a. Excellent:>80%b. Verygood:75to85%c. Good:65to75%d. Fair:50to65%e. Poor:<50%
76
8. Modelaccuracywasassessedbythestandarderroroftheestimate(Se),whichwastakenasthesquarerootoftheaveragesquarederrorofprediction.ForSemuchgreaterthanthatreportedfromtheNCHRP1-40Ddistress/IRIpredictions,recalibrationwasnecessary.
9. Biaswasdeterminedbyalinearregressionusingmeasuredandpredicteddistress/IRI.Hypothesistestswereconductedforthefollowinghypothesesusingasignificancelevel,α,of0.05or5%.
a. Hypothesistest1:determinewhetherthelinearregressionmodelhasaninterceptofzero
i. Thenull(H0)andalternativehypothesis(HA)are1. H0:Modelintercept=02. HA:Modelintercept≠0
ii. Ifthep-value<0.05,thenullhypothesisisrejectedanditisimpliedthatthelinearregressionmodelhadaninterceptsignificantlydifferentfromzeroattheα-level,therefore,thepredictionmodelisbiasedandshouldberecalibrated.
b. Hypothesistest2:determinewhetherthelinearregressionmodelhasaslopeof1.0
i. Thenull(H0)andalternativehypothesis(HA)are1. H0:Modelintercept=1.02. HA:Modelintercept≠1.0
ii. Ifthep-value<0.05,thenullhypothesisisrejectedanditisimpliedthatthelinearregressionmodelhadaslopesignificantlydifferentfrom1.0attheα-level,therefore,thepredictionmodelisbiasedandshouldberecalibrated.
c. Hypothesistest3:determinewhetherthemeasuredandpredicteddistresses/IRIrepresentthesamepopulationofdistress/IRIusingthefollowingpairedt-test:
i. Thenull(H0)andalternativehypothesis(HA)are1. H0:meanmeasureddistress/IRI=meanpredicteddistress/IRI2. HA:meanmeasureddistress/IRI≠meanpredicteddistress/IRI
ii. Ifthep-value<0.05,thenullhypothesisisrejectedanditisimpliedthatthemeasuredandMEPDGdistress/IRIarefromdifferentpopulationsattheα-level,thereforetheMEPDGdistress/IRIpredictionsarebiasedandshouldberecalibrated.
B.8 MethodologyusedinEffortsforOregon(19)
1. DarwinM-EVersion1.12. SincepavementworkconductedbyODOTinvolvestherehabilitationofexisting
pavements,calibrationwasconductedforrehabilitationofexistingstructures.3. Pavementsectionswereselectedbasedonlocation(Coastal,Valley,andEastern),type
(HMAoveraggregatebase,HMAinlayoroverlayoveraggregatebase,HMAinlayor

77
overlayovercementtreatedbase,andHMAoverlayofCRCP),trafficlevel(lowandhigh)andpavementperformance(verygood/excellent,asexpected,andinadequate).
4. PrimaryeffortforcalibrationwasonaLevel3analysis.5. Theauthorsdonotclearlyspecifyhowmanydatapointswereusedtoconductlocal
calibrationofthedifferentmodels,andtheonlystatisticreportedwasthestandarderroroftheestimate(Se)beforeandaftercalibration.
6. TheIRImodelwasnotcalibrated.B.9 MethodologyusedinEffortsforTennessee(20)
1. Version 1.100 of theMEPDGwas utilized for an initial verification of the rutting and
roughnessmodelsforthedesignofnewACpavements.a. Accuracy of the predictive performance models was evaluated using HMA
Dynamic modulus Level 1 (obtained from laboratory testing) and Level 3(estimatedusingtheWitczakmodel).
2. Nineteen HMA pavement sections were utilized for initial verification, including 18interstatehighwaypavementsectionsandonestateroutepavementsection.
a. TwosectionswereACpavements.b. SixsectionswerePCCpavementsthathadreceivedanACoverlay.c. TheremainingsectionsincludedACpavementsthathadreceivedanACoverlay
3. Twoinputlevelsweredefinedandanalyzed:a. “Level 2.5” considered Level 3 inputs for AC layers and Level 2 for base and
subgradeproperties.b. “Level1.5” consideredLevel1 formaterialpropertiesofAC layersandLevel2
inputsforthebaseandsubgrade.4. RoughnessischaracterizedbyTennesseeDOT(TDOT)intermsofPSI,ratherthanbyIRI,
therefore, initial IRI was determined from the average initial PSI and an IRI-PSIrelationshippreviouslydeveloped.
5. Local calibration was attempted on the permanent deformation (rutting) transferfunction for asphalt pavements and comparisonswere drawnbetweenpredicted andmeasuredruttingbygroupingpavementsectionsbytrafficlevels.
a. In verifying and calibrating the rutting model, three different categories ofpavementswereconsidered:asphaltpavementsandasphaltpavementoverlaidwith AC; concrete pavements overlaidwith AC for low volume traffic (0-1,000AADTT);andconcretepavementsoverlaidwithACforheavytraffic(1,000-2,500AADTT).
6. UsingMicrosoftSolver,eliminationofbiaswasattemptedbyminimizingtheSebetweenmeasured and predicted rutting values by varying the β1r and βs1 (for base andsubgrade)coefficients.
a. Comparisonsweredrawnbetweenpredictedandmeasuredruttingforthetwopavementtypesandthenfurtherbrokendownbytrafficlevels(AnnualAverageDailyTruckTraffic(AADTT)between0and1,000,andAADTTbetween1,000and2,500).
78
7. A total of 18 pavement sections were utilized in the calibration effort using Version1.100oftheMEPDG.
a. SixpavementsectionsincludedPCCpavementsthathadreceivedanACoverlay.b. TenpavementsectionsincludedACpavementsthathadreceivedanACoverlay.
i. TheACoverlaysrangedinthicknessfromtwotoeightinches.c. TwonewACpavementsectionswereincluded.
8. CalibrationofthesectionswithanACoverlayatopPCCpavementsincluded:a. Level1 inputswereusedforthedynamicmodulusoftheasphaltmixturesand
thecomplexmodulusoftheasphaltbinders.b. Level3inputsutilizedforthePCC,base,andsubgradelayers.c. BecausenoruttingoccurredinthePCCandunderlyinglayers,onlyruttinginthe
asphaltoverlaywasconsideredandcomparedwithpredictedrutting.d. CalibrationcoefficientswerevariedusingMicrosoftExcelSolvertominimizeSe.e. DuetolimitednumberofPCCpavementsoverlaidwithAC,novalidationeffort
wasconducted.9. Calibration of the sections with an AC overlay atop AC pavements and the new AC
pavementsincludedthefollowing:a. AC pavements overlaid with AC were assumed as new pavements (the AC
overlay pavements and new AC pavement design utilized the same ruttingtransfermodelintheMEPDG).
b. Thelevelofinputsfortheasphaltlayerswasnotexplicitlystated.c. Totalpredictedruttingwascomparedwithmeasuredrutting.d. CalibrationcoefficientswerevariedusingMicrosoftExcelSolvertominimizeSe.e. Validationwas conductedusing twoadditionalACpavement sections thathad
beenoverlaidwithAC.B.10 MethodologyusedinEffortsforUtah(21,22)
1. Version0.8oftheMEPDG(Reportdate:October2009)
a. HMAdynamicmodulusLevel3(Computedusingmaterialgradation,bindergradeandWitczakmodel)
b. HMAcreepcompliance&indirecttensilestrengthLevel3(Basedonbindertypeandmaterialtype)
c. Effectivebindercontent-Level3(EstimatedfrompastconstructionprojectsQA/QC)
d. HMAcoefficientofthermalcontractionLevel3(MEPDGdefaults)e. Basetype/Modulus-Level3,basedonmaterialtypef. Subgradetype(Level1,backcalculatedusingdeflectiondata)
2. HMAsectionsincluded:g. NewHMA(includingthinoverlays):26projectsh. HMAoverlaidexistingHMA:4projects
3. AllHMAthicknesseswereincludedalthoughmostsectionswerebetween4and8inches.

79
4. Localcalibrationwasconductedusinglinearandnon-linearregressionprocedures(SASstatisticalsoftware).OptimizationwasperformedtoselectlocalcalibrationcoefficientstomaximizeR2andminimizeSe,goodnessoffitandbiaswaschecked,andlimitedsensitivityanalysiswasperformed.
5. Recalibrationoftheruttingmodelswasconductedin2013.Therecalibrationanalysiswasconductedinthesamemannerandusingmostofthetestsectionsusedinthe2009calibrationwithfourmoreyearsofruttingdata.
B.11 MethodologyusedinEffortsforWashington(23)
1. Version1.0oftheMEPDG(Paperdate:July2009)2. Itwasreportedthatthecalibrationprocessfollowsacombinationofasplit-sample
approachandajackknifetestingapproachperrecommendationinthedraftreporttoNCHRPProject1-40A(RecommendedPracticeforLocalCalibrationoftheMEPavementDesignGuide).
3. Forthecalibrationprocedure,datafromtheWashingtonStatePavementManagementSystem(WSPMS)wasused.
4. Theircalibrationeffortsfocusedonfatiguedamage,longitudinalcracking,alligatorcracking,andruttingmodels.
5. Anelasticityanalysiswasconductedtoassesstheeffectofthedifferentcalibrationfactorsonthedistressmodels.Tworepresentativecalibrationsectionswereused.
6. Finalcalibrationfactorsarereported,butnostatisticsarepresented.
B.12 MethodologyusedinEffortsforWisconsin(24)
1. Version1.0oftheMEPDG(Reportdate:April2009)2. The study was conducted using information collected from the LTPP sections in
Wisconsin.3. Most of the inputs required for the verification and calibration were from the LTPP
databasewithsomeinputsbeingnationaldefaultsinthesoftware.4. AdesignwasconductedforeachLTPPsectiontopredictpavementdistressesandIRI.5. The Pavement ME Design predictions were then compared with the measured
distressesintheLTPPdatabasetodeveloprecommendationsforWisconsinDOT.6. Calibrationwasattemptedforrutting,transversecrackingandIRImodels.7. WorkwassponsoredbyWisconsinDOTandcompletedbyARAin2009.

80
APPENDIXCSUMMARYOFVERIFICATIONANDCALIBRATIONRESULTS
C.1 FatigueCracking(Alligator/Bottom-up)
C.1.1 Arizona(10)VerificationoftheDarwinMEglobalalligatorcrackingmodelsconsistedofrunningtheMEPDGwiththeglobalcoefficientsforallselectedprojectsandevaluatinggoodnessoffitandbias.Atotalof363datapointswereused.“Obviousbias”intheformofunder-predictionwasreported.ThegoodnessoffitwasreportedasverypoorwithR2of8.2%andSeof14.3%.Basedonthisfinding,localcalibrationwasrecommended.Localcalibrationwasconductedusing419datapoints,whichincludedboththecalibrationandvalidationdatasets,andtheauthorsreportedadequategoodnessoffitwithanR2of50%andSeof14.8%.Thebiaswasreducedifnoteliminatedthroughlocalcalibration.ItshouldbenotedthattheauthorsofthestudyforArizonaDOTreporteddifferentstatisticsinChapter3and8.FromChapter3(Page61,Table20)R2wasreportedas50%andSewaslistedas14.8%ofthelanearea.InChapter8(Page175,Table65),R2wasreportedas58%andSewasshownas13%ofthelanearea(10).C.1.2 Colorado(11)TheevaluationoftheglobalalligatorcrackingmodelsconsistedofrunningtheMEPDGwiththeglobal coefficients for all selected projects and evaluating goodness of fit and bias. ThegoodnessoffitwaspoorwithanR2of17.5percent,whichindicatesaweakalligatorcrackingprediction.Thebiaswasreportedintermsofp-valueforpairedt-testandslope(seestatisticsavailableinTable5).Bothtermsindicatedbiasintheprediction.Themodelconsistentlyunder-predictedalligatorcrackingwith increasingHMAfatiguedamage.Sincethe fatiguemodeldidnot adequately predict alligator cracking for Colorado conditions, local calibration wasrecommended.Atotalof50datapointswereusedforthiseffort.ThelocalcalibrationofHMAalligatorcrackingandfatiguedamagemodelswasconductedusingthesamegoodnessof fitandbiasparametersthatwerereportedforverification.Theresultsshowed an adequate (fair) goodness of fit with minimal bias. For the fatigue damage andalligatorcrackinglocalmodels,56datapointswereusedandforthereflectioncrackingmodel87datapoints.C.1.3 Iowa(13)The global alligator cracking model was evaluated by plotting the measured against thepredicted cracking and by calculating the bias and standard error for the globalmodel. Theglobalmodel resulted ingoodestimatesof themeasuredalligator cracking,withonly twoofthe327datapointsunderestimatedbythemodel.Researchersconcludedthat thenationallycalibratedmodelforalligatorcrackingdidnotrequirelocalcalibration.C.1.4 Missouri(14)Thealligatorcrackingdata showed thatapproximately99%ofallmeasuredalligatorcrackinghad a value less than 5% (by lane area). Becausemost of the projects reported no alligatorcracking, a non-statistical approach was used to verify the model. In order to verify theadequacyof the global calibration coefficients, crackingwas categorized intoeight groups to

81
determine how oftenmeasured and predicted cracking fell in the same group. The authorsreportedthattheglobalmodelseemedtobothslightlyunder-predictandslightlyover-predictalligator cracking. Based on this information, local calibration was not recommended at thetimethestudywasconductedanditwasrecommendedthatthemodelbereevaluatedwhendatashowhighermagnitudesofalligatorcracking.C.1.5 NortheasternStates(15)VerificationofthenationallycalibratedmodelwasconductedusingmeasuredfatiguecrackingfromtheLTPPsitesinthenortheasternregion.However,theamountofdatapointsconsideredfor this evaluation and for the regional calibration was not reported. The predicted fatiguecrackingusingthenationallycalibratedmodelresultedinsumofsquareoftheerrors(SSE)of63.48. By plotting the measured fatigue cracking with predicted fatigue cracking from thenationally calibratedmodel, itwas concluded that the globalmodel “severely under-predictstheextentofalligatorcracking.”Asaresult,calibrationwasconductedforthefatiguecrackingmodelusingMicrosoftExcelSolvertodeterminethecalibratedcoefficients,C1,C2,andC4,byminimizing SSE. No other statistical measures were used to evaluate the goodness of fit ofeitherthenationallycalibratedmodelorthe locallycalibratedmodel.An improvement inthepredictionoffatiguecrackingwasreportedfortheregionallycalibratedmodelwithareductioninSSEfrom63.48to43.48.C.1.6 NorthCarolinaInitial verification of the nationally calibrated alligator crackingmodel was reported in 2008(16). For this effort, theMEDPG Version 1.0 was utilized to evaluate the predicted alligatorcrackingrelativetomeasuredalligatorcracking.NewandrehabilitatedasphaltpavementsfromLTPP(onlysectionsthatwerenotincludedinthenationalcalibration)andnon-LTPPpavementsectionsinNorthCarolinawereconsidered.ConsideringonlyLTPPpavementsections,atotalof76 data points were used to evaluate themodel. Standard error and SSE were reported as10.7% and 8,505.51, respectively. When both LTPP and non-LTPP pavement sections wereconsidered,thedatasetwasexpandedto176datapointsandresultedinSeof6.02%andSSEof29,487.1.Thenationallycalibratedmodelwasfoundtounder-predictalligatorcrackingand“asignificantamountofbias”wasreportedforthedefaultmodel.Verificationwasalsoconducteden-routetoperforminglocalcalibrationineffortscompletedinthemorerecent2011study,usingVersion1.1oftheMEPDGsoftware(17)forwhichresultsarereportedinTable5ofthisreport.Additionalparametersthatwerereportedfortheapplicationof thenationallycalibratedmodel includetotalSSEof56,412,biasof -11.034(percentof thelane area) and Se/Sy of 1.022. The authors of the 2011 study reported the global calibrationcoefficientsresultedinsignificantunder-predictionsofthemeanmeasuredfatiguecracking.Material-specificcoefficients (kf1,kf2,andkf3)calibratedforeachofthetwelvemostcommonasphaltmixturesusedinNorthCarolinawereusedincalibratingthealligatorcrackingmodelforNorthCarolina(17).Twoapproachesweretakentodeveloplocalcalibrationmodelcoefficients,βf1,βf2,βf3,C1,andC2. Itwasfoundthatthe locallycalibratedcoefficientsfromApproach II-Fimproved the predictedmean alligator cracking and reduced the bias foundwhen using the

82
nationally calibrated coefficients. Approach II-F resulted in statistically better predictions ofalligator cracking and as a result, coefficients from Approach II-F were recommended. Thecalibration coefficients and statistical parameters resulting from Approach II-F are listed inTable 6. Despite the improved predictions, itwas found that differences betweenmeasuredandpredictedfatiguecrackingwerestillsignificantatthe95%confidencelevel,thusrejectingthenullhypothesis.Additionalparameterswerereporteddescribingtheadequacyandbiasofthecalibratedmodel:thetotalSSEof38,752,biasof-5.153(percentoflanearea)andSe/Syof0.949.Validation of locally calibrated models from Approach I-F and II-F with use of the material-specific coefficientswasconductedwith sections fromthepavementmanagement systemoftheNorthCarolinaDepartmentofTransportation(17).Fortheapplicationoftherecommendedlocally calibratedcoefficientsdetermined fromApproach II-F to thevalidationdataset, itwasreported that both bias and standard error were reduced relative to the calibration andverification results. As was the case with the calibration set, the null hypothesis was alsorejectedwhen the local calibration coefficientswere applied to the validation set, indicatingthattherewerestatisticallysignificantdifferencesbetweenthemeasuredandpredictedfatiguecrackingvalues.StatisticalparametersforthevalidationofApproachII-FcalibrationcoefficientsarealsolistedinTable6.AdditionalparametersreportedbutnotlistedinTable6includebiasof1.973(percentoflanearea)andSe/Syof1.690.C.1.7 Ohio(18)Thealligatorcrackingmodelwasnotevaluatedorrecalibratedduetopremature longitudinalcrackingassociatedwithconstructiondefectsintheLTPPprojectsites.C.1.8 Oregon(19)The verification of the global calibration factors using DarwinME software showed that thesoftware under estimates the amount of alligator cracking, therefore, local calibration wasrecommended.Aftercalibration,theauthorsindicatedthatthemodelwasimprovedintermsofbiasandstandarderror,buttherewasahighdegreeofvariabilitybetweenthepredictedandmeasureddistresses.TheauthorsonlyreportedSe,withavalueof3.384beforecalibrationand2.644aftercalibration;nootherstatisticswerepresented.Thenumberofdatapointsusedtoconductlocalcalibrationwasnotexplicitlystated,however,itwasnotedthatonlyoneyearofdistressdatawasavailablefortheverificationandcalibrationprocedures.C.1.9 Utah(21)Thealligatorcrackingdatashowedthat95%ofthedatapointshadlessthan2%ofcracking(%lanearea).Duetothelimiteddataavailable,anon-statisticalapproachwasusedtoverifythemodel. In order to verify the adequacy of the global calibration coefficients, cracking wascategorizedintoeightgroupstodeterminehowoftenmeasuredandpredictedcrackingfellinthesamegroup.Itwasfoundthattheglobalmodelpredictedcrackingrelativelywell,butthemodel couldnotbeevaluated for sectionswith significantamountof cracks; therefore, localcalibrationofthemodelwasnotrequired.
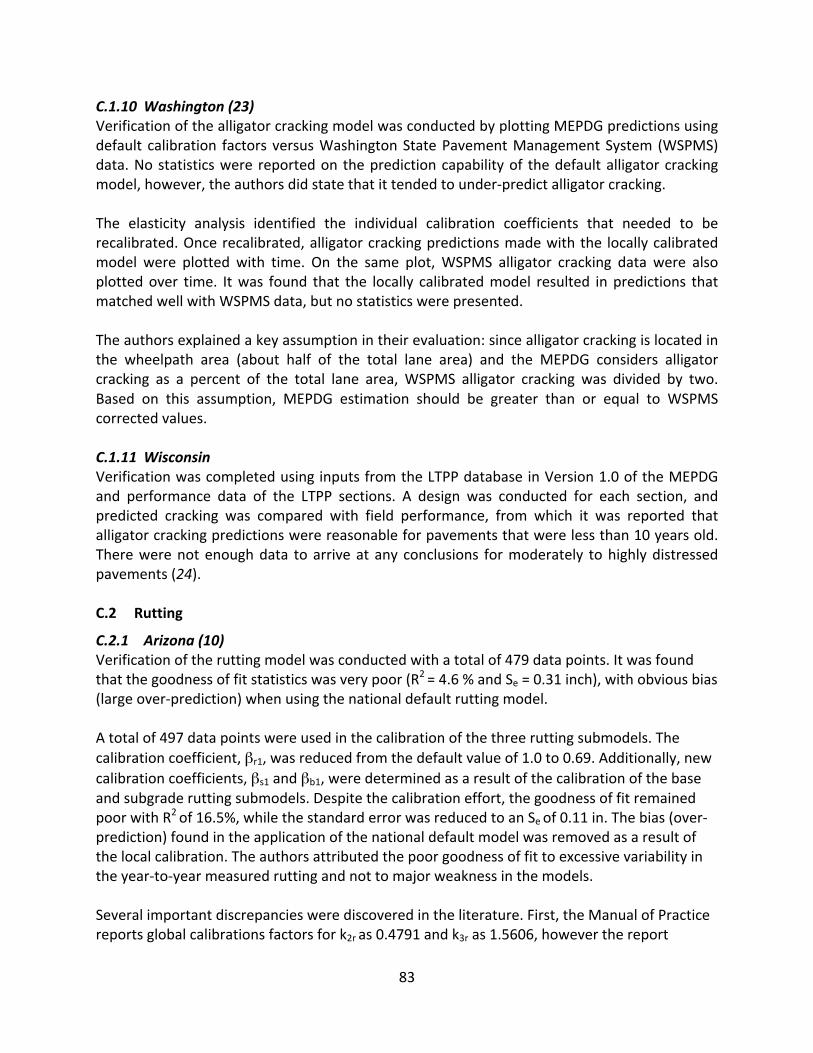
83
C.1.10 Washington(23)VerificationofthealligatorcrackingmodelwasconductedbyplottingMEPDGpredictionsusingdefault calibration factors versusWashingtonStatePavementManagementSystem (WSPMS)data.Nostatisticswere reportedon thepredictioncapabilityof thedefaultalligatorcrackingmodel,however,theauthorsdidstatethatittendedtounder-predictalligatorcracking.The elasticity analysis identified the individual calibration coefficients that needed to berecalibrated.Oncerecalibrated,alligatorcrackingpredictionsmadewiththe locallycalibratedmodel were plotted with time. On the same plot,WSPMS alligator cracking data were alsoplottedover time. Itwas found that the locally calibratedmodel resulted inpredictions thatmatchedwellwithWSPMSdata,butnostatisticswerepresented.Theauthorsexplainedakeyassumptionintheirevaluation:sincealligatorcrackingislocatedinthe wheelpath area (about half of the total lane area) and the MEPDG considers alligatorcracking as a percent of the total lane area,WSPMS alligator cracking was divided by two.Based on this assumption, MEPDG estimation should be greater than or equal to WSPMScorrectedvalues.C.1.11 WisconsinVerificationwascompletedusinginputsfromtheLTPPdatabaseinVersion1.0oftheMEPDGand performance data of the LTPP sections. A design was conducted for each section, andpredicted cracking was compared with field performance, from which it was reported thatalligatorcrackingpredictionswerereasonableforpavementsthatwerelessthan10yearsold.Therewerenotenoughdata toarriveat any conclusions formoderately tohighlydistressedpavements(24).C.2 Rutting
C.2.1 Arizona(10)Verificationoftheruttingmodelwasconductedwithatotalof479datapoints.Itwasfoundthatthegoodnessoffitstatisticswasverypoor(R2=4.6%andSe=0.31inch),withobviousbias(largeover-prediction)whenusingthenationaldefaultruttingmodel.Atotalof497datapointswereusedinthecalibrationofthethreeruttingsubmodels.Thecalibrationcoefficient,βr1,wasreducedfromthedefaultvalueof1.0to0.69.Additionally,newcalibrationcoefficients,βs1andβb1,weredeterminedasaresultofthecalibrationofthebaseandsubgraderuttingsubmodels.Despitethecalibrationeffort,thegoodnessoffitremainedpoorwithR2of16.5%,whilethestandarderrorwasreducedtoanSeof0.11in.Thebias(over-prediction)foundintheapplicationofthenationaldefaultmodelwasremovedasaresultofthelocalcalibration.Theauthorsattributedthepoorgoodnessoffittoexcessivevariabilityintheyear-to-yearmeasuredruttingandnottomajorweaknessinthemodels.Severalimportantdiscrepancieswerediscoveredintheliterature.First,theManualofPracticereportsglobalcalibrationsfactorsfork2ras0.4791andk3ras1.5606,howeverthereport
84
detailingtheverificationandcalibrationeffortforArizonareportsshowk2as1.5606andk3as0.4791(4,10).Secondly,ArizonareporteddifferentstatisticsforthelocallycalibratedmodelinChapter3and8.FromChapter3(Page67,Table23)R2waslistedas16.5%andSewasreported0.11in,however,inChapter8(Page175,Table65),R2wasshowntobeslightlyhigherat21%andSewasreportedas0.12in(10).C.2.2 Colorado(11)Since the MEPDG predicts HMA pavement total rutting using separate submodels for thesurface HMA, granular base, and subgrade, evaluation of the global total rutting modelconsistedofthefollowingsteps:
a. Run the three rutting submodels using global coefficients for all sections to obtainestimatesoftotalrutting.
b. Perform statistical analysis to determine goodness of fit andbias in estimated totalrutting.
c. The goodness of fit was evaluated using the same parameters that were used foralligatorcracking.
Atotalof155datapointswereusedtoevaluatethenationaldefaultruttingsubmodels.Itwasreported that there was “significant bias” when the nationally calibrated rutting modelpredictionswerecomparedwithmeasuredrutdepth.Intheplotofmeasuredversuspredictedrutting shown in Figure 82 (11), it appears that the global model over-predicts for somemagnitudesofruttingandtendstounder-predicttotalruttingforothermagnitudes(highandlow).Ruttingpredictionwaspoor,therefore,localcalibrationwasrecommended.
Local calibration of the HMA rutting, unbound aggregate base rutting, and subgrade ruttingglobal model coefficients was conducted using a total of 137 data points. After calibration,reasonablepredictionsofruttingwereobtained. Itwasalsoreportedthatthesignificantbiasassociatedwiththenationallycalibratedmodelwaseliminatedthroughlocalcalibration,basedonthereportedp-values.Itshouldbenotedthatthekr2andkr3valuesarereporteddifferently inthebodyofthetext,specificallyTable59ofthereport,whichshowsvaluesconsistentwiththePavementMEDesignsoftwareVersion2.1.However, in theAppendixof thereferencedreport (11), thevaluesarereversedandassuchareconsistentwiththevaluesreportedintheManualofPractice(4).Thevalues listed inTables7and8are thevalues listed inTable59of the referenceddocument,whichareconsistentwiththecurrentversionofthesoftware.C.2.3 Iowa(13)Comparisons were drawn between predicted and measured rutting in each layer (HMA,granularbase,andsubgrade)and total rutting.Thenationally calibratedmodelwas found tounder-estimate HMA layer rutting while over-predicting rutting in the granular base andsubgrade. The total rutting prediction bias and standard error for the nationally calibratedmodelwerereportedas0.05and0.08,respectively.
85
As a result of local calibration, reductions in both bias and standard error were reported.Overall improvementsrelativetothegloballycalibratedmodel in ruttingpredictions foreachlayer and total rutting were also reported for the locally calibrated ruttingmodel. Bias andstandarderrorforthelocallycalibratedmodelwerereportedas0.03and0.07,respectively,forthetotalruttingprediction.Similartotheresultsreportedforthecalibrationdataset,predictionsmadeforthevalidationdatasetusingthelocallycalibratedcoefficientsshowedgoodagreementwithmeasuredvaluesandan improvementoverthegloballycalibratedruttingmodel intermsofbiasandstandarderror.However,aswasthecasewiththecalibrationdataset,thereislimiteddataavailableforthe evaluation of rutting in the granular base layer and the subgrade layer, although thenumber of data points in the validation dataset was not reported. Applying the nationallycalibratedmodel to the validation dataset resulted in a bias and standard error of 0.04 and0.07, respectively, for the total rutting prediction. The application of the locally calibratedmodel to the validation dataset resulted in bias and standard error of 0.02 and 0.07,respectively, for the total ruttingprediction.Asa result, the locally calibrated ruttingmodelswererecommendedforuseovertheexistingglobalmodels.C.2.4 Missouri(14)The verification of the national rutting model was conducted using 183 data points. It wasfoundthatthemodelover-predictstotalruttingandapoorcorrelationwasobserved(R2=0.32andSe=0.11in).Localcalibrationofthethreeruttingsubmodels(HMA,baseandsubgrade)wasconductedusingthesamedatapoints.Calibrationwasconductedbymodifyingtheβr1intheHMAsubmodel,βs1fortheunboundbasesubmodel,andβs2forthesubgradesubmodel.Afterlocalcalibration,afaircorrelationbetweenmeasuredandpredictedruttingwasreported(R2=0.52andSe=0.051in).Itshouldbenotedthatthe coefficient of determination was listed in the plot of measured versus predicted totalrutting for the locally calibrated model (Figure I-124) as 53% and 52% in Table I-69 of thereferencedocument(14).ValueslistedinTable8ofthisreportareconsistentwithTableI-69ofthereferencedocument(14),whichdescribedthestatisticsforthelocallycalibratedmodel.C.2.5 NortheasternStates(15)Comparisons were drawn between measured rutting and predicted rutting in the AC, base,subgrade,andtotalruttingusingthenationallycalibratedmodel.Theproportionofpredictingruttingineachlayertothetotalruttingwasdeterminedandappliedtomeasuredtotalruttingtodrawcomparisons for total rutting, rutting in theAC,base,andsubgrade.Theauthorsdidnot explicitly state whether under- or over-prediction was noted with the national model.However, based on the plot of measured versus predicted total rutting using the globalcoefficients(showninFigure4.7),itappearsthenationaldefaultruttingmodelunder-predictedtotalruttingatthehighend(above0.4inches).Calibration was completed for the permanent deformation model by using the nationallycalibratedmodeltodeterminetheratioofpredicteddeformationtototalruttingineachlayer.

86
Once the proportionswere determined, themeasured total rut depthwasmultiplied by thecorresponding ratio to estimate the measured rutting in each layer. Calibration was thenperformed using a simple linear regression with no intercept, where the measured ruttingservedasthe independentvariable.Thecalibrationcoefficientswerethendeterminedastheinverseof theslope.Thenumberofdatapointsused for thecomparisonwerenot reported,norwereany statisticalmeasures reported relative to theaccuracyor goodnessof fit of thenationallyandlocallycalibratedmodels.However,itwasreportedthattheSSEfortotalruttingdecreasedwith local calibrationand that the regional calibrationcoefficientsgiveabetter fitbetweenmeasuredandpredicted rutting in all layers. Itwas suggested that themuch largerregionalcoefficientscouldbeduetothesmalldatasetof17sections.C.2.6 NorthCarolinaInitialverificationofthenationallycalibratedruttingmodelwasreportedin2008(16).MEDPGVersion 1.0 was utilized to evaluate the predicted total rutting, AC rutting, rutting in thegranularbase,andruttinginthesubgraderelativetomeasuredrutting.NewandrehabilitatedasphaltpavementsfromLTPP(onlysectionsthatwerenotincludedinthenationalcalibration)and non-LTPP pavement sections in North Carolinawere considered. By including only LTPPpavementsections,atotalof161datapointswereusedtoevaluatethemodel.TheR2,Se,andSSE for the comparison ofmeasured ruttingwith predicted total rutting using the nationallycalibratedcoefficientswerereportedas0.340,0.111,and1.962,respectively.WhenbothLTPPand non-LTPP pavement sections were included, the dataset consisted of 255 data points.Applyingthenationallycalibratedcoefficientsandcomparingwithmeasuredruttingresultedinthefollowingparameters:R2of0.142,Seof0.153,andSSEof10.387.Thepredictedrutdepthsmatched well with the measured rut depths when only LTPP pavement sections wereconsidered.Verification was also conducted as part of local calibration efforts completed in 2011 usingMEPDGVersion1.1(17).Inapplyingthenationallycalibratedmodel,itwasfoundthatitunder-predictedthetotalrutdepthaswellastherutdepthintheHMAlayers.WhilethedifferencesreportedforthetotalandHMArutdepthswerefoundtobestatisticallysignificantatthe95%confidencelevel,thedifferenceinpredictedandthe(estimated)measuredrutdepthsfortheunbound base and subgrade were not found to be statistically significant. Althoughcomparisonsweremade for the individualmodels (HMA rutting, base rutting, and subgraderutting)aswellasthetotalruttingmodel,onlytheresultsforthetotalruttingarereportedinTable7. Inaddition to theparameters shown inTable7, the followingparameterswerealsoreported:totalSSEof4.110,biasof-0.031,andSe/Syof1.027.The material-specific calibration coefficients were used in the local calibration process tocalibrateβr1,βr2,βr3,βgb, andβsg forNorthCarolina (17). Twoapproacheswere taken in thelocal calibration process, Approach I-R and II-R. The locally calibrated coefficients fromApproach II-R were reported to “significantly reduce bias and standard error between thepredictedandmeasuredrutdepthvaluesforalllayerstypes,exceptforthesubgrade.”BiasfortotalruttingwasalsoreducedthroughthelocalcalibrationcoefficientsresultingfromApproachII-R.Furthermore,ApproachII-Rresultedinimprovementsoverthenationallycalibratedmodel
87
for all of the statistics evaluated, therefore, coefficients determined in Approach II-R wererecommended.Althoughcomparisonsweremadefortheindividualmodels(HMArutting,baserutting,andsubgraderutting)aswellasthetotalruttingmodel,onlytheresults forthetotalruttingpredictedusingApproachII-RcoefficientsarelistedinTable8.Thefollowingparameterswere also reported for the predicted total rutting using the recommended local calibrationcoefficients from Approach II-R relative to the measured rutting: total SSE was 3.604, biasof -0.021, and Se/Sy of 0.975. Additionally, itwas reported that at the 95% confidence level,thereweredifferencesbetweenthemeasuredandpredictedtotalrutdepthvalues.Validation of locally calibratedmodels from Approach I-R and II-R with use of thematerial-specific coefficientswasconductedwith sections fromthepavementmanagement systemoftheNorthCarolinaDepartmentofTransportation(17).Fortherecommendedlocallycalibratedcoefficients determined fromApproach II-R, itwas reported the calibrated coefficients over-predicted the total rut depth in the validation dataset. It was found that the differencesbetween predicted and measured total rut depth were statistically significant at the 95%confidence level for the validation set. Parameters regarding the model adequacy and biaswhen applied to the validation dataset are also listed in Table 8. Additional parameters thatwerereportedincludedbiasof0.248andSe/Syof2.317.C.2.7 Ohio(18)A statistical comparison of measured total rutting and predicted total rutting using thenationallycalibratedruttingmodelwasconductedtoevaluatethetotalruttingpredictions(18).The coefficient of determination was calculated and reported as 64%, falling into the faircategory,althoughitwasreportedthatthetherewasa“poorcorrelationbetweenmeasuredand MEPDG predicted rutting” (18). Using a linear regression line for the measured andpredictedtotalruttingplot,threehypothesistestswereconductedtodetermineifbiasexistsinthe predicted ruttingmodels. The hypothesis tests looked at the slope and intercept of thelinear regressionmodel and if themeasured and predicted total rutting represent the samepopulation.Allthreetestsrestedintherejectionofthenullhypothesis,indicatingbiasexistedinthenationallycalibratedmodel.Over-predictionofthetotalrutdepthisapparentintheplotofmeasured versus predicting total rutting shown in Figure 21 of the referenced document(18).Localcalibrationwasattemptedduetothebiasintheformofover-predictionoftotalruttingandpoorcorrelationbetweenmeasuredandpredictedrutting.First,athoroughreviewoftherutting submodel (HMA, base, and subgrade) predictions was completed to check forreasonablepredictionsbasedonengineeringjudgment.Fromthis,itwasfoundthatruttingintheHMAlayercontributedanunreasonableamounttothetotalruttingdespiterelativelythickasphalt concrete layers, indicating a need to adjust the rutting accumulated in the unboundlayers.Localcalibrationwascompletedbymodifyingthelocalcalibrationcoefficient,β1r,oftheHMAruttingsubmodel,andβS1andβS2ofthebaseandsubgraderuttingsubmodels.Oncelocalcalibrationwascomplete,statisticalcomparisonsbetweenmeasuredandpredictedruttingusingtherecalibratedsubmodelswereconducted.Thecoefficientofdeterminationwas

88
calculated and showed a fair correlation (R2 of 0.63). The three hypothesis tests werecompleted to check formodel bias, revealing significant bias remained in themodel despiterecalibration. Specifically, the intercept of the linear regression model was statisticallysignificantlydifferentthanzeroandthepopulationofmeasuredtotallyruttingwasstatisticallysignificantlydifferentthantheMEPDGpredictedrutting.Sewascalculatedtocheckformodelaccuracy,whichshowedanaccuratemodel inthesensethattheSe(0.014in.)wasmuchlessthan that reported for the global total rutting model. Due to the noted bias after localcalibration, it was recommended that a larger data set be used in calibration and a morecomprehensivesetofHMApavementmixturesinOhiobeevaluated.C.2.8 Oregon(19)TheauthorsreportedthatinOregon,ruttinginthebaseandsubgradelayersisnotaproblem,since most of the rutting comes from the HMA layers only. The approach was to set thecalibrationfactorstozeroforbaseandsubgradelayers.Nohypothesestestingwasconductedtodetermineifbiaswaspresent,however,theauthorsreportedthatbiaswasreducedthroughlocal calibration. The only statistic that was reported, Se, was found to be 0.568 beforecalibrationfortheglobalmodel,anditwasreducedto0.180aftercalibration.Inevaluatingtheglobalmodelitwasalsoreportedthatthemuchoftheestimatedruttingwaspredictedforthesubgradelayer.C.2.9 Tennessee(20)An initial verification of the nationally calibrated ruttingmodelswas attempted for both ACpavementsoverlaidwithACandPCCpavementoverlaidwithAC, ignoringrutting inthebaseand subgrade for AC overlays on PCC pavements. Comparisons between measured andpredictedruttingweredrawnforthetwoinputlevelsconsidered(“Level2.5”and“Level1.5”).FortheACoverlaysonPCCpavements,thepredictedruttingintheACfollowedasimilartrendwith time as was observed formeasured rutting. In looking at two input levels, “Level 1.5”resulted in more accurate rutting predictions, whereas “Level 2.5” tended to over-predictrutting in the AC overlay. For the AC overlays on AC pavements, the nationally calibratedmodels over-predicted total rutting for input “Level 1.5” and “Level 2.5.” The predictions ofruttingintheAClayerswerehigherthanmeasuredruttingforbothinput“Level1.5”and“Level2.5”,althoughpredictionsat“Level1.5”werereportedtobemorereasonablethanthelatter.As part of the calibration effort, verification was completed such that predictions from thenationally calibrated model were compared with measured rutting. For AC overlays on PCCpavements, predictions with the global model were made using Level 1 inputs for the ACoverlayandLevel3 inputs for theexistingPCCpavement,base, and subgradematerial.Onlyrutting in the AC overlay was consideredwhere the overlay was placed on PCC pavements.Total rutting was considered for AC pavement and AC overlays on AC pavements. For PCCpavements with AC overlays, in looking at two traffic levels, low (0-1,000 AADTT) and high(1,000-2,500AADTT),itwasfoundthatthelowtrafficlevelsresultedinpoorruttingpredictionsthat under-estimated rutting in the AC overlay. In the case of high traffic levels, predictionswere reasonable relative to measured rut depths, therefore, calibration was deemedunnecessary.ForACoverlaysonACpavements,comparisonsbetweenruttingpredictionsand
89
measuredrutdepthsindicatedthatthenationallycalibratedmodelover-predictedtotalruttingforACpavementsandACoverlaysonACpavements.Results from theverificationeffort aresummarizedinTable7.Basedontheresultsofthemoredetailedverificationeffort,modelcoefficientswerecalibratedforeachofthreecategoriesofpavements.ForACoverlaysonPCCpavementswithlowtraffic,calibrationwas conductedby varying theβr1 coefficient,whileβr2 andβr3wereheld to theirdefaultvalueof1.0;coefficientsforβBSandβSGwereassignedavalueofzero.ACoverlaysonACpavementsandnewACpavementswereanalyzedtogether.Thelocalcoefficients,βr1,βBS,andβSGwerevariedtominimizetheSe.Althoughitwasreportedintheverificationeffortthatcalibration was deemed unnecessary for AC overlays on PCC pavements with high traffic,calibrationwas attempted. The local calibration coefficient,βr1,was varied in the calibrationprocedure and attempts to minimize the Se only resulted in the same value (1.0, which isconsistentwiththenationallycalibratedmodel),itwasconcludedthatnolocalcalibrationwasnecessary for the high traffic volume. While not necessarily calibration, the authors laterreportedinTable5.3(page125ofthereferenceddocument)coefficientsofzerofortheβBSandβSGforACoverlaysonPCCpavementswithhightraffic.ResultsofthelocalcalibrationfortheothertwopavementcategoriesarelistedinTable8.AsaresultofthelocalcalibrationforACoverlaysonPCCpavementswithlowtrafficlevels,theβr1increasedfrom1.0inthenationallycalibratedmodelto2.20inthelocallycalibratedmodel.ForAC overlay on AC pavements and new AC pavements, the local calibration resulted in newcoefficientsforβr1,βBS,andβSGandalsoimprovedtheruttingpredictionsC.2.10 Utah(21)The verification of the national rutting model indicated that the rutting predictions wereadequateforolderpavementthatusedviscositygradedasphalt(68datapoints),butwerepoorfornewerpavementthatusedSuperpavemixes(86datapoints).Statisticalparametersfortheverification effort of the newer Superpave mixes are listed in Table 7 of this report. Localcalibrationofthethreeruttingsubmodels(HMA,base,andsubgrade)wasconductedtopredictrutting for current HMAmixes using Superpavemix design and usingmostly Level 3 inputs.Afterlocalcalibration,apoorcorrelationbetweenmeasuredandpredictedruttingwasfound.ThiswasattributedtothemeasuredruttingdataobtainedfromtheUDOTPMSdatabase,whichwasmeasured using a laser system and converted to LTPP standards. No improvementwasfoundonSe,butthesignificantbiaswaseliminated.C.2.11 Washington(23)VerificationoftheMEPDGusingglobalcalibrationfactorsshowedthattheruttingwasunder-predicted; hence, the next step was to conduct calibration. After calibration, the authorsreported that the calibrated model estimation matched well with performance data inmagnitudeandprogression.However,asitwasmentionedinthedescriptionofmethodologies,statistics were not reported. The authors also indicated that WSDOT does not typically

90
experience rutting in the base and subgrade; hence, rutting should be presented as onlyoccurringinthesurfacelayer.Thiswascorrectedbysettingsubgraderuttingfactorsto0.C.2.12 WisconsinVerificationwascompletedinVersion1.0usinginputsandperformancedataofLTPPsectionsinWisconsin.Predictedruttingwascomparedwithfieldperformancedata,fromwhichitwasreportedthatthedefaultcalibrationcoefficientsproducedtotalpavementruttingpredictionsthatwerestatisticallydifferent fromruttingmeasured inthe field.Thus, localcalibrationwasthen conducted tomodify the local calibration coefficients of the HMA, base, and subgraderutting models (24). The new model coefficients obtained through local calibration are asfollows(25):
ACRuttingβr1 =0.477GranularBaseRutting βs1 =0.195SubgradeRutting βs1 =0.451
C.3 Thermal(Transverse)Cracking
C.3.1 Arizona(10)VerificationofthetransversecrackingmodelusingLevel3wasconductedforallHMAsectionsat the LTPP SPS-1 site in Arizona. The coefficient, K, for Level 3 was shown as 3.0 in theAppendixoftheArizonareport(10).However,indiscussionsoftheverificationeffort(page71),K was listed as 1.5 for the Level 3 designs completed to evaluate the nationally calibratedmodel. Therefore, it is assumed a K-value of 1.5 was the value utilized in the nationallycalibrated model. A non-statistical analysis was completed by comparing measured versustransverse crackingpredictedusing theglobalMEPDGmodel. Theauthors indicated that thesoftware under-predicted transverse cracking for a range of HMA sections. As a result, localcalibrationwasdeemednecessary.LocalcalibrationwasattemptedataLevel3analysisbymodifyingthecalibrationparameter,K.ResearchersvariedthevalueofK (upto100)untilonaverage,predictivetransversecrackingmatched measured cracking. At a value of K = 100, predictions roughly matched measuredcracking at high magnitudes but over-predicted at low magnitudes of transverse cracking.Predictions at K = 50 were not consistent for all climatic locations. The authors’recommendationwastonotusetransversecrackingasdesigncriteria.
C.3.2 Colorado(11)Modelverificationofthetransversecrackingmodelwascompletedusing12datapoints.Sincethe transverse crackingmodel is very sensitive, the authors recommended that only Level 1HMAcreep compliance and indirect tensile strength inputsbeused for local calibration. Theglobalmodelwasfoundtounder-predictmeasuredtransversecracking.Sincepoorgoodnessoffitwasfound,calibrationofthetransversecrackingmodelwasrecommended.Calibrationwasconductedusingthesame12datapointsandindicatedthatpredictionswerereasonable.ByvaryingtheKcoefficientfrom1to10incrementallyandevaluatingthepredicted

91
transverse cracking, researchers arrived at a locally calibrated coefficient of 7.5, whichproduced thebestgoodnessof fitand the leastbias.The resultingR2valueof43.1%wasanimprovementoverthenationallycalibratedmodelandwasdeemedadequate.Alargeincreasein Se was reported with the nationally calibrated model at 0.00232 ft/mi and the locallycalibratedmodel at 194 ft/mi, however, researchers consideredboth values tobeadequate.Additionally, itwasreportedthatthesignificantbias found inthenationallycalibratedmodelwaseliminatedwithlocalcalibration.C.3.3 Iowa(13)Iowa conducted transverse cracking model verification by plotting the measured transversecracksinfeetpermileagainsttransversecrackspredictedbythenationallycalibratedthermalcrackingmodel.Bias and standarderrorwerealso reported.Although significant amountsofthermalcrackingweremeasuredinthefield,thenationallycalibratedthermalcrackingmodelpredictedminimallevelsofthermalcracking.Asaresult,alargestandarderrorof1,203andalargebiasof-446werereported.Duetothelargedisparitybetweenmeasuredandpredictedthermalcracking,thethermalcrackingmodelwasnotconsideredforlocalcalibration.C.3.4 Missouri(14,27)In verifying the transverse cracking model, two levels of inputs, Level 1 and Level 3, wereconsideredfortheHMAcreepcomplianceandindirecttensile.Atotalof49datapointswereusedtoverifythemodelatbothlevels.WhenLevel3designswereused,theauthorsreportedthat the MEPDG under-predicted the measured cracking; when a Level 1 design was used,predictionswereslightlyimprovedbutstillshowedasignificantbias.Althoughpredictionswerereportedto improvewhenaLevel1designwasused,theR2andSewereactuallyworsethanstatistics for the Level 3 design according to the report. In the Volume I report (14), whichsummarizes the findings of the calibration efforts, the Se for the verification of the Level 3nationally calibrated model is listed as 0.15 ft/mi (Table I-66 on page 186); however, theVolumeIIreport(27),whichdetailsthemodelverificationandcalibrationefforts,hasamuchlarger value of 281 ft/mi listed for Se (Table 17 on page 56). This is the only statistic that isreported differently between the two reports for the transverse cracking model. Therecommendationwastorecalibratethemodel.Calibrationwasconductedusingthesame49datapointsandindicatedthatpredictionswereexcellentbutslightlybiased(R2=0.91andSe=51.4ft/mi).It is not clearly statedwhich level (1, 2, or 3)was used in the local calibration effort. ItwasnotedthatdefaultHMAcreepcomplianceandHMAtensilestrengthvalueswerereplacedwithMoDOTspecificvaluesandthelocalcalibrationcoefficient,βt,wasmodifiedfrom1.5to0.625toreducebias.TheuseofMoDOTspecificvalueswouldimplythataLevel1designwasusedinthecalibrationeffort.Itshouldalsobenotedthatβtisthelocalcalibrationcoefficientandhasadefaultvalueof1.0inthesoftware;therefore,itisassumedthiswasmeanttodescribetheK-value.However,variousvalueshavebeenreportedforKataLevel1design(asshowninA.3):in the PavementME software (Version 2.1), K has a default value of 1.5; in theManual of

92
PracticethedefaultvalueforKisreportedas5.0.Indescribingthenationallycalibrateddefaultmodel,theK-valueswerelistedinthereferenceddocumentonpage7(27)asfollows:
• AtLevel1,K=5.0• AtLevel2,K=1.5• AtLevel3,K=3.0.
However, the statement on page 57, which implied a Level 1 design was utilized in localcalibrationwhilealsostatingthecoefficientwaschangedfrom1.5to0.625,indicatesthattheabove valuesmay have been reported incorrectly on page 7 (27). Therefore, Table 9 of thisreport,forbothverificationandcalibration,reflectsthedefaultK-valuesastheyarepresentedinA.3forthePavementMEsoftware.C.3.5 NortheasternStates(15)Transversecrackingpredictedbythenationallycalibratedmodelwascomparedwithmeasuredtransverse cracking from 17 LTPP sections in the NE region (17). It was found that inmanycases, themeasured transverse crackingdidnot increaseover timeas themodelpredicts. Itwas believed that measurements were made in error; as a result, calibration was notperformedonthetransversecrackingmodel.C.3.6 Ohio(18)A non-statistical comparison of measured and predicted transverse cracking was used toevaluate the nationally calibrated thermal (transverse) cracking model. The measuredtransverse cracking from the LTPP projects (SPS-1 and SPS-9) was divided into four groupsbasedontheextentofcracking,as listedbelow.Thenationallycalibratedmodelwasusedtopredicttransversecrackingtodeterminehowfrequentlythepredictedvaluesfell inthesamecategoryasthemeasuredvalues.
a. 0-250ft/mileb. 250-500ft/milec. 500-1000ft/miled. 1000-2000ft/mile
Itwas found that all predicted transverse cracking fell into the same rangeas themeasuredcracking (0-250 ft/mile).Despite theadequateperformanceof theglobal transverse crackingmodel,itwasrecommendedthatduetothelimitedscaleoftransversecrackingmeasurements(maximummeasurementof110ft/mile),amoredetailed reviewshouldbecompletedon theadequacyofthedefaultHMAcreepcomplianceandtensilestrengthwithintheMEPDG.
C.3.7 Oregon(19)VerificationofthenationallycalibratedmodelwasattemptedforaLevel3designwithvalueofKequalto1.5.ThenationallycalibratedmodelresultedinaSeof121.Nootherstatisticswerereported.Theauthorsreportedthat theDarwinM-Econsiderablyunder-predictedtransversecrackingrelativetotheactualmeasuredcrackinginthefield.

93
Inanefforttocalibratethemodel,iterativerunstooptimizethethermalcrackingmodelwereconducted by changing K from 1.5 to 12.5 for 15 projects. Reasonable estimates of thermalcrackingwere foundwithavalueof10,but the locallycalibratedmodeldidnot improvetheprediction compared to the nationally calibrated model. The Se before calibration was 121,however,theSeincreasedto751aftercalibration.Basedontheresultsofthelocalcalibrationeffort, researchers recommended that additional projectswithmore variation in cracking beincludedinfuturecalibrationefforts.C.3.8 Utah(21)Similartotheprocedurefollowedforalligatorcracking,anon-statisticalapproachforvalidatingthe nationally calibratedmodelwas conducted using Level 3 inputs. The predictions showedthat the nationalmodel predicted crackingwell for the fairly newer pavements constructedusing Superpave binders. For older pavement sections that used conventional binders, thepredictions were very poor and under-predictedmeasured transverse cracking. The authorsindicatedthatlocalcalibrationofthemodelwasnotrequired.C.3.9 Washington(23)VerificationofthetransversecrackingmodelwasconductedbyplottingWSPMSdataandtheMEPDG predictions using default calibration coefficients over time. No statistics werepresented,buttheauthorsindicatedthattheMEPDGtransversecrackingmodelusingdefaultcalibrationfactorscanreasonablyestimateWSDOTtransversecracking.C.3.10 WisconsinVerificationofthetransversecrackingmodelwasconductedfortheLTPPsectionsovertime.Adesign was conducted for each of the 94 data points, and a non-statistical comparison ofmeasured and predicted transverse cracking was performed. The results indicated that thenationallycalibratedtransversecrackingmodelusingdefaultcalibrationfactorsover-predictedtransverse cracking in Wisconsin. Thus, the transverse cracking model was recalibrated byvarying the calibration parameter (24). For the locally calibrated model, the K-values werereportedonpage92ofthedraftusermanual(25)asfollows:
• AtLevel1,K=3.0• AtLevel2,K=0.5• AtLevel3,K=3.0
C.4 IRI
C.4.1 Arizona(10)VerificationoftheIRImodelwasconductedusingatotalof675datapoints.Thegoodness-of-fitreportedwaspoorwithanR2of30%andSereportedas18.7 in/mi.Bias intheformof largeover-predictions for lower IRI andunder-predictions forhigher IRIwasobserved.Asa result,localcalibrationwasdeemednecessary.Itshouldbenotedthatthedefaultcalibrationcoefficients,C1andC4forthemodel,werelisteddifferently than reported in the Manual of Practice. In the Appendix (page 188) of the
94
referenced report, C4 is reported as 40 and is listed as themodel coefficient for the ruttingterm,andC1islistedas0.015asthemodelcoefficientforthesitefactorterm.ThisiscontrarytothecoefficientsreportedintheManualofPractice(asshowninA.6),whereC1islistedasthemodelcoefficientforrutdepthwithavalueof40,andC4islistedasthemodelcoefficientforthesitefactorwithavalueof0.015.However,onpage77inTable28ofthereferencereport,thetermsareconsistentwiththeManualofPractice:C4isreportedasthemodelcoefficientforsitefactorandC1asthemodelcoefficientforrutting.Inordertobeconsistent,Table10listsC1as40andasthemodelcoefficientfortheruttingtermandC4isshownasthevalue0.015andas the model coefficient for the site factor (for the global model). The model coefficientreportedinTable10aftercalibrationrepresentthesameterms:C1fortheruttingtermandC4forthesitefactorterm.Localcalibrationwasconductedusing559datapoints.Thegoodness-of-fitreportedwasverygood with an R2 of 82.2% and Se of 8.7 in/mi. It should be noted that the authors of thereferenced study (10) reported different statistics in Chapters 3 and 8. In Chapter 3 of thedocument (Page 77, Table 28), R2 was reported as 82.2% and Se was shown as 8.7 in/mi.However, in Chapter 8 (Page 175, Table 65), R2was reported as 80% and Sewas listed as 8in/mi.Regardlessofthediscrepanciesinstatistics,bothsetsshowthelocalcalibrationresultedinverygoodpredictionsofIRI.Additionally,thestatisticsreportedonpage77inTable28andtheplotofmeasuredversuspredictedIRIrevealedtheover-predictionbiasintheglobalmodelwasremovedthroughlocalcalibration.C.4.2 Colorado(11)ColoradoconductedverificationoftheIRImodelusing343datapoints.Itwasreportedthatthenationally calibratedmodel hadpoor goodness of fit andbias in thepredictions.Although itwas reported that “themodel over-predicts IRI for highermeasured IRI values,” the plot ofmeasured versus predicted IRI shown in the referenced document (Figure 98, page 139)indicates under-prediction for higher magnitudes of measured IRI values. Calibration wasrecommendedandwasconductedusingthesamenumberofdatapoints.Itwasfoundthatthegoodnessoffitwassignificantlyimproved.Discrepancieswerealsofoundinthisstudy.Onpage140,Equation12,ofthereferencereport(11)C4isreportedasthemodelcoefficientfortheruttingtermandC1asthemodelcoefficientforthesitefactorterm.Onpage140,inTable67ofthereport,C4isreferredtoasthemodelcoefficientforsitefactorandC1asthemodel coefficient for rutting. In order to be consistentwith theManual of Practice, theMEDPGdefaultcoefficientsarelistedinTable10forC1as40forthemodelcoefficientfortheruttingterm,andC4as0.015forthemodelcoefficientforthesitefactor(fortheglobalmodel).Additionally, themodel coefficient reported in Table 10 after calibration represent the sameterms:C1fortheruttingtermandC4forthesitefactorterm.C.4.3 Iowa(13)Measured IRIvalueswereplottedagainst IRIvaluespredictedby thenationallycalibrated IRImodel using the distress inputs predicted by the corresponding nationally calibrated distressmodels. This approach resulted in good estimation of field measurements. Alternatively, IRI
95
valueswerealsopredictedusingnationallycalibratedcoefficientsintheIRImodelwithinputs(rut depth, fatigue cracking, and thermal cracking) predicted by locally calibrated distressmodels.ThesevalueswereplottedwiththemeasuredIRIvalues.ThisapproachalsoresultedingoodestimationofmeasuredIRIvalues.Researchersdidnotconsiderthemodificationofthenationally calibratedcoefficientsdue to thegoodestimationofmeasured IRI valuesbyusingeitherinputsfromnationallycalibrateddistressmodelsorinputsfromlocallycalibrateddistressmodels.Researchersalsocitetheexpectedimprovementin longitudinalcrackingandthermalcrackingthroughothernationalstudiesasareasonfornotcalibratingtheIRImodel.C.4.4 Missouri(14)A total of 125 data points were used to verify the adequacy of the nationally calibrated IRImodel. As shown in Appendix A.6, the IRI model utilizes predicted transverse cracking (TC),fatiguecracking (FC),andrutdepth(RD)tocompute IRI. InverifyingthenationallycalibratedmodelforMoDOT,theresultsoflocallycalibratedruttingandtransversecrackingmodelswereutilizedtopredictIRI.Theauthorsreportedthatareasonablepredictionwasfound(R2=0.54,Se = 13.2 in/mi), but a slight bias was present. For higher magnitudes of IRI, slight under-estimates,although“notverysignificant,”werereportedforthenationallycalibratedIRImodel(14).Local calibration was conducted to remove the bias and improve the accuracy of thepredictions.Twosetsofstatisticswerereportedinthereferencedocument(14)regardingtheresults of the local calibration, with no explanation for the differences. In Figure I-127 thecoefficientofdetermination,R2,wasreportedas58%,theSewasshownas12.8in/mi,andthenumberofdatapointsutilizedinthelocalcalibrationwasshownas121.However,inTableI-71thefollowingstatisticswerereported:R2of53%,Seof13.2in/mi,andnumberofdatapointsas125.ThevaluesshowninTable10ofthisreportreflectthevaluesshowninTableI-71ofthereferencedocument(14),asthisisthemostcompletesetofstatisticsreportedforthelocallycalibratedmodel.Althoughtherearedifferencesinstatisticsreported,theyaresmall,andbothshowareasonablecorrelationbetweenmeasuredandpredictedIRIwiththelocallycalibratedIRImodel.SomebiasinthepredictedIRIwasfoundwiththelocallycalibratedmodel,however,theamountofbiaswasconsideredreasonable.Theauthorsconcludedthatthemodelcanbeusedinroutinedesigns.C.4.5 NortheasternStates(15)MeasuredIRIvaluesfrom15LTPPsectionswerecomparedwithpredictedIRIvaluesfromthenationally calibrated model. A very poor correlation was reported, particularly for highmeasuredIRIvalues.Additionally,thenationallycalibratedmodelwasreportedtohaveanSSEof 1.557. Regional calibrationwas completed and resulted in improvements over predictionsmadebythenationallycalibratedmodelwithareportedSSEof0.799.C.4.6 Ohio(18)AstatisticalcomparisonbetweenmeasuredIRIandIRIpredictedbythenationallycalibratedIRImodelwasconducted.Thecoefficientofdeterminationwasdeterminedtobe0.008,indicatingapoor correlationbetweenmeasuredandpredicted IRI. Thedefault IRImodelwas found to

96
over-predict IRI for lowermagnitudes (less than 80 inches/mile) and under-predict at highermeasuredIRIvalues(greaterthan80inches/mile).Additionally,significantbiaswasreportedinthepredictedIRI.TheSewasfoundtobelowerthanthatreportedforthedevelopmentofthenationally calibratedmodel (18.9 in/mile). Although this is reported in the text as both 19.8in/mileand9.8in/mile,itisbelievedtobethelowerofthesetwovalues,sinceitwasreportedtobelowerthanthenationallycalibratedmodel.LocalcalibrationwasconductedandastatisticalcomparisonwithmeasuredIRIwascompletedtoevaluatethecalibratedmodel. ItwasfoundtheSeofthelocallycalibratedmodelwasverysimilar to the nationally calibrated model. Hypothesis testing was also conducted, whichshowed that the null hypothesis for the intercept and slope were rejected while the nullhypothesis for thepaired t-testwasaccepted. The levelofbiaswas reducedwith the locallycalibratedmodelandwasconsideredmorereasonablethanthenationallycalibratedmodelC.4.7 Tennessee(20)Averificationexercisewasconductedusing19pavementsections inTennessee;however,nostatisticswerereportedontheaccuracyorbiasof thepredictedroughness.AsPSI isusedtocharacterize roughness in Tennessee; IRI predicted by the nationally calibrated model wasconverted to PSI using a previously established PSI-IRI relationship. Two input levels wereconsideredintheverification,“Level1.5”and“Level2.5”,whichresultedinsimilarpredictionsofIRI.ItwassuggestedthatsinceIRIisdependentonrutting,fatiguecracking,thermalcracking,site, and other factors, the similarities in predictionswere both a result of no transverse orlongitudinalcrackingpredictedforeither“Level1.5”or“Level2.5”andthesmall influenceofAClayerpropertiesonalligatorcracking.Theeffectof traffic levelonPSIpredictionwasalsoevaluatedandcomparedwithmeasuredPSI. Itwas found that for cumulative ESALsover a 20-year designperiodbetween0 and4.5million, pavement roughnesswasunder-predicted.However, the rateof decrease inPSIwassimilartotherateformeasuredPSI.ForcumulativeESALsbetween4.5and9millionoverthesame design period, predicted and measured PSI agreed well, although measured PSI wasreported to have high variability. Although local calibration was recommended, it was notconducted.C.4.8 Utah(21)Thenationally calibrated IRImodelwasevaluated. Theauthors indicated that for the ruttinginput,the locallycalibratedmodelwasused. It isassumedthattheremaining inputsresultedfromnationallycalibrateddistressmodels.A totalof162datapointswereusedtoverify theadequacyofthemodel.AgoodcorrelationbetweenmeasuredandMEPDG-predicted IRIwasfound, and the standard error of estimate (Se)was about the same as that reported for thenationalMEPDG IRImodel. Somebias in the predicted IRIwas found, but itwas consideredinsignificant.Localcalibrationwasnotrequired.

97
C.4.9 Washington(23)ItwasfoundthatwhencalibratedcrackingandruttingestimateswereusedwiththedefaultIRImodel, the results under-predicted actualWSDOT roughness, although the differences weresmall.Thiswasbelievedtobeduetotheeffectofstuddedtirewear inWashington,which isnot modeled in the MEPDG. It was noted that the differences could be resolved throughcalibrationofthemodelandthatstuddedtirewearcouldbeadjustedthroughthesitefactorinthemodel.However,theauthorsindicatedthattheIRImodelcouldnotbecalibratedbecauseofbugsintheMEPDGsoftware.C.4.10 WisconsinVerificationoftheIRImodelwasconductedfortheLTPPsections.Asfortheverificationofthedistressmodels,adesignwasconductedforeachofthe142datapoints,andthepredictedIRIresultswere comparedwith the fieldmeasureddata. The results indicated thatwhile theR2(0.6273)andSEE (5.694 in/mi)were reasonable, thenationallycalibrated IRImodelgenerallyover-predictedIRIwhenitwaslessthan70in/miandunder-predictedIRIwhenitwasgreaterthan70in/mi.Inaddition,astatisticaltestshowedthatthedifferencebetweenthepredictedandmeasuredIRIvalueswasstatisticallysignificant(24).Thus,theIRImodelwasrecalibrated,andthelocallycalibratedcoefficientsareasfollows(25):
IRIC1 =8.6733IRIC2 =0.4367IRIC3 =0.00256IRIC4 =0.0134
C.5 Top-Down(Longitudinal)Cracking
C.5.1 Iowa(13)The globalmodelwas evaluatedby plottingmeasured versus predicted longitudinal crackinganddetermining thebiasandstandarderrorofbothmodels. Itwas reported that theglobalmodelseverelyunder-predictedtheextentoflongitudinalcrackinginboththecalibrationandvalidationdatasets.Althoughthelocallycalibratedmodelresultedinimprovedpredictionsandbiasrelativetotheglobalmodel,biaswasstillpresent.Alargestandarderrorwasalsoreportedinpredictions forboth the calibrationandvalidation setsof 2,767and2,958, respectively. Itwas recommended that predictions of longitudinal cracking in theMEPDG be used only forexperimentalorinformationalpurposesuntiltheongoingrefinementofthemodeliscompleteanditisfullyimplemented.C.5.2 NortheasternStates(15)CalibrationwasperformedbyminimizingtheSSEbetweenpredictedandmeasuredlongitudinalcracking using Microsoft Excel Solver. In comparing measured longitudinal cracking withpredicted cracking, itwas found that thenationally calibratedmodel severely under-predictsthe extent of longitudinal cracking. Additionally, the SSE for was found to be 58.18 for theNortheasternLTPPsectionsused inthestudy.Byperformingtheregionalcalibration, theSSEwas reduced to 25.67 and an improvementwas realized in longitudinal cracking predictionsrelativetomeasuredlongitudinalcracking.
98
C.5.3 Oregon(19)VerificationoftheDarwinMEusingglobalcalibrationfactorsshowedthatthesoftwareeitherunder-estimates or over-estimates the distress considerably. Local calibration wasrecommended.Aftercalibration,themodelwasimproved,buttherewasalsoahighdegreeofvariabilitybetweenthepredictedandmeasureddistresses.Thestandarderroroftheestimate(Se)was3601beforecalibrationand2569aftercalibration.C.5.4 Washington(23)Verificationof the longitudinalcrackingmodelwasconductedbyplottingMEPDGpredictionsusing default calibration factors and Washington State Pavement Management System(WSPMS) data over time. The default model tended to under-predict WSPMS data. Localcalibrationcoefficientswereused topredict longitudinal crackingandwerealsoplottedwithWSPMS data over time. No statistics were presented, but plots of predicted longitudinalcrackingovertimeshowedthatthemodelestimationsbythecalibratedanddefaultcalibrationfactorsweresignificantlydifferent.Theauthorsindicatedthatthepredictionsusingcalibratedfactors show a similar level and progression of distress as theWSPMS longitudinal crackingdata. They concluded that the calibrated model is able to reasonably estimate longitudinalcrackingforWSDOT.