
NCAT Report 18-01 MATERIAL SELECTION GUIDANCE FOR ASPHALT PAVEMENT DESIGN...
62
NCAT Report 18-01 MATERIAL SELECTION GUIDANCE FOR ASPHALT PAVEMENT DESIGN Dr. Carolina Rodezno Dr. David H. Timm Dr. Mary Robbins Dr. Nam Tran June 2018
Transcript of NCAT Report 18-01 MATERIAL SELECTION GUIDANCE FOR ASPHALT PAVEMENT DESIGN...

NCAT Report 18-01
MATERIAL SELECTION
GUIDANCE FOR ASPHALT PAVEMENT DESIGN
Dr. Carolina Rodezno Dr. David H. Timm Dr. Mary Robbins
Dr. Nam Tran
June 2018
ii
MATERIAL SELECTION GUIDANCE FOR ASPHALT PAVEMENT DESIGN
Dr. Carolina Rodezno Assistant Research Professor
National Center for Asphalt Technology
Dr. David H. Timm, P.E. Brasfield and Gorrie Professor of Civil Engineering
Principal Investigator
Dr. Mary M. Robbins Assistant Research Professor
National Center for Asphalt Technology
Dr. Nam Tran, P.E. Associate Research Professor
National Center for Asphalt Technology
Sponsored by National Asphalt Pavement Association
June 2018

iii
iv
ACKNOWLEDGEMENTS The authors wish to thank the National Asphalt Pavement Association for sponsoring this research as part of the Optimizing Flexible Pavement Design and Material Selection research project and for providing technical review of this document.
DISCLAIMER The contents of this report reflect the views of the authors who are responsible for the facts and accuracy of the data presented herein. The contents do not necessarily reflect the official views or policies of the sponsoring agency, the National Center for Asphalt Technology or Auburn University. This report does not constitute a standard, specification, or regulation. Comments contained in this paper related to specific testing equipment and materials should not be considered an endorsement of any commercial product or service; no such endorsement is intended or implied.

v
TABLE OF CONTENTS 1 Introduction ............................................................................................................................ 7
2 Structural Pavement Design with Innovative and Sustainable Materials .............................. 8
2.1 1993 AASHTO Design Guide ............................................................................................. 8
2.2 AASHTO Mechanistic‐Empirical (M‐E) Pavement Design Guide .................................... 14
2.2.1 MEPDG Material Properties .................................................................................... 16 2.2.2 MEPDG Empirical Performance Predictions ........................................................... 16
2.3 Perpetual Pavement Design ........................................................................................... 17
2.3.1 Perpetual Pavement Design Procedure .................................................................. 19 2.4 Summary ........................................................................................................................ 22
3 Sustainable Materials for Asphalt Pavement Design ............................................................ 23
3.1 Warm Mix Asphalt .......................................................................................................... 23
3.1.1 WMA Categories ..................................................................................................... 25 3.1.2 WMA Mix Design .................................................................................................... 25 3.1.3 Laboratory and Field Performance Evaluation of WMA ......................................... 26 3.1.4 WMA Summary ....................................................................................................... 29
3.2 Reclaimed Asphalt Pavement and Recycled Asphalt Shingles ....................................... 30
3.2.1 Reclaimed Asphalt Pavement ................................................................................. 30 3.2.2 Recycled Asphalt Shingles ....................................................................................... 35 3.2.3 Recycled Materials Summary.................................................................................. 39
3.3 Recycled Tire Rubber (RTR) ............................................................................................ 40
3.3.1 RTR Production Methods ........................................................................................ 41 3.3.2 Rubber‐Modified Asphalt Technologies ................................................................. 41 3.3.3 RTR Applications ..................................................................................................... 43 3.3.4 Performance of RTR Asphalt Technologies ............................................................. 44 3.3.5 RTR Summary .......................................................................................................... 45
3.4 Stone Matrix Asphalt (SMA) ........................................................................................... 46
3.4.1 SMA Mix Design ...................................................................................................... 47 3.4.2 Performance of SMA Mixes .................................................................................... 48 3.4.3 SMA Summary ......................................................................................................... 48
3.5 Cold Recycling................................................................................................................. 49
3.5.1 Cold Recycling Mix Design ...................................................................................... 50 3.5.2 Performance of Cold Recycling Mixtures ................................................................ 51 3.5.3 Cold Recycling Summary ......................................................................................... 52
3.6 Polymer‐Modified Asphalt ............................................................................................. 52
3.6.1 Performance of Polymer‐Modified Asphalt Mixes ................................................. 53 3.6.2 Polymer‐Modified Asphalt Summary ..................................................................... 54
4 Summary ............................................................................................................................... 55
4.1 Warm Mix Asphalt .......................................................................................................... 55

vi
4.2 Reclaimed Asphalt Pavement (RAP) and Recycled Asphalt Shingles (RAS) ................... 55
4.3 Recycled Tire Rubber (RTR) ............................................................................................ 56
4.4 Stone Matrix Asphalt (SMA) ........................................................................................... 56
4.5 Cold Recycling................................................................................................................. 56
4.6 Polymer‐Modified Asphalt (PMA) .................................................................................. 56
5 References ............................................................................................................................ 57
List of Tables
Table 1 Recommended Strain Ratios for Perpetual Pavement Design (18) ................................. 21 Table 2 RAP Processing Options (34) ............................................................................................ 31 Table 3 Shingle Composition (43) ................................................................................................. 36 Table 4 Mix Types in terms of RAP/RAS Percentages (45) ........................................................... 37 Table 5 Mix Types in terms of RAS Percentages (49) ................................................................... 38 Table 6 RTR Gradation used by Different Agencies (60, 61, 62, 63, 64 ) ...................................... 42 Table 7 Typical Asphalt Rubber Binder Laboratory Reaction Profile Design (60, 61, 62) ............. 42 Table 8 Typical Asphalt Rubber Binder Laboratory Reaction Profile Design (65) ........................ 42 Table 9 Requirements for Coarse Aggregates Used in SMA ......................................................... 47 Table 10 Requirements for Fine Aggregates Used in SMA ........................................................... 47 Table 11 SMA Mixture Specification for Superpave Gyratory Compactor ................................... 48
List of Figures Figure 1 Structural Number Concept (3)......................................................................................... 9 Figure 2 Flexible Pavement Design Curves with a1 = 0.44 (2) ......................................................... 9 Figure 3 Structural Coefficient Usage in the U.S. (3) .................................................................... 10 Figure 4 Pavement Cross‐Sections in Alabama Recalibration Study (4) ....................................... 11 Figure 5 Structural Coefficients in Alabama Recalibration Study (4) ........................................... 11 Figure 6 Alabama Structural Coefficient Validation Sections (6) .................................................. 13 Figure 7 Alabama Structural Coefficient Validation Structural Coefficients (6) ........................... 13 Figure 8 M‐E Design Framework (3) ............................................................................................. 15 Figure 9 Perpetual Pavement Design Concept (13) ...................................................................... 18 Figure 10 Perpetual Pavement Design Framework (3) ................................................................. 20 Figure 11 Example Design Strain Distribution .............................................................................. 22 Figure 12 WMA Usage by Owner Segments, 2009‐2014 (22) ...................................................... 24 Figure 13 Asphalt Rubber Binder (left) and Terminal Blend Binder (right) (70) ........................... 44 Figure 14 Cumulative Crack Length vs. ALF Wheel Load Passes for Test Sections (71) ............... 45
Rodezno, Timm, Robbins, Tran
7
1 INTRODUCTION
Over the years, the asphalt industry has developed and quickly adopted a number of innovative and sustainable materials and technologies (hereinafter referred to as materials) for use in flexible pavements. While sustainability is a broadly‐used term, within this report it refers to the usage of specific materials meant to reduce the consumption of virgin raw materials or otherwise reduce the carbon footprint of asphalt mixture production. Specific examples of these sustainable and innovative materials include warm mix asphalt (WMA), recycled asphalt shingles (RAS), reclaimed asphalt pavement (RAP), recycled tire rubber (RTR), stone matrix asphalt (SMA), and cold recycled mixtures. These materials offer economic, engineering, and environmental advantages over conventional materials when their use in structural pavement design is carefully considered to arrive at optimized structures.
The purpose of this document is to provide guidance for flexible pavement design methods to arrive at optimized pavement structures when innovative and sustainable materials are used, and also to identify the challenges when trying to incorporate these materials. This report also provides a basic understanding of different materials and technologies, mix design considerations, material properties, performance, and possible applications.
Rodezno, Timm, Robbins, Tran
8
2 STRUCTURAL PAVEMENT DESIGN WITH INNOVATIVE AND SUSTAINABLE MATERIALS
There are currently several methods for flexible pavement design in the United States. They include, but are not limited to, the empirical AASHTO pavement design method (1993 AASHTO Design Guide), the AASHTO Mechanistic‐Empirical Pavement Design Guide (MEPDG) and perpetual pavement design. In each of these design methods, innovative and sustainable materials can be strategically incorporated into pavement structural design by carefully considering their structural performance characteristics.
In the following sections, each design method is briefly described, followed by proposed changes to each design method to arrive at optimized pavement structures when innovative or sustainable materials are specified.
2.1 1993 AASHTO Design Guide
The 1993 AASHTO Design Guide represents the last major update of the empirical flexible pavement design method first developed by AASHTO in the 1960s (1). This method is a strictly empirical approach that relies on correlations between pavement structural characteristics, traffic applications, and observed pavement performance at the AASHO Road Test (2). While it is an older pavement design method, it is still widely used throughout the U.S., with 39 state departments of transportation currently using some form of the AASHTO empirical method (3). The official software companion to the 1993 AASHTO Design Guide was DARWin, though it is no longer supported by AASHTO. Spreadsheet templates have also been developed to implement the 1993 methodology and recently PaveXPress was developed by Pavia Systems Inc. to provide a web‐based design platform.
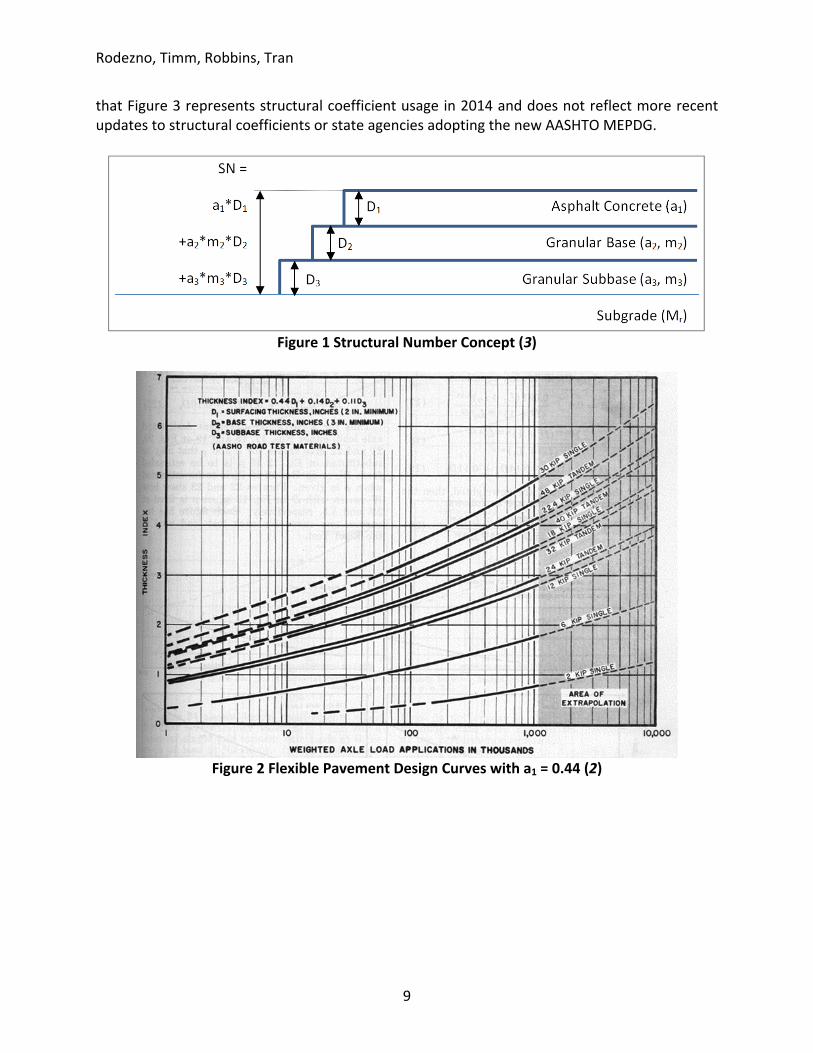
Central to the AASHTO empirical method is the structural number of the pavement, as depicted in Figure 1. The structural number expresses the cumulative pavement structure above the subgrade in terms of each layer’s thickness (D) multiplied by its corresponding structural coefficient (a) and, for the lower pavement layers, drainage coefficient (m). This concept was developed by AASHTO to quantify the total pavement structure in terms of a single number for a cross section comprised of fundamentally different pavement layers. For structural pavement design, a required structural number is first computed and then divided by the structural coefficient to determine thickness; therefore, the structural coefficients are critically important to selecting the pavement thickness. Consequently, small changes in the structural coefficient can lead to relatively large changes in required pavement thickness.
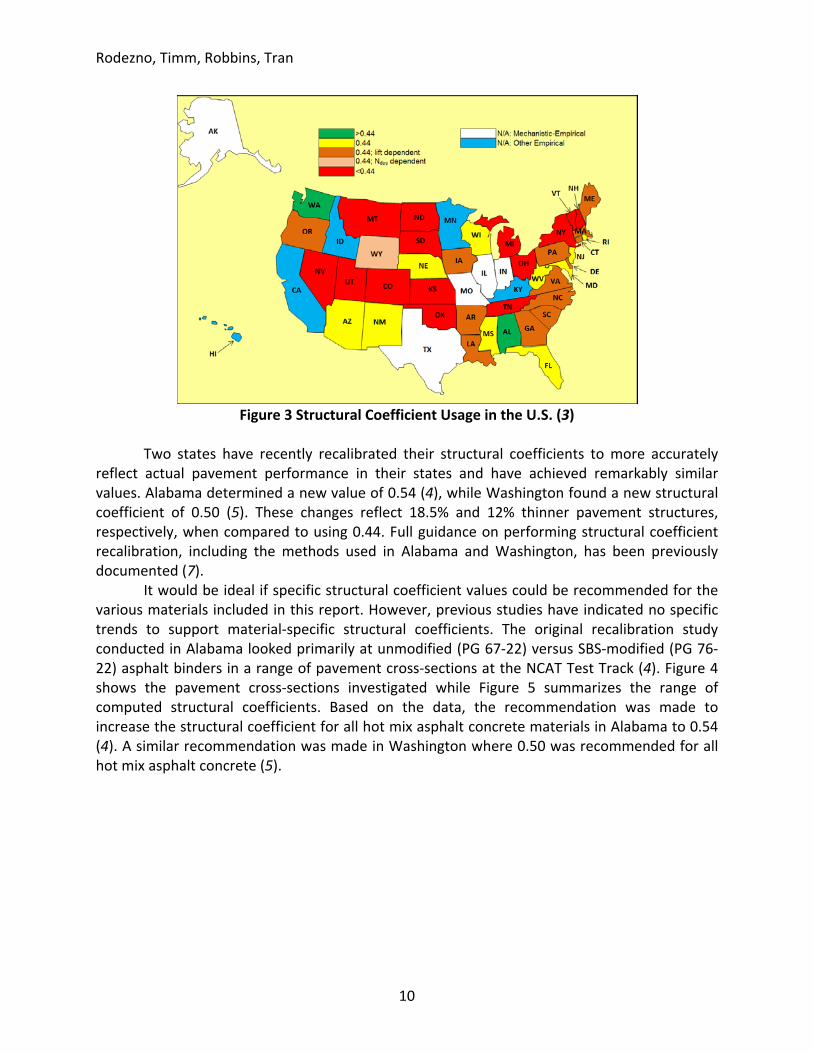
Structural coefficients are also critically important in that they are the only parameter in the 1993 AASHTO Design Guide that may be directly adjusted to account for changes in materials or technologies. Despite this fact, most state DOTs use an asphalt structural coefficient (a1) that was published by AASHO in 1962 (2). Figure 2 shows the design chart that depicts a1 equal to 0.44, which was widely adopted and is currently used by 45% of state agencies (Figure 3). Remarkably, 28% state agencies use a value less than 0.44 (Figure 3). Using a value of 0.44 (or less) inherently assumes that the structural quality of asphalt concrete materials in use today are equivalent (or less than) those produced for the AASHO Road Test in the late 1950s. This is a conservative assumption that may lead to significantly over designed pavements given the advancements made in material specifications, production, and construction, in addition to the innovative materials described above. It should also be noted
Rodezno, Timm, Robbins, Tran
9
that Figure 3 represents structural coefficient usage in 2014 and does not reflect more recent updates to structural coefficients or state agencies adopting the new AASHTO MEPDG.
Figure 1 Structural Number Concept (3)
Figure 2 Flexible Pavement Design Curves with a1 = 0.44 (2)
Rodezno, Timm, Robbins, Tran
10
Figure 3 Structural Coefficient Usage in the U.S. (3)
Two states have recently recalibrated their structural coefficients to more accurately
reflect actual pavement performance in their states and have achieved remarkably similar values. Alabama determined a new value of 0.54 (4), while Washington found a new structural coefficient of 0.50 (5). These changes reflect 18.5% and 12% thinner pavement structures, respectively, when compared to using 0.44. Full guidance on performing structural coefficient recalibration, including the methods used in Alabama and Washington, has been previously documented (7).
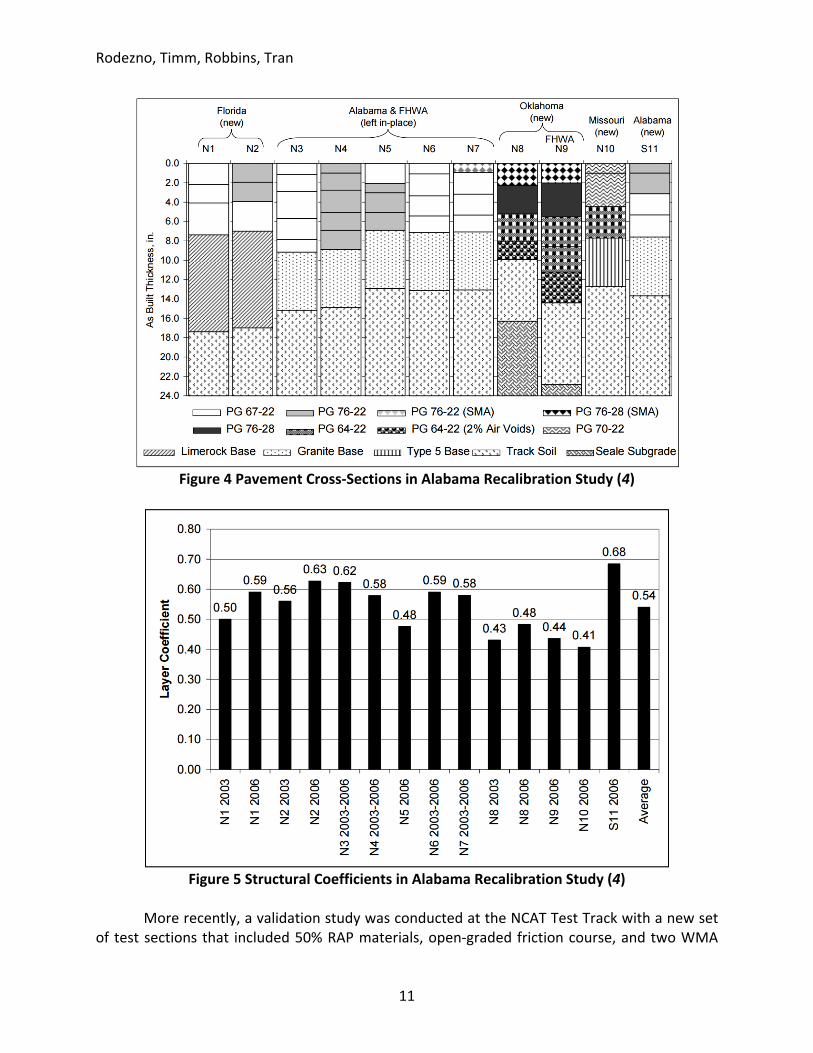
It would be ideal if specific structural coefficient values could be recommended for the various materials included in this report. However, previous studies have indicated no specific trends to support material‐specific structural coefficients. The original recalibration study conducted in Alabama looked primarily at unmodified (PG 67‐22) versus SBS‐modified (PG 76‐22) asphalt binders in a range of pavement cross‐sections at the NCAT Test Track (4). Figure 4 shows the pavement cross‐sections investigated while Figure 5 summarizes the range of computed structural coefficients. Based on the data, the recommendation was made to increase the structural coefficient for all hot mix asphalt concrete materials in Alabama to 0.54 (4). A similar recommendation was made in Washington where 0.50 was recommended for all hot mix asphalt concrete (5).
Rodezno, Timm, Robbins, Tran
11
Figure 4 Pavement Cross‐Sections in Alabama Recalibration Study (4)
Figure 5 Structural Coefficients in Alabama Recalibration Study (4)
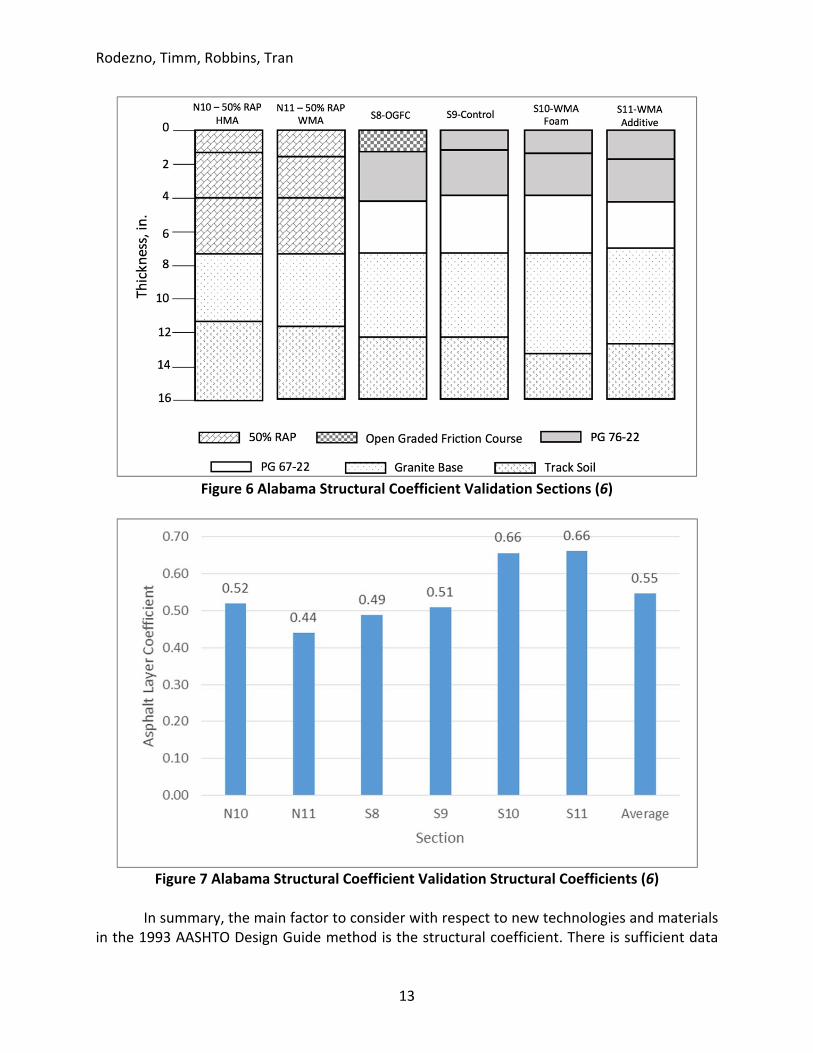
More recently, a validation study was conducted at the NCAT Test Track with a new set
of test sections that included 50% RAP materials, open‐graded friction course, and two WMA

Rodezno, Timm, Robbins, Tran
12
technologies (Figure 6). Following the same procedure as the earlier study (4), the recalibration achieved the values summarized in Figure 7 (6). Again, no definable trends were observed in the data to support recommending higher or lower values based on technology or mix type, but the average value (0.55) was very similar to the value adopted by ALDOT (0.54). A t‐test was conducted, and the researchers concluded that there was no statistical difference between the two recommended values. Given the wide variety of materials in the two investigations, this seems to support using a higher value for modern materials but not specifying a value based directly on material type.
The Alabama and Washington studies are the only investigations that resulted in design code changes on a state level, but there have been a number of other studies conducted to determine structural coefficients of various asphalt concrete materials. These efforts were previously described by Peters‐Davis and Timm (4) and are summarized below.
x In 1983, Van Wyk et al. computed structural coefficients for recycled asphalt pavements (8). Their investigation relied on pavement deflection testing and matching pavement cross‐sections to achieve similar pavement responses between a conventional cross‐section and one that contained recycled pavement. They computed a range of values (0.11 to 0.39) but did not recommend any of them for use given the high degree of variability in their study.
x Hossain et al. investigated recycled tire rubber (RTR) mixtures for the Kansas Department of Transportation (9). Using falling weight deflectometer data, they computed the in‐place pavement modulus from which they computed structural coefficients according to equations published by AASHTO (1). They also followed a procedure similar to Van Wyk et al. to compute structural coefficients to provide an equivalent structure. The average layer coefficient for the RTR mixes found using the AASHTO method was 0.28. The average layer coefficient from the other method was 0.33. Again, no recommendation was made for design practice, and the researchers clearly stated that their values were only valid for the materials tested.
x In 2007, Von Quintus conducted a study on layer coefficients for the Kansas Department of Transportation (10). He concluded that the asphalt concrete layer coefficient for wearing surfaces and base mixtures should be increased, but that the increase should depend on a detailed analysis of material properties, construction records, and pavement performance.
Rodezno, Timm, Robbins, Tran
13
Figure 6 Alabama Structural Coefficient Validation Sections (6)
Figure 7 Alabama Structural Coefficient Validation Structural Coefficients (6)
In summary, the main factor to consider with respect to new technologies and materials
in the 1993 AASHTO Design Guide method is the structural coefficient. There is sufficient data
Rodezno, Timm, Robbins, Tran
14
to support increasing values from 0.44 for a wide range of materials, but not specific guidance on recommending particular values for particular mix types or technologies. The structural coefficient has been increased to 0.50 and 0.54 in Washington and Alabama, respectively, for all hot mix asphalt concrete materials (4, 5). As Von Quintus recommended, agencies should evaluate material properties, construction, and actual pavement performance in determining their own recommended values (10). Guidance on conducting calibration studies has been recently published (7).
2.2 AASHTO Mechanistic‐Empirical (M‐E) Pavement Design Guide
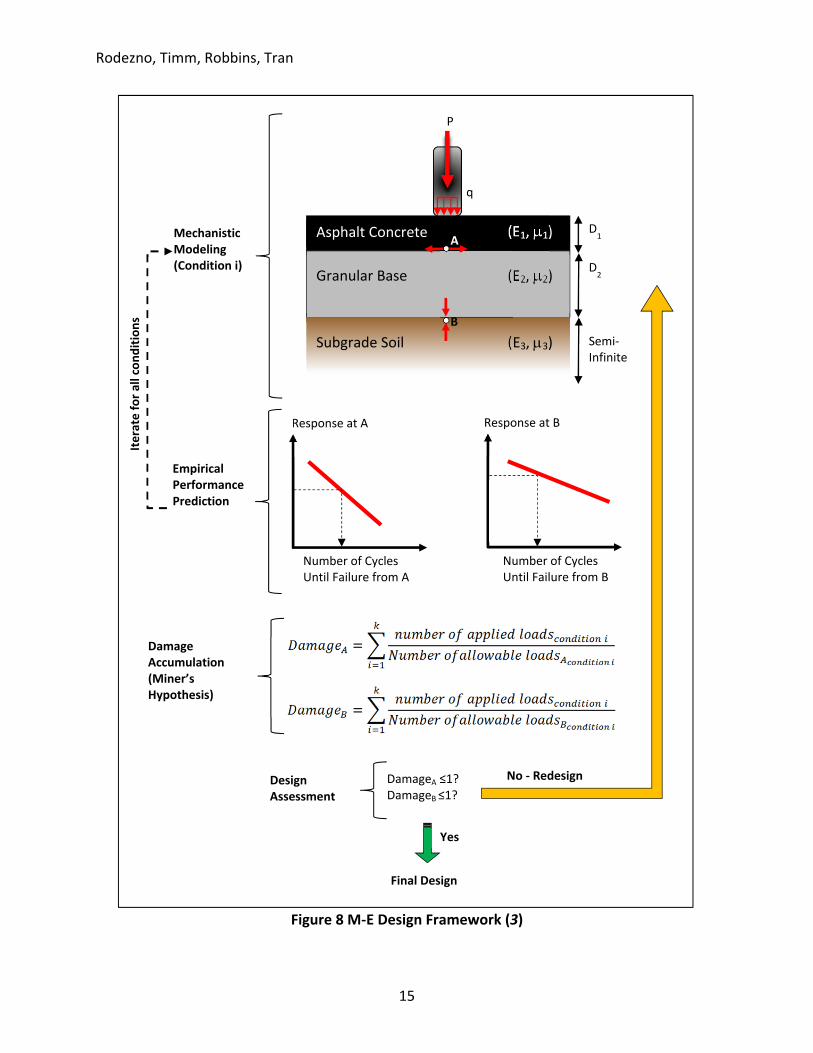
The MEPDG and accompanying design software, AASHTOWare® Pavement ME Design, were recently adopted by AASHTO as the new pavement design standard. The MEPDG and design software will be used synonymously in this report. The new method represents a dramatic modernization of pavement design over the earlier empirical method described previously. The MEPDG couples mechanistic pavement modeling with empirical predictions of performance as the basis for design. The Mechanistic‐Empirical (M‐E) design process features four main components: mechanistic modeling, empirical performance prediction, damage accumulation, and design assessment. These components are depicted in Figure 8 and described below (3).
x The mechanistic modeling component includes materials characterization for the purpose of computing pavement responses (e.g., stress and strain) at critical locations in the structure. The schematic shown in Figure 8 shows tensile strain at the bottom of the AC (response at A) to predict bottom up fatigue cracking and vertical compressive strain at the top of the subgrade (response at B) to predict rutting, respectively. Within this framework, when considering a new material for design, specific material properties will be required. The properties required by the MEPDG will be further explained below.
x The empirical performance prediction component uses the computed pavement responses from mechanistic modeling (i.e., responses at A and B from Figure 8) to predict expected pavement performance expressed as the number of allowable cycles until failure. Due to the empirical nature of this component, some prior knowledge of how the material will perform is needed. Further details are provided below.
x The damage accumulation and design assessment components are not impacted by the choice of materials. The same sets of formulas and decision‐making processes are used regardless of the material type. Damage is expressed as the ratio between the number of applied loadings and the number of allowable cycles until failure, predicted from the empirical performance predictions. When the ratio exceeds unity, for any distress, then the structure must be modified since it is underdesigned. When each mode of distress is predicted to have a damage ratio of slightly less than unity, a final design has been reached.
Rodezno, Timm, Robbins, Tran
15
Figure 8 M‐E Design Framework (3)
Asphalt Concrete (E1, P1)
Granular Base (E2, P2)
Subgrade Soil (E3, P3)
D1
D2
Semi‐Infinite
P
q
A B
Mechanistic Modeling (Condition i)
Response at A
Number of Cycles Until Failure from A
Number of Cycles Until Failure from B
Response at B
Empirical Performance Prediction
Damage Accumulation (Miner’s Hypothesis)
Design Assessment
DamageA ≤1?DamageB ≤1?
Final Design
Yes
No ‐ Redesign
Iterate fo
r all cond
ition
s
Rodezno, Timm, Robbins, Tran
16
2.2.1 MEPDG Material Properties The MEPDG has a three‐level input structure. For material properties, Level 1 inputs require testing to determine the material properties of the actual materials to be used in the design. Level 2 inputs rely on other tests of the actual materials that may be correlated to the required material property. Level 3 inputs represent a generic characterization of the material based on some general properties such as asphalt PG grade and volumetric properties. Since Levels 2 and 3 rely on previously established relationships, they are not particularly useful when using a new material in a design. Therefore, the remaining discussion of material properties will focus on determination of the actual material properties required by the MEPDG (i.e., Level 1 inputs).
The primary material property input for the MEPDG is the dynamic modulus (|E*|) of the asphalt concrete mixture. This property quantifies the modulus of the asphalt concrete over a range of expected temperatures and traffic speeds as a function of loading frequency. The test is conducted according to AASHTO TP79 using the Asphalt Mixture Performance Tester (AMPT). There have been many studies to measure |E*| of the materials discussed in this report. Results for those studies are presented in the respective sections.
A secondary material property for the MEPDG is the dynamic shear modulus of the asphalt binder (|G*|) determined according to AASHTO T315. Similar to |E*| testing, |G*| is meant to capture behavior of the asphalt binder over a range of expected temperatures and traffic speeds. If |G*| data are not available, conventional binder test data that includes softening point, penetration, rotational viscosity, absolute viscosity, and kinematic viscosity may also be used. For materials that involve blending the virgin binder with an additive, this is straightforward, as it can be tested directly after blending. However, for some materials where the virgin binder is altered during the mixing process, it may be more difficult to determine |G*|, or other properties, since this would rely on extracting binder from a mixture. Examples of this situation include RAP and some RAS and RTR mixes. In any case, the dynamic shear modulus of the binder should be determined for the material in question. Another issue is that limits within the design software may prevent a designer from entering actual measured values from excessively stiff or soft materials. Currently, there is not a direct means to overcome this challenge.
There are a number of additional properties required by the MEPDG, but their determination does not pose a particular challenge unique to the use of the materials in this report. These properties include the effective binder content, the air void content, and unit weight of the mixture. Measurement of these properties is straightforward and considered routine under most conditions.
2.2.2 MEPDG Empirical Performance Predictions A key feature of the MEPDG is the ability to predict specific modes of pavement distress over time. These predictions rely on empirical transfer functions that correlate computed pavement responses to estimates of distress and were based on unmodified materials only. This makes their application with polymer‐modified asphalt questionable. The transfer functions are complex, as documented in the Manual of Practice for the MEPDG (11). Local calibration of the transfer functions using full‐scale pavement sections has been identified as a critical step in the overall implementation of the MEPDG. This step is not limited to the use of new materials, but
Rodezno, Timm, Robbins, Tran
17
rather recommended for any agency considering using the MEPDG in practice regardless of material type (12).
While local calibration is strongly recommended by AASHTO, it may be prohibitively costly and time‐consuming to perform local calibration for a new material that is not in widespread use. At the same time, not adjusting the performance predictions for the new material may lead to non‐optimized structures since the default calibration parameters may lead to over or under designed structures. Currently, there is no formalized procedure for overcoming this difficulty. Designers have to rely on their engineering judgment based on an assessment of the material to determine whether the pavement performance predictions will be accurate. In most cases, this may be done by examining previous lab and field studies of the various materials. Relevant studies pertaining to each of the materials discussed in this report are presented in their respective sections.
2.3 Perpetual Pavement Design
Perpetual pavements were brought forward as a viable design concept in the early 2000s by the asphalt pavement industry. Since then, different definitions have been used for perpetual pavements or long‐life pavements. Although they differ on some details, they all share the common following attributes:
1. Life exceeds 40 years, 2. No deep structural distresses (i.e., bottom‐up fatigue cracking, rutting in lower
pavement layers), and 3. Routine surface maintenance and rehabilitation (e.g., mill and overlay) provides
excellent riding conditions. It is important to recognize that although proper design is crucial, other factors such as a
solid foundation, construction practices, layer thicknesses, materials characteristics, design requirements, pavement maintenance activities, and failure criteria will also dictate how a perpetual pavement will perform over the course of its design life (13, 14).
The advantages of perpetual pavements include, but are not limited to (13): x More efficient pavement designs that reduce the cost of conservative pavement
sections and/or deep pavement repairs or reconstruction, x Lower user delay costs due to minor surface rehabilitation of the pavement, and x The amount of non‐renewable resources used and the energy cost over the life of
the pavement is reduced. Perpetual pavement design needs to consider the function of each layer within the
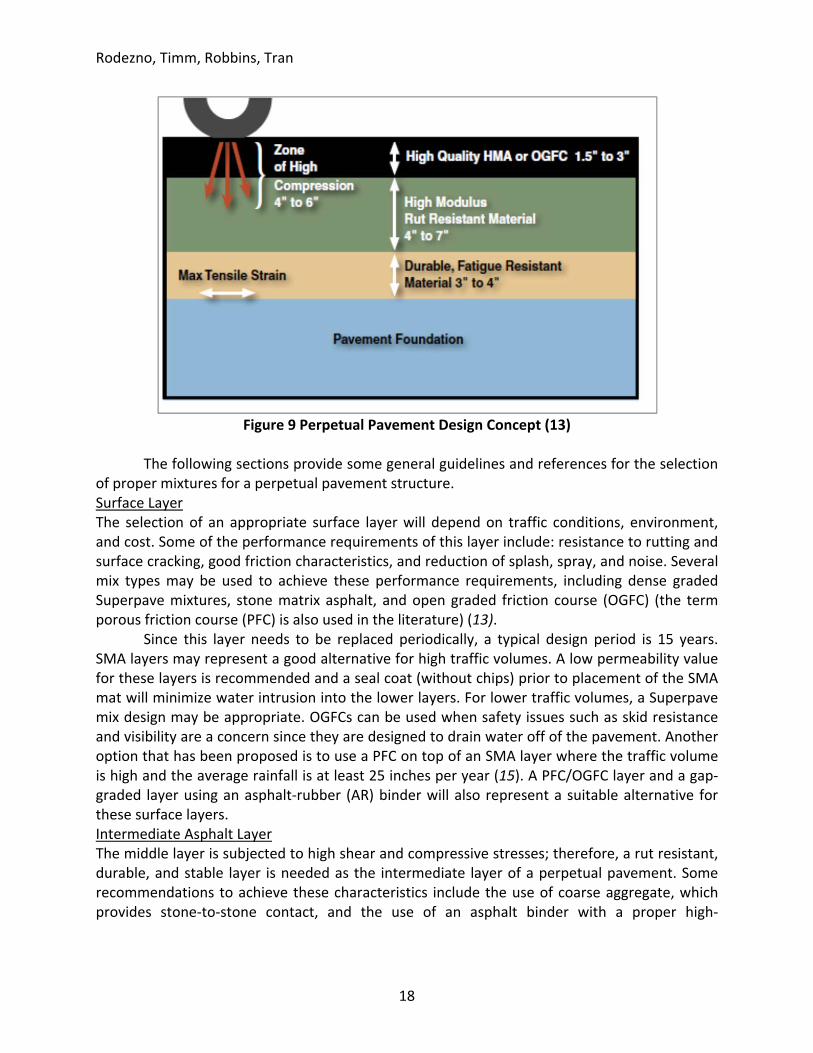
pavement structure to resist specific distresses. Therefore, the critical pavement responses in terms of stresses and strains for each layer must be defined to determine the layer thickness, strength, and modulus that will prevent a specific failure to occur. Figure 9 illustrates the perpetual pavement concept. For this pavement structure, the functions of each layer are as follows (13):
x Surface layer—designed to resist surface initiated distresses such as surface cracking and rutting
x Intermediate asphalt layer—durable and stable, designed to resist rutting x Asphalt base layer—durable, designed to resist fatigue and moisture damage
Rodezno, Timm, Robbins, Tran
18
Figure 9 Perpetual Pavement Design Concept (13)
The following sections provide some general guidelines and references for the selection
of proper mixtures for a perpetual pavement structure. Surface Layer The selection of an appropriate surface layer will depend on traffic conditions, environment, and cost. Some of the performance requirements of this layer include: resistance to rutting and surface cracking, good friction characteristics, and reduction of splash, spray, and noise. Several mix types may be used to achieve these performance requirements, including dense graded Superpave mixtures, stone matrix asphalt, and open graded friction course (OGFC) (the term porous friction course (PFC) is also used in the literature) (13).
Since this layer needs to be replaced periodically, a typical design period is 15 years. SMA layers may represent a good alternative for high traffic volumes. A low permeability value for these layers is recommended and a seal coat (without chips) prior to placement of the SMA mat will minimize water intrusion into the lower layers. For lower traffic volumes, a Superpave mix design may be appropriate. OGFCs can be used when safety issues such as skid resistance and visibility are a concern since they are designed to drain water off of the pavement. Another option that has been proposed is to use a PFC on top of an SMA layer where the traffic volume is high and the average rainfall is at least 25 inches per year (15). A PFC/OGFC layer and a gap‐graded layer using an asphalt‐rubber (AR) binder will also represent a suitable alternative for these surface layers. Intermediate Asphalt Layer The middle layer is subjected to high shear and compressive stresses; therefore, a rut resistant, durable, and stable layer is needed as the intermediate layer of a perpetual pavement. Some recommendations to achieve these characteristics include the use of coarse aggregate, which provides stone‐to‐stone contact, and the use of an asphalt binder with a proper high‐
Rodezno, Timm, Robbins, Tran
19
temperature grading. Other recommendations include the use of polymer‐modified asphalt with crushed aggregate when heavy traffic is expected. Asphalt Base Layer Since the asphalt base layer is located at the bottom of the asphalt pavement structure, it must be flexible and resistant to fatigue cracking. The asphalt layer deflects under the wheel load and tensile strains and stresses develop at the bottom of the layer. The repetitive bending causes cracks that initiate at the bottom of the layer and propagate to the surface. The total thickness of the asphalt pavement structure provides the resistance to fatigue cracking; therefore, as the thickness increases, the tensile stresses and tensile strain decreases. Another alternative to resist fatigue cracking other than relying only on a layer thickness is to use a “rich bottom layer” or a layer with a higher asphalt content to allow for compaction of the layer to a higher density and improve its fatigue resistance. A rich bottom layer also adds flexibility and increases the endurance limit at the bottom of the asphalt layer (14).
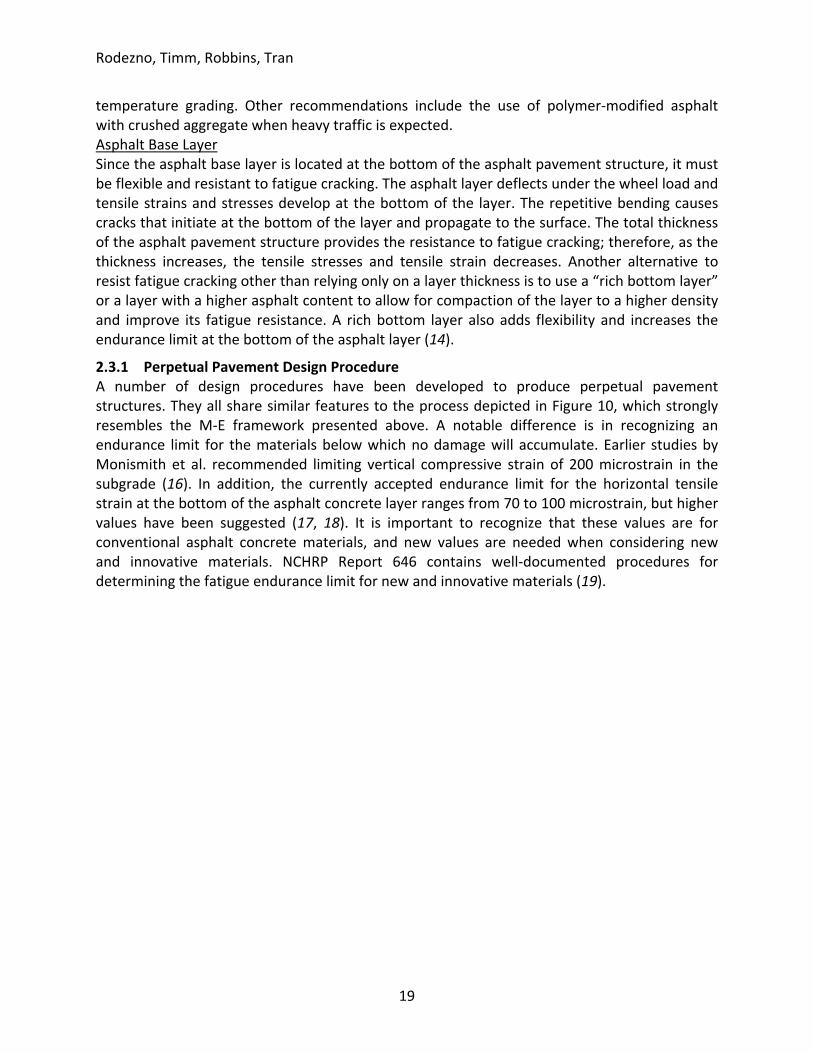
2.3.1 Perpetual Pavement Design Procedure A number of design procedures have been developed to produce perpetual pavement structures. They all share similar features to the process depicted in Figure 10, which strongly resembles the M‐E framework presented above. A notable difference is in recognizing an endurance limit for the materials below which no damage will accumulate. Earlier studies by Monismith et al. recommended limiting vertical compressive strain of 200 microstrain in the subgrade (16). In addition, the currently accepted endurance limit for the horizontal tensile strain at the bottom of the asphalt concrete layer ranges from 70 to 100 microstrain, but higher values have been suggested (17, 18). It is important to recognize that these values are for conventional asphalt concrete materials, and new values are needed when considering new and innovative materials. NCHRP Report 646 contains well‐documented procedures for determining the fatigue endurance limit for new and innovative materials (19).
Rodezno, Timm, Robbins, Tran
20
Figure 10 Perpetual Pavement Design Framework (3)
Asphalt Concrete (E1, P1)
Granular Base (E2, P2)
Subgrade Soil (E3, P3)
D1
D2
Semi‐Infinite
P
q
A B
Mechanistic Modeling (Condition i)
Response at A
Number of Cycles Until Failure from A
Number of Cycles Until Failure from B
Response at B
Empirical Performance Prediction
Damage Accumulation (Miner’s Hypothesis)
Design Assessment
DamageA <<1?DamageB <<1?
Final Design
Yes
No ‐ Redesign
Iterate fo
r all cond
ition
s
Endurancelimit
Endurance limit
Rodezno, Timm, Robbins, Tran
21
Different methods are used by state agencies to design perpetual pavements. A study conducted by Tarefder and Bateman indicated that states such as Kansas, Washington, Oregon, and New Jersey still use AASHTO 1993 (20). Other states such as California, Illinois, and Texas use their own mechanistic‐empirical design methods. Through the Asphalt Pavement Alliance, the asphalt industry has developed a mechanistic‐empirical perpetual pavement design program called PerRoad, along with a low‐volume road version called PerRoadXPress. The AASHTOWare Pavement ME Design software, based on the MEPDG, also includes some perpetual pavement design features that allow designers to enter limiting strain values. Using the AASHTO 1993 and ME Design software for perpetual design still relies on some performance prediction capabilities that require field calibration. Therefore, those methods may not be ideal for incorporating innovative or new materials that may be lacking field data.
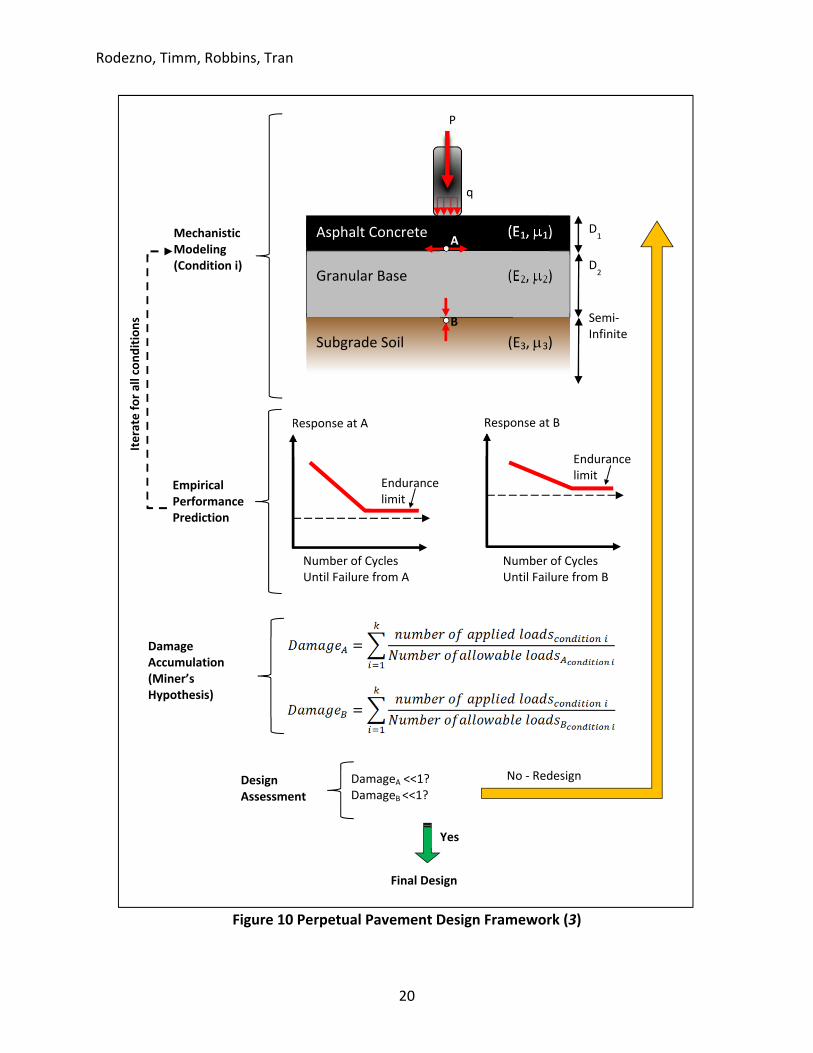
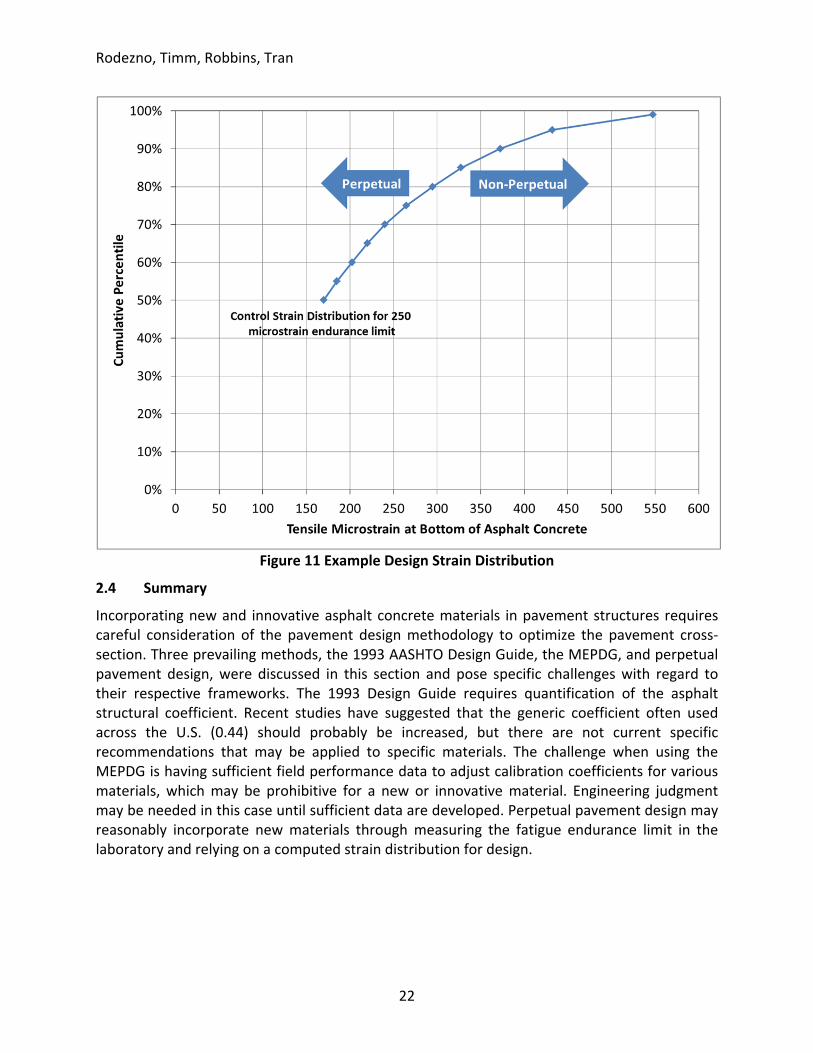
Alternatively, the PerRoad approach may be used more readily with new and innovative materials since the designer can use strain distributions as the basis for design. As documented by Tran et al., utilizing strain distributions can circumvent the need for transfer functions during design (18). This methodology enables a designer to transform a laboratory‐determined fatigue endurance limit into a control strain distribution by multiplying the strain ratios in Table 1 by the endurance limit. For example, if the laboratory endurance limit is 250 microstrain, then the pavement should not exceed 372.5 microstrain (1.49*250=372.5) at the 90th percentile. This can be repeated for each percentile in the table to generate a control strain distribution, as depicted in Figure 11. After establishing the control distribution, the designer can use it to design a perpetual pavement by adjusting layer thicknesses so that the resulting tensile strain distribution is to the left of the control distribution.
Table 1 Recommended Strain Ratios for Perpetual Pavement Design (18) Percentile Strain Ratio to Multiply by Laboratory Endurance Limit
50% 0.68 55% 0.74 60% 0.81 65% 0.88 70% 0.96 75% 1.06 80% 1.18 85% 1.31 90% 1.49 95% 1.73 99% 2.19
Rodezno, Timm, Robbins, Tran
22
Figure 11 Example Design Strain Distribution
2.4 Summary
Incorporating new and innovative asphalt concrete materials in pavement structures requires careful consideration of the pavement design methodology to optimize the pavement cross‐section. Three prevailing methods, the 1993 AASHTO Design Guide, the MEPDG, and perpetual pavement design, were discussed in this section and pose specific challenges with regard to their respective frameworks. The 1993 Design Guide requires quantification of the asphalt structural coefficient. Recent studies have suggested that the generic coefficient often used across the U.S. (0.44) should probably be increased, but there are not current specific recommendations that may be applied to specific materials. The challenge when using the MEPDG is having sufficient field performance data to adjust calibration coefficients for various materials, which may be prohibitive for a new or innovative material. Engineering judgment may be needed in this case until sufficient data are developed. Perpetual pavement design may reasonably incorporate new materials through measuring the fatigue endurance limit in the laboratory and relying on a computed strain distribution for design.

Rodezno, Timm, Robbins, Tran
23
3 SUSTAINABLE MATERIALS FOR ASPHALT PAVEMENT DESIGN
This section summarizes the following asphalt pavement materials and technologies that have been identified as potential candidates for cost‐effective and sustainable asphalt pavement systems: a) Warm mix asphalt, b) Reclaimed asphalt pavement, c) Recycled asphalt shingles, d) Recycled tire rubber, e) Stone matrix asphalt, f) Cold recycling, and g) Polymer‐modified asphalt
While there are certainly more materials and technologies available, this list focuses on those more commonly used in the asphalt industry. The following subsections detail each of these technologies by describing the material itself, discussing important aspects of mix design and presenting results from various studies regarding performance and material properties. The discussion is not meant to provide an exhaustive accounting of each technology, but rather highlight important ideas, concepts and findings related to each. Given the wide variety of locally‐available materials and mix designs resulting from those materials, it was not possible to recommend a single set of input values for pavement design. Rather, general guidance is provided in terms of how to consider these technologies relative to more traditional hot mix asphalt.
3.1 Warm Mix Asphalt
Warm mix asphalt (WMA) is the general name for technologies used to reduce the mixing and compaction temperatures of asphalt mixtures. Although the reduction in temperature varies by technology, WMA is generally produced at temperatures in the range of 30°F to 100°F lower than typical hot mix asphalt (HMA).
WMA terminology and widespread standardized use originated in Europe in the late 1990s in response to the need for greenhouse gas reduction, improvement in field compaction, reduction of crews exposure to fumes, and reduced fuel and energy usage . European Union nations were required to achieve target reductions as a result of the 1997 Kyoto Protocol agreement on climate change (21).
WMA was first introduced to the United States in 2002. Representatives from the United States asphalt paving industry traveled to Europe to learn and document about Europeans’ advancements in the area of WMA. The first documented WMA pavement in the United States was constructed in 2004. In 2005, the Federal Highway Administration (FHWA) and the National Asphalt Pavement Association (NAPA) formed the WMA Technical Working Group (ETG) with the focus of achieving proper implementation through data collection and analysis in order to develop guidelines and specifications. In 2007, the FHWA, the Association of State Highway and Transportation Officials (AASHTO), and the National Cooperative Highway Research Program (NCHRP) conducted a scan tour of European countries to collect information on WMA technologies that could help implementation in the United States. Since then, many more projects have been constructed and evaluated using different WMA technologies.

Rodezno, Timm, Robbins, Tran
24
Since 2009, NAPA has been conducting surveys of asphalt mix producers throughout the United States to monitor the usage of WMA, which continues to increase. To estimate the total asphalt mixture market in each state, data provided by state asphalt pavement associations (SAPAs) and the U.S. Department of Transportation federal‐aid highway apportionment were used to determine a weighting factor for each state and approximate the total U.S. asphalt mix tonnage with national estimates. Therefore, the accuracy of data may vary depending on the number of responses received for each state and the total number of tons represented by the responses (22). Figure 12 shows the estimate WMA usage from 2009‐2015 by sector: state, government, local agencies (cities and counties), and non‐government (commercial developers).
Figure 12 WMA Usage by Owner Segments, 2009‐2015 (22)
WMA accounted for 5.4% of all asphalt plant mix in 2009. The most recent survey
conducted in 2015 indicated that a total of approximately 32% of asphalt mixtures in 2014 were produced as WMA (22). This suggests that implementation of WMA has continued to grow among all segments across the U.S.
The potential benefits of WMA include (21, 23): x Reduced plant emission, including greenhouse gases, x Reduced fuel usage, x Reduced binder oxidation, x Ability to increase haul distances and maintain required workability, x Compaction aid, x Ability to incorporate higher percentages of recycled material, x Ability to pave in cool weather, x Better work environment/less worker exposure to fumes, and x Increased densities.

Rodezno, Timm, Robbins, Tran
25
Although WMA may provide great benefits, proper construction practices are required and satisfactory performance must be achieved. While most aspects of designing and constructing WMA are similar to HMA, lower production temperatures and binder modifications could result in differences in pavement performance relative to HMA. Other issues such as reduced oxidation of the asphalt may improve fatigue performance of a pavement but may reduce its moisture and rutting resistance. Better compactability of WMA may allow for higher percentages of RAP; however, the lower mixing temperatures may not aid the initial blending typically seen with HMA (23). A common practice of contractors is to use WMA technologies as compaction aid. For those cases, mixes are still produced at normal temperatures; therefore, the benefit is reflected in the ease of compaction.
3.1.1 WMA Categories There are currently three categories of WMA technologies: foaming technologies, organic additives, and chemical additives. A fourth category is sometimes used, referred to as hybrids, which utilize a combination of the other categories.
Asphalt foaming technologies include different processes to foam asphalt, such as water‐injecting systems (mechanical foaming) or the addition of a hydrophilic material or foaming additive such a zeolite. For water injection systems, the water turns to steam, disperses throughout the asphalt, and expands the binder, providing a corresponding temporary increase in volume and fluid content, similar in effect to increasing the binder content. For foaming additives, the zeolite materials contain water of crystallization that is released when the temperature is increased above the boiling point of water. The zeolite releases water at a small rate creating an extended foaming effect. Some examples of technologies that use water to foam the binder include Aspha‐min (zeolite), Low Energy Asphalt (LEA) (foams from portion of aggregate fraction), Advera (zeolite), Astec Double Barrel Green (DBG), Gencor Ultrafoam TX, and Maxam Aquablack systems.
Chemical additives include surfactants to help the asphalt binder coat the aggregates. Typical chemical additives include: Cecabase RT, Evotherm ET (emulsion technology), Evotherm Dispersed Asphalt Technology (DAT), Evotherm 3G, and Rediset LQ.
The organic additives are typically special types of waxes that cause a decrease in binder viscosity above the melting point of the wax. Some examples of organic additives include Sasobit, and SonneWarmix.
3.1.2 WMA Mix Design NCHRP Report 691 (9‐43 Project) “Mix Design Practices for Warm Mix Asphalt” recommends mix design best practices and methods for WMA (24). These recommendations are included in AASHTO R35 as an appendix, “Special Mixture Design Considerations and Methods for Warm Mix Asphalt (WMA).” The recommendations regarding the difference in mix design when compared to HMA focus on the following areas: volumetric properties, selection of WMA technologies, binder grade selection, RAP in WMA, rutting resistance evaluation, moisture susceptibility, and evaluation of coating and compactability.
The coating and compactability evaluation recommended relates to the mixing and compaction temperatures for mix design. Conventional HMA mix designs use equiviscous mixing and compaction temperatures based on rotational viscosity binder tests, but most WMA technologies cannot be properly evaluated with this method. NCHRP 9‐43 recommended the
Rodezno, Timm, Robbins, Tran
26
use of a coating test (per AASHTO T195‐Ross count procedure) as a mixture surrogate test to evaluate the suitability of the mixing temperature. In general, when these areas are evaluated, mix designs of WMA are essentially the same as those for HMA. This finding is in agreement with the current practice of just adding a WMA technology (e.g., drop‐in approach) to an approved mix design.
NCHRP Report 779 (Project 9‐47A) “Engineering Properties and Field Performance of Warm Mix Asphalt Technologies” confirms that the “drop‐in approach” for WMA mix designs has worked well and avoids the potential of designing mixes with lower asphalt contents when using WMA (23). Therefore, mix designs should be conducted without the WMA technology to determine the optimum asphalt content for the mix. Then, coating, compactability, and moisture sensitivity should be confirmed using the proposed WMA technology and temperatures. Currently, coating and compactability requirements are not commonly checked, as long as the mixes are properly designed and moisture sensitivity criteria are met.
3.1.3 Laboratory and Field Performance Evaluation of WMA The only laboratory test required per AASHTO M323 is a moisture damage susceptibility test, but researchers use different tests to evaluate the resistance of asphalt mixes to other distresses (such as rutting) and resistance to different forms of cracking. Other tests provided mechanical properties such as mix stiffness. These tests may be used to support use of WMA in the structural design procedures discussed in Section 2 of this report. The following subsections present representative studies that document laboratory and field performance of WMA mixes.
3.1.3.1 Rutting Resistance of WMA A WMA demonstration was conducted in St Louis, Missouri to evaluate three WMA technologies: Evotherm ET, Sasobit, and Aspha‐min (25). A control HMA section was also constructed to assess the performance of WMA technologies compared to HMA. The mix design used for all four mixes was a 12.5 mm NMAS surface Superpave mix that contained 10% RAP. Asphalt Pavement Analyzer (APA) testing was used to determine rut depths of the different samples. They found that the WMA additive Aspha‐min had very little effect on rut depth when compared to the control HMA specimens. Sasobit was found to decrease rut depths when compared to the control HMA specimens. These findings indicate that Sasobit could actually decrease rut depths in WMA pavements. Evotherm ET also decreased the rut depth of the WMA pavement.
Another study conducted in Florida evaluated the rutting performance of a high RAP HMA control mix and a high RAP WMA mix (26). The mixes contained 45% RAP and the WMA mixes were produced by foaming the asphalt binder by adding 2% of water by weight of the binder. The test results show that on average, the RAP HMA specimens have higher flow numbers than the RAP WMA specimens. The authors concluded that the RAP HMA control mix may provide better rutting resistance than the RAP WMA mix.
Wielinski et al. conducted a study to evaluate Astec Double Barrel Green foaming technology effects on the performance of WMA (27). The evaluation was conducted using an APA device. The WMA specimens were found to be slightly more susceptible to rutting than the HMA control specimens. The WMA specimens had an average rut depth of 0.09 inches more than the HMA control specimens, but the WMA rut depths were still acceptable values for the APA test.
Rodezno, Timm, Robbins, Tran
27
Based on these results, it appears that the laboratory rutting performance of WMA relative to HMA varies. It is important to notice that laboratory rutting results for both WMA and HMA are impacted by other factors such as binder grade, test temperature, sample conditioning, and compaction.
3.1.3.2 Fatigue Resistance of WMA A study was conducted in 2008 to evaluate the fatigue performance of WMA produced with Sasobit as compared to a control HMA mix using beam fatigue testing (28). The specimens were tested at 300, 400, and 600 microstrain levels. The results were similar for both HMA and WMA, though the HMA specimens performed slightly better at lower strains. Another important observation is that as the production temperature of WMA increased, the fatigue life also increased.
Another study conducted by NCAT in 2010 found similar results for the fatigue performance of WMA produced with the Gencor Ultrafoam GX compared to a control HMA mix (29). Fatigue testing in accordance with AASHTO T321 was also conducted. Samples were prepared from plant‐produced mix and reheated in the laboratory. For each mix, three beams were tested at 200 and 400 microstrain. The test results indicated that the HMA samples showed a slightly longer fatigue life than WMA at 200 microstrain, but at 400 microstrain the WMA samples had the same fatigue life as the HMA samples. It is worth pointing out that reheating the samples may have impacted the results. Endurance fatigue testing using the procedure developed under NCHRP 9‐38 report 646 was conducted and suggested that the WMA pavement may incur damage at a lower loading level than the HMA pavement (18).
3.1.3.3 WMA at the NCAT Test Track The 2009 research cycle at the NCAT Test Track featured a WMA experiment that evaluated a control section using conventional production and laydown temperatures versus two sections constructed with different WMA technologies. The sections were all designed with three lifts of asphalt mix, totaling 7 inches, over 6 inches of crushed granite aggregate base and a common subgrade. The sections were meant to examine the in situ performance under accelerated loading and provide fundamental laboratory and field characterization of the respective materials. The control section and warm mix sections utilized the same asphalt binder (PG 67‐22) and aggregate gradations during production, with the only difference being that the control section was produced hot (325‐335°F) while the mechanical foaming WMA section was produced at 275°F and the additive‐based WMA was produced at 250°F (30).
The surface, intermediate, and base mixtures were subjected to dynamic modulus (E*) testing according to AASHTO TP79‐09. This fundamental measure is a primary input to the AASHTO Pavement M‐E thickness design procedure and describes the material behavior in response to temperature and loading speed changes. At high, intermediate, and low temperatures (40, 20, and 4°C, respectively) no statistical differences were detected between the control mixtures and the WMA mixtures. This suggests treating WMA as HMA within M‐E design systems in terms of material properties.
Field‐measured rutting demonstrated an expected trend where the control section had the least measured rutting, followed by the foamed warm mix, with the additive WMA having the greatest rutting. Though some statistical differences were noted, the range of rut depths from best‐to‐worst was less than 3 mm, which was practically insignificant.
Rodezno, Timm, Robbins, Tran
28
Laboratory rutting tests were conducted on the control and WMA materials. APA testing resulted in no statistical differences between the control and WMA mixtures. Flow number (FN) testing revealed the control mixture to have significantly better rutting resistance than the WMA materials even though all of the mixtures passed the FN minimum criteria for the applied traffic level (between 3 and 10 million standard load applications). Hamburg wheel tracking device (HWTD) testing resulted in no statistical differences between the control and foamed WMA while the additive WMA had a significantly higher rutting rate. Of these tests, the APA and FN tests correlated poorly to field performance while the Hamburg provided the best prediction of actual rutting performance. Furthermore, an excellent predictor of rutting performance was the G*/sinG parameter used in the Superpave binder specification to control rutting (30).
The sections were routinely inspected for signs of fatigue cracking during the experiment. During the 2009 research cycle, when the first 10 million equivalent single axle loads (ESALs) were applied, no cracking was observed in any of the sections. The sections were left in place for the 2012 research cycle with cracking developing first in the WMA additive section (10.5 million ESALs), followed by the WMA foam section (11 million ESALs), and finally the control section (11.9 million ESALs). After 17 million ESALs, the WMA foam section had 22% of the lane area cracked, the WMA additive section was 15% cracked, and the control section was 10% cracked. Though the cracking amounts do represent practical differences between sections, it should be noted that they are all below a commonly held threshold of 25% of lane area cracked to represent failure.
During the 2009 research cycle, bending beam fatigue tests (BBFT) were conducted on the base mixtures from each section to make fatigue performance predictions in the absence of observed field cracking. Fatigue transfer functions developed from BBFT for each base mixture, combined with measured strain responses from each section, predicted that the WMA mechanical foaming section should perform best, followed by the WMA additive section and the control section (30). These predictions were the opposite of the observed performance described above after 17 million ESALs. As with the rutting performance prediction, it is imperative to validate laboratory predictive tests with actual pavement performance data. The performance of these sections was used in the recalibration study discussed in Section 2 of this report, and insufficient evidence was found to recommend a different structural coefficient from the control section (6).
3.1.3.4 WMA Sections from NCHRP 9‐47A Project For NCHRP Project 9‐47A, WMA and corresponding HMA (control) sections around the United States were monitored to compare their relative measures of performance (23). Engineering properties were also evaluated in terms of the following tests: recovered binder testing, dynamic modulus, flow number (FN), tensile strength ratio (TSR), Hamburg test, and simplified viscoelastic continuous damage–fatigue (SVECD). Statistical analyses were conducted to assess if significant differences existed in the results, and a brief description follows.
1. Testing of recovered binders from cores taken right after construction and after approximately one to two years of service generally indicate that the true grades of HMA and WMA were not substantially different based the difference in the high and low critical temperature between HMA and WMA binder recovered. These test

Rodezno, Timm, Robbins, Tran
29
results also indicate that very little or no stiffening had occurred for the binders from the time of construction.
2. Statistical analyses indicate that the dynamic moduli of WMA mixtures are different than those of corresponding HMA mixtures in most cases.
3. FN results for plant‐produced WMA mixes were statistically lower than corresponding HMA mixes in more than two‐thirds of the comparisons.
4. The TSR test showed that 82% of the mixes passed the standard 0.8 minimum TSR criterion. The six mixes that failed the criterion included four WMA and two HMA mixes.
5. Hamburg tests showed that 59% of the WMA mixes had statistically equivalent Hamburg rut depths to their corresponding HMA mixes; the other 41% of the WMA mixes had greater Hamburg rut depths.
6. The SVECD test does not yield a unique test result, but rather a relationship between strain and the number of cycles to failure. Therefore, the results provide a relative ranking of the fatigue behavior for a set of mixes. For all projects under evaluation, WMA mixes performed the same or better than conventional HMA.
Field performance evaluation of different WMA pavement sections indicate that WMA is comparable to HMA mixes, which suggests inconsistency with the laboratory test results, particularly related to rutting performance. Because lower production temperatures are used for WMA as compared to HMA, binder aging in WMA is less, resulting in lower resistance to rutting. Despite this fact, after two years of performance, some sections experienced less than 5 mm of rutting and some sections didn’t experience any rutting. Current criteria to evaluate rutting resistance are based on mixtures that have been aged to a greater degree; this suggests that for WMA, reducing rutting criteria based on field performance may be needed. Cracking after two years was negligible.
In summary, the findings from NCHRP 9‐47A project and the NCAT Test Track suggest that additional studies and monitoring of pavement performance of WMA pavement sections are needed to find better correlations between laboratory performance tests and the actual field performance of WMA.
3.1.4 WMA Summary WMA are technologies that allow complete coating of aggregates and the production and placement of asphalt mixes at lower temperatures than conventional hot mix asphalt (HMA) without compromising the quality of the mixture. Numerous potential benefits have been identified with the use of WMA that include: reduced fuel consumption, reduced emissions, better work environment, and the possibility to extend the paving season and increase RAP usage. The different benefits have led to a fast implementation of the technology; according to NAPA, the total production of WMA for 2014 was estimated to be approximately 32% of the asphalt mix produced in the U.S. that year.
Research has shown that WMA can be designed with few changes when compared to conventional HMA. Preliminary trials with WMA started in 2004, so the technology has been used for over a decade. Although there are still some inconsistencies with the laboratory test results of WMA when compared with HMA, the equivalent short‐term performance, accelerated pavement test experiments, and limited long term performance suggests that this

Rodezno, Timm, Robbins, Tran
30
doesn’t impact relative performance, indicating that WMA is comparable to HMA with the additional potential benefits mentioned above. Additional long‐term performance of pavement constructed with WMA is still underway (31). All of this information suggests treating WMA the same as HMA in structural design systems. For example, using the same structural coefficient in the 1993 AASHTO Design Guide would be appropriate between WMA and HMA materials. In M‐E systems, treating WMA in the same fashion as HMA with respect to material properties and performance prediction equations also is supported by lab and field data.
3.2 Reclaimed Asphalt Pavement and Recycled Asphalt Shingles
The use of recycled materials in asphalt pavement has been a common practice in the transportation industry for decades. There are economic and environmental benefits associated with the use of these materials. Environmental benefits include reduced fuel usage due to reduced extraction and transportation of virgin materials and reduced emissions, reduced demand of raw materials, and reduced landfill space for disposal of used material. Some of the economic benefits include material cost savings from replacing a portion of the raw materials with RAP/RAS and costs associated with transportation.
3.2.1 Reclaimed Asphalt Pavement The use of RAP can be traced back to 1915, but it wasn’t until the 1970s when the price of asphalt binder dramatically increased (due to the Arab oil embargo) that the use of RAP became a common practice (32). RAP is most commonly used in asphalt mixes to substitute aggregate and replace virgin binder, but it can also be used in other highway applications such as granular base/subbase or stabilized base aggregate.
Over the years, the principles that guide the use of RAP in asphalt mixtures have been to meet the same requirements as mixes with only virgin materials and that their performance should be equal or better than virgin mixtures (33). NAPA has conducted surveys to monitor the usage of RAP in asphalt mixtures since 2009. According to their latest survey conducted in 2015, the average RAP content in new asphalt mixes in 2014 was approximately 20%, corresponding to approximately 71.9 million of the total 352 million tons of asphalt mix produced in 2014. If 5% asphalt content in RAP is assumed, this represents 3.5 million tons of asphalt binder and 68 million tons of aggregate that were preserved (22).
Some of the main obstacles for further increasing the RAP content have been related to the lack of guidelines for RAP processing, binder concerns related to bumping grades, asphalt binder contribution from RAP, changes in volumetric mix design, and limited well‐documented performance for mixes with high RAP content. Several state highway agencies limit the use of RAP to certain mix types or require the performance grade of virgin binder to be adjusted when the RAP content is above 25% or the RAP binder ratio (RAPBR, as defined in Equation 1) is greater than 0.25. ܴܤܲܣܴ ൌ ೃಲುൈೃಲು
ଵൈೌ (1)
where:
RAPBR = Reclaimed asphalt pavement binder ratio PbRAP = Binder content of the RAP

Rodezno, Timm, Robbins, Tran
31
PRAP = RAP percentage by weight of mixture PbTotal = Total binder content in the mixture
RAP can be obtained from milling operations, full depth pavement demolition, and
asphalt that is normally wasted during plant mix production. Before the RAP can be used in asphalt mixes, it has to be processed. RAP processing practices vary greatly by state and producers. Some have recommended not mixing RAP from different sources because it may result in more variability in the RAP stockpile. When RAP is milled from a single project, its gradation and asphalt content is more consistent. These stockpiles generally only require screening to remove oversized particles. Other studies have shown that RAP collected from multiple sources can be processed into a consistent product when using blending and crushing best practices.
Table 2 summarizes different processing options used to produce a consistent RAP
product. Regardless of the method used to collect, process, and store the RAP material, it is recommended to test the material on a regular basis to ensure uniformity (34). The recommended sampling rate is at least one set of tests per 1,000 tons of RAP. It is also recommended that a minimum of 10 tests be performed on a RAP stockpile to obtain good statistics for consistency analyses (33). Table 2 RAP Processing Options (34) Type Description Suitable Conditions Possible Concerns Minimal Processing
Screening only to remove oversized particles
RAP from a single source
Single source RAP piles are a finite quantity. New mix designs will be needed with another RAP material
Crushing Breaking of RAP chunks, and or aggregate particles in order to avoid large particles that may not break apart during mixing or particles that exceed the mix’s NMAS
RAP contains large chunks (larger than 2”) or RAP aggregate NMAS exceeds the recycled mix’s NMAS
Generating excess dust and uncoated surfaces
Mixing Using a loader or excavator to blend RAP from different sources. Usually done in combination with crushing and/or fractionating
RAP stockpile contains materials from multiple sources
Good consistency of RAP characteristics must be verified with a RAP QC plan
Fractionating Screening RAP into multiple size ranges
High RAP content mixes (above 30 to 40%) are routine
Highest cost, requires additional RAP bin(s) to simultaneously feed

Rodezno, Timm, Robbins, Tran
32
multiple fractions
3.2.1.1 Mix Design with RAP Material For mix designs with RAP material, the following properties are typically required: gradation, bulk specific gravity, consensus properties of the aggregate recovered from the RAP, asphalt binder content of the RAP, and RAP asphalt binder PG grading when using more than 25% binder ratio (proportion of the total binder content that comes from the RAP). The RAP aggregate can be recovered using the ignition method (AASHTO T308) or the solvent extraction method (AASHTO T164). When using these two methods, the gradation and consensus properties of the recovered aggregate may be affected, but in general, it will not affect the mix design or the percentage of RAP to be used (34).
The bulk specific gravity of the RAP aggregate (Gsb (RAP)) is critical for an accurate determination of VMA, which is an important mix property used for asphalt mix design. Gsb (RAP) can be determined by conducting AASHTO T84 and T85 for specific aggregate of the fine and coarse aggregate for the recovered aggregate (after ignition or solvent extraction). Both of these methods are recommended for recovered aggregates for high RAP content mix designs with the exception of some aggregates such as soft limestones or dolomites, which tend to degrade when subjected to high temperatures used during ignition testing. In this case, most agencies elect to use extractions.
Another approach used to determine Gsb (RAP) consists of estimating the RAP effective specific gravity Gse (RAP) using Equation 2, and then using Equation 3 to estimate Gsb (RAP). This approach was recommended in NCHRP Report 452 “Recommended Use of Reclaimed Asphalt Pavement in the Superpave Mix Design Method: Technician’s Manual” (35). Based on recent studies conducted by NCAT, this method is not recommended because it results in high VMA values that will translate into low asphalt contents for high RAP content mixes (34, 36).
bRAPmm
RAPb
RAPbse
GGPP
RAPG
u
��
)(
)(
)()( 100100
(2)
1100
�u
u
b
RAPseba
RAPsesb
GGPG
RAPG)(
)()( (3)
Where:
Pb (RAP) = Asphalt content of the RAP determined by AASHTO T308 or AASHTO T164 Gmm (RAP) = Maximum theoretical specific gravity of the RAP determined by AASHTO
T209 Pba = Asphalt absorption estimated based on historical records of mixes with the
same aggregate sources Gb = Assumed specific gravity of the binder (~1.02)
Rodezno, Timm, Robbins, Tran
33
AASHTO M323 (Superpave Volumetric Mix Design) and AASHTO R35 (Superpave Volumetric Design for Asphalt Mixes) include guidelines on the use of RAP in Superpave mixes. These guidelines are based on NCHRP Report 452, which provides procedures for preparing and designing asphalt mixtures with RAP (35). A recent NCHRP report (34) found that the standards are appropriate for high RAP content mixes with some revisions and the following suggestions to AASHTO R35 and M323.
1. The selection of the virgin binder grade should be based on knowledge of the true grade of the RAP binder, the high and low critical temperatures for the project location and pavement layer, and either the approximate ratio of RAP binder divided by the total binder content or the high and low critical temperatures for the available virgin binders.
2. Recommendation of a required moisture damage test of mix designs with RAP regardless of the RAP content (such as TSR, Hamburg), a rutting test only if a softer grade of virgin binder or rejuvenator is used (such as the APA, Hamburg, and flow number), and thermal cracking tests for cold climates (such as the semi‐circular bend test).
One of the concerns with the use of RAP is the PG grade of the virgin binder and how much RAP binder is actually available to blend with the virgin binder to ensure adequate performance. The use of blending charts is recommended to determine the grade of virgin asphalt binder to be used. Blending charts assume a linear relationship between the critical high temperature grade of the virgin asphalt and the RAP binder according to the proportion of the RAP. AASHTO M323 recommends procedures for developing blending charts. The reader is advised to refer to those documents for additional information (34, 35).
Since current mixture designs are based on volumetric criteria, there are uncertainties for mixes with RAP and RAS such as the amount of blending between RAP/RAS and virgin binder. Because of this, balanced mix design approach is currently being evaluated by some states. The goal of a balanced mix design is to obtain a mix with an optimum binder content that will provide resistance to major forms of distress using appropriate performance tests. NAPA Special Report 213 “Use of RAP and RAS in High Binder Replacement Asphalt Mixtures” presents an example of such approach that was developed in Texas by Zhou et al (46). The reader is advised to refer to this document for additional information.
3.2.1.2 Laboratory Performance of Mixes Containing Reclaimed Asphalt Pavement Several studies have evaluated the mechanical properties of RAP mixes. Different researchers have assessed the stiffness, rutting, and cracking performance of these mixes. In general, mix stiffness increased for mixes with higher RAP contents. Most researchers also indicated improved rutting performance for mixes with different percentages of RAP when compared to control mixes. Several studies have shown that the resistance of fatigue and thermal cracking tends to decrease with the use of RAP, but a few studies contradict these findings.
A study conducted by Al‐Qadi et al. evaluated the laboratory performance of high RAP mixes with percentages of RAP ranging from 30 to 50 percent (37). The mixes were designed with a base asphalt binder PG 64‐22. For laboratory testing, specimens were produced using a single and double bumped binder PG 58‐22 and PG‐58‐28, respectively. A battery of tests were

Rodezno, Timm, Robbins, Tran
34
conducted to evaluate moisture susceptibility (Illinois modified AASHTO T283), rutting potential (FN test), stiffness (dynamic modulus), and fatigue resistance (bending beam fatigue test) and fracture properties (semi‐circular bending fracture test). The study found that in general, the tensile strength ratio of the mixes increased with an increased RAP content. FN test results show less rutting potential as the RAP content increased when the base binder PG 64‐22 was used; when a softer binder was used, the rutting potential of the mixes increased. Dynamic modulus also increased with increased RAP content. In terms of fatigue performance, the authors reported a slight improvement in performance using the slope (K2) of the fatigue curve. Finally, the potential for thermal cracking in terms of fracture energy increased with increased RAP content.
Another study conducted by McDaniel et al. evaluated the effect of RAP on the performance of plant‐produced mixes (38). The mixes evaluated had RAP contents that ranged from 15‐40%. Several tests were conducted on the mixes and extracted/recovered binders. Laboratory test results showed that in most cases, mixture stiffness in terms of E* and binder complex shear modulus (G*) increased when RAP content was increased. This was particularly noticeable at high and intermediate temperatures. The binder testing also showed that an increase in RAP content increased the high temperature properties of the recovered asphalt binder, and the low critical temperature of the recovered binders also increased with higher RAP content but to a lesser degree.
A study in Virginia documented laboratory performance of 10 asphalt pavement sections that used mixes with RAP content that ranged from 21% to 30% (39). Control mixes were also placed and evaluated when possible. Laboratory test results using APA were conducted to evaluate rutting susceptibility, TSR testing was conducted to evaluate moisture susceptibility, and beam fatigue testing conducted at a range of strains to determine fatigue endurance limit showed no significant difference between the control and RAP mixes.
The laboratory results discussed above indicate that material properties used in M‐E design systems should be measured for mixtures containing RAP, as they are significantly different from virgin mixtures. The performance data are somewhat mixed, so mixture‐specific tests should be conducted to determine the effect of the RAP on overall rutting and cracking performance.
3.2.1.3 High RAP Mixes at the NCAT Test Track NCAT has evaluated the construction and performance of several high RAP content sections since 2006 (40). For the 2006 cycle, four sections with mixes containing 45% RAP were constructed and compared to a control section of virgin mix. The sections used different grades of virgin binder, ranging from a PG 52‐28 to a PG 76‐22 polymer‐modified binder with 1.5% Sasobit. The mixes were placed 2 inches thick as surface layers. These sections were left in place for two cycles for a total of 20 million ESALs. All of the test sections had less than 5 mm of rutting and small amounts of low severity cracking. The amount of cracking was also consistent with the virgin binder grade in the RAP sections, with the RAP section containing the softest virgin binder having the least amount of cracking. The findings of this experiment led to NCAT’s recommendation to use a softer virgin binder grade for high RAP content (>25%) mixes and no change to the binder grade for low to moderate RAP content mixes (≤25%).
Rodezno, Timm, Robbins, Tran
35
Laboratory results for E* showed higher moduli results when RAP content increased, particularly at the highest temperature. APA testing showed better performance for the RAP mixes when compared to the control mix, but the results also showed that mixes with softer binders had higher rutting potential when the same RAP content was used. Nonetheless, all the RAP mixes showed small rut depth values.
For the next NCAT Test Track cycle in 2009, three additional high RAP test sections were constructed. The first section was a 45% RAP content section with a PG 67‐22 virgin binder. After 10 million ESALs, the section had only 3 mm of rutting and only 61 feet of low severity cracking. The other two sections contained 50% RAP in each of the three layers of the 7‐inch asphalt pavement structure. One of the 50% RAP mixture sections was produced as a WMA. These two sections were compared to a virgin mix control section built to the same thickness with a polymer‐modified PG 76‐22 binder in the top two layers. After 10 million ESALs, the 50% RAP sections had less rutting and fatigue cracking than the control section. These sections were used in the structural coefficient recalibration effort described in Section 2 of this report where insufficient evidence was found to recommend a structural coefficient different from the control section (6).
Laboratory test results of APA and FN to evaluate rutting potential indicated that the control mix was the most resistant to permanent deformation; however the field performance contradicted these results.
3.2.2 Recycled Asphalt Shingles The possibility of using recycled asphalt shingles (RAS) in asphalt pavements has been recognized since the mid 1980s (41). With the implementation of Superpave asphalt binder specifications in the 1990s, binder modifications became more common and the concept of adding RAS was considered beneficial because it could potentially reduce the cost of materials since RAS contains approximately 19‐36% asphalt binder.
There are two different sources of RAS: manufacturing waste (MW) and post‐consumer (PC) waste. MW refers to factory rejected material that may not meet all the specifications of the roofing industry or scrap pieces that remain after the manufacturing process. PC shingles are removed during demolition or replacement of old roofs. Since PC shingles have been in service for an unknown length of time, the asphalt binder in the PC shingles has experienced weathering and oxidation and is stiffer and more brittle than the MW binder. In the United States, approximately 11 million tons of shingles are generated each year; 10 million tons from PC shingles (42).
Typical asphalt shingles are composed of different materials that include a granular/aggregate surface, fine mineral base, and a fiber mat that can be a fiberglass or organic felt (43).
Table 3 summarizes estimates of the percent of each material. Shingles are produced by
impregnating the base fiberglass or organic mat with asphalt, coating again with more asphalt on both sides, and then coating with mineral granules on the top surface and mineral fillers such as talc and sand on the bottom surface. Most roofing shingles produced are of the organic felt type.
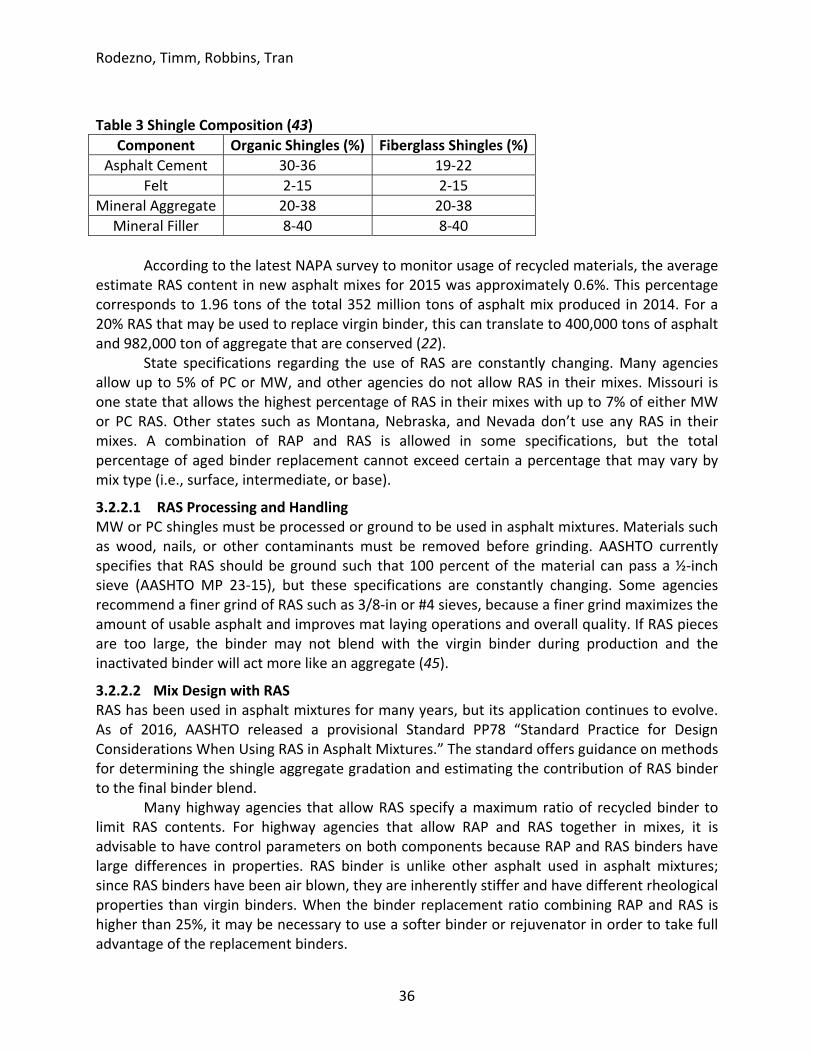
Rodezno, Timm, Robbins, Tran
36
Table 3 Shingle Composition (43)
Component Organic Shingles (%) Fiberglass Shingles (%)Asphalt Cement 30‐36 19‐22
Felt 2‐15 2‐15 Mineral Aggregate 20‐38 20‐38
Mineral Filler 8‐40 8‐40
According to the latest NAPA survey to monitor usage of recycled materials, the average estimate RAS content in new asphalt mixes for 2015 was approximately 0.6%. This percentage corresponds to 1.96 tons of the total 352 million tons of asphalt mix produced in 2014. For a 20% RAS that may be used to replace virgin binder, this can translate to 400,000 tons of asphalt and 982,000 ton of aggregate that are conserved (22).
State specifications regarding the use of RAS are constantly changing. Many agencies allow up to 5% of PC or MW, and other agencies do not allow RAS in their mixes. Missouri is one state that allows the highest percentage of RAS in their mixes with up to 7% of either MW or PC RAS. Other states such as Montana, Nebraska, and Nevada don’t use any RAS in their mixes. A combination of RAP and RAS is allowed in some specifications, but the total percentage of aged binder replacement cannot exceed certain a percentage that may vary by mix type (i.e., surface, intermediate, or base).
3.2.2.1 RAS Processing and Handling MW or PC shingles must be processed or ground to be used in asphalt mixtures. Materials such as wood, nails, or other contaminants must be removed before grinding. AASHTO currently specifies that RAS should be ground such that 100 percent of the material can pass a ½‐inch sieve (AASHTO MP 23‐15), but these specifications are constantly changing. Some agencies recommend a finer grind of RAS such as 3/8‐in or #4 sieves, because a finer grind maximizes the amount of usable asphalt and improves mat laying operations and overall quality. If RAS pieces are too large, the binder may not blend with the virgin binder during production and the inactivated binder will act more like an aggregate (45).
3.2.2.2 Mix Design with RAS RAS has been used in asphalt mixtures for many years, but its application continues to evolve. As of 2016, AASHTO released a provisional Standard PP78 “Standard Practice for Design Considerations When Using RAS in Asphalt Mixtures.” The standard offers guidance on methods for determining the shingle aggregate gradation and estimating the contribution of RAS binder to the final binder blend.
Many highway agencies that allow RAS specify a maximum ratio of recycled binder to limit RAS contents. For highway agencies that allow RAP and RAS together in mixes, it is advisable to have control parameters on both components because RAP and RAS binders have large differences in properties. RAS binder is unlike other asphalt used in asphalt mixtures; since RAS binders have been air blown, they are inherently stiffer and have different rheological properties than virgin binders. When the binder replacement ratio combining RAP and RAS is higher than 25%, it may be necessary to use a softer binder or rejuvenator in order to take full advantage of the replacement binders.
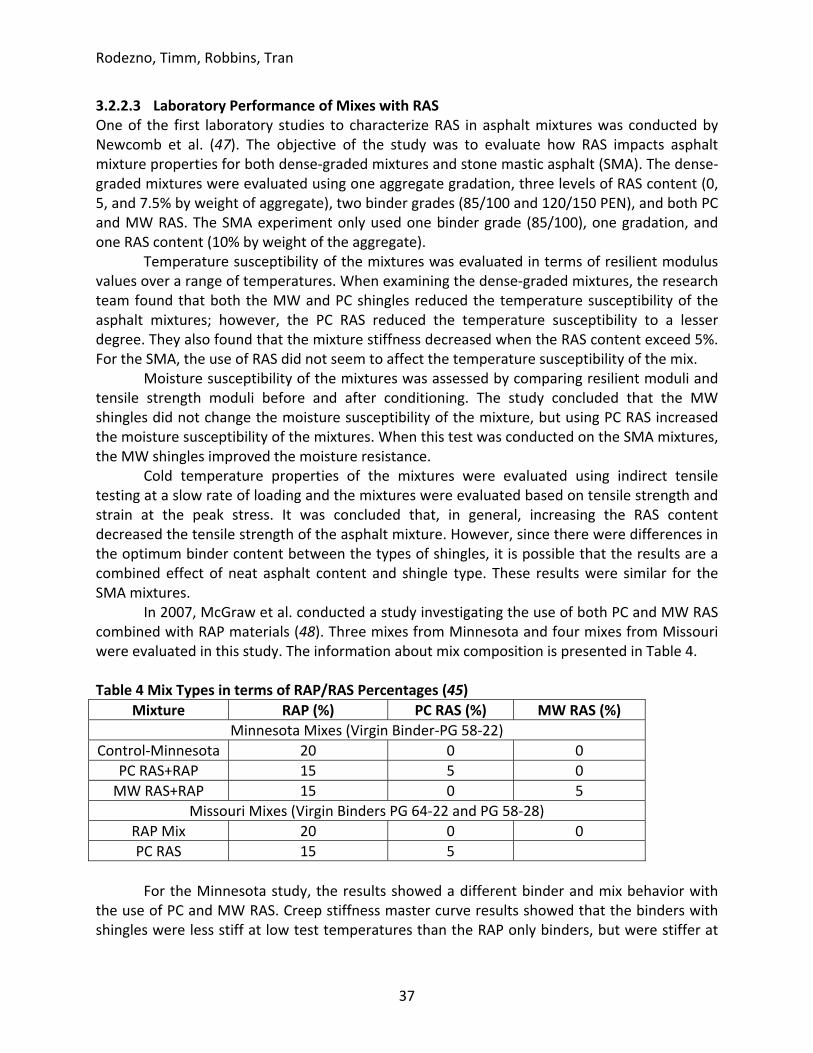
Rodezno, Timm, Robbins, Tran
37
3.2.2.3 Laboratory Performance of Mixes with RAS One of the first laboratory studies to characterize RAS in asphalt mixtures was conducted by Newcomb et al. (47). The objective of the study was to evaluate how RAS impacts asphalt mixture properties for both dense‐graded mixtures and stone mastic asphalt (SMA). The dense‐graded mixtures were evaluated using one aggregate gradation, three levels of RAS content (0, 5, and 7.5% by weight of aggregate), two binder grades (85/100 and 120/150 PEN), and both PC and MW RAS. The SMA experiment only used one binder grade (85/100), one gradation, and one RAS content (10% by weight of the aggregate).
Temperature susceptibility of the mixtures was evaluated in terms of resilient modulus values over a range of temperatures. When examining the dense‐graded mixtures, the research team found that both the MW and PC shingles reduced the temperature susceptibility of the asphalt mixtures; however, the PC RAS reduced the temperature susceptibility to a lesser degree. They also found that the mixture stiffness decreased when the RAS content exceed 5%. For the SMA, the use of RAS did not seem to affect the temperature susceptibility of the mix.
Moisture susceptibility of the mixtures was assessed by comparing resilient moduli and tensile strength moduli before and after conditioning. The study concluded that the MW shingles did not change the moisture susceptibility of the mixture, but using PC RAS increased the moisture susceptibility of the mixtures. When this test was conducted on the SMA mixtures, the MW shingles improved the moisture resistance.
Cold temperature properties of the mixtures were evaluated using indirect tensile testing at a slow rate of loading and the mixtures were evaluated based on tensile strength and strain at the peak stress. It was concluded that, in general, increasing the RAS content decreased the tensile strength of the asphalt mixture. However, since there were differences in the optimum binder content between the types of shingles, it is possible that the results are a combined effect of neat asphalt content and shingle type. These results were similar for the SMA mixtures.
In 2007, McGraw et al. conducted a study investigating the use of both PC and MW RAS combined with RAP materials (48). Three mixes from Minnesota and four mixes from Missouri were evaluated in this study. The information about mix composition is presented in Table 4. Table 4 Mix Types in terms of RAP/RAS Percentages (45)
Mixture RAP (%) PC RAS (%) MW RAS (%) Minnesota Mixes (Virgin Binder‐PG 58‐22)
Control‐Minnesota 20 0 0 PC RAS+RAP 15 5 0 MW RAS+RAP 15 0 5
Missouri Mixes (Virgin Binders PG 64‐22 and PG 58‐28) RAP Mix 20 0 0 PC RAS 15 5
For the Minnesota study, the results showed a different binder and mix behavior with
the use of PC and MW RAS. Creep stiffness master curve results showed that the binders with shingles were less stiff at low test temperatures than the RAP only binders, but were stiffer at

Rodezno, Timm, Robbins, Tran
38
higher temperatures. This may suggest that the shingle binder could be more susceptible to fatigue cracking rather than low temperature cracking. PC shingle binders were also found to be stiffer than MW shingle binders. IDT tests performed on the mixes showed that the addition of PC shingles significantly increased the stiffness of the mixes at all temperatures, especially at the lowest temperature (‐20°C). On the other hand, the addition of MW shingles caused an increase in stiffness only at 0°C and ‐10°C, but at 20°C it reached the lowest value of the three mixes. These results were not confirmed by strength tests, which indicated no significant difference in strength properties with the addition of shingles.
The Missouri study showed that for the PG 64‐22 mixture, the addition of PC shingles increased the mixture stiffness significantly at temperatures below ‐10°C. The authors concluded that this increase would likely cause large thermal stresses in the pavement structures. This effect was less significant with the PG 58‐28; therefore, it was not possible to conclude if the use of a softer grade was a reasonable solution to achieve the required binder grade.
Zhou et al. evaluated the use of RAS in asphalt mixes by characterizing the binder properties of 10 different types of processed RAS stockpiles, four MW and six PC (49). The extracted and recovered RAS binders were found to be very stiff. PC binders were stiffer than MW binder, with an average high temperature grade of 175°C compared to 131°C for MW binders. In terms of low temperature grade, the authors were not able to find reliable results from bending beam rheometer tests (BBR) for any of the binders. RAS binders met the “S” (stiffness criteria) of <300 MPa, but the “m” (slope of stiffness curve) values were always less than the required 0.3 value, even when higher test temperatures were used. MW binders were also found to have less impact on the PG temperatures of the virgin binders, since MW binders are softer than PC binders. The study also characterized mixture properties using dynamic modulus (E*), Hamburg test, and Texas Overlay Tester. Table 5 summarizes the mix information in terms of RAS content and virgin binder used. A total of six mixtures were evaluated; the 0% RAS/PG 64‐22 was used as the control mix and the 0% RAS/PG 70‐22 was evaluated to compare with mixes containing RAS, since some specifications allow one grade bump of the virgin binder when 5% RAS is added. Table 5 Mix Types in terms of RAS Percentages (49)
RAS Type RAS Percentage and Virgin Binder 0% RAS/PG70‐22 0% RAS/PG64‐22 3% RAS/PG 64‐22 5% RAS/PG 64‐22
PC ‐ ‐ 9 9 MW 9 9
Dynamic modulus results indicated that master curves of all mixes were similar, except
the 0% RAS/PG 70‐22 mix, which showed slightly high moduli. Hamburg test results showed improved rutting/moisture susceptibility with either RAS type, but mixes with PC RAS showed less rut depths than those containing MW RAS. Overlay test results showed poor cracking resistance of RAS mixes compared with the 0% RAS mixes; therefore, the authors suggested that cracking resistance may be a concern for these mixes. In order to overcome this limitation, the researchers investigated two approaches for improving cracking resistance of RAS mixes
Rodezno, Timm, Robbins, Tran
39
using soft binder and increasing design density. Both approaches were found to reduce the cracking potential of the mixes.
3.2.2.4 Field Performance of RAS Mixes Minnesota constructed test sections containing RAS mixes in 1990 and 1991. After 13 years in service, the mixes constructed in 1990 still showed good performance, and the mixes constructed in 1991 showed equivalent performance to the control mixtures after 12 years of performance. Transverse reflective cracking was noticed in RAS and control sections; however, no other distresses were noticed (50).
In 1997, The Texas DOT constructed test sections using both PC and MW RAS in asphalt surface mixtures (51). In addition, a control section was also constructed. The performance of the test sections containing roofing shingles appears to be comparable to conventional mixes, and no severe distresses were observed after two years of service.
In 2009, a field project conducted by the Washington State Department of Transportation (WSDOT) and King County Department of Transportation (KCDOT) was designed to assess the viability of using RAS and RAP in asphalt mixtures. Two miles of roadway were divided into half‐mile test sections containing two different overlay asphalt mixtures: 15% RAP HMA and 3% RAS, and 15% RAP HMA. Field monitoring after three years suggested that the RAS had no negative impacts on the pavement’s performance (52).
3.2.3 Recycled Materials Summary The use of RAP and RAS in asphalt pavement is not a new practice, but in recent years, economic and environmental benefits associated with the use of these materials are evident more than ever to the asphalt pavement industry. Some of the benefits include material cost savings, reduced demand of virgin materials, and reduced fuel usage due to reduced extraction and less transportation of virgin materials. According to NAPA, the average RAP content in new asphalt mixes for 2014 was approximately 20%. This percentage represents approximately 71.9 million tons of the total 352 million tons of asphalt mix produced in 2014. RAS content in new asphalt mixes for 2015 was approximately 0.6%, which corresponds to 1.96 tons of the total 352 million tons of asphalt mix produced in 2014. If 20% RAS is used to replace virgin binder, this can translate to 400,000 tons of asphalt and 982,000 tons of aggregates that are preserved.
As more recycled materials are utilized in asphalt mixtures, there are concerns regarding the degree of blending of the RAP/RAS binder into the total binder blend and the effect of recycled binder on the long‐term field performance of the mixture. To address these concerns, some states have limited the amount of recycled binder credited to the total binder blend to increase virgin binder content, resulting in increased effective asphalt content in the total mix. Other states have required additional performance testing for asphalt mixtures with high recycled material contents to evaluate their rutting and cracking resistance before accepting the mix designs. Mix design procedures will continue to evolve for these materials to ensure that the recycled asphalt mixtures will perform. For example, a balanced mix design approach has been recently proposed for designing recycled mixtures. The procedure will include performance tests on appropriately conditioned specimens that address multiple distress types. It will also take into consideration mix aging, traffic climate and location within the pavement structure. Research is underway to select performance tests and laboratory conditioning procedures that

Rodezno, Timm, Robbins, Tran
40
can be included in the balanced mix design procedure. Both materials have proved that when properly designed and placed, they can perform as well as conventional HMA mixes. When including recycled materials in mixtures for structural pavement design, the data and studies presented above suggest that changes in dynamic modulus should be accounted for in the design process as these mixtures are often stiffer than their virgin counterparts. Field testing has indicated that equal or better performance can be achieved from recycled mixtures which suggests using similar performance prediction equations or structural coefficients as a conservative estimate of expected performance. Further field testing and calibration using recycled materials could lead toward more optimal designs.
3.3 Recycled Tire Rubber (RTR)
Rubber modification in asphalt pavements has a long history, starting in the 1840s with a study involving natural rubber in bitumen (53); however, it was in the 1960s that RTR in asphalt pavement applications really developed with different research programs sponsored by the Arizona Department of Transportation (ADOT). In the mid 1970s, ADOT adopted the use of RTR in pavement interlayers, chip seals, and eventually as a binder modifier in open‐graded and gap‐graded mixes. Based on Arizona’s experience, other state agencies started experimenting with the technology. In the mid 1970s and early 1980s, the California Department of Transportation (Caltrans) began experimenting with RTR in chip seals and with the dry process.
In 1988, the American Society of Testing Materials (ASTM) included a definition for asphalt rubber as “a blend of asphalt cement, reclaimed rubber, and certain additives in which the rubber component is at least 15% by weight of the total blend and has reacted in the hot asphalt cement sufficiently to cause swelling of the rubber particles.” A standard specification for asphalt rubber binder was specified later in ASTM D6114‐97.
In 1991, the federal legislation “Intermodal Surface Transportation Efficiency Act” (ISTEA) was signed into law. Section 1038(d) of this legislation required states to use a minimum amount of “crumb rubber” in asphalt surfacing placed each year starting in 1994. The NHS Designation Act of 1995 amended section 1038 of the ISTEA law by eliminating the “crumb rubber” mandate. Although the mandate was lifted, many national research projects to evaluate GTR were underway and some states continued its use.
RTR in asphalt pavement applications has continued to evolve over the years due to the enhancement in performance and many potential benefits that have been recognized. Numerous studies have shown that when properly designed and constructed, rubber‐modified asphalt technologies can perform well and provide different potential benefits that include, but are not limited to (54, 55, 56, 57, 58):
x Improved resistance to rutting, x Improved thermal, reflective and fatigue cracking, x Reduced road maintenance, x Improved driving safety, x Reduced noise (with open‐graded mixtures produced with RTR‐modified asphalt
binders compared to dense‐graded asphalt mixtures and Portland cement concrete pavements), and
x Cost‐effectiveness when compared to conventional AC strategies.
Rodezno, Timm, Robbins, Tran
41
3.3.1 RTR Production Methods There are two grinding methods to produce RTR: ambient temperature and cryogenic. The ambient temperature method processes RTR at or above ordinary room temperature using a crackmill and granulators. The cryogenic method takes place by fracturing rubber particles that have been frozen with liquid nitrogen. The main difference with the use of these methods is the particle shape. Rubber particles obtained from the cryogenic process have a smooth surface, while rubber particles derived from the ambient process have an irregular, rough surface that results in greater surface area than the cryogenically produced particles.
Although there is no U.S. standard to process GTR, there are requirements that the industry uses to determine the quality of the product. These requirements are related to the specific gravity of the rubber, moisture content, fiber content, and metal content. Chemical composition can also be required to ensure that no replacement with unacceptable materials occurs. Some of these requirements include acetone extract, ash, carbon black, rubber hydrocarbon, and natural rubber.
3.3.2 Rubber‐Modified Asphalt Technologies Rubber‐modified asphalt technologies refer to any technology that uses GTR in asphalt pavements, and they can be divided into two processes. The first process is commonly referred to as the wet process, which adds RTR as a modifier to the asphalt binder before mixing with the aggregate. Applications of the wet process include modified asphalt mixtures (dense, gap and open‐graded) and surface treatments. The second process is the dry process, which adds RTR dry as an aggregate replacement. Applications include modified asphalt mixtures.
The wet process can also be divided into asphalt rubber and terminal blend binder. For asphalt rubber, the range of crumb rubber added typically ranges from 15 to 22% by weight of the asphalt. Terminal blends use finely ground crumb rubber (less than #40 mesh), and the amount of crumb rubber may vary from 5‐20% depending on the application. A description of each process is presented in the next sections.
3.3.2.1 Asphalt Rubber (AR) During the blending process for asphalt rubber, a reaction occurs when the crumb rubber particles absorb a portion of the oils in asphalt binder and the particles swell (53). This reaction does not cause the melting of the crumb rubber into the binder. For crumb rubber, when the reaction with asphalt cement occurs, it also swells and softens (54). This swelling increases the viscosity, which results in a thicker film coating on the aggregate particles in asphalt mixtures. The increase in film thickness provides a more durable HMA mixture with increased resistance to oxidative aging (59).
3.3.2.1.1 AR Binder Design Before AR binder production starts, a binder design profile must be developed to conform to specifications to provide a quality product for a particular climate condition. The interaction between the asphalt binder and RTR depends on several factors such as gradation of the rubber, interaction time and temperature, amount of rubber, and asphalt binder grade. Table 6 presents the RTR gradations used by selected agencies. Table 7 presents examples of asphalt binder, RTR content and interactions conditions used by different agencies. A binder design profile is used to evaluate the compatibility of the materials and to ensure the stability of the

Rodezno, Timm, Robbins, Tran
42
AR over time. This profile is based on different laboratory tests that are indicators of the amount of modification obtained with the interaction of RTR and asphalt binder. *Selected based on location of project within the state.
Table 8 presents an example of an asphalt rubber binder profile. Common test
properties specified by different agencies include rotational viscosity, resilience, softening point, and cone/needle penetration test. Table 6 RTR Gradation used by Different Agencies (60, 61, 62, 63, 64 )
Agency ADOT ADOT Caltrans Caltrans FDOT MassDOT PennDOTSpecification Type A Type B Scrap
Tire High Natural
Rubber Sieve Size % Passing
4.75 mm (No. 4) 100 2.36 mm (No. 8) 100 100 98‐100 2.00 mm (No. 10) 100 100 98‐100 100 95‐100 1.18 mm (No. 16) 75‐95 65‐100 45‐75 95‐100 0.60 mm (No. 30) 30‐60 20‐100 2‐20 35‐85 98 0‐10 0.425 mm (No. 40) 0.30 mm (No. 50) 5‐30 0‐45 0‐6 10‐30 0‐5 0.15 mm (No. 100) 0‐2 0‐4 0.075 mm (No. 200) 0‐5 0‐5 0 0‐1 0‐3 Table 7 Typical Asphalt Rubber Binder Laboratory Reaction Profile Design (60, 61, 62)
Blending Parameter ADOT Caltrans FDOT RTR (%) Min. 20 20±2 Min. 20
Base Binder PG 58‐22 PG58‐22 or PG 64‐16* PG64‐22 (for ARB 20)
Blending Temperature (°F) 325‐375 375‐425 335‐375 Minimum Interaction Time (minutes) 60 45 30 *Selected based on location of project within the state. Table 8 Typical Asphalt Rubber Binder Laboratory Reaction Profile Design (65)
Test Performed Test Method Minutes of Reaction
Limit 45 90 240 360 1440
Viscosity at 190°C, (centipoises) ASTM D7741 2400 2800 2800 2800 2100 1500‐4000Resilience at 25°C, % Rebound ASTM D5329 27 ‐ 33 ‐ 23 18 minimum
Softening Point, °C ASTM D36 59.0 59.5 59.5 60.0 58.5 52‐74Cone Pen. at 25°C, (0.10mm) ASTM D217 39.0 ‐ 45.0 ‐ 50 25‐70
One of the limitations of asphalt rubber binders is that they cannot be classified using
Superpave PG system testing procedures. Superpave specifications set the gap opening to conduct dynamic shear rheometer test (DSR) to 1 and 2 mm for high and intermediate temperature range testing. RTR particles in AR may be larger, and the non‐homogenous nature

Rodezno, Timm, Robbins, Tran
43
of the AR binder may affect the test results. Another limitation is that RTR required constant agitation to avoid separation. Research is currently in progress to develop new testing geometries and procedures to evaluate AR binders (66, 67).
3.3.2.2 Terminal Blend For terminal blended binders, the blending takes place in the refinery or stationary asphalt terminal and the component materials are heated over an extended period of time. This results in dissolving the rubber particles. The process uses finer RTR particles than the particles used in AR binders, ranging from 30 to 40 mesh. Terminal blend binders contain anywhere from 5 to 20% or more RTR depending on the application and binder supplier.
This process allows the product to be engineered specifically to meet the climatic conditions specified by the Superpave performance graded system (66). Therefore, Superpave PG System testing procedures similar to conventional and polymer‐modified binders can be used to classify the binder and the same specifications requirements apply. Some modifications are sometimes adopted by agencies; for example, the solubility requirement specified in AASHTO M320 “Performance‐Graded Asphalt Binders” is reduced from 99% to 97.5%.
Terminal blends are sometimes proprietary blends with some of the components classified as trade secrets, but these binders must also comply with the quality requirements established by the agency.
3.3.2.3 Dry Processes The original process, known as PlusRide, was developed in Sweden in 1960. In this process, RTR is blended with the heated aggregate before the asphalt binder is added into the mix at a typical rate of 1 to 5%. The RTR particles in this process are generally coarser than those in the wet process and are considered as part of the aggregate gradation (55). In general, the use of the dry process has not been very successful in the past. More recent dry modified methods are using additives, processing aids, and smaller particle sizes (30‐40 mesh) than the ones typically used in the dry process (4‐18 mesh). By using smaller particles, the intention is to modify the binder during the asphalt mix production process (69). With these modifications, the technology has been successfully used in Georgia and it is currently allowed in their specifications.
3.3.3 RTR Applications
3.3.3.1 Asphalt Rubber AR and terminal blend binders are very different materials with unique properties. One of the most significant differences is their viscosity; terminal blend binders have much lower viscosity than asphalt rubber binders. The typical range for AR at 375°F is 1500‐2500 cP, and for terminal blends 300‐600 cP at 325°F. Figure 13 illustrates the two binders (70).
Mix design methods, specifications, and construction procedures for AR are different than for conventional mixes. AR binders are recommended in gap and open‐graded mixes, but they are not recommended for dense‐graded mixes because the dense gradation cannot accommodate the rubber particle sizes typically used for AR binder. They can also be used in surface treatments, slurry seals, and interlayers.

Rodezno, Timm, Robbins, Tran
44
Figure 13 Asphalt Rubber Binder (left) and Terminal Blend Binder (right) (70)
3.3.3.2 Terminal Blends Terminal blends can be used in dense‐graded, open‐graded and gap‐graded mixes. Since terminal blend binders can be classified using the Superpave PG system, the same mix design methods, specifications, and construction procedures used for conventional and polymer‐modified binders can be used for terminal blends. They can be used in different surface treatments such as chip seals, emulsions, slurry seals, and tack coat applications.
3.3.4 Performance of RTR Asphalt Technologies There are numerous studies that document the performance of asphalt pavement applications using RTR. AR has a longer performance history than terminal blend, and the dry process has not been successful in the past.
One of the most recognized studies was conducted in 2002 at the Turner‐Fairbank Highway Research Center. A total of twelve lanes of asphalt mixes were constructed with various modified asphalts. Two of the test lanes used RTR, one lane used AR binder in a gap graded mix (CR‐AZ), while another lane used terminal blend binder + SBS (hybrid binder) in a dense graded mix. The sections were subjected to accelerated pavement testing using the accelerated loading facility (ALF). One of the most significant findings was that the CR‐AZ section showed the best fatigue and reflective cracking performance. This implies that the structural coefficient and transfer functions could be adjusted for the 1993 AASHTO Design Guide and M‐E methods, respectively. The CR‐TB showed better fatigue cracking resistance than the control section, but other sections with other types of modifiers performed better than the CR‐TB. Figure 14 shows the cracking performance of the different sections. The CR‐TB section showed the lowest rut resistance while the CR‐AZ showed similar rut resistance as the other sections (71).

Rodezno, Timm, Robbins, Tran
45
Figure 14 Cumulative Crack Length vs. ALF Wheel Load Passes for Test Sections (71)
As part of the 2009 NCAT Test Track research cycle, the Missouri Department of
Transportation sponsored two test sections to determine if RTR would be an adequate substitute for SBS in asphalt mixtures without sacrificing mixture performance. The first mixture used a binder modified with 11% 30‐40 ambient ground mesh rubber and the second mixture used a 2.5% SBS‐modified binder. Both mixtures had a 12.5 mm nominal maximum aggregate size (NMAS) and they were constructed as lifts 1.75 inches thick on perpetual pavement foundations to ensure that distresses were indicative of the surface mixture’s performance and not the subgrade or base material. A total of approximately 10 million equivalent single axle loads (ESALs) were applied to both sections. At the end of this cycle, neither section showed any signs of cracking and the rutting for both was less than 5 mm. Because of its excellent performance, the RTR section was left in place for the next cycle to assess its long‐term performance. After 20 million ESALs, no signs of cracking were observed and no additional rutting was found at the end of the 2012 cycle.
3.3.5 RTR Summary RTR has been used in asphalt pavement applications for several decades and the different applications have evolved over the years. Due to the enhancement in performance and many potential benefits that have been recognized, the technology is gaining acceptance by the asphalt industry. Some of these potential benefits include: improved resistance to rutting, improved thermal, reflective, and fatigue cracking, and improved driving safety. Design methods for some of the RTR technologies available, such as terminal blend, do not differ from those typically used for conventional asphalt mixtures. For other technologies, such as asphalt rubber, design procedures are available but research still continues to be able to incorporate these technologies in Superpave mix design. Numerous studies have shown that when properly designed and constructed, rubber‐modified asphalt technologies can perform well and provide several additional benefits. These findings support using structural coefficients equal or greater to conventional materials in the 1993 AASHTO Design Guide, despite an earlier study using deflection data (described in Section 2) that computed lower structural coefficients (9).
Rodezno, Timm, Robbins, Tran
46
Likewise, transfer functions for RTR should also be adjusted to reflect their performance. To fully optimize structural pavement designs using RTR, there is a need for further research to quantify structural coefficients and transfer functions.
3.4 Stone Matrix Asphalt (SMA)
Stone matrix asphalt, also known as stone mastic asphalt, is a gap‐graded mix composed of high quality coarse aggregates and a mixture of asphalt binder, mineral filler, and fine aggregate. This type of mix relies on strong stone‐to‐stone contact of a high quality aggregate, which provides strength to resist rutting, and high asphalt binder content, which provides durability.
The technology was developed in Germany in the 1960s with the primary goal of resisting the wear of studded tires, but the technology demonstrated excellent performance as durable asphalt surface mixtures resisting numerous asphalt pavement distresses. In the United States, the interest in the use of SMA started in the early 1990s after a study tour of European countries by U.S. pavement specialists to observe the excellent performance of these mixes. A technical working group was established by FHWA in early 1991 to develop guidelines for the use of the technology. That same year, SMA mixes were placed in Wisconsin, Michigan, Georgia, and Missouri.
In the mid 1990s, NCAT conducted a performance evaluation of more than 140 SMA pavements in the United States. No raveling was found, and rutting measurements were less than 4 mm for over 90 percent of the pavements (72). Two years later, NCAT completed project NCHRP 9‐8, “Designing Stone Matrix Asphalt Mixtures for Rut‐Resistant Pavements” (73). As a result of this project, a mix design procedure was developed and validated with field data for SMA, and a formal design procedure, specifications, and construction guidelines were provided for SMA mixes with nominal maximum aggregate size (NMAS) gradations ranging from 4.75 to 25.0 mm. NAPA published a technical document, “Designing and Constructing SMA Mixtures‐State of Practice,” with key findings from NCHRP 9‐8 and documented research with the use of SMA mixes (74).
Due to their high initial cost as a result of the increase in asphalt content and the use of high quality aggregate, SMA mixes are considered premium mixes, but this high initial cost can be offset by enhanced performance. These mixes are primarily used for surface courses on high volume interstates and highways, but studies have also shown that they can be used as overlays on low volume roads and still provide a longer service life than conventional pavements (75). Numerous advantages with the use of SMA mixes compared with conventional dense graded mixes include (72, 73, 78):
1) Enhanced performance reflected in the following observations: a. Superior resistance to permanent deformations, even when subjected to high
traffic volumes, b. Less fatigue cracking as a result of the high binder content, c. Excellent resistance to raveling, as a result of high quality aggregate and large
stones, and d. The propagation rate of reflective cracking is significantly reduced.
2) Improved skid resistance: the rougher surface texture improves its resistance to friction
3) Reduced tire splash
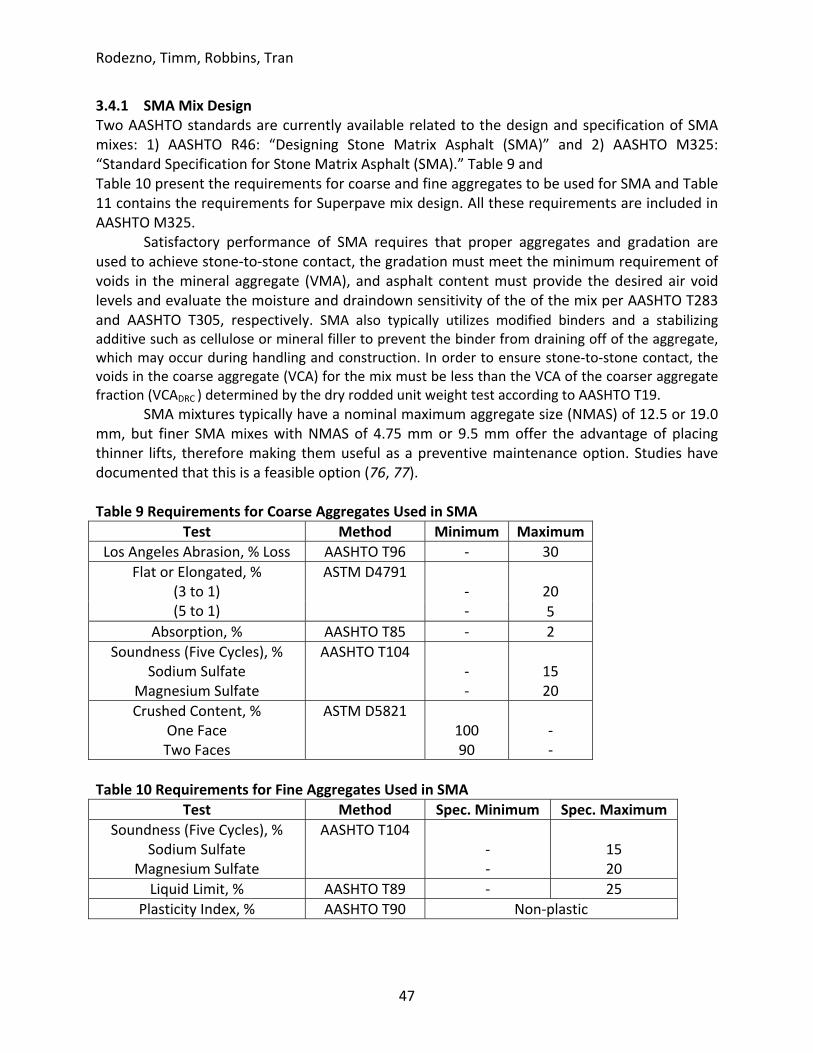
Rodezno, Timm, Robbins, Tran
47
3.4.1 SMA Mix Design Two AASHTO standards are currently available related to the design and specification of SMA mixes: 1) AASHTO R46: “Designing Stone Matrix Asphalt (SMA)” and 2) AASHTO M325: “Standard Specification for Stone Matrix Asphalt (SMA).” Table 9 and Table 10 present the requirements for coarse and fine aggregates to be used for SMA and Table 11 contains the requirements for Superpave mix design. All these requirements are included in AASHTO M325.
Satisfactory performance of SMA requires that proper aggregates and gradation are used to achieve stone‐to‐stone contact, the gradation must meet the minimum requirement of voids in the mineral aggregate (VMA), and asphalt content must provide the desired air void levels and evaluate the moisture and draindown sensitivity of the of the mix per AASHTO T283 and AASHTO T305, respectively. SMA also typically utilizes modified binders and a stabilizing additive such as cellulose or mineral filler to prevent the binder from draining off of the aggregate, which may occur during handling and construction. In order to ensure stone‐to‐stone contact, the voids in the coarse aggregate (VCA) for the mix must be less than the VCA of the coarser aggregate fraction (VCADRC ) determined by the dry rodded unit weight test according to AASHTO T19.
SMA mixtures typically have a nominal maximum aggregate size (NMAS) of 12.5 or 19.0 mm, but finer SMA mixes with NMAS of 4.75 mm or 9.5 mm offer the advantage of placing thinner lifts, therefore making them useful as a preventive maintenance option. Studies have documented that this is a feasible option (76, 77).
Table 9 Requirements for Coarse Aggregates Used in SMA
Test Method Minimum Maximum Los Angeles Abrasion, % Loss AASHTO T96 ‐ 30
Flat or Elongated, % (3 to 1) (5 to 1)
ASTM D4791
‐ ‐
20 5
Absorption, % AASHTO T85 ‐ 2 Soundness (Five Cycles), %
Sodium Sulfate Magnesium Sulfate
AASHTO T104 ‐ ‐
15 20
Crushed Content, % One Face Two Faces
ASTM D5821 100 90
‐ ‐
Table 10 Requirements for Fine Aggregates Used in SMA
Test Method Spec. Minimum Spec. Maximum Soundness (Five Cycles), %
Sodium Sulfate Magnesium Sulfate
AASHTO T104 ‐ ‐
15 20
Liquid Limit, % AASHTO T89 ‐ 25 Plasticity Index, % AASHTO T90 Non‐plastic
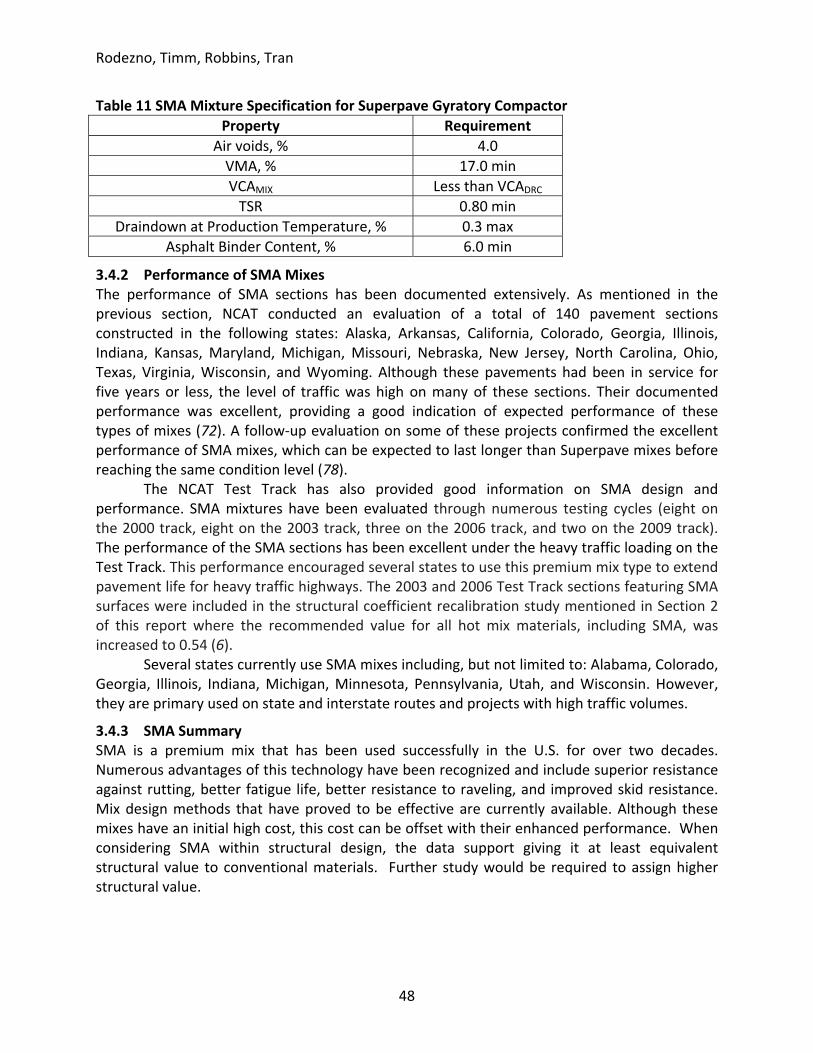
Rodezno, Timm, Robbins, Tran
48
Table 11 SMA Mixture Specification for Superpave Gyratory Compactor Property Requirement
Air voids, % 4.0 VMA, % 17.0 min VCAMIX Less than VCADRC TSR 0.80 min
Draindown at Production Temperature, % 0.3 max Asphalt Binder Content, % 6.0 min
3.4.2 Performance of SMA Mixes The performance of SMA sections has been documented extensively. As mentioned in the previous section, NCAT conducted an evaluation of a total of 140 pavement sections constructed in the following states: Alaska, Arkansas, California, Colorado, Georgia, Illinois, Indiana, Kansas, Maryland, Michigan, Missouri, Nebraska, New Jersey, North Carolina, Ohio, Texas, Virginia, Wisconsin, and Wyoming. Although these pavements had been in service for five years or less, the level of traffic was high on many of these sections. Their documented performance was excellent, providing a good indication of expected performance of these types of mixes (72). A follow‐up evaluation on some of these projects confirmed the excellent performance of SMA mixes, which can be expected to last longer than Superpave mixes before reaching the same condition level (78).
The NCAT Test Track has also provided good information on SMA design and performance. SMA mixtures have been evaluated through numerous testing cycles (eight on the 2000 track, eight on the 2003 track, three on the 2006 track, and two on the 2009 track). The performance of the SMA sections has been excellent under the heavy traffic loading on the Test Track. This performance encouraged several states to use this premium mix type to extend pavement life for heavy traffic highways. The 2003 and 2006 Test Track sections featuring SMA surfaces were included in the structural coefficient recalibration study mentioned in Section 2 of this report where the recommended value for all hot mix materials, including SMA, was increased to 0.54 (6).
Several states currently use SMA mixes including, but not limited to: Alabama, Colorado, Georgia, Illinois, Indiana, Michigan, Minnesota, Pennsylvania, Utah, and Wisconsin. However, they are primary used on state and interstate routes and projects with high traffic volumes.
3.4.3 SMA Summary SMA is a premium mix that has been used successfully in the U.S. for over two decades. Numerous advantages of this technology have been recognized and include superior resistance against rutting, better fatigue life, better resistance to raveling, and improved skid resistance. Mix design methods that have proved to be effective are currently available. Although these mixes have an initial high cost, this cost can be offset with their enhanced performance. When considering SMA within structural design, the data support giving it at least equivalent structural value to conventional materials. Further study would be required to assign higher structural value.

Rodezno, Timm, Robbins, Tran
49
3.5 Cold Recycling
As explained in Section 3.2, back in the 1970s when the price of asphalt binder drastically increased due to the Arab oil embargo, the asphalt industry was proactive in finding ways to effectively recycle asphalt pavement materials. Section 3.2 covered the use of RAP in asphalt mixtures in a controlled plant environment. Another option available is to use RAP materials as an asphalt layer using cold in place recycling.
Cold recycling (CR) refers to the recycling of asphalt pavements without the application of heat. It can be divided in two categories: cold in place recycling (CIR) and cold central plant recycling (CCPR). CR falls into the category of rehabilitation when it is combined with an asphalt overlay or as a pavement preservation and corrective maintenance technique (81). However, CR can also be used effectively as a structural layer within new pavement structures. Two of the most common binding agents used to produce a CR layer are asphalt emulsion and foamed asphalt.
CR is most commonly used to rehabilitate pavements with high severity, non‐load associated distresses or with load related distresses when combined with an overlay to provide structural capacity to the pavement structure. Some of the distresses that can be treated include raveling, potholes, bleeding, shoving, rutting, edge and block cracking, and corrugations, as well as improved skid resistance. Although a lot of distresses can be addressed with CR, cracked pavements that are structurally sound with well‐drained bases are the best candidates (81). Therefore, pavement distress evaluation is crucial to determine if a pavement is a good candidate for this technique.
This recycling process, like other recycling alternatives, provides a number of potential economical and sustainable benefits that include but are not limited to the following (81, 82).
x Construction benefits: reduces traffic disruptions, shortens lane closure times, and maintains height clearances.
x Environmental benefits: conserves non‐renewable resources, reduces emissions and fuel consumption, reduces materials disposal.
x Economic benefits: reduction in haul costs, competitive cost when compared to conventional asphalt overlays.
Significant disadvantages of using CR include: past performance heavily dependent on contractor experience; quality control and quality assurance are more difficult; no nationally accepted mix design procedures are available to characterize the materials; and performance benefits still are quantified empirically (82, 83).
CIR is defined as a process that uses cold milling of the surface and remixing with the addition of asphalt emulsion, Portland cement, foamed asphalt, or other additives to improve the properties of the RAP, followed by placing and compacting the new mix in one continuous operation (83). CIR is generally applied to older pavements that are structurally adequate but require a new wearing course due to poor ride or other surface distresses. This rehabilitation treatment may be applied in conjunction with an overlay or with a seal coat, depending on the expected traffic levels on the roadway (82). It has also been used as a surface layer on low volume roads that may only require a surface treatment.
CIR is a continuous process that involves the following steps: the existing asphalt pavement is cold‐milled, the RAP is screened, the oversized particles are crushed, and the RAP
Rodezno, Timm, Robbins, Tran
50
is blended with bituminous recycling agents such as emulsified asphalt or foamed asphalt to produce a CIR mix. Typically, a milling machine removes 2‐5 inches off the existing pavement. Additional aggregate may be added to correct the gradation and improve mixture properties. Additives such as cement or lime may also be added into the blend to improve early strength gain and resistance to moisture damage. The CIR mix is then placed onto the existing milled roadway using conventional paving equipment and compacted using steel, vibratory, and pneumatic tire rollers.
CCPR is defined as the process in which the asphalt recycling takes place at a central location using a stationary cold mix plant. The CCPR mixture can be used immediately as a recycled pavement or it can be stockpiled and used later. The RAP materials can be obtained by cold planning or removal using different pieces of equipment such as a backhoe, excavator, or front end loader. The material is then transported to a central plant where it is sized and mixed with a recycling agent. When the CCPR mix is going to be used, it is transported to the site with conventional equipment and placed with conventional asphalt pavers.
CR may require more compactive energy than HMA or WMA due to the colder compaction temperatures, the high friction developed between mixture particles, and the higher viscosity of the binder. After compaction, the CR mix needs time to set or cure and the water needs time to evaporate. The time required for curing is variable and depends on factors such as the type of emulsifying agent used, environmental conditions, and moisture characteristics of the mix. Typical curing times are two to three days, but in some cases curing can take a few hours to up to several weeks. Once cured, most CIR paving layers are overlaid with a wearing surface.
3.5.1 Cold Recycling Mix Design According to the Asphalt Recycling & Reclaiming Association (ARRA), there are three traditional theories that have been used to design CR mixtures with recycling agents (81). The first theory considers that the RAP will act as an aggregate and the mix design process needs to determine asphalt content to coat the RAP aggregate; hence, no contribution of the binder in the RAP is considered. The second theory assumes that complete softening of the aged RAP binder occurs; therefore, the physical and chemical characteristics of the recovered asphalt binder needs to be evaluated and a recycling agent is added to restore the asphalt binder to its original properties. The third theory, which is most widely accepted, is a combination of the first two and is referred to as the effective asphalt theory, where the softened aged binder and the recycling agent form an effective asphalt layer. In this case, the level of softening of the aged binder may be difficult to quantify because it will depend on the properties of the old binder, the recycling agent, and the environmental conditions. For this method, mechanical tests on the CR mix may be needed as part of the mix design.
There are different design procedures for CR mixtures used by different agencies in the United States, but there is no nationally accepted method. In 1998, a first effort to develop guidelines for CR design took place. A task force was formed with the participation of AASHTO, the Associated General Contractors of America (AGC) and the America Road and Transportation Builders Association (ARTBA). The outcome of this effort included mix design procedures for Marshall and Hveem equipment. Current mix design procedures accepted by some agencies include the use of a Superpave gyratory compactor and a Wirtgen method that uses 75‐blow

Rodezno, Timm, Robbins, Tran
51
Marshall design (84). These design procedures may include mixture testing of initial and cured strength, moisture, and raveling resistance.
The ARRA indicates that the following steps are required for designing CR mixtures (81). 1. Obtain cores from the existing pavement or samples of the RAP materials and
determine binder content, binder properties, and gradation of extracted aggregate. 2. Select the amount and type of any additional aggregate if required. 3. Select the type and amount of the recycling agent. 4. Prepare and test specimens. 5. Establish a job mix formula. 6. Adjust the design in the field as needed. For more information regarding the ARRA recommended procedure for CR mixtures, the
reader can consult the latest edition of the ARRA Basic Asphalt Recycling Manual published in 2015.
3.5.2 Performance of Cold Recycling Mixtures Although cold recycling has been used for several decades, the long‐term performance of pavements constructed with these techniques has not been widely documented, especially when they are used on highways with relatively high traffic levels.
Poor performance is usually attributed to improper pavement candidate selection, lack of contractor experience, only one asphalt layer being recycled (resulting in delamination from the underlying layers), excessive amounts of recycling agent, paving in cold or wet weather, or overlying before the curing process is complete. Despite these reported problems, Arizona, Virginia, and Nevada have reported successful experiences with cold recycling.
In 2006, a study was conducted in Arizona to document the performance of 17 selected CIR projects that had been placed by the Arizona Department of Transportation for over two decades (82). CIR is commonly used with an asphalt overlay or a double application of a seal coat. The study indicated that for low to moderate traffic levels, 2 to 3 inches of CIR was a viable pavement preservation strategy that added approximately 10 years of service to the existing pavement with moderate distresses, adequate ride quality, and fair maintenance activities and cost. The study also suggested that combining CIR with a 2 to 3‐inch overlay provided greater assurance of adequate performance and reduced the probability of premature failure. It was also indicated that there was no performance data available for pavements 10 years or older, and therefore, monitoring future projects was recommended to assess long term performance of pavements using this rehabilitation technique.
In 2011, the Virginia Department of Transportation (VDOT) completed a construction project that used three in place pavement recycling techniques: CCPR, CIR, and full depth reclamation (FDR), on a high‐volume interstate (85). The project consisted of a 3.7‐mile section of I‐81 in Augusta County. The CCPR and CIR materials used a hydraulic cement content of 1% and a foamed asphalt cement of 2%. For the FDR, a combination of hydraulic cement and lime kiln dust was used as a stabilization agent at a dosage rate of 3%. For the right lane, the existing pavement was milled, leaving just one inch of asphalt processed using FDR with the existing aggregate base and upper portion of the subgrade. The RAP material was then mixed with foamed asphalt and Portland cement in an onsite CCPR mobile plant and placed in a 6‐inch layer using conventional paving equipment. The CCPR base was covered with 4 inches of
Rodezno, Timm, Robbins, Tran
52
conventional asphalt with a 19 mm NMAS with a PG 70‐22 binder and a 2‐inch SMA overlay having a 12.5 mm NMAS with a polymer‐modified PG 76‐22. In the left‐hand passing lane, the existing pavement structure did not require reconstruction of the aggregate base. Therefore, the lane was recycled in‐place using the CIR method to a depth of 5 inches and topped with 4 inches of conventional asphalt mix. The field performance after three years of high traffic volume demonstrated that the section of pavement rehabilitated by the three in‐place recycling methods performed well.
As part of the NCAT Test Track 2012 cycle, VDOT sponsored three sections to further evaluate the use of CCPR base material for high‐volume applications. Sections N3 and N4 compared the overlay thickness of conventional asphalt mixes of 6 inches vs. 4 inches, respectively, when placed on top of a CCPR base. Section S12 compared FDR with the conventional base and subgrade construction used in N4. The three sections were built on the same subgrade material. Sections N3 and N4 were built on a crushed granite base course, while S12 used a stabilized base course constructed using FDR, treated with cement, and compacted in place. A CCPR layer was constructed above the base layers, Superpave mixtures were placed on top of the CCPR layer, and each section was surfaced with SMA. Section N3 had an AC thickness of 6 inches total, while the other two sections used approximately 4 inches of AC on top of the CCPR. For the CCPR base, RAP was mixed with 2% foamed asphalt binder and 1% Portland cement in an onsite mobile cold recycling plant. The CCPR material was compacted to a target layer thickness of 5 inches. At the end of the test cycle, after approximately 10 million ESALs of trafficking, all three CCPR sections exhibited excellent performance. Very little difference was observed between sections in terms of rutting performance, and no cracking was observed in any of the sections.
As part of the CCPR investigation at the Test Track, falling weight deflectometer deflection data were used to compute structural coefficients of the CCPR layer (86). Values ranging from 0.36 to 0.39 were found and believed to be conservative based on the excellent performance observed in each section. These values were consistent with those found by Diefenderfer and Apeagyei in a similar study that had values ranging from 0.36 to 0.48 (85).
3.5.3 Cold Recycling Summary Cold recycling refers to the recycling of asphalt pavements without the application of heat. It represents an effective way to recycle asphalt pavement materials. CR is most often used to rehabilitate pavements with high severity, non‐load associated distresses or with load‐related distresses when combined with an overlay to increase the structural capacity. Different design methods are currently available and continue to evolve. As with other technologies covered in this report, when properly designed and placed, cold recycling has proved to be an effective alternative to rehabilitate asphalt pavements. When considering cold‐recycled materials within structural design methods, data and studies support attributing a somewhat lower structural value than conventional or hot or warm mix asphalt materials.
3.6 Polymer‐Modified Asphalt
Polymer modification of asphalt binders to improve performance properties has increased significantly over the past years starting with the implementation of the Strategic Highway Research Program (SHRP). Polymers include a wide range of modifiers. Elastomers (rubber or elastics) and plastomers (plastic) are the two main categories. Elastomers enhance strength at

Rodezno, Timm, Robbins, Tran
53
high temperatures and elasticity at low temperatures; plastomers enhance strength but not elasticity (87). Styrene‐butadiene rubber (SBR) and styrene‐butadiene‐styrene (SBS) are the most commonly used elastomers. Plastomers are not commonly used.
Polymer‐modified asphalt (PMA), SBS in particular, has been increasingly used in asphalt pavements with high traffic demands to improve permanent deformation resistance and mix durability. The addition of a polymer to virgin asphalt allows increasing the binder temperature range by increasing the high temperature grade with minimal effect on the low temperature grade (88). The higher viscosity provided by the polymers helps resist rutting under heavy loads, while increased elasticity improves the resistance to the fatigue from heavy traffic. Other benefits reported with the use of PMA include improved aging characteristics, and improved adhesive bonding to aggregate particles, which helps minimize drain‐down during construction and reduces the raveling potential of the asphalt mixes (87, 88).
Agencies have reported that PMA mixtures provide moderate to excellent performance. A study conducted in 2005 indicated that the primary reason agencies used PMA mixtures was to increase resistance to rutting, increase resistance to thermal cracking, and improve durability. The study also indicated that none of the agencies interviewed used PMA mixtures to enhance pavement fatigue resistance (89).
PMA mixtures using SBS have been placed primarily in surface courses, partly due to the perception that intermediate and base courses don’t need modification due to having narrower temperature spans than surface courses. Despite this fact, the ability of SBS to resist fatigue could be used to reduce the overall cross‐section of an asphalt pavement section. This is particularly important for perpetual pavements, which may require a high‐modulus intermediate asphalt layer and fatigue resistant base layer (90).
Although PMA mixtures can be designed using Superpave, some special considerations must be noted. PMA mixtures may require higher mixing and compaction temperatures and these temperatures are usually selected per supplier recommendation.
3.6.1 Performance of Polymer‐Modified Asphalt Mixes PMA mixtures are typically used in upper pavement layers to improve rutting performance where temperatures and stresses are more extreme. In 2009, Kraton Polymers sponsored a structural section at the NCAT Test Track containing high polymer‐modified asphalt mixes (HiMA) in each lift (base, binder, and wearing). These mixes contained an asphalt binder formulation with 7.5% SBS. Conventional modified binder contains 2‐3% SBS. This HiMA section was 5.75 inches thick, an 18% thinner cross section compared to a control section with typical levels of polymer and a thickness of 7 inches. The objective was to evaluate the performance of this thinner HiMA section relative to a control section (90).
Bending beam fatigue tests indicated that the Kraton mixture endured a greater number of cycles until failure than the control mixture at 400 and 800 microstrain. It was also found that the Kraton base mixture had a fatigue endurance limit three times greater than the control base mixture. Fatigue transfer functions developed from beam fatigue testing were combined with measured AC strain data at the Test Track from each test section to compare estimated fatigue performance between sections. An estimated 45 times improvement in fatigue performance was reported when comparing the Kraton section against the control section. The authors reported that this improvement could be attributed to each section having
Rodezno, Timm, Robbins, Tran
54
approximately the same strain level, while the Kraton base mixture had a better fatigue performance over the control base mixture (90).
APA test and FN tests were also conducted to evaluate the susceptibility of the mixes to rutting. The results of APA tests on the control surface and base mixtures and Kraton surface and base mixtures were all less than 6 mm of rutting after 8,000 cycles. In addition, the Kraton mixtures had statistically higher FN test results, indicating that the Kraton surface mixture was least susceptible to rutting. While the Kraton base mixture had a higher FN than the control, the results were not statistically significant. This was attributed to the high variability of the test results for the control base mixture (90).
The Kraton section was left in place for two research cycles due to its excellent performance, equivalent to 20 million ESALs of traffic. The HiMA section outperformed the control section in terms of rutting resistance. The rutting on the control section was reduced due to a pavement preservation treatment that was applied; however, even after 20 million ESALs, the HiMA section had only approximately 4 mm of rutting. The section also proved to be more resistant to cracking than the control mixture (90, 91).
3.6.2 Polymer‐Modified Asphalt Summary PMA mixes have been used to improve pavement performance and increase pavement life. Potential benefits include improved permanent deformation resistance, durability, improved aging characteristics, and improved adhesive bonding to aggregate particles, which helps minimize drain‐down and raveling. Laboratory and field performance of mixes with PMA have clearly shown superior performance when compared to conventional mixes. Although PMA mixes will typically have a higher initial cost, the potential of extending pavement service life and reducing maintenance costs may offset the initial cost. Within structural design systems, PMA mixtures should be given at least the structural value of unmodified materials. Further investigation should be done to determine the magnitude of structural value increase for specific PMA mixtures.
Rodezno, Timm, Robbins, Tran
55
4 SUMMARY
Asphalt pavement technology advancements to improve performance and environmental sustainability in flexible pavements continue to evolve with a constant improvement of innovative and sustainable materials and technologies. As the industry continues moving towards sustainable development, the focus must be on improving materials and designs, reducing energy consumption, emissions, and environmental impacts, and extending pavement life. Higher materials and construction costs and the challenges associated with the deterioration of the roadway system supports continuing this approach. Despite this fact, structural design aspects need to be considered for optimum designs.
There are several methods for flexible pavement design in the United States. They include the 1993 AASHTO Design Guide, the AASHTO M‐E Design, and perpetual pavement design. This document proposed changes to each design method to arrive at optimized pavement structures when innovative and sustainable materials are specified. Emphasis is placed on challenges encountered when attempting to use these materials and guidance and/or recommendations for overcoming these challenges are provided. One of the most significant challenges lies in rapid deployment of promising new technologies. Proper calibration of mechanistic‐empirical transfer functions or empirical structural coefficients to efficiently use new technologies is currently, at best, a multi‐year and very costly effort. National level research should be conducted to develop rapid calibration procedures to minimize the time and cost required to deploy new mix technologies.
The report also provides a basic understanding of different materials and technologies, mix design considerations, material properties, performance, and possible applications. Other information pertaining current usage and experience with aforementioned materials and technologies is also presented. The following are summary recommendations made regarding each technology:
4.1 Warm Mix Asphalt
Warm mix asphalt has been used for over a decade in the U.S., and numerous studies have indicated it can be used in design with few (if any) changes when compared to conventional HMA. It is recommended that WMA mixtures have similar structural coefficients to HMA mixtures in the 1993 AASHTO Design Guide. In M‐E systems, treating WMA in the same fashion as HMA with respect to material properties and performance prediction equations also is supported by lab and field data.
4.2 Reclaimed Asphalt Pavement (RAP) and Recycled Asphalt Shingles (RAS)
Increased RAP and RAS contents tend to increase mixture moduli and potentially decrease strain tolerance when all else is held equal. However, using softer virgin binders can offset this effect and result in high‐performing materials nearly indistinguishable from virgin HMA. Laboratory testing should be conducted to determine E* for specific mixes in to be used in the MEPDG. Adjustments to transfer functions will also be needed to account for potentially greater cracking with less rutting, but don’t currently exist for specific mix designs. There are

Rodezno, Timm, Robbins, Tran
56
data to support using structural coefficients for RAP mixtures similar to virgin mixtures, but no data or guidance was found pertaining to RAS mixtures. This deficiency requires further investigation.
4.3 Recycled Tire Rubber (RTR)
Though RTR has a very long history and the benefits of the material are well‐documented, there is very little guidance available regarding its use in structural design procedures. The recommendation, based on available data, is to use structural coefficients at least equal to that of conventional materials for AASHTO 1993 Design. For ME design, E* should be measured in the laboratory, but further research is needed regarding transfer function calibration.
4.4 Stone Matrix Asphalt (SMA)
Many field studies have confirmed excellent performance from SMA mixtures used as surfacing layers. SMA mixes at the NCAT Test Track were found to have comparable structural coefficients to conventional materials and 0.54 was recommended from that study (4). Again, laboratory E* testing is needed for ME design and the various transfer functions should be adjusted to reflect actual performance of SMA mixtures in the field.
4.5 Cold Recycling
Though cold recycling has been widely used across the U.S., the long‐term performance of pavements constructed with these techniques has not been widely documented, especially when they are used on highways with relatively high traffic levels. Recent studies, however, have estimated CCPR layers to have structural coefficients in the range of 0.36 to 0.48 (85, 86). Further research is needed to quantify structural coefficients for a wider range of CR materials. For ME design, E* should again be measured on a mixture‐specific basis and calibration of transfer functions is required.
4.6 Polymer‐Modified Asphalt (PMA)
Polymer modified asphalt includes a wide range of materials resulting a wide range of mixtures whose properties depend on the mix design and the amount and type of polymer modification. These materials tend to have improved cracking and rutting resistance which suggests that the ME transfer functions should be calibrated accordingly to optimize their use. Also, E* should be directly measured in the laboratory for ME design. As documented at the NCAT Test Track, there was insufficient evidence found to support using a structural coefficient for PMA different than that of conventional mixtures. This was likely due to the limited nature of the study but is a conservative recommendation.

Rodezno, Timm, Robbins, Tran
57
5 REFERENCES
1. American Association of State Highway and Transportation Officials. AASHTO Guide for Design of Pavement Structures. Washington, D.C., 1993.
2. Highway Research Board. The AASHO Road Test. Highway Research Board Special Report 61A, 61C, 61E. National Academy of Sciences, Washington, D.C., 1962.
3. Timm, D., M. M. Robbins, P. Nam Tran, and C. Rodezno. Flexible Pavement Design–State of the Practice. NCAT Report 14‐04. National Center for Asphalt Technology, Auburn, Ala., 2014.
4. Peters‐Davis, K., and D. H. Timm. Recalibration of the Asphalt Layer Coefficient. NCAT Report 09‐03. National Center for Asphalt Technology, Auburn, Ala., 2009.
5. Li, J., J. S. Uhlmeyer, J. P. Mahoney, and S. T. Muench. Use of the 1993 AASHTO Guide, MEPDG and Historical Performance to Update the WSDOT Pavement Design Catalog. WA‐RD 779.1. University of Washington, Seattle, 2011.
6. Dossett, C., and D. H. Timm. Structural Coefficient Calibration of Sustainable Asphalt Paving Materials. World Conference on Pavement Asset Management, Milan, Italy, 2017, under review.
7. Timm, D. H., M. Robbins, N. Tran, and C. Rodezno. Recalibration Procedures for the Structural Asphalt Layer Coefficient in the 1993 AASHTO Pavement Design Guide. NCAT Report 14‐08. National Center for Asphalt Technology, Auburn, Ala., 2014.
8. Van Wyk, A., E. J. Yoder, and L. E. Wood. Determination of Structural Equivalency Factors of Recycled Layers by Using Field Data. Transportation Research Record 898, TRB, National Research Council, Washington, D.C., 1983, pp. 122‐132.
9. Hossain, M., A. Habib, and T. M. LaTorella. Structural Layer Coefficients of Crumb Rubber Modified Asphalt Concrete Mixtures. In Transportation Research Record: Journal of the Transportation Research Board, No. 1583, Transportation Research Board of the National Academies, Washington, D.C., 1997, pp. 62‐70.
10. Von Quintus, H. L. Evaluation of Procedure to Assign Structural Layer Coefficients for Use in Flexible Pavement Design. KS‐07‐9. Kansas Department of Transportation, Topeka, Kans., 2007.
11. American Association of State Highway and Transportation Officials. Mechanistic‐Empirical Pavement Design Guide: A Manual of Practice. Second Edition. Washington, D.C., 2015.
12. American Association of State Highway and Transportation Officials. Guide for the Local Calibration of the Mechanistic‐Empirical Pavement Design Guide. Washington, D.C., 2010.
13. Newcomb D., R. Willis, and D. Timm. Perpetual Asphalt Pavements: A Synthesis. Asphalt Pavement Alliance, IM‐40, 2010.
14. Von Quintus, H. L. Hot‐Mix Asphalt Layer Thickness Designs for Longer‐Life Bituminous Pavements. Transportation Research Circular Number 503. Perpetual Bituminous Pavements. Transportation Research Board, Washington, D.C., 2001, pp. 66‐78.
15. Walubita, L. F., and T. Scullion. Texas Perpetual Pavements: New Design Guidelines. Product 0‐4822‐P6. Texas Transportation Institute, College Station, Tex., 2010.
16. Monismith, C., J. Harvey, T. Bressette, C. Suszko, and J. St. Martin. The I‐710 Freeway Rehabilitation Project: Mix and Structural Section Design, Construction Considerations and Lessons Learned. Proceedings of International Symposium on Design and Construction of
Rodezno, Timm, Robbins, Tran
58
Long Lasting Asphalt Pavements, National Center for Asphalt Technology, Auburn, Ala., 2004, pp. 217‐262.
17. Willis, J., and D. Timm. Field‐Based Strain Thresholds for Flexible Perpetual Pavement Design. NCAT Report 09‐09. National Center for Asphalt Technology, Auburn, Ala., 2009.
18. Tran. N., M. Robbins, D. H. Timm, J. R. Willis, and C. Rodezno. Refined Limiting Strain Criteria and Approximate Ranges of Maximum Thicknesses for Designing Long‐Life Asphalt Pavements. NCAT Report 15‐05, National Center for Asphalt Technology, Auburn Ala., 2015.
19. Prowell, B., E. Brown, R. Anderson, J. Daniel, A. Swamy, H. Von‐Quintus, S. Shen, S. Carpenter, S. Bhattacharjee, S., and S. Maghsoodloo. NCHRP Report 646: Validating the Fatigue Endurance Limit for Hot Mix Asphalt. Transportation Research Board of the National Academies, Washington, D.C., 2010.
20. Tarefder, R., and D. Bateman. Design of Optimal Perpetual Pavement Structure. Journal of Transportation Engineering, Vol. 138, No. 2, 2010, pp. 157‐175.
21. Prowell, B. D., G. C. Hurley, and B. Frank. Warm Mix Asphalt: Best Practices. Quality Improvement Publication 125, 3rd Edition. National Asphalt Pavement Association, 2012.
22. Hansen, K. R., and A. Copeland. Asphalt Pavement Industry Survey on Recycled Materials and Warm‐Mix Asphalt Usage‐2015. National Asphalt Pavement Association, Lanham, Md., 2016.
23. West, R. C. Rodezno, G. Julian, B. Prowell, B. Frank, L. V. Osborn, and T. Kriech. NCHRP Report 779: Field Performance of Warm Mix Asphalt Technologies. Transportation Research Board of the National Academies, Washington, D.C., 2014.
24. Bonaquist, R. F. NCHRP Report 691: Mix Design Practices for Warm Mix Asphalt. Transportation Research Board of the National Academies, Washington, D.C., 2011.
25. Hurley, G. and B. Prowell. Evaluation of Potential Processes for Use in Warm Mix Asphalt. Journal of the Association of Asphalt Paving Technologists, Vol. 75, Savannah, Ga., 2006.
26. Copeland, A., J. D’Angelo, R. Dongre, S. Belagutti, and G. Sholar. Field Evaluation of High Reclaimed Asphalt Pavement‐Warm Mix Asphalt Project in Florida. In Transportation Research Record: Journal of the Transportation Research Board, No. 2179, Transportation Research Board of the National Academies, Washington, D.C., 2010, pp. 93‐101.
27. Wielinski, J., A. Hand, and D. M. Rausch. Laboratory and Field Evaluations of Foamed Warm Mix Asphalt Projects. In Transportation Research Record: Journal of the Transportation Research Board, No. 2126, Transportation Research Board of the National Academies, Washington, D.C., 2009, pp. 125‐131.
28. Diefenderfer, S. and A. Hearon. Laboratory Evaluation of a Warm Asphalt Technology for Use in Virginia. Publication VTRC 09‐R11. Virginia Transportation Research Council, Charlottesville, Va., 2008.
29. Kvasnak, A., A. J. Taylor, J. M. Signore, and S. A. Bukhari. Evaluation of Gencor Green Machine Ultrafoam GX: Final Report. NCAT Report 10‐03, National Center for Asphalt Technology, Auburn, Ala., 2010.
30. Vargas‐Nordcbeck, A., and D. Timm. Physical and Structural Characterization of Sustainable Asphalt Pavement Sections at the NCAT Test Track. NCAT Report 13‐02. National Center for Asphalt Technology, Auburn, Ala., 2013.
31. Wen, H., S. Shen, and L. Mohammad. NCHRP 9‐49A: Performance of WMA Technologies: Stage II‐Long Term Field Performance. Under review.
Rodezno, Timm, Robbins, Tran
59
32. Kandhal, P. Recycling of Asphalt Pavements ‐ An Overview. Journal of the Association of Asphalt Paving Technologists, Vol. 66, 1997.
33. West, R. Best Practices for RAP and RAS Management. NAPA QUP‐129. National Asphalt Pavement Association, Lanham, Md., 2015.
34. West, R., J. Willis, and M. Marasteanu. NCHRP Report 752: Improved Mix Design, Evaluation and Materials Management Practice for Hot Mix Asphalt with High Reclaimed Asphalt Pavement Content. Transportation Research Board of the National Academies, Washington, D.C., 2013.
35. McDaniel, R., and R. M. Anderson. NCHRP Report 452: Recommended Use of Reclaimed Asphalt Pavement in the Superpave Mix Design Method: Technician’s Manual. Transportation Research Board of the National Academies, Washington, D.C., 2001.
36. Kvasnak, A., R. West, J. Michael, L. Loria, E. Hajj, and N. Tran. Bulk Specific Gravity of Reclaimed Asphalt Pavement Aggregate, Evaluating the Effect of Voids in Mineral Aggregate. In Transportation Research Record: Journal of the Transportation Research Board, No. 2180, Transportation Research Board of the National Academies, Washington, D.C., 2010, pp. 30‐35.
37. Al‐Qadi, I., Q. Aurangzeb, S. Carpenter, W. Pine, and J. Trepanier. Impact of High RAP Contents on Structural and Performance Properties of Asphalt Mixtures. Report FHWA‐ICT‐12‐002. Illinois Center for Transportation, Urbana, Ill., 2012.
38. McDaniel, R., A. Shah and G. Huber. Investigation of Low and High Temperature Properties of Plant‐Produced RAP Mixtures. Report FHWA‐HRT‐11‐058. FHWA, U.S. Department of Transportation, 2012.
39. Maupin, G. W., S. Diefenderfer, and J. S. Gillespie. Evaluation of Using Higher Percentages of Recycled Asphalt Pavement in Asphalt Mixes in Virginia. Virginia Transportation Research Council, Charlottesville, Va., 2007.
40. Willis, J. R., D. H. Timm, R. C. West, R. Powell, M. A. Robbins, A. J. Taylor, A. D. F. Smit, N. H. Tran, M. A. Heitzman, and A. Bianchini. Phase III NCAT Test Track Findings. NCAT Report 09‐08, National Center for Asphalt Technology, Auburn, Ala., 2009.
41. Paulsen, G., M. Stroup‐Gardiner, and J. Epps. Roofing Waste in Asphalt Paving Mixtures. Center for Construction Materials Research, University of Nevada, Reno, 1986.
42. Northeast Recycling Council (NERC). Asphalt Shingles Waste Management in the Northeast. Fact Sheet, 2007.
43. California Integrated Waste Management Board (CIWMB). Asphalt Roofing Shingles Recycling: Introduction. 2006 (Accessed September, 2015).
44. Townsend, T., J. Powell, and C. Xu. Environmental Issues Associated with Asphalt Shingle Recycling. Construction Materials Recycling Association, U.S. EPA Innovations Workgroup, 2007.
45. Willis, R. Reclaimed Asphalt Shingles Characterization: Best Practices. NCAT Report 13‐07, National Center for Asphalt Technology, Auburn, Ala., 2013.
46. Zhou, F., S. Hu, G. Das, R. E. Lee, T. Scullion, and G. Claros. Successful High RAP Mixes Designed with Balanced Rutting and Cracking Requirements. In Asphalt Paving Technology‐Journal of the Association of Asphalt Paving Technologists, Vol. 81, 2012, pp. 477‐505.
47. Newcomb, D., M. Stroup‐Gardiner, B. Weikle, and A. Drescher. Influence of Roofing Shingles on Asphalt Concrete Mixture Properties. Final Report MN/RC‐93/09. Minnesota Department
Rodezno, Timm, Robbins, Tran
60
of Transportation, St. Paul, Minn., 1993. 48. McGraw, J., A. Zofka, D. Krivit, J. Schroer, R. Olsen, and M. Marasteanu. Recycled Asphalt
Shingles in Hot Mix Asphalt. In Asphalt Paving Technology‐Journal of the Association of Asphalt Paving Technologists, Vol. 77, 2007, p. 235.
49. Zhou, F., J. Li, S. Hu, R. Lee, T. Scullion, G. Claros, J. Epps, and J. Button. Evaluation of Use of Recycled Asphalt Shingles in HMA. In Asphalt Paving Technology‐Journal of the Association of Asphalt Paving Technologists, Vol. 82, 2013, p. 367.
50. Shively, L. Use of Tear‐off Recycled Shingles in Asphalt Pavements. Presented at Ohio Asphalt Paving and North Central User Producer Group Conference, 2011.
51. Rana, A. S. M. Evaluation of Recycled Material Performance in Highway Applications and Optimization of Their Use. PhD dissertation. Texas Tech University, Lubbock, Tex., 2004.
52. Caulfield, M. Asphalt Shingles in Paving. SWANA Meeting, 2010. 53. Heitzman, M. State of the Practice – Design and Construction of Asphalt Paving Materials
with Crumb Rubber Modifier. FHWA‐SA‐92‐022. Federal Highway Administration, Washington, D.C., 1992.
54. Lee, S., Amirkhanian, S., and K. Shatanawi. Effects of Crumb Rubber on Aging of Asphalt Binders. Proceedings of the Asphalt Rubber 2006 Conference, Palm Springs, Cali., 2006, pp. 779‐795.
55. Huang, B.; M. L. Mohammad., P. Graves, and C. Abadie. Louisiana Experience with Crumb Rubber‐Modified Hot‐Mix Asphalt Pavement. In Transportation Research Record: Journal of the Transportation Research Board, No. 1789, Transportation Research Board of the National Academies, Washington, D.C., 2002, pp. 1‐13.
56. Kaloush, K. E., M. W. Witczak, G. B. Way, A. Zborowski, M. Abojaradeh, and A. Sotil. Performance Evaluation of Arizona Asphalt Rubber Mixtures Using Advanced Dynamic Material Characterization Tests. Final Report. Arizona State University, Tempe, Ariz., 2002.
57. Way, G., and B. Flagstaff. I‐40 Asphalt Rubber Overlay Project – Ten Years of Success. In Transportation Research Record: Journal of the Transportation Research Board, No. 1723, Transportation Research Board of the National Academies, Washington, D.C., 2000, pp. 45‐52.
58. Shen, J. S. and Amirkhanian. Comparison of the Properties of Laboratory and Field Prepared CRM Binders. Proceedings of the Asphalt Rubber 2009 Conference, Nanjing, China, pp. 437‐448.
59. Arizona Department of Transportation. The Chemical and Physical Properties of Asphalt‐Rubber Mixtures. ADOT‐RS‐14(162), July 1977.
60. Arizona Department of Transportation. Standard Specifications for Road and Bridge Construction. January 2008.
61. Caltrans. Standard Specifications. 2015. 62. Florida Department of Transportation. Standard Specifications for Road and Bridge
Construction. January, 2015. 63. Chen, D. and G. Hicks. Summary of Rubber Modified Asphalt Product Specification Around
the World. Ontario Tire Stewardship, October 2012. 64. Pennsylvania Department of Transportation. Specifications, Publication 408/2016. 65. Integrated Waste Management Board. Rubberized Asphalt Concrete, Design and
Specification Guide. RAC‐102. Technology Transfer Series.

Rodezno, Timm, Robbins, Tran
61
66. Baumgardner, G. and J. D’Angelo. Development of a Crumb Rubber Modified (CRM) PG Binder Specification. Asphalt Rubber Conference Proceedings, 2012, pp. 22‐29.
67. Stempihar, J., R. Stevens, S. Underwood, and D. Pal. Properties of Arizona TR+ Binders in Multiple Stress Creep and Recovery Test. Proceedings of the Rubberized Asphalt and Asphalt Rubber Conference, 2015, pp. 389‐397.
68. Hicks, R. G., D. Cheng, and T. Duffy. Evaluation of Terminal Blend Rubberized Asphalt in Paving Applications. Report No. CP2C‐2010‐102TM. California Pavement Preservation Center, 2010.
69. Clark, R., and R. Dongre. Laboratory and Field Performance of Dry‐Process Rubber Mixes. Presentation 51st Petersen Asphalt Research Conference, Laramie Wyo., 2014.
70. Integrated Waste Management Board. Rubberized Asphalt Concrete, Design and Specification Guide. RAC‐103. Technology Transfer Series.
71. Gibson, N., X. Qi, A. Shenoy, G. Al‐Khateeb, M. E. Kutay, A. Andriescu, K. Stuart, J. Youtcheff, and T. Harman. Performance Testing for Superpave and Structural Validation. FHWA Report No. HRT‐11‐045, 2012.
72. Brown, E. R., R. B. Mallick, J. E. Haddock, and J. Bukowski. Performance of Stone Matrix Asphalt (SMA) Pavements in the United States. NCAT Report 97‐01. National Center for Asphalt Technology, Auburn, Ala., 1997.
73. Brown, E. R., and L. A. Cooley, Jr. NCHRP Report 425: Designing Stone Matrix Asphalt Mixtures for Rut Resistant Pavements. Transportation Research Board, National Research Council, Washington, D.C., 1999.
74. National Asphalt Pavement Association. Designing and Constructing SMA Mixtures – State‐of‐the Practice. Quality Improvement Series 122, 2002.
75. Titus‐Glover, L., H. Von Quintus, K. Smith, M. Stanley, and S. Rao. Life‐cycle Cost Analysis of SMA Pavements and SMA Applications Guidelines. Report No. WHRP 06‐11. Wisconsin Highway Research Program, 2006.
76. Cooley, L. A., Jr., and E. R. Brown. Potential of Using Stone Matrix Asphalt (SMA) for Thin Overlays. NCAT Report 03‐01, National Center for Asphalt Technology, Auburn, Ala., 2003.
77. Xie, H., L. A. Cooley, and M. Hunter. 4.75 mm NMAS Stone Matrix Asphalt (SMA) Mixtures. NCAT Report 03‐05, National Center for Asphalt Technology, Auburn, Ala., 2003.
78. Watson, D. Updated Review of Stone Matrix Asphalt and Superpave Projects. In Transportation Research Record: Journal of the Transportation Research Board, No. 1832, Transportation Research Board of the National Academies, Washington, D.C., 2003, pp. 217‐223.
79. Brown, E. R., L. A. Cooley Jr., D. Hanson, C. Lynn, B. Powell, B. Prowell, and D. Watson. NCAT Test Track Design, Construction, and Performance. NCAT Report 02‐12. National Center for Asphalt Technology, Auburn, Ala., 2002.
80. Timm, D. H., R. C. West, A. L. Priest, B. Powell, I. Selvaraj, J. Zhang, and E. R. Brown. Phase II NCAT Test Track Results. Phase II Pavement Test Track Conference, National Center for Asphalt Technology, Auburn, Ala., 2005.
81. Asphalt Recycling and Reclaiming Association (ARRA). Basic Asphalt Recycling Manual. 2015. 82. Mallela, J., H. Von Quintus, and K. L. Smith. Performance Evaluation of Cold In‐Place
Recycling Projects in Arizona. Final Report 460, Arizona State Department of Transportation, 2006.

Rodezno, Timm, Robbins, Tran
62
83. Stroup‐Gardiner, M. NCHRP Synthesis 421: Recycling and Reclamation of Asphalt Pavements Using In‐Place Methods, A Synthesis of Highways Practice. Transportation Research Board, National Research Council, Washington, D.C., 2011.
84. Wirtgen. Wirtgen Cold Recycling Technology. 2012 85. Diefenderfer, B. and A. Apeagyei. I‐81 In‐Place Pavement Recycling Project. Virginia Center
for Transportation Innovation and Research. Report FHWA/VCTIR 15‐R1, 2014. 86. Diaz‐Sanchez, M., D. H. Timm, and B. K. Diefenderfer. Structural Coefficients of Cold Central‐
Plant Recycled Asphalt Mixtures. American Society of Civil Engineering Journal of Transportation Engineering, publication pending, 2016.
87. Illinois Department of Transportation. Polymer‐Modified Hot Mix Asphalt, PTA‐D5, Design, Construction and Materials, 2005.
88. Woo, W. J. E. Ofori‐Abebresse, A. Chowdhury, J. Hilbrich, Z. Kraus, A. Epps, and C. J. Glover. Polymer Modified Asphalt Durability in Pavements. FHWA.TX‐07/0‐4688‐1. July 2007.
89. Asphalt Institute. Quantifying the Effect of PMA for Reducing Pavement Distress. Asphalt Institute Information Series No. 215. February 2005.
90. Timm, D., M. Robbins, J. Willis, N. Tran, and A. Taylor. Field and Laboratory Study of High‐Polymer Mixtures at the NCAT Test Track‐Interim Report. NCAT Report 12‐08, National Center for Asphalt Technology, Auburn, Ala., 2012.
91. West, R., D. Timm, R. Powell, M. Heitzman, J. Willis, N. Tran, D. Watson, M. Robbins, C. Rodezno, M. Vrtis, and M. Sanchez. Phase V NCAT Pavement Test Track Findings. Draft Report, National Center for Asphalt Technology, Auburn, Ala., 2016.


