NBER WORKING PAPER SERIES UNIONIZATION AND WAGE INEQUALITY ... · NBER WORKING PAPER SERIES...
58
NBER WORKING PAPER SERIES UNIONIZATION AND WAGE INEQUALITY: A COMPARATIVE STUDY OF THE U.S., THE U.K., AND CANADA David Card Thomas Lemieux W. Craig Riddell Working Paper 9473 http://www.nber.org/papers/w9473 NATIONAL BUREAU OF ECONOMIC RESEARCH 1050 Massachusetts Avenue Cambridge, MA 02138 January 2003 Some parts of this paper are taken from our forthcoming chapter in the International Handbook of Trade Unions, edited by John Addison and Claus Schnabel. We are grateful to John Addison for comments. Funding for Card’s research was provided by the Center for Labor Economics at UC Berkeley, while that of Lemieux and Riddell was supported by the Social Sciences and Humanities Research Council of Canada. The views expressed herein are those of the authors and not necessarily those of the National Bureau of Economic Research. ©2003 by David Card, Thomas Lemieux, and W. Craig Riddell. All rights reserved. Short sections of text not to exceed two paragraphs, may be quoted without explicit permission provided that full credit including notice, is given to the source.
Transcript of NBER WORKING PAPER SERIES UNIONIZATION AND WAGE INEQUALITY ... · NBER WORKING PAPER SERIES...

NBER WORKING PAPER SERIES
UNIONIZATION AND WAGE INEQUALITY: A COMPARATIVE STUDY OF
THE U.S., THE U.K., AND CANADA
David CardThomas LemieuxW. Craig Riddell
Working Paper 9473http://www.nber.org/papers/w9473
NATIONAL BUREAU OF ECONOMIC RESEARCH1050 Massachusetts Avenue
Cambridge, MA 02138January 2003
Some parts of this paper are taken from our forthcoming chapter in the International Handbook of TradeUnions, edited by John Addison and Claus Schnabel. We are grateful to John Addison for comments. Funding for Card’s research was provided by the Center for Labor Economics at UC Berkeley, while that ofLemieux and Riddell was supported by the Social Sciences and Humanities Research Council of Canada. Theviews expressed herein are those of the authors and not necessarily those of the National Bureau of EconomicResearch.
©2003 by David Card, Thomas Lemieux, and W. Craig Riddell. All rights reserved. Short sections of textnot to exceed two paragraphs, may be quoted without explicit permission provided that full credit includingnotice, is given to the source.
Unionization and Wage Inequality: A Comparative Study of the U.S., the U.K., and Canada David Card, Thomas Lemieux, and W. Craig RiddellNBER Working Paper No. 9473January 2003JEL No. J3, J5
ABSTRACT
This paper presents a comparative analysis of the link between unionization and wage inequality in
the U.S., the U.K., and Canada. Our main motivation is to see whether unionization can account for
differences and trends in wage inequality in industrialized countries. We focus on the U.S., the
U.K., and Canada because the institutional arrangements governing unionization and collective
bargaining are relatively similar in these three countries. The three countries also share large non-
union sectors that can be used as a comparison group for the union sector. Using comparable micro
data for the last two decades, we find that unions have remarkably similar qualitative impacts in all
three countries. In particular, unions tend to systematically reduce wage inequality among men, but
have little impact on wage inequality for women. We conclude that unionization helps explain a
sizable share of cross-country differences in male wage inequality among the three countries. We
also conclude that de-unionization explains a substantial part of the growth in male wage inequality
in the U.K. and the U.S. since the early 1980s.
David Card Thomas LemieuxDepartment of Economics Department of EconomicsUniversity of California, Berkeley University of British ColumbiaBerkeley, CA 94720-3880 Vancouver, BC V6T 1Z1, Canadaand NBER and [email protected] [email protected]
W. Craig RiddellDepartment of EconomicsUniversity of British ColumbiaVancouver, BC V6T 1Z1, [email protected]

This paper presents a comparative analysis of the link between unionization and wage
inequality in the United States, the United Kingdom, and Canada. Our investigation is motivated
by several factors. One is to understand better trends in income inequality. Several previous
studies have concluded that falling unionization contributed to the steep increase in wage
inequality in the U.S. and the U.K. that occurred in the 1980s. Wage inequality did not rise as
quickly in these countries in the 1990s. This raises the question of whether the evolution of
union coverage and union wage impacts can account for some of the changing trend in wage
inequality. More generally, differences across these countries in the timing of changes in
unionization and in wage inequality provide an opportunity for further assessing the contribution
of institutional change to trends in income inequality. With the addition of questions on union
status and wages to the U.K. Labour Force Survey (LFS) in 1993 and the Canadian LFS in 1997,
it is now possible to use comparable large-scale micro data sets to examine the impact of unions
on wages in the three countries. Estimates of the role of unionization in cross-country
differences in wage inequality are no longer significantly affected by survey differences or by
the limitations of small sample sizes.
Our study is also motivated by the fact that in these three countries the institutional
arrangements governing unionization and collective bargaining provide an environment that is
suitable for estimating the impacts of unions on wage inequality. As with other aspects of the
economy, collective bargaining institutions in these countries are broadly similar. In particular,
negotiations are conducted at the enterprise level, and there is no general mechanism to extend
union wage floors beyond the organized sector. The fraction of workers covered by collective
agreements in the three countries is also relatively modest – currently under one-third of wage
and salary workers. Thus it is possible to compare the structure of wages for workers whose

2
wages are set by union contracts, and those wages are not, and potentially infer the effect of
unions on overall wage inequality. A similar task is far more difficult in other countries
(including the major European countries and Australia) because there is no clear distinction
between the union and nonunion sectors. Collective bargaining in these countries is conducted
at the industry or sectoral level, and the provisions are formally or informally extended to most
of the labor force. Moreover, in many countries, unions exert considerable influence on political
decisions (such as minimum wages) that directly effect labor market outcomes.
We also seek to assess whether there are common patterns in the impact of unions on the
wage structure in countries with economies and industrial relations systems that are broadly
similar. Of particular interest are patterns in union coverage and union wage impacts by gender
and skill.
After briefly reviewing trends in union membership in the three countries, we begin by
developing a simple framework for measuring the effect of unions on wage inequality, based on
the potential outcomes framework that is now widely used in program evaluation. Our
framework emphasizes three key aspects of collective bargaining coverage: How does the
probability of union coverage vary for workers who would earn more or less in the nonunion
sector? How much do unions raise average wages for workers in different skill groups? How
do unions affect the dispersion of wages within narrow skill groups?
We then use micro data samples to compare the incidence and average wage effect of
unions by skill level on male and female workers in the three countries, and measure recent
trends in union coverage by skill level. Despite some differences in the institutional systems
that govern the determination of union status across workplaces in the three countries, we find
remarkable similarity in the overall patterns of union coverage and in the degree to which unions

3
affect average wages of different skill groups. Within narrowly defined skill groups, wage
inequality is always lower for union workers than nonunion workers. For male workers, union
coverage tends to be concentrated at the middle of the skill distribution, and union wages tend to
be “flattened” relative to nonunion wages. As a result, unions have an equalizing effect on the
dispersion of male wages across different skill groups in the three countries, complementing the
effect on within-group inequality. For female workers, however, union coverage is concentrated
near the top of the skill distribution, and there is no tendency for unions to flatten skill
differentials across groups. Thus, unions tend to raise inequality between more and less skilled
women in the three countries, offsetting their effect on within-group inequality.
As a final step, we use data from the past 25 years to compute the changing effect of
unionization on wage inequality. During the 1980s and 1990s, unionization rates fell in all three
countries, with the most rapid decline in the U.K. and the slowest fall in Canada. These trends
contributed to rising male wage inequality, particularly in Britain. Indeed, we estimate that the
precipitous fall in unionization in the U.K. can explain up to two thirds of the difference in the
trend in male wage inequality between Britain and the U.S.
I. Union Membership and Collective Bargaining Coverage
Table 1 presents data on union membership rates as a fraction of paid (wage and salary)
employment in the U.S., Britain, and Canada over the past 40 years. As has been noted in many
previous studies (e.g., Freeman, 1998; Farber and Western, 2000) union membership rates have
been declining in the U.S. since the mid-1950s, and are currently under 15 percent. In the U.S. a
relatively small fraction of workers who are covered by collective bargaining agreements are not

4
1See Budd and Na (2000) for a discussion of the institutional setting and a comparison betweenmembers and covered non-members. Hirsch and MacPherson (2002) present separate data andmembership and coverage rates: both declined about 10 percentage points between 1980 and2000.2Different data sources show somewhat faster or slower rates of decline in union membership inCanada in the 1980s and 1990s. Traditionally, union membership rates have been constructedfrom trade union membership tallies. These rates show a very modest fall since the mid-1980s,while estimates from micro surveys show a much sharper decline. 3See Pencavel (2003) for a discussion of alternative explanations for the rapid decline in U.K.unionization.
union members (10-15 percent), so the trend in coverage by collective agreements is similar.1 In
contrast to the U.S., union membership rates in Canada rose between 1960 and 1980, but in the
1990s have begun to decline.2 In Canada, as in the U.S., the fraction of workers covered by
collective bargaining agreements is only slightly above the union membership rate, so trends in
union membership and coverage are similar.
In 1960 the union membership rate was higher in Britain than in the U.S. or Canada, and
over the 1960s and 1970s membership expanded, peaking at over 50 percent in 1979. During the
past two decades, however, union membership has fallen rapidly, losing about 10 percentage
points in the 1980s and another 10 points in the 1990s.3 Recent data from the labor force survey
suggest that in the U.K. in the late 1990s, the fraction of workers whose pay is set by collective
bargaining agreements is about 5 percentage points higher than union membership (Bland, 1999,
Table 6). There are no comparable data from earlier periods. Nevertheless, crude estimates of
union coverage rates suggest that collective bargaining coverage has declined at least as fast as
union membership (OECD, 1997).
The relative similarity of collective bargaining institutions but very different levels and
trends in union membership in the U.S., Canada, and Britain suggest that comparisons between
these countries may be particularly informative in understanding the role of unionization in the
5
evolution of wage inequality. To the extent that other confounding factors, such as
technological change and rising globalization, are common across the three countries, we may be
able to quantify the effects of changing unionization by comparing relative trends in inequality
to relative trends in unionization.
II. Unions and Wage Inequality
A. Conceptual Framework
A convenient framework for analyzing the effect of unions on wage inequality is the
potential outcomes model now widely used in program evaluation (see Angrist and Krueger,
1999). Assume for the moment that each worker faces two potential wages: a log wage in the
union sector, WiU, and a log wage in the nonunion sector Wi
N. Ignoring dual job holders, a given
individual is either in one sector or the other at any point in time, so one of the potential
outcomes is observed and the other is not. Letting Ui denote an indicator for union status, the
observed wage of individual i is
Wi = Ui WiU + (1- Ui) Wi
N.
Let WU and WN represent the means of the potential wage outcomes in the two sectors, and let
VU and VN represent the corresponding variances. Finally, let W and V represent the mean and
variance of observed wages. In this setting, a natural measure of the effect of unions on wage
inequality is V!VN: the difference between the observed variance of wages and the variance
that would prevail if everyone was paid his or her nonunion potential wage.
There are two problems with this measure. The first is purely practical: how do we
estimate VN? The second is conceptual. Arguably, any given individual in the union sector has a
well-defined potential wage in the nonunion sector. But if the union sector disappeared, the
6
4 This possibility was emphasized by Lewis (1963). The presence of unionized employers maylead to higher wages in the nonunion sector (if nonunion employers raise wages to deterunionization efforts) or to lower wages (if unionization reduces employment in the union sector,increasing labour supply in the nonunion sector).
equilibrium set of wage offers in the nonunion sector could change.4 Thus VN is really a
function of the size of the union sector, VN(u), where 0#u#1 indexes the fraction of workers in
the union sector. In the absence of unionization, the variance of observed wages would be
VN(0). This means that the effect of unionization on wage inequality, taking account of the
general equilibrium impact of the presence of the union sector, is:
V ! VN(0) .
Despite its theoretical appeal, it is difficult to imagine developing a credible estimate of VN(0).
Under strong assumptions, however, it may be possible to estimate VN(U), where U is the current
fraction of unionized workers. The obvious advantage of this measure is that potential nonunion
wage outcomes under the current level of unionism are at least partially observed (for all current
nonunion workers). Since
V ! VN(U) = V ! VN(0) + { VN(0) ! VN(U) } ,
the difference V!VN(U) overstates or understates the “true” effect of unions by a term reflecting
how much the variance of nonunion wage outcomes would change if the union sector was
eliminated. While acknowledging this potential bias, in the rest of the paper we focus on
comparisons between V, the observed variance of wages, and VN(U), the variance that would
prevail if everyone were paid according to the current nonunion wage structure.
B. Estimating the Variance of Potential Nonunion Wages
In order to estimate VN we have to make an assumption about how current union workers

7
would be paid if they worked in the nonunion sector. One starting point is the assumption that
union status is “as good as randomly assigned”, conditional on observed skill characteristics. In
this case, the counterfactual variance VN can be estimated as the variance of wages for a suitably
reweighted sample of nonunion workers. In this section we show how the resulting calculations
are related to three key factors: the variation in the union coverage rate by wage level in the
absence of unions, the size of the union wage effect for different skill groups, and the union-
nonunion difference in the variance of wages within skill categories. We then show how the
assumption that union status is independent of unobserved productivity factors can be relaxed.
Let WiN(c) represent the log wage that individual i in skill group c would earn in the
nonunion sector, and let WiU(c) denote the log wage for the same individual if employed in a
union job. Assume that
WiN(c) = WN(c) + ei
N
WiU(c) = WU(c) + ei
U
where WN(c) and WU(c) are the mean nonunion and union log wages for individuals in skill
group c, respectively, and the random terms eiN and ei
U are independent of actual
union status (conditional on the observed skill level c). Let VU(c) and VN(c) denote the variances
of potential wage outcomes for individuals in skill group c in the union and nonunion sectors,
respectively. The union-nonunion gap in average wages for workers in skill group c is
∆w(c)= WU(c) ! WN(c)
while the corresponding variance gap is
∆v(c) = VU(c) ! VN(c) .
Under the independence assumption, WN(c) and VN(c) provide unbiased estimates of the

8
mean and variance of nonunion wage outcomes for all workers in skill group c, not just those
who are actually working in the nonunion sector. The variance of wages in the nonunion sector
will not necessarily equal VN, however, if the distribution of nonunion workers across skill
groups differs from the distribution of the overall workforce. A simple way to estimate VN is to
reweight individual observations from the nonunion workforce to account for this difference.
Letting U(c) denote the fraction of workers in skill group c in union jobs, the appropriate weight
for nonunion workers in group c is 1/(1!U(c)).
While reweighting provides a convenient way to calculate VN, it is nevertheless
instructive to develop an analytical expression for V!VN under the conditional independence
assumption. First, note that the average wage in skill group c is
W(c) = WN(c) + U(c)∆w(c), (1)
while the variance of log wage outcomes for all workers in skill group c is
V(c) = VN(c) + U(c)∆v(c) + U(c)(1-U(c))∆w(c)2. (2)
The second term in this expression reflects the “within-sector” effect for skill group c that arises
if wages are more or less disperse under collective bargaining than in the absence of collective
bargaining. The third term is a “between sector” effect that is necessarily positive whenever
∆w(c) … 0, reflecting the wedge between the average wage of otherwise identical union and
nonunion workers. The variance of log wages across all skill groups is the sum of the between-
group and within-group variances:
V = Var[W(c)] + E[V(c)] .
where expectations (denoted by E[ ]), and variances (denoted by Var[ ]) are taken across the skill
categories. Using equations (1) and (2), this expression be rewritten as:

9
V = Var[WN(c) + U(c)∆w(c)] + E[VN(c) + U(c)∆v(c) + U(c)(1!U(c))∆w(c)2]
= Var[WN(c)] + Var[U(c)∆w(c)] + 2Cov[WN(c), U(c)∆w(c)]
+ E[VN(c)] + E[U(c)∆v(c)] + E[U(c)(1!U(c))∆w(c)2] (3)
where Cov[ , ] denotes the covariance across skill groups. In contrast to equation (3), if all
workers were paid according to the wage structure in the nonunion sector, the variance of wage
outcomes would be
VN = Var[WN(c)] + E[VN(c)] .
The effect of unions on the variance of wage outcomes, relative to what would be observed if all
workers were paid according to the current wage structure in the nonunion sector, is therefore
V - VN = Var[U(c)∆w(c)] + 2Cov[WN(c), U(c)∆w(c)]
+ E[U(c)∆v(c)] + E[U(c)(1!U(c))∆w(c)2] (4)
Substituting observed values for WN(c), U(c), ∆w(c), and ∆w(c) into equation (4) leads to an
expression that is numerically equal to the difference between the observed variance of wages V
and the “reweighting” estimate of VN, derived by reweighting each nonunion worker by
1/(1!U(c)).
To understand the implications of equation (4) it is helpful to begin by considering a case
where the union coverage rate, the union wage effect ∆w(c), and the union variance gap are all
constant across skill groups. In this case, the first two terms of equation (4) are zero and the
effect of unions on the economy-wide variance of wages is just an average of the “within-sector”
and “between-sector” effects across skill groups. The two additional terms in equation (4)
reflect differences in the union coverage rate U(c) and/or the union wage effect ∆w(c) across skill
groups. The first term in (4) is a positive component that arises whenever the union wage gain

10
U(c)∆w(c) varies across groups. The second is a covariance term that may be positive or
negative, depending on how the union wage gain varies across the wage distribution. If union
coverage is higher for less-skilled workers, or if the union wage impact is higher for such
workers, then the covariance term will be negative, enhancing the equalizing effect of unions on
wage dispersion.
C. Allowing for Unobserved Heterogeneity
The assumption that union status is “as good as random” conditional on observed skills is
convenient but arguably too strong. In this section we show how the presence of unobserved
productivity differences between union and nonunion workers biases the calculation that ignores
these differences. As before, assume that workers are classified into skill categories on the basis
of observed characteristics, and suppose that potential nonunion and union wages are given by:
WiN(c) = WN(c) + ai + ei
N (5a)
WiU(c) = WU(c) + ai + ei
U , (5b)
where ai represents an unobserved skill component that is equally rewarded in the union and
nonunion sectors. Continue to assume that eiN and ei
U are independent of union status, and let
θ(c) = E[ai | Ui=1, c] ! E[ai | Ui=0, c]
represent the difference in the mean of the unobserved skill component between union and
nonunion workers in group c. If union workers in group c tend to have higher unobserved skills
than their nonunion counterparts, for example, then θ (c) > 0.
The observed wage gap between union and nonunion workers in group c includes the
true union wage premium and the difference attributable to unobserved skills:

11
5Equation (6) is only correct if unobserved skills are rewarded equally in the union and nonunionsectors, although it may provide a good first approximation if the rewards for unobserved abilityin the union sector are not too much lower than in the nonunion sector. Lemieux (1998) presentsa model in which unobserved attributes are rewarded differently in the union and nonunionsectors.
Dw(c) = ∆w(c) + θ(c) .
Similarly, assuming that eiN and ei
U are independent of ai, the observed difference in the variance
of wages between union and nonunion workers in group c is:
Dv(c) = ∆v(c) + Var[ai | Ui=1, c] !Var[ai | Ui=0, c] ,
which is a combination of the true union effect on within-group inequality and any difference in
the variance of the unobserved productivity effects between union and nonunion workers. If
union workers tend to have a narrower distribution of unobserved skills, for example, the
observed variance gap Dv(c) will be biased downward relative to the “true” union effect ∆v(c).
Assuming that potential wage outcomes are generated by equations (5a, 5b), it can be
shown that the difference in the variance of wages in the presence of unions and in the
counterfactual situation in which all workers are paid according to the nonunion wage structure
is
V - VN = Var[U(c)∆w(c)] + 2Cov[WN(c), U(c)∆w(c)]
+ E[U(c)∆v(c)] + E[U(c)(1!U(c)){ (θ(c)+∆w(c))2 !θ(c)2 }] . (6)
Only the last term of this equation differs from equation (4), the expression that applies when
θ(c)=0 for all groups.5 In the presence of unobserved heterogeneity, however, ∆w(c) and ∆v(c)
can no longer be estimated consistently from the observed differences in the means and
variances of union and nonunion workers in skill group c. By the same token, it is no longer
possible to use a reweighting procedure based on the fraction of union members in different

12
observed skill groups to estimate VN.
It is instructive to compare the estimated effect of unions under the “as good as random”
assumption to the true effect, when potential wages are generated by equations (5a,5b). The
estimated effect is given by equation (4), using the observed within-skill group union differences
Dw(c) and Dv(c) as estimates of ∆w(c) and ∆v(c). The true effect is given by equation (6). The
difference is
Bias = Var[U(c)Dw(c)] ! Var[U(c)∆w(c)]
+ 2Cov[WN(c), U(c)( Dw(c) !∆w(c) ) ]
+ E[ U(c)( Dv(c) !∆v(c) ) ]
+ E[ U(c)(1-U(c)) { Dw(c)2 !∆w(c)2 !2 θ(c) ∆w(c) } ] .
There are various competing factors here. For example, if Dw(c) varies more across skill groups
than ∆w(c), the sum of the first two terms is likely to be positive. On the other hand, if Dw(c) is
more strongly negatively correlated with nonunion wages across skill groups than ∆w(c) (as
argued in Card, 1996), then the third (covariance) term will be negative, leading to an
overstatement of the equalizing effect of unions. We return to this issue below.
III. Estimating the Effect of Unions on Wage Inequality
A. Data Sources
We use a variety of micro data files to compare the effects of unions on wage outcomes
in the U.S., the U.K., and Canada over the past thirty years. Our U.S. samples are the most
straightforward, since the Current Population Survey (CPS) has been collecting data on wages
and union status on an annual basis since 1973. We use the pooled May 1973 and May 1974

13
CPS samples as our first U.S. observation. For later years, we use the monthly earnings
supplement files (the so-called “outgoing rotation group” files) for 1984, 1993, and 2001. The
earnings and union status information all pertain to an individual’s main job as of the CPS
survey week.
Starting in 1993 the U.K.’s Labour Force Survey (UKLFS) began asking questions on
union status and earnings that are comparable to the questions in the CPS. Strictly comparable
data are unavailable for earlier years. The 1983 General Household Survey (GHS) is the only
large scale micro data set that contains information on union status and wages in the U.K. prior
to the 1990s. While this data source has several limitations, we elected to combine the 1983
GHS with the 1993 and 2001 UKLFS samples for our U.K. analysis.
The Canadian Labour Force Survey (CLFS) added questions on earnings and union status
in 1997. To supplement these data, we combine two smaller surveys – the 1991 and 1995
Surveys on Work Arrangements (SWA) -- as a source of information for the early 1990s, and
use the 1984 Survey of Union Membership as a source of information for the early 1980s. All
three of these surveys were conducted as supplements to the regular CLFS.
In addition to the usual problems that arise in comparing survey responses over time and
across countries, a significant issue for our analysis is the measurement of union status. The
1984 and later CPS files include questions on both union membership and union coverage. The
1973 and 1974 May CPS files, however, only ask about union membership. For comparability
reasons, we therefore focus on union membership as our measure of union status in the U.S. Our
U.K. data sets include data on union membership as well as responses to a question about
whether there is a “union presence” at the individual’s place of employment. As noted in Bland
(1999, Table 6), however, the latter question significantly overstates coverage under collective

14
6In the 2001 CLFS, 2.4 percent of male workers and 1.9 of female workers are covered bycollective bargaining but not members of a union. The two different measures of unionizationlead to nearly identical estimates of the union wage premium in a conventional linear regressionof wages on union status, education, and experience.
bargaining agreements. As in our U.S. analysis, we therefore use union membership as our
measure of unionization in the U.K. With respect to Canada, consistent information on union
membership cannot be recovered from the 1991 and 1995 SWA’s, so we use union coverage as
our measure of unionization in Canada. We believe that this choice has little effect on the
results, since only about two percent of Canadian employees are covered by collective
agreements but are not union members.6
In the data appendix we explain in detail how we process the various data sets to arrive at
our final estimation samples. Generally speaking, our samples include only wage and salary
workers age 16 to 64 (15 to 64 in Canada) with non-allocated wages and earnings (except in
1984 and 2001 in Canada). We use hourly wages for workers who are paid by the hour and
compute average hourly earnings for the other workers by dividing weekly earnings by weekly
hours (or earnings for a longer time period divided by the corresponding measure of hours). We
also exclude workers with very low or very high hourly wage values. Sample weights are used
throughout except in the 1983 GHS for which sample weights are not available.
To implement the methods developed in Section II, we divide workers in each sample
into skill groups, based on age and educational attainment. The number of skill groups used
varies by country, reflecting differences in the sample sizes and the age and education codes
reported in the raw data files. In the earlier Canadian data sets age is only reported in 10-year
categories (a total of 5 categories for workers age 15 to 64), and education can only be
consistently coded into 5 categories. Thus we only use 25 skill groups for Canada. Given the
15
7In the U.S., for example, we use bins for the log hourly wage of width 0.05. We use smallerbins for our U.K. and Canadian samples.
small sample sizes available in the 1983 GHS and the 1993 UKLFS, we use the same number of
skill groups for the U.K. (five age and five education groups). In our U.S. samples, we are able
to use a much larger number of skill categories because of the larger sample sizes and detailed
age and education information in the CPS. We have re-analyzed the U.S. data using about the
same number of skill groups as in Canada and the U.K., however, and found that this has little
impact on our results.
B. Patterns of Union Coverage and Union Wage Effects
To set the stage for our analysis it is helpful to begin by looking at how union coverage
and the size of the union wage gap vary by skill level. Figures 1-3 show the unionization rates of
men and women in the U.S., the U.K. and Canada, by the level of real hourly wages. These
graphs are constructed by calculating union membership/coverage rates for workers in narrow
wage bins, and smoothing across bins.7 In all three countries, unionization rates of men tend to
follow a hump-shaped pattern, peaking for workers near the middle or upper middle of the wage
distribution. By comparison, unionization rates of women in the U.S. and Canada are about the
same for highly paid workers as for those in the middle. This pattern is driven in part by
relatively high rates of unionization for teachers, nurses, and other public sector workers, who
are near the top of the female wage distribution. In the U.K. there is more of a fall-off in union
membership among the highest-paid women, especially in the more recent data. Comparisons of
the unionization rates in different years reveal the rapid decline in union membership among
U.S. and U.K. men. Declines are also evident for Canadian men and for women in all three

16
countries.
The framework developed in Section II suggests that the effect of unions on wage
inequality depends in part on how the union wage gap varies by skill. Figures 4-6 provide some
simple evidence on this variation, using data from the early 1990s for the three countries. These
figures plot mean wages for unionized workers in a given age-education group (i.e., WU(c) in the
notation of Section II) against the corresponding mean for non-union workers with the same skill
level (i.e., WN(c)) for 25 age-education groups in Canada and the U.K., and about 150 groups in
the U.S. In interpreting these figures, note that if union and nonunion workers in a given skill
group have the same average wages, then the points in these graphs will lie on the 45-degree
line. On the other hand, if the union wage gap ∆w(c) is positive, then the points will lie above the
45-degree line. Moreover, if ∆w(c) is larger for lower wage workers, then the points will tend to
be further above the 45 degree line for low-wage skill groups (on the left side of the graph) than
for high-wage groups (on the right). This is in fact the case for U.S. men. The best-fitting line
relating WU(c) to WN(c) is also shown in the figure, and lies above the 45 degree line but with a
slope of less than 1.
Interestingly, the same pattern is true for men in Canada and the U.K., as shown in
Figures 5a and 6a. For skill groups with low average wages (e.g., less educated and relatively
young men) the mean union wage tends to be substantially higher than the mean nonunion wage,
while for groups with high average wages (e.g., middle age college or university graduates) the
mean union wage is not too much above the mean nonunion wage. Thus, in all three countries
∆w(c) is larger for low-wage men than high-wage men, implying that unions tend to “flatten”
wage differentials across skill groups. As we discuss in the next section, one caveat to this

17
conclusion is that there may be unobserved skill differences between union and nonunion
workers in different age-education groups that tend to exaggerate the apparent negative
correlation between wages in the non-union sector and the union wage gap.
For women, the patterns of union wages relative to nonunion wages are also remarkably
similar in the three countries. Unlike the patterns for men, however, the union wage gaps for
women are roughly constant. Coupled with the tendency for unionization rates of women to rise
across the wage distribution, the absence of a “flattening” effect of unions on female wages
implies that covariance between the nonunion wage WN(c) and the union wage gain U(c))w(c) is
either zero or positive, limiting the potential equalizing effect of unions on female inequality.
Although the data in Figures 4-6 pertain to the early 1990s, similar plots from other years
show that the basic patterns have been very stable in all three countries over the past 20-30
years. In all our sample years, the union-nonunion wage gap for men tends to be highest for the
least skilled workers, and to be relatively small (or even negative) for highly skilled men. The
union gap for women, on the other hand, tends to be stable or only slightly declining with skill
level. The consistency of these patterns over time and across the three countries is remarkable.
C. The Effect of Unions on Wage Inequality
With this background, we turn to our analysis of the effect of unions on wage inequality
in the three countries. Tables 2, 3, and 4 summarize a variety of facts about unionization and
the structure of wages for the U.S., Canada, and the U.K., respectively. Reading across the
columns of Table 2, a comparison of the entries in the first row confirms the steep decline in
U.S. unionization rates documented in Table 1. As illustrated in Figures 1a and 1b, however,
these aggregate figures hide a sharp difference between men and women. Between 1973 and

18
2001, the unionization rate of women declined only about 2 points, from 14 to 12 percent, while
for men it fell by 50 percent, from 31 to 15 percent. This sharp male-female difference has
much to do with the gradual shift of unionization from the private to the public sector. For
instance, Card (2001) shows that for both men and women, unionization rates declined by about
50 percent in the private sector between 1973 and 1993. During the same period, however,
unionization rates increased sharply in the public sector. Women in general, and unionized
women in particular, are much more concentrated in the public sector than their male
counterparts. As a result, the rise in public sector unionism has largely offset the decline in
private sector unionization among women.
The trends in unionization in Canada between 1984 and 2001 (Table 3) are similar to
those in the U.S. The male unionization rate declined by 14 percentage points, even more than
the 9 percentage point decline in the U.S. over the same period. As in the U.S., the decline for
women was more modest (4 percentage points). The drop in unionization in our Canadian
samples is much steeper than the decline registered in membership tallies obtained from union
reports, but is consistent with the trends reported by Riddell and Riddell (2001) based on similar
micro data sources.
The data in Table 4 show that unionization rates have also fallen sharply in the U.K. in
the past two decades: by 27 percentage points for men and by 14 percentage points for women.
As in the U.S. and Canada, the faster decline in male unionization is linked to the relative shift of
unionization from the private to the public sector (Gosling and Lemieux, 2001). In the U.K., this
shift was compounded by privatization of many nationalized industries (e.g., steel, coal, and
public utilities), which transferred sizeable numbers of mainly male workers from the unionized
public sector to the much less organized private sector (Gosling and Lemieux, 2001).

19
Interestingly, the relatively faster decline of male unionization in the three countries meant that
by 2001, male and female unionization rates were not too different in the U.S., Canada, or the
U.K. This near equality marks a sharp departure from the historical pattern of greater
unionization among men.
The next set of rows in Tables 2-4 show the evolution of mean wages of nonunion and
union workers, and the trend in the corresponding union wage gap. We also report an adjusted
wage gap, calculated from a regression that includes a full set of dummies for each of the skill
categories. As in the case for the unionization rates, the estimated wage gaps show a remarkably
similar pattern across the three countries. The unadjusted wage gaps tend to be larger for women
than for men. The adjusted wage gaps are uniformly smaller than the unadjusted gaps, and in all
three countries the divergence has increased over time, implying that union membership rates
have fallen more for relatively unskilled workers (as is apparent in Figures 1-3).
Like the unadjusted union wage gap, the adjusted wage gap is typically larger for women
than for men. Nevertheless, male-female differences in the adjusted gaps are less pronounced
than the corresponding differences in the unadjusted gaps, especially in more recent years. For
example, the unadjusted wage gaps in the U.S. in 2001 were 0.233 for men and 0.305 for
women, versus adjusted wage gaps of 0.156 and 0.149. This pattern is consistent with Figures 1
to 3, which show that unionized women are more highly concentrated in the upper end of the
skill distribution than unionized men. As a result, controlling for the skill composition of the
workforce reduces the union wage gap far more for women than for men.
Another trend that is shared by all three countries is a gradual decline in the adjusted
union wage gap, by 5 to 10 percentage points (depending on gender and country) between the
early 1980s and 2001. Since the rate of unionization also declined sharply during this period, the

20
8 The densities are estimated using a bandwidth of 0.05. See DiNardo, Fortin and Lemieux(1996) for more detail.
implied effect of unions on average wages – the union wage gain E[U(c)∆w(c)] – has declined
dramatically over the last two decades. For example, the adjusted impact of unions on male
wages in the U.K. went from 9.2 percentage points in 1983 (unionization rate of 0.57 times an
adjusted gap of 0.162) to 1.7 percentage points in 2001 (0.307 times 0.045). In the U.S., the
effect on average wages of men fell from 5.7 percentage points (unionization rate of 0.307 times
an adjusted gap of 0.185) to 2.3 percent in 2001 (0.149 times 0.156).
The next rows in Tables 2-4 report measures of wage dispersion within the union and
nonunion sectors. Once again, the results are remarkably consistent across countries. As first
documented in Freeman (1980), the standard deviation of wages is always smaller in the union
than in the nonunion sector. Moreover, the gap between the standard deviation in the union and
nonunion sector is always larger for men than for women. These observations are confirmed by
Figures 7 to 12, which show kernel density estimates of the densities of log hourly wages in the
union and nonunion sectors, and for the two sectors pooled together, by gender and time period.8
For example, Figure 7 displays the wage distribution for U.S. males. In all four time periods,
wages are more tightly distributed in the union than the nonunion sector. In particular, while the
upper tails of the union and nonunion densities look qualitatively similar, the lower tail goes
much further to the left in the nonunion sector. By contrast, the inter-sectoral differences in
wage dispersion are much less striking for U.S. women (Figure 8). In 1984, for example, the
union and nonunion distributions show different skewness, and average wages are higher in the
union sector. However, it is not clear whether wages are more narrowly distributed in the union
or nonunion sector.
21
9 This is similar to DiNardo, Fortin and Lemieux (1996) who show that the minimum wage has amuch larger impact on women than on men.
Inspection of Figures 7 and 8 (and the corresponding figures for Canada and the U.K.)
suggests that the minimum wage is an important factor in explaining overall trends in wage
inequality, particularly for nonunion female workers.9 An interesting conjecture is that unions
appear to have a more limited effect on the dispersion of female wages in part because minimum
wages limit the amount of dispersion in the lower tail of the female wage distribution.
The wage densities for Canadian men (Figure 9) and women (Figure 10) are qualitatively
similar to those in the U.S. In particular, it is clear that male wages are more narrowly
distributed in the union sector than the nonunion sector. Things are not as clear for women, in
part because of the minimum wage, which has a surprisingly large visual impact in the nonunion
sector, especially in 2001. Relative to the U.S. or Canada it is more difficult to see union wage
compression effects for U.K. males (Figure 11) or females (Figure 12). Comparing the reported
standard deviations of wages in the two sectors in Table 3, however, the union-nonunion gaps
are nonetheless quite similar to those in Canada or the United States.
The bottom rows of Tables 2-4 show the various components of our analysis of the effect
of unions on wage inequality. For reference purposes, we first present a simplified analysis that
ignores any differences across skill groups. In this case, equation (4) reduces to
V - VN = U∆v + U(1!U)∆w2 (4')
where U represents the overall unionization rate, ∆v represents the difference in the variance of
log wages between union and nonunion workers, and ∆w represents the (unadjusted) difference in
mean wages between union and nonunion workers. The first term is the “within sector” effect of

22
10 The derivative of the right hand side of equation (4') with respect to the unionization rate is ∆v + (1!2U)∆w
2. This is negative as long as ∆v is large relative to ∆w2.
unions, and is negative since the variance of wages is lower for union workers, while the second
is the “between sector” effect, which is always positive.
Comparing the results across countries and over time, the results from this simplified
analysis are remarkably consistent. For men, the within-sector effect is substantially larger (in
absolute value) than the between-sector effect, implying that unions reduce wage dispersion.
Relative to the overall variance, the compression effect ranges from 31 percent in the U.K. in
1984, when the unionization rate was 57 percent, to 6 percent in the U.S. in 2001 (unionization
rate of 15 percent). More generally, the compression effect of unions is highly correlated with
the overall level of unionization (4').10
In contrast to the situation for men, the simplified analysis of equation (4') implies that
unions have either no effect on female wage inequality, or a slightly disequalizing effect. This
contrast is attributable to three complementary factors. First, the female unionization rate is
lower, reducing the size of the within-sector effect. Second, the gap in overall wage dispersion
between union and nonunion workers is much smaller for women than men. Third, the union
wage gap is systematically larger for women than men, yielding a larger (more positive)
between-sector effect U(1!U)∆w2. Indeed, in the later years of our analysis, the between-sector
effect dominates in all three countries. Consistent with findings reported in Card (2001) and
Lemieux (1993), unions thus tend to increase the variance of wages among women.
The final set of rows in Tables 2-4 show the effect of unions on the variance of wages
when we distinguish among skill groups. Recall from equation (4) that this analysis includes
23
three components: an average within-sector effect, E[U(c)∆v(c)], an average between-sector
effect, E[U(c)(1!U(c))∆w(c)2], and the sum of two “between-skill-group” terms,
Var[U(c)∆w(c)] + 2Cov[WN(c), U(c)∆w(c)]
that reflect the rise in inequality between groups if the union wage gain varies by skill group, and
any tendency of unions to raise wages more or less for higher wage workers.
Starting with men, the introduction of controls for observable skill systematically reduces
the magnitudes of both the within- and between-sector effects. It is easy to see why this happens
in the case of the between-sector effect. As we have noted, adjusting for characteristics reduces
the union wage gap, and thus decreases the size of the between-group effect. In other words,
part of the measured between-sector effect in the simple two-sector calculation is a spurious
consequence of that fact that union workers are more skilled, on average, than nonunion
workers. A similar reasoning can be used to understand why the within-group effect also
declines when differences in observed skills are taken into account. Recall from Figures 1a-3a
that unionized men are more concentrated in the middle of the wage distribution than nonunion
men. Part of the lower dispersion of wages in the union sector is thus a spurious consequence of
the fact that union workers are more homogenous.
Interestingly, adjusting for observed skill characteristics also reduces the magnitude of
the between-sector effect for women but increases (or leaves unchanged in the U.S.) the
magnitude of the within-group effect. The latter finding means that union women are no more
homogenous (in terms of their observable skills) than their nonunion counterparts, which is
consistent with the evidence reported in Figures 1b, 2b, and 3b. Once worker characteristics are
taken into account, the within-sector effect tends to dominate the between-sector effect for both

24
men and women. Thus, the results from a simplified analysis which ignores measured skill
differences tends to overstate male-female differences in the effect of unions on wage inequality.
The final components of the union effect are the two terms which reflect the effect of
unions on the distribution of wages across skill groups. As highlighted in our discussion of
Figures 4-6, the union wage effect ∆w(c) is systematically lower for high-wage men, inducing a
negative covariance between WN(c) and U(c)∆w(c). By contrast, the wage gap for women is not
much lower for high-wage groups, and the higher unionization rate for those groups induces a
positive covariance between WN(c) and U(c)∆w(c).
The results in Tables 2-4 are broadly consistent with this prediction. As expected, unions
tend to reduce wage dispersion across skill groups for men (except in recent years in Canada
where the effect is essentially zero). Also as expected, unions tend to increase wage dispersion
across skill groups for women in Canada and the U.K. In the U.S., however, unions have little
effect on female wage dispersion across skill groups from 1973 and 1993, and actually reduce
wage dispersion in 2001. A natural explanation for the difference between the U.S. on one hand,
and Canada and the U.K., on the other, is that the union wage gap for U.S. women tends to
decline slightly with higher nonunion wages (see Figure 4b). This lowers the covariance
between WN(c) and U(c)∆w(c) for U.S. women relative to the other two countries.
Once all three factors are taken into consideration, our calculations show that unions
systematically reduce the variance of wages for men. By contrast, the effects for women tend to
be small and slightly positive (i.e., unions raise inequality). This pattern of result is quite similar
to what we found with the simpler model, though the magnitude of the effects tend to be smaller
when we control for worker’s characteristics.

25
11Modify equation (5b) to: WiU(c) = WU(c) + kai + ei
U , where k#1, and assume that aworker’s expected productivity (in either the union or nonunion sector) is equal to his or herexpected nonunion wage, WN(c) + ai . Then a unionized employer will be willing to hire anyworker in skill group c with ai $ ∆w(c) /(1-k). Note that the higher is ∆w(c), the more selective isthe subset of workers who are hired.12Taking a more direct approach, Hirsch and Schumacher (1998) examine test score data andfind that union members with high measured skills have relatively low test scores.
E. Biases from Unobserved Heterogeneity
As we noted in Section II, a potential problem with estimates of the equalizing effect of
unions based on equation (4) is that union workers may be more or less productive than
otherwise similar nonunion workers. In this case, comparisons of the mean and variance of
wages for union and nonunion workers with the same observed skills confound the true union
effect and unobserved differences in productivity. Traditionally, economists have argued that
union workers are likely to have higher unobserved skills than their nonunion counterparts
(Lewis, 1986). Underlying this view is the notion that union wage structures do not fully
compensate high productivity individuals, so employers can reduce the burden of above-market
wage scales by hiring more productive workers. This line of argument suggests that the degree
of employer selectivity may be higher, the higher is the union wage premium.11 If unions really
raise wages more for lower skill groups, unionized employers may respond by hiring only the
very best workers in the lowest skill groups, inducing a pattern of selectivity bias that
accentuates the true union wage premium, and leading to an overstatement of the “between
group” equalizing effect of unions.
Previous studies by Lemieux (1993), Card (1996), and Lemieux (1998) have attempted
to use data on job changers to measure the extent to which union and nonunion workers in
different skill groups have different unobserved productivity characteristics.12 The two Lemieux

26
studies analyze data for men and women in Canada, while Card examines data for men in the
U.S. All three studies find that among North American men, unions tend to raise wages more
for less skilled workers, but that simple comparisons which ignore unobserved skill components
tend to overstate the flattening effect. Lemieux’s results for Canadian women, on the other
hand, show little evidence of flattening, either in simple cross sectional comparisons or in more
sophisticated longitudinal estimators. Lemieux (1998) also uses longitudinal data to examine
the apparent effect of unions on the dispersion of wages controlling for observed and unobserved
skill components. This analysis suggests that some of the apparent reduction in variance in the
union sector may be due to selectivity, rather than to a within-sector effect. Unfortunately, this
inference is confounded by the potential selectivity of the group of union status changers, and
the fact that the variability of wages may be temporarily high just before and just after a job
change. Overall, Lemieux (1998) concludes incorporating unobserved heterogeneity effects
leads to a small reduction in the apparent effect of unions on male wage inequality. A similar
conclusion is reached in Card (1996).
Based on these findings, we conclude that the estimates of the equalizing effect of unions
on male workers in the U.S., Canada, and the U.K. in Tables 2-4 are likely to slightly overstate
the true equalizing effects. For women, the estimated effects in Tables 2-4 are very small
anyway, and the existing longitudinal research suggests there is no important bias.
F. Unions and Differences in the Trends in Wage Inequality
To what extent can changes in the strength of unions explain the evolution of wage
inequality over time and the differences in inequality across countries? In light of the results of
Tables 2-4, we look at this question for men only since unions appear to have little effect on
27
13 DiNardo, Fortin and Lemieux (1996), Card (2001) and Gosling and Lemieux (2001) all reachthe same conclusion that de-unionization explains very little of the increase in wage inequalityamong women in the U.S. or U.K.
wage inequality for women.13 Starting with the U.S., Table 2 shows that the variance of male
wages increased from 0.258 to 0.340 (a rise of 0.082) between 1973/74 and 2001. During the
same period, the effect of unions on the variance of wages computed using the simplified model
declined from –0.047 to –0.021 (a rise of 0.026). If this effect had remained constant over time,
overall wage inequality would have grown by 31 percent less (0.026/0.082) than it actually did.
The contribution of unions to the growth of inequality remains important though only about one-
half as big (14 percent) when we use the more sophisticated estimates of the union effect that
control for observable skills.
The results for the U.K. are qualitatively similar. Between 9 and 29 percent of the 0.087
growth in the variance of log wages between 1983 and 2001 can be accounted for by the decline
in union compression effects. Furthermore, in both the U.S. and U.K. union wage compression
effects remained relatively constant between 1993 and 2001. In particular, the effects from the
analysis that controls for workers’ characteristics are essentially unchanged in the period from
1993 to 2001. This is consistent with the slowdown in the growth of inequality in both countries
in the 1990s, relative to the 1980s.
As in the U.S. and U.K., the union wage compression effect has been steadily declining
for Canadian men since 1984. Unlike the U.S. and U.K., however, overall inequality has
remained very stable in Canada over time. This suggests that overall inequality would have
actually declined if union wage impacts had remained at their 1984 levels. Several developments
may have offset the pressures toward increased inequality associated with the decline in union

28
strength. The real minimum wage in Canada rose from the mid-1980s to the late-1990s, in
contrast to the situation in the U.S. where the real minimum wage was approximately constant
over this period (Kuhn, 2000). In addition, there is some evidence that the much more rapid
growth in educational attainment in Canada compared to the U.S. during the 1980s and 1990s
reduced the tendency for widening earnings differentials between less-educated and more-
educated workers (Murphy, Riddell and Romer, 1998).
Turning to cross-country differences in wage inequality, first note that in 1983/84 the
variance of wages was lowest in the U.K. (0.216) followed by Canada (0.231) and the U.S.
(0.289). By contrast, union wage compression effects (from the model that controls for skill
differences) were highest in the U.K. (-0.050), followed by Canada (-0.037) and the US (-0.017).
The pattern of cross-country differences in wage inequality is thus consistent with the pattern of
union wage compression effects. For instance, differences in union wage compression effects
account for 45 percent of the U.K.-U.S. difference in the variance of wages in the early 1980s.
By 2001, the U.S.-U.K. difference in the variance of wages had fallen to 0.037, while the U.S.-
U.K. difference in the union compression effect had fallen to 0.027. This indicates that over 70
percent of the difference in wage inequality can now be explained by union wage compression
effects. In 2001, however, union wage compression effects cannot account for the much lower
variance of wages in Canada.
In summary, union wage compression effects help explain a reasonable fraction of the
secular growth in male wage inequality and of cross-country differences in male wage
inequality. One exception is the surprising lack of growth in male wage inequality in Canada
relative to the other two countries. An assessment of the relative importance of the various
influences on wage inequality among Canadian men is a worthwhile subject for future research.

29
IV. Summary and Conclusions
The impact of unions on the structure of wages has recently attracted renewed interest as
analysts have struggled to explain the rise in earnings inequality in several industrialized
countries. Canada, the U.K. and the U.S. provide a potentially valuable set of countries for
examining this question. All three countries now collect comparable data on wages and union
status in their regular labor force and population surveys. Several features of the collective
bargaining institutions of these countries make them suitable for studying the relationship
between unions and wage inequality. Bargaining is highly decentralized, there are no general
mechanisms for extending collective bargaining provisions beyond the “organized” sector, and
the fraction of the workforce covered by collective bargaining is relatively modest. Thus it is
possible to compare the structure of wages for workers covered by union contracts to those who
are not covered, and potentially infer the effect of unions on overall wage inequality.
A number of previous studies, including Freeman (1980, 1993), Lemieux (1993), Card
(1996, 2001), DiNardo, Fortin and Lemieux (1996), DiNardo and Lemieux (1997), Machin
(1997) and Gosling and Lemieux (2001), have examined the relationship between unionization
and wage inequality in these countries individually or in country pairs. Most of the previous
work has focused on men and on the 1970s and 1980s. One contribution of this paper is to
provide a comprehensive analysis of the evolution of unionization and wage inequality for both
men and women in all three countries over the past two to three decades. Following the approach
developed in Card and Lemieux (1996), we also take into account variation in collective
bargaining coverage and union wage impacts across workers with different levels of observable
skills.
In his landmark paper, Freeman (1980) concluded that, overall, unions tend to reduce

30
wage inequality among men because the inequality-increasing “between-sector” effect is smaller
than the dispersion-reducing “within-sector” effect. Our analysis indicates that this finding is
very robust across countries (U.S., U.K. and Canada) and time periods (from the early 1970s to
2001). Controlling for worker characteristics alters the magnitudes of the “within-sector” and
“between-sector” effects, and introduces additional terms that reflect differences in union
coverage and union wage effects across skill groups. For men in all three countries both the
“within” and “between” sector effects decline when we control for the skill composition of the
workforce. Because union workers are more skilled, on average, than nonunion workers,
adjusting for characteristics reduces the magnitude of the “between-sector” effect. The decline in
the within-group effect reflects the fact that unionized men are more homogeneous than their
nonunion counterparts.
We find remarkably similar patterns in union representation and union wage impacts
across skill groups for men in all three countries. Union coverage tends to be concentrated in the
middle of the skill distribution, and union wages tend to be compressed relative to nonunion
wages. As a consequence, unions have an equalizing effect on the dispersion of wages across
skill groups in the three countries, complementing the effect on “within-group” inequality.
Once all these factors are taken into consideration, our calculations imply that unions
systematically reduce the variance of wages for men in all three countries, though the
magnitudes of the effects are smaller when we control for the skill composition of the workforce.
Interestingly, an equally robust finding that emerges from this paper is that unions do not
reduce wage inequality among women. In all three countries, this important male-female
difference in the impact of unionism is due to a combination of three factors. First, unionized
women are more concentrated in the upper end of the wage distribution than their male
31
counterparts. Second, the union wage gap is larger for women than for men, resulting in a larger
“between-sector” effect. Third, the union wage gap is larger for lesser- than higher-skilled men,
while this is not the case for women.
Another important conclusion is that the impacts of unions on the wage structure in the
U.S., Canada, and the U.K. have followed remarkably similar trends over the last two decades.
In all three countries, the unionization rate and the union wage differential have declined
substantially since the early 1980s. For men, this has resulted in a steady erosion of the
equalizing effect of unions that explains a significant fraction of the growth in wage inequality
in the U.S. and U.K. The decline of female unionization has been much smaller than that of
men. A a consequence, unionization rates of men and women are nearly equal now in all three
countries, marking a sharp departure from the historical pattern. However, the modest decline in
union coverage among women had little impact on female wage inequality.
Interestingly, in both the U.S. and the U.K. our estimates of the effects of unions on wage
inequality were virtually unchanged between 1993 and 2001. This is consistent with the
slowdown in the growth of inequality in both countries during the 1990s, relative to the 1980s.
However, in Canada there was little change in wage inequality during the 1980s and 1990s,
despite a moderate drop in union coverage among men. The Canadian experience suggests that
other factors offset the pressures toward widening inequality associated with the decline in
unionization.
Although trends in union coverage and union wage effects are very similar in the three
countries, there are substantial differences in the levels of unionization and wage inequality. The
pattern of cross-country differences in wage inequality is consistent with the pattern of wage
compression effects. Our calculations indicate that differences in union wage compression

32
effects can account for almost one-half of the U.K. - U.S. differential in the variance of wages in
the early 1990s, and over two-thirds of the differential in 2001.

33
References
Angrist, Joshua D. and Alan B. Krueger. “Empirical Strategies in Labor Economics.” In Orley
Ashenfelter and David Card, editors, Handbook of Labor Economics Volume 3a. Amsterdam:
Elsevier, 1999.
Bland, Paul (1999), “Trade Union Membership and Recognition, 1997-98: An Analysis of Data
from the Certification Officer and the Labour Force Survey.” Labour Market Trends (July
1999): 343-353.
Budd, John W. and In-Gang Na (2000), “The Union Membership Wage Premium for
Employees Covered by Collective Bargaining Agreements.” Journal of Labor Economics 18
(October 2000): 783-807.
Card, David (1996), 'The Effects of Unions on the Structure of Wages: A Longitudinal Analysis',
Econometrica, 64 (4), 957-979.
Card, David (2001), 'The Effect of Unions on Wage Inequality in the U.S. Labor Market'
Industrial and Labor Relations Review, 54 (2), 296-315.
Card, David, and John DiNardo (2002), 'Skill-Biased Technological Change and Rising Wage
Inequality: Some Problems and Puzzles' Journal of Labor Economics, 20 (4), 733-783.
Card, David and Thomas Lemieux (1996), 'Wage Dispersion, Returns to Skill, and Black-White
Wage Differentials', Journal of Econometrics, 74, 319-361.
DiNardo, John, Nicole M. Fortin and Thomas Lemieux (1996), 'Labor Market Institutions and
the Distribution of Wages, 1973-1992: A Semi-Parametric Approach', Econometrica 64 (5),
1001-1044.

34
DiNardo, John and Thomas Lemieux (1997), 'Diverging Male Wage Inequality in the United
States and Canada, 1981-88: Do Institutions Explain the Difference?', Industrial and Labor
Relations Review, 50 (4), 629-651.
Farber, Henry S. and Bruce Western (2000), “Round Up The Usual Suspects: The Decline of
Unions in The Private Sector, 1973-1998.” Princeton University Industrial Relations Section
Working Paper #437 (April).
Freeman, Richard B. (1980), 'Unionism and the Dispersion of Wages', Industrial and Labor
Relations Review, 34 (1), 3-23.
Freeman, Richard B. (1993), 'How Much has Deunionization Contributed to the Rise of Male
Earnings Inequality?', in Sheldon Danziger and Peter Gottschalk (eds), Uneven Tides: Rising
Income Inequality in America, New York: Russell Sage Foundation.
Freeman, Richard B. (1998) “Spurts in Union Growth: Defining Moments and Social
Processes”, in Michael Bordo, Claudia Goldin, and Eugene White (eds), The Defining Moment:
The Great Depression and the American Economy in the Twentieth Century, Chicago:
University of Chicago Press for NBER.
Gosling, Amanda and Thomas Lemieux (2001), “Labor Market Reforms and Changes in Wage
Inequality in the United Kingdom and the United States”, NBER Working Paper 8413,
Cambridge, Mass.: National Bureau of Economic Research.
Hicks, Stephen (2000), “Trade Union Membership 1998-99: An Analysis of Data from the
Certification Officer and the Labour Force Survey”, Labour Market Trends, 108 (7), 329-340.
Hirsch, Barry T. and Edward J. Schumacher (1998), 'Unions, Wages, and Skills', Journal of
Human Resources, 33 (1), 201-219.

35
Hirsch, Barry T. and Edward J. Schumacher (2003), 'Match Bias in Wage Gap Estimates Due to
Earnings Imputation', forthcoming in the Journal of Labor Economics.
Hirsch, Barry T, and David A. Macpherson (2003), “Union Membership and Coverage Database
from the Current Population Survey: Note,” Industrial and Labor Relations Review, Vol. 56, No.
2, January 2003, forthcoming.
Human Resources Development Canada (2002), Workplace Gazette, 5 (3). Available online
only at http://labour.hrdc-drhc.gc.ca/pdf/pdf_e/18_unions_eng.pdf.
Kuhn, Peter (2000), ‘Canada and the OECD Hypothesis: Does Labour Market Inflexibility
Explain Canada’s High Level of Unemployment?’, in W. Craig Riddell and France St-Hilaire
(eds), Adapting Public Policy to a Labour Market in Transition, Montreal: Institute for Research
on Public Policy, pp. 177-209.
Lemieux, Thomas (1993), 'Unions and Wage Inequality in Canada and the United States' in David
Card and Richard B. Freeman (eds.) Small Differences That Matter: Labor Markets and Income
Maintenance in Canada and the United States, Chicago: University of Chicago Press.
Lemieux, Thomas (1998), 'Estimating the Effects of Unions on Wage Inequality in a Panel Data
Model with Comparative Advantage and Non-Random Selection', Journal of Labor Economics, 16
(2), 261-291.
Lewis, H. Gregg (1963), Unionism and Relative Wages in the United States, Chicago: University
of Chicago Press.
Lewis, H. Gregg (1986), Union Relative Wage Effects: A Survey, Chicago: University of Chicago
Press.
Machin, Stephen (1997), ‘The Decline of Labour Market Institutions and the Rise in Wage

36
Inequality in Britain’, European Economic Review, 41 (3-5), 647-657.
Metcalf, David (1994), “Transformation of British Industrial Relations? Institutions, Conduct,
and Outcomes,” In Ray Burrell (ed) The UK Labour Market: Comparative Aspects and
Institutional Developments. (Cambridge: Cambridge University Press).
Murphy, Kevin M., W. Craig Riddell and Paul M. Romer (1998), ‘Wages, Skills and Technology
in the United States and Canada’ in Elhanan Helpman (ed), General Purpose Technologies and
Economic Growth, Cambridge, Mass.: MIT Press, pp. 283-309.
OECD, “Economic Performance and the Structure of Collective Bargaining” Employment
Outlook, Paris: OECD, July 1997.
Pencavel, John H. (2003) “The Surprising Retreat of Union Britain.” In Richard Blundell, David
Card, and Richard Freeman, editors, Seeking a Premier League Economy. University of Chicago
Press for NBER, forthcoming.
Riddell, Chris and W. Craig Riddell (2001) “Changing Patterns of Unionization: The North
American Experience” University of British Columbia, Department of Economics, Discussion
Paper 01-23, June.

37
14 See Card and DiNardo (2002) and Gosling and Lemieux (2001), for more detail.
DATA APPENDIX
U.S. Data
Since 1979, the U.S. Census Bureau has been collecting data on weekly hours, weekly
earnings, and hourly earnings (for workers paid by the hour) for all wage and salary workers in the
“outgoing rotation group” (ORG) of the Current Population Survey (CPS). Beginning in 1983, the
ORG supplement of the CPS also asks about the union status of workers (and union coverage).
Similar variables are also available in the May supplement of the CPS between 1973 and 1978,
though only union membership (and not coverage) is available for this period.
In both the May and ORG supplements of the CPS, workers paid by the hour are asked their
hourly rate of pay. We use this variable, which is collected in a consistent fashion over time, as
our measure of the hourly wage rate for these workers. The May and ORG supplements also
provide information on usual weekly earnings for all workers. For workers not paid by the hour,
we use average hourly earnings (weekly earnings divided by weekly hours) as our measure of the
wage rate.
Note, however, that weekly earnings are not measured in a consistent fashion over time. From
1973 to 1993, this variable was collected by asking directly individuals about their earnings on a
weekly basis. From 1994 to 2001, individuals had the option of reporting their usual earnings on
the base period of their choice (weekly, bi-weekly, monthly, or annually). Weekly earnings are
then obtained by normalized the earnings reported by workers to a weekly basis. The available
evidence does not suggest, however, that this change in the way earnings are collected had a
significant impact on the distribution of wages.14
Another potential problem is that weekly earnings are top-coded at different values for
different years throughout the sample period. Before 1988, weekly earnings were top-coded at
999 dollars. The top-code was later increased to 1923 dollars in 1988 and 2884 dollars in 1998.
For an individual working 40 hours a week, the weekly earnings top code corresponds to an hourly
wage ranging from of $42.6 in 1984 ($2001) to $99.6 in 1973 ($2001). To keep the wage samples
relatively comparable over time, we trim observations with wages above $63 dollars ($2001). We
also trim observations with wages below $2.5 ($2001), which typically corresponds to about half

38
of the minimum wage. The wage deflator used is the Consumer Price Index (CPI-U). All the U.S.
wage statistics reported in the paper are also weighted using the CPS earnings weights.
Questions about educational achievement were changed substantially in the early 1990s. Until
1991, the CPS used to ask about the highest grade (or years of schooling) completed. Starting in
1992, the CPS moved to questions about the highest degree. We have recoded the post-1992 data
in term of completed years of schooling to have a measure of schooling that is consistent over
time. We then use years of schooling to compute the standard measure of years of potential
experience (age-schooling-6). Only observations with potential experience larger or equal than
zero are kept in the analysis samples.
Finally, in the 1979-2001 ORG supplements of the CPS, wages or earnings of workers who
refuse to answer the wage/earnings questions were allocated using a “hot deck” procedure. We
exclude observations with allocated wages and earnings for two reasons. First, wages and
earnings were not allocated in the May 1973-78 CPS. We thus need to exclude allocated
observations from the 1984, 1993, and 2001 ORG supplement data to maintain a consistent sample
over time. Second, union status is not one of the characteristics used to match observations with
missing earnings to observations with non-missing earnings in the imputation procedure (hot deck)
used by the U.S. Census Bureau. As a result, estimates of union wage effects obtained from a
sample with allocation observations included can be severely biased downward (see Hirsch and
Schumacher, 2003, for more details).
U.K. Data
As mentioned in the text, for the U.K. we use data from the 1983 GHS and the 1993 and 2001
UKLFS. For the sake of consistency, we exclude observations from Northern Ireland since this
region was sampled in the UKLFS but not in the GHS. Real wages are obtained by deflating
nominal wages with the Consumer Price Index (Retail Price Index). To limit the effect of outliers,
we only keep observations with an hourly wage rate between 1.5 and 50 pounds (in 2001 pounds).
In general, we process the U.K. samples to make them as comparable as possible to the U.S.
samples. In both the UKLFS and the GHS, we use observations for wage and salary workers with
non-missing wages and earnings. We also use the sample weights whenever available (there are

39
15 Some assumptions could be made (as in Hirsch and Schumacher, 2003) to estimate the extentof the bias if we knew the fraction of workers with allocated wages and earnings, but thisfraction is not available in the data documentation provided by Statistics Canada.
no sample weights in the GHS). Since education is not consistent measured over time, we recode
education into five broad categories that are consistently over time: university graduates, higher-
level vocational training and A-level qualifications, middle-level vocational training or O-level
qualifications, lower-level vocational training, and no qualifications or diploma.
Canadian Data:
As mentioned in the text, for Canada we use the 2001 Labour Force Survey (CLFS), the 1991
and 1995 Surveys on Work Arrangements (SWA), and the 1984 Survey of Union Membership
(SUM). These data sets are all relatively comparable since both the SUM and the SWA were
conducted as supplements to the Labour Force Survey. Relative to the U.S. and U.K. data
however, there are some important limitations in the Canadian data. First, as mentioned in the
text, it is not possible to distinguish union membership from union coverage in the SWA. For the
sake of consistency over time, we thus use union coverage as our measure of unionization in
Canada.
A second limitation is that in the 1984 SUM and the 2001 CLFS, missing wages and earnings
were allocated but no allocation flags are provided. We thus have to include observations with
allocated wages and earnings in the analysis with generates an inconsistency relative to the SWA
(where missing wages and earnings are not allocated) and the U.S. and U.K. data. This likely
understates the effect of unions on wages in 1984 and 2001, though it is not possible to quantify
the extent of the bias.15 Another limitation is that age is only provided in broad categories, unlike
in the U.S. and U.K data where age is provided in single years. In particular, it is not possible to
separate workers age 15 from those age 16. This explains why we use all wage and salary workers
age 15 to 64 in Canada, compared to workers age 16 to 64 in the two other countries.
A further limitation is that hourly wages are top-coded at a relatively low level in the Canadian
data. The top codes are 45 dollars in the 1984 SUM, 50 dollars in the 1991 SWA, 40 dollars in the
1995 SWA, and 100 dollars in the 2001 CLFS. For the sake of consistency, we trim observations
with hourly wages above 44 dollars (in 2001 dollars). Wages are deflated using the Canadian CPI

40
for all items. We also trim observations with wages below 2.5 dollars in 2001 dollars, which
represents about half of the minimum wage.
One final limitation is that only five education categories are available on a consistent basis
over time. These categories are: 0 to 8 years of school, high school (some or completed), some
post-secondary education, post-education degree or diploma (less than university), and university
degree. As in the CPS and the UKLFS, all statistics for Canada are computed using sample
weights.

Table 1: Union Membership Rates Among Wage and Salary Workers in the U.S., the U.K. andCanada
United States United Kingdom Canada
1960 30.4 41.3 32.3
1970 26.4 48.2 33.6
1980 22.2 52.9 35.7
1990 15.3 40.0 34.5
1999 13.5 29.5 32.6
Notes: U.S. data are from Farber and Western (2000). U.K. data for 1960-1990 are from Metcalf(1994, Table 4.1); 1999 observation is from Hicks (2000, Table 2). Canadian data are fromHuman Resources Development Canada (2002).

Table 2: Effect of Unions on Wage Structure of U.S. Workers, 1973-2001
1973/74 1984 1993 2001——————————————— ——————————————— ——————————————— ———————————————male female male female male female male female
Fraction Union Members 0.307 0.141 0.236 0.141 0.185 0.132 0.149 0.121
Mean Log Wages (2001$):Non-union Workers 2.646 2.270 2.573 2.276 2.535 2.337 2.667 2.457Union Workers 2.841 2.499 2.866 2.605 2.838 2.686 2.899 2.761
Union Gap (unadjusted) 0.196 0.230 0.293 0.329 0.304 0.349 0.233 0.305Union Gap (adjusted) 0.185 0.220 0.208 0.228 0.210 0.210 0.156 0.149
Standard Deviation Log Wages:Non-union Workers 0.553 0.442 0.563 0.467 0.594 0.515 0.601 0.538Union Workers 0.354 0.383 0.363 0.408 0.399 0.444 0.417 0.460
Union Gap -0.198 -0.059 -0.199 -0.058 -0.194 -0.071 -0.184 -0.077
Variance Decomposition:Overall Variance 0.258 0.195 0.289 0.223 0.331 0.270 0.340 0.289
Two sector modelWithin-sector effect -0.055 -0.007 -0.044 -0.007 -0.036 -0.009 -0.028 -0.009Between-sector effect 0.008 0.006 0.015 0.013 0.014 0.014 0.007 0.010Total effect -0.047 0.000 -0.028 0.006 -0.022 0.005 -0.021 0.001
Model with skill groupsWithin-sector effect -0.022 -0.006 -0.020 -0.007 -0.018 -0.009 -0.013 -0.009Between-sector effect 0.007 0.004 0.010 0.008 0.012 0.011 0.004 0.008Dispersion across groups -0.011 0.001 -0.007 0.000 -0.008 -0.003 -0.006 -0.005Total effect -0.026 0.000 -0.017 0.001 -0.014 -0.001 -0.015 -0.007
Sample Size 43,189 30,500 77,910 69,635 71,719 69,723 55,813 55,167Number of Skill Groups 180 180 343 343 244 246 245 246
Note: Samples include wage and salary workers age 16-64 with non-allocated hourly or weekly pay, and hourlywages between $2.00 and $90.00 per hour in 1989 dollars.

Table 3: Effects of Unions on Wage Structure of Canadian Workers, 1984-2001
1984 1991-95 2001——————————————— ——————————————— ———————————————male female male female male female
Fraction Union Workers 0.467 0.369 0.408 0.353 0.330 0.317
Mean Log Wages (2001$)Non-union Workers 2.658 2.365 2.661 2.452 2.728 2.495Union Workers 2.987 2.793 2.972 2.851 2.964 2.853
Union Gap (unadjusted) 0.330 0.428 0.311 0.398 0.236 0.358Union Gap (adjusted) 0.251 0.321 0.204 0.275 0.153 0.226
Standard Deviation Log Wages:Non-union Workers 0.528 0.446 0.514 0.465 0.501 0.463Union Workers 0.343 0.368 0.362 0.380 0.386 0.395
Union Gap -0.185 -0.078 -0.152 -0.084 -0.115 -0.068
Variance Decomposition:Overall Variance 0.231 0.218 0.233 0.227 0.229 0.224
Two sector modelWithin-sector effect -0.075 -0.023 -0.054 -0.025 -0.034 -0.019Between-sector effect 0.027 0.043 0.023 0.036 0.012 0.028Total effect -0.048 0.019 -0.031 0.011 -0.021 0.009
Model with skill groupsWithin-sector effect -0.041 -0.027 -0.033 -0.028 -0.025 -0.022Between-sector effect 0.017 0.022 0.010 0.017 0.006 0.012Dispersion across groups -0.014 0.014 -0.002 0.014 0.001 0.013Total effect -0.037 0.009 -0.025 0.002 -0.017 0.003
Sample size 17,737 15,356 17,981 18,323 24,003 23,703Number of skill groups 25 25 25 25 25 25
Note: Samples include wage and salary workers age 15-64 with allocated hourly or weekly pay (except in 1991-95), and hourly wages between $2.50 and $44.00 per hour in 2001 dollars.

Table 4: Effects of Unions on Wage Structure of U.K. Workers, 1983-2001
1983 1993 2001——————————————— ——————————————— ———————————————male female male female male female
Fraction union workers 0.570 0.426 0.392 0.337 0.307 0.285
Mean log wages (2001£):Non-union Workers 1.843 1.416 2.036 1.705 2.170 1.873Union Workers 2.053 1.685 2.224 2.047 2.306 2.167
Union Gap (unadjusted) 0.210 0.269 0.188 0.342 0.135 0.294Union Gap (adjusted) 0.162 0.195 0.131 0.184 0.045 0.137
Standard Deviation of Log Wages:Non-union Workers 0.532 0.412 0.586 0.499 0.588 0.510Union Workers 0.382 0.399 0.438 0.475 0.442 0.468
Union Gap -0.150 -0.013 -0.148 -0.024 -0.146 -0.043
Variance Decomposition:Overall Variance 0.216 0.183 0.293 0.268 0.303 0.266
Two sector modelWithin-sector effect -0.078 -0.004 -0.059 -0.008 -0.046 -0.012Between-sector effect 0.011 0.018 0.008 0.026 0.004 0.018Total effect -0.067 0.013 -0.051 0.018 -0.042 0.006
Model with skill groupsWithin-sector effect -0.034 -0.023 -0.031 -0.028 -0.032 -0.025Between-sector effect 0.009 0.011 0.006 0.008 0.002 0.005Dispersion across groups -0.026 0.009 -0.016 0.012 -0.013 0.010Total effect -0.050 -0.003 -0.041 -0.008 -0.042 -0.010
Sample size 4,435 3,512 4,009 4,139 7,548 8,113Number of skill groups 25 25 25 25 25 25
Note: Samples include wage and salary workers age 15-64 with non-missing hourly or weekly pay, and hourlywages between £1.50 and £50.00 per hour in 2001 pounds.

a. US Men
0.000.050.100.150.200.250.300.350.400.450.50
5.47 7.03 9.03 11.59 14.88 19.11 24.53 31.50 40.45 51.94
Hourly Wage (2001$, Log Scale)
Uni
on M
embe
rshi
p R
ate 1973/4
198419932001
b. US Women
0.000.050.100.150.200.250.300.350.400.450.50
5.47 7.03 9.03 11.59 14.88 19.11 24.53 31.50 40.45 51.94
Hourly Wage (2001$, Log Scale)
Uni
on M
embe
rshi
p R
ate 1973/4
198419932001
Figure 1. Unionization Rate by Wage Level, United States
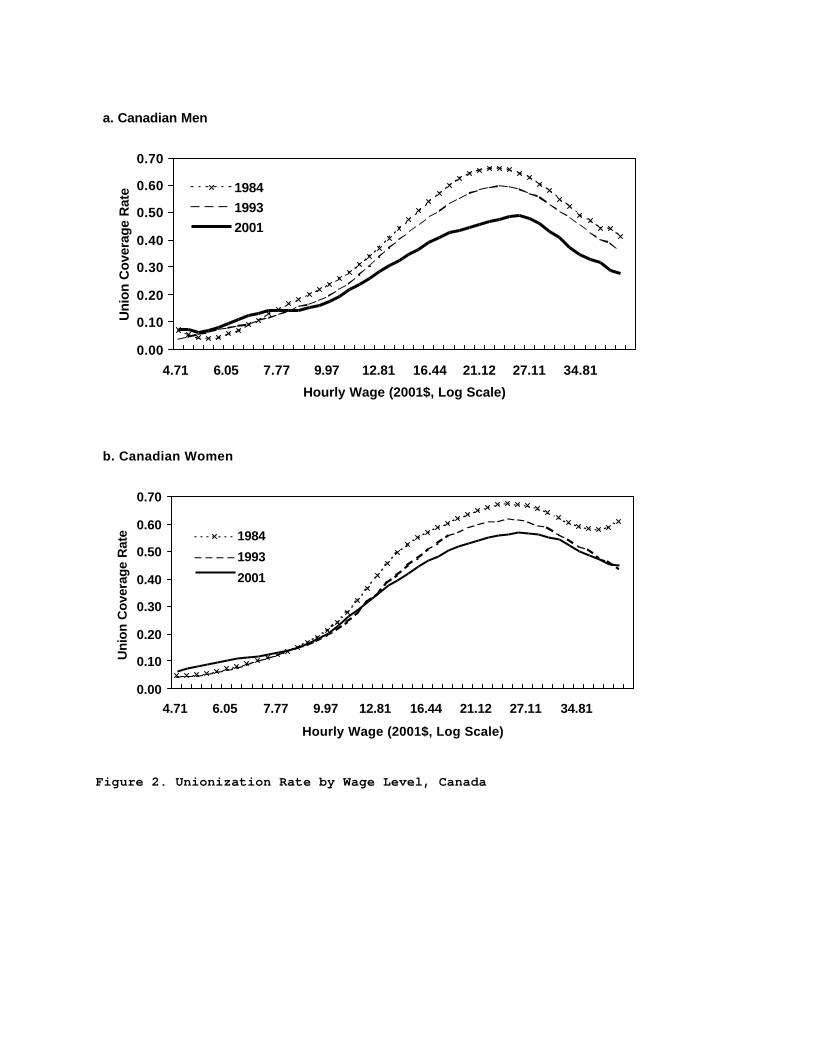
a. Canadian Men
0.00
0.10
0.20
0.30
0.40
0.50
0.60
0.70
4.71 6.05 7.77 9.97 12.81 16.44 21.12 27.11 34.81
Hourly Wage (2001$, Log Scale)
Uni
on C
over
age
Rat
e 198419932001
b. Canadian Women
0.00
0.10
0.20
0.30
0.40
0.50
0.60
0.70
4.71 6.05 7.77 9.97 12.81 16.44 21.12 27.11 34.81
Hourly Wage (2001$, Log Scale)
Uni
on C
over
age
Rat
e 1984
1993
2001
Figure 2. Unionization Rate by Wage Level, Canada
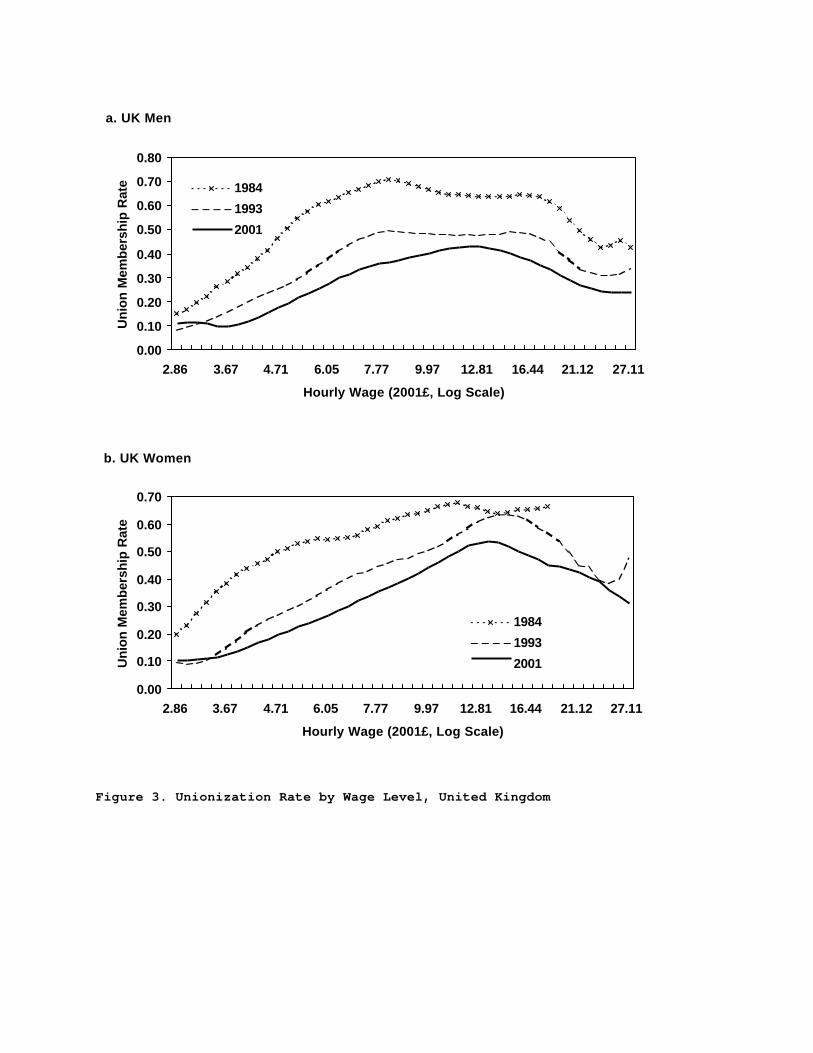
a. UK Men
0.00
0.10
0.20
0.30
0.40
0.50
0.60
0.70
0.80
2.86 3.67 4.71 6.05 7.77 9.97 12.81 16.44 21.12 27.11
Hourly Wage (2001£, Log Scale)
Un
ion
Mem
ber
ship
Rat
e 1984
1993
2001
b. UK Women
0.00
0.10
0.20
0.30
0.40
0.50
0.60
0.70
2.86 3.67 4.71 6.05 7.77 9.97 12.81 16.44 21.12 27.11
Hourly Wage (2001£, Log Scale)
Un
ion
Mem
ber
ship
Rat
e
1984
1993
2001
Figure 3. Unionization Rate by Wage Level, United Kingdom

a. US Men, 1993
1.50
1.70
1.90
2.10
2.30
2.50
2.70
2.90
3.10
1.50 1.70 1.90 2.10 2.30 2.50 2.70 2.90 3.10
Mean Non-union Wage
Mea
n U
nion
Wag
e
Solid line = 45 degreesDotted line = linear fit
b. US Women, 1993
1.50
1.70
1.90
2.10
2.30
2.50
2.70
2.90
3.10
1.50 1.70 1.90 2.10 2.30 2.50 2.70 2.90 3.10
Mean Non-union Wage
Mea
n U
nion
Wag
e
Solid line = 45 degreesDotted line = linear fit
Figure 4: Union Relative Wage Structure in the United States, 1993

a. Canadian Men, 1991-95
1.9
2.1
2.3
2.5
2.7
2.9
3.1
3.3
1.9 2.1 2.3 2.5 2.7 2.9 3.1 3.3
Mean Non-union Wage
Mea
n U
nion
Wag
e
Solid line = 45 degreesDotted line = linear fit
b. Canadian Women, 1991-95
1.9
2.1
2.3
2.5
2.7
2.9
3.1
3.3
1.9 2.1 2.3 2.5 2.7 2.9 3.1 3.3
Mean Non-union Wage
Mea
n U
nion
Wag
e
Solid line = 45 degreesDotted line = linear fit
Figure 5: Union Relative Wage Structure in Canada, 1991-95

a. UK Men, 1993
1.3
1.5
1.7
1.9
2.1
2.3
2.5
2.7
2.9
1.3 1.5 1.7 1.9 2.1 2.3 2.5 2.7 2.9
Mean Non-union Wage
Mea
n U
nion
Wag
e
Solid line = 45 degreesDotted line = linear fit
b. UK Women, 1993
1.3
1.5
1.7
1.9
2.1
2.3
2.5
2.7
2.9
1.3 1.5 1.7 1.9 2.1 2.3 2.5 2.7 2.9
Mean Non-union Wage
Mea
n U
nion
Wag
e
Solid line = 45 degreesDotted line = linear fit
Figure 6: Union Relative Wage Structure in the United Kingdom, 1993

a. U.S. Men, 1973/74
0.000.200.400.600.801.001.201.401.60
1 2 3 4 5
Log Hourly Wage (2001$)
Den
sity
All
Nonunion
Union
b. U.S. Men, 1984
0.00
0.20
0.40
0.60
0.80
1.00
1.20
1.40
1 2 3 4 5
Log Hourly Wage (2001$)
Den
sity
All
Nonunion
Union
c. U.S. Men, 1993
0.00
0.20
0.40
0.60
0.80
1.00
1.20
1.40
1 2 3 4 5
Log Hourly Wage (2001$)
Den
sity
AllNonunion
Union
d. U.S. Men, 2001
0.00
0.20
0.40
0.60
0.80
1.00
1.20
1 2 3 4 5
Log Hourly Wage (2001$)
Den
sity
AllNonunion
Union
Figure 7. Density of Wages, U.S. Males

a. U.S. Women, 1973/74
0.00
0.20
0.40
0.60
0.80
1.00
1.20
1 2 3 4 5
Log Hourly Wage (2001$)
Den
sity
All
Nonunion
Union
b. U.S. Women, 1984
0.00
0.20
0.40
0.60
0.80
1.00
1.20
1 2 3 4 5
Log Hourly Wage (2001$)
Den
sity
AllNonunion
Union
c. U.S. Women, 1993
0.00
0.20
0.40
0.60
0.80
1.00
1 2 3 4 5
Log Hourly Wage (2001$)
Den
sity
AllNonunion
Union
d. U.S. Women, 2001
0.00
0.20
0.40
0.60
0.80
1.00
1 2 3 4 5
Log Hourly Wage (2001$)
Den
sity
All
Nonunion
Union
Figure 8. Density of Wages, U.S. Females

a. Canadian Men, 1984
0.00
0.20
0.40
0.60
0.80
1.00
1.20
1.40
1 1.5 2 2.5 3 3.5 4 4.5
Log Hourly Wage (2001$)
Den
sity
All
Nonunion
Union
b. Canadian Men, 1991-95
0.00
0.20
0.40
0.60
0.80
1.00
1.20
1.40
1 1.5 2 2.5 3 3.5 4 4.5
Log Hourly Wage (2001$)
Den
sity
All
Nonunion
Union
c. Canadian Men, 2001
0.00
0.20
0.40
0.60
0.80
1.00
1.20
1 1.5 2 2.5 3 3.5 4 4.5
Log Hourly Wage (2001$)
Den
sity
All
Nonunion
Union
Figure 9. Density of Wages, Canadian Males

a. Canadian Women, 1984
0.00
0.20
0.40
0.60
0.80
1.00
1.20
1.40
1 1.5 2 2.5 3 3.5 4 4.5
Log Hourly Wage (2001$)
Den
sity
All
Nonunion
Union
b. Canadian Women, 1993
0.00
0.20
0.40
0.60
0.80
1.00
1.20
1 1.5 2 2.5 3 3.5 4 4.5
Log Hourly Wage (2001$)
Den
sity
All
Nonunion
Union
c. Canadian Women, 2001
0.00
0.20
0.40
0.60
0.80
1.00
1.20
1 1.5 2 2.5 3 3.5 4 4.5
Log Hourly Wage (2001$)
Den
sity
All
Nonunion
Union
Figure 10. Density of Wages, Canadian Females

a. U.K. Men, 1984
0.00
0.20
0.40
0.60
0.80
1.00
1.20
1.40
0.5 1 1.5 2 2.5 3 3.5 4
Log Hourly Wage (2001£)
Den
sity
All
Nonunion
Union
b. U.K. Men, 1993
0.00
0.20
0.40
0.60
0.80
1.00
1.20
0.5 1 1.5 2 2.5 3 3.5 4
Log Hourly Wage (2001£)
Den
sity
All
Nonunion
Union
c. U.K. Men, 2001
0.000.100.200.300.400.500.600.700.800.901.00
0.5 1 1.5 2 2.5 3 3.5 4
Log Hourly Wage (2001£)
Den
sity
All
Nonunion
Union
Figure 11. Density of Wages, U.K. Males

a. U.K. Women, 1984
0.00
0.20
0.40
0.60
0.80
1.00
1.20
1.40
0.5 1 1.5 2 2.5 3 3.5 4
Log Hourly Wage (2001£)
Den
sity
All
Nonunion
Union
b. U.K. Women, 1993
0.00
0.20
0.40
0.60
0.80
1.00
1.20
0.5 1 1.5 2 2.5 3 3.5 4
Log Hourly Wage (2001£)
Den
sity
All
Nonunion
Union
c. U.K. Women, 2001
0.000.100.200.300.400.500.600.700.800.901.00
0.5 1 1.5 2 2.5 3 3.5 4
Log Hourly Wage (2001£)
Den
sity
All
Nonunion
Union
Figure 12. Density of Wages, U.K. Females