NBER WORKING PAPER SERIES THE COMPETITIVE
39
NBER WORKING PAPER SERIES THE COMPETITIVE POSITION OF U.S. MANUFACTURING FIRMS Pnhar+ T TA n ar Irving B. Kravis Working Paper No. 1551 NATIONAL BUREAU OF ECONOMIC RESEARCH 1050 Massachusetts Avenue Cambridge, MA 02138 February 1985 This paper was prepared as part of the NBER's studies of U.S. Trade Policy, Competitiveness, and Capital Mobility in the World Econorry, (NSF Grant No. PRA—8l161459). The research reported here is part of the NBER's research program in International Studies and project in Productivity and Industrial Change in the World Econou. Any opinions expressed are those of the authors and not those of the National Bureau of Economic Research.
Transcript of NBER WORKING PAPER SERIES THE COMPETITIVE
NBER WORKING PAPER SERIES
THE COMPETITIVE POSITION OFU.S. MANUFACTURING FIRMS
Pnhar+ T TA n ar
Irving B. Kravis
Working Paper No. 1551
NATIONAL BUREAU OF ECONOMIC RESEARCH1050 Massachusetts Avenue
Cambridge, MA 02138February 1985
This paper was prepared as part of the NBER's studies of U.S. Trade
Policy, Competitiveness, and Capital Mobility in the World Econorry,(NSF Grant No. PRA—8l161459). The research reported here is part ofthe NBER's research program in International Studies and project inProductivity and Industrial Change in the World Econou. Anyopinions expressed are those of the authors and not those of theNational Bureau of Economic Research.

NBER Working Paper #1557February 1985
The Competitive Position ofU.S. Manufacturing Firms
ABSTRACT
This paper distinguishes between the competitive position of U.S. firms
and that of the U.S. and other countries as geographical locations for pro-
duction. While the share of the U.S. in world exports of manufactures fell
more than 40 per cent between 1957 and 1977, the share of all TJ.S. firms
from all locations declined much less and the share of U.S. multinational
enterprises increased.
The comparative advantage of U.S. multinational firms, as measured by
the industry distribution of their exports from all locations, changed very
little between 1966 and 1977. At the same time, there were large shifts in the
comparative advantage of the parent firms in the U.S., their overseas affil-
iates, and foreign firms. The changes for the U.S. parents and their affil-
iates reflected differences among industries in the extent to which export
production shares moved from the U.S. to the affiliates' host countries. The
shift took place in all the industry groups but was largest for metals and chem-
icals and smallest for transport equipment.
The rise in the share of world exports accounted for by U.S. multinational
firms and the decline in the share of the U.S. as a geographical location
suggests that the search for causes of the changed position of the U.S. should
be directed not to deficiencies in American industrial or technological
leadership but to other price and cost determining influences, such as produc-
tivity, wage setting, taxation, domestic inflation, and exchange rates.
Robert B. Lipsey Irving B. KravisNational Bureau of Economic Research Department of Economics269 Mercer Street 368 McNeil BuildingNew York, NY 10003 University of Pennsylvania
Philadelphia, PA 19104(212) 598—3533
(215) 898—5692

NBER Working Paper #January 1985
The Competitive Position of U.S. Manufacturing Firms
Robert F. Lipsey and Irving B. Kravis
RESEARCH SUMMARY
Synopsis
Issues: What have been the changes in the competitiveness (share in
world exports) of U.S. firms in their worldwide activities, and
in their comparative advantage (distribution among industries)?
How do they compare with the competitiveness and comparative ad-
vantage of the U.S. as a geographical location and to those of
foreign firms?
If IJ.S.—owned and managed firms, including their operations
at home and abroad, have fared well in international competition,
while production facilities located in the TJ.S. have not, the
inference is that the deterioration of the U.S. position is due
to factors others than management or technology.
Results: While the share of the U.S. in world exports of manufactures
fell more than 40 per cent between 1957 and 1977, that of all
U.S. firms from all their locations around the world declined
much less and the share of U.S. multinationals increased. The
comparative advantage of U.S. multinational firms, as measured
by the industry distribution of their exports from all locations,
changed very little between 1966 and 1977, while there were sub-
stantial shifts in the distribution of exports from the U.S.,

—2-
from foreign affiliates of U.S.—firms, and from non-U.S. firms
in foreign countries. There was also a shift in export produc-
tion, in terms of shares in total exports, from U.S. parents to
their foreign affiliates. This took place in all industry groups
but was largest in metals and chemicals.
The comparative advantage of foreign firms, as shown by the distribu-
tion of their exports, became more similar to that of U.S. multinationals.
That was particularly true in the developing countries, where the impor-
tance of food industries declined and that of machinery industries
increased.
Policy Implications
If, as we have hypothesized, the competitiveness and comparative advan-
tage of U.S. firms reflects their managerial and technological abilities,
there is little indication here of any serious erosion of these advantages
or shifts in their industry distribution. This casts doubt upon explana-
tions that attribute the U.S. trade deficit to unfavorable aspects of U.S.
management, such as an undue focus on short—term profits or lack of
measures that enlist the support of workers. It suggests that the search
for causes for the deterioration in the American position be sought in fac-
tors that determine relative U.S. prices as costs, such as monetary and
fiscal policy and wage and productivity behavior. For example, subsidies
to R & D or technological progress might produce gains in U.S.
multinationals' shares of world markets without affecting the extent of
production in the U.S.
THE COMPETITIVE POSITION OF U.S. MANTJFACTURINC FIRMS
Robert F. LipseyIrving B. Kravis
Introduction
The decline in the U.S. shares of world exports and world manufac-
tured goods exports since the 1950's has often been noted and commented on as
a measure of the declining competitiveness of the United States. While that
interpretation is questionable for a number of reasons (see Lipsey, 1984), we
will use the term here for convenience. Our main purpose in this paper is to
distinguish between the trade of the U.S. as a geographical location and the
trade of U.S. companies, wherever their production takes place, and to ana-
lyze the trends in these two aspects of U.S. competitiveness and comparative
advantage. While exports from the United States had declined by 1977 to less
than 15 per cent of world exports of manufactures, exports from all locations
by U.S. multinational firms accounted for more than 1/5 of the world total,
and exports by all U.S. firms for more than 1/4.1
Exports by American owned and managed firms thus fared well, while
exports from the territory of the U.S. did not. The implication is that the
deterioration of the U.S. position in world trade, at least for the decade
ending in 1977, was not due primarily to deficiencies in management, as is
sometimes claimed.
The share of world exports originating in the territory of the U.S.
reflects U.S. competitiveness, as determined by the characteristics of the
U.S. domestic economy. These include U.S. monetary and fiscal policy, through
effects on exchange rates and prices, and U.S. wage and productivity behavior.
The share of U.S. companies in world exports, on the other hand, is an
1The data on multinational firms are mainly from the 1957, 1966 and 1977official surveys of U.S. multinational enterprises (U.S. Department ofCommerce, 1960, 1975 and 1981). To match the definitions used in these sur—veys, the scope of "manufactures" in this paper includes manufactured foodsand edible oils but excludes manufactured fuels.

—2—
indicator of U.S. companies' competitiveness reflecting the firms' own
characteristics, such as their managerial and technological abilities and
skills. These can 'be exploited by U.S. companies by producing in the U.S. or
in foreign countries. A policy aimed at affecting TJ.S. domestic inflation or
exchange rates may affect the U.S. share of exports, while one aimed at tech-
nological advantage, such as subsidization of R & D, might have more
influence on the share of U.S. firms in world production, wherever it is
located, and the share of U.S. firms in world exports, wherever they are pro-
duced. This outcome would fit with the now common 'belief that it is the
existence of firm—specific assets, particularly knowledge, technology, and
management techniques, that account for much of the phenomenon of direct
investment.
We will refer in this paper to two characteristics of the U.S. and
of U.S. firms. One is their competitiveness, a term we will use, as mentioned
above, as shorthand for shares in world exports of manufactured goods. The
other is their comparative advantage, which we will use as shorthand for the
industry or commodity distribution of their exports, relative to those of
other companies or of the U.S. and other countries.
Shares in World Exports
Several indicators of trends in the shares of the U.S. as a
geographical entity, of U.S. firms, and of U.S. multinational firms in world
exports of manufactures are given in Table •2 The decline in U.S. shares
2The meaning of these terms is defined by the following:Exports of
U.S. Multinationals Other U.S. Firms
by Parents in by Affiliatesin U.S. Abroad
U.S. Exports X XU.S. Firm Exports X X X
U.S. Multinational
Enterprise Exports X X
Parent Exports X

-3—
Further Research
The story should be extended beyond 1977, but this must await the
availability of data from the 1982 census of U.S. direct foreign
Investment. It would also be desirable to examine the issue studied here in
terms of a more detailed breakdown than the broad industry divisions upon
which reliance has necessarily been placed in the present work. Such a
breakdown or, better still, access to individual company reports to the
Commerce Department would open the possibility of studying the effects of
R & D and of changes in technology upon export shares. Further insight into
the changes in competitiveness and comparative advantage could be obtained
from U.N. production data.

Indicators of the Shares of theEnterprises in World
1957,
U.S., U.S. Firms, and U.S. MultinationalExports of Manufactured Goods1966, and 1977
Comparable Data1957 1966 1977A
BestEstimate1 977B
Exports from the U.S.1. % of World Exports2. % of Developed—Country Exports
Exports by U.S. Firms md. Majority—OwnedAffiliates3. of World Exports4. of Developed-Country Exports
Exports by U.S. Firms, md. All Affiliates5. % of World Exports6. of Developed—Country Exports
NA 23.9NA 26.8
21.3 25.223.8 27.6
Exports by U.S. Multinational Enterprises,mci. All Affiliates10. % of World Exports11. % of Developed—Country Exports12. of Developing—Country Exports
Exports by U.S. Majority—Owned Affiliates16. of World Exports other than U.S.17. of Developed—Country Exports other than U.S.18. of U.S. Multinational Enterprise Exports19. % of U.S. Firms' Exports
10.311.7
62.7
8.910.471.6
10.412.1
72.5
—3—
Table 1
21.3 16.4 12.3 14.425.7 18.7 14.5 16.7
25.8 23.0 19.9 23.530.9 25.8 22.4 26.2
Exports by U.S. Multinational Enterprisesmd. Majority—Owned Affiliates7. % of World Exports8. of Developed—Country Exports9. of Developing-Country Exports
NA 16.9 17.0 20.2NA 16.8 19.1 22.40.91 3.6 5.1 6.5
NA 17.8 18.5 21.9NA 19.8 20.5 24.0NA 4.2 7.0 8.9
Exports by TJ.S. Multinationals (Parents) from the U.S.
13. % of World Exports NA14. % of Developed—Country Exports NA
15. of U.S. Exports NA
5.8 7.9 9.4 11.47.1 8.7 10.3 12.3NA 39.3 48.3 48.317.6 28.9 41.5 41.5

Notes to Table 1
-4—
Table 1 (concluded)
All Data are from Table A—i
minus Line 3)minus Line 3)
BestComparable Data Estite
1957 1966 l977A l977B
Exports by All U.S. AffiliatesWorld Exports other than U.S. NA 9.0 11.1 13.420. % of
21. % of Developed—Country Exports other than U.S. NA 9.9 11.9 14.222. % of U.S. Multinational Enterprise Exports NA 42.4 52.423. % of U.S. Firms' Exports NA 31.5 45.5 145.5
Line 1: Line 3 + Line 12: Line 3 ÷ Line 23: Line 18 ÷ Line 14: Line 19 + Line 25: Line 20 + Line 1
6: Line 21 + Line 27: Line 14 * Line 18: Line 15 * Line 29: Line 10 * Line 4
10: Line 16 * Line 1
11: Line 17 + Line 212: (Line 10 + Line 13) * Line 14
13: Line 7 * Line 1
14: Line 7 * Line 215: Line 7 * Line 316: Line 8 (Line 117: Line 9 * (Line 218: Line 8 * Line 14
19: Line 8 Line 1820: (Line 8 plus Line ii) ÷ (Line 1 minus Line 3)21: (Line 9 plus Line 12) (Line 2 minus LIne 3)22: (Line 8 plus Line ii) + Line i623: (Line 8 plus Line ii) + Line 20

—5—
of exports by all market economies and by developed countries, frequently
cited as evidence of falling U.S. competitiveness, was more than 40 per cent
over the twenty years from 1957 to 1977, and was large in both halves of that
period (Lines 1 and 2). The share of 13.5.—owned firms, including operations
in the U.S. and overseas, also declined, but the change was much smaller,
only about half as large (Lines 3 through 6). The source of the difference
between the two sets of ratios is suggested by the figures for U.S. multina-
tional enterprises (Lines 7 through 12), although most of them are available
only for 1966 and 1977. While the share of U.S. firms in world exports
declined, the share of U.S.—owned multinational enterprises remained constant
or increased slightly. That difference between the share of multinationals
and that of all U.S. firms could have reflected both the export performance
of firms that were already multinational in 1966 and the entry of additional
U.S. firms into status as multinationals. The sources of difference cannot be
precisely distinguished, but we have some indication that the latter element
was probably not the major one.3
3The number of manufacturing company parents recorded in 1977 (1,841) wasactually smaller than the nuniber of reporters recorded in 1966 (1,872). Thefigures cannot be regarded as conclusive because the definition of areporter in 1966 was not identical to that of a parent in 1977, and it islikely that some 1977 parents filed multiple reporter forms in 1966,exaggerating the apparent decline in numbers of parents. However, thenumber of such multiple reporters within firms was not large enough in 1966to negate the implication that it was the greater success of multinationalfirms in increasing exports rather than a tendency for more U.S. firms tobecome multinational that accounted for the rise in the multinationals'share in exports. Furthermore, there is other evidence for the relativelygreater export growth of multinationals. U.S. industries with high propor-tions of firms not investing abroad have tended to be those having severeproblems with import competition. And within industries, multinationalfirms have tended to grow more rapidly than others. (Lipsey, Kravis, andO'Connor, 1983).
—6—
For TEs we can distinguish between their exports from the U.S.
(parent exports) and their exports from foreign production locations. The
shares of parent company exports from the U.S. in world and developed—country
exports of manufactures (Lines 13 and 14) declined between 1966 and 1977, but
by much less than U.S. exports in general, as was clear from the increase in
parent companies' share of U.S. exports. What produced the constancy or small
gains mentioned above in U.S. multinationals' shares in world and developed—
country exports were the substantial increases in the shares of U.S.—owned
overseas affiliates in exports of countries other than the TJ.S., this in a
period when the exports of these countries were growing much faster than U.S.
exports. The shares of majority—owned affiliates in world exports rose from
about 6 per cent in 1957 to 91/2 per cent in 1977 (Line 16) and increased in
both developed— (Lines 17 and 21) and developing— (Lines 9 and 12) countries'
exports. The latter gain was particularly large, from less than 1 per cent in
1957 to over 5 per cent in 1977. If we include our rough estimates for
exports by minority—owned affiliates, which must also have reflected to some
degree the firm—specific advantages of the U.S. multinationals, the increases
were even larger between 1966 and 1977.
Another way of putting this development is that there was a large
shift in the geographical origins of exports by U.S. firms. For U.S. com-
panies in general, the share of exports supplied by the overseas affiliates
of multinationals increased from 171/a percent in 1957 to over 40 per cent
(over 45 per cent including minority—owned affiliates) in 1977 (Lines 19
and 23). For the MEs, the share of their exports supplied from majority—
owned affiliates outside the U.S. rose from less than 40 per cent in
1966 to almost half in 1977 and the share from all affiliates reached over
half (Lines 18 and 22). Thus U.S. firms overcame some of the relative decline

-7-
in the competitiveness of the U.S. as a production location by shifting to
other countries the sites from which they exploited their firm—specific com-
petitive advantages. Fxports of U.S. firms other than multinationals dropped
from 6.1 per cent of world exports in 1966 to 3.5 per cent in 1977 (Line 2
minus Line i).
The Competitiveness and Comparative Advantages of U.S. Multinationals
The competitiveness of U.S.—owned multinational firms might be best
renresented by their shares in worldwide production and their comparative
advantage by the distribution of their production among various industries,
as compared with production by others. However, since production data are not
readily available on a comprehensive basis, we have relied on information
about shares in worldwide exports and exports of individual industry groups.
In assessing the role of U.S. multinationals, we examine separately
their exports from the U.S. compared with those of non—multinational U.S.
firms, their exports from other countries compared with those of non—U.S.
firms, and their worldwide exports compared with those of other U.S. and
foreign firms. The first comparison, between U.S. exports of multinational
(parent) and non—multinational firms, reflects the effects of multinationa—
lity. Worldwide production and distribution facilities may lead to an
increase in the firm's share of foreign markets, part of which may come
through exports from the United States of components or smaller—volume ele-
ments of a line of products. On the other hand, the multinational firm, even
if it has a comparative advantage in an industry, may substitute exports by
subsidiaries in other countries for exports by the parent from the U.S.
These choices depend on location—specific rather than firm—specific advan-
tages.
The second comparison, between exports of affiliates and those of

—8-
non—U.S. firms from foreign countries, should reflect the advantages of the
U.S. base for a company: the factors that make U.S. firms competitive with
foreign firms producing in the same location. This comparison should reflect
firm—specific competitiveness because location—specific influences have been
eliminated except for interactions between firm—specific and location—
specific factors.
The third comparison is between exports by U.S. multinational firms
from all locations and all other exports including those of non—multinational
firms from the U.S. and of non—U.S. firms from foreign countries. This should
give the best measure of U.S. firms' comparative advantage, because it eli-
minates from the comparison the effects not only of location—specific advan-
tages themselves but also of any interactions between firm—specific and
location—specific advantages.
In making these three sets of comparisons we rely on data on the
exports of U.S. multinationals by country of origin from official surveys and
on U.N. export data for the U.S. and host countries which we have
reclassified to make reasonably comparable with the multinational export
data. The latter are available by country only for seven broad manufacturing
groups. We can, therefore, identify the comparative advantage of U.S. multi-
nationals from export data only at this level and not, as would be desirable,
for a more detailed classification.
Exports from the U.S. by U.S. Multinationals and by Other U.S. Firms
The exports of non—multinational U.S. firms should reflect the com-
petitiveness and the comparative advantages of the U.S. as a production loca-
tion. Exports from the U.S. by U.S. multinationals (parent exports) reflect
the combination of the influence of the U.S. production location and of the
multinational nature of these firms. The distributions of exports by the two

—9-.
types of firms are compared in Table 2 in two ways. One is based on exports
classified by commodity group, the preferable way, since it is the basis for
classifying aggregate U.S. exports and should, therefore, give better estima—
tes for exports by non-multinational firms. The second is by industry group
of parent firm; this is the only comparison that can be made for 1966 as well
as 1977, and for this purpose we also calculate aggregate exports in such a
way that figures for the two years are comparable.
It is clear from the commodity—group classification that the largest
differences between multinational and other U.S. firms in 1977 were in the
shares in transport equipment and "other manufacturing" exports. Despite the
fact that motor vehicle companies (but not aircraft companies) were in one of
the most multinational of U.S. industries, in the sense of having the highest
share of its activity overseas, multinationals accounted for almost 85 per
cent of exports of transport equipment from the U.S., about 2/3 of which was
by motor vehicle and parts manufacturers. This is an industry in which
multinationals appear to have had an advantage relative to other firms in
exporting from the U.S. Almost all of the exports of motor vehicle companies
were of parts and components to their own overseas affiliates, while aircraft
exports were almost entirely to unaffiliated foreigners (Kulchycky and
Lipsey, 1984, Table 2). The other case of a large advantage for multina-
tionals is machinery, also an industry in which a large part of companies'
activity tended to be overseas.
On the other side, in foods, chemicals, and other manufacturing,
especially the last, either multinationals did not have any advantage over
other U.S. firms in exporting from the U.S., or any such advantages were out-
weighed by the advantages of other locations from which they could export.
To observe changes in comparative advantage between 1966 and 1977,

— 10 —
Table 2
Industry Distribution of Exports from the U.S.,by U.S. Multinational Companies and Other U.S. Firms
1966 and 1977
Exports Total Transport OtherBy Mfg. Foods Chemicals Metals Machinery Equipment Mfg.
1977, Based on Data Classified By Commodity Group
Multinational Companies 100.0 5.3 11.2 6.0 34.4 28.7 14.5Other Firms 100.0 8.4 16.6 5.8 27.2 13.6 28.4Multinat. Exports as
of All U.S. Exports 72.2 62.1 63.6 72.8 76.6 84.6 57.0
1977, Based on Data Classified By Industry Group of Parent
Multinational Companies 100.0 3.8 13.6 6.0 29.8 32.1 14.7Other Firms 100.0 15.5 9.3 5.5 37.5 5.5 26.9Multinat. Exports as
of All U.S. Exports 70.5 37.0 77.8 72.5 65.6 93.4 56.8
1966, Based on Data Classified By Industry Group of Parent
Multinational Companies 100.0 4.7 14.5 9.1 29.6 27.1 15.0Other Firms 100.0 15.8 11.8 7.3 32.5 8.7 23.9Multinat. Exports as
of all TJ.S. Exports 65.8 36.6 70.2 70.7 63.6 85.6 54.7
Source: Appendix Table A—3

— 11 —
we can use only the data by industry group.4 Between 1966 and 1977 there was
a general increase in the competitiveness of U.S. multinationals relative to
other U.S. firms, as shown by the increase in their share of U.S. exports.
This increase took place in every industry group, but it was substantial only
in chemicals and transport equipment. As can he seen from the industry
distribution of exports, there was an apparent decline in U.S. comparative
advantage in foods, chemicals, and particularly metals, shared by both multi-
nationals and other firms. There was a gain in the comparative advantage of
multinational firms relative to non—multinational firms, in transport equip-
ment and a shift toward machinery on the part of non—multinational firms.
Exports by U.S. Firms' Foreign Affiliates and their Host Countries
Further evidence on the competitiveness and comparative advantages
of U.S. multinationals is given by the comparison between exports by their
affiliates and exports by other firms in the same areas. The distribution of
exports from an area by both U.S. and other firms reflects the comparative
advantages of that area. The differences in distribution between U.S. affi-
liates and other firms reflect the comparative advantages of the U.S. firms
relative to others in that area. Finally, the shares of U.S. firms in exports
can be thought of as reflecting both the comparative advantages of U.S. firms
and their competitiveness relative to other firms. For example, U.S. firms
might account for a large part of exports of food products from an area or
country because of the superior marketing abilities of U.S. companies in
general, but the share of food products in U.S. firms' exports from that area
might be low relative to that of local firms because U.S. firms have no corn—
4mese suffer from a defect that makes them more suitable for observingchanges over time than for comparing the relative advantages of the two groupsof U.S. firms. The classification of parent exports by parent industry places asubstantial amount of exports under the wrong category for comparison withaggregate IJ.S. export data. A notable example is that over 20 per cent of
exports by the transportation equipment industry are machinery, and over aquarter of machinery exports are made by parent companies in other industries.

— 12 -
parative advantage in that industry.
These calculations have been performed separately for several areas
because U.S. affiliates' relative competitiveness and comparative advantage
may differ among countries. The areas are Canada, developed countries other
than Canada, developing countries, and two groups of developing countries
that make up much of the set of countries often referred to as NICs, or newly
industrializing countries. The data for majority-owned and minority—owned
(where available) U.S. affiliates are summarized in Table 3.
Aside from Canada, where the ratios tend to be distorted by the
Canadian—U.S. Auto Agreement5, several results are common to most areas. U.S.
multinationals tend to have a comparative advantage in the machinery
industry. It is particularly large in developing areas, where it applies to
both electrical and non—electrical machinery, but exists in developed
countries also for the latter. U.S. firms also appeared to have comparative
advantages relative to local firms in chemicals and transport equipment in
the developed countries and the developing countries as a group, but not for
transport equipment in the Asian NIC's, where the other exporters probably
include many affiliates of Japanese auto companies.
At the other side of the scale, U.S. ME's did not seem to have any
comparative advantage over local and other foreign firms in the manufactured
foods and metals industries. That is not to say that no U.S. firms had such
advantages over local firms, since their presence in these countries implies
5The agreement encourages two—way trade between auto parents and theiraffiliates, to a far larger extent than in other industries or countries. Acalculation using net exports for these companies, as an approximation to netexports for these products, might give a more accurate picture of U.S. firms'comparative advantage.

JUL
t 3
Indu
stry
Distribution of Exports from Countries Outside the U.S.,
U.S.
Maj
ority
—O
wne
d and Minority—Owned Affiliates and Non-U.S. Firms
1966 and 1977
achine
Total
Non-
Mann facturin Foods Chemicals M
etal
s T
otal
__
__
Dev
eloe
d C
ount
ries
eCanada
5.5
18.8
.3
3:2.
1
Ele
ct.
23.3
Elect.
8.8
uiment M
214.2
15.1
100.0
1977 Majority—Owned U.S. Affil.
Minority—Owned U.S. Affil.
100.0
11.6
18.0
20.3
21.9
15.5
6.4
16.2
19.0
Non—U.S. Firms a
100.0
100.0
10.8
7.8
10.1
12.0
13.9
114.5
23.2
23.1
13.8
114.0
9.4
9.2
16.7
25.3
17.6
25.0
U.S. Firms as % of Total
9.6
6.7
114.2
4.8
12.2
114.3
8.9
12.1
6.3
1966 Majority—Owned U.S. Affil.
100.0
4.8
12.14
4.5
37.3
NA
NA
28.8
12.2
Minority—Owned U.S. Affil.
100.0
1.2
8.3
9.2
3:1.7
NA
NA
38.6
11.0
Non—U.S. Firms
100.0
13.7
9.9
15.8
20.0
NA
NA
12.1
28.5
U.S. Firms as % of
Total
7.6
2.5
9.0
2.6
13.1
NA
NA
17.0
3.14
Canada
1977 Majority—Owned U.S. Affil.
Minority—Owned U.S. Affil.
100.0
100.0
2.14
.3
3.0
6.2
6.3
20.14
1.5
8.1
4.7
3.4
2.8
4.7
62.2
18.6
1.6
63.14
Non—U.S. Firms
100.0
6.8
10.0
i8.4
1:3.4
10.6
2.8
12.5
38.9
U.S. Firms as % of
Total
51.1
26.1
25.0
28.14
37.1
31.6
51.8
83.2
35.7
1966 Majority—Owned U.S. Affil.
100.0
5.5
8.5
2.2
10.8
NA
NA
112.1
30.9
Minority—Owned U.S. Affil.
Non—U.S. Firms
100.0
100.0
3.9
12.3
2.4
1.6
1.4
44.5
:1.4
17.0
NA
NA
NA
NA
2.9
89.14
7.14
11.2
U.S. Firms as % of
Total
149.4
29.7
50.7
4.4
36.6
NA
NA
91.3
68.2
Developing Countries
— 19
17 Majority—Owned U.S. Affil.
Minority—Owned U.S. Affil.
100.0
100.0
12.7
6.7
8,5
11.9
8.3
25.6
5:1.0
36.5
7.7
6.2
43.2
30.3
7.4
12.1
5.6
13.7
Non—U.S. Firms a
100.0
100.0
113.4
25.0
3.9
6.3
9.0
12.11
7.2
8.8
1.9
3.0
5.3
5.8
2.1
33.9
4.i
115.5
U.S. Firms as % of
Total
"
" "
" "
7.2
9.0
1.9
14.2
15.6
12.9
10.1
9.5
33.3
34.6
22.4
19.5
36.6
110.3
16.5
2.7
i4.4
1.9
1966 Majority—Owned U.S. Affil.
100.0
1114
.5
16.6
12.8
8.5
NA
NA
1.4
16.3
Minority—Owned U.S. Affil.
Non—U.S. Firms
U.S. Firms as o of
Total
100.0
iOp.o
4.2
23.6
58.9
2.9
11.3
2.4
23.2
30.0
i6.8
3.9
6.14
<1.
5 15.7
NA
NA
NA
NA
NA
NA
4.5 2OS21.9
3.8

Table 3 (cont.)
— Ma
chin
e Total
Non—
Trans.
Other
ifacturin Foods Chemicals Metals Total Elec Elec in j.
Asia Other_than_Jaan and Middle East
1971 Majority—Owned U.S. Affil.
100.0
6.1
14.8
2.14
73.6—75.2
5.9 61.7—69.3
0.9 10.6—12.2
Other Firms
100.0
22.2
3.6
7.5
11.1—11.2
2.5
8.6—8.7
3.8
51.8—51.9
Other Firmsa
100.0
13.0
9.1
12.3
2.8
9.149.5
14.i
57.1-57.2
Maj.—Owned IJ.S. Affil.
as % o
f Total
5.0
i.14
6.6
1.6 25.7—26.2 11.0 29.1—29.8
1.2
1.1—1.3
a
2.1
6.1
1.5
25.7—26.3 10.7 29.2—29.9 1.2
0.9—1.2
1966 Majority—Owned U.S.
Aff
il.
100.0
27.1
3.9—7.2
31.9
15.0
NA
NA
0
18.8—22.2,
Oth
er Firms
100.0
38.9
2.142.5
8.6
3.9
NA
NA
Maj.—Ovned U.S. Affil.
as % of
Total
3.9
2.8
5.9—11.1
13.1
13.6
NA
NA
1.6—1.9
Brazil & Mexico
1971 Majority—Owned U.S. Affil.
100.0
21.8
7.6
)414
30.2
11.9
18.2
22.7
13.3
Other Firms
100.0
514.9
5.9
12.2
7.2
5.5
1.7
6.7
13.1
Maj.—Owned U.S. Affil.
as % of
Total
19.14
8.7
23.6
7.9
50.3
314.14
72.0
1414.9
19.7
1966 Majority—Owned U.S. Affil.
100.0
38.6
18.2
NA
12.5
NA
NA
NA
NA
Other Firms
100.0
31.14
9.3
NA
5.0
NA
NA
NA
NA
Maj —Owned US. A
ffil.
as % of Total
10.0
10.3
17.7
NA
21.7
NA
NA
NA
NA
aNO comparable to 1966 but based on aggregate export data more closely tched
with affiliate export data.
Source: Appendix Table A—5

— 15 —
the presence of some firm—specific advantages. However, comparative advan-
tages in foods and metals industries do not seem to be characteristic of U.S.
multinationals as a group.
The competitiveness of U.S. multinationals as a group is suggested
1w their shares in total manufactured exports. The shares grew in both deve-
loped and developing countries, but the most noteworthy increases were in the
latter. The U.S. firms' shares almost doubled despite the fact that tiese
countries' exports were increasing rapidly relative to those of other
countries. The data thus suggest that the U.S. affiliates probably played an
important role in these export expansions.
One of the major changes in comparative advantage that took place
between 1966 and 1977 was the shift toward machinery industries in developing
country exports. Both U.S. and non—U.S. firms moved strongly in this direc-
tion, but the change was larger for the U.S. firms, even in percentage terms,
despite their much higher initial levels. In developed countries, on the
other hand, the U.S. firms' comparative advantage in this industry declined
while that of foreign firms rose, remaining, however, well below the U.S.
firms' level. In transport equipment, U.S. multinationals retained some
advantage over others in both groups of countries, but there was some
catching up by foreign firms within developed countries. Outside of machinery
and transport equipment we find mostly declines in the comparative advantage
of U.S. affiliates in developing countries, and mixed results in developed
countries.
There is no evidence of any tendency for U.S. affiliates to gravi-
tate toward the distribution of domestic firm exports over time as far as we
can judge, given the number of missing observations for 1966. The 1977 affi-
liate export pattern was more similar to that of 1966 than to the domestic
firm product distribution in either 1966 or 1977. The product composition of

— 16 —
affiliate exports also was less like that of the domestic firms in 1977 than
in 1966.6
Exports from all Locations by U.S. Multinationals
Another way to view the comparative advantage of U.S. multinational
firms, escaping the effects of their choices of location, is to look at their
exports from all locations, including those from the parents in the U.S. and
those from their affiliates overseas. The distribution of these exports,
by industry, in 1966 and 1977 was as follows:
U.S. Multinational Firm Exports:Classified on Basis of Classified on Basis of
Industry of Parent Product Exported1966 1977 1977
All Mfg. Industries 100.0 100.0 100.0
Foods 5.7 4.6 5.3
Chemical 13.1 14.0 12.9
Metals 7.4 6.8 6.8
Machinery 28.8 28.5 30.7
Non—Elect. 17.5 NA
Elect. NA 11.0 NA
Transport Equip. 2R.9 30.4 28.8
All other 16.1 15.7 15.5
Source: Appendix Tables A-3 and A-6
6The coefficients of correlation between sets of export shares werer77M/66M = .58, r77M/66D = .43, r77/77], = .25, and rG5M/56D = .66, where M =an industry's share in exports by majority—owned U.S. affiliates and D thesame share for non—U.S. and U.S. minority—owned firms, and 77 and 66 refer to1966 and 1977. The full data set would have consisted of 5 product shares inexports (the "other" category was excluded) for each of 29 countries of which16 were developed and 13 developing. The number of available pairs of com-parable shares was around 75 due mainly to the suppression of data by the ori-ginal source owing to disclosure rules. The most serious omissions are some1966 data for the metals, machinery, and transportation equipment industriesfor the developing areas and U.S. affiliate exports from Japan in the all—areatotals. A very large part of U.S. affiliate activity in Japan was inminority—owned affiliates, for which trade data were not collected in theCommerce Department surveys.

— 17 -
Over this eleven—year period there was remarkably little change in
the industry distribution of exports: slight declines in foods and metals and
small increases in chemicals and transport equipment. These changes were
much smaller than those for parents alone (Table 2) or for affiliates alone
(Table 3). The implication is that the comparative advantages of U.S. multi-
nationals remained virtually constant; the shifts we observed for parents in
the U.S. and for their affiliates abroad must have represented changes in the
comparative advantages of production locations.
We can also compare the comparative advantage of U.S. multinational
companies, as represented by their worldwide operations, with those of other
U.S. companies and those of foreign companies, described in the earlier
tables.
Relative to non—multinational U.S. firms and to foreign firms,
TJ.S.—based multinationals appear to have had a comparative advantage in
transport equipment and in machinery in 1977 ("best estimates" in Table 4).
Non—multinational U.S. firms had a relative advantage in chemicals, non—U.S.
firms in developed countries in metals, and non—U.S. firms in developing
countries in foods and in other manufacturing.
Between 1966 and 1977, the comparative advantage of U.S. multina-
tionals remained very stable, as mentioned earlier, while that of other U.S.
firms shifted toward machinery and other manufacturing and away from chemicals
and transport equipment. 'oreign firms shifted toward the comparative advan-
tage of U.S. multinationals, particularly foreign firms in developing
countries. In all the cases but one in which the share of their exports in an
industry was substantially above that of the U.S. multinationals in 1977, they
had decreased that share in the previous eleven years and in the cases in
which their share was below that of U.S. multinationals, they had increased

Table 4
Distribution of Exports of U.S. Multinational Firms' Worldwide Operations Compared with
Those of Non-Multinational U.S. Firms and with Foreign Firms
U.S. Multinationals
Other TJ.S. Firms
Other Foreign Firms, Developed
Countries, exci. Canada
Other Foreign Firms, Developing
Countries
U.S. Multinationals
Other U.S. Firms
Other Foreign Firms, Developed
Countries, excl. Canada
Other Foreign Firms, Developing
Countries
ch me ry
Non-
U.S. Multinationals
Other U.S. Firms
Other Foreign Firms, Developed
Countries, exci. Canada
Other Foreign Firms, Developing
Countries
a1i5• parent exports on product basis;
approximation to industry categories.
Sources: Tables 2 and 3 and Appendix Tables A—3 and A—S.
28.8
15.5
13.6
28.4
17.6
25.0
4.1
45.5
Total
Mfg.
Foods Chemicals Metals Total
Elect. Elect.
1966
Transport
Equip.
Other
Mfg.
100.0
100.0
5.7
15.8
13.1
11.8
7.4
7.3
28.8
32.5
28.9
16.1
8.7
23.9
100.0
100.0
13.7
58.9
9.9
2.4
15.8
16.8
20.0
1.5
- 12.1
28.5
V
20.4—21.9
'
1977 Comparable to 1966
100.0
100.0
4.6
15.5
14.0
9.3
6.8
5.5
28.5
37
.5
17.5
11.0
30.4
15.7
5.5
26.9
100.0
10.8
10.1
13.9
23.2
13.8
9.4
16.7
25.3
100.0
43.4
3.9
9.0
7.2
1.9
5.3
2.7
33.9
1977 (Best Estimate)8
100.0
5.3
12.9
6.8
30.7
100.0
8.4
16.6
5.8
27.2
100.0
7.8
12.0
14.5
23.1
14.0
9.2
100.0
25.0
6.3
12.4
8.8
3.0
5.8
foreign countries' exports at best

— 19 -
it. The exception was "other manufacturing" which is a mixture containing a
wide range of industry types.
Shifts in the Geographical Origin of Exports by U.S. Multinationals
Since the comparative advantage of U.S. multinationals remained vir-
tually constant between 1966 and 1977 while those of the parent firms in the
U.S. and of their overseas affiliates each changed, there must have been
shifts in the advantages of production in different geographical locations.
Such changes are reflected in the following data on changes in the sources of
exports by U.S. multinational firms:
Exports from the U.S. by U.S. MultinationalFirms as % of Their Exports from all
Locations, by IndustryExports Classified by Exports ClassifiedIndustry of Parent by Product
1 977
1966 1977 1966 1977
All Mfg. Industries 58.7 47.6 .81 47.9
Foods 48.8 39.5 .81 47.8
Chemicals 64.8 46.1 .71 41.7
Metals 72.0 41.8 .58 41.9
Machinery 60.2 49.7 .83 53.6
Non-Elect. NA 49.7 NA NA
Elect. NA 49.6 NA NA
Transport Equipment 55.1 50.4 .91 47.9
All Other 54.8 44.8 .82 44.7
There was a substantial shift away from the United States in the
sources of U.S. ME's exports. The shift was largest for metals and next for
chemicals, and least for transport equipment. From these data we might infer
that the sharpest decline in comparative advantage for the U.S. as a

- 20 -
geographical entity was in metals, not too surprising given the problems of
both the iron and steel and nonferrous metals industries. The lack of change
in transportation equipment is more surprising, but it probably reflects the
retention of U.S. comparative advantage in the aircraft industry and the very
large trade in motor vehicles and components with Canada. Also, some of the
changes that have attracted public attention may have accelerated after 1977.
The changes in the sources of exports are all measured in percentage
terms. They do not involve actual decreases in the value of exports from the
U.S., but rather slower increases in the U.S. than in foreign countries.
It cannot be inferred that the slower growth in exports from the U.S. was the
result of the more rapid increases abroad; in fact, multinational firms
increased exports from the U.S. more than did the non—multinationals.
Conclusions
The main conclusions of this paper reflect the importance of
distinguishing between the competitiveness and comparative advantages of U.S.
firms and those of the U.S. and other countries as geographical locations for
production. The competitiveness of U.S. firms, as measured by their share in
world exports of manufactured goods, decreased much less than did that of the
U.S. as a geographical entity. The share of U.S. multinationals in world
exports, including exports by all their foreign affiliates, actually
increased. The reasons for the difference are that U.S. multinationals
increased their exports from the U.S. faster than did firms with no overseas
operations and increased exports from their foreign affiliates still more.
Relative to non—multinational U.S. firms and to foreign firms, the
comparative advantage of U.S. multinationals was in transport equipment
and machinery. That of non—multinational U.S. firms was in chemicals, that of
foreign firms in developed countries was in metals, and that of foreign firms

— 21 —
in developing countries was in foods and other manufacturing. While there were
some considerable shifts in the comparative advantages of foreign firms and of
U.S. firms without overseas manufacturing operations, the comparative advan-
tage of U.S. multinational firms hardly changed at all between 1966 and 1977.
Thus, the changes in the comparative advantage of their U.S. operations,
mainly decreases in foods and metals and increases in transport equipment,
reflected the redistribution of the location of their production for export.
The largest shift away from the U.S. as a location for export production was
in the metals industry, followed by chemicals, and the smallest was in
transport equipment.
The comparative advantage of foreign firms, as represented by the
industry distribution of their world—wide exports, converged toward that of
U.S. multinationals. That was particularly the case for foreign firms in
developing countries, shifting away from exports of food and chemical products
and towards machinery.
The implication is that the decline in U.S. shares in world manufac-
tures exports in the late 1960's and 1970's was not, as sometimes alleged, to
be found in deficiencies in American management or declines in American tech-
nological leadership. The share of exports produced under U.S. management —
that is, by U.S. multinational firms operating at home and abroad — actually
increased. The decline in the U.S. share, it may be inferred, reflects a rela-
tive diminution in the advantage of the U.S. as a production location.

— 22 —
References
Kravis, Irving B. and Robert E. Lipsey (1984), "The Diffusion of EconomicGrowth in the World Economy, 1950—1980," in International Comparisonsof Productivity and Causes of the Slowdown, ed. by John W. Kendrick,Ballinger Publishing Co., 1984.
Kuichycky, Ksenia and Robert E. Lipsey (1984), "Host—Country Regulation andOther Determinants of Overseas Operations of U.S. Motor Vehicle and
Parts Companies" NBER Working Paper 1463. September.
Lipsey, Robert E. (1984), "Recent Trends in U.S. Trade and Investment," inNew Problems of Advanced Societies. Third International Symposium.Springer-Verlag, Heidelberg and New York, 1984.
Lipsey, Robert B., Irving B. Kravis, and Linda O'Connor (1983),"Characteristics of U.S. Manufacturing Companies Investing Abroad andtheir Choice of Production Locations," NBER Working Paper No. 1104,.ttpLJ.L.
Lipsey, Robert E., and Irving B. Kravis (1982), "U.S.—Owned Affiliates andHost-Country Exports," NBER Working Paper No. 1037, December.
Organization for European Economic Cooperation (OEEC), (1958), Foreign Trade,OEEC Statistical Bulletins, Series IV, Member Countries Combined, ForeignTrade by Commodity and Area of Origin and Destination, 1957.
________________________________________________ (1959), Foreign Trade,OEEC Statistical Bulletins, Series IV, United States of America, ForeignTrade by Commodity and Area of Origin and Destination, Jan/Sept. andJan./Dec. 1958.
Scott, Bruce R. and George C. Lodge, eds. (1984), U.S. Competitiveness inthe World Economy. Harvard Busines School Press, Boston, MA.
United Nations (1958), Commodity Trade Statistics, Jan.—Dec. 1957, StatisticalPapers, Series D, Vol. VII, No. 4.
______________ (1963), Monthly Bulletin of Statistics, March.
______________ (1965?), Statistical Yearbook, 1963.
______________ (1972a), Monthly Bulletin of Statistics, April.
______________ (l972b), Monthly Bulletin of Statistics, July.
U.S. Department of Commerce (1960), U.S. Business Investments in ForeignCountries, by Samuel Pizer and Frederick Cutter, Office of BusinessEconomics.
__________________________ (1975), U.S. Direct Investment Abroad, 1966,Bureau of Economic Analysis.
__________________________ (1976), Foreign Direct Investment in the UnitedStates, Report to the Congress, Vol. 2: Report of the Secretary ofCommerce: Benchmark Survey, 1974.

— 23 —
__________________________ (1981), U.S. Direct Investment Abroad, 1977,Bureau of Economic Analysis.
__________________________ (1983), Foreign Direct Investment in the UnitedStates, 1980, October.

- 24 —
Table A-i
Estimates of World (rIarket Econosr) Exports of Manufactures1957, 1966, and 1971
(Unit: $ billion)
1957 1966 197Th 1977B
Exports, by Geographical Areaa
1. World (Market Economies) 63.9 132.14 726.1 6114.32. Developed countries 53.0 115.8 617.9 529.23 . U.S. 13.6 21.7 89.14 88.314. Developing countries 10.9 16.6 108.2 85.1
Exports, by Ownership
5. Foreign—owned companies in U.S. 0 0 5.06. All U.S.—owned companies in U.S. 13.6 21.7 814.14
U.S. Multinational enterprises7. Parents from U.S. N.A. 13.6 614.08. Majority—owned aff ii., from host countries 2.9 8.8 59.89. of which, developed 2.8 8.2 51t.3
10. " " , developing 0.1 0.6 5•511. Minority—owned aff ii., from host countries N.A. 1.2 10.612. of which, developed PT.A. 1.1 8.13. " " , developing N.A. .1 2.1i14. Parents and majority—owned affil., total N.A. 22.14 123.815. " ' , developed countries N.A. 21.8 118.316. Parents and all affiliates, total N.A. 23.6 1314.14
17. " " , developed countries N.A. 22.9 126.8U.S.—owned Firms
18. All U.S.—owned firms & majority—ownedaffil., total 16.5 30.5 11414.2
19. of which, developed countries 16.14 29.9 138.720. All U.S.—owned firms and affiliates, total N.A. 31.7 1514.821. All U.S.—owned firms and affiliates,
developed countries N.A. 31.0 1147.2

— 25 —
Notes to Table A—i
aFor 1957, 1966, and 1977A, SITC 0, 1, —8, less 0141_0145. These totalsinclude substantial amounts of non—manufactured products but were thebest approximations that could be made for all three years. For 1977B,we used a better approximation to exports of manufactured goods fromLipsey and Kravis (1982), Table B-i. Both of the 1977 figures werethen corrected by adding exports from Taiwan, from Table A—7.
Line 1: 1977B: Lipsey and Kravis (1982), Table B—i.1966 and 1977A: United Nations (1980), (April 1972), and (July 1972).1957: Line 2 plus line 4•
Line 2: 1966 and 1977A and B: Same as line 1.1957: Data for OEEC imbers, OEEC (1958), Tables 3 and L.
Data for U.S., SITC 0, 1, and 14_8 from OEEC (1959), Table 2,p. 23, with correction of SITC 5 from United Nations (1958),and SITC 0141_OL5 from OEEC (1958).Data for Canada for SITC 0, 1, and I_8 from United Nations(1958) and for SITC 0141—01t5 from OEEC (1958). Data for Japanfrom United Nations (1958). Data for Australia, New Zealand,and South Africa, SITC 0, 1, and 5—8, from United Nations (1965?)and for SITC 4 for Australia and 014l_015 for Australia and SouthAfrica from United Nations (1958).
Line 3: 1966 and l977A and B: Same as line 1.1957: See source for line 2.
Line : 1966 and 1977A and B: Same as line 1.1957: Data for SITC 0, 1, and 5—8 from United Nations (1963), minus a
rough estimate of developing—country exports of SITC 014l0145,from import data in United Nations (1958), pp. 78—81.
Line 5: 1977: Simple average of figures for 1971 ( 1.7 billion), from U.S.Department of Commerce (1976), Table E—7, Columns 3 and 6, andfor 1980 ($ 8.3 billion), from U.S. Department of Commerce(1983), Table G—12, Col. 13.
1957 and 1966: Assumed to be 0 on the assumption that the rate ofgrowth in the years before 197)4 was not far short of the ratebetween 197)4 and 1980.

— 26 —
Notes to Table A—i (cont.
Line 6: Line 3 minus line 5.
Line 7: Table A—2, line 10.
Line 8—10: Lipsey and Kravis (1982), Table B—i.
Line 11: Line 12 plus line 13.
Line 12: Estiited from sales of minority—owned affiliates by assumingthat the ratio of exports to sales was the same in minority—owned affiliates as in n.jority—owned affiliates in the sameindustry and geographical area. Some combinations of areasand/or industries had to be ide because of disclosure problems.Exports from countries for which elements of this calculationwere missing were assumed to bear the same relation to sales asin the covered countries.
Line 13: Estirted from sales of minority—owned affiliates in developingcountries as a group within each industry by assuming that theratio of exports to sales was identical to that of njority—owned affiliates. This method applied to the developedcountries produced a 1977 figure about 50 per cent above theone used for line 12, which was based on a detailed countrybreakdown not available for developing countries. For 1966,however, this method produced a figure 6 per cent below the onefrom the detailed country breakdown.
Line l1: Line 7 plus line 8.
Line 15: Line 7 plus line 9.
Line 16: Line 11 plus line l4.
Line 17: Line 12 plus line 15.
Line 18: Line 6 plus line 8.
Line 19: Line 6 pius line 9.
Line 20: Line 11 plus line 18.
Line 21: Line 12 plus line 19

— 27 —
Table A-2
Estimate of U.S. Manufacturing Parent xports of Their Own Products1966 and 1977
(Unit: $ million)
1 966
5,343
4,958
5,672
8,356
7,960
1 977
Reported byAffiliates Parents
25,769 24,330
23,089
2,492 2,353
2,233
28,260 26,683
25,822
39,194
38,172
65,877
63,994
Line 1, 1977, Reported by parents: Line 5 multiplied by the ratioto Line 5 for data reported by affiliates.
Reported by affiliates: U.S. Department of Commerce (1981),Table II. Ti , p. 185.
1966: U.S. Department of Commerce (1975), Table E—1, p. 82.
Line 2, 1977: Line 1 multiplied by the estimated ratio of exports of ownproducts to exports of all products. Ratio is estimated as .974(Line 8/Line 7) multiplied by .928/.953, the 1966 ratio ofLine 2/Line 1.Line 8/Line 7.
i966: U.S. Department of Commerce (1975), Table E—1, p. 82.
Line 3, 1977, Reported by parents: Line 5 minus Line 1.Line 4, 1977, Line 3 multiplied by the ratio used for Line 2.
of Line 1
By U.S. parents to
1. Majority—owned affil., all prod.
2." " , own prod.
3. Other affil., all prod.
4." " , own prod.
5. All affil., all prod.
6." " , own prod.
7. Unaffiliated foreigners, all prod.
8." " , own prod.
9. All affil. and unaffil. foreigners, all prod.
10." " " I' own prod. 13,632
Sources:

— 2 —
Line 5, 1977, Reported by parents: U.S. Department of Commerce (1981),Table II. Tl, p. 185, Col. 13.
Reported by affilliates: U.S. Department of Commerce (1981),Table II. Ti, p. 185, Col. 3.
Line 6, 1977: Line 2 plus Line 41966: Line 1 imitiplied by the ratio of total sales of all allied
affiliates to total sales of nRjority—ovned affiliates.Line 7, 1977: U.S. Department of Commerce (1981), Table II. Ti,
p. i85, Col. 11.1966: U.S. Department of Commerce (1975), Table E—i, p. 82.
Line 8, 1977: Line 7 multiplied by the ratio for exports to unaffiliatedforeigners of own products to all products, from U.S.
Department of Commerce (1981), Table II. T3, p. 187, Col. 12 & 13.1966: U.S. Department of Commerce (1975), Table E—l, p. 82.
Line 9: Line 5 plus Line 7.Line 10: Line 6 plus Line 8

Table A-3
Industry Distribution of U.S. Exportsa and Exports from the U.S. by
U.S. Multinationals (Parent Firms)
1966 and 1977
(Unit: $ million)
Machinery
U.S.
Parent Firms
by Industry
Other Firms
U.S.
Parent Firms
by Industry
Other Firms
U.S.
Parent Firms
by Product
Other Firms
aThese figures differ
73 (3
,714
.6)
+ 7
11.4
(292.3) + 71
1.5
(514.5).
because they include more
out for the world.
Sources: United Nations (1971), pp. 886—887, and (1981) and Appendix Tables A—2 and A—3.
Exports
Total
Non—
Transport
Other
By
Mfg.
Foods
Chemicals
Metals
Elect.
Elect.
Equip.
Mfrs.
1966
21,7
02
1,850
2,941
1,838
4,740
S
1,89
9'
4,521
3,913
14,274
7,428
677
1,173
2,064
877
1,299
539
4,222
2,417
3,872
649
2,139
1,774
90,642
6,57
3 1977
11,142 Comparable
5,297
to 1966
19,766
9,260
22,001
16,603
63,941
26,701
2,434
4,139
8,666
2,476
3,839
1,458
11,686
8,080
7,34
5 1,
915
20,544
1,457
9,428
7,175
89,669
5,494
11,395
1 977
5,297
19,766
9,260
22,001
16,456
64,751
3,411
7,249
3,854
22,242
18,613
9,382
24,918
2,083
4,146
1,443
6,784
3,388
7,074
slightly from those in Table A—i
complete adjustments for the U.S. than we could carry
bsipc 71 (5,547.2) - 71
1.4
- 71
1.5.
CSTTC 72

— 30 —
Table A-4
Estimate of U.S. Parent Companies' Exports, by Industry of Parent1966 and 1977 on Comparable Basis
Manufacturing Industry Parent Companies(Unit: $ million)
1977, Table II.T1Table F-i
Table II.T3 C1 (1) minus Col. (3)
Sources: U.S. Department of Commerce (1975) and (1981)
Exports to Majority—Owned Affiliates and
Foreignersmade by others
Una f fi 1 ia ted
Products Own ProductsPlus Exports ofOthers' Prod. to
aTotal Total
To UnaffilForeigners Total
Majority—OwnedAffiliates() (2) (3)
1977
(4) (5)
64,963 1,022 63,9412,659 225 2,4348,829 163 8,6664,027 188 3,839
11,831 145 11,6867,378 33 7,34520,649 105 20,5449,590 162 9,428
1 966d
All ManufacturingFoodsChemicalsMetalsNon—Elect. Mach.Elect. Mach.
Transp. Equip.Other Mfg.
All ManufacturingFoodsChemicalsMetalsNon—Elect. Mach.Elect. Mach.
Transp. Equip.Other Mfg.
14,670796
2,0811,346
4,319
3,9202,207
1 ,753
311
192220
296
470
264
39611917
47
97
4868
12,918486
1,8891 , 126
4,023
3,451
1,943
14,274677
2,0641,299
4,222
3,8722,139

Tab
le A
—S
Est
imat
e of
U.S
. Pa
rent
Com
pani
es'
Exp
orts
, by
Pr
oduc
t, 19
77
Man
ufac
turi
ng
Indu
stry
Par
ent
Com
pani
es
(TJn
it: $ m
illio
n)
36
1181
e
2,63
5 3,
535
2,7)
49
13 ,OO4
9,38
3 5,
178
To Majority—
Owned Affil.
by Parents
by Product
214,963
55)4
3,12
6 71
5
8,19
6 8,
789
3,58
3
To Minority—
Owned Affil.
by Industy
of Parent
Total
3,30
4 22
2 58
8 39
0 6)
40
)4 0
2 14
)41
621
6)4,
751
3,)4
11
7,2)49
3,85)4
22,2
142
18,6
13
9,38
2
aTable II.T2, p. 187
bExcludes tobacco mfg.
cTable 111.18, p. 3143
cable II.Tl, p. 185, Col.
(3) minus Col.
(6).
egum
of products shown. Excludes $
2,08
0 million in exports of "Inedible crude
materials exci. fuels" and "Mineral fuels, lubricants, and related iraterials."
um of products shown. Excludes $
153
mill
ion
of items listed in footnote e.
Source: U.S. Department of Commerce (1981)
To Non—Aff 11
.
by Parentsâ
by Product
Industry
Product
All Manufacturing
b
Food & kindred products
Foods, beverages, & tobacco
Chemicals & allied prod.
Chemicals
Primary & fabricated metals
Metal iranufactures
Machinery, excl. electrical
Machinery
Electric & electronic equip.
Transportation equip.
Road Motor Veh.& Parts & Other Transp.Eq.
Other Mfg.
Other !lfrs.
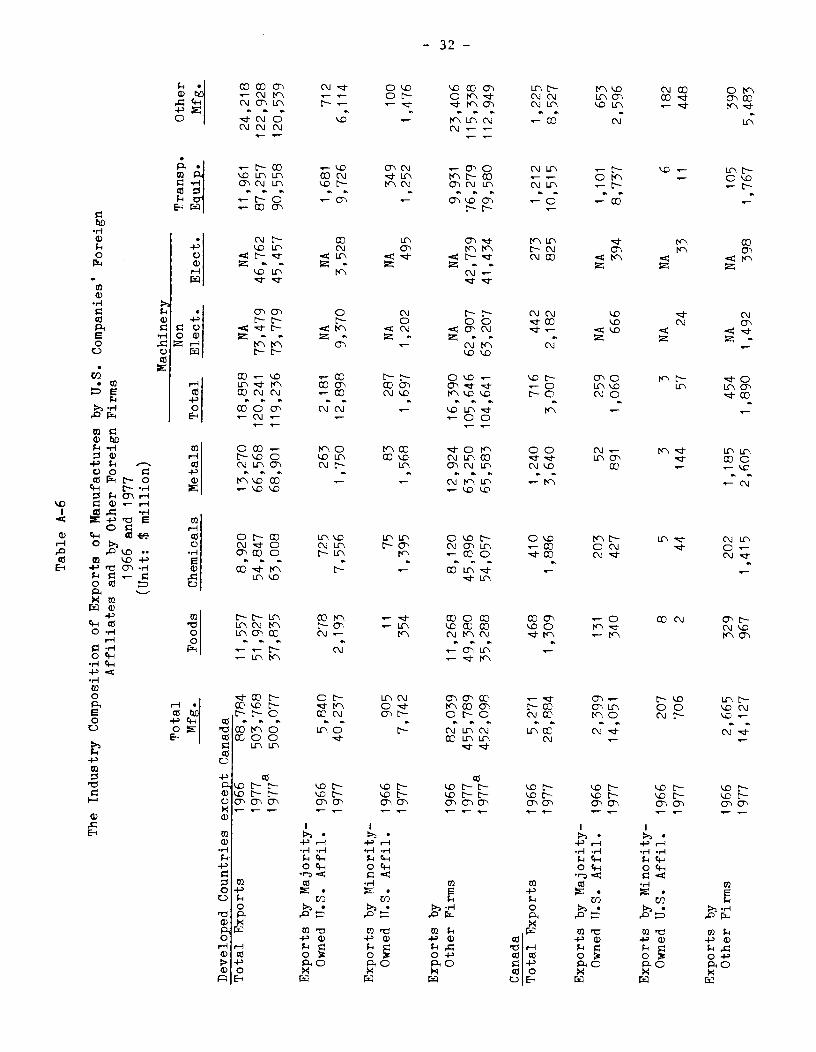
Table A—6
The Industry Composition of Exports of Manufactures by U.S. Companies' Foreign
Affiliates and by Other Foreign Firms
1966 and 1977
(Unit: $ m
illio
n)
Machinery
Total
Non
Transp.
Other
Mfg.
Foods
Chemicals
Metals
Total
Elect.
Elect.
Equip.
Mfg.
Developed Countries except Canada
Total Exports
1966
88,784
11,557
8,920
13,270
18,858
NA
NA
11,961
24,218
1977a
503,768
51,927
54,847
66,5
68
120,241 73,479
46,762
87,257
122,928
1977
500,077
37,835
63,008
68,901
119,236 73,779
45,457
90,558
120,539
Exports by Majority—
Owned U.S. Affil.
1966
5,840
278
725
263
2,181
NA
NA
1,681
712
1977
40,237
2,193
7,556
1,750
12,898
9,370
3,528
9,726
6,114
Exports by inority—
Owned U.S. Affil. 1966
905
11
75
83
287
NA
NA
349
100
1977
7,742
354
1,395
1,568
1,697
1,202
495
1,252
1,476
Exports by
Other Firms
1966
82,039
11,268
8,120
12,924
16,390
NA
NA
9,931
23,406
1977
455,789
49,380
45,896
63,250
105,646 62,907
42,739
76,279
115,338
19778
452,098
35,288
54,057
65,583 104,641 63,207
41,434
79,580
112,949
Canada
Total Exports
1966
5,271
468
410
1,240
716
442
273
1,212
1,225
1977
28,884
1,309
1,886
3,640
3,007
2,182
825
10,515
8,527
Exports by Majority-
Owned U.S. Affil.
1966
2,399
131
203
52
259
NA
NA
1,101
653
1977
14,051
340
427
891
1,060
666
394
8,737
2,596
Exports by Minority-
Owned U.S. Aff ii.
1966
207
8
5
3
3
NA
NA
6
182
1977
706
2
44
144
57
24
33
11
448
Exports by
Other Firms
1966
2,665
329
202
1,185
454
NA
NA
105
390
1977
14,127
967
1,415
2,605
1,890
1,492
398
1,767
5,483

Table A—6 (cont.)
Machinery
Total
Non
Transp.
Other
Mfg.
Foods
Chemicals
Metals
Total
Elect.
Elect.
Equip.
Mfg.
Developing Countries
Total Exports
1966
16,550
9,620
495
2,770
300
NA
NA
3,35
1977
106,813
43,851
4,584
9,887
10,720
2,487
8,233
'3,189
34,5821
1977a
84,469
20,072
5,566
10,491
10,345
2,865
7,480
3,612
35,633
Exports by Majority-
Owned U.S. Affil.
1966
578
257
96
74
49
NA
NA
8
94
1977
5,486
695
464
453
2,797
425
2,372
408
669
Exports by Minority—
Owned U.S. Affil.
1966
110
26
19
33
7 N
A
NA
5
20
1977
2,132
143
253
545
778
133
645
119
294
Exports by
Other Firms
1966
15,862
9,337
380
2,663
244
NA
NA
3,28
1977a
99,195
43,013
3,867
8,889
7,145
1,929
5,216 2,662
33,6f'
1977
76,851
19,234
4,849
9,493
6,770
2,307
4,463
3,135
34,970
Asia other than Japan and Middle East
Total Exports
1966
5,295
2,035
135
502
228
NA
NA
2,j95
1977
58,156
12,420
2,018
4,198
8,353
1,560
6,793
'2,117
28,96O'
1977a
53,320
6,740
2,278
4,668
8,374
1,604
6,770
2,109
29,151
Exports by Majority—
Owned U.S. Affil.
1966
207
56
8—15
66
31
NA
NA
0
39—46
1977
2,921
179
139
69 2150—2197
172
1978—2025
26
311—358
Exports by
Other Firms
1966
5,088
1,979
120—127
436
197
NA
NA
2,349356
1977
55,235
12,241
1,969
4,129 6156—6203 1,388 4768—4815 2,O91
28,6O2—28,649'
1977a
50,399
6,561
2,139
4,599 6177—6224 1,432
4745—4792
2,083
28,793—28,840
Brazil and Mexico
Total Exports
1966
883
331
90
144
51
36
14
14
253
1977
6,774
3,713
474
820
889
514
375
749
1,012
Exports by Majority—
Owned U.S. Affil.
1966
88
34
16
NA
11
NA
NA
NA
NA
1977
1,482
323
112
65
447
177
270
336
199
Exports by
Other Firms
1966
795
297
74
NA
40
NA
NA
NA
NA
1977
6,175
3,390
362
755
442
337
105
413
813
Source: Lipsey and Kravis (1982), Tables B—i through B—7, plus some corrections from later issues of the sources
listed there, estimates for minority—owned affiliates as described in the notes to Table A—i of this paper, and estimates
for Taiwan exports in 1977 as described in Table A-7.

— 34 -
Table A-7
Taiwan: Estimate of 1977 Exports, by Industry
Million $ NT
1980 1977Million $ U.S.
1977
SITC 0 + 1Less non—iafd. and tobacco— Live animals— Coffee, tea, mate, spices— Cereals— Other crude veg. prod.— Tobacco= Mfd. foods
SITC 5+ Man—made fibers
Chemicals
61,3140 141,859
—363—1,1692,1614—9,7814
2714147,586
176,0171145,271
33,1405111,867
22,735
79,991(66,018)(15,181)(50,838)
(10,332)
(2,107.8)(1,739.6)
(14oo.o)
(1,339.6)
(272.3)
SITC 5—8 628,099 301,756 7,951.11
Total Mfd. Prod.a 712,1-155 351,082 9,251.2
asITC 5—8 plus manufactured foods and manmade fibers.
Figures for 1—digit SITC classes, 1977 and 1980 are from StatisticalYearbook of the Repiblic of China 1983, Directorate General of Budget,Accounting & Statistics, Executive Yuan, The Republic of China.
Figures for other items, 1980, are from The Trade of China (TaiwanDistrict), 1980, Chinese Maritime Customs, I. — Statistical Series, No.Statistical Department, Inspectorate General of Customs, Taipei, Taiwan,May 1981, Table 4.
Figures in parentheses for 1977 are estimated from the 1—digit SITCtotals by assuming the same ratios as in 1980.
1,103.0
(14.9)(855.7)
216.14(1439.2)
655.6
(588.7)
17,987+36,1496
514,1483
163,14814146,102
(—187)T32,1473
8,2114(+16,666)
214,880
79,225(22,3141)
SITC 6Base itals and articles
SITC 7Machinery
Non—elect.Elect.
Vehicles
1,