NBER WORKING PAPER SERIES WORLD TRADE …cid.econ.ucdavis.edu/data/undata/NBER-UN_Data... · NBER...
65
NBER WORKING PAPER SERIES WORLD TRADE FLOWS: 1962-2000 Robert C. Feenstra Robert E. Lipsey Haiyan Deng Alyson C. Ma Hengyong Mo Working Paper 11040 http://www.nber.org/papers/w11040 NATIONAL BUREAU OF ECONOMIC RESEARCH 1050 Massachusetts Avenue Cambridge, MA 02138 January 2005 Funding from the National Science Foundation is gratefully acknowledged. The authors thank Harry P. Bowen for providing the data for 1962 to 1983, and Chang Hong and Li Xu for able research assistance. The views expressed herein are those of the author(s) and do not necessarily reflect the views of the National Bureau of Economic Research. © 2005 by Robert C. Feenstra, Robert E. Lipsey, Haiyan Deng, Alyson C. Ma, and Hengyong Mo. All rights reserved. Short sections of text, not to exceed two paragraphs, may be quoted without explicit permission provided that full credit, including © notice, is given to the source.
Transcript of NBER WORKING PAPER SERIES WORLD TRADE …cid.econ.ucdavis.edu/data/undata/NBER-UN_Data... · NBER...

NBER WORKING PAPER SERIES
WORLD TRADE FLOWS: 1962-2000
Robert C. FeenstraRobert E. Lipsey
Haiyan DengAlyson C. MaHengyong Mo
Working Paper 11040http://www.nber.org/papers/w11040
NATIONAL BUREAU OF ECONOMIC RESEARCH1050 Massachusetts Avenue
Cambridge, MA 02138January 2005
Funding from the National Science Foundation is gratefully acknowledged. The authors thank Harry P.Bowen for providing the data for 1962 to 1983, and Chang Hong and Li Xu for able research assistance. Theviews expressed herein are those of the author(s) and do not necessarily reflect the views of the NationalBureau of Economic Research.
© 2005 by Robert C. Feenstra, Robert E. Lipsey, Haiyan Deng, Alyson C. Ma, and Hengyong Mo. All rightsreserved. Short sections of text, not to exceed two paragraphs, may be quoted without explicit permissionprovided that full credit, including © notice, is given to the source.

World Trade Flows: 1962-2000Robert C. Feenstra, Robert E. Lipsey, Haiyan Deng, Alyson C. Ma, and Hengyong MoNBER Working Paper No. 11040January 2005JEL No. F10, F14, C82
ABSTRACT
We document a set of bilateral trade data by commodity for 1962-2000, which is available fromwww.nber.org/data (International Trade Data, NBER-UN world trade data). Users must agree notto resell or distribute the data for 1984-2000. The data are organized by the 4-digit StandardInternational Trade Classification, revision 2, with country codes similar to the United Nationsclassification. This dataset updates the Statistics Canada World Trade Database as described inFeenstra, Lipsey, and Bowen (1997), which was available for years 1970-1992. In that database,Statistics Canada had revised the United Nations trade data, mostly derived from the export side, tofit the Canadian trade classification and in some cases to add data not available from the exportreports. In contrast, in the new NBER-UN dataset we give primacy to the trade flows reported by theimporting country, whenever they are available, assuming that these are more accurate than reportsby the exporters. If the importer report is not available for a country-pair, however, then thecorresponding exporter report is used instead. Corrections and additions are made to the UnitedNations data for trade flows to and from the United States, exports from Hong Kong and China, andimports into many other countries.
Robert C. FeenstraDepartment of EconomicsUniversity of CaliforniaDavis, CA 95616and [email protected]
Robert E. LipseyNational Bureau of Economic Research365 Fifth Avenue, 5th Floor, Suite 5318New York, NY 10016-4309and [email protected]
Haiyan DengConference Board845 3rd AvenueNew York, NY [email protected]
Alyson C. MaSchool of Business Administration 5998 Alcala Park - Olin Hall 205University of San DiegoSan Diego, CA [email protected]
Hengyong MoEconomics DepartmentCUNY Graduate Center365 Fifth AvenueNew York, NY [email protected]
1
1. Introduction
In this paper we document a set of bilateral trade data for 1962-2000, which is available
from www.nber.org/data (International Trade Data, NBER-UN world trade data). Users must
agree not to resell or distribute any of the data for 1984-2000. The data are organized by the
4-digit Standard International Trade Classification, Revision 2, with country codes similar to the
United Nations classification. This dataset updates the Statistics Canada World Trade Database
as described in Feenstra, Lipsey and Bowen (1997), which was available for years 1970-1992.
In that database, Statistics Canada had revised the United Nations trade data, mainly drawn from
export reports, to fit the Canadian trade classification and, in some cases, to add data not
available from reported exports.
In contrast, in the new NBER-UN dataset, we give primacy to the importers’ reports,
whenever they are available, assuming that these are more accurate than reports by the exporter.
If the importer report is not available for a country-pair, however, the corresponding exporter
report is used instead. If the importer’s report is deficient in various ways, exporters’ reports and
other information are used to adjust them. In addition, corrections and additions are made to the
United Nations data for trade flows to and from the United States, exports from Hong Kong and
China, and imports into many other countries, as described herein.
The NBER-UN trade data were constructed from United Nations trade data over two
periods: (i) 1962-1983, the data for which covered all trading partners and were classified by
SITC Rev. 1; (ii) 1984-2000, for which we purchased current UN Comtrade data that covered 72
reporter countries and were classified by SITC Rev. 2 trade flows, provided they exceeded
$100,000 per year. These data also included quantities of exports and imports.1
1 These limits on the amount of data acquired from the UN for 1984-2000 arose from our budget constraint.

2
Data for the early years (1962-1983), are taken from UN data collected at various times
by Robert Lipsey and Harry Bowen for different trade studies. They reflect the UN data bases at
the times of original acquisition, and do not include any subsequent revisions such as may be
included in the current UN Comtrade data base for those years. We converted the SITC Rev. 1
codes to SITC Rev. 2 and also adjusted the country codes, as discussed in section 2. The final
dataset uses the value reported by the importer in the early years, unless that value happens to be
missing, in which case the exporter value is used instead. Information on trade quantities before
1984 was not available.
For the later years (1984-2000), the 72 countries for which import and export data were
obtained from the UN are listed in Table 1. They accounted for 98% of world exports in the last
five years. For these countries, we have used the imports reported to the UN at the SITC Rev. 2
level in the NBER-UN dataset, but made many adjustments as described below. Note that these
imports can come from any country in the world – not just the 72 countries listed above. For the
exports from these 72 countries to a trading partner, we again use the trading partners’ reported
imports provided that the trading partner is included in the above list. When the trading partner
is not included in the above list, however, we instead use the reported exports by the country
above. In this way, there is only a single value reported for a trade flow from one country to
another for each 4-digit SITC Rev. 2 product, which is the value reported by the importer
whenever it is available.
For example, the dataset includes imports to Algeria (the first country listed in Table 1)
from every country in the world, and also exports from Algeria to every country in the world, but
in the latter case we use the trading partners reported imports from Algeria (rather than the
Algerian reported exports) whenever possible. When the two countries are both not included in

3
Table 1: Countries with Reported Trade Data for 1984-2000
Algeria Fm Czechoslovakia (1984-1992)*
Kuwait* Russian Federation (1992-2000)*
Angola Fm Fed Germany (1984-1990)
Libya South Afr. Cus. Union (1984-1999)
Argentina Fm USSR (1984-1991) Luxemburg (1999-2000)
Saudi Arabia*
Australia Fm Yugoslavia (1984-1991) Malaysia Singapore Austria France Mexico* Slovakia Belgium (1999-2000) Germany (1991-2000) Morocco Slovenia Belgium-Luxembourg (1984-1998)
Greece Netherlands South Africa (2000)*
Brazil Hong Kong** New Zealand Spain Bulgaria Hungary Nigeria Sweden Canada India Norway Switzerland Chile Indonesia Oman Thailand China Iran Pakistan Tunisia Colombia Ireland Peru Turkey* Czech Republic (1993-2000) Israel Philippines United Kingdom Denmark Italy Poland United Arab Emirates* Dominican Republic Japan Portugal USA Ecuador Kazakhstan (1992-2000) Qatar Venezuela Finland Korea Republic Romania Vietnam
* Missing import data: Fm Czechoslovakia (1991,1992); Kuwait (1984-86, 2000); Mexico (1984-1985); Saudi Arabia (1997); Turkey (1984); Russian Federation (1992-1995); South Afr. Cus. Union (1986-1991); United Arab Emirates (1987, 1994-1998, 2000) ** Referred to as China Hong Kong Special Administrative Region (China HK SAR).
Table 1, however, the trade flows for 1984-2000 are entirely missing from the dataset. In
addition, there were some instances of trade flows for countries that are listed in Table 1 but
were not available from the UN for unknown reasons. We adjusted for this when the United
States was a trading partner by merging the UN data with the U.S. imports and exports reported
in Feenstra (1996, 1997) and Feenstra, Romalis, and Schott (2002). In particular, we assumed
that the trade values in the U.S. trade database were always more accurate than those in the UN
database, and so we used the former to replace the latter, as discussed in section 3.
For the later years (1984-2000) the dataset excludes trade flows at the 4-digit SITC Rev.
2 level when they are less than $100,000 per year. Some adjustment has been made for these

4
“low-valued” trade flows, however, by comparing the 4-digit trade flows with those at higher
levels of aggregation. For example, if the imports or exports between two countries are summed
across all for 4-digit categories within SITC 111 (non-alcoholic beverages), and that total is less
than the trade flow for the 3-digit category SITC 111, then we create an “artificial” 4-digit
category called 111A or 111X which includes the “additional” trade reported at the 3-digit SITC
level but not the 4-digit SITC level.2 In this way, we are able to capture some of the low-valued
trade flows within the artificial categories ending in A or X.3 This procedure is described in
more detail in section 4.
A final set of adjustments to the UN data concerns specific countries where we know that
the UN values are inaccurate. As described in section 5, we have painstakingly checked the
4-digit SITC trade values against other auxiliary data for specific countries, and corrected a
number of inconsistencies in the UN data and added other data. The countries with corrections
and additions include: Australia, Austria, Belgium, Canada, China, Czech Republic (1993 -
2000), Denmark, Former Czechoslovakia (1984- 1992), Former German Federal Republic
(1984-1990), France, Germany (1991-2000), Hungary, India, Ireland, Israel, Italy, Japan, Korea,
Kuwait, Malaysia, Mexico, Netherlands, Poland, Russian Fed, Saudi Arabia, Singapore, South
Africa, Spain, Sweden, Switzerland, Taiwan, Thailand, Turkey, United Arab Emirates, and the
United Kingdom. The resulting data (in SAS or STATA format) are stored as:
WTF??.SAS7DBAT, where ?? = 62, 63,…,00 (30 – 70 megabytes in size)
WTF??.DTA (for STATA), where ?? = 62, 63,…,00 (30 – 70 megabytes in size)
2 111A indicates that there are no imports or exports at all between the two countries in 4-digit SITC categories within 111, so that 111A is the “aggregate” 3-digit import or export value. Conversely, 111X indicates that there is already some other 4-digit SITC category within 111 that has reported trade, so that 111X is the “extra” trade unreported at the 4-digit level. 3 These artificial SITC categories also occurred within the Statistics Canada World Trade Database, described in Feenstra, Lipsey, and Bowen (1997).

5
Second, for the years 1988-2000 we make adjustments for the exports of China versus
Hong Kong. Because Chinese goods are often re-exported through Hong Kong, some trading
partners (such as the United States) attribute the full value of such goods to China.4 This ignores,
however, the markup on these goods as they pass through Hong Kong, which should more
accurately be treated as an (service) export by Hong Kong. Using an auxiliary dataset on Hong
Kong trade, we have estimated the markups on Chinese goods as they pass through Hong Kong
en-route to each destination country. With these markups, we attribute a portion of the trading
partners imports from China as an import from Hong Kong instead, i.e., we raise the import
value from Hong Kong and lower the import value from China by the same amount. This
procedure is discussed in section 6, and the revised data of bilateral trade with either Hong Kong
or China as the exporter is stored as:
CHINA_HK??.SAS7DBAT, where ?? = 88, 89,…,00 (3 – 5 megabytes in size)
CHINA_HK??. DTA (for STATA), where ?? = 88, 89,…,00 (3 – 5 megabytes in size)
A data file of the bilateral trade flows (summed across SITC commodities) is also
available at WTF_BILAT.SAS7DBAT and WTF_BILAT.DTA. Section 7 provides further
documentation and the Appendixes to this paper describe the country codes, SITC conversions
and other features of the NBER-UN trade data.
2. Description of the United Nations Trade Data
2.1 Country Names and Code The United Nations trade data lists countries according to their 5-digit Standard
Classification of Customs Areas and Territories. We have adapted the UN country names and
codes to match the 6-digit classification complied in the World Trade Database by Statistics
4 See Feenstra, Hai, Woo, and Yao (1999).
6
Canada, as reported in Feenstra, Lipsey, and Bowen (1997). Thus, the country codes used in the
earlier dataset over 1970-1992, and the country codes used in this new dataset over 1962-2000,
are essentially the same. The complete list of the modified UN country codes (henceforth called
the NBER-UN country codes) is given in Appendix A, with the accompanying notes presented in
Appendix B. Note in particular that the NBER-UN country code for Taiwan is ‘454900’. This
code corresponds to the UN country code of ‘458960’ and the UN country description of ‘Asia
Othr. NS’, so we are imputing Taiwan trade from that classified as ‘Asia other not specified’ by
the United Nations.
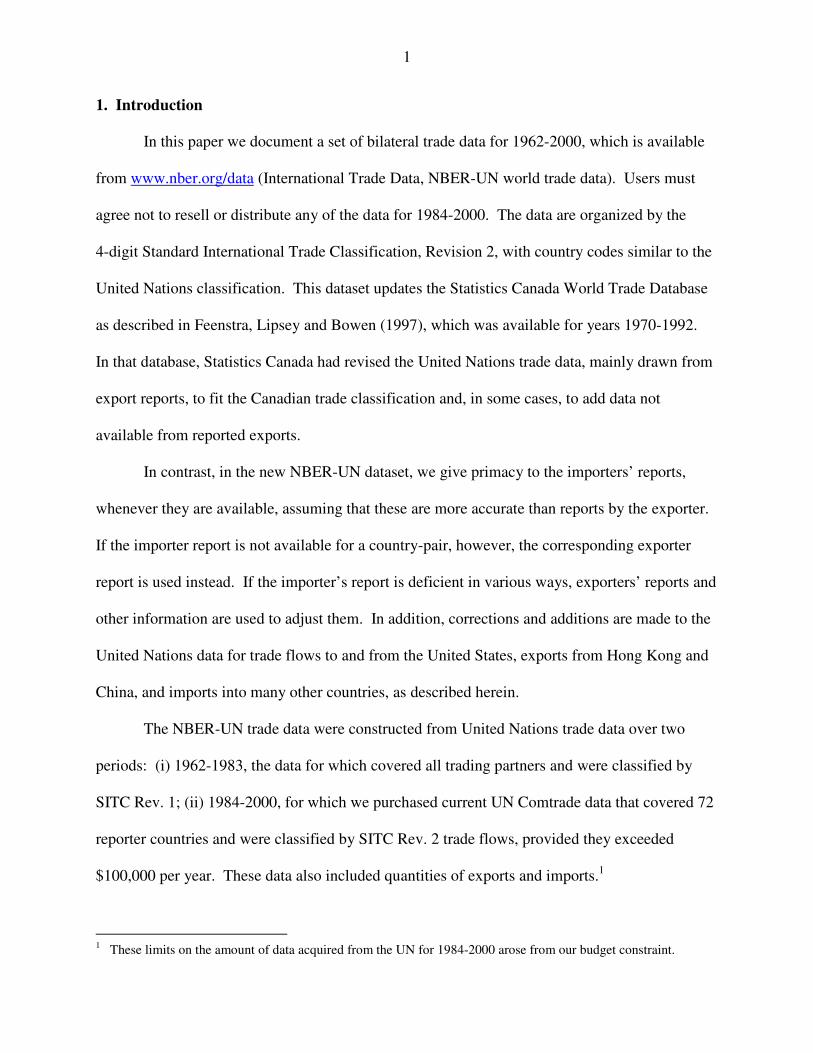
2.2 SITC Classification
The commodities in the UN trade data are classified by the 4-digit Standard International
Trade Classification, Revision 2 (SITC Rev.2). Changes were made to countries for which the
original data were classified in SITC Rev.1. That was the case for all countries before 1984.
Table 2 lists the countries originally classified by SITC Rev.1, by year and direction of trade
(DOT=1 for importer report, and DOT=2 for exporter report).
Table 2: UN Countries with SITC Rev.1
Country Name
Country Code
Year DOT = 1 Importer
DOT = 2 Exporter
Dominican Republic 352140 1988 X Mexico 334840 1984-1985 X X Turkey 447920 1984 X Former Yugoslavia 598900 1984-1990 X X All countries - 1962-1983 X X
Note: DOT = Direction of reported trade
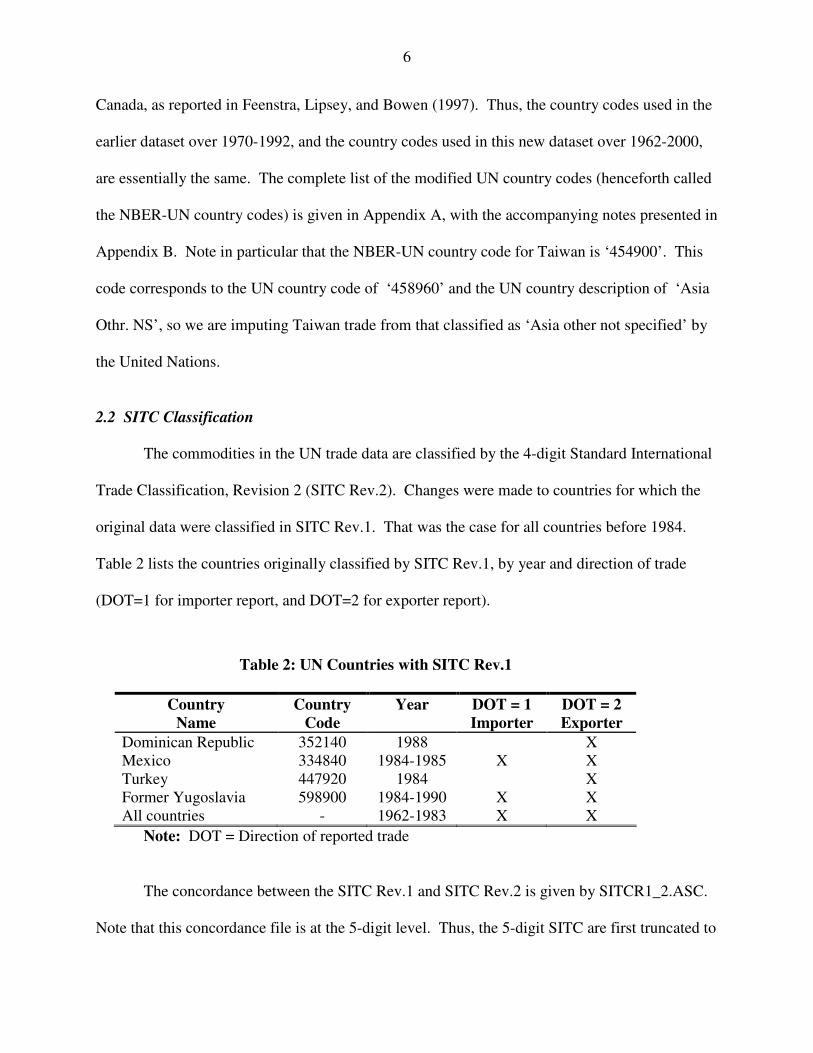
The concordance between the SITC Rev.1 and SITC Rev.2 is given by SITCR1_2.ASC.
Note that this concordance file is at the 5-digit level. Thus, the 5-digit SITC are first truncated to

7
the 4-digit level. Then the 4-digit SITC Rev.1 (truncated 5-digit SITC Rev.1) are matched with
corresponding 4-digit SITC Rev.2 using the maximum count of the SITC Rev.2 frequency. In a
tie, the maximum is given by the first corresponding 4-digit SITC Rev.2 listed numerically.
This method used for the concordance is described by the example given in Table 3,
where columns (1) and (2) list the 5-digit SITC Rev.1 and SITC Rev.2, respectively. Columns (3)
and (4) give the corresponding 4-digit level for SITC Rev.1 and SITC Rev.2, respectively. The
frequency count of the 4-digit SITC Revision 2 is presented in column (5) and the matching 4-
digit SITC Rev.2 used in the concordance is shown in column (6).
Starting with the first set of numbers, SITC 0320 from Rev.1 corresponds to both SITC
Rev.2 0371 and 0372. The frequency count for each of the SITC Rev.2 is one; therefore, SITC
Rev.2 0371 is selected as the match for SITC Rev.1 0320 since it is listed numerically first. In
the next set of numbers, SITC Rev.1 0520 is matched with SITC Rev.2 0579 since this SITC has
the highest count in the correspondence between the two revisions.
3. Merging with the U.S. Trade Data
As noted in section 1, there were some instances of trade flows for countries that are
listed in Table 1 but were not available from the UN for unknown reasons. This included a
number of cases of trade with the United States, in particular. To offset this, we have merged
U.S. imports and exports with the UN trade data. The U.S. trade dataset described in detail in
Feenstra (1996, 1997) and Feenstra, Romalis, and Schott (2002) is available at the 5-digit SITC
Rev.2 level, and includes import and export values but not quantities.5 By aggregating to the 4-
5 As discussed in Feenstra, Romalis, and Schott (2002), the U.S. imports are “imports for consumptions” for 1972-1988 and “general imports” for 1989-2000. “General imports” consist of foreign merchandise that leaves the dock and immediately enter consumption channels, bonded warehouses, or foreign trade zones. In contrast, foreign merchandise cleared through customs for intermediate consumption reflects “imports for consumption.” These include merchandise coming from U.S. foreign trade zones and withdrawals from bonded warehouses for
8
Table 3: SITC Rev.1 and SITC Rev.2 Concordance
5-SITCRev.1
5-SITCRev.2
4-SITCRev.1
4-SITCRev.2
4-SITCRev.2 FreqCount
4-SITCRev.2 Match
(1) (2) (3) (4) (5) (6)
03201 03710 0320 0371 1 0371 03202 03720 0320 0372 1 0371
05201 05796 0520 0579 2 0579 05202 05760 0520 0576 1 0579 05203 05752 0520 0575 1 0579 05209 05799 0520 0579 0579
26621 26650 2262 2265 1 2265 26622 26660 2262 2266 1 2265 26623 26670 2262 2267 1 2265
27311 27311 2731 2731 3 2731 27311 27311 2731 2731 3 2731 27313 27313 2731 2731 2731
27610 27896 2761 2789 1 2789
digit SITC level, we have used this data to replace all trade values in the UN data over 1972-
2000 when the trading partner is the United States.6 The use of the U.S. values to replace the UN
values can be expected to improve the quality of the trade data in most cases. To merge these
datasets, changes were made to a few U.S. country names and codes to match the NBER-UN
classification, as listed in Table 4.
Table 4: U.S. Country Names and Codes Modification
U.S. Data NBER-UN data Code Name Code Name Full US description 368961 Puerto Rico 218400 USA Puerto Rico 999990 Int_Org 999990 Int Org International Organization 999991 All_Cty 100000 World All Countries
consumption. For all years, the U.S. import data are on a c.i.f. basis, and include the costs of all freight, insurance and other charges (excluding import duties) incurred in transporting the merchandise from the port of exportation to the first port of entry in the United States. 6 Values less than one thousand dollars in the U.S. trade dataset are omitted. Note that the quantities in the UN data (if available) were not adjusted or replaced.
9
4. Adjusting the UN Data at Differing Levels of Aggregation: A and X codes for 1984-2000
Ideally, the sum of the value of imports or exports at a disaggregate SITC level should
equal to the value of that trade flow at a higher aggregate SITC level. For example, the sum of
the value of imports at the 4-digit SITC level should equal to the value of imports for the
corresponding 3-digit SITC level, while the sum of the value of imports at the 3-digit SITC level
should equal the value of imports for the corresponding 2-digit SITC level, etc. However, this is
not the case in our UN data, for several reasons. First, countries may not report the detailed 4-
digit SITC data to the UN, whereas they do include these trade flows in their 3-digit or 2-digit
reports. Second, for the years 1984-2000, the data that we acquired from the UN only included
the 4-digit imports or exports if they exceeded $100,000. But the same dollar lower-limit was
applied at the 3- or 2-digit level, so there will be trade flows reported in the 3 and 2-digit level
that are excluded from the 4-digit data. To resolve this, two sets of codes are created at the
disaggregate SITC level: the “A” and the “X” codes.
The first set of codes deals with the case in which the value of imports or exports at the
disaggregate SITC level is available but does not equal to the value at the higher aggregate SITC
level. As an example, suppose the value of imports is reported for SITC 4441 and 4442 as $100
million and $50 million, respectively giving a sum of $150 million for SITC 444, but the
reported value of import for SITC 444 is $200 million. To deal with such a case, an additional
SITC is created which combines the beginning of the 3-digit SITC with an ending of X (444X)
and its value equals the difference between the reported value and the sum of the values of
imports at the 4-digit SITC (50). This residual category represents “extra” trade. Thus, 444X
represents extra trade in the 3-digit SITC group 444, 44XX represents extra trade in the 2-digit
SITC group 44, and 4XXX represents extra trade in the 1-digit SITC group 4.
10
The second set of codes deals with the case in which there are no imports or exports
reported at the disaggregate SITC level, but there is such a value at the higher aggregate SITC
level. As an example, suppose the value of imports is reported as $200 million for SITC 444, but
there are no corresponding four-digit SITC with leading numbers of 444. To deal with such a
case, an additional SITC is created which combines the beginning of the 3-digit SITC with an
ending of A (444A) and is given a value equal to the value of import at the 3-digit SITC level
(200). This residual category represents “aggregate” imports or exports in SITC 444. (Having a
double “AA” or triple “AAA” ending would occur rarely if at all).
The A and X codes are not used for the adjusted SITC codes of the 35 countries for
which specific corrections and adjustments were made, as described in Section 5.
5. Corrections and Additions to Individual Countries’ Data
Countries were selected for adjustment of the UN data for 1984-2000 on several grounds.
Aside from China, Hong Kong, and the United States, which are discussed separately, two
criteria were used, and the country’s data were adjusted if either one was met. One was that the
sum of imports in all 4-digit SITC subgroups fell short of the aggregate imports from the world
by $US 1 billion in any year. The other was that the country reported imports from unidentified
partners of more than $US 1 billion in any year. About half of the countries in the UN data set
met one of the two criteria and their data were therefore subject to adjustment.
5.1 Australian Imports Australia reported some imports at only the 3-digit SITC level. Partner totals are quite
complete, except in 1990. At the 4-digit SITC level, but not the 3-digit level, there are
substantial imports reported from unidentified partners, “Special categories”, 90939, and “Not
specified,” 90899, as well as “Europe, n.e.s”., 90838.
11
Of the imports reported at only the 3-digit group level, more than half the items were
allocated to 4-digit subgroups by the distribution of partner exports to Australia in the same years.
Most of the rest of the 3-digit groups were allocated by the distribution of Australia’s imports
from the same partners in nearby years. The last few 3-digit groups were allocated using the
average distribution among the partners reporting at the 4-digit level in the same years.
Imports from unidentified partners under SITC 5225, “Other inorganic bases and metallic
oxides,” in all years except 1988 to 1992 were attributed to the United States, Japan, and Saudi
Arabia on the basis of export distributions. Imports from unidentified partners under SITC 7611,
“Television receivers,” were allocated to Singapore and Japan in 1984-1987 and 1993-1994, to
Singapore, Japan, and the United Kingdom in 1995-96, and to Singapore in 1997-2000, all on the
basis of partner exports to Australia. Imports of SITC 334, “Petroleum products,” in 1993-2000
were allocated to Kuwait, Oman, Qatar, Saudi Arabia, and the UAE according to the reported
distribution of exports. Imports of SITC 6412, “Printing paper,” were allocated to Indonesia and
South Korea.
In 1993-98 and 2000, reported total imports from identified partners were nearly equal to
reported aggregate imports, but at the SITC 4-digit level there were large imports reported from
unidentified partners. These were allocated to Australia’s partners in proportion to the difference
between each partner’s reported total of 4-digit imports into Australia, and the reported total
imports from that partner. These allocation to each partner were then distributed across 4-digit
subgroups in proportion to reported 4-digit imports. For 1984-92 and 1999, imports from
unidentified partners were distributed among identified partners in proportion to identified
imports. The missing imports in 1990 were also allocated to partners and SITC subgroups in
proportion to imports from identified partners.

12
5.2 Austrian imports
From 1984 through 1996, many items were reported in Austrian data only at the 3-digit
level. In addition, there were large imports from unidentified partners in 1995, mostly in SITC
3414, “Petroleum gases.” There were almost 2000 SITC by partner import combinations
reported at the 3-digit level. Almost half of them were distributed to 4-digit subgroups according
to the distribution of exports to Austria reported by the same partners for the same years. Most
of the others were allocated according to the distribution of imports from the same partners in
nearby years. The last set was allocated according to the 4-digit distribution within 3-digit
groups of imports from all partners combined.
Imports of SITC 3414 from unidentified partners in 1995 were allocated to the Russian
Federation, the main source in other years. For several items, imports were reported only from
unidentified partners in 1995. The partner distributions for the average of 1994 and 1996, where
available, were used to allocate these to partners in 1995. For other items, 1993 partner imports
were used for the allocation. Imports from unidentified partners of unidentified SITCs were
distributed proportionately to all identified partners and SITCs.
5.3 Belgian imports
Imports into Belgium in UN data include many items reported at the 3- digit SITC level
and some reported from unidentified partners.
Most of the imports reported at the 3-digit level were allocated to 4-digit SITC subgroups
on the basis of exports to Belgium by the same partners in the same years. Almost all the
remaining 3-digit SITC groups were allocated to 4-digit subgroups on the basis of imports from
the same partners in the closest year. One last group was allocated to subgroups on the basis of
imports from all partners in the same years.

13
Imports from unidentified partners were distributed to identified partners in proportion to
their shares of each SITC. Imports not identified by partner or SITC were distributed to partners
and SITCs in proportion to identified imports.
5.4 Canadian imports
The major problem with Canadian import data is large imports from unidentified partners,
under the headings, “Special Categories” and “Free Zones.” A smaller problem is that some
imports are reported at only the 3-digit level. Of the imports from unidentified partners, about
half were “Special Transactions,” which provided no basis for allocation by partner or SITC.
These imports were dropped from the data set. Imports from unidentified partners in identified
SITC subgroups were allocated proportionately to identified partners in most cases.
Imports of motor cars (SITC 7810) listed as from Caribbean n.e.s. were reallocated to
Korea, since that country was omitted as an import partner for this SITC and the values matched
Korea’s reported exports closely. Oil imports from Caribbean, n.e.s. were allocated to Trinidad.
The imports reported at only the 3-digit SITC level were divided into 4-digit subgroups on the
basis of reported exports to Canada by the same partner in the same year in most cases, by the
same partner in a nearby year in some cases, and by all partners in the same year in two cases.
5.5 China imports
In the UN data, China records imports from their own trade zones differently from those
imported from another country. In 1984-1986 there are large imports from a partner called "Not
Specified" and in 1985 and 1986 from a partner called "Special Categories." The latter item is
$14 to 17 billion, and is available by 4-digit SITC. From 1996 to 2000 there are imports from a
partner called "Free Zones" ranging from $1 to 7 billion. The early imports are mainly iron and
steel products while the later imports are mainly computer and electrical machinery parts.

14
To account for China’s import from itself, the trade value is recalculated if the reporting
country is China (ICode = 481560) and the partner country is characterized as either the “Free
Zones” (ECode = 908380) or “Special Categories” (ECode = 908390) or “Areas NES” (ECode =
908990). The new partner countries are respectively given the names of China FTZ (ECode =
481561), China SC (ECode = 481562), and China NES (Ecode = 481563). The value and
quantity corresponding to the newly created China FTZ (China SC or China NES) is subtracted
from Areas NES (Special Categories or Areas NES, respectively) by SITC to prevent double
counting. An example of the adjustment made to the UN import data is given in Appendix C.
5.6 Czech Republic imports The main problems of Czech Republic import data are imports from unidentified partners
53492 (European Union n.e.s.) in 1996 and 90899 (Not specified) in 1996-99, particularly 1996.
The imports from 53492 in each SITC subgroup were distributed to EU countries in proportion
to positive amounts of (reported exports minus reported imports). For seven subgroups where
this allocation was not possible, the imports were distributed in proportion to reported imports.
Imports from 90899 in each SITC subgroup were distributed to partners in proportion to
reported imports in that group. For seven subgroups with no partner data reported for imports,
the import totals reported under 90899 were distributed to partners by the distribution of exports
reported by partners. For three small subgroups, no partner distribution was available, and these
import records were discarded.
5.7 Danish imports
Demark reports imports under the 3-digit SITC code 334 and imports from unidentified
partners, both within the European Union and in the world as a whole. Imports of the 191 cases
reported at the 3-digit SITC group level were first allocated to the 4-digit subgroup level by the
15
4-digit distribution of the same partners’ exports to Denmark in the same year. This method
accounted for more than half the cases. The remaining cases were dealt with mainly by using the
4-digit distributions of imports from the same partners in nearby years. For the 14 remaining
cases, the 4-digit distributions from all reporting and estimated partners was used.
The imports reported to be from “European Union, n.e.s.” in each SITC subgroup were
allocated to European Union members in proportion to Denmark’s reported imports from each
EU member in that SITC and year. Imports from unidentified partners were classified as either
“Special categories” (90837) or “Not specified” (90899). Imports in both these categories under
SITC 3222 were distributed to actual partners in proportion to the differences between reported
imports and reported exports for each partner in each year. For other identified SITCs, imports
from unidentified partners were allocated to identified partners in proportion to their shares of
each SITC. Imports not identified by SITC were allocated to actual partners and SITCs in
proportion to Denmark’s reported imports.
5.8 Former Czechoslovakia imports
Data for the former Czechoslovakia suffer from several major defects. One is that the
data for 1989-90 are reported in SITC Revision 3, rather than SITC Revision 2. A second is that
4-digit data are seriously incomplete, and even 3-digit data and, for some years, 2-digit data, do
not cover all imports. Furthermore, large imports are reported from unidentified partners, and
imports were hardly reported at all in 1991 and 1992. Since the reported partner totals added up
almost completely to Czechoslovakia’s reported imports from the world from 1984 to1990,
imports from unidentified partners must have been duplicated and were dropped from the data
set.

16
Imports reported at the 4-digit level of SITC Revision 3 in 1989 and 1990 were translated
to SITC Revision 2 using a concordance between 5-digit SITC Revision 3 and 4-digit SITC
Revision 2. In cases where the 5-digit items in a 4-digit Revision 3 subgroup matched more
than one 4-digit SITC Revision 2 subgroup, the 4-digit Revision 3 subgroup was matched to the
4-digit SITC Revision 2 subgroup with the largest number of 5-digit SITC Revision 3 items.
For 1992, no import data by commodity or even by partner were available. The UN
Yearbook of International Trade Statistics and the IFS Yearbooks did not even report aggregate
imports. The aggregate import total we used was from United Nations (1995). Partner import
totals for 1991 were taken from United Nations (1994). Partner import totals for 1992 were
estimated from import distributions by partner interpolated between1991 and 1993. Reported
imports for the Czech Republic and Slovakia, combined, in 1993, with trade between the two
countries eliminated, were used to estimate the distribution of imports into former
Czechoslovakia from each partner in that year. For imports from the former USSR (1991) and
the Russian Federation (1992), the SITC distribution of Czech imports from the Russian
Federation in 1993 was applied to the import totals for 1991 and 1992.
For partner countries for which over 80 per cent of estimated Czech imports were
covered by reported exports to Czechoslovakia, the export data were scaled to match the
estimated imports. For partner countries with data on exports to Czechoslovakia but missing
estimated Czech partner import totals in 1991 and 1992, aggregate Czech imports were first
estimated by subtracting total estimated imports from identified partners from the aggregate
estimated imports, to arrive at imports from unidentified partners. Then, that total was allocated
to this set of partner countries in proportion to their reported total exports to former
Czechoslovakia. The distributions of Czechoslovakia’s imports from each country, by 4-digit

17
SITC, were then estimated by using the reported export distributions.
The remaining partners were those with aggregate data on exports to Czechoslovakia,
but no data on commodity distributions, and those for which their reported exports to
Czechoslovakia fell short of covering 80 per cent of estimated imports. For these, the Czech
import distributions by 4-digit SITC subgroups were estimated from Czech import distributions
from the same countries in the nearest years.
Imports reported at only the 1-, 2-, or 3-digit level were a substantial part of the totals in
1984-1990. There were almost 11,000 such country by commodity combinations. Almost half
of these were allocated to 4-digit subgroups by distributions of exports from the same countries
in the same years. Most of the rest of them were allocated using distributions of imports from
the same countries in nearby years. After that procedure, there were still over 2,500 country by
commodity pairs not allocated to 4-digit subgroups. 225 country by commodity combinations
were at the 1- or 2-digit level and almost half of these could first be assigned to 3-digit groups
using distributions for the same countries in nearby years. 17 SITC 1-digit by country
combinations seemed to have no obvious methods to distribute them and were discarded from
the data set since they the amounts of trade involved were small. Almost all the remaining
aggregated SITC Division and Group data were allocated to 4-digit subgroups by using the
distributions for all reporting countries in the same years.
5.9 Former Federal Republic of Germany imports, 1984-1990
Aggregate partner totals for the Federal Republic of Germany are essentially complete,
but at the 4-digit SITC level, large amounts of imports were attributed to unidentified partners
(90839, Special Categories). These had to be distributed to identified partners, as far as possible.

18
One SITC subgroup with the largest imports unidentified by partner is SITC 3414. In
1984 to 1987, all imports in this subgroup were reported under partner 90839 (Special
Categories). German imports from Denmark, France, the Netherlands, the United Kingdom, and
Norway (1984-85) were taken from those countries’ reported exports to Germany. Imports from
Norway (1986-87) were taken to be the difference between the reported partner total for Norway
and the aggregate of reported 4-digit imports from Norway, which was smaller than the reported
value of exports from Norway to the Federal Republic under SITC 3414. The remainder of
imports under 90839 were assigned to the Former USSR.
For 1988 to 1990, partner imports from Denmark were reported and used, as were exports
to the Federal Republic by France, Italy, the Netherlands, and Norway. The remaining imports
from unidentified partners were added to the imports reported from the USSR.
For subgroup 7929, “Parts of aircraft falling within SITC 792,” no imports were reported
from identified partners in 1984 and 1985. Reported partner exports to the FRG in 1985 came
fairly close to the total reported imports, and the remaining imports were assigned to France, for
which reported exports fell far short of reported imports in later years. In 1984, the United States
did not report exports to the FRG, and FRG imports were assumed to be identical to those of
1985. The remaining unidentified imports were assigned to France.
For other years and SITC subgroups, the imports reported in SITC Section 9, the imports
from unidentified partners, other than those already distributed to partners in SITC subgroups
3414 and 7929, were distributed to partners in proportion to the differences between the total of
4-digit total imports from each identified partner and total imports from each partner. They
were then allocated to 4-digit subgroups in proportion to the estimated distribution of imports at
the 4-digit subgroup level.

19
5.10 French imports
French import data include large amounts of imports from unidentified partners, usually
more than $3 billion and sometimes over $4 billion. In addition, imports as large as almost $4
billion are reported at the 3-digit SITC level.
There were also more than 700 SITC by partner entries that were reported only at the 3-
digit SITC level. More than two thirds of these were allocated to 4-digit SITC subgroups by the
distribution of exports to France reported by the same partners in the same years. All but a few
of the remaining 3-digit groups were allocated to 4-digit subgroups in proportion to imports from
the same partners in nearby years, and the last few were allocated by the distribution of imports
from the world in each 4-digit group in each year.
Imports from unidentified partners were reported under 90838 (Free Zones), 90839
(Special Categories), and 90899 (Not Specified). In all the 4-digit subgroups other than SITC
5241, export data were used to allocate imports from unidentified partners. In cases where
reported exports exceeded reported imports, imports from unidentified partners were allocated to
identified partners in proportion to the differences between reported exports and reported imports.
In cases where reported exports did not exceed reported imports, the imports from unidentified
partners were allocated to identified partners in proportion to reported imports.
In SITC 5241 (Fissile chemical elements and isotopes; other radio-active chemical
elements and radio-active isotopes; and related products), reported export values were substituted
for reported import values in all cases where reported exports were larger. The remainder of the
imports from unidentified partners in this subgroup were allocated to Niger. Niger was the
largest reported source in most years but reported small exports in 1996 and 1997, when there
were large reported French imports from unspecified partners.

20
5.11 German imports, 1991-2000
The two main problems with German import data are the reporting at a level more
aggregated than 4-digit SITC and reporting of imports from unidentified partners at the 4-digit
level, but not in the aggregate to any large extent.
More than half of the SITC-partner combinations reported at levels of aggregation above
the 4-digit level, of which there were over 12,000, were allocated to the 4-digit level by using the
4-digit distributions of foreign partners’ exports to Germany in each year. Almost all the rest
were allocated by using the distributions reported in nearby years for the same countries.
Of the 143 remaining combinations, about half, all at the 3-digit level, were estimated by
using the distribution across all countries in each year. Imports reported at only the 1-digit
Division level were small, and were dropped from the data set.
Imports under 90839 (Special categories) were dropped in 1991-97 and 2000, since they
were duplicated by imports from identified partners at a level more aggregated than 4-digit SITC.
However, most of these imports from identified partners were in SITC Division 9, with no
commodity breakdown. In 1998 and 1999, imports under 90839, except for those in Division 9,
were allocated to partners in proportion to the distribution of positive values of (reported exports-
reported imports) in each SITC subgroup. After that, imports under 90839 in Division 9 were
distributed to identified partners according to the SITC Division 9 distributions in 1997 and 2000
respectively. Finally, imports under SITC Division 9 in 1991-2000 were allocated to partners in
proportion to the distribution of positive values of (reported exports – reported imports) in each
SITC subgroup. Imports categorized as 90837 (Bunkers) and 90899 (Not specified) were
dropped from the data set since none of these was large, and there was little basis for allocating
them to partners.

21
5.12 Hungarian imports
Before 1991, most of Hungary’s imports were reported at only the 2-digit DITC Division
level. In addition, some imports, in fairly small amounts, were reported as coming from
unidentified partners or unidentified European partners. The imports from partner Europe, other,
n.e.s., partner 57568, were allocated to European countries in general, in proportion to Hungary’s
imports from them, since the European countries not listed could not account for the imports.
Imports from unidentified partners worldwide were similarly allocated to identified partners in
proportion to Hungary’s imports from them.
Although exports to Hungary by reporting countries accounted for only 40-60 per cent of
Hungary’s total imports before 1992, the reason was that important suppliers to Hungary, such as
the Former USSR, the former German Democratic Republic, and the former Czechoslovakia did
not report their exports at all. For the remaining countries, the distributions of their exports to
Hungary in each year were used to allocate Hungary’s reported imports at the 2-digit or 3-digit
level to 4-digit SITC subgroups. Most of the remaining 2- or 3-digit divisions and groups were
allocated using the 4-digit breakdowns of imports from the same partners in the closest years.
The remaining aggregates were subdivided using the 4-digit distributions for all partners
combined.
5.13 Indian imports
India’s reported imports by partner add up almost completely to total reported imports if
3-digit and 4-digit data are combined. There are no duplications between 3- and 4-digit data.
The data by SITC from each partner were scaled to match the partner totals.
The major problem was the reporting of SITC 334 at only the 3-digit level from 1986
through 1997 and the attribution of those imports to unidentified partners. Distributions of

22
exports to India reported by partners are used to allocate imports to partners and to divide
imports into 4-digit subgroups. The partners used were: 1986-89: Period average distributions
of exports by Bahrain, Kuwait, Singapore, and Former Soviet Union; 1990-91: Period average
distribution of exports by Bahrain, Kuwait, Singapore, Saudi Arabia, UAE, Kazakhstan, and
Russian Federation combined; 1992-97: Period average distribution of exports by same
countries as for 1990-91, with Kazakhstan and Russian Federation separated.
5.14 Irish imports
The principal problem with Irish import data is the listing of large amounts of imports
from unidentified partners. Unidentified partner imports were concentrated in SITC subgroups
3222, 7599, 7764, and 8983. Since differences between reported imports and reported exports
appeared to explain the unidentified origins of imports in these subgroups, the imports reported
from unidentified partners were allocated to partners in proportion to differences between
reported imports and reported exports from identified partners for which reported exports were
larger. For SITC subgroups 7522 and 7525, import values that were smaller than reported
partner exports were replaced by the reported export values, and the differences subtracted from
unidentified imports. For all other SITC subgroups, except those of SITC Division 9, imports
from unidentified partners in each SITC subgroup were assigned to identified partners in
proportion to the identified partner imports. Imports from unidentified partners in Division 9
were divided among the 10 countries with the largest excesses of exports over imports in this
Division, in proportion to those differences.
5.15 Israeli imports
There are two main problems with data for imports into Israel. One is large imports
under SITC 334 and other 3-digit groups, not divided into 4-digit subgroups. The other is
23
imports from unidentified partners, particularly of SITC 3330, Petrol oils, and SITC 6672,
Diamonds.
For SITC 3330, imports from Egypt (1984, 1985 1989-97) and Mexico in 1984 and 1985
were taken from the Statistics Canada WTDB. For other years, 20 per cent of imports were
attributed to Egypt, following statements in U.S. International Trade Administration (2004) and
U.S. Energy Information Administration (2004e). Imports were attributed to other sources,
Mexico. Norway, Former USSR (before 1992), the Russian Federation, and Kazakhstan after
that, on the basis of reported exports.
A similar breakdown was performed for SITC 334, assigning imports to the same
countries as for SITC 333 and dividing them into 4-digit subgroups on the basis of imports in
other years or from other countries, where available, and also In general, 3-digit groups were
also divided into 4-digit subgroups on the basis of export data.
Imports of SITC 6672, Diamonds were allocated to the South Africa Customs Union, as
suggested by the distribution of exports to Israel.
5.16 Italian imports
The most important problem with Italian trade data is the listing of over $5 billion in
1999 and almost $9 billion in 2000 as unidentified by either partner or SITC. In addition, from
1984 through 1987, some imports are reported under non-existent 4-digit SITC codes that are
really 3-digit codes.
A comparison of import with partner export reports shows that most of the unidentified
imports in 1999 and 2000 were imports of SITC 33 (Petroleum, Petroleum Products, and Related
Materials) and 34 (Gas, Natural and Manufactured) from Algeria, the Russian Federation, and
Nigeria. These were allocated to those partners in proportion to the discrepancies between their
24
reported exports to Italy and Italy’s reported imports from them. Unidentified imports outside of
these two SITC Divisions were allocated to partners in proportion to reported imports in each 4-
digit subgroup. Unidentified imports in other years were and imports under 90839 (Special
Categories) were dropped from the data set.
The 255 country by partner items reported at only the 3-digit level in 1984 to 1987 were
mostly allocated to 4-digit subgroups on the basis of reported exports to Italy by the same
partners in the same years. Almost all the rest were allocated using imports from the same
partners in a nearby year and the two remaining cases were allocated using the distribution for all
partners combined.
5.17 Japanese imports
The main problem with Japanese import data is the reporting of imports of Refined
petroleum products, SITC 334, at only the 3-digit SITC level. There were also some very minor
imports from unidentified partners, but they were so small that they were simply discarded.
The 3-digit group exports were almost all divided into 4-digit subgroups by using the
shares in the nearest year for which they were available for each partner. The few remaining
cases that could not be distributed in this way were allocated by the average shares of the
subgroups in each year.
5.18 Korean imports
Korea reports large amounts of imports at the 3-digit level and also large amounts from
unidentified partners. Small imports from groupings not distinguished by country, “Asia West,
n.e.s.,” and North Africa, n.e.s.,” were dropped from the data set. Most imports reported at the
3-digit level were allocated to 4-digit subgroups on the basis of the 4-digit distributions from the

25
same countries in nearby years. The remaining 3-digit groups were divided into 4-digit
subgroups in proportion to the distributions for all available partner countries combined.
Imports of ships from unidentified partners were also dropped from the data set. Since
Korea is a major builder and exporter of ships, it is unlikely that these were genuine imports of
goods into Korea. They may have been ships on which some repair or other services were to be
performed or ships changing to Korean ownership. Imports of SITC “Petrol oils” from
unidentified sources from 1984 to 1987 were allocated to Iran. Imports under SITC 3221,
“Anthracite coal,” were allocated to Canada and Australia in proportion to their reported exports
to Korea. The remaining imports from unidentified sources, classified by 4-digit SITC, were
distributed among identified partners in proportion to Korea’s imports from them in each year.
5.19 Kuwaiti imports
There is no information at all in the UN data set for imports into Kuwait in 1984 to 1986
and for 2000. In addition, large imports are reported from unidentified partners before 1993.
Some imports are reported only at the 3 digit group level.
For 1987 to 1989, while there are large imports reported from unidentified partners at the
4-digit level, partner totals are virtually complete. Thus, it is possible to calculate, for each
partner, the imports from unidentified 4-digit subgroups. For each partner, these are distributed
across 4-digit subgroups in proportion to the imports identified at the 4-digit level. Thus, it is
assumed that the distribution of imports from each partner not reported is identical to the
reported distribution from the same partner.
For 1990 to 1992, the partner distribution was assumed to be the same as in 1993, when it
was almost complete. The imports at the 4-digit level from unidentified partners were allocated
to partners in proportion to the differences between partner totals reported at the 4-digit level and

26
these estimated partner totals. The estimated imports from each partner unidentified by subgroup
were then allocated to subgroups in proportion to the reported imports from that partner.
For 1993-1999, imports unidentified by partner were very small and were dropped from
the data set. For 1984-1986 and 2000, when import data were completely missing from the UN
data set, some partner totals were available in United Nations (1990) and (1991) for 1988 and
1989, and for 2000 from United Nations (2004).. Imports from those partners for which reported
export data covered 80 per cent or more of these partner import totals were estimated as being
proportional to the reported exports. Total imports from partners not separately identified in the
UN Yearbooks but reporting export data were estimated by assuming that the partner import
totals were the same proportion of total imports as the partner export totals were of reported
exports to Kuwait of countries other than those for which total partner imports were identified.
The total imports from each such partner were then distributed to 4- digit subgroups in
proportion to exports to Kuwait reported by that partner. For the remaining partners with
estimated Kuwait imports but no export data, the import distributions in the nearest year
available were used to estimate imports by 4-digit subgroup.
Of the many commodities reported at only the 3-digit level, some could be allocated to 4-
digit subgroups by using the distributions of exports from the same partner in the same year.
Most of the rest were allocated by using the distributions of imports from the same partner in a
nearby year. The remaining ones were allocated by using the 4-digit distributions of imports
from all partners in the same year.
5.20 Malaysian imports
Malaysian import data suffer from two main problems. One is the reporting of imports at
the 3-digit SITC level and the other is the attribution of large amounts of imports to unidentified

27
partners. The main location of the unidentified partners is in the subgroup SITC 7768, “Piezo-
electric crystals, mounted; and parts, n.e.s. of the electronic components falling within heading
776, “Thermionic, cold cathode valves.” There is a particularly large discrepancy between
Malaysia’s reported imports from Singapore and Singapore’s much larger reported exports to
Malaysia. Most of the major exporters of this group report exports to Malaysia smaller than
Malaysia’s reported imports from them, suggesting that these products pass through Singapore
on their way to Malaysia. We attribute the imports reported as from unidentified partners under
SITC 7768 to Singapore.
Data on exports to Malaysia are too thin to use as guides to dividing up imports in groups
reported only at the 3-digit level in some years. Import data from the same countries in nearby
years are used to divide up most of these groups into 4-digit subgroups, but for a few items,
imports from the world are used.
5.21 Mexican imports The major problem with Mexican import data is the absence of any UN data for 1984
and 1985. In addition, some imports were reported only at the 3-digit group level and there were
also substantial imports from unidentified partners.
For 1984 and 1985, export data for partners covered almost all of Mexico’s imports.
Partner totals for imports were taken from United Nations (1990). For partners with both partner
totals and reported exports, the total imports from each partner were distributed to 4-digit
subgroups by the distribution of reported exports. For partners with reported export data but no
import totals from the UN Yearbook (United Nations, 1990), the Mexican import totals were first
estimated by allocating the difference between total Mexican imports and imports from partners
identified in the Yearbook to partners in proportion to their reported exports to Mexico. These

28
estimated totals by partner were then distributed among 4-digit subgroups in proportion to the
distribution of their exports to Mexico. For partners with Mexican import totals but no export
data, imports were allocated to 4-digit subgroups by the distribution of Mexican imports from
that partner in the closest year.
Of 92 cases in 1987, 1988, and 1991 where imports from a partner were reported at only
the 3-digit or 2-digit level, 49 were distributed to 4-digit subgroups using reported data on
exports to Mexico from the same partner in the same year. In other cases, 4-digit breakdowns of
exports from the same partners in nearby years were used in the allocation. For a few remaining
cases, the allocation was based on the distribution among 4-digit subgroups for the total Mexican
imports in the 2-digit or 3-digit groups in the same year.
Most imports from unidentified partners are also unidentified by product. An exception
is imports of SITC 5621, Mineral or chemical fertilizers, which can, according to export data, be
assigned to “Russian Federation” as a partner. Other imports from unidentified partners that
were identified by SITC were distributed to partners in proportion to reported imports by SITC
in the same year. Remaining imports of unidentified products from unidentified partners were
distributed by the imports of identified products from identified partners in the same year, except
that small imports from “Free Zones” in 1989 and from “European Union, n.e.s.” in 1995 were
dropped.
5.22 Netherlands imports
The major problem with Netherlands import data is the listing of large amounts of
imports, sometimes over $5 billion, under partner 90839 (Special Categories). There are also
minor imports reported under 90837 (Bunkers) and 90899 (Bunkers), and these have been
dropped from the data set.

29
Since the unidentified partner, 90839 (Special Categories) appears in 4-digit data, but not
in 2-digit data in 1984-1987, we calculated the differences, for each partner country, between the
reported 2-digit Division totals and 2-digit totals derived by truncating the reported 4-digit
import values for each partner, and treated those differences as the basis for the partner
distribution of the imports listed under 90839. To allocate those partner totals of unidentified
imports to 4-digit SITCs, we calculate the excess of reported exports to the Netherlands over
reported imports by the Netherlands in each 4-digit subgroup within each SITC Division. We
allocate the differences between reported and truncated 2- digit totals from each partner to 4-digit
subgroups in proportion to reported excess amounts of exports over imports in each 4-digit
subgroup. Where there were no excess reported exports, the differences between reported 2-digit
imports and 2-digit totals from reported 4-digit imports are allocated to 4-digit subgroups by the
reported 4-digit import distributions. For a small number of cases with no breakdown on either
the export side or the import side, the distribution in a nearby year is used or, in a very few cases,
the distribution across all reporting partners.
In 1988-2000, there is no difference between reported 2- digit import totals and 2- digit
import totals from truncated 4-digit imports. The imports from unidentified partners are
distributed to identified partners by the distribution of differences between export and import
reports, by partner and year. In 4-digit subgroups with no excess of exports reported, the
imports from unidentified partners are allocated to identified partners in proportion to reported
imports from identified partners in the same years.
5.23 Polish imports
Polish import data at the 4-digit SITC level are only about 50 per cent complete in 1984-
1991 and much more complete, but still missing 2 to 4 per cent of total imports in 1992, 1993,

30
and 1995 through 1997. 1-digit division totals were quite complete from 1984 through 1992.
Large imports were reported from unidentified partners in all years except 1993 and 1999. In
some years, large imports were reported under SITC Division 9 (Commodities and Transactions
n.c.e), concealing the commodity composition of those imports.
Since the identified partner totals are larger than the identified partner 1-digit numbers, it
is possible to calculate a partner distribution of those imports not identified by 1-digit division.
They were allocated to 1-digit divisions in proportion to the imports identified by division for
each partner in each year.
In 1985 through 1987, there were large import aggregates reported from unidentified
partners. Data for 1984 and 1988 suggested that these were from a stable group of countries,
particularly the former USSR the former Czechoslovakia, and the two Germanies. The imports
from unidentified partners in 1985-1987 were allocated to identified partners by the average
shares in 1984 and 1988.
Reported imports of SITC Division 3 (Mineral Fuels, Lubricants, and Related Materials)
decreased sharply from 1990 to 1991, and there was a corresponding increase in Division 9
(Commodities and Transactions n. c. e.), not identifiable by product. Division 9 had shown
negligible imports in 1988-1990. It was assumed that these imports should have been classified
under Division 3 in 1991, and they were added to that division. There was another large increase
in imports reported under Division 9 in 1992, and a large fall in the imports reported in all other
divisions. The imports reported under Division 9 were reallocated to the other divisions in the
same proportions as reported for 1991.
The imports reported at only the 1- to 3-digit levels, half to two thirds of total imports in
1984-88 and almost a third in 1989-2000, were allocated to 4-digit subgroups in several steps.

31
For those countries that reported exports to the UN, which did not include the USSR or the GDR,
the distributions of exports to Poland at the 4-digit level for each country in each year were used
to allocate Polish imports reported from each country at more aggregated levels to the 4-digit
level. Most import groups were distributed in this way. Most of the remaining aggregated
imports were allocated by using the 4-digit distributions of imports from the same countries in
nearby years. The 4-digit export distribution for the Federal Republic of Germany came closer
than the distributions of other countries to resembling that of the GDR, where they could be
compared. They were therefore used to allocate Polish imports from the GDR that were reported
on a more aggregated basis. A small number of remaining aggregated groups of imports were
allocated by using distributions of exports to Poland by the world.
The 4-digit totals of Polish imports in 1993 and 1997 fell short of national total imports.
The country sources of the omitted imports could be identified, as well as their concentration in
SITC 3 and 7. Differences between reported exports and reported imports at the 4-digit level
were used as guides to allocating these imports to 4-digit subgroups.
In 1995, 1996, and 1998, there were large imports from unidentified partners at the 4-
digit level, although total imports by partner were complete. The 4-digit imports by identified
partner were scaled up to eliminate these differences.
In 1994 and 2000, the unidentified partners appeared in the data by partner, as well as in
the 4- digit SITC subgroup data. The unidentified partners appeared to be mainly the same ones
as in the 4-digit data of 1995, 1996, and 1998. The imports from unidentified partners were
allocated to partners in proportion to the differences between partner totals and 4-digit partner
imports in 1995 (for 1994) and 1998 for 2000).

32
There were large jumps in reported imports under SITC Division 9 (Commodities and
Transactions, n.c.e.) in 1995 and 1998. These were allocated to the other Divisions by the
distributions among the Divisions in 1996 and 2000, respectively.
5.24 Russian Federation imports
The Russian Federation reported very large imports from unidentified partners, as much
as $15 billion per year. These imports were mostly reported under SITC 9310, “Special
Categories,” and thus did not reveal the commodity composition. In addition, some imports
were reported at only the SITC 3-digit level.
Of the 139 SITC by partner combinations reported at the 3-digit level, more than half
could be subdivided into 4-digit subgroups by using data on exports to the Russian Federation in
the same 3-digit grouping the same years. For most of the remaining 3-digit data, the 4-digit
distribution of 3-digit imports from the same partner in a nearby year was used. For the few
remaining cases, the 4-digit distribution of imports in each 3-digit group from all partners
combined was used.
The larger problem is that of unidentified partners and products. The closest match
between the total of reported exports to the Russian Federation (as modified) and imports by the
Russian Federation, by partner, at the 4-digit SITC subgroup level, was for 1997. The
modification of export data was to use Russian Federation import data for countries that did not
report exports and also for SITC 4-digit subgroups in which reported exports by a country to the
Russian Federation were larger than reported imports by the Russian Federation from the country.
The distributions for 1997 were therefore used as the benchmarks for the adjustments in 1996
and 1998-2000.

33
For 1997, the distribution of exports to the Russian Federation could be used to distribute
the Special Category (90839) imports from unidentified partners to identified ones. For other
years, even the modified export totals were smaller than the import totals. Therefore, after the
modified export data for each year were used to estimate imports to the Russian Federation, the
remaining unallocated imports were allocated to partners by the 1997 distribution. Four-digit
imports into the Russian Federation were matched to 4-digit exports by each partner to the
Russian Federation. Where the reported imports were equal to or larger than the reported exports,
the import data were accepted. Where the reported exports were larger, the difference from
reported imports was used to distribute the imports from unidentified partners among the
identified partners. For partners with no export data, or all reported exports smaller than
reported imports, the imports from unidentified partners were distributed proportionally among
the 4-digit subgroups for which imports were reported.
5.25 Saudi Arabian imports
Import data for Saudi Arabia suffer from two main problems. One is that in 1984-87 and
1990, a substantial part of imports were reported only at the 3-digit level (shown as 4-digit with 0
as the last). Another is that Saudi Arabia did not report imports at all in 1997. A smaller
problem is the listing of imports with unidentified partners. Most of these are classified as SITC
9310, essentially unidentified by SITC. However, the imports from unidentified partners never
exceed $350 million.
Most of the items (1916 partner-SITC 3-digit combinations) reported at the 3-digit group
level by partner were distributed to 4-digit subgroups on the basis of the distribution reported by
partners (exporters to Saudi Arabia) for the same years. Another 753 combinations were
distributed on the basis of the breakdown in the most recent year for that partner. The 53

34
remaining partner-SITC 3-digit combinations were distributed on the basis of the breakdown of
each 3-digit group for all available partners.
For 1997, data on imports to Saudi Arabia from larger partners were obtained from
United Nations (2003). For partner countries that reported exports to Saudi Arabia in that year,
the distribution by SITC was estimated from the export distribution. For five countries listed as
import partners, with no exports reported, the import distribution for 1996 and 1998 combined
was substituted for the nonexistent detailed import reports.
5.26 Singapore imports
Singapore does not report its trade with Indonesia at all, although Indonesia is a major
trading partner. The omitted imports, to judge from the Indonesian data, ranged from over $1
billion in the early years to $6.5 billion in 2000. 43 per cent of the exports in 1992 were in SITC
Division 6, Manufactured Goods Classified Chiefly by Material, and a third were divided almost
equally among SITC Division 2, Crude Materials, Inedible, except Foods, SITC 7, Machinery
and Transport Equipment, and SITC Division 8, Miscellaneous Manufactured Articles.
In addition to the omission of trade with Indonesia, other problems are that there are
some imports from unidentified partners and imports of petroleum and products, SITC 334, are
reported at only the 3-digit level. The main imports from unidentified partners were from “Other
Africa, n.e.s.” The change in 1995 after the embargo was lifted showed that the source of those
imports was mainly South Africa, and that partner was substituted for the catch-all group.
Imports from other unidentified partners were small and were dropped from the data set.
Imports from Indonesia were taken entirely from Indonesian export data. They are lower
than they would be if reported by Singapore, because Singapore reports on a General Trade basis,
including imports for re-export, while Indonesia reports on a Special Trade basis.

35
Almost half of imports in SITC group 334 were allocated to 4-digit subgroups by export
distributions in the same years for countries that reported them. Almost all the rest were
allocated using import distributions for nearby years and the last few were allocated by the
distributions for all partners combined.
5.27 South African imports
There are no import data for South Africa by country or commodity in the UN data set
from 1986 to 1991, presumably because the country was the subject of various United Nations
sanctions, particularly a prohibition on the exporting of petroleum products to South Africa. In
years when imports were reported, there were often large amounts, as much as $6 billion, not
identified by partner, but reported as 90839 (Special Categories) or 90899 (Not Specified). In
addition, some small amounts were reported only at the 3-digit SITC level. In years when import
data were reported by SITC, a large part of the imports from unidentified partners were in SITC
333 (Petroleum oils, crude, and crude oils obtained from bituminous materials), confirming the
use of unidentified partners to conceal the sources of oil.
In 1984-85 and 1992-94, large imports were reported in the UN data set from
unidentified partners under SITC 9310 (Special transactions and commodities not classified
according to kind.). For 1986-1991, large imports of unidentified commodities from the world
were reported in United Nations (1993) and (1994), similar in magnitude to the imports from
unidentified partners under SITC 9310 in earlier and later years. We suspect that it was largely
or entirely crude oil.
A report on the workings of the sanctions (Hengeveld and Rodenburg, Editors, 1995)
provided estimates of the tonnage of oil shipments to South Africa during the period of sanctions,
and these, multiplied by estimated prices from U.S. Energy Information Administration (2004a),

36
came fairly close to the values of imports of unidentified products or from unidentified partners
reported by South Africa. We have therefore assumed that the unidentified imports were imports
of petroleum.
Hengeveld and Rodenburg, Editors (1995) gives estimates of imports through the
embargo period from individual countries and regions. We have used the estimates of imports
from the UAE, Saudi Arabia, Iran, Oman, Qatar, Kuwait, unknown countries in the Persian Gulf,
Egypt, unknown countries in the Middle East, Brunei, the Netherlands, the UK, and the
Netherlands Antilles, which account for 95 per cent of their total. We assigned exports from
unknown countries in the Middle East to Egypt, and allocated the exports from unknown
countries in the Persian Gulf to the identified countries there in proportion to their identified
exports. The unidentified imports were allocated to these countries in proportion to their shares
in estimated export tonnage to South Africa.
For imports other than oil in 1986-1991, the partner totals were estimated by assuming
that the partner distribution of the imports from the world from U.N. Yearbooks for 1986-88 was
that of 1985, and the partner distribution of 1989-91 was that of 1992. For those partners with
reported exports covering 80% or more of estimated imports, the export distribution was used to
allocate imports by SITC. For partners with exports reported, but no imports estimated, the
export amounts by SITC were allocated as imports directly. For partners with estimated imports
but no reported exports, the reported import distributions of 1985 (for 1986-88) and 1992 (for
1989-91), were used to allocate import totals to SITC subgroups, and the same was done for
partners with export data covering less than 80%f estimated imports. Virtually all the remaining
estimated partner import totals were allocated by the distributions of imports in the closest years
available. A few cases were allocated by the SITC distribution for all countries combined.

37
For 1995, imports of SITC 333 from the UK and Argentina, and in 1996, those from the
UK, were estimated from the reported exports to South Africa by these countries, and the values
were subtracted from the imports reported from unidentified partners. The remaining imports
from unidentified partners in those two years were allocated to the other partners in proportion to
their reported exports. For 1997-1998, imports of SITC 333 from the UK were assumed equal to
reported UK exports to South Africa, and these amounts were subtracted from South Africa’s
imports from unidentified partners. The remaining imports of SITC 333 from unidentified
partners were allocated by the distribution by partners in 1999, recognizing the apparent effort by
South Africa to diversify its sources of oil (U.S. Energy Information Administration, 2004b).
Other imports from unidentified partners in these years, reported by SITC, were
allocated to partners in proportion to the distribution of sources in each SITC in each year.
Imports under SITC 9310, not identified by partner or commodity, were allocated to partners and
SITC subgroups by the distribution of positive differences between reported exports and reported
imports.
5.28 Spanish imports
Spanish import data are relatively complete, although there are some large imports
reported at only the 3-digit level and smaller amounts reported from unidentified partners. The
latter items never reached $700 million in total and were dropped from the data set. The more
than 650 country by SITC group combinations reported at the 3-digit level were mostly allocated
to 4-digit subgroups using the 4-digit breakdowns of exports by the same partners to Spain in the
same years. Almost all the rest were allocated in proportion to imports from the same partners in
nearby years and a small number were allocated on the basis of imports from all other partners in
the same year.

38
5.29 Swedish imports
The main problem with Swedish import data is the reporting in some categories at only
the 3-digit SITC level. There are also some imports unidentified by SITC and partner, but they
are relatively small and have been dropped from the data set.
Most of the 513 country by SITC imports at the 3-digit level could be allocated to 4-digit
subgroups by using the distribution reported in the partner countries’ export data for the same
years. Almost all the rest of the groups were allocated to subgroups using the distributions of
Swedish imports in nearby years. The last few cases were allocated by the 4-digit distributions
for the reporting exporters as a group.
5.30 Swiss imports
There are some imports reported from unidentified partners, but they are small and occur
in only four years, and we have therefore dropped them from the data set. A more serious
problem is the more than 650 import by partner groups reported only at the 3-digit level. Almost
two thirds of these are allocated to 4-digit SITC subgroups in proportion to the same partners’
reported exports to Switzerland in the same SITC groups in the same years. Almost all the rest
are allocated to 4-digit subgroups on the basis of the distributions of imports from the same
partners in nearby years, and the last few are divided according to the distributions of imports
from all other partners in the same groups in the same years.
5.31 Taiwan imports Taiwan is not included in the UN data set as a reporter and appears there only as an
export partner designated “Other Asia, n.e.s.” The NBER data set is constructed mainly from
three sources. One is official Republic of China or ROC (Taiwan) import data for 1991 to 2000,
on a 4-digit Harmonized System (HS) classification. A second is the UN data from partner

39
countries on exports to “Other Asia, n.e.s.” The third is official Republic of China (Taiwan)
published import data for total imports and also for imports on a very detailed HS basis.
For the HS data in 1991-2000, the imports at the 4-digit HS level add up to the totals
reported in the ROC Yearbooks, such as China, Republic of China (1999). We therefore accept
them as complete. The main problem is the translation into the 4-digit SITC Revision 2
subgroups. The translation here starts with the UN concordance between 6-digit HS and 5-digit
SITC. These were truncated to 4-digit HS and SITC subgroups, producing 1,014 unambiguous
matches, but also 555 cases where 4-digit HS subgroups were matched to two or more 4-digit
SITC subgroups.
U.S. export and import data were used to assign the HS subgroups with multiple SITC
matches to single SITC assignments. The 10-digit HS data, with their 4-digit SITC assignments,
and the 5-digit SITC data were truncated to 4-digit data, revealing the SITC distribution for each
4-digit HS group in U.S. exports and in U.S. imports. In the more than 500 cases where the U.S.
export and U.S. import data revealed the same predominant match, these were used at the 4-digit
level. The 50 or so remaining cases were almost all assigned by using the 10-digit import
breakdown provided in China, Republic of China (1990). The predominant import in each 4-
digit HS group was assigned to a 4-digit SITC group by using the detailed descriptions of these
groups in United Nations (1963) and (1975).
Some imports, particularly SITC 334, were reported at only the 3-digit level in 1992-
2000. These were allocated to 4-digit SITCs by the export distributions from the partner
countries in the same years. For 1984-1990 there are no import data except the totals from all
countries and the partner totals reported by Taiwan, although there are extremely detailed data
published in print form by Taiwan, which were not usable on any large scale. Mostly, our data

40
set must be derived from export data.
There are no reported exports from Saudi Arabia, except one doubtful figure for 1990,
which is many times the partner import total reported by Taiwan. There are also no data for
exports by the UAE, Kuwait, and apparently missing or understated exports by Oman. The
partner import totals for these countries, except Oman, were allocated to SITC subgroups on the
basis of reported exports in 1991. For Oman, the export distribution in 1987 and the import
distribution in 1991 were used.
Sweden, South Korea in 1989-1990, and South Africa also did not report exports to
Taiwan. The reported partner totals were allocated to SITC subgroups by the distribution in
1991. The partner totals are from China, Republic of China (1989), (1991), (1999), and (2002),
except for South Africa in 1984 and 1985, taken from the Statistics Canada World Trade Data
Base. All of these calculations leave more than 1800 commodity by country pairs for which data
are reported at 1-, 2-, or 3-digit levels in the whole period from 1984 to 2000. Most of these are
estimated at the 4-digit SITC level by using the distribution for the same partner in the closest
year available. The remaining entries at above the 4-digit level, fewer than 50, are allocated by
using the distributions for all partners combined as the guide.
There are substantial imports throughout the 1990s from unidentified partners, especially
in 1997-2000, and also small amounts of imports from country combinations such as Other
Africa, n.e.s., Caribbean, n.e.s., and Europe, n.e.s. The import values from the country
combinations are small and they were removed from the data set. Imports from unidentified
partners were concentrated in SITC 7524 (Digital Centered Storage Units) and 7764 (Electronic
Microcircuits). These numbers are similar to the differences between export total values and
import total values for Japan, and they were therefore assigned to that country. The other

41
imports from unidentified partners were allocated to those for which reported exports exceeded
reported imports, in proportion to the excess exports
5.32 Thai imports.
Thailand’s reported imports include substantial amounts from unidentified partners, listed
as 90899 (“Not specified),” 90838 (Free zones), or 90839 (Special categories).” There are also
minor imports from 16577 (Other Africa, n.e.s.).
Imports under 16577 were dropped from the data set. The much larger imports from
unidentified partners in SITC subgroup 7599 ( Parts,, n.e.s. of and accessories for calculating
machines and automatic data processing machines…) were distributed to partners in proportion
to differences between reported exports to Thailand by and reported imports by Thailand from
partners for which these reported exports exceeded the reported imports. For SITC subgroup
7929 (Parts, n.e.s. of aircraft and associated equipment), import values from individual partners
were replaced by partner export values when the export values were larger. The remaining
imports from unidentified partners were allocated to partners in proportion to the distribution of
excess amounts of exports to Thailand relative to imports by Thailand by each partner in SITC
group 792 (Aircraft and associated equipment). In the remaining SITC subgroups, except those
of Division 9, imports from unidentified partners were distributed to partners in proportion to
reported imports in each subgroup. Imports from unidentified partners in Division 9 were
allocated to the 10 partners with the largest positive gaps between reported exports to Thailand
and reported imports from Thailand.
5.33 Turkish imports. The two main problems with the Turkish import data in our data set are the total absence
of data for 1984 and the listing of large imports as coming from unidentified sources.

42
For 1984, data on total imports to Turkey by major partner were published in the
International Trade Statistics Yearbook (United Nations, 1990). For partners with reported
exports to Turkey that were over 80 per cent of imports reported by Turkey, export distributions
were used to estimate the corresponding import data. For the rest of partners with reported
import totals, the totals were added to the data set and allocated among SITC 4-digit subgroups
by the distribution of Turkish imports from each country in the closest available year. For
partners with reported exports but no reported import totals, the export data were used and scaled
to match the totals to the reported Turkish imports from the world.
The imports from unidentified partners were listed under 90899 “Not specified” and
90838, “Free zones.” In 1997 to 2000, large imports under 3330 were reported as from
unidentified partners. However, the volume of Turkish imports from Iraq can be estimated from
OECD data reported in U.S. Energy Information Administration (2004c), Table 4.17, and world
market prices are published in U.S. Energy Information Administration (2004a) and (2004d).
The combination of the two can be used to estimate the value of imports by each country from
Iraq. In the case of Turkey, the value estimated came close to the reported Turkish imports from
unidentified partners, and the estimated values were therefore attributed to Iraq. For SITC
subgroup 3344, reported export values were substituted for the reported import values when the
export values were larger, and the additional import values were subtracted from the unidentified
partner import totals. The remaining reported imports from unidentified partners were discarded.
5.34 UAE imports There are several major problems with UAE import data. One is the reporting of imports
from unidentified partners, under the heading “Not specified” or “Special Categories.” A second
is the total absence of import data for 1987, 1994-1998, and 2000, and the reporting at only a 2-

43
digit HS level for 1999. A third is the reporting of many import categories at only higher levels
of aggregation than 4-digit SITC. For 1984-86 and 1988-93, imports by 3- or 4- digit SITC
covered 98-100 per cent of total imports. For 1994 and 2000, even import totals are inconsistent
among sources. Partner export data were used directly for those years. However, Taiwan, a
major import partner for UAE, was not reported in UN export data, and UAE imports were
calculated from China, Republic of China (2002). For 1992 and 2001, UAE import totals by
partner were published in United Nations (1993) and United Nations (2003).
For 1999, partner totals were available in the data set. Where export data were available
for a partner, they were used to allocate the partner import totals to SITC categories. For
partners with no reported import totals, but data on exports to the UAE, the total discrepancy
between the UAE import total from the world and totals from reported partners was divided
among unreported partners in proportion to their reported exports to the UAE. The reported
SITC product distributions of these exports were then used to distribute the estimated import
totals across SITCs. For partners for which total imports into the UAE were available, but no
distribution by SITC and no export reports for 1999, the export distribution from the closest year
was used to estimate the 1999 import distribution. Imports from 18 small partners could not be
distributed by SITC by any of these methods and were dropped from the data set.
17,631 entries were reported at only the 1- to 3- digit SITC level. Where 4-digit data
were available from partners’ export reports, they were used to estimate allocate imports at the
broader level to the 4-digit SITC categories. Where 4-digit data were not available for a given
year, data for nearby years were used for the allocation. Some remaining 1- or 2-digit import
categories were first distributed to the 3-digit level from partner export data for the same year
and then to the 4-digit level by partner export distributions for nearby years.

44
5.35 UK imports
UK import data involve several problems. One is that some imports are reported at only
the 3-digit SITC level and the 4- digit breakdown must be estimated. These imports are as large
as $US 12 billion in 1997. After the 4-digit estimation, reported imports by 4-digit subgroup fall
short of reported total imports by $US 1 to 2 billion in some years and exceed the total by $US 1
to 5 billion in others. Included in these totals are $US 1 to 4 billion reported as SITC 9,
concealing the commodity distribution of those imports.
Substantial amounts of UK imports are from unidentified partners, reported as “Special
Categories” (90839) or Europe, Other, n.e.s.(57568). One large component of the imports from
unidentified partners, to judge from differences between reported and calculated partner totals
and from export data, are imports of diamonds, mainly from Belgium and Switzerland in 1984-
1990, and these two countries plus South Africa in 1993-95. Data on exports to the UK by
partner were used to estimate these imports. The estimated amounts were then subtracted from
the reported imports from unidentified partners and also, in 1994 and 1995, from “EU, n.e.s.”
Another group with large imports from unidentified partners was SITC 792, “Aircraft and
Associated Equipment.” In 1993-95, the UK reported the same magnitude of imports under this
group from identified partners (3-digit imports without a 4-digit breakdown) as from unidentified
partners in a 4-digit breakdown. The 4-digit total of imports exceeded the reported imports from
the world by the same magnitude, suggesting that imports under SITC 792 from unidentified
partners were duplicated in those years. A similar comparison, along with export information,
suggests that imports under SITC 792 from unidentified partners were partially duplicated in
1991-92. For subgroup SITC 7924, “Aircraft, unladen weight exceeding 15,000 kg.,” export
data suggest that the imports in 1984-88 were almost entirely from the United States, and the

45
imports were allocated accordingly. For 1989-91 and 1996-2000, the imports from unidentified
partners were allocated to partners in proportion to the differences between reported exports and
reported imports.
A similar procedure was applied to imports in SITC 7643, “Television,” in 1988-1996,
using the distribution of differences between reported exports and reported imports. In SITC
7931, “Warships,” no guidance could be found for distributing the reported imports from
unidentified partners, and they were omitted from the data set.
6. Adjusting the UN Import Trade Data with Value Added from Hong Kong’s Re-export
Countries trading with China and Hong Kong treat goods shipped from China through
Hong Kong differently than those imported directly from China. This difference in treatment
results in a discrepancy in the UN trade data. Specifically, many countries report a higher value
of import from China than what China reports as the value of export to the respective countries.
The reason is that these countries include the value-added (VA) from Hong Kong (HK) as part of
the value of import from China. This value-added should instead be attributed to Hong Kong’s
export instead of China’s.
To achieve this, we first calculated the HK re-export markup (percent) at 1-digit SITC
level using an auxiliary dataset containing disaggregate information on Chinese exports to Hong
Kong, and Hong Kong re-exports of the same commodities.7 These markups differ by
destination country. In principle, by multiplying the percentage markups by the value of Chinese
re-exports through Hong Kong to the destination country (from our auxiliary dataset), we obtain
the value-added in Hong Kong on that trade flow. However, in very few cases the HK re-export
7 The data used and markup calculation are described in Feenstra, Hai, Woo and Yao (1999), method A. We exclude disaggregate observations for which the Hong-Kong re-export quantity exceeds the Hong Kong import quantity, which indicates measurement error in one of these observations.
46
VA is higher than the import value from China as reported in the UN data. Therefore, to avoid
this situation, we re-defined the HK VA as:
HK VA = Markup × min{UN country imports from China, China re-exports to UN country}
That is, we use our percentage markup times the minimum of two trade flows: the first is the
country imports from China at the 4-digit SITC level, reported in the UN data; and the second is
the Chinese re-exports through Hong Kong to that UN country, as available from our auxiliary
dataset. With this definition of HK value-added, for each country in the UN dataset the value of
imports from China is reduced by the calculated HK VA, and the value of imports from HK is
increased by the same HK VA. Namely, the sum of value of imports from China and HK
remains the same in the UN data. The files CHINA_HK??, for ??=88,…,00, included with the
dataset, provides the revised values of bilateral trade flows when China or Hong Kong is the
exporting country.
Table 5A provides examples of the HK VA adjusted imports for four countries – Japan,
Canada, U.S., and Germany – for the years 1988, 1992, 1996, and 2000. The first column
reports the UN recorded imports from Hong Kong, and the fourth column reports the UN
recorded imports from China. Column (2) is the same as column (5), which is the HK VA
calculated as described above. The revised import values of these countries from HK are shown
in column (3), which is the sum of the original UN recorded imports and the calculated HK VA.
On the other hand, subtracting the corresponding HK VA from the original UN recorded imports
from China yields the revised import of these countries from China. This is shown in column (6).
Column (7) reports the sum of the imports from China and HK for these countries, which are the
same as before the HKVA adjustments. Table 5B shows how this adjustment affects the value of
the U.S.-China trade deficit, reducing it by 39% in 1988 and 16% in 2000.

47
Table 5A: UN Imports Adjusted by HK re-export VA for Selected Countries
Canada importsOriginal UN
importsVA of HK re-exports
Revised UN imports
Original UN imports
VA of HK re-exports
Revised UN imports
from China + Hong Kong
1988 937,995 116,252 1,054,247 776,746 116,252 660,494 1,714,741 1992 934,914 446,867 1,381,781 2,021,430 446,867 1,574,563 2,956,344 1996 831,922 579,556 1,411,478 3,613,307 579,556 3,033,751 4,445,229 2000 969,320 890,180 1,859,500 7,590,229 890,180 6,700,049 8,559,549
US importsOriginal UN
importsVA of HK re-exports
Revised UN imports
Original UN imports
VA of HK re-exports
Revised UN imports
from China + Hong Kong
1988 10,744,705 1,675,893 12,420,598 9,265,279 1,675,893 7,589,386 20,009,984 1992 10,260,526 6,601,843 16,862,369 27,446,823 6,601,843 20,844,980 37,707,349 1996 10,256,959 9,308,256 19,565,215 54,393,721 9,308,256 45,085,465 64,650,680 2000 11,968,327 13,364,682 25,333,009 107,611,395 13,364,682 94,246,713 119,579,722
German importsOriginal UN
importsVA of HK re-exports
Revised UN imports
Original UN imports
VA of HK re-exports
Revised UN imports
from China + Hong Kong
1988 2,597,184 282,571 2,879,755 2,445,061 282,571 2,162,490 5,042,245 1992 3,027,808 1,420,398 4,448,206 7,466,781 1,420,398 6,046,383 10,494,589 1996 2,269,285 2,100,912 4,370,197 11,900,293 2,100,912 9,799,381 14,169,578 2000 2,232,521 2,346,920 4,579,441 16,746,042 2,346,920 14,399,122 18,978,563
German imports from HK German imports from China
US imports from China
Canada imports from ChinaCanada imports from HK
US imports from HK
Table 5B: Adjusted Trade Balance between the U.S. and China, 1988-2000
year US imports from China
China imports from US
Trade deficit % decrease of trade deficit after
1988 UN recorded imports 9,265,279 4,999,888 4,265,3911988 HK VA adjusted imports 7,589,386 4,999,888 2,589,498 39%1992 UN recorded imports 27,446,823 9,579,328 17,867,4951992 HK VA adjusted imports 20,844,980 9,579,328 11,265,652 37%1996 UN recorded imports 54,393,721 17,082,106 37,311,6151996 HK VA adjusted imports 45,085,465 17,082,106 28,003,359 25%2000 UN recorded imports 107,611,395 22,370,953 85,240,4422000 HK VA adjusted imports 94,246,713 22,370,953 71,875,760 16%

48
7. Documentation
The data are stored as SAS and STATA files by year.
A. DISAGGREGATE WORLD TRADE FLOWS
The variables included in WTF??.SAS7DBAT and WTF??.DTA where ?? = 62, 63,…,00 are:
Variable Explanation DOT Direction of trade (1=Data from importer, 2=Data from exporter) SITC Standard International Trade Classification Revision 2 ICode Importer country code ECode Exporter country code Importer Importer country name Exporter Exporter country name Unit Units or measurement (see below) Year 4-digit year Quantity Quantity (only for years 1984 – 2000) Value Thousands of US dollars Quantity Unit Codes (Blank indicates quantity unavailable or less than one-half a unit) A Area (1,000 square meters) H Energy (1,000 kilowatt hours) K Weight (kilograms) L Length (1,000 meters) N Units (number of items) P Pairs (number of pairs) V Volume (cubic meters) W Weight (metric tons) B. AGGREGATE BILATERAL TRADE FLOWS
The bilateral trade between countries (i.e., summed across all SITC commodities) is stored as
WTF_BILAT.SAS7DBAT and WTF_BILAT.DTA.
Variable Explanation ICode Importer country code ECode Exporter country code Importer Importer country name Exporter Exporter country name Value?? Thousands of US dollars where ?? = 62, 63,…,00

49
C. HONG KONG AND CHINA TRADE FLOWS ADJUSTMENT
The Hong Kong value-added adjustment files are included separately from the master data files
by years as China_HK??.SAS7DBAT and China_HK??.DTA where ?? = 88, 89,…,00.
Variable Explanation DOT Direction of trade (1=Data from importer, 2=Data from exporter) SITC Standard International Trade Classification Revision 2 ICode Importer country code ECode Exporter country code Importer Importer country name Exporter Exporter country name Unit Units of measurement (see above) Year 4-digit year Quantity Quantity (only for years 1984 – 2000) Value Thousands of US dollars (same as in WTF files) Value_adj Thousands of US dollars (revised value)

50
References China, Republic of China (1987), Yearly Statistics of Imports and Exports, the Trade of China,
Taiwan District,1986, L-Statistical Series, No. 1, Statistical Department, Inspectorate General of Customs, Taipei, Taiwan.
________________ ______(1988), Yearly Statistics of Imports and Exports, the Trade of China, Taiwan District, 1987 L- Statistical Series, No.1, Statistical Department, Inspectorate General of Customs, Taipei, Taiwan.
_______________ ______(1989), Yearly Statistics of Imports and Exports, the Trade of China, Taiwan District, 1988 L-Statistical Series No. 1, Statistical Department, Inspectorate of Customs, Taipei, Taiwan.
_____________________(1990), Monthly Statistics of Imports, December 1989, The Republic of China, Taiwan District, Statistical Department, Inspectorate General of Customs, Taipei, Taiwan.
______________ ______(1992), Monthly Statistics of Imports, December 1991, The Republic of China, Taiwan District, Statistical Department, Inspectorate General of Customs, Taipei, Taiwan.
________________ ______(1999), Statistical Yearbook of the Republic of China, 1999, Directorate General of Budget, Accounting, and Statistics, Executive Yuan. Republic of China
_________________ _____(2002), Statistical Yearbook of the Republic of China ,2002, Directorate General of Budget, Accounting, and Statistics, Executive Yuan, Republic of China, also available at http://www.stat.gov.tw/bs2/2002YearBook.pdf.
Feenstra, Robert C., 1996, “U.S. Imports, 1972-1994: Data and Concordances,” NBER Working Paper 5515. Feenstra, Robert C., 1997, “U.S. Exports, 1972-1994: With State Exports and Other U.S. Data,” NBER Working Paper 5990. Feenstra, Robert C., Robert E. Lipsey and Harry P. Bowen, 1997, “World Trade Flows,
1970-1992, with Production and Tariff Data,” NBER Working Paper 5910. Feenstra, Robert C., John Romalis, and Peter K. Schott, 2002, “U.S. Imports, Exports
and Tariff Data, 1989-2001,” NBER Working Paper 9387. Feenstra, Robert C., Wen Hai, Wing T. Woo, and Shunli Yao, 1999, “Discrepancies in
International Data: An Application to China-Hong Kong Entrepôt Trade,” The American Economic Review, Vol. 89, No. 2.
Hengeveld, Richard, and Jaap Rodenburg, Editors (1995) Embargo: Apartheid’s Oil Secrets Revealed, Shipping Research Bureau, Amsterdam, Amsterdam University Press.
United Nations (1963), Commodity Indexes for the Standard International Trade Classification, Revised, Statistical Papers, Series M, No. 38, New York, United Nations.
____________ (1975), Standard International Trade Classification Revision 2, Statistical Papers, Series M, No. 34/Rev. 2, New York, United Nations.
____________ (1990), Yearbook of International Trade Statistics, 1988, New York, United Nations
____________ (1991), Yearbook of International Trade Statistics, 1989, New York, United Nations.
____________ (1993), Yearbook of International Trade Statistics, 1992, New York, United Nations.
51
____________ (1994), Yearbook of International Trade Statistics, 1993, Volume 1, New York, United Nations.
____________ (1995), Monthly Bulletin of Statistics, Vol. XLIX,, No. 4, New York, United Nations, April.
____________ (1996), Yearbook of International Trade Statistics, 1995, Volume 1, New York, United Nations.
____________ (1999), Yearbook of International Trade Statistics, 1998, Volume, 1, New York, United Nations.
____________ (2000), Yearbook of International Trade Statistics, 1999, Volume 1, New York, United Nations.
____________ (2003), Yearbook of International Trade Statistics, 2001, Volume 1, New York, United Nations.
_____________(2004), UN Commodity Trade Statistics Database (accessed on October 26, 2004 at http://unstats.un.org/unsd/comtrade).
U. S. Energy Information Administration (2004a), World Oil Market and Oil Price Chronologies, web site http://www.eia.doe.gov/emeu/cabs/chron.html.
________________________________ (2004b), South Africa Country Analysis Brief, web site http://www.eia.doc.gov/emeu/cabs/safrica.html.
_________________________________ (2004c) OECD Gross Oil Imports from Iraq, 1991-2003, International Petroleum Monthly, Table 4.17, Washington, D.C., U.S. Department of Energy, June 2004 (accessed July 20, 2004, at URL http://www.eia.doe.gov/emeu/ipsr/t417.xls).
__________________________________ (2004d), Annual World Oil Market and Oil Price Chronologies, 1970-2003, International Petroleum Monthly, Washington, D.C., U.S. Department of Energy, June 2004 (accessed July 20, 2004, at URL http://www.eia.doe.gov/emeu/cabs/chron2003.xls).
_____________________________ (2004e), Israel Country Analysis Brief, Washington, D.C., U.S. Department of Energy (accessed June 29, 2004 at URL http://www.eia.doe.gov/emeu/cabs/israel.html).
U.S., International Trade Administration (2004), Israel Energy Overview, Washington, D.C., U.S. Department of Commerce (at URL http://www.ita.doc.gov/td/energy/israel/htm).

52
Appendix A: NBER-UN Country Codes
The UN data keeps track of a country by a 2-digit region code and a 3-digit specific
country code. The NBER-UN code consists of 6 digits where the first 5 digits are the
concatenation of the UN region and country codes while the last digit is a specific modifier that
equals to zero in almost all the cases (Feenstra, Romalis, and Schott, 2002). The following table
gives a complete list of the UN codes and country abbreviation along with the corresponding
NBER-UN codes and country abbreviation, the valid period for the codes, and the full
description of the UN country.
In some cases, the UN codes are not accounted for by the 6-digit Standard Classification
of Customs Areas and Territories used by Statistics Canada in their World Trade Database.
Consequently, these UN codes are also new to the NBER-UN codes. For the most part, these
codes consist of former countries which dated before the start of this dataset. Three such
countries are Former Rhodesia NYAS, Former Tangayika, and Former Zanzibar-Pemb. Other
UN codes newly added to the NBER-UN codes correspond to the regions consisting of the
Occupied Palestinian Territory, Neutral Zone, and Asia West Not Elsewhere Specified.
UN Codes NBER-UN 62-83 83-00 Name Code Name Period Full UN description 0 00 000 World 100000 World 1962-2061 World 710 11 710 South Africa 117100 South Africa 2000-2061 South Africa 11 711 S.Afr.Cus.Un 117100 South Africa 1962-1999 South African Customs Union 12 13 012 Algeria 130120 Algeria 1962-2061 Algeria 13 290 Africa N.NES 138960 North Africa NES 1962-2061 North Africa Not Elsewhere Specified 434 13 434 Libya 134340 Libya 1962-2061 Libyan Arab Jamahiriya 504 13 504 Morocco 135040 Morocco 1962-2061 Morocco 732 13 732 Westn.Sahara 135040 Morocco 1962-2061 Western Sahara 736 13 736 Sudan 137360 Sudan 1962-2061 Sudan 788 13 788 Tunisia 137880 Tunisia 1962-2061 Tunisia 818 13 818 Egypt 138180 Egypt 1962-2061 Egypt 120 14 120 Cameroon 141200 Cameroon 1962-2061 Cameroon 140 14 140 Cent.Afr.Rep 141400 Cent.Afr.Rep 1962-2061 Central African Republic 148 14 148 Chad 141480 Chad 1962-2061 Chad 178 14 178 Congo 141780 Congo 1962-2061 Congo 226 14 226 Eq.Guinea 162260 Eq.Guinea 1962-2061 Equatorial Guinea

53
266 14 266 Gabon 142660 Gabon 1962-2061 Gabon 14 472 Afr.CACEU NS 148960 Afr.CACEU NS 1962-2061 Africa CACEU Not Elsewhere Specified24 16 024 Angola 160240 Angola 1962-2061 Angola 72 16 072 Botswana 117100 South Africa 2000-2061 Botswana 86 16 086 Br.Ind.Oc.Tr 166900 Seychelles 1962-2061 British Indian Ocean Territories 108 16 108 Burundi 161080 Burundi 1962-2061 Burundi 132 16 132 Cape Verde 166240 GuineaBissau 1962-2061 Cape Verde 174 16 174 Comoros 166380 Fr Ind O 1962-2061 Comoros 180 16 180 Dem.Rp.Congo 161800 Dem.Rp.Congo 1962-2061 Congo Dem. Republic 204 16 204 Benin 162040 Benin 1962-2061 Benin 230 16 230 Fmr Ethiopia 162300 Ethiopia 1962-1992 Frm Ethiopia (until 1992) 16 231 Ethiopia 162300 Ethiopia 1993-2061 Ethiopia 16 232 Eritrea 162300 Ethiopia 1993-2061 Eritrea 260 16 260 Fr.So.Ant.Tr 166380 Fr Ind O 1962-2061 French South Antartic Territories 262 16 262 Djibouti 162620 Djibouti 1962-2061 Djibouti 270 16 270 Gambia 162700 Gambia 1962-2061 Gambia 288 16 288 Ghana 162880 Ghana 1962-2061 Ghana 324 16 324 Guinea 163240 Guinea 1962-2061 Guinea 384 16 384 Cote Divoire 163840 Cote Divoire 1962-2061 Cote Divoire 404 16 404 Kenya 164040 Kenya 1962-2061 Kenya 426 16 426 Lesotho 117100 South Africa 2000-2061 Lesotho 430 16 430 Liberia 164300 Liberia 1962-2061 Liberia 450 16 450 Madagascar 164500 Madagascar 1962-2061 Madagascar 454 16 454 Malawi 164540 Malawi 1965-2061 Malawi 466 16 466 Mali 164660 Mali 1962-2061 Mali 478 16 478 Mauritania 164780 Mauritania 1962-2061 Mauritania 480 16 480 Mauritius 164800 Mauritius 1962-2061 Mauritius 508 16 508 Mozambique 165080 Mozambique 1962-2061 Mozambique 516 16 516 Namibia 117100 South Africa 1962-2061 Namibia 562 16 562 Niger 165620 Niger 1962-2061 Niger 566 16 566 Nigeria 165660 Nigeria 1962-2061 Nigeria 16 577 Afr.Other NS 168960 Afr.Other NS 1962-2061 Other Africa Not Elsewhere Specified 624 16 624 GuineaBissau 166240 GuineaBissau 1962-2061 Guinea Bissau 638 16 638 Reunion 166380 Fr Ind O 1962-1995 Reunion 646 16 646 Rwanda 166460 Rwanda 1962-2061 Rwanda 654 16 654 St.Helena 166540 St.Helena 1962-2061 Saint Helena 678 16 678 Sao Tome Prn 166240 GuineaBissau 1962-2061 Sao Tome and Principe 686 16 686 Senegal 166860 Senegal 1962-2061 Senegal 690 16 690 Seychelles 166900 Seychelles 1962-2061 Seychelles 694 16 694 Sierra Leone 166940 Sierra Leone 1962-2061 Sierra Leone 706 16 706 Somalia 167060 Somalia 1962-2061 Somalia 716 16 716 Zimbabwe 167160 Zimbabwe 1965-2061 Zimbabwe 16 717 Fm Rhod Nyas 167170 Fm Rhod Nyas 1962-1964 Frm Rhodesia NYAS (until 1964) 748 16 748 Swaziland 117100 South Africa 2000-2061 Swaziland 768 16 768 Togo 167680 Togo 1962-2061 Togo 800 16 800 Uganda 168000 Uganda 1962-2061 Uganda 834 16 834 Tanzania 168340 Tanzania 1965-2061 United Republic of Tanzania 16 835 Fm Tanganyik 168350 Fm Tanganyik 1962-1964 Frm Tangayika (until 1964) 16 836 Fm Zanz-Pemb 168360 Fm Zanz-Pemb 1962-1964 Frm Zanzibar-Pemb. (until 1964) 854 16 854 Burkina Faso 168540 Burkina Faso 1962-2061 Burkina Faso 894 16 894 Zambia 168940 Zambia 1965-2061 Zambia 124 21 124 Canada 211240 Canada 1962-2061 Canada 630 21 841 USA, P.Rico 218400 USA 1962-1980 Frm USA ex.US Virgin Islds (until 80)840 21 842 USA,PR,USVI 218400 USA 1981-2061 USA, incl. Puerto Rico and US Virgin Islands60 22 060 Bermuda 220600 Bermuda 1962-2061 Bermuda 304 22 304 Greenland 223040 Greenland 1962-2061 Greenland

54
666 22 666 St.Pierre,Mq 226660 St.Pierre Mq 1962-2061 Saint Pierre and Miquelon 32 33 032 Argentina 330320 Argentina 1962-2061 Argentina 68 33 068 Bolivia 330680 Bolivia 1962-2061 Bolivia 76 33 076 Brazil 330760 Brazil 1962-2061 Brazil 152 33 152 Chile 331520 Chile 1962-2061 Chile 170 33 170 Colombia 331700 Colombia 1962-2061 Colombia 218 33 218 Ecuador 332180 Ecuador 1962-2061 Ecuador 33 473 LAIA NES 338960 LAIA NES 1962-2061 LAIA Not Elsewhere Specified 484 33 484 Mexico 334840 Mexico 1962-2061 Mexico 600 33 600 Paraguay 336000 Paraguay 1962-2061 Paraguay 604 33 604 Peru 336040 Peru 1962-2061 Peru 858 33 858 Uruguay 338580 Uruguay 1962-2061 Uruguay 862 33 862 Venezuela 338620 Venezuela 1962-2061 Venezuela 188 34 188 Costa Rica 341880 Costa Rica 1962-2061 Costa Rica 222 34 222 El Salvador 342220 El Salvador 1962-2061 El Salvador 320 34 320 Guatemala 343200 Guatemala 1962-2061 Guatemala 340 34 340 Honduras 343400 Honduras 1962-2061 Honduras 34 471 CACM NES 348960 CACM NES 1962-2061 CACM Not Elsewhere Specified 558 34 558 Nicaragua 345580 Nicaragua 1962-2061 Nicaragua 28 35 028 Antigua,Barb 356580 St.Kt-Nev-An 1962-2061 Antigua and Barbuda 44 35 044 Bahamas 350440 Bahamas 1962-2061 Bahamas 52 35 052 Barbados 350520 Barbados 1962-2061 Barbados 92 35 092 Br.Virgin Is 356580 St.Kt-Nev-An 1962-2061 British Virgin Islands 35 129 Carib. NES 358960 Carib. NES 1962-2061 Caribbean Not Elsewhere Specified 136 35 136 Cayman Is 353880 Jamaica 1962-2061 Cayman Islands 192 35 192 Cuba 351920 Cuba 1962-2061 Cuba 212 35 212 Dominica 356580 St.Kt-Nev-An 1962-2061 Dominica 214 35 214 Dominican Rp 352140 Dominican Rp 1962-2061 Dominican Republic 308 35 308 Grenada 356580 St.Kt-Nev-An 1962-2061 Grenada 312 35 312 Guadeloupe 353120 Guadeloupe 1962-2061 Guadeloupe 332 35 332 Haiti 353320 Haiti 1962-2061 Haiti 388 35 388 Jamaica 353880 Jamaica 1962-2061 Jamaica 474 35 474 Martinique 353120 Guadeloupe 1962-1995 Martinique 500 35 500 Montserrat 356580 St.Kt-Nev-An 1962-2061 Montserrat 35 530 Neth.Antiles 355320 Neth.Ant.Aru 1988-2061 Netherlands Antilles 532 35 532 Neth.Ant.Aru 355320 Neth.Ant.Aru 1962-1987 Frm Neth. Antilles/ Aruba (until 1988) 35 533 Aruba 355320 Neth.Ant.Aru 1988-2061 Aruba 658 35 658 St.Kt-Nev-An 356580 St.Kt-Nev-An 1962-1980 Frm St.Kitts/Nev/Anguilla (until 1980) 35 659 St.Kitts-Nev 356580 St.Kt-Nev-An 1981-2061 Saint Kitts and Nevis 660 35 660 Anguilla 356580 St.Kt-Nev-An 1981-2061 Anguilla 662 35 662 St.Lucia 356580 St.Kt-Nev-An 1962-2061 Saint Lucia 670 35 670 St.Vincent,G 356580 St.Kt-Nev-An 1962-2061 Saint Vincent and the Grenadines 780 35 780 Trinidad Tbg 357800 Trinidad Tbg 1962-2061 Trinidad and Tobago 796 35 796 Turks,Caicos 353880 Jamaica 1962-2061 Turks and Caicos Islands 850 35 850 US.Virgin Is 218400 USA 1962-1980 Frm US Virgin Islands (until 1980) 80 36 080 Br.Antr.Terr 360800 Br.Antr.Terr 1962-2061 British Antartic Territories 84 36 084 Belize 360840 Belize 1962-2061 Belize 238 36 238 Falkland Is 362380 Falkland Is 1962-2061 Falkland Islands 254 36 254 Fr.Guiana 362540 Fr.Guiana 1962-1995 French Guiana 328 36 328 Guyana 363280 Guyana 1962-2061 Guyana 590 36 590 Fm Pan.Ex-CZ 365900 Panama 1962-1977 Frm Panama ex.Canal Zone (until 1977) 36 591 Panama 365900 Panama 1978-2061 Panama 592 36 592 Fm Panama CZ 365900 Panama 1962-1977 Frm Panama Canal Zone (until 1977) 36 636 Amer.Rest NS 368960 US NES 1962-2061 Rest of America Not Elsewhere Specified740 36 740 Suriname 367400 Suriname 1962-2061 Suriname 376 41 376 Israel 413760 Israel 1962-2061 Israel

55
392 41 392 Japan 413920 Japan 1962-2061 Japan 48 44 048 Bahrain 440480 Bahrain 1962-2061 Bahrain 196 44 196 Cyprus 441960 Cyprus 1962-2061 Cyprus 274 44 275 Occ.Pal.Terr 442750 Occ.Pal.Terr 2000-2061 Occupied Palestinian Territory 364 44 364 Iran 443640 Iran 1962-2061 Iran, Islamic Republic of 368 44 368 Iraq 443680 Iraq 1962-2061 Iraq 400 44 400 Jordan 444000 Jordan 1962-2061 Jordan 414 44 414 Kuwait 444140 Kuwait 1962-2061 Kuwait 422 44 422 Lebanon 444220 Lebanon 1962-2061 Lebanon 512 44 512 Oman 445120 Oman 1962-2061 Oman 536 44 536 Neutral Zone 445360 Neutral Zone 1962-2061 Neutral Zone 634 44 634 Qatar 446340 Qatar 1962-2061 Qatar 682 44 682 Saudi Arabia 446820 Saudi Arabia 1962-2061 Saudi Arabia 720 44 720 Fm Yemen Dm 447200 Fm Yemen Dm 1962-1990 Frm Democratic Yemen (until 1990) 760 44 760 Syria 447600 Syria 1962-2061 Syrian Arab Republic 784 44 784 Untd Arab Em 447840 Untd Arab Em 1962-2061 United Arab Emirates 792 44 792 Turkey 447920 Turkey 1962-2061 Turkey 44 879 Asia West NS 448790 Asia West NS 1962-2061 Asia West Not Elsewhere Specified 886 44 886 Fm Yemen AR 448860 Fm Yemen AR 1962-1990 Frm Arab Rep. of Yemen (until 1990) 44 887 Yemen 448870 Yemen 1991-2061 Yemen 4 45 004 Afghanistan 450040 Afghanistan 1962-2061 Afghanistan 50 45 050 Bangladesh 450500 Bangladesh 1972-2061 Bangladesh 64 45 064 Bhutan 450000 Asia NES 1962-2061 Bhutan 96 45 096 Brunei Darsm 450000 Asia NES 1962-2061 Brunei Darussalam 104 45 104 Myanmar 451040 Myanmar 1962-2061 Myanmar 116 45 116 Cambodia 451160 Cambodia 1962-2061 Cambodia 144 45 144 Sri Lanka 451440 Sri Lanka 1962-2061 Sri Lanka 156 45 156 China 481560 China 1962-2061 China 900 90 838 Free Zones* 481561 China FTZ 1984-2061 China Foreign Trade Zone 908 90 839 Spec Cats* 481562 China SC 1984-2061 China Special Categories 898 90 899 Areas NES* 481563 China NES 1984-2061 China Areas NES 344 45 344 China HK SAR 453440 China HK SAR 1962-2061 Hong Kong Special Administrative Region356 45 356 India Ex Sik 453560 India 1962-1974 Frm India excl. Sikkim (until 1974) 360 45 360 Indonesia 453600 Indonesia 1962-2061 Indonesia 408 45 408 Korea D P Rp 484080 Korea D P Rp 1962-2061 Korea, Democratic People's Republic of410 45 410 Korea Rep. 454100 Korea Rep. 1962-2061 Korea, Republic of 418 45 418 Lao P.Dem.R 454180 Lao P.Dem.R 1962-2061 Lao People's Democratic Republic 446 45 446 China MC SAR 454460 China MC SAR 1962-2061 Macau Special Administrative Region 45 457 Sarawak 454580 Malaysia 1962-1963 Frm Sarawak (until 1963) 458 45 458 Malaysia 454580 Malaysia 1964-2061 Malaysia 45 459 Pen Malaysia 454580 Malaysia 1962-1963 Frm Peninsula Malaysia (until 63) 45 461 Sabah 454580 Malaysia 1962-1963 Frm Sabah (until 1963) 462 45 462 Maldives 453600 Indonesia 1962-2061 Maldives 896 45 490 Asia Othr.NS 458960 Taiwan 1962-2061 Asia Other Not Elsewhere Specified 496 45 496 Mongolia 484960 Mongolia 1962-2061 Mongolia 524 45 524 Nepal 455240 Nepal 1962-2061 Nepal 586 45 586 Pakistan 455860 Pakistan 1972-2061 Pakistan 45 588 Pakistan E/W 455860 Pakistan 1962-1971 Frm Pakistan East/West (until 71) 608 45 608 Philippines 456080 Philippines 1962-2061 Philippines 626 45 626 East Timor 453600 Indonesia 1962-2061 East Timor 650 45 647 Ryukyu Is 413920 Japan 1962-1972 Frm Ryukyu Island (until 1972) 698 45 698 Sikkim 453560 India 1962-1974 Frm Sikkim (until 1974) 45 699 India 453560 India 1975-2061 India 702 45 702 Singapore 457020 Singapore 1962-2061 Singapore 704 45 704 Viet Nam 487040 Viet Nam 1975-2061 Viet Nam 764 45 764 Thailand 457640 Thailand 1962-2061 Thailand

56
866 45 866 Fm Vietnm DR 487040 Viet Nam 1962-1974 Frm Viet Nam Democratic (until 1974)868 45 868 Fm Vietnm Rp 487040 Viet Nam 1962-1974 Frm Viet Nam Republic (until 1974) 46 031 Azerbaijan 460310 Azerbaijan 1992-2061 Azerbaijan 46 051 Armenia 460510 Armenia 1992-2061 Armenia 46 268 Georgia 462680 Georgia 1992-2061 Georgia 46 398 Kazakhstan 463980 Kazakhstan 1992-2061 Kazakhstan 46 417 Kyrgyzstan 464170 Kyrgyzstan 1992-2061 Kyrgyzstan 46 762 Tajikistan 467620 Tajikistan 1992-2061 Tajikistan 46 795 Turkmenistan 467950 Turkmenistan 1992-2061 Turkmenistan 46 860 Uzbekistan 468600 Uzbekistan 1992-2061 Uzbekistan 40 53 040 Austria 550400 Austria 1962-2061 Austria 53 056 Belgium 530560 Belgium-Lux 1999-2061 Belgium 56 53 058 Belgium-Lux 530560 Belgium-Lux 1962-2061 Belgium, Luxembourg 208 53 208 Denmark 532080 Denmark 1973-2061 Denmark 53 246 Finland 552460 Finland 1995-2061 Finland 250 53 251 France,Monac 532500 France,Monac 1962-2061 France, Monaco and Overseas territories 53 276 Germany 532760 Germany 1991-2061 Germany 280 53 280 Fm German FR 532800 Fm German FR 1962-1990 Frm Germany, Federal (until 1990) 300 53 300 Greece 533000 Greece 1981-2061 Greece 372 53 372 Ireland 533720 Ireland 1973-2061 Ireland 674 53 381 Italy 533800 Italy 1962-2061 Italy, incl. San Marino and the Holy See380 53 381 Italy 533800 Italy 1962-2061 Italy, incl. San Marino and the Holy See442 53 442 Luxembourg 530560 Belgium-Lux 1999-2061 Luxembourg 53 492 Europe EU NS 538960 EEC NES 1962-2061 European Union Not Elsewhere Specified528 53 528 Netherlands 535280 Netherlands 1962-2061 Netherlands 620 53 620 Portugal 536200 Portugal 1986-2061 Portugal 724 53 724 Spain 537240 Spain 1986-2061 Spain 752 53 752 Sweden 557520 Sweden 1962-2061 Sweden 826 53 826 UK 538260 UK 1973-2061 United Kingdom 246 55 246 Finland 552460 Finland 1962-1994 Finland 352 55 352 Iceland 553520 Iceland 1971-2061 Iceland 578 55 579 Norway,Sb,JM 555780 Norway 1962-2061 Norway 55 697 Eur. EFTA NS 558960 Eur. EFTA NS 1962-2061 Europe EFTA Not Elsewhere Specified438 55 757 Switz.Liecht 557560 Switz.Liecht 1962-2061 Switzerland, Liechtenstein 756 55 757 Switz.Liecht 557560 Switz.Liecht 1962-2061 Switzerland, Liechtenstein 8 56 008 Albania 580080 Albania 1962-2061 Albania 100 56 100 Bulgaria 581000 Bulgaria 1962-2061 Bulgaria 200 56 200 Czechoslovak 582000 Czechoslovak 1962-1992 Frm Czechoslovakia (until 1992) 56 203 Czech Rep 582030 Czech Rep 1993-2061 Czech Republic 56 221 Eur. East NS 582210 E Europe NES 1962-2061 Europe East Not Elsewhere Specified 278 56 278 Fm German DR 582780 Fm German DR 1962-1990 Frm Germany, Democratic (until 90) 348 56 348 Hungary 583480 Hungary 1962-2061 Hungary 616 56 616 Poland 586160 Poland 1962-2061 Poland 642 56 642 Romania 586420 Romania 1962-2061 Romania 56 703 Slovakia 587030 Slovakia 1993-2061 Slovakia 20 57 020 Andorra 532500 France,Monac 1962-2061 Andorra 234 57 234 Faeroe Is 532080 Denmark 1962-2061 Faeroe Islands 292 57 292 Gibraltar 572920 Gibraltar 1962-2061 Gibraltar 470 57 470 Malta 574700 Malta 1962-2061 Malta 57 568 Eur. Othr.NS 578960 Eur. Other NES 1962-2061 Europe Other Not Elsewhere Specified890 57 890 Fm Yugoslav 598900 Fm Yugoslav 1962-1991 Frm SFR Yugoslavia (until 1991) 58 112 Belarus 581120 Belarus 1992-2061 Belarus 58 233 Estonia 582330 Estonia 1992-2061 Estonia 58 428 Latvia 584280 Latvia 1992-2061 Latvia 58 440 Lithuania 584400 Lithuania 1992-2061 Lithuania 58 498 Rep Moldova 584980 Rep Moldova 1992-2061 Republic of Moldova

57
58 643 Russian Fed 586430 Russian Fed 1992-2061 Russian Federation 58 804 Ukraine 588040 Ukraine 1992-2061 Ukraine 59 070 Bosnia Herzg 590700 Bosnia Herzg 1992-2061 Bosnia and Herzegovina 59 191 Croatia 591910 Croatia 1992-2061 Croatia 59 705 Slovenia 597050 Slovenia 1992-2061 Slovenia 59 807 TFYR Macedna 598070 TFYR Macedna 1993-2061 TFYR Macedonia 59 891 Yugoslavia 598910 Yugoslavia 1992-2061 Yugoslavia 810 68 810 Fm USSR 688100 Fm USSR 1962-1991 Frm USSR (until 1991) 36 71 036 Australia 710360 Australia 1962-2061 Australia 554 71 554 New Zealand 715540 New Zealand 1962-2061 New Zealand 90 72 090 Solomon Is 722960 Kiribati 1962-2061 Solomon Islands 162 72 162 Christmas Is 710360 Australia 1962-2061 Christmas Islands 166 72 166 Cocos Is 710360 Australia 1962-2061 Cocos (Keeling) Islands 184 72 184 Cook Is 715540 New Zealand 1962-2061 Cook Islands 242 72 242 Fiji 722420 Fiji 1962-2061 Fiji 258 72 258 Fr.Polynesia 725400 New Calednia 1962-2061 French Polynesia 296 72 296 Kiribati 722960 Kiribati 1962-2061 Kiribati 520 72 520 Nauru 722420 Fiji 1962-2061 Nauru 72 527 Oceania NES 728960 Oth.Oceania NES 1962-2061 Oceania Not Elsewhere Specified 540 72 540 New Calednia 725400 New Calednia 1962-2061 New Caledonia 548 72 548 Vanuatu 722960 Kiribati 1962-2061 Vanuatu 570 72 570 Niue 715540 New Zealand 1962-2061 Niue 574 72 574 Norfolk Is 710360 Australia 1962-2061 Norfolk Islands 72 580 N.Mariana Is 728960 Oth.Oceania NES 1992-2061 Northern Mariana Islands 582 72 582 Fm Pacific I 368960 US NES 1962-1991 Frm Pacific Islands (until 1991) 16 72 583 Micronesia 368960 US NES 1992-2061 Micronesia, Federated States of 72 584 Marshall Is 368960 US NES 1992-2061 Marshall Islands 72 585 Palau 368960 US NES 1992-2061 Palau 598 72 598 Papua N.Guin 725980 Papua N.Guin 1962-2061 Papua New Guinea 612 72 612 Pitcairn 722960 Kiribati 1962-2061 Pitcairn 772 72 772 Tokelau 715540 New Zealand 1962-2061 Tokelau 776 72 776 Tonga 722420 Fiji 1962-2061 Tonga 798 72 798 Tuvalu 722960 Kiribati 1962-2061 Tuvalu 316 72 849 US Msc.Pac.I 368960 US NES 1962-2061 US Miscellaneous Pacific Islands 876 72 876 Wallis Fut.I 725400 New Calednia 1962-2061 Wallis and Futuna Islands 882 72 882 Samoa 728882 Samoa 1962-2061 Samoa 904 90 837 Bunkers 908960 Areas NES 1962-2061 Bunkers 900 90 838 Free Zones 908960 Areas NES 1962-2061 Free Zones 908 90 839 Spec Cats 908960 Areas NES 1962-2061 Special Categories 898 90 899 Areas NES 908960 Areas NES 1962-2061 Not Specified *Applies only to the cases where China is the reporting country.
The following 3-digit country codes for years 1962-1983 do not have corresponding NBER-UN
country codes and are dropped from the dataset. The table below shows the frequency of these
country codes in the data by year.
Frequency by Year
Code 1970 1973 1974 1975 1976 1977 1978 1979 1980 1981 488 1 12 6 872 2 4 3 5 6 3 3 3 3 2

58
Appendix B: NBER-UN Country Code Notation (1962-2000) 1. Cases where UN country codes are revised to match Feenstra, Lipsey, and Bowen (FLB, 1997) 100000 WORLD (appears as 000000 in UN) (a) Africa
117100 S AFRICA (appears as 117110 in UN; incl. Botswana, UN uses 160720; incl. Lesotho, UN uses 164260 until 1988; incl. Namibia, UN uses 165160; incl. Swaziland, UN uses 167480, 2000 and later) 138960 NORTH AFRICA NES (appears as 132900 in UN) 148960 CEUCA NES (appears as 144720 in UN) 162260 EQUATORIAL GUINEA (appears as 142260 in UN, 1996 and later) 162300 ETHIOPIA (appears as 162310 in UN, 1993 and later; incl. Eritrea, UN uses 162320, 1993 and later) 166240 GUINEA-BISSAU (incl. Cape Verde, UN uses 161320; incl. Sao Tome Prn, UN uses 160780 until 1975) 168960 AFRICA OTH. NES (appears as 165770 in UN) 166900 SEYCHELLES (incl. British Indian Occupied Terr, UN uses 160860) 166380 FR IND O (incl. Comoros, UN uses 161740; incl. Reunion, UN uses 166380; incl. Fr.So.Ant.Tr, UN uses 162600) 135040 Morocco (incl. W.Sahara, UN uses 137320) (b) Americas 218400 USA (appears as 218410 in UN, w/out Virgin Is until 1980, appears as 218420 in UN, w/ Virgin Is, 1981 and later, both categories incl. Puerto Rico; US Virgin Is appears as 358500 in UN until 1980) 368960 REST AMERICA NES (appears as 366360 in UN) 365900 PANAMA (appears as 365910 in UN, 1978 and later; incl. Former Panama Canal, UN uses 365920 until 1977) (c) Caribbean Islands 338960 LAIA NES (appears as 334730 in UN) 348960 CACM NES (appears as 344710 in UN) 353120 GUADELOUPE (incl. Martinique, UN uses 354740) 355320 NETH.ANT.ARU (appears as 355300 in UN w/o Aruba 1988 and later; incl. Aruba,
UN uses 355330, 1988 and later) 356580 ST KITTS (incl. Anguilla, UN uses 356600; incl. Dominica, UN uses 352120;
incl. Montserrat, UN uses 355000; incl. St Lucia, UN uses 356620; incl. St Vincent, UN uses 356700; incl. Grenada, UN uses 353080, 1981 and later; incl. Br.Virgin Islands, UN uses 350920; incl. Antigua and Barbuda, UN uses 350280)
358960 CARIBBEAN NES (appears as 351290 in UN) 353880 JAMAICA (incl. Cayman Is, UN uses 351360; incl. Turks and Caicos, UN uses 357960) (d) Asia

59
453560 INDIA (appears as 456990 in UN, 1975 and later; incl. Sikkim,
UN uses 456980 until 1974) 453600 INDONESIA (incl. Maldives, UN uses 454620; incl. East Timor, UN uses 456260) 455860 PAKISTAN (appears as 455880 in UN until 1971) 454580 MALAYSIA (incl. Pen Malaysia, UN uses 454590 until 1963; incl. Sabah, UN uses 454610 until 1963; incl. Sarawak, UN uses 454570 until 1963;) 458960 TAIWAN (appears as Asia Othr.NS 454900 in UN) 481560 CHINA (appears as 451560 in UN) 484080 KOREA D P RP (appears as 454080 in UN) 484960 MONGOLIA (appears as 454960 in UN) 487040 VIETNAM (appears as 457040 in UN, 1975 and later; incl. Former Vietnam Dr, UN uses 458660 until 1974; Former Vietnam Rp, UN uses 458680 until 1974) 450000 ASIA NES (incl. Bhutan, UN uses 450640; incl. Brunei Darsm, UN uses 450960) (e) Western Europe 532080 DENMARK (incl. Faeroe Is, UN uses 572340) 532500 FRANCE (appears as 532510 in UN; incl. Monaco; incl. Andorra, UN uses 570200) 533800 ITALY (appears as 533810 in UN) 538960 EEC NES (appears as Europe EU NS 534920 in UN) 550400 AUSTRIA (appears as 530400 in UN, 1995 and later) 552460 FINLAND (appears as 532460 in UN, 1995 and later) 555780 NORWAY (appears as 555790 in UN) 557520 SWEDEN (appears as 537520 in UN, 1995 and later) 557560 SWITZERLAND (appears as 557570 in UN, incl. Liechtenstein) 558960 EUR. EFTA NES (appears as 556970 in UN) 578960 EUR. OTHER NES (appears as 575680 in UN) (f) Former East Germany and Eastern Europe: (the FLB, 1997 code 588960 FM EUR CPE NES no
longer appears): 580080 ALBANIA (appears as 560080 in UN) 581000 BULGARIA (appears as 561000 in UN) 582000 CZECHOSLOVAKIA (appears as 562000 in UN) 582030 CZECH REPUBLIC (appears as 562030 in UN, 1993 and later) 587030 SLOVAKIA (appears as 567030 in UN, 1993 and late) 582210 E EUROPE NES (appears as 562210 in UN) 583480 HUNGARY (appears as 563480 in UN) 586160 POLAND (appears as 566160 in UN) 586420 ROMANIA (appears as 566420 in UN) 598900 FM YOGOSLAVIA (appears as 578900 in UN, until 1991) (g) Oceania 710360 AUSTRALIA (incl. Christmas Is, UN uses 721620; incl. Norfolk Is, UN uses 725740; incl. Cocos Is, UN uses 721660)

60
715540 NEW ZEALAND (incl. Tokelau, UN uses 727720; incl. Niue, UN uses 725700; incl. Cook Is, UN uses 721840) 722420 FIJI (incl. Nauru, UN uses 725200; incl. Tonga, UN uses 727760) 722960 KIRIBATI (incl. Solomon Is, UN uses 720900; incl. Tuvalu, UN uses 725480; incl. Pitcairn, UN uses 726120) 725400 NEW CALEDONIA (incl. Fr Polynesia, UN uses 722580; incl. Wallis Fut.I, UN uses 728760) 728882 SAMOA (appears as 728820 in UN) 728960 OTH. OCEANIA NES (appears as 725270 in UN, incl. N.Mariana Is, UN uses 725800 ) 908960 AREAS NES (appears as 908990 in UN) 2. Cases where UN country codes are revised for aggregation to match FLB, 1997: (a) Belgium-Luxembourg Available in UN but not in FLB, 1997, and now aggregated to Belgium-Luxembourg 530560 530580 BELGIUM-LUX (appears as 530560 in FLB, 1997) 530560 BELGIUM (appears as 530560 in UN, 1999 and later) 534420 LUXEMBOURG (appears as 534420 in UN, 1999 and later) (b) US NES The following were available in UN but not in FLB, 1997, now aggregated to US NES 368960 725830 MICRONESIA 725840 MARSHALL ISLAND 725850 PALAU 725820 FM PACIFIC ISLANDS (until 1991) 728490 US MISC PAC I (US Miscellaneous Pacific Islands) (c) Miscellaneous The following were available in UN but not in FLB, 1997, now aggregated to Areas NES 908960 908370 BUNKERS 908380 FREE ZONES 908390 SPEC CATS (Special Categories) 3. Cases where new codes (not already in FLB, 1997) are retained in the revised UN data: (a) Asia: 454460 MACAU (merged with Indonesia in FLB, 1997) (b) Germany: Former West Germany and unified Germany both listed as 532800 in FLB, 1997, now broken up over the years as:

61
532800 W GERMANY (up to 1990) 532760 GERMANY (unified, 1991 and later) (c) Former Soviet Union (Europe): Former USSR (including new countries) listed as 688100 in FLB, 1997, now broken up over the years as: 581120 BELARUS (1992 and later) 582330 ESTONIA (1992 and later) 584280 LATVIA (1992 and later) 584400 LITHUANIA (1992 and later) 584980 REP MOLDOVA (1992 and later) 586430 RUSSIA (1992 and later) 588040 UKRAINE (1992 and later) 688100 FM USSR (until 1991) (d) Former Soviet Union (Asia): Former USSR (including new countries) listed as 688100 in FLB, 1997, now broken up over the years as: 460310 AZERBAIJAN (1992 and later) 460510 ARMENIA (1992 and later) 462680 GEORGIA (1992 and later) 463980 KAZAKHSTAN (1992 and later) 464170 KYRGYZSTAN (1992 and later) 467620 TAJIKISTAN (1992 and later) 467950 TURKMENISTAN (1992 and later) 468600 UZBEKISTAN (1992 and later) (e) Former Yugoslavia: Yugoslavia (including Croatia and Slovenia) listed as 598900 in FLB, 1997, now listed as: 598900 FM YUGOSLAVIA (until 1991) 597050 SLOVENIA (1992 and later) 598910 YUGOSLAVIA (1992 and later) 590700 BOSNIA HERZEGOVINA (1992 and later) 591910 CROATIA (1992 and later) 598070 TFYR MACEDONIA (1993 and later, included in Yugoslavia in 1992) (f) Others – Previously not listed in FLB, 1997 but in UN data 167170 FM RHOD NYAS (Former Rhodesia NYAS – until 1964) 168350 FM TANGANYIK (Former Tanganyika – until 1964) 168360 FM ZANZ PEMB (Former Zanzibar-Pemb. – until 1964) 442750 OCC. PAL. TERR (Occupied Palestinian Territory, 2000 and later) 448790 ASIA W NES (appears as ASIA CPE NES, 488960 in FLB, 1997) 445360 NEUTRAL ZONES 360800 BR.ANTR.TERR (British Antarctic Territories)

62
Appendix C: China FTZ and China SC in the UN Import Trade
As mentioned in section 5.1, China records imports from their own trade zones
differently from those imported from another country. For years 1984 to 2000, if the reporting
country is China (ICode = 481560) and the partner country is characterized as the “Free Zones”
(ECode = 908380) then the new partner country is given the name of China FTZ (China Free
Trade Zone) with a new ECode of 481561. Next, the value and quantity corresponding to the
newly created China FTZ is subtracted from Areas NES (ECode = 908960) by SITC to prevent
double counting. An example of the adjustment made to the UN import data is given below.
Similar steps are taken for creating China SC (ECode = 481562) from “Special Categories”
(ECode = 908390) and creating China NES (Ecode = 481563) from “Areas NES” (ECode =
908990), when China is the importing country.
UN Import Data (value in thousands of dollars)
DOT SITC ICode ECode Importer Exporter Unit Year Quantity Value 1 0342 481560 481561 China China FTZ W 1992 237 265 1 0342 481560 908960 China Areas NES W 1992 2,333 1,714 1 0360 481560 481561 China China FTZ W 1992 42 195 1 0360 481560 908960 China Areas NES W 1992 42 195
Adjusted UN Import Data (value in thousands of dollars)
DOT SITC ICode ECode Importer Exporter Unit Year Quantity Value 1 0342 481560 481561 China China FTZ W 1992 237 265 1 0342 481560 908960 China Areas NES W 1992 2,096 1,449 1 0360 481560 481561 China China FTZ W 1992 42 195
The following tables provide information regarding the value of import by China through their
free trade zones (China FTZ).
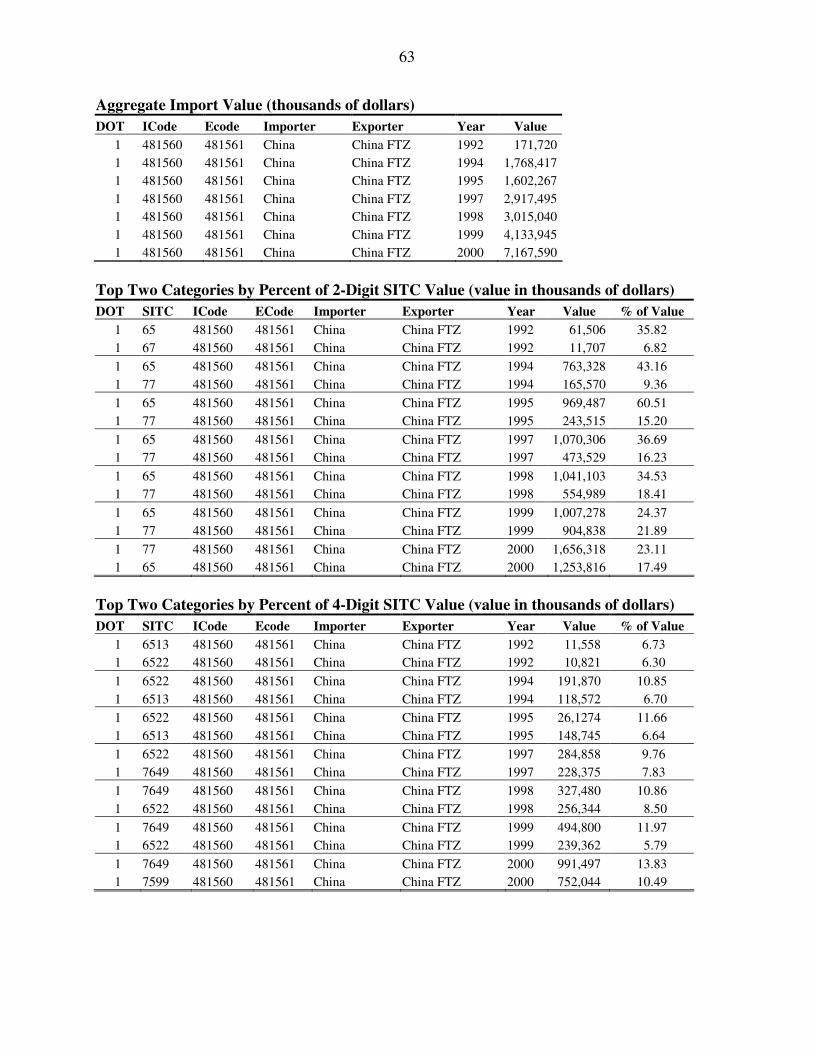
63
Aggregate Import Value (thousands of dollars) DOT ICode Ecode Importer Exporter Year Value
1 481560 481561 China China FTZ 1992 171,720 1 481560 481561 China China FTZ 1994 1,768,417 1 481560 481561 China China FTZ 1995 1,602,267 1 481560 481561 China China FTZ 1997 2,917,495 1 481560 481561 China China FTZ 1998 3,015,040 1 481560 481561 China China FTZ 1999 4,133,945 1 481560 481561 China China FTZ 2000 7,167,590
Top Two Categories by Percent of 2-Digit SITC Value (value in thousands of dollars) DOT SITC ICode ECode Importer Exporter Year Value % of Value
1 65 481560 481561 China China FTZ 1992 61,506 35.82 1 67 481560 481561 China China FTZ 1992 11,707 6.82 1 65 481560 481561 China China FTZ 1994 763,328 43.16 1 77 481560 481561 China China FTZ 1994 165,570 9.36 1 65 481560 481561 China China FTZ 1995 969,487 60.51 1 77 481560 481561 China China FTZ 1995 243,515 15.20 1 65 481560 481561 China China FTZ 1997 1,070,306 36.69 1 77 481560 481561 China China FTZ 1997 473,529 16.23 1 65 481560 481561 China China FTZ 1998 1,041,103 34.53 1 77 481560 481561 China China FTZ 1998 554,989 18.41 1 65 481560 481561 China China FTZ 1999 1,007,278 24.37 1 77 481560 481561 China China FTZ 1999 904,838 21.89 1 77 481560 481561 China China FTZ 2000 1,656,318 23.11 1 65 481560 481561 China China FTZ 2000 1,253,816 17.49
Top Two Categories by Percent of 4-Digit SITC Value (value in thousands of dollars) DOT SITC ICode Ecode Importer Exporter Year Value % of Value
1 6513 481560 481561 China China FTZ 1992 11,558 6.73 1 6522 481560 481561 China China FTZ 1992 10,821 6.30 1 6522 481560 481561 China China FTZ 1994 191,870 10.85 1 6513 481560 481561 China China FTZ 1994 118,572 6.70 1 6522 481560 481561 China China FTZ 1995 26,1274 11.66 1 6513 481560 481561 China China FTZ 1995 148,745 6.64 1 6522 481560 481561 China China FTZ 1997 284,858 9.76 1 7649 481560 481561 China China FTZ 1997 228,375 7.83 1 7649 481560 481561 China China FTZ 1998 327,480 10.86 1 6522 481560 481561 China China FTZ 1998 256,344 8.50 1 7649 481560 481561 China China FTZ 1999 494,800 11.97 1 6522 481560 481561 China China FTZ 1999 239,362 5.79 1 7649 481560 481561 China China FTZ 2000 991,497 13.83 1 7599 481560 481561 China China FTZ 2000 752,044 10.49