NBER WORKING PAPER SERIES THE CENTER AND THE …
47
NBER WORKING PAPER SERIES THE CENTER AND THE PERIPHERY: THE GLOBALIZATION OF FINANCIAL TURMOIL Graciela L. Kaminsky Carmen Reinhart Working Paper 9479 http://www.nber.org/papers/w9479 NATIONAL BUREAU OF ECONOMIC RESEARCH 1050 Massachusetts Avenue Cambridge, MA 02138 January 2003 We have received insightful comments and suggestions from Fernando Broner, Guillermo Calvo, and Takatoshi Ito, as well as participants at presentations held at the Third Joint Central Bank Research Conference on Risk Measurement and Systemic Risk, 2002, Basel, Switzerland; the LACEA 2002 Meeting (Madrid, Spain); Bank of England, Cornell University, George Washington University, London School of Economics, University of Maryland, and University of West Virginia. We are grateful to Amine Mati for superb research assistance. The views expressed herein are those of the authors and not necessarily those of the National Bureau of Economic Research. ©2003 by Graciela L. Kaminsky and Carmen Reinhart. All rights reserved. Short sections of text not to exceed two paragraphs, may be quoted without explicit permission provided that full credit including notice, is given to the source.
Transcript of NBER WORKING PAPER SERIES THE CENTER AND THE …

NBER WORKING PAPER SERIES
THE CENTER AND THE PERIPHERY:THE GLOBALIZATION OF FINANCIAL TURMOIL
Graciela L. KaminskyCarmen Reinhart
Working Paper 9479http://www.nber.org/papers/w9479
NATIONAL BUREAU OF ECONOMIC RESEARCH1050 Massachusetts Avenue
Cambridge, MA 02138January 2003
We have received insightful comments and suggestions from Fernando Broner, Guillermo Calvo, andTakatoshi Ito, as well as participants at presentations held at the Third Joint Central Bank ResearchConference on Risk Measurement and Systemic Risk, 2002, Basel, Switzerland; the LACEA 2002 Meeting(Madrid, Spain); Bank of England, Cornell University, George Washington University, London School ofEconomics, University of Maryland, and University of West Virginia. We are grateful to Amine Mati forsuperb research assistance. The views expressed herein are those of the authors and not necessarily those ofthe National Bureau of Economic Research.
©2003 by Graciela L. Kaminsky and Carmen Reinhart. All rights reserved. Short sections of text not toexceed two paragraphs, may be quoted without explicit permission provided that full credit including notice,is given to the source.

The Center and the Periphery: The Globalization of Financial TurmoilGraciela L. Kaminsky and Carmen ReinhartNBER Working Paper No. 9479January 2003JEL No. F0, F20, F30, G15
ABSTRACT
This paper studies how financial turbulence in emerging market countries can spread across borders.
We construct indices of "financial globalization" and evaluate the repercussions of turmoil in three
emerging markets, which experienced financial crises in the late 1990s: Brazil, Russia, and Thailand.
Our findings indicate that financial turbulence in these countries only spreads globally when they
affect asset markets in one or more of the world's financial centers. Otherwise, spillovers are
confined to countries in the same region. We also find that fragility in institutions in the financial
centers is at the core of global spillovers while economic and monetary policy news contributes to
regional spillovers.
Graciela L. Kaminsky Carmen ReinhartDepartment of Economics Research Department George Washington University International Monetary FundWashington, DC 20052 Washington, DC [email protected] and NBER

The first springs of great events, like those of great rivers, are often mean and little.
Jonathan Swift, 1667-1745
I. Introduction
A succession of crises in emerging market economies over the 1990s ignited a debate in
academia and policymaking circles about the transmission of shocks across national borders.
While it might seem to pre-judge the conclusion, much of this work can be summarized under
the heading of “contagion” and, indeed, this word seems apt to capture the spreading market
strain surrounding the Mexican peso crisis of 1994, the Asian credit crunch of 1997, and the
Russian devaluation and Long-Term Capital Management’s (LTCM) implosion of 1998. These
episodes have also resuscitated the interest on codes and standards, monetary arrangements, the
role of international institutions, and securities law —summarized as the international financial
architecture— to construct a bulwark to prevent contagion.
The academic literature on contagion, or less pejoratively described as spillovers and the
international propagation of shocks, has progressed along two roads in recent years. Early
studies attempted to document the existence of contagion. More recent papers have primarily
sought to discriminate among the possible channels of transmission of disturbances —that is,
whether shocks propagate through channels established by trade patterns, geography,
commonalities among lenders, or from other sources.
In our view, much of this literature suffers from three serious drawbacks. First, most
studies have not discriminated among where the shocks originate. One expects, a priori, that the
global or regional consequences of a disturbance may depend importantly on whether the shock
—to borrow terms from Sir Arthur Lewis— originates in the periphery or in the center. Were the
regional consequences of the Thai crisis so severe owing to Thailand's direct links with other
countries in the region or because that shock affected the region's largest economy —Japan?
Were the paralysis of the bond markets in many parts of the globe and the persistent equity
market volatility due to the Russian default or to concerns that LTCM’s reach was wider than
understood and that other firms in other financial centers of the world share similar failings? And
what about the dog that did not bark: Why did Ecuador’s 1999 default not have greater
1

international consequences? In contrast, in this paper, we attempt to capture the origins of
systemic turbulences and measure the direct and indirect linkages among national markets.
Second, terms like contagion and spillover can be quite slippery to define. Some authors
seek to learn about potential linkages by examining patterns of correlations across markets using
long time series. Others focus on market behavior during specific episodes dated a priori from
other sources. Our approach is to define financial turmoil precisely in terms of financial prices
and let the data determine when there were episodes of spillover. Specifically, we analyze the
daily behavior of stock markets for thirty-five emerging-to-mature market countries from
January 1997 to August 1999. Our approach is to focus on the spillover of extreme returns,
which are defined as those returns in the 5th and 95th percentile of the distribution. Since we are
interested in the center and the periphery, we examine what happens in stock markets around the
world on days of turmoil in financial centers (Germany, Japan, and U.S.) and on days of turmoil
in crisis-prone emerging economies (Brazil, Russia, and Thailand).
Third, most of the studies in financial spillovers rely on an examination of
contemporaneous and lagged correlations. But correlations alone cannot tell apart those
systemic turbulences due to a common shock (say a large change in oil prices or the
announcement of election results in an important country) and true spillover (a change in one
national market directly related to extreme price movements in another market). To learn about
the determinants of systemic financial turmoil, we turn to newspapers and summarize the key
world events associated with significant price changes. In many cases, this allows us to identify
the source of the shock —the center or the periphery— and to understand better the temporal
dimension of the financial market adjustment.
To be more specific about spillovers, we borrow from the literature on efficiency of
financial markets to distinguish between “weak-form globalization” and “strong-form
globalization” of turmoil. Weak-form globalization occurs when country j experiences
anomalous returns following an extreme event in country i, where anomalous behavior is
interpreted as a change in the distribution of returns assessed by a nonparametric procedure. This
definition does not require the countries suffering the spillovers to have extreme returns (i.e., to
be in the 5th and 95th percentile). Strong-form globalization occurs when country j experiences
turmoil when country i is also experiencing financial turbulences. That is, it is a statement about
simultaneity of extreme returns. Using these definitions, we construct two indices of
2

globalization and examine the patterns of spillover among crisis-prone emerging markets and
financial centers. While the analysis of more episodes is clearly necessary, one of the
preliminary conclusions we draw from this exercise is that it is important to understand the
circuitous route that financial shocks often traverse. Problems occur synchronously in many
emerging markets on the periphery because a shock in one of them first influenced a financial
center. If the shock never reaches the center, it is doubtful it can become systemic, irrespective
of the definition of systemic that is used. For example, in the case of the Asian crisis, Japanese
bank exposure to Thailand ―and their subsequent retrenchment from lending to other Asian
countries― played a prominent role in the spread of the crisis. The role played by the center
(i.e. Japan) in this episode was much the same that played by U.S. banks in the 1980s. In the case
of Russia, its default triggered a pervasive widening of spreads that hobbled the weakened
LTCM and led to a generalized withdrawal of risk taking. Thus, financial centers serve a key
role in propagating financial turmoil. When financial centers remain safe, problems in an
emerging market stop at the region’s border.
The rest of the paper is organized as follows. Section II presents a brief discussion of
some of the analytical issues that are relevant to our analysis of globalization of financial
turmoil. Section III constructs the two indices of globalization of turmoil and examines the
pattern of spillover within and across regions. Section IV discusses the origins of high spillovers.
Concluding remarks are presented in Section V.
II. Analytical Issues
For the purposes of our analysis, we divide the world into center and periphery countries.
The former consist of the countries that house the largest financial centers (i.e., New York,
London, Berlin, and Tokyo) while the latter comprise everyone else. We distinguish among three
patterns in the propagation of shocks. First, there is the transmission of shocks from one
periphery country to another periphery country, which can take place if the two countries are
directly linked through bilateral trade or finance (Figure 1). Recent examples of this type of
transmission mechanism include the adverse impact of the 1997-98 Asian Crisis on Chilean
exports and the contractionary impact on Argentina of the Brazilian devaluation in January 1999.
This transmission channel may also be operative if there are bilateral finance links. For instance,
3

Costa Rican banks were borrowing from Mexican banks on the eve of the Mexican crisis (see
Sara Calvo and Carmen Reinhart, 1996), but when Mexican banks ran into trouble this source of
funds disappeared.
Second, there is the transmission of shocks from one periphery country to another via a
center country (as shown in Figure 2). There are several prominent examples of this type of
transmission mechanism in the literature. Giancarlo Corsetti, Paolo Pesenti, Nouriel Roubini,
and Cedric Tille (1998) model trade competition among the periphery countries in a common
third “center” market. For instance, Thailand and Malaysia export many of same goods to Japan,
Hong Kong, and Singapore. Hence, when Thailand devalued in mid-1997, the crisis spread to
Malaysia who lost some of its competitive edge in the common third markets. Guillermo Calvo
(1998) suggests that Wall Street may have been the carrier of the “Russian virus” in the fall of
1998; he focuses on asymmetric information and liquidity problems in the financial centers. So,
when Russia (a periphery country) defaulted on its bonds, the leveraged investors that held those
bonds in the center country faced margin calls and needed to raise liquidity. The margin calls
caused them to sell their asset holdings (the bonds and stock of other countries in their portfolio)
to an uninformed counterpart. Because of information asymmetries, a “lemons problem” arises
and the assets are sold at a firesale price.
A variant of this “financial center” story concerns open-end fund portfolio managers who
need to raise liquidity in anticipation of future redemptions. As before, the strategy would be to
sell other assets held in the portfolio. The sell-off depresses the asset prices of other countries
and the original disturbance spreads across markets. Jeffrey Frankel and Sergio Schmukler
(1998) find evidence suggesting that the crisis in Mexico in late 1994 spread to other equity
markets in Latin America through New York rather than directly. Graciela Kaminsky, Richard
Lyons, and Sergio Schmukler (2001), who examine the behavior of the mutual fund industry in
international equity markets, support this venue of spillover. The authors find that in the
aftermath of the Thai crisis, the largest mutual fund withdrawals affected Hong Kong and
Singapore, which have the most liquid financial markets. Graciela Kaminsky and Carmen
Reinhart (2000 and 2001) focus instead on the role of commercial banks lenders in the center
country. They stress that following the initial losses due to a crisis in a periphery country,
banks’ need to rebalance the overall risk of their asset portfolio can lead to a marked reversal in
commercial bank lending across the markets where the bank has exposure. By calling loans and
4

drying up credit lines to the crisis country, center banks deepen the original crisis. By re-calling
loans elsewhere, they propagate the crisis to other countries. The Debt crisis in the early 1980s
and the Asian crisis in 1997 provide two clear examples of this mechanism. Following Mexico’s
default in 1982, United States banks with an extensive exposure to Mexico, spread the crisis
across Latin America. In 1997, Japanese banks, heavily exposed to Thailand, played the same
role in spreading the crisis throughout Asia.
Third, there is the transmission of symmetric shocks from the center country to the
periphery (Figure 3). This is the type of shock stressed in several papers by Guillermo Calvo,
Leonardo Leiderman, and Carmen Reinhart (1993, 1996), who analyze how changes in U.S.
interest rates influenced capital flows to Latin America in the early part of the 1990s. While an
obvious example of this type of shock is changes in interest rates in a financial center country,
more subtle ones may include the kinds of regulatory changes in the financial centers discussed
in Mohamed El-Erian (1992). Also, the closure of Salomon Brothers’ bond arbitrage desk on
July 6, 1998 is thought to have been a factor contributing to the loss of liquidity in the market for
emerging market bonds, which in turn made markets less resilient.
III. Financial Globalization: Measures and Determinants
The crises of the 1990s triggered an immense interest in understanding extreme events.
The literature in the late 1990s focused mostly on extreme events in the exchange market as
captured by exchange rate devaluations, foreign exchange reserve losses, and in some cases,
spikes in overnight interest rates.1 Most of this literature focused on either monthly data or even
annual data. The goal was to examine whether deteriorating fundamentals were at the root of
these crises. 1 See, for example, Graciela Kaminsky and Carmen Reinhart (1999).
5

But when a variety of countries started to topple like dominoes, many authors began to
focus also on the characteristics of contagion.2 This literature also deals with issues of systemic
risk. But systemic risk is not just connected to currency crises. Systemic risk may also be
triggered by shocks in banking and stock or bond markets. Our goal in this section is to present
a measure of systemic events triggered by turmoil in a financial market in one country.3
We understand financial turmoil as an extreme event in a financial market, be it a rally or
a crash. That is, we confine our definition of extreme events to the tail of the distributions of
returns by looking at returns in the 5th and 95th percentile of the distribution. Because our interest
is in systemic events, we have to consider a substantially large number of markets. Sometimes
these systemic events are not long lasting (for example, the worldwide stock market crash in
October 1987), implying a need to use high-frequency data. This puts some restrictions on the
markets we can examine. To accommodate these needs, we focus on daily returns in stock
markets.
Our dataset spans the period beginning on January 1, 1997 through August 31, 1999. We
focus on the daily return on equities in the local currency and based on the available local bourse
indices. The countries in our sample cover mature- and emerging-market economies, thereby
excluding countries with less developed capital markets and a significant extent of financial
repression. We can classify the sample into five, somewhat arbitrary, seven-country groupings:
The G7 countries, which are comprised of Canada, France, Germany, Italy, Japan, United
Kingdom, and the United States; and the transition economies, which include Czech Republic,
Estonia, Hungary, Poland, Russia, Slovakia, and Ukraine. The remaining three groups are
primarily by region. There is the Asian cluster, which includes Hong Kong, Indonesia, Malaysia,
the Philippines, Singapore, South Korea, and Thailand. The other European group, which
excludes those countries that are part of the G7, and includes, Finland, Greece, Holland, Norway,
Spain, Sweden, and Turkey. Finally, the Latin American sample consists of the larger economies
in the region, Argentina, Brazil, Chile, Colombia, Mexico, Peru, and Venezuela.
Table 1 provides summary information on the stock markets examined. Not surprisingly,
the degree of instability of stock returns varies considerable across countries. Thus, our 2 See, for example, Barry Eichengreen, Andrew Rose, and Charles Wyplosz (1996), Reuven Glick and Andrew Rose (1998), and Kaminsky and Reinhart (2000). 3 See also J. Danielsson and C. de Vries (1997), Olivier De Bandt and Philipp Hartmann (2000), F. Longin (1996) and Amine Mati (2001) for studies of extreme returns in stock and bond markets.
6

definition of extreme events is country-dependent. For example, a drop of 1.8 percent is
classified as an extreme event in the United States but it takes a 3.94-percent downfall to qualify
as an extreme event in Indonesia. To complete the picture about the stock markets around the
world, Table 2 reports sample bilateral correlations. Since the various countries are in different
times zones, we provide two measures of bilateral correlations for some countries. For example,
Table 2 reports the same day bilateral correlations for countries in Asia and Latin America and
also correlations between observations in day t in Latin America and day t+1 in Asia. Overall,
daily correlations are large for mature markets and somewhat large within regions, but quite
small across regions, which does not preclude stock markets around the world from collapsing
together on several occasions. For example, on October 28, 1997, 80 percent of the countries in
our sample, exhibited extreme returns following the stock market collapse in Hong Kong.
Figure 4 provides the first glimpse of the bunching of turmoil that we are trying to
explain. This figure reports the percentage of countries with simultaneous extreme changes in
stock prices (those movements in the 5th and 95th percentiles) around the globe or in various
regions. The top panel reports the proportion of countries worldwide simultaneously in the 5th or
95th percentile of the distribution. The five other panels show the same evidence by region. The
globalization of turmoil is quite evident during the last few days of October 1997 following the
collapse of the Hong Kong stock market. However, the phenomenon was short lived,
underscoring the importance of daily data. The simultaneous turbulences in the fall of 1998 were
quite more persistent. The events that triggered these systemic crashes originated in Russia,
starting on June 1, 1998 with the suspension of trading in future markets and were fueled further
by the failed auction of Russian GKO government bills on August 27, 1998. On that day, 74
percent of the stock markets around the world collapsed. Turbulence persisted until October as
the crisis in Russia was followed by the dislocation in G-7 financial markets as LTCM spiraled
downward. The final episode is very short and it is linked to the Brazilian crisis in January 1999.
Regional turmoil is far more frequent, with the last half of 1997 plagued by problems in most
countries in Asia. In the first half of 1998, the turbulence spreads to Latin America, with turmoil
in Brazil at its core. Fragility in mature markets is mostly concentrated in the fall of 1998.
Below, we use two definitions of globalization to examine the determinants of world and
regional instability.
7

1. Weak-Form Globalization
This definition focuses on whether turmoil in one country (returns in the 5th or 95th
percentile of the distribution) triggers anomalous behavior in other countries. Anomalous
behavior is defined as a change in the distribution of returns. In particular, we estimate the
frequency distribution of returns in country j on days of turmoil in country i and the frequency
distribution of returns in country j on days of no turmoil in country i. We compare these two
distributions using the Kolmogorov-Smirnov test of equality of distributions. We classify a
country as being affected by extreme crashes or rallies in another country when we reject the null
hypothesis of equality of the distributions at a 5 percent significance level or less. We call this
phenomenon weak-form globalization from country i to country j because it does not impose
simultaneous occurrence of returns in the tails for globalization to occur.
We first examine the degree of weak-form globalization triggered by turmoil in three
financial centers: Germany, Japan, and U.S. Table 3 reports the spillover of extreme events with
a country-by-country detail. To get a high-resolution picture of anomalous behavior in the stock
market, we report the 5th and 95th percentiles of the distribution of returns for all observation in
the sample and for the observations on days of market turmoil in each of the financial centers.
For example, the 5th and 95th percentile returns for Argentina for the whole sample are -4.31 and
3.41. When there is turmoil in the United States, the 5th and 95th percentile returns for Argentina
become -9.37 and 8.13. As shown in this table, the Kolmogorov-Smirnov test rejects the null
hypothesis of similar distribution of stock market returns in Argentina on days of financial
turmoil in the United States and the distribution on all other days. Thus, we catalogue Argentina
as suffering weak-form globalization from turmoil in the United States. In the event, extreme
movements in equity markets in the United States are transmitted instantaneously to most Latin
American countries—the only exception being Colombia and Venezuela. Indeed, seven-tenth of
the countries in Latin America are, according to our measure, affected by toil events in the
United States. In contrast, turmoil in the United States triggers an anomalous behavior in only 29
percent of the stock markets of Asian countries. The pattern of the spreading of problems in
Japan is in sharp contrast to that observed for the United States. In this case, Latin American
markets do not react at all to turmoil in Japan, but 71 percent of the Asian countries experience
anomalous returns when Japan posts an outsized return.
8

Table 4 summarizes these results. Overall, shocks in financial centers are transmitted
instantaneously to basically all (70 percent) mature markets (G-7 and European countries),
whether the shock occurs in Germany, Japan, or the United States. These results are suggestive
of the higher degree of integration of those markets. The regional characteristics of the
transmission of the shocks to emerging economies are, however, different. U.S. shocks are
strongly transmitted across Latin America; the shocks in Germany simultaneously affect stock
markets in Eastern Europe, Latin American, and Asia; while Japan turbulences mostly affect
other Asian countries. Interestingly, this pattern of transmission matches the pattern of exposure
of financial institutions in Germany, Japan, and the United States to emerging economies as
examined by Caroline van Rijckenghem and Beatrice Weder (2000). These authors classify bank
lending to emerging economies by area of origin of those loans. They find that European banks
are the largest creditors in all regions, with North American banks concentrating their lending in
Latin America and Japanese banks mostly lending to other Asian countries. In particular, at the
onset of the Asian crisis, 32 percent of all the international loans to Asian countries originated in
Japan, 44 percent originated in Europe, and just 10 percent originated in North America. Also,
during 1997 and 1998, most lending to Eastern European (including Russia) countries originated
in Western Europe (80 percent) while lending to Latin America originated in Western European
banks (60 percent) and North American Banks (30 percent).
Rijckenghem and Weder (2000) also examine the shifts in portfolios of European, North
American, and Japanese banks during the Asian and Russian crises. Japanese banks consistently
withdrew from Asia, reducing their lending from $124 billion in mid-1997 to $86 billion by the
end of 1998, North American banks mainly shifted their lending among emerging markets during
the Asian crisis (from Asia to Latin America and Europe) while they reduced their positions in
all three regions during the Russian crisis. European banks continued to build up their positions
in all regions even after the onset of the Asian crisis and only during the first half of 1998 did
they reduce their holdings in Asia, while increasing them in Latin American and Eastern Europe.
The Russian crisis triggered the end of this expansionist investment strategy of European banks
in emerging markets, with all banks reducing their exposure to all the three regions by about $20
billion.
Table 5 examines whether turmoil is transmitted from one country in the periphery to
another country in the periphery or to financial centers. In particular, it examines the pattern of
9

spillovers on days of turmoil of three crisis-prone countries in our sample: Brazil, Russia, and
Thailand on a country-by-country basis. Table 6 summarizes the information. The patterns of
globalization are similar for Brazil and Russia. Turbulence in those countries coincides with
abnormal movements around the globe with the sole exception of Asia. Extreme movements in
Thailand are not so-far reaching, in that they spill over only to other Asian economies. This
evidence begs for an answer as to what are the channels through which these crisis-prone
countries with small asset markets have so-far reaching effects. To answer this question, we
examine whether the days of turbulence in a particular crisis-prone emerging market were also
days of turbulence in a financial center to which that particular country was associated with. We
then examine whether problems in crisis-prone emerging markets not associated with turmoil in
financial centers also have wide spillover effects. We chose financial centers according to the
evidence discussed in the literature. We pair Brazil with the United States, Russia with Germany,
and Thailand with Japan.
Table 7 examines the periphery-to-periphery and periphery-center-periphery connections.
Days of turmoil in crisis-prone emerging economies are divided in two samples, those on which
the corresponding financial center was also roiled and those on which the corresponding
financial center was not. The results are dramatically different. Turbulence in Brazil
accompanied by turbulence in the United States is transmitted around the world, with Asia being
the only region untouched. In contrast, turbulence in Brazil unaccompanied by turbulence in the
United States only affects stock markets in Latin America. Turmoil in this case only has a
regional reach. The same picture of propagation of shocks is observed in the case of Russian
jitters. Turbulence becomes global if a financial center is affected but remains regional when the
stock market in the financial center is calm. The evidence from Thailand is somewhat different.
Again, simultaneous turmoil in the financial center (Japan) and Thailand triggers a broader
propagation of shocks. But here this propagation is only regional in nature. There is not even
regional propagation when turbulence affects only the stock market in Thailand. The regional
characteristics of some the turbulences in stock markets agree with the evidence from currency
crises.4
The question is what causes this regional pattern of spillovers. Strong bilateral trade
patterns may provide one explanation. For example, Kaminsky and Reinhart (2000) point to the
10

strong bilateral trade among Mercosur countries but caution that turmoil in Brazil is still
transmitted rapidly to non-Mercosur Latin American countries. Similarly, shocks from Russia
are strongly transmitted to most of the transition economies even though bilateral trade links
among transition economies diminished drastically in importance following the collapse of the
communist regimes in Eastern Europe in 1989-1991. Third party trade links may provide
another explanation. For example, Malaysia and Thailand sell similar goods to Japan and the
United States, explaining the “contagion” from Thailand to Malaysia following the Thai
devaluation in July 1997. But the Mexican crisis in 1994 strongly affected Argentina and Brazil
and these countries do not compete with Mexico on third markets. Again financial links may
help to explain regional contagion too. For example, Graciela Kaminsky, Richard Lyons, and
Sergio Schmukler (2002) examine investment strategies of U.S.-based mutual funds specialized
in Latin America and find that they were a key element in explaining the reach of the Tequila
crisis: as investors stampeded out of mutual funds specializing in Latin America following the
Mexican devaluation, managers (under the pressure of the massive redemptions) had to sell not
just Mexican stocks but also stocks from Argentina and Brazil.
Table 8 summarizes these results by region and examines the null hypothesis of financial
center irrelevance versus the alternative hypothesis that a financial center has to be affected for
the turmoil to become systemic. To examine this hypothesis, we construct the Wilcoxon, or
rank-sum, test. To construct this test, we look at the results from the Kolmogorov-Smirnov test
and construct two samples as follows. The first sample captures the weak-form globalization
pattern following turmoil in a crisis-prone emerging market coinciding with turmoil in a
financial center. For each j country in the sample, we assign a value equal to 1 if turmoil in the
pair crisis-prone emerging-market and financial center triggers anomalous behavior in country j
and zero otherwise. The second sample captures the weak-form globalization pattern following
turmoil in a crisis-prone emerging market not coinciding with turmoil in a financial center.
Again, for each j country in the sample, we assign a value equal to 1 if turmoil in just the crisis-
prone emerging market triggers anomalous behavior in country j and zero otherwise. Denote the
observations from the first sample by {X} and the observations from the second sample by {Y}.
The null hypothesis of financial center irrelevance implies that P(X>k)=P(Y>k) for all k. We are
interested in the one-sided alternative that X is stochastically larger than Y, that is, 4 See, for example, Gelos and Sahay (2000), Glick and Rose (1998), and Kaminsky and Reinhart (2000).
11

P(X>k)$P(Y>k) for all k. To construct the rank-sum test, we rank all the observations without
regard to the sample to which they belong. Then, the Wilcoxon test statistic is formed as the sum
of the ranks in the first sample:
W R ii
n
==∑ 1
1 (1)
where n is the number of countries in each sample. Under the null hypothesis, the average rank
of an observation in sample 1 should equal the average rank of an observation in sample 2. Using
the Fisher’s Principle of Randomization, it is straightforward to verify that:
E Wn n
Wns
( )( )
)=+
=2 1
2 2
2
and Var( (2)
where s is the standard deviation of the combined ranks r for both samples: i
sn
r rii
n2
1
221
2 1=
−−
=∑ (
_) (3)
The last row of Table 8 shows the Wilcoxon test statistic for each sample and the one-sided p
value for the null hypothesis of financial-center irrelevance. For example, for the case of Brazil,
the proportion of all countries affected when both Brazil and the United States experience
turmoil is 76 percent and the proportion of countries affected when just Brazil experiences
turmoil is 24 percent. For these two samples, the Wilcoxon p-value under the null hypothesis of
financial-center irrelevance is less than 0.01, leading us to reject the null hypothesis of financial
center irrelevance. The results for the other two emerging markets are similar. In all cases, the
tests reject the null hypothesis of financial-center irrelevance in favor of the alternative
hypothesis that a financial center has to be affected for turmoil to become systemic.
2. Strong-Form Globalization
In the previous section, we examined whether turmoil in one country triggers anomalous
behavior in stock markets around the world, with anomalous behavior defined as a change in the
distribution of returns. Under this definition of globalization, other stock markets do not have to
experience extreme returns in response to extreme returns in one stock market for globalization
to occur. A more stringent concept of globalization of turmoil would be one of simultaneous
turmoil. We call this definition of globalization of turmoil “strong-form globalization.” A
12

globalization index in this case will just be the proportion of countries with simultaneous
extreme events.5 Our task in this section is to examine the determinants of this index.
To examine the causes of systemic events, we use a multinomial logit approach. We
also estimated the model using order logit techniques. The results are quite similar, so we do not
report them to save space. Since we are interested in explaining the degree of globalization, our
left-hand variable will be a dummy variable that can take three values, low, medium, and high
globalization. Low globalization occurs when less than 25 percent of the countries in the
sample experience turmoil, medium globalization occurs when there are more than 25 percent
but less than 50 percent of the countries in turmoil. Finally, high globalization occurs when 50
percent or more of all the countries experience turmoil. Our explanatory variables are dummy
variables capturing days of turmoil in financial centers, days of turmoil in crisis-prone countries
on days of turmoil in financial centers, and days of turmoil in crisis-prone countries when
financial centers are not affected. These dummies will take a value of one on days of turmoil and
zero otherwise. Equation (4) is the multinomial logit equation to be estimated.
P y i x xii
j
( ) exp( ' ) / ( ' ))= = +=
−
∑β 11
1
iβ
))
(4)
The variable y is the globalization index, and the vector x includes the dummy variables
capturing turmoil in the various countries. The variable P(y=i) is the probability associated with
outcome i. The index j refers to the number of outcomes in our estimation: low, medium, and
high globalization. The vector is the vector of coefficients to be estimated. As is usual in this
type of estimations for each explanatory variable, we estimate j-1 parameters. The probability
that there is low globalization is our base case and it is equal to:
β
P y x ii
j
( ) / ( exp( '= = +=
−
∑low 1 11
1
β (5)
The estimation of equation (4) is somewhat problematic because not all the markets are open at
the same time. Thus, a shock leading to turmoil in Brazil can affect all Latin American
economies the same day, it can affect European economies the same day or the following day
depending of the time at which the shock occurs, and can only affect Asian countries the
5 In Kaminsky and Reinhart (2000) we constructed a similar index. That time, the index was the proportion of countries with currency crises. That index was used to predict currency crises in other countries. B. Kee-Hong, Andrew Karolyi, and Rene Stulz (2000) also look at simultaneous financial turbulences in Asia and Latin America.
13

following day. Thus, if a shock occurs in Russia, the index of globalization on the left-hand side
has to include countries in turmoil in Europe, the G-7, and Latin America the same day and
countries in turmoil in Asia the next day, but if the turmoil originates in Thailand, the index of
globalization on the left hand side has to include the number of countries in turmoil in all the
regions the same day of the shock.
We deal with this problem in two different ways. First, we estimate equation (4) using
only turmoil originating in shocks from one time zone at a time. In this case, the left-hand-side
variable is constructed depending on the origin of the shock and we estimate three separate
versions of equation (4) for financial centers and three separate versions of equation (4) for
crisis-prone emerging markets. The shortcoming of this type of estimation is that we cannot
evaluate jointly the effects of extreme events in the various crisis-prone countries and financial
centers.
Second, to account for the effect of turbulence in the three crisis-prone countries jointly,
we perform panel estimations. To deal with the different time zones, the index of globalization in
the left-hand side accounts for low, medium, and high globalization by region. For each region,
we align the explanatory variables on the right-hand side according to the region they may affect.
Since we estimate the regression for all the regions at the same time, the parameters provide a
somewhat different measure of the effects of turmoil in the various countries on globalization.
For example, the episodes of high globalization are more confining in the sense that they require
all the regions to have a high degree of globalization simultaneously. This was not the case in the
non-panel estimation.
β
Finally, within the panel regression estimates, we jointly evaluate the effects of
coincidence of multiple shocks in emerging markets and financial centers. We construct two
dummy variables. The first one captures days of turmoil in emerging markets coinciding with
turmoil in financial centers. This variable can take four values, zero to three. If this variable
takes the value three, it means that the three crisis-prone emerging economies experience turmoil
and so do their respective financial centers. The second explanatory variable in this regression
will capture the number of crisis-prone emerging markets in turmoil when there is no turmoil in
financial centers. Again, this variable can take four values, zero to three.
Tables 9 and 10 examine the effects of turmoil originating in one time zone at a time.
Table 9 concentrates on turmoil originating in financial centers. The first equation has as
14

explanatory variable a dummy variable equal to one when Germany experiences turmoil and
zero otherwise. The second regression has as explanatory variable a dummy variable equal to
one when Japan experiences turmoil and zero otherwise. Finally, the third equation has as
explanatory dummy variable a dummy variable equal to one when United States experiences
turmoil and zero otherwise. Table 10 uses the same methodology to evaluate the degree of
globalization following jitters in one turmoil cluster at a time: Brazil-U.S., Russia-Germany, and
Thailand-Japan. For each turmoil cluster, the regression has two explanatory dummy variables.
One dummy variable is equal to one on days of turbulences in the emerging market coinciding
with days of turmoil in the corresponding financial center and zero otherwise. The second
explanatory dummy variable is equal to one on days of turbulences in the emerging market not
accompanied by turmoil in the corresponding financial center and zero otherwise. To evaluate
jointly the contribution of these clusters to the globalization of turmoil, we estimate a
multivariate turmoil-cluster panel regression. We estimate the model using panel data because of
the time-zone problem. The results are reported in Table 11. Finally, Table 12 reports the panel
estimation evaluating the effects of multiple coincidence of turmoil in the three crisis-prone
emerging markets. The top panels in all these tables report the estimated coefficients while the
bottom panels show the conditional probabilities of globalization obtained from the estimations
shown in the top panels.
As for the results, Table 9 shows that turmoil in financial centers triggers turbulences
around the world, with the explanatory power (as captured by the pseudo ) ranging from 9
percent for turmoil originating in Japan to 19 percent for turmoil originating in Germany. Again,
this pattern could be explained, in part, by the higher worldwide exposure of German banks to
emerging markets in Asia, Latin America, and Transition economies during the late 1990s. The
bottom panel provides another metric to capture the reach of turmoil in the three financial
centers: the probability of low, medium, and high globalization conditional on turmoil in each
financial center, derived from the multinomial estimation. Again the likelihood of medium to
high globalization on days of turmoil in Germany is about 60 percent, but only about 40 percent
when shocks originate in Japan, with market jitters in the United States triggering medium-to-
high globalization with a probability of almost 50 percent.
R 2
Table 10 reports the results for turmoil originating in emerging markets. The first three
columns report the estimates for Brazil, the next three for Russia, and the last three for Thailand.
15

As we did when we evaluated weak forms of globalization, we pay particular attention to
whether days of turmoil in the three crisis-prone emerging markets coincide with days of turmoil
or with days of no turmoil in financial centers. Financial centers would be irrelevant in
explaining high degrees of globalization of turmoil if the coefficient attached to the dummy
capturing turmoil in the cluster emerging market-financial center is not statistically different
from the coefficient attached to the dummy capturing turmoil in just the emerging market.
This hypothesis is tested in the third column for each emerging market. In all cases, we reject
this hypothesis at all conventional significance levels. To better understand the effects of
turmoil in the various countries, the bottom panel of Table 10 also reports the conditional
probabilities of low, medium, and high globalization obtained from the estimation of equation
(4). The results for Brazil indicate that low globalization is the most likely outcome when
turbulence in Brazil does not coincide with turbulence in a financial center. In contrast, when
the financial center is also experiencing an extreme event, high globalization becomes the most
likely event, with the probability reaching 57 percent. Interestingly, if there is no turmoil in
Brazil or the United States, the likelihood of a high clustering of countries with turmoil collapses
to 2 percent. The results for Russia are quite similar. Again the necessary ingredient for high
globalization is the coincidence of turmoil in Russia and Germany. In this case, the average
probability of high globalization is about 50 percent but declines to 2 percent when only Russia
experiences turbulence. The results for Thailand indicate that the reach of the Asian crisis was
limited in scope. Still, jitters in Thailand are transmitted to other Asian countries only on days of
jitters in Japan. The explanatory power of these shocks, as captured by the pseudo is high for
Brazil and Russia but, as expected, quite small for Thailand.
β
β
R 2
To evaluate jointly the effects of turmoil in the three emerging markets and financial
centers, we report the panel estimates in Tables 11 and 12. As shown in Table 11, each of the
three emerging-market-financial center clusters contribute to trigger financial turmoil worldwide,
as captured by the statistically significant coefficients of the three crisis-cluster dummies for
the high globalization event. Still, the contribution of the Thailand-Japan cluster is somewhat
smaller. Our panel estimation, though, has a smaller predictive power than the non-panel
estimations on account of the restrictions imposing similar effects of turmoil of the various
center-periphery clusters across the five regions. Our more stringent definition of high
β
16

globalization episodes is also reflected in lower probabilities of high globalization following
turbulences in the three center-periphery clusters.
Finally, the results in Table 12 bring to the spotlight the magnification effect of
simultaneous turbulences in several center-periphery clusters. Note that the probability of high
globalization now increases to 94 percent when the three crisis clusters experience turbulences
but just 13 percent when one crisis cluster is in turmoil. Note that the probability of high
globalization on days of no turmoil in any of the crisis clusters is just 1 percent.
IV. The Origins of Globalization
In the previous section, we evaluated the odds of simultaneous turbulence around the
world when crisis-prone emerging markets and financial centers were experiencing turmoil. We
did not explain the origin of these turbulences. To do that, we have to bring in information
beyond that on daily movements in equity prices. Our source is the written record: We used
reports from Bloomberg, the Financial Times and the Wall Street Journal to construct a
chronology of news in those days. We limit our search to days on which at least 50 percent of
countries in one region have stock market jitters. This chronology is reported in the Appendix
Table. The first column dates the days of regional and global turmoil. The next six columns
report the proportion of countries worldwide and by region with stock market turmoil. For
clarity, we just report the proportion of markets in turmoil when it reaches more than 50 percent
of the countries worldwide or in each region. The last column reports the news. To study the
onset and propagation of turmoil, it is important to collect all news, local and foreign, triggering
jitters. This news can be about the state of the economy, financial institutions, policies, and just
plain rumors. The Appendix Table does not report all the news events that move markets on a
particular day, it just reports the most common source of market jitters in the region or around
the world.
As shown in this chronology, the first day of worldwide turmoil is October 27, 1997,
with 60 percent of the countries around the globe experiencing turmoil. The tension started to
build up towards the end of August. Until that time, while several Asian countries experienced
turbulences, they did not spread to other countries in that region. But on August 28, 1997,
financial markets in Indonesia, Malaysia, the Philippines, Singapore, and Hong Kong collapsed
17

amid a deepening loss of confidence in the ability of governments to tackle their severe
economic problems. Again, on October 22, turmoil reached Hong Kong and spread in Asia, with
about 60 percent of the Asian countries experiencing market crashes. The crisis in Hong Kong
deepened and on October 23, it triggered a global sell off in Europe, the G-7 countries, and Latin
America. By October 27, worldwide globalization reached about 60 percent of the countries in
the sample. This time around, the globalization of the turmoil was short-lived and within two
days markets rebounded, with massive rallies around the world.
December 11 is the next day of significant inter-regional spillover, with Korea at the
center of the debacle in Asia and Europe. Still, repercussions in the G-7 countries were minor.
Another day of inter-regional turmoil was January 12, 1998. At the heart of the jitters was the
collapse of Peregrine (Hong Kong), one of Asia’s largest investment banks and according to
journalists’ accounts “raising concerns about emerging markets in general.”
The next cluster of global instability started towards the end of May 1998, with Russian
tension spreading to Latin America, transition economies, Asia, Europe, and the G-7 countries.
The degree of globalization rapidly rose, reaching about 50 percent of countries worldwide by
June 15. Rumors of devaluation in China and weakness of the Japanese economy and the yen
also contributed to the build up of skittishness. The degree of globalization reached 60 percent
on August 11. On August 21, shares of German banks heavily exposed to Russia collapsed
triggering downfalls in other G-7 countries. On August 27, the failed auction of Russian GKOs
reignited fears of financial collapse, bringing major downturns in 75 percent countries
worldwide. Financial turmoil griped Latin American markets following Moody’s downgrade of
Brazilian and Venezuelan foreign debt while putting Argentina’s debt and 11 banks on review
for a possible downgrade on September 3. While markets in some regions rebounded during the
first week of September, financial concerns, brought again to the limelight by the S&P’s
downgrade of Spain’s second largest bank (with heavy exposure to Argentina) and of
Argentina’s two largest banks on September 10, together with LTCM’s collapse and bailout on
September 24, triggered stock market crashes around the world. This episode of worldwide
financial instability came to an end with news of credit easing in financial centers related
importantly to the inter-meeting reduction in the federal funds interest rate on October 15 in the
United States.
18

The last episode of financial instability in our sample occurred around the time of the
devaluation of the Brazilian real, which was extremely short-lived. Only on January 13, did
financial markets around the world collapse.
The chronology in the Appendix Table suggests that although by construction we have
the same number of days of positive and negative turmoil, clusters of world instability occur
mostly following adverse shocks. This table also seems to indicate that financial vulnerabilities
are at the core of worldwide globalization of turbulences. Table 13 highlights these findings.
The top panel shows the proportion of days of rallies and days of crashes during episodes of high
regional and world globalization (at least 50 percent of countries affected by turmoil). Note that
85 percent of the episodes of high world globalization involve stock market crashes. Episodes of
high regional globalization are more balanced. With the exception of the Asian region, in which
days of joint rallies outnumber days of simultaneous crashes, about 60 percent of the days of
high regional globalization consist of crashes. The middle panel classifies the days of high
globalization, both at a regional level and worldwide, according to the type of news that seems to
have triggered the spillover. Financial concerns from bankruptcies of large banks or adverse
shocks in one or more asset market in a center country seem to be at the core of high worldwide
globalization (40 percent of the episodes). Only 20 percent of the days of high spillovers seem
to be driven by economic, political, and monetary news at the center. Another important source
of instability is concerns about financial fragility in the periphery (25 percent of the episodes).
In contrast, financial worries in center countries only account for 26 percent of the episodes of
high regional globalization. Financial fragility in the periphery seems to be at the heart of
regional turbulences (31 percent of the episodes). Finally, international agreements also
contribute to regional turbulences.
One final aspect of globalization that we have still not addressed is whether high
globalization occurs when the magnitude of the shocks in the stock market is larger. The bottom
panel addresses this question. We first divide extreme returns in three categories according to
their size: large (within the 1-percent critical-region on both tails), medium (between the 1-
percent and 3-percent critical-region on both tails) and small (between the 3-percent and 5-
percent critical-region). Afterwards, we estimate the average size of the returns for all the
countries in turmoil for each episode of low, medium, and high world globalization. The bottom
panel in Table 13 shows the proportion of episodes of low, medium, and high world
19

globalization with small, medium, and large returns. Larger (in absolute values) returns are more
common in days of high globalization: all the shocks in episodes of high globalization are
clustered in at the most the 3 percent critical region while during episodes of low globalization
46 percent of the shocks are relatively small (between 3 percent and 5 percent critical region).
V. Concluding Comments
This paper presents a new approach to measure and understand systemic financial
turbulences. We defined two measures of systemic disturbances: weak- and strong-form
globalization and created the corresponding indices of “globalization.” These indices allowed us
to capture the routes through which market jitters in one country reach other countries in the
same region or even worldwide. They also allowed us to estimate the likelihood of low to high
globalization following a variety of shocks in crisis-prone emerging markets and financial
centers. One of the preliminary conclusions we draw from this exercise is that financial centers
are at the core of “systemic” problems: The “worldwide globalization” of the turbulences in
Asia in the Fall of 1997 only occurred after the stock market crash in the United States on
October 27, while the Russian downfall spread around the globe only after it triggered fragilities
in German banks and helped to provoke LTCM’s bankruptcy. Without distress in a financial
center, disturbances spread at most regionally, with the “silk road” of regional financial distress
being in part related to trade links but also to financial linkages. For example, as documented in
Kaminsky, Lyons, and Schmukler (2002), the 1994 Mexican crisis spread so rapidly to
Argentina and Brazil via the mutual funds (specialized in Latin America) massive withdrawals
from those two countries. Finally, our evidence indicates that collapses and not rallies are at the
heart of high-globalization episodes, suggesting the need for models with asymmetries to explain
systemic turmoil.
Our research has focused on explaining the “geographical” extent of financial turmoil,
still the “temporal” dimension of high-globalization episodes of turbulences varies as much, with
some episodes lasting just a couple of days (Sell-off in stock markets around the world following
the Hong Kong collapse in October 1997) while others, such as the turmoil during the Fall of
1998, lingered much longer. Also, our research, as most of the previous literature, has just
focused on a particular asset market. But the degree of systemic problems should not only be
20

understood as synchronized jitters across a particular asset market in a variety of countries, but
also as simultaneous turmoil across markets in a particular country. Future research should
inquire into these differences too.
21

References
Bank for International Settlements, (1999), A Review of Financial Market Events in Autumn 1998, (Basle, Switzerland: Bank for International Settlements), October.
Calvo, Guillermo, (1998). “Capital Market Contagion and Recession: An Explanation of the
Russian Virus,” mimeo, University of Maryland. Calvo, Guillermo A., Leonardo Leiderman, and Carmen M. Reinhart, (1993), “Capital Flows and
Real Exchange Rate Appreciation in Latin America: The Role of External Factors,” IMF Staff Papers, Volume 40, No. 1, March.
Calvo, Guillermo A., Leonardo Leiderman, and Carmen M. Reinhart, (1996). “Capital Flows to
Developing Countries in the 1990s: Causes and Effects”, Journal of Economic Perspectives, Vol. 10, Spring, 123-139.
Calvo, Sara and Carmen M. Reinhart, (1996). “Capital Flows to Latin America: Is There
Evidence of Contagion Effects?” in Guillermo A. Calvo, Morris Goldstein, and Eduard Hochreitter (eds.) Private Capital Flows to Emerging Markets, (Washington DC: Institute for International Economics).
Corsetti, Giancarlo, Paolo Pesenti, Nouriel Roubini, Cedric Tille, (1998). “Structural Links and
Contagion Effects in the Asian Crisis: A Welfare Based Approach,” mimeo, Yale University.
Danielsson, J. and C. de Vries, (1997), “Value-at-Risk and Extreme Returns,” London School of
Economics Working Paper. De Bandt, Olivier and Philipp Hartmann, (2000). “Systemic Risk: A Survey,” European Central
Bank Working Paper Series, November. Eichengreen, Barry, Andrew Rose and Charles Wyplosz, (1996). “Contagious Currency Crises,”
National Bureau of Economic Research Working Paper No. 5681. Frankel, Jeffrey and Sergio Schmukler, 1998, “Crises, Contagion, and Country Funds: Effects on
East Asia and Latin America,” in Reuven Glick (ed.), Managing Capital Flows and Exchange Rates: Perspectives from the Pacific Basin, (New York: Cambridge University Press), pages 232-266.
Gelos, Gastón and Ratna Sahay, (2000), “Financial Market Spillovers in Transition Economies,”
IMF Working Paper WP/00/71 Glick, Reuven and Andrew Rose, (1998). “Contagion and Trade: Why are Currency Crises
Regional?” NBER Working Paper No. 6806.
22

Kaminsky, Graciela L., and Carmen M. Reinhart, (1999). “The Twin Crises: The Causes of Banking and Balance-of-Payments Problems,” American Economic Review.
Kaminsky, Graciela L. and Carmen M. Reinhart, 2000, “On Crises, Contagion, and Confusion,”
Journal of International Economics. Kaminsky, Graciela L., and Carmen M. Reinhart, 2001, “Bank Lending and Contagion:
Evidence from the Asian Crisis,” in T. Ito and A. Krueger, eds. Regional and Global Capital Flows: Macroeconomic Causes and Consequences, (Chicago: University of Chicago Press for the NBER).
Kaminsky, Graciela, Richard Lyons, and Sergio Schmukler, 2002, “Managers, Investors, and
Crises: Mutual Fund Strategies in Emerging Markets,” World Bank Working Paper. Kaminsky, Graciela, Richard Lyons, and Sergio Schmukler, 2001, Economic Fragility,
Liquidity, and Risk: The Behavior of Mutual Funds During Crises,” World Bank Working Paper.
Kee-Hong, B., G. A. Karolyi, and R. Stulz, (2000), “A New Approach to Measuring Financial
Contagion,” mimeo. Longin, F. M., (1996), “The Asymptotic Distribution of Extreme Stock Market Returns,”
Journal of Business, 69, 383-408. Mati, Amine, (2001), “Extreme Returns: News and Patterns of Contagion,” George Washington
University, mimeo. Van Rijckeghem, Caroline and Beatrice Weder, (2000). “Financial Contagion: Spillovers
through Banking Centers”, mimeo, IMF Working Paper.
23
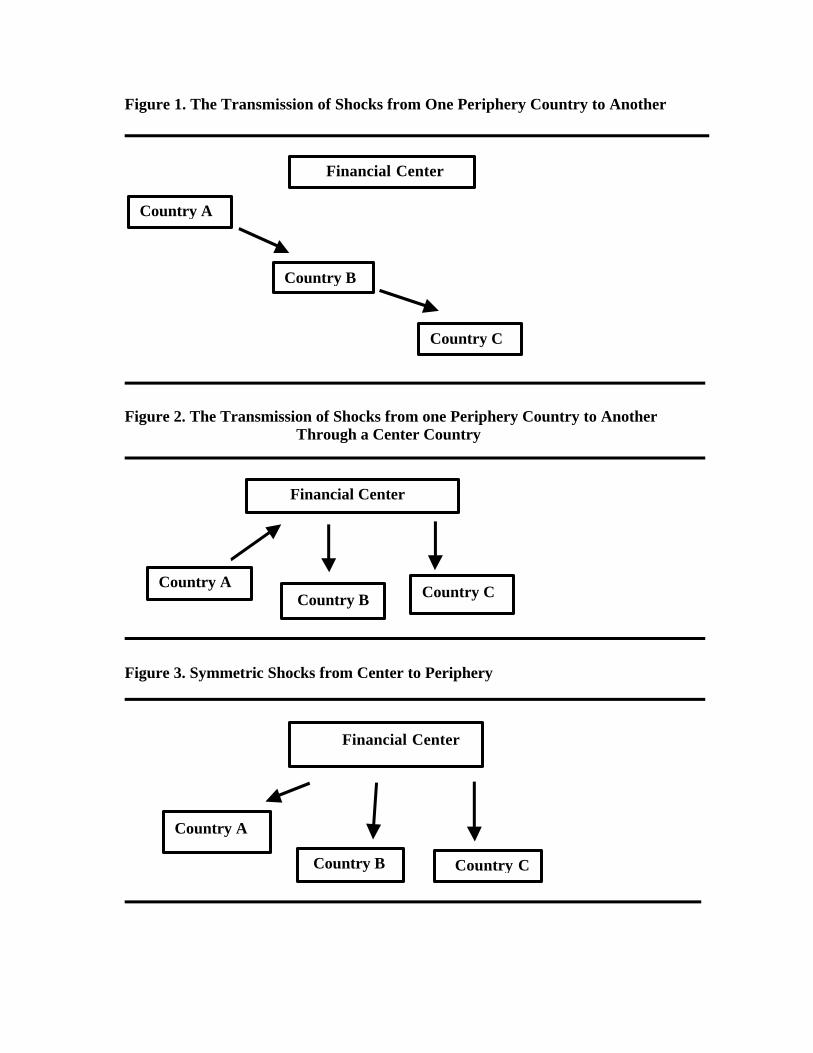
Figure 1. The Transmission of Shocks from One Periphery Country to Another Figure 2. The Transmission of Shocks from one Periphery Country to Another Through a Center Country Figure 3. Symmetric Shocks from Center to Periphery
Financial Center
Country A
Country B
Country C
Financial Center
Country A Country B Country C
Financial Center
Country A
Country B Country C

Note: Numbers in the y axis represent the percentage of countries experiencing turmoil. Turmoil is defined as those observations in the 5th and 95th percentiles.
Figure 4World Globalization
Regional Globalization
0
20
40
60
80
100
J-97
A-9
7
J-97
O-9
7
J-98
A-9
8
J-98
O-9
8
J-99
A-9
9
J-99
Asia
0
20
40
60
80
100
J-97
A-9
7
J-97
O-9
7
J-98
A-9
8
J-98
O-9
8
J-99
A-9
9
J-99
Europe
0
20
40
60
80
100
J-97
A-9
7
J-97
O-9
7
J-98
A-9
8
J-98
O-9
8
J-99
A-9
9
J-99
G7
0
20
40
60
80
100
J-97
A-97
J-97
O-9
7
J-98
A-98
J-98
O-9
8
J-99
A-99
J-99
Latin America
0
20
40
60
80
100
J-97
A-9
7
J-97
O-9
7
J-98
A-9
8
J-98
O-9
8
J-99
A-9
9
J-99
Transition Economies
0
20
40
60
80
100
J-97
A-9
7
J-97
O-9
7
J-98
A-9
8
J-98
O-9
8
J-99
A-9
9
J-99

Stock Market Returns in Domestic Currency
5th 95thHONG KONG 1.40 -3.39 3.17INDONESIA 1.62 -3.94 4.51
KOREA 1.96 -4.43 5.32MALAYSIA 1.72 -3.63 3.78
PHILIPPINES 1.41 -3.26 3.46SINGAPORE 1.30 -2.89 3.00THAILAND 1.78 -3.49 4.74
GREECE 1.59 -3.32 3.62FINLAND 1.31 -2.79 2.82HOLLAND 1.16 -2.42 2.46NORWAY 1.00 -2.29 2.18
SPAIN 1.03 -2.13 2.29SWEDEN 0.98 -2.16 2.00TURKEY 2.49 -5.75 5.82
CANADA 0.71 -1.63 1.49FRANCE 0.90 -2.02 2.01
ITALY 1.26 -2.61 2.88GERMANY 1.20 -2.54 2.27
JAPAN 0.93 -1.99 2.20UK 0.86 -1.90 1.86
USA 0.87 -1.80 1.90
ARGENTINA 1.60 -4.31 3.41BRAZIL 2.13 -4.84 4.31CHILE 1.03 -2.24 2.42
COLOMBIA 0.83 -2.01 2.17MEXICO 1.35 -2.78 3.23
PERU 1.01 -2.15 2.33VENEZUELA 1.55 -3.98 3.48
CZECH REPUBLIC 0.94 -2.30 2.10ESTONIA 1.84 -4.00 4.54
HUNGARY 1.63 -3.48 3.48POLAND 1.35 -3.02 3.03RUSSIA 2.49 -5.10 6.48
SLOVAKIA 0.97 -2.49 2.38UKRAINE 2.07 -5.18 5.42
Notes: The sample extends from January 1,1997 to August 31,1999. Mean is the average of one-day percent returns in absolute values.
Countries mean percentiles
Table 1
Summary Statistics

HON IND KOR MAL PHI SING THA GRE FIN HOL NOR SPA SWE TUR CAN FRA GER ITA JAP UK USA ARG BRA CHI COL MEX PER VEN CZE EST HUN POL RUS SVK UKRAHON 1 0.06 0.04 0.11 0.04 0.12 0.10 0.01 0.31 0.13 0.04 0.07 0.20 0.35 0.27 0.24 0.17 0.03 0.34 0.15 0.12 0.04 -0.04 -0.03 0.03 0.02 -0.06 -0.08IND 0.40 1.00 0.05 0.12 0.19 0.08 0.18 0.15 0.09 0.31 0.20 0.14 0.13 0.20 0.26 0.20 0.21 0.26 0.08 0.27 0.26 0.18 0.08 0.04 0.06 0.12 0.06 -0.07 -0.04KOR 0.21 0.17 1.00 0.06 0.15 0.15 0.11 0.17 0.14 0.08 0.19 0.15 0.13 0.12 0.20 0.21 0.19 0.16 0.13 0.02 0.19 0.16 0.13 0.07 0.02 0.10 0.09 0.15 0.08 -0.06MAL 0.35 0.29 0.21 1.00 -0.03 0.08 0.07 0.06 0.11 0.08 0.00 0.24 0.11 0.09 0.01 0.11 0.26 0.12 0.12 0.13 0.02 0.16 0.10 0.10 0.06 -0.02 -0.01 0.06 0.09 0.01 -0.03PHI 0.44 0.39 0.22 0.20 1.00 0.12 0.23 0.27 0.21 0.27 0.22 0.11 0.33 0.26 0.24 0.25 0.31 0.30 0.34 0.27 0.24 0.08 0.30 0.26 0.20 0.21 -0.02 0.18 0.14 0.04 0.02 0.03
SING 0.68 0.50 0.24 0.40 0.53 1.00 0.03 0.13 0.18 0.14 0.19 0.19 0.03 0.36 0.22 0.13 0.15 0.25 0.37 0.29 0.26 0.27 0.07 0.35 0.20 0.19 0.08 -0.01 0.03 0.08 -0.02 -0.03 -0.04THA 0.36 0.40 0.28 0.32 0.35 0.47 1.00 0.07 0.11 0.15 0.10 0.20 0.13 0.05 0.24 0.17 0.14 0.15 0.18 0.19 0.19 0.18 0.20 0.05 0.22 0.15 0.17 0.06 0.05 0.08 0.11 0.11 -0.04 -0.01
GRE 0.18 0.09 0.13 0.12 0.14 0.20 0.17 1.00 0.25 0.06 0.28 0.26 0.24 0.21 0.07 0.21 0.16 0.11FIN 0.41 0.19 0.16 0.20 0.17 0.34 0.17 0.31 1.00 0.32 0.16 0.45 0.28 0.24 0.17 0.03 0.28 0.08 0.08
HOL 0.36 0.17 0.17 0.15 0.16 0.29 0.18 0.29 0.71 1.00 0.23 0.20 0.34 0.25 0.19 0.14 0.02 0.23 0.05 0.10NOR 0.37 0.18 0.11 0.20 0.20 0.36 0.19 0.28 0.67 0.63 1.00 0.27 0.12 0.36 0.26 0.22 0.19 0.00 0.25 0.12 0.11SPA 0.29 0.17 0.11 0.10 0.17 0.25 0.13 0.31 0.63 0.72 0.56 1.00 0.24 0.21 0.30 0.28 0.24 0.19 0.03 0.29 0.12 0.10SWE 0.38 0.16 0.16 0.16 0.17 0.31 0.16 0.31 0.76 0.74 0.67 0.69 1.00 0.27 0.19 0.36 0.31 0.25 0.18 0.02 0.25 0.12 0.14TUR 0.13 0.09 0.11 0.11 0.02 0.11 0.18 0.16 0.29 0.26 0.27 0.22 0.27 1.00 0.11 0.05 0.16 0.15 0.15 0.14 0.03 0.18 0.09 0.07
CAN 0.26 0.10 0.09 0.09 0.16 0.24 0.14 0.22 0.43 0.45 0.39 0.48 0.47 0.21 1.00 0.25 0.31 0.19 0.30 0.27 0.20 0.16 0.32 0.49 0.17 0.05 -0.01FRA 0.35 0.16 0.15 0.16 0.17 0.30 0.16 0.29 0.72 0.78 0.62 0.77 0.77 0.26 0.48 1.00 0.19 0.35 0.27 0.24 0.14 0.03 0.25 0.06 0.09GER 0.43 0.20 0.15 0.17 0.21 0.33 0.18 0.28 0.72 0.78 0.66 0.68 0.70 0.25 0.45 0.75 1.00 0.16 0.44 0.33 0.28 0.18 0.01 0.29 0.11 0.16ITA 0.26 0.12 0.12 0.11 0.12 0.22 0.11 0.27 0.63 0.69 0.54 0.75 0.67 0.25 0.40 0.76 0.62 1.00 0.13 0.28 0.24 0.18 0.13 0.05 0.22 0.04 0.05JAP 0.37 0.23 0.19 0.23 0.20 0.33 0.19 0.19 0.34 0.30 0.28 0.24 0.33 0.15 0.21 0.31 0.29 0.23 1.00 0.24 0.33 0.27 0.27 0.21 0.03 0.29 0.16 0.12 0.09 -0.05 0.06 -0.01 0.05 -0.06 0.03UK 0.39 0.16 0.20 0.23 0.22 0.34 0.21 0.26 0.67 0.74 0.60 0.66 0.70 0.24 0.45 0.75 0.68 0.66 0.32 1.00 0.34 0.24 0.23 0.11 0.02 0.21 0.02 0.09
USA 0.12 -0.02 0.09 -0.03 0.10 0.12 0.05 0.11 0.35 0.37 0.27 0.38 0.35 0.11 0.73 0.40 0.34 0.33 0.08 0.38 1.00 0.18 0.14 0.39 0.55 0.20 0.00 0.00
ARG 0.21 0.08 0.15 0.12 0.14 0.24 0.17 0.15 0.28 0.32 0.29 0.36 0.28 0.15 0.49 0.32 0.28 0.30 0.14 0.34 0.55 1.00 0.24 0.12 0.41 0.47 0.21 0.03 0.04BRA 0.13 0.01 0.15 0.03 0.12 0.16 0.11 0.15 0.25 0.33 0.19 0.34 0.23 0.15 0.43 0.32 0.26 0.27 0.12 0.32 0.54 0.71 1.00 0.22 0.08 0.39 0.45 0.19 0.04 -0.01CHI 0.21 0.11 0.12 0.04 0.20 0.21 0.16 0.12 0.31 0.32 0.30 0.37 0.30 0.13 0.38 0.35 0.31 0.30 0.15 0.35 0.41 0.52 0.52 1.00 0.18 0.09 0.32 0.37 0.14 0.01 0.10COL 0.10 0.11 0.05 0.07 0.06 0.07 0.06 0.05 0.17 0.13 0.16 0.16 0.13 0.10 0.14 0.14 0.16 0.15 0.06 0.15 0.09 0.11 0.07 0.15 1.00 0.14 0.04 0.08 0.02 -0.01 -0.01 0.11MEX 0.19 0.02 0.10 0.11 0.15 0.16 0.10 0.17 0.30 0.33 0.26 0.35 0.28 0.13 0.52 0.34 0.28 0.29 0.13 0.35 0.57 0.64 0.65 0.51 0.06 1.00 0.18 0.12 0.41 0.47 0.25 0.00 0.06PER 0.23 0.15 0.09 0.14 0.19 0.19 0.17 0.18 0.35 0.34 0.37 0.38 0.36 0.23 0.38 0.36 0.32 0.35 0.16 0.36 0.30 0.47 0.45 0.41 0.18 0.45 1.00 0.10 0.07 0.27 0.30 0.11 0.01 0.13VEN 0.21 0.16 0.10 0.10 0.14 0.22 0.19 0.09 0.24 0.26 0.28 0.30 0.32 0.18 0.30 0.25 0.25 0.24 0.15 0.29 0.20 0.35 0.29 0.30 0.12 0.32 0.31 1.00 0.13 0.03 0.19 0.18 0.10 0.02 0.04
CZE 0.22 0.15 0.12 0.14 0.16 0.22 0.17 0.29 0.34 0.32 0.39 0.32 0.35 0.24 0.30 0.37 0.34 0.31 0.20 0.38 0.18 0.17 0.10 0.18 0.07 0.17 0.25 0.20 1.00EST 0.18 0.09 0.03 0.09 0.09 0.16 0.10 0.11 0.13 0.11 0.09 0.08 0.13 0.04 0.04 0.14 0.12 0.11 0.05 0.10 0.02 0.00 0.00 0.03 0.01 0.01 -0.01 0.00 0.08 1.00HUN 0.41 0.26 0.25 0.20 0.24 0.36 0.21 0.29 0.50 0.46 0.45 0.45 0.46 0.32 0.28 0.46 0.48 0.41 0.33 0.43 0.14 0.22 0.14 0.24 0.14 0.15 0.28 0.24 0.40 0.17 1.00POL 0.43 0.27 0.29 0.30 0.34 0.41 0.28 0.30 0.46 0.36 0.42 0.34 0.43 0.27 0.25 0.37 0.43 0.33 0.35 0.39 0.13 0.15 0.13 0.21 0.10 0.12 0.27 0.20 0.34 0.15 0.52 1.00RUS 0.28 0.16 0.12 0.21 0.15 0.26 0.20 0.11 0.28 0.25 0.28 0.24 0.24 0.20 0.16 0.22 0.29 0.23 0.19 0.28 0.08 0.16 0.06 0.13 0.02 0.12 0.20 0.15 0.22 0.17 0.33 0.28 1.00SVK 0.05 0.01 -0.05 0.01 0.01 0.03 0.05 0.01 0.03 -0.01 -0.02 -0.03 0.00 0.02 0.02 -0.03 -0.01 -0.01 0.02 -0.01 -0.01 0.02 -0.03 -0.02 -0.05 -0.01 0.00 0.00 0.02 -0.03 0.03 0.03 0.08 1.00
UKRA 0.05 0.02 0.04 -0.01 0.03 0.11 0.01 0.07 0.08 0.01 0.11 0.05 0.14 0.02 0.16 0.06 0.08 0.08 0.06 0.06 0.11 0.15 0.13 0.18 0.16 0.08 0.09 0.07 0.12 0.00 0.07 0.12 0.06 -0.01 1.00
Notes: The lower triangular part of the correlation matrix reports the correlation on the same day. Since markets are not open at the same time, shocks to some countries will be transmitted to some regions the following day. The upper triangular part of the matrix reports the correlation between the returns of the countries listed in the column in day t with returns of the countries listed on top on day t+1 or day t-1 as appropriate.
Correlation of Stock Market ReturnsTable 2

5th 95th 5th 95th 5th 95th 5th 95th
HONG KONG 1.40 -3.39 3.17 2.08 -4.92 5.07 0.44 2.60 -6.61 7.41 ** 2.40 -3.92 7.01 **INDONESIA 1.62 -3.94 4.51 2.55 -5.24 7.41 ** 2.74 -4.76 7.30 *** 2.17 -4.84 7.12 ***
KOREA 1.96 -4.43 5.32 2.22 -4.97 6.35 0.98 2.81 -5.52 7.26 *** 2.41 -5.45 6.87 0.76MALAYSIA 1.72 -3.63 3.78 2.38 -4.80 5.89 ** 2.63 -5.37 5.71 0.06 2.58 -6.15 9.09 0.52
PHILIPPINES 1.41 -3.26 3.46 2.23 -5.54 4.21 *** 2.00 -4.95 5.83 ** 1.84 -4.86 4.31 0.51SINGAPORE 1.30 -2.89 3.00 1.95 -4.66 4.23 0.18 2.27 -3.93 7.00 *** 1.85 -3.62 3.85 0.23THAILAND 1.78 -3.49 4.74 2.09 -4.05 6.10 0.69 2.38 -3.94 8.16 0.47 1.83 -3.54 7.52 0.21
GREECE 1.59 -3.32 3.62 2.06 -6.13 3.60 0.06 2.17 -6.12 5.07 0.10 2.39 -5.57 4.93 0.06FINLAND 1.31 -2.79 2.82 3.07 -5.67 5.05 *** 2.20 -4.85 4.67 *** 2.11 -4.79 5.10 **HOLLAND 1.16 -2.42 2.46 2.77 -5.21 4.89 *** 1.75 -3.85 3.80 ** 1.69 -4.54 3.33 **NORWAY 1.00 -2.29 2.18 2.49 -5.39 5.05 *** 1.68 -4.95 5.05 ** 1.53 -4.64 4.44 **
SPAIN 1.03 -2.13 2.29 2.40 -6.03 5.12 *** 1.58 -4.79 4.01 ** 1.31 -3.69 3.78 0.30SWEDEN 0.98 -2.16 2.00 2.18 -4.34 3.21 *** 1.74 -4.07 3.28 *** 1.47 -3.71 3.31 **TURKEY 2.49 -5.75 5.82 3.74 -10.12 9.26 0.06 3.56 -10.12 8.78 0.12 3.45 -8.85 9.89 **
CANADA 0.71 -1.63 1.49 1.36 -3.72 2.75 *** 0.93 -2.04 1.67 0.07 1.83 -3.72 2.90 ***FRANCE 0.90 -2.02 2.01 2.22 -4.29 4.45 *** 1.42 -3.94 3.47 *** 1.23 -3.34 3.11 0.15
ITALY 1.26 -2.61 2.88 2.59 -5.63 5.29 *** 2.02 -5.23 4.48 ** 1.61 -4.33 4.96 **GERMANY 1.20 -2.54 2.27 3.57 -5.87 5.17 *** 1.88 -4.67 4.21 ** 1.90 -5.35 3.94 ***
JAPAN 0.93 -1.99 2.20 1.20 -3.07 2.84 ** 2.95 -4.15 4.37 *** 1.19 -2.79 2.77 0.62UK 0.86 -1.90 1.86 1.79 -3.25 3.32 *** 1.23 -2.96 2.67 ** 1.19 -3.06 3.00 **
USA 0.87 -1.80 1.90 1.39 -3.42 3.10 0.18 0.97 -2.06 2.12 0.28 2.60 -3.73 4.02 ***
ARGENTINA 1.60 -4.31 3.41 2.98 -10.44 5.76 0.06 2.14 -6.40 4.94 0.52 3.51 -9.17 8.13 ***BRAZIL 2.13 -4.84 4.31 3.73 -9.77 8.07 ** 2.73 -9.71 4.72 0.32 4.76 -10.08 10.34 ***CHILE 1.03 -2.24 2.42 1.71 -5.04 3.23 ** 1.05 -2.79 2.39 0.43 1.78 -4.69 3.55 **
COLOMBIA 0.83 -2.01 2.17 0.89 -2.38 2.30 0.79 1.04 -2.28 3.93 0.11 0.88 -2.42 1.95 0.88MEXICO 1.35 -2.78 3.23 2.67 -6.05 5.29 ** 1.98 -4.79 4.20 0.09 2.95 -6.05 7.17 ***
PERU 1.01 -2.15 2.33 1.85 -5.75 4.58 *** 1.29 -3.02 2.88 0.29 1.66 -4.70 3.97 **VENEZUELA 1.55 -3.98 3.48 2.25 -7.51 4.32 0.26 1.72 -5.09 2.32 0.06 2.04 -6.20 3.77 0.13
CZECH REPUBLIC 0.94 -2.30 2.10 1.62 -4.28 2.82 *** 1.18 -2.99 2.09 0.14 1.31 -3.48 2.33 **ESTONIA 1.84 -4.00 4.54 2.80 -8.35 8.25 0.16 2.97 -11.31 9.09 0.09 2.38 -8.35 5.36 0.43HUNGARY 1.63 -3.48 3.48 3.48 -10.03 4.94 *** 3.47 -10.76 8.63 ** 3.26 -10.76 9.10 ***POLAND 1.35 -3.02 3.03 2.34 -6.02 5.28 *** 2.42 -6.41 4.81 0.09 2.90 -6.60 6.53 ***RUSSIA 2.49 -5.10 6.48 4.73 -10.80 14.98 *** 3.82 -10.11 7.46 0.10 4.19 -12.49 14.67 0.07
SLOVAKIA 0.97 -2.49 2.38 1.09 -3.13 2.35 0.71 0.96 -2.56 1.82 0.30 0.83 -2.58 1.94 0.37UKRAINE 2.07 -5.18 5.42 3.15 -12.20 6.06 0.08 3.10 -11.07 8.09 0.13 3.02 -8.63 7.04 0.26
Notes: Turmoil is defined as those observations in the 5th and 95th percentiles. Mean is the average of one day percent returns in absolute values. The Kolmogorov Smirnov Test evaluates whether the frequency distribution on days of turmoil in the corresponding financial center is different from the frequency distribution on all other days. 5th and 95th percentiles report the the values of stock market returns at those percentiles. The sample extends from January 1,1997 to August 31,1999. ***,** represent the significance of the Kolmogorov Smirnov Test at the 1 and 5 percent level respectively.
Table 3
K&S p-value
meanK&S
p-valuemean
Percentilesmean
Percentiles Percentilesmean
COUNTRIES
Turmoil in Financial Centers: How Does It Spread?
Percentiles K&S p-value
Empirical Distribution of Stock Market ReturnsON DAYS OF TURMOIL IN USAON DAYS OF TURMOIL IN GERMANY ON DAYS OF TURMOIL IN JAPANON ALL DAYS

GERMANY JAPAN USA
Asia 43 71 29Europe 71 71 71
G7 100 75 75Latin America 43 0 71
Transition Economies 57 14 43
World 59 44 56
Notes: Turmoil is defined as those observations in the 5th and 95th percentiles.An anomalous return is interpreted as a change in the distribution of returns in country j on days of turmoil in country i.
Table 4
Weak-Form Globalization of TurmoilRegional and World Effects
REGIONS Percentage of Countries with Anomalous Returns when Turmoil in

5th 95th 5th 95th 5th 95th 5th 95thHONG KONG 1.40 -3.39 3.17 2.41 -4.82 7.41 0.32 2.05 -3.26 6.84 0.17 2.45 -4.52 6.84 ***INDONESIA 1.62 -3.94 4.51 2.50 -5.15 6.77 ** 2.32 -5.15 6.47 0.30 2.89 -5.03 8.00 **
KOREA 1.96 -4.43 5.32 2.60 -5.65 6.76 0.37 2.18 -4.97 4.91 0.49 2.35 -5.66 7.39 0.87MALAYSIA 1.72 -3.63 3.78 2.52 -4.73 9.42 0.68 2.85 -4.53 11.80 ** 2.81 -5.86 6.91 0.12
PHILIPPINES 1.41 -3.26 3.46 2.09 -5.28 4.80 0.12 2.19 -6.01 3.98 *** 2.46 -4.84 6.80 **SINGAPORE 1.30 -2.89 3.00 2.13 -3.58 5.92 0.09 1.94 -3.30 7.00 0.24 2.35 -3.84 7.62 **THAILAND 1.78 -3.49 4.74 2.18 -4.05 7.52 0.31 2.05 -3.51 5.96 0.69 5.71 -6.33 10.42 ***
GREECE 1.59 -3.32 3.62 2.20 -4.99 5.50 ** 2.23 -6.02 3.85 *** 1.89 -5.53 4.02 0.26FINLAND 1.31 -2.79 2.82 2.14 -4.85 4.36 *** 2.42 -5.59 4.50 *** 1.71 -4.81 3.31 0.74HOLLAND 1.16 -2.42 2.46 1.89 -5.00 3.38 *** 1.82 -5.21 2.68 *** 1.32 -3.15 2.50 0.29NORWAY 1.00 -2.29 2.18 1.99 -4.95 4.57 *** 2.11 -5.23 3.92 *** 1.61 -4.73 3.88 0.08
SPAIN 1.03 -2.13 2.29 1.61 -4.74 3.78 ** 1.67 -6.03 3.06 *** 1.16 -3.09 2.54 0.58SWEDEN 0.98 -2.16 2.00 1.69 -3.61 3.17 *** 1.61 -4.07 2.09 *** 1.22 -2.79 2.09 0.31TURKEY 2.49 -5.75 5.82 3.73 -9.25 8.78 *** 4.29 -10.99 9.86 *** 3.12 -8.23 7.98 0.65
CANADA 0.71 -1.63 1.49 1.32 -3.32 2.29 *** 1.19 -3.18 2.46 ** 0.94 -1.90 2.13 **FRANCE 0.90 -2.02 2.01 1.38 -3.34 2.94 *** 1.51 -4.29 2.55 *** 0.99 -3.08 2.20 0.69
ITALY 1.26 -2.61 2.88 2.02 -4.33 4.96 ** 2.08 -5.63 3.22 *** 1.39 -3.91 2.86 0.33GERMANY 1.20 -2.54 2.27 2.01 -5.54 3.94 ** 2.05 -5.68 3.51 *** 1.58 -4.32 3.35 0.38
JAPAN 0.93 -1.99 2.20 1.37 -3.00 3.76 0.24 1.18 -2.55 3.03 0.61 1.25 -3.22 3.56 0.25UK 0.86 -1.90 1.86 1.29 -3.13 3.00 *** 1.52 -3.14 2.69 *** 0.99 -2.03 2.89 0.11
USA 0.87 -1.80 1.90 1.72 -3.32 3.70 *** 1.31 -2.80 4.02 0.23 1.01 -2.13 2.18 0.13
ARGENTINA 1.60 -4.31 3.41 4.58 -10.44 8.51 *** 3.32 -10.44 7.41 ** 2.23 -4.15 6.09 0.12BRAZIL 2.13 -4.84 4.31 7.67 -10.09 12.19 *** 3.89 -10.08 7.66 ** 2.56 -5.19 6.72 0.20CHILE 1.03 -2.24 2.42 2.25 -5.04 4.34 *** 1.58 -5.04 2.53 0.16 1.28 -2.86 3.36 0.09
COLOMBIA 0.83 -2.01 2.17 1.10 -3.74 2.02 ** 0.91 -3.11 1.88 ** 0.88 -2.08 2.47 0.40MEXICO 1.35 -2.78 3.23 3.21 -6.05 8.43 *** 2.58 -5.57 6.40 ** 1.80 -3.76 4.59 0.26
PERU 1.01 -2.15 2.33 1.93 -5.64 3.84 *** 1.63 -5.11 3.78 ** 1.21 -2.47 3.51 **VENEZUELA 1.55 -3.98 3.48 2.63 -7.51 3.85 *** 2.03 -6.65 3.08 ** 1.85 -4.55 3.67 0.32
CZECH REPUBLIC 0.94 -2.30 2.10 1.61 -3.70 2.81 *** 1.83 -3.93 3.13 *** 0.98 -2.21 2.06 0.96ESTONIA 1.84 -4.00 4.54 3.04 -10.49 7.01 *** 3.54 -10.49 8.64 *** 2.37 -6.98 5.74 0.37HUNGARY 1.63 -3.48 3.48 3.65 -10.51 9.32 *** 3.61 -10.76 5.91 *** 2.18 -6.02 3.47 0.48POLAND 1.35 -3.02 3.03 2.61 -5.74 6.00 *** 2.45 -6.27 4.66 *** 1.98 -5.00 3.75 0.06RUSSIA 2.49 -5.10 6.48 4.75 -12.49 13.85 ** 9.74 -17.49 16.71 *** 3.46 -7.35 8.56 0.31
SLOVAKIA 0.97 -2.49 2.38 0.97 -3.04 2.68 0.94 1.19 -3.10 2.52 ** 1.14 -3.07 2.90 0.47UKRAINE 2.07 -5.18 5.42 4.37 -10.94 8.99 *** 3.27 -11.56 8.37 0.16 2.37 -6.24 8.56 0.96
Notes: Turmoil is defined as those observations in the 5th and 95th percentiles. Mean is the average of one day percent returns in absolute values. The Kolmogorov Smirnov Test evaluates whether the frequency distribution on days of turmoil in the corresponding emerging market is different from the frequency distribution on all other days. 5th and 95th percentiles report the the values of stock market returns at those percentiles. The sample extends from January 1,1997 to August 31,1999. ***,** represent the significance of the Kolmogorov Smirnov Test at the 1 and 5 percent level respectively.
Table 5Turmoil in Emerging Markets: How Does It Spread?
COUNTRIES
Empirical Distribution of Stock Market ReturnsON ALL DAYS ON DAYS OF TURMOIL IN BRAZIL ON DAYS OF TURMOIL IN RUSSIA ON DAYS OF TURMOIL IN THAILAND
meanPercentiles K&S
p-valuemean
Percentilesmean
PercentilesK&S p-value
meanPercentiles K&S
p-value
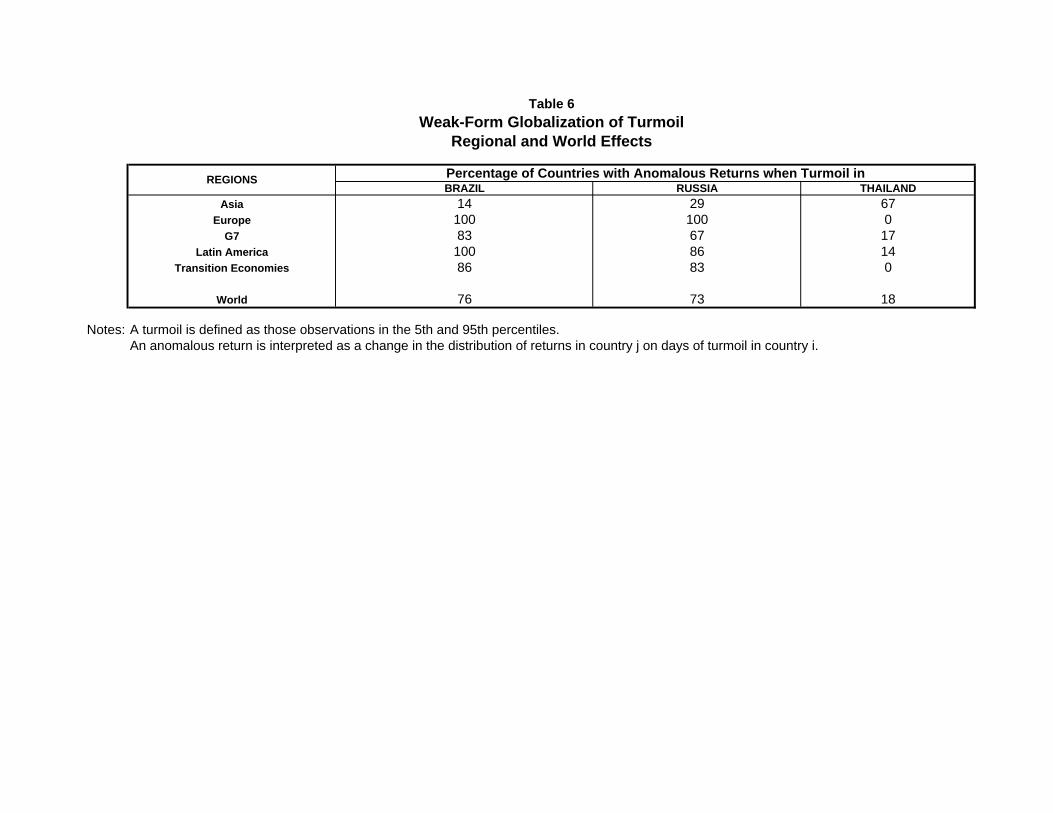
BRAZIL RUSSIA THAILAND
Asia 14 29 67Europe 100 100 0
G7 83 67 17Latin America 100 86 14
Transition Economies 86 83 0
World 76 73 18
Notes: A turmoil is defined as those observations in the 5th and 95th percentiles.An anomalous return is interpreted as a change in the distribution of returns in country j on days of turmoil in country i.
Table 6
Regional and World Effects
Percentage of Countries with Anomalous Returns when Turmoil in
Weak-Form Globalization of Turmoil
REGIONS

5th 95th 5th 95th 5th 95th 5th 95th 5th 95th 5th 95th 5th 95thHONG KONG 1.40 -3.39 3.17 2.41 -4.82 7.41 0.32 1.67 -4.38 5.53 0.74 2.05 -3.26 6.84 0.17 1.78 -3.10 6.95 0.11 2.45 -4.52 6.84 *** 1.96 -4.51 5.55 0.13INDONESIA 1.62 -3.94 4.51 2.50 -5.15 6.77 ** 2.00 -4.02 6.26 0.34 2.32 -5.15 6.47 0.30 1.79 -3.44 5.83 0.56 2.89 -5.03 8.00 ** 2.13 -4.28 5.75 0.72
KOREA 1.96 -4.43 5.32 2.60 -5.65 6.76 0.37 2.23 -5.65 6.76 0.82 2.18 -4.97 4.91 0.49 2.14 -3.94 5.08 0.13 2.35 -5.66 7.39 0.87 2.00 -5.66 7.39 0.69MALAYSIA 1.72 -3.63 3.78 2.52 -4.73 9.42 0.68 2.49 -3.75 14.94 0.92 2.85 -4.53 11.80 ** 2.74 -4.68 9.98 ** 2.81 -5.86 6.91 0.12 2.15 -4.05 4.36 0.48
PHILIPPINES 1.41 -3.26 3.46 2.09 -5.28 4.80 0.12 1.68 -4.60 3.11 0.12 2.19 -6.01 3.98 *** 1.79 -4.49 3.95 0.58 2.46 -4.84 6.80 ** 1.99 -4.43 5.97 0.34SINGAPORE 1.30 -2.89 3.00 2.13 -3.58 5.92 0.09 1.73 -3.21 4.92 0.36 1.94 -3.30 7.00 0.24 1.62 -3.30 6.22 0.15 2.35 -3.84 7.62 ** 1.80 -3.82 5.56 0.36THAILAND 1.78 -3.49 4.74 2.18 -4.05 7.52 0.31 1.97 -3.95 6.36 0.77 2.05 -3.51 5.96 0.69 2.29 -3.47 7.44 0.77 5.71 -6.33 10.42 *** 5.59 -6.76 10.74 ***
GREECE 1.59 -3.32 3.62 2.20 -4.99 5.50 ** 1.64 -4.00 3.47 0.13 2.23 -6.02 3.85 *** 1.71 -3.86 3.95 0.70 1.89 -5.53 4.02 0.26 1.76 -5.84 3.67 0.31FINLAND 1.31 -2.79 2.82 2.14 -4.85 4.36 *** 1.59 -4.49 2.83 ** 2.42 -5.59 4.50 *** 1.51 -3.17 3.95 0.11 1.71 -4.81 3.31 0.74 1.38 -2.66 3.06 0.47HOLLAND 1.16 -2.42 2.46 1.89 -5.00 3.38 *** 1.57 -2.78 2.92 0.10 1.82 -5.21 2.68 *** 1.14 -2.53 1.86 0.27 1.32 -3.15 2.50 0.29 1.24 -1.98 2.93 0.49NORWAY 1.00 -2.29 2.18 1.99 -4.95 4.57 *** 1.66 -4.04 3.47 ** 2.11 -5.23 3.92 *** 1.49 -2.96 3.89 0.07 1.61 -4.73 3.88 0.08 1.31 -2.77 3.51 0.19
SPAIN 1.03 -2.13 2.29 1.61 -4.74 3.78 ** 1.43 -4.83 2.49 0.15 1.67 -6.03 3.06 *** 0.86 -1.78 1.96 0.68 1.16 -3.09 2.54 0.58 0.99 -2.30 2.39 0.20SWEDEN 0.98 -2.16 2.00 1.69 -3.61 3.17 *** 1.41 -3.11 2.58 0.16 1.61 -4.07 2.09 *** 1.10 -2.77 2.06 0.12 1.22 -2.79 2.09 0.31 0.98 -2.36 2.02 0.34TURKEY 2.49 -5.75 5.82 3.73 -9.25 8.78 *** 2.88 -8.04 7.09 0.26 4.29 -10.99 9.86 *** 3.56 -6.66 9.87 0.18 3.12 -8.23 7.98 0.65 3.13 -8.22 7.96 0.42
CANADA 0.71 -1.63 1.49 1.32 -3.32 2.29 *** 0.71 -1.81 1.51 0.98 1.19 -3.18 2.46 ** 0.88 -2.20 2.03 0.12 0.94 -1.90 2.13 ** 0.92 -1.92 2.21 0.08FRANCE 0.90 -2.02 2.01 1.38 -3.34 2.94 *** 1.18 -2.95 2.20 0.19 1.51 -4.29 2.55 *** 0.84 -2.08 1.30 0.39 0.99 -3.08 2.20 0.69 0.90 -2.03 2.34 0.99
ITALY 1.26 -2.61 2.88 2.02 -4.33 4.96 ** 1.83 -4.19 3.38 0.11 2.08 -5.63 3.22 *** 1.46 -2.90 3.05 0.23 1.39 -3.91 2.86 0.33 1.16 -2.33 2.78 0.10GERMANY 1.20 -2.54 2.27 2.01 -5.54 3.94 ** 1.52 -3.55 2.15 0.41 2.05 -5.68 3.51 *** 1.09 -2.31 2.10 0.31 1.58 -4.32 3.35 0.38 1.44 -2.58 3.62 0.82
JAPAN 0.93 -1.99 2.20 1.37 -3.00 3.76 0.24 1.36 -2.41 3.87 0.20 1.18 -2.55 3.03 0.61 1.05 -1.93 3.06 0.59 1.25 -3.22 3.56 0.25 0.69 -1.50 1.87 **UK 0.86 -1.90 1.86 1.29 -3.13 3.00 *** 1.12 -2.13 2.59 0.09 1.52 -3.14 2.69 *** 1.15 -2.11 2.35 0.10 0.99 -2.03 2.89 0.11 0.89 -1.65 2.73 0.40
USA 0.87 -1.80 1.90 1.72 -3.32 3.70 *** 0.93 -1.77 1.68 0.19 1.31 -2.80 4.02 0.23 1.04 -1.83 3.49 0.79 1.01 -2.13 2.18 0.13 0.99 -2.11 2.16 0.16
ARGENTINA 1.60 -4.31 3.41 4.58 -10.44 8.51 *** 3.48 -8.82 6.55 *** 3.32 -10.44 7.41 ** 2.63 -4.85 8.49 0.13 2.23 -4.15 6.09 0.12 2.18 -4.74 6.53 0.33BRAZIL 2.13 -4.84 4.31 7.67 -10.09 12.19 *** 6.68 -9.69 8.81 *** 3.89 -10.08 7.66 ** 3.24 -8.46 10.79 0.51 2.56 -5.19 6.72 0.20 2.57 -5.12 7.20 0.24CHILE 1.03 -2.24 2.42 2.25 -5.04 4.34 *** 1.95 -3.87 4.08 *** 1.58 -5.04 2.53 0.16 1.27 -3.07 3.73 0.63 1.28 -2.86 3.36 0.09 1.31 -2.99 3.53 0.28
COLOMBIA 0.83 -2.01 2.17 1.10 -3.74 2.02 ** 1.14 -3.97 2.23 ** 0.91 -3.11 1.88 ** 0.85 -3.79 1.94 0.18 0.88 -2.08 2.47 0.40 0.91 -1.98 2.51 0.37MEXICO 1.35 -2.78 3.23 3.21 -6.05 8.43 *** 2.19 -3.45 5.12 0.12 2.58 -5.57 6.40 ** 1.91 -3.75 5.89 0.50 1.80 -3.76 4.59 0.26 1.56 -3.66 3.62 0.61PERU 1.01 -2.15 2.33 1.93 -5.64 3.84 *** 1.44 -5.34 3.37 ** 1.63 -5.11 3.78 ** 1.25 -2.83 3.84 0.47 1.21 -2.47 3.51 ** 1.16 -2.29 2.65 **
VENEZUELA 1.55 -3.98 3.48 2.63 -7.51 3.85 *** 2.33 -7.19 3.93 ** 2.03 -6.65 3.08 ** 1.50 -4.19 3.07 0.24 1.85 -4.55 3.67 0.32 1.95 -4.17 4.12 0.12
CZECH REPUBLIC 0.94 -2.30 2.10 1.61 -3.70 2.81 *** 1.44 -3.71 2.85 ** 1.83 -3.93 3.13 *** 1.43 -2.33 3.07 0.06 0.98 -2.21 2.06 0.96 0.99 -2.18 2.35 0.99ESTONIA 1.84 -4.00 4.54 3.04 -10.49 7.01 *** 2.78 -8.05 8.57 0.22 3.54 -10.49 8.64 *** 3.42 -9.09 9.31 *** 2.37 -6.98 5.74 0.37 1.76 -6.16 4.63 0.76
HUNGARY 1.63 -3.48 3.48 3.65 -10.51 9.32 *** 2.46 -6.35 7.99 0.29 3.61 -10.76 5.91 *** 2.42 -7.22 4.22 0.14 2.18 -6.02 3.47 0.48 1.69 -3.49 3.12 0.72POLAND 1.35 -3.02 3.03 2.61 -5.74 6.00 *** 1.84 -3.79 4.36 0.26 2.45 -6.27 4.66 *** 1.86 -4.38 3.86 ** 1.98 -5.00 3.75 0.06 1.51 -4.28 2.83 0.20RUSSIA 2.49 -5.10 6.48 4.75 -12.49 13.85 ** 3.58 -6.54 8.44 0.13 9.74 -17.49 16.71 *** 9.37 -17.85 15.71 *** 3.46 -7.35 8.56 0.31 3.08 -7.29 8.32 0.18
SLOVAKIA 0.97 -2.49 2.38 0.97 -3.04 2.68 0.94 0.91 -3.07 2.93 0.94 1.19 -3.10 2.52 ** 1.11 -3.06 2.79 0.40 1.14 -3.07 2.90 0.47 1.31 -4.01 3.19 0.23UKRAINE 2.07 -5.18 5.42 4.37 -10.94 8.99 *** 3.72 -10.94 8.99 0.08 3.27 -11.56 8.37 0.16 3.04 -7.04 8.83 0.19 2.37 -6.24 8.56 0.96 1.65 -3.68 8.28 0.99
Notes: Turmoil is defined as those observations in the 5th and 95th percentiles. Mean is the average of one day percent returns in absolute values. The Kolmogorov Smirnov Test evaluates whether the frequency distribution on days of turmoil in the corresponding emerging m (with or without turmoil in a financial center) is different from the frequency distribution on all other days. 5th and 95th percentiles report the the values of stock market returns at those percentiles. The sample extends from January 1,1997 to August 31,1999. ***,** represent the significance of the Kolgomorov-Smirnov Test at the 1 and 5 percent respectively.
With Financial center Without Financial Center With Financial Center Without Financial CenterON DAYS OF TURMOIL IN RUSSIA ON DAYS OF TURMOIL IN THAILAND
With Financial Center Without Financial Center
Empirical Distribution of Stock Market Returns
percentiles K&S p-valuemean mean percentiles K&S
p-value mean
ON ALL DAYS ON DAYS OF TURMOIL IN BRAZIL
percentiles K&S p-value
percentiles K&S p-value mean percentiles
Table 7
COUNTRIESpercentilesmean
Financial Turmoil in Emerging Markets and Financial Centers: How Does It Spread?
mean percentiles K&S p-value
K&S p-value mean

REGIONS
With Financial Center
Without Financial
Center
W p-value
With Financial Center
Without Financial
Center
W p-value
With Financial Center
Without Financial
Center
W p-value
Asia 14 0 29 14 67 0Europe 100 29 100 0 0 0
G7 83 0 67 0 17 14Latin America 100 83 86 0 14 14
Transition Economies 86 14 83 33 0 0
World 76 24 73 12 18 6
Wilcoxon Statistic (W) 1320 891 0.00 1452 759 0.00 1188 1023 0.00
Notes: The Financial Center is respectively USA for Brazil, Germany for Russia and Japan for Thailand. Turmoil is defined as those observations in the 5th and 95th percentiles.An anomalous return is interpreted as a change in the distribution of returns in country j on days of turmoil in country i.
BRAZIL RUSSIA THAILAND
Table 8Weak-Form Globalization of Turmoil
Regional and World Effects
Percentage of Countries with Anomalous Returns when Turmoil in

TURMOIL IN GERMANY TURMOIL IN JAPAN TURMOIl IN USA
Medium 2.51*** 1.78*** 1.25***(7.88) (5.49) (3.74)
High 4.71*** 2.56*** 2.45***(7.14) (5.72) (6.85)
Pseudo R2 0.19 0.08 0.10Number of Observations 694 694 694
Notes: Numbers in parentheses represent z statistics. ***,**, * represents the significance of the coefficient at the 1, 5 and 10 percent levels. Turmoil is defined as those observations in the 5th and 95th percentiles. The left-hand-side variable captures the degree of globalization. There are three possible degrees of globalization: Low ( when less than 25 percent of the countries in the sample experience turmoil), medium (whenmore than 25 percent but less than 50 percent of the countries experience turmoil), high ( when 50 percent or more of all countries in the sample experience turmoil). In order to be able to estimate our model, coefficients for the low globalizationare set equal to zero (that is our base case). Interpretation of the reported coefficients has to be done with respect to the base case. Our model was estimated with a constant but constant coefficients are notreported here for expositional purposes.
TURMOIL IN GERMANY TURMOIL IN JAPAN TURMOIL IN USA
Low 40 58 52
Medium 36 26 22
High 23 16 26
Notes: Turmoil is defined as observations in the 5th and 95th percentiles.Probabilities are given in percent terms and are derived from the multinomial logit estimation shownin the top panel.
Table 9
Strong-Form GlobalizationMultinomial Logit Estimation
Probabilities Conditional on
Coefficients
Degree Of Globalization
Degree of Globalization
))'exp(1/()'exp()(2
1∑
=
+==i
ii xxiyP ββ

With Financial CenterWithout Financial
Centerp-values With Financial Center
Without Financial
Centerp-values With Financial Center
Without Financial
Centerp-values
Medium 2.14*** 1.41*** 0.28 2.70*** 1.36*** * 2.32*** 0.91** **(3.62) (3.61) (4.33) (3.61) (4.03) (2.3)
High 4.64*** 2.47*** *** 5.53*** 1.18 *** 2.18*** 0.37 *(8.44) (4.85) (7.87) (1.07) (2.6) (0.63)
Pseudo R2 0.13 Pseudo R2 0.15 Pseudo R2 0.03
Notes: Numbers in parentheses represent z statistics. ***,**, * represents the significance of the coefficient at the 1, 5 and 10 percent levels. Turmoil is defined as those observations in the 5th and 95th percentiles. The left-hand-side variable captures the degree of globalization. There are three possible degrees of globalization: Low ( when less than 25 percent of the countries in the sample experience turmoil), medium (when more than 25 percent but less than 50 percent of the countries experience turmoil), high ( when 50 percent or more of all countries in the sample experience turmoil). In order to be able to estimate our model, coefficients for the low globalization had to equal zero (that is our base case). Interpretation of the reported coefficients has to be done with respect to the base case. Our model was estimated with a constant but constant coefficients are not reported here for expositional purposes.P column reports p values for test of equality between parameters estimated with and without Turmoil in Financial Centers. The financial Center is respectively USA for Brazil, Germany for Russia and Japan for Thailand.Number of observations for our sample was 694.
With Financial CenterWithout Financial
CenterWith Financial Center
Without Financial
CenterWith Financial Center
Without Financial
Center
Low 21 56 87 23 75 92 47 80 90
Medium 21 27 10 27 23 7 40 17 8
High 57 17 2 50 2 1 13 4 3
Notes: Turmoil is defined as observations in the 5th and 95th percentiles. Probabilities are given in percent terms and are derived from the multinomial logit estimation shown in the top panel.
No TurmoilNo Turmoil
TURMOIL
No Turmoil
TURMOIL
Probabilities Conditional onBRAZIL RUSSIA THAILAND
TURMOIL
Degree of Globalization
Table 10Strong-Form Globalization
Multinomial Logit Estimation
CoefficientsTURMOIL IN BRAZIL TURMOIL IN RUSSIA TURMOIL IN THAILAND
Degree of Globalization
))'exp(1/()'exp()(2
1∑
=
+==i
ii xxiyP ββ

With Financial Center
Without Financial Center
p-valuesWith Financial
Center
Without Financial
Centerp-values
With Financial Center
Without Financial
Centerp-values
Medium 0.93*** -0.58*** *** 0.35 0.17 0.54 0.63** 0.05 *
(4.23) (-2.12) (1.31) (1.07) (2.34) (0.31)
High 2.67*** 0.85** *** 2.71*** 0.37 *** 2.14*** 0.41 ***
(9.22) (2.11) (8.49) (0.99) (4.68) (1.15)
Pseudo R2 : 0.07Number of Observations : 3469
Notes: Numbers in parentheses represent z statistics. ***,**, * represents the significance of the coefficient at the 1, 5 and 10 percent levels. Turmoil is defined as those observations in the 5th and 95th percentiles. The left-hand-side variable captures the degree of globalization. There are three possible degrees of globalization: Low ( when less than 25 percent of the countries in the sample experience turmoil), medium (when more than 25 percent but less than 50 percent of the countries experience turmoil), high ( when 50 percent or more of all countries in the sample experience turmoil). In order to be able to estimate our model, coefficients for the low globalization had to equal zero (that is our base case). Interpretation of the reported coefficients has to be done with respect to the base case. Our model was estimated with a constant but constant coefficients are not reported here for expositional purposes.P column reports p values for test of equality between parameters estimated with and without Turmoil in Financial Centers. The financial Center is respectively USA for Brazil, Germany for Russia and Japan for Thailand.
With Financial Center
Without financial Center
With Financial Center
Without Financial
Center
With Financial
Center
Without financial Center
Low 77 51 84 61 70 60 76
Medium 21 36 13 24 28 31 22
High 1 13 3 15 2 9 2
Notes: Turmoil is defined as observations in the 5th and 95th percentiles. Probabilities are given in Percent termsand are derived from the multinomial logit estimation shown in the top panel.
Turmoil in Russia Turmoil in ThailandDegree Of Globalization
Probabilities Conditional on
No Turmoil
Turmoil in Brazil
Degree of Globalization
BRAZIL RUSSIA THAILAND
Table 11Strong-Form Globalization
Multinomial Logit Panel Estimation
Coefficients
))'exp(1/()'exp()(2
1∑
=
+==i
ii xxiyP ββ

With Financial Center
Without Financial
Centerp-value
Medium 0.65*** 0.01 ***
(4.76) (0.11)
High 2.64*** 0.57*** ***(14.64) (2.71)
Pseudo R2 0.07#Observations 3469
Notes: Numbers in parentheses represent z statistics. ***,**, * represents the significance of the coefficient at the 1, 5 and 10 percent levels. Turmoil is defined as those observations in the 5th and 95th percentiles. The left-hand-side variable captures the degree of globalization. There are three possible degrees of globalization: Low ( when less than 25 percent of the countries in the sample experience turmoil), medium (when more than 25 percent but less than 50 percent of the countries experience turmoil), high ( when 50 percent or more of all countries in the sample experience turmoil). In order to be able to estimate our model, coefficients for the low globalization had to equal zero (that is our base case). Interpretation of the reported coefficients has to be done with respect to the base case. Our model was estimated with a constant but constant coefficients are not reported here for expositional purposes.P column reports p values for test of equality between parameters estimated With and Without Turmoil in Financial Centers. The explanatory variable is emerging market. Such variable could equal 0,1,2,3 depending on how many emerging markets (Brazil,Russia,Thailand) experienced turmoil concurrently.
With Financial Center Without
Financial Center
With Financial Center
Without Financial
Center
With Financial Center
Without Financial
Center
Low 77 56 76 19 75 2 73
Medium 21 31 22 20 22 4 21
High 1 13 2 62 4 94 6
Notes:Turmoil is defined as observations in the 5th and 95th percentiles. Probabilities are given in percent terms and are derived from the multinomiallogit estimation shown in the top panel.
Probabilities Conditional on
Degree of Globalization No Turmoil
TURMOIL IN ONE EMERGING MARKET
TURMOIL IN TWO EMERGING MARKETS
TURMOIL IN THREE EMERGING MARKETS
Table 12Strong-Form Globalization
Multinomial Logit Panel Estimation
Degree of Globalization
CoefficientsEmerging Markets
))'exp(1/()'exp()(2
1∑
=
+==i
ii xxiyP ββ

Asymmetries
Proportion of Crashes
Proportion of Rallies
World 85 15
Asia 29 71
Latin America 69 31
Europe 61 39
G7 56 44
Transition Economies 61 39
Note: Numbers reported in the above table are in percent.
News on Days of High globalization
Center Periphery Center Periphery Center Periphery Center Periphery Center PeripheryRegional 8 8 18 23 11 10 11 3 2 7World 10 10 30 15 10 10 10 5
Note : Numbers in the above table are in percent.
Degree of Globalization and Size of Returns
Small Medium Large
LOW 46 48 5MEDIUM 12 86 2HIGH 0 92 8
Notes: Numbers in the above table are in percent. Small returns are returns between the 3rd (97th) and 5th (95th) percentiles. Medium Returns are returns between the 1st (99th) and 3rd (97th) percentiles. Large Returns are returns in the 1st (99th) percentile. The first cell of this table indicates that 46 percent of the days of low globalization had countries experiencing on average a small return.
Economy and Politics Monetary Policy
TABLE 13
Days of Globalization: Asymmetries, Origins and Size of Shocks
International AgreementsProportion of Days with News about the
Financial Sector
Degree of World Globalization
Regions
Regions
BANKING
Days of High Globalization
Returns
OTHER

Appendix Table The Globalization of Financial Turmoil: Chronology of News
January 1, 1997 to August 31,1999
DAY ALL ASIA EUR G7 LA TRA NEWS
7-Apr-97 57
EUR: European and US Stocks up, benefiting from comments of EU finance ministers who indicated the single currency will begin on time. (FS-OTHER, CENTER)
28-Aug-97 71
ASIA: Investors flee the region amid a deepening loss of confidence in the ability of governments to tackle their severe economic problems. (E&PN, PERIPHERY)
22-Oct-97 57
ASIA: Share prices fall sharply in Asian markets due to a sharp drop in futures prices in Singapore and fears about higher interest rates and currency stability in Hong Kong. (FS-OTHER,PERIPHERY)
23-Oct-97 57 71 57
G7, EUR, LA: Hong Kong Monetary Authority was forced to sell US dollars to support the currency, triggering interest rate hikes that prompted a global sell off. (FS-OTHER, PERIPHERY)
27-Oct-97 57 71 86 86
EUR, G7, LA: A $600 billion sell-off shut down the US market for the first time since 1981. The sell-off was triggered by Southeast Asia’s shaky economies, by a jump in interest rates, as well as by a stream of weak earning reports. Panic grips other regions as US market crashes especially after the Hong Kong declines of the past week. (E&PN, PERIPHERY); (FS-OTHER, CENTER)
28-Oct-97 80 100 86 86 71 57
ASIA, EUR, TRA, G7: still reacting to US -market-crash and Hong Kong crash. (FS-OTHER, CENTER) LA: Markets soar as US market rallies. (FS-OTHER, CENTER)
29-Oct-97 63 57 71 86 71
EUR, G7, TRA: Markets soared as US soared the day before. (FS-OTHER, CENTER) ASIA: Asian markets finish lower as investors fear another steep drop in US markets. (FS-OTHER, CENTER)
30-Oct-97 71 57
EUR: Stocks soared after Greenspan eased concern that inflation could be on the rise. (MP, CENTER) LA: Strong declines in the region stemmed from contagion in Asia. Fears about Brazil ‘s real currency and liquidity crunch of its banking system. (FS-OTHER, PERIPHERY); (FS-BANKING, PERIPHERY)
3-Nov-97 57 ASIA: Stocks rally as a financial aid package to Indonesia restores calm to the region. China also eases credit. (IA, PERIPHERY); (MP, PERIPHERY)
7-Nov-97 57 G7: The US dollar surges reaching a six-month high as concerns increased in the market over the ability

DAY ALL ASIA EUR G7 LA TRA NEWS of the Japanese government to revive the country’s economy. (E&PN, CENTER)
12-Nov-97 71 71
LA: Concern about fiscal austerity package announced by Brazil. Markets also fall after steep declines in Asian markets. (E&PN, PERIPHERY), (FS-OTHER, PERIPHERY) TRA: Stocks fall after major drops in Asian markets. (FS-OTHER, PERIPHERY)
17-Nov-97 86 57
EUR, G7: Stocks up as Japan PM hints that public spending may be used to stimulate the economy and protect depositors following the collapse of the nation’s largest bank. US reports low inflation measures. (FS-BANKING CENTER); (E&PN, CENTER)
24-Nov-97 57 EUR: Shares fall after the collapse of Japan’s fourth largest brokerage firm, Yamaichi Securities company. (FS-BANKING, CENTER)
1-Dec-97 57 G7: Stock markets rally on gains in Asian markets overnight (FS-OTHER, PERIPHERY)
11-Dec-97 100 57
ASIA: Stocks slumped as Moody’s cut rating of South Korea’s currency. (E&PN, PERIPHERY) EUR: Stocks down amid a new wave of selling in Asian markets and signs of weakness in the US economy (FS-OTHER, PERIPHERY); (E&PN, CENTER)
9-Jan-98 71
LA: Asian turmoil, especially concerns about Indonesia, causes markets declines. Central Bank of Chile raises key interest rate (FS-OTHER, PERIPHERY); (MP, PERIPHERY)
12-Jan-98 71 71
EUR, TRA: Peregrine, one of Asia’s largest investment banks (Hong Kong), files for liquidation raising concerns about emerging markets in general (FS-BANKING, PERIPHERY)
13-Jan-98 71 ASIA: Stocks rose on optimism about IMF backed reforms for the region (IA, PERIPHERY)
14-Jan-98 86 ASIA: Stocks continued to rise on optimism about IMF backed reforms for the region (IA, PERIPHERY)
19-Jan-98 100
ASIA: Indonesia signaled commitment to the much awaited bank reform. Camdessus issues statement of confidence about Malaysia and countries in the region.(FS-BANKING, PERIPHERY); (IA, PERIPHERY)
22-Jan-98 57 ASIA: The plunging Indonesian rupiah dragged the rest of Asia into a downward spiral. (FS-OTHER, PERIPHERY)
2-Feb-98 71
ASIA: Stocks up as value oriented funds flooded back into Asia from Europe and US. Strength driven by liquidity even though nothing changed in the fundamentals front. (FS-OTHER, PERIPHERY)
27-Apr-98 86 86 EUR, G7: Concern US will raise interest rates to fight Inflation (MP, CENTER)
26-May-98 57 LA: Concerns about a potential devaluation in Russia affecting Brazil and other emerging markets. (FS-

DAY ALL ASIA EUR G7 LA TRA NEWS affecting Brazil and other emerging markets. (FS-OTHER, PERIPHERY)
27-May-98 57 EUR: Speculation about Russian devaluation of the ruble caused fall in stock prices. (FS-OTHER, PERIPHERY)
1-Jun-98 57
TRA: Russian stock prices plummeted while the main market for Russian futures announced that it was suspending trading indefinitely. Unfulfilled expectations of foreign aid to Russia contributed to the declines. (FS-OTHER, PERIPHERY); (IA, PERIPHERY)
15-Jun-98 51 86 57 57
ASIA: Japanese government announced that GDP contracted for a second consecutive quarter. (E&PN, CENTER) ASIA, LA, G7, TRA: Loss of confidence in emerging markets in general as Russian market tumbled for a seventh straight day. (FS-OTHER, PERIPHERY)
17-Jun-98 71 ASIA: US and Japan coordinated actions to sell US dollars and buy Japanese yens. Markets soared due to the stronger yen. (IA, CENTER)
18-Jun-98 100 ASIA: Countries in the region still reacting to the US and Japan coordinated actions to prop up the yen (IA, CENTER)
14-Jul-98 71 TRA: Russia would receive 22.6 billion dollars from IMF and other bilateral donors (IA, PERIPHERY)
11-Aug-98 60
86 71 57
EUR, G7, LA: Foreign investors seemed to be the main driving force behind the market drop. Fears of a weaker yen, and the prospect of devaluation in China sent shock waves throughout the world. (FS-OTHER, CENTER); (FS-OTHER, PERIPHERY)
13-Aug-98 71 TRA: Russian shares fell more than 10 percent early on growing fears of a liquidity crisis among Russian banks. (FS-BANKING, PERIPHERY)
18-Aug-98 57 EUR: Gains in European markets following a major Wall Street advance (FS-OTHER, CENTER)
20-Aug-98 71 LA: Concern Russian banks may fail and Venezuela may devalue (FS-BANKING, PERIPHERY); (FS-OTHER, PERIPHERY)
21-Aug-98 54 71 71 71
LA: Concern about imminent currency devaluation in Venezuela. (FS-OTHER, PERIPHERY) EUR, G7, LA: Russia’s Central Bank stated that some Russian banks could go bankrupt accentuating the Russian financial crisis. In Germany (a major lender to Russia) stocks plunged, triggering downfalls in London and Paris (FS-BANKING, PERIPHERY); (FS-OTHER, CENTER)
26-Aug-98 71 EUR: Stocks fall as Russia announces its debt restructuring plan (FS-OTHER, PERIPHERY)
27-Aug-98 74 86 100 100 86
EUR, G7, LA, TRA: Russia’s government unable to sell its newly restructured GKO bills spreading fear that global crisis will continue. (FS-OTHER, PERIPHERY)

DAY ALL ASIA EUR G7 LA TRA NEWS
1-Sep-98 57 57
LA: Stocks end sharply higher mirroring the DJIA’s rebound (FS-OTHER, CENTER) EUR: Stocks up on optimism about Europe’s prospects. (FS-OTHER, CENTER)
2-Sep-98 71 57
TRA: Markets rebound as investors went for bargains. (FS-OTHER, PERIPHERY) EUR: Stocks follow rebound in the US stock market. (FS-OTHER, CENTER)
3-Sep-98 57 57 57
LA: Moody’s downgraded Brazil’s and Venezuela’s foreign debt and put Argentina’s foreign currency debt and 11 banks on review for a possible downgrade. (E&PN, PERIPHERY), (FS-BANKING, PERIPHERY) EUR, G7: European stock markets were hurt by a dollar plunge and worries that financial troubles are spreading from Russia and Asia to Latin America. (FS-OTHER, PERIPHERY)
4-Sep-98 57 TRA: Russia’s parliament delays a vote on Chernomyrdin’s appointment as Prime Minister at Yeltsin’s request. (E&PN, PERIPHERY)
7-Sep-98 57 57
ASIA: Stronger yen and a higher stock market helps Japanese banks but fund managers stay skeptical (FS-BANKING, CENTER). EUR: Greenspan hints he would favor cutting interest rates. (MP, CENTER)
8-Sep-98 57 57 G7, TRA: Renewed confidence was felt thanks to market supportive comments from Fed Chairman Alan Greenspan.(MP, CENTER)
10-Sep-98 60 71 71 86 57
EUR, G, TRA, LA: Worries about banks exposures as S&P downgrades Spain’s second largest bank. Credit ratings for Argentina’s two largest banks were also reduced. (FS-BANKING, CENTER); (FS-BANKING, PERIPHERY)
11-Sep-98 57
LA: Brazilian Government boosted overnight interest rates by 20 percentage points to try to stem capital flight, which reached 2.2 billion dollars the day before.(FS-OTHER, PERIPHERY)
14-Sep-98 71 71 G7, TRA: Russia’s new PM pledges to revive the economy. (E&PN, PERIPHERY)
15-Sep-98 86 57
LA, TRA: G7 meeting hints at financial aid for Latin America. Argentina may borrow 5.7 billion dollars from the World Bank and other international institutions. (IA, PERIPHERY)
17-Sep-98 54 86 86 EUR, G7: Greenspan states that there is no move to coordinate interest rates (MP, CENTER)
21-Sep-98 86 57
G7, EUR: Concern about Japan’s recession and low growth potential for OECD countries due to emerging markets collapse and deepening financial collapse. Political parties in Japan remains at odds on how to use taxpayer money to prop up LTCB of Japan.

DAY ALL ASIA EUR G7 LA TRA NEWS (E&PN, CENTER); (FS-OTHER, EMERGING); (FS-BANKING, CENTER)
22-Sep-98 71 EUR: US markets rebound day after the Clinton grand jury testimony. (E&PN, CENTER)
23-Sep-98 57.14 57 100
LA: President of IDB says Brazil could receive up to 50 billion dollars in aid from international institutions. IMF and US also gave statements of support for Brazil Aid. (IA, PERIPHERY) G7, EUR: Investors hope that Greenspan will hint at a possible rate cut when he testifies before the senate banking committee. (MP, CENTER)
24-Sep-98 86 57
ASIA: Stocks up as Greenspan suggests he may lower interest rates. (MP, CENTER) LA: Stocks down as concern over banks is felt after some of the largest banks put together a 4-billion dollar bailout of LTCM raising concern about credit. Brazil announces fiscal austerity measures. (E&PN, PERIPHERY); (FS-BANKING,CENTER)
25-Sep-98 71
TRA: Russian tax collection continued to plummet in September, due to the crash on Russian financial markets and the country's ensuing banking crisis (statement by tax official). (E&PN, PERIPHERY)
30-Sep-98 57 G7: US cut interest rates and asked other countries to follow suit. (MP, CENTER)
1-Oct-98 66 86 100 71
G7, EUR, LA: Concerns about global economic slump. Report US manufacturing production weakened for fourth straight month as exports slumped. (E&PN, CENTER)
2-Oct-98 57 57
LA: Stock markets soared on hopes of a financial package for troubled Brazil (IA, PERIPHERY) TRA: Stocks still falling following global declines of October first. (FS-OTHER, CENTER)
6-Oct-98 57
G7: Disappointment that the G7 meeting in Washington failed to adopt a clear strategy to address global economic issues drove share prices sharply lower in world markets. (IA, CENTER)
8-Oct-98 51 86 71 EUR, G7: Speculation the Fed would cut interest rates. Japan moves to repair its economy. (MP, CENTER) (E&PN, CENTER)
9-Oct-98 57 57 57
ASIA, G7: Interest cuts in UK and other European countries in the preceding week generated rallies in several markets. (MP, CENTER) LA: Brazilian authorities and the International Monetary Fund issued a joint statement on the availability of a rescue package to help cushion the region from market turmoil (IA, PERIPHERY)
12-Oct-98 54 57 71 71 EUR, G7, ASIA: Japan will substantially increase the amount of money it will spend on shoring up its fragile banking system. (FS-BANKING, CENTER)
16-Oct-98 71 71 EUR, G7: Fed Funds rate cut by a quarter th

DAY ALL ASIA EUR G7 LA TRA NEWS percentage point on Oct. 15th. (MP,CENTER)
20-Oct-98 57 57
EUR, G7: Suggestions that France and Germany would lower their interest rates boosted investor sentiment in Europe as well as continued gains in the USA and a rally in Asian markets (MP, CENTER); (FS-OTHER, CENTER); (FS-OTHER, PERIPHERY)
27-Oct-98 71 EUR: Italy makes a surprise cut in interest rate by a full percentage point. (MP, CENTER)
30-Oct-98 71 LA: G7 countries said they would back a new IMF credit line to Brazil, speeding aid to Brazil. (IA,PERIPHERY)
2-Nov-98 71 57
EUR, TRA: Stocks rallied after the October 30th US commerce department report announcing better than expected third quarter growth rates. (E&PN, CENTER)
4-Nov-98 71
G7: Democrats increased seats in the US Congressional elections, the first party with an incumbent resident to do this since 1934. Stocks rally after interest rate cuts in Italy and Sweden in the past week (E&PN, CENTER); (MP, CENTER)
10-Nov-98 57 ASIA: Investors await the release of the Japanese government’s stimulus package (E&PN, CENTER).
11-Nov-98 57 ASIA: Japan’s newest economic stimulus package is expected to be the largest ever. (E&PN, CENTER)
20-Nov-98 57 EUR: European stocks finished with strong gains as bourses benefited from hopes of further European rate cuts. (MP, CENTER)
30-Nov-98 57 57
G7: Global markets were given a boost after the DJIA marked a record high. (FS-OTHER, CENTER) LA: Latin American investors were influenced by heavy profit taking on Wall Street and Brazil. (FS-OTHER, PERIPHERY)
1-Dec-98 57 71 G7, EUR: Stocks down on weak dollar (FS, CENTER, OTHER)
3-Dec-98 57
LA: The US dollar weakened as investors were discouraged by the continuing decline in U.S. stocks and Wednesday's defeat in the Brazilian Congress of an important government austerity measure. (FS-OTHER, CENTER); (E&PN, PERIPHERY)
21-Dec-98 57 G7: High expectations on the Euro boost stocks. (FS-OTHER, CENTER)
4-Jan-99 86 57 EUR, G7: Stock prices ended up higher lured by a weak dollar and start of Euro trading. (FS-OTHER, CENTER)
6-Jan-99 57 71
G7: US rallied on the back of technology stocks. (FS-OTHER, CENTER) ASIA: Japanese market followed an overnight jump in New York stocks lead by strength in the high-technology sector. (FS-OTHER, CENTER)
12-Jan-99 57 LA: Markets closed sharply lower due to rumors of an interest rate hike in Brazil and a near $200 million outflow. (FS-OTHER, PERIPHERY)

DAY ALL ASIA EUR G7 LA TRA NEWS
13-Jan-99 66 100 57 86 57 EUR, LA, TRA: Brazil’s Central Bank Chairman resigns. Brazil devalues its currency. (E&PN, PERIPHERY); (MP, PERIPHERY)
14-Jan-99 57 LA: Standard & Poor’s downgraded certain Latin American Banks and some of Brazil’s foreign currency debt. (FS-BANKING, PERIPHERY)
15-Jan-99 71 LA: Brazil lets its currency float against the dollar (FS-OTHER, PERIPHERY)
18-Jan-99 57 EUR: Bank mergers in France, Spain and calmer financial markets in Brazil pushed stocks higher (FS-BANKING, CENTER); (FS-OTHER, PERIPHERY).
9-Feb-99 57
G7: There were growing concerns in Europe about a slowdown in the economy. European markets fell following financial turmoil in emerging markets. Japanese investors were waiting for measures, if any, from the BOJ to curb the recent sharp rise in bond yields, which would increase borrowing costs for companies and could stall Japan's efforts to revive its battered economy. (E&PN,CENTER); (FS-OTHER, PERIPHERY)
5-Mar-99 86
G7: Labor department reported hourly wages rose 0.1 percent in February, less than the 0,3 percent forecasted. Unemployment went up 0.1 percent point. (E&PN, CENTER)
16-Apr-99 57 ASIA: Influx of European funds brought up Asian stocks posting sharp gains throughout the region. (FS-OTHER, CENTER)
19-Apr-99 57 ASIA: Investors fell confident that the global financial crisis is largely over. (FS-OTHER, PERIPHERY)
26-May-99 71
LA: Markets rebound as fears concerning Argentina’s ability to maintain its currency board (as well as fears about a potential political scandal involving Brazilian President Cardoso) subside. (FS-OTHER, PERIPHERY) ; (E&PN, PERIPHERY)
29-July-99 57 G7: Investors were relieved when Alan Greenspan offered nothing new to upset global markets in a testimony to US lawmakers. (MP, CENTER)
Notes: FS: News from the financial Sector. They could either originate in the banking sector (BANKING) or not (OTHER). MP: News about Monetary Policy E&PN: News about the economy (excluding the financial sector) and political news. IA: Refers to international agreements or policy coordination actions Numbers in cells represent the percentage of countries in their respective region (or world) experiencing turmoil on that day. The parenthetical statements after each news event explain the region from which news originated and our classification of news. For example, On July 29,1999; 57 percent of the G7 countries were affected by Alan Greenspan’s testimony. His testimony was classified as Monetary Policy News originating in the Center (MP, CENTER).