Navigation 4
31
The Use of Bigrams to Enhance Text Categorization Chade-Meng Tan * Yuan-Fang Wang ** Chan-Do Lee Department of Computer Science University of California Santa Barbara, CA 93106 Tel: (805)893-3866 FAX: (805)893-8553 [email protected] [email protected] Department of Information and Communication Engineering Taejon University Taejon, 300-716, KOREA Tel: 82(42)280-2551 FAX: 82(42)284-0109 [email protected] * Current Address: Google Inc., 2400 Bayshore Pkwy, Mountain View, CA 94043. Tel: (650)330-0100 x 1146; FAX: (650)618-1499 ** Corresponding author
description
Network
Transcript of Navigation 4

The Use of Bigrams to Enhance
Text Categorization
Chade-Meng Tan∗ Yuan-Fang Wang∗ ∗ Chan-Do Lee
Department of Computer Science
University of California
Santa Barbara, CA 93106
Tel: (805)893-3866
FAX: (805)893-8553
[email protected] [email protected]
Department of Information and
Communication Engineering
Taejon University
Taejon, 300-716, KOREA
Tel: 82(42)280-2551
FAX: 82(42)284-0109
∗ Current Address: Google Inc., 2400 Bayshore Pkwy, Mountain View, CA 94043.
Tel: (650)330-0100 x 1146; FAX: (650)618-1499
∗ ∗ Corresponding author

1
Abstract
In this paper, we present an efficient text categorization algorithm that generates bigrams
selectively by looking for ones that have an especially good chance of being useful. The
algorithm uses the information gain metric, combined with various frequency thresholds. The
bigrams, along with unigrams, are then given as features to a Naïve Bayes classifier. The
experimental results suggest that the bigrams can substantially raise the quality of feature sets,
showing increases in the break-even points and F1 measures. The McNemar test shows that in
most categories the increases are very significant. Upon close examination of the algorithm, we
conclude that the algorithm is most successful in correctly classifying more positive documents,
but may cause more negative documents to be classified incorrectly.
Keywords: information retrieval, text categorization, text classification, machines learning.
2
1. Introduction
Text categorization (also known as text classification) is, quite simply, the automated
assignment of natural language texts to predefined categories based on their content (see
Sebastiani, 2000, for an introduction). Its applications include indexing texts to support
document retrieval, extracting data from texts, and aiding humans in these tasks (Lewis 1992b).
The performance of standard text categorization techniques on standard test corpora has been
quite encouraging. Apté et al. (1998), for example, reported an 87.8% precision/recall break-
even point for the Reuters-21578 corpus.
At present, text categorization techniques are predominantly keyword-based. Many
researchers in the field have used different classifiers, but most of them treat a document as a bag
of words (BOW), that is, identify terms with all the words occurring in the document, and
perform categorizations based mainly on the presence or absence of keywords. Billsus and
Pazzani (1997) showed that various categorization techniques produced similar results for BOW-
based features1. Yang and Pederson (1997) and Lewis and Ringuette (1994) came to the similar
conclusions.
1 In categorization features are often used to refer to the same kind of entity as terms in
information retrieval. In this paper, we use them interchangeably as appropriate.

3
In a number of experiments (Lewis, 1992a, 1992b, 1992c; Apté et al., 1994), it was found
that the use of phrases2 actually caused text categorization performance to degrade. Despite of
these discouraging results, investigations of using phrases have been actively pursued
(Mladeni) and Grobelnik 1998; Fürnkranz, 1998; Schütze et al., 1995; Schapire et al., 1998).
This paper presents our attempt to improve categorization performance by automatically
extracting and using phrases, especially two-word phrases (hereafter bigrams). Our algorithm
generates high quality bigrams by using the information gain (infogain) metric, combined by
various frequency thresholds. The experimental results suggest that the bigrams can substantially
raise the quality of feature sets, showing increases in the break-even points and F1 measures.
The remainder of the paper is organized as follows: Section 2 reviews related works and
justifies our study, Section 3 discusses our algorithm and its implementation, Section 4 presents
our experimental results, Section 5 analyzes the results and the performance of the algorithm,
and Section 6 suggests further work.
2A phrase refers to “an indexing term that corresponds to the presence of two or more single
word indexing terms” (Lewis, 1992a, p.35), whether the notion of phrase is motivated
syntactically or statistically.

4
2. The Use of Phrases in Text Categorization
Lewis (1992a, 1992b, 1992c) extensively examined the use of phrases in text
categorization. He performed part-of-speech parsing on the text and used all noun phrases that
occurred at least twice as features. He showed that phrases gave worse performance than single
words. The degradation in performance was due to that high dimensionality, low frequency, and
high degree of synonymy using phrases as features outweigh the advantages phrases had in
lowering ambiguity (Lewis 1992b). Lewis (1992a) gave a more detailed analysis of why phrases
failed to do well. He stated 6 characteristics that were desirable for features for text
categorization:
1. Small number of indexing terms
2. Flat distribution of values for an indexing term
3. Lack of redundancy among terms
4. Low noise in indexing term values
5. Lack of ambiguity for linguistically derived terms
6. Terms should be related to the classes to be induced
Phrases tend to do well on the criterion 5, but badly on the first 4 criteria. First, the
number of indexing terms for phrases may be large. If there are d words, for example, there are
potentially d2 phrases. Second, most of these d2 phrases are likely to take on the value of 0 for all
documents, while the rest might be 0 for most documents, implying that the distribution of the
indexing terms may be far from flat. Third, phrases are likely to have higher redundancy caused
5
by high synonymy: if each word in a phrase has k synonyms, then k2 phrases could have the
same meaning. Lastly, phrases tend to be noisier. If two phrases have an identical meaning, we
would want them to be assigned to the same documents. However, in most natural language
texts, the opposite is the case. In short texts, there are simply not enough references to a concept
for all the synonymous phrases to be used. Having more phrases with the same meaning only
worsens the problem.
Several efforts have been made to circumvent the possible problems posed by using
phrases and some research results showed that the addition of n-grams (sequences of words of
length n) to the BOW representation indeed improved performance. However, sequences of
length n > 3 were shown to be not useful and might decrease the performance.
Mladeni) and Grobelnik (1998) generated new features based on word sequences of
different length up to 5. Learning was performed using NB classifier on feature-vectors, where
only highly scored features according to term frequency were used. The performance was
evaluated using Yahoo text hierarchy. They showed that using word sequences of length up to 3
instead of using only single words improved the performance, while longer sequences in average
had no influence on the performance.
Fürnkranz (1998) came to a similar conclusion. He used an algorithm based on the
APRIORI algorithm for efficiently generating features using term frequency and document
frequency as criteria. His experimental results indicated that word sequences of length 2 or 3
were most useful, while using longer sequences reduced categorization performance. He also

6
showed that moderate frequency-based pruning of the feature set could be useful, while heavy
frequency-based pruning resulted in a performance decrease, thus contradicting the findings by
Yang and Pederson (1997) and Lewis (1992b) that heavy pruning may improve performance.
Schütze et al. (1995) applied dimensionality reduction techniques to overcome
computational intensity and overfitting in solving document routing, a problem of statistical text
categorization. As terms they used single words and two-word phrases that were chosen by term
frequency as an evaluation measure. Their findings showed that a reduced feature space was both
practical and beneficial for document routing.
Schapire et al. (1998) used words and phrases in applying Rocchio’s algorithm for text
filtering. They also used term frequency as a criterion to choose which phrases to select.
However, they were not clear as to what a phrase meant.
Our approach is different in many aspects from the above-mentioned studies. First, we
use bigrams in addition to, not in place of, single words. Second, we are highly selective of the
bigrams we use. The number of bigrams our algorithm finds is no more than 2% of the number
of single words as we try to avoid the problem of high dimensionality. With continued use of
single words in combination with a small number of added bigrams, our approach fares only
slightly worse for criteria 1 – 4 mentioned in Lewis (1992a). Finally, we use infogain in addition
to document frequency and term frequency to choose which bigrams to use. This means that the
bigrams that we select are likely to be good discriminators and less likely to be noisy.

7
3. Our Algorithm and Its Implementation
The idea of our algorithm is simply to find bigrams in which at least one of the
constituent words (hereafter unigrams) has a minimum document frequency in at least one of the
categories. Intuitively, what our algorithm does is to first find the list of unigrams that appear in
a significant number of documents, and use them as seeds. All the training documents are then
scanned and we gather all bigrams where at least one of its component unigrams is a seed. We
then select only the bigrams, among those extracted, with high occurrences and infogain. Figure
1 shows the pseudo-code of our algorithm.
1. Find S = {set of words that occur in at least df_seed ∗ number of documents in at least 1 category } 2. Set B = @. 3. For each document in the training set 4. { 5. Preprocess document by removing all numbers, punctuation and words in a stoplist. 6. For each pair of adjacent words (w1, w2) in preprocessed document 7. If (w1 is in S or w2 is in S), add bigram "w1+w2" to B. 8. } 9. For each b in B 10. { 11. For each category c 12. { 13. If (b occurs in less than df_bigram ∗ number of documents in category c) 14. OR (b occurs in fewer than tf_bigram times in all documents) 15. remove b from B 16. } 17. If (b is not removed and b has infogain < ig_bigram) remove b from B 18. } 19. Output B
Figure 1. Bigram extraction algorithm

8
We performed some pilot experiments and the number 0.01 seemed to be good for
df_seed and 0.005 for df_bigram. For ig_bigram, we set it to the infogain of the single word at
position igat_unigram in the list of unigrams sorted by decreasing infogain. igat_unigram was
set at approximately 1 percent of all unigrams. We also set max_bigram at 1.5 times
igat_unigram. In our experiments, igat_unigram was set to 1500 for the Yahoo! Science corpus
(corresponding roughly to 1% of the 160,000+ unique unigrams) and for the Reuters corpus, it
was set to 400 (about 1% of the 42,000+ unique unigrams). Finally, we set tf_bigram to 3.
Note that the algorithm preprocesses the training set to collect the occurrence statistics of
each unigram and to calculate its infogain.
Our programs were written in C and built upon Andrew McCallum's Bag of Words
Library (libbow) (McCallum 1996). The libbow distribution ships with a text categorization
front-end known as rainbow. We made use of rainbow for building models of our data and for
its built-in NB classifier. Stemming was not used in categorization.
4. Experiments
4.1 Test Corpora
Two corpora were used for the experiments. One was a collection of webpages pointed
to by the Yahoo! Science hierarchy gathered in July 1977 (McCallum, personal communication),

9
which we call the "Yahoo-Science" corpus. The other was the Reuters-21578 corpus, one of the
standard benchmarks for text categorization tasks.
All documents in both corpora were preprocessed to retain only the bodies of each
document by discarding headers and the likes. In addition, all numbers and punctuation were
removed and all words set to lower case. Finally, all stopwords were removed using a standard
stopwords list (Salton and McGill, 1983).
4.1.1 Yahoo-Science
The collection originally contained 14,869 documents in 30 top- level categories. For
each top-level category, “flattening” was performed: we moved all documents in its sub-
categories to the top- level category and removed all the sub-categories. We decided to
concentrate our attention on the 10 largest categories. All other categories were deleted and their
documents moved to the "Others" category. We also added 3,410 documents gathered from the
Yahoo! Health hierarchy to the "Others" category. The idea was to make our categorization
experiments a little more realistic by adding a significant number of totally unrelated documents.
In the end, we had 14,477 unique documents in our collection (with some documents
existing in more than 1 category). These documents contained a total of 160,975 unique words.
4.1.2. Reuters -21578
This collection contained 22,173 unique documents with 42,418 unique words. Since out
of 135 categories 14 had no documents and many others had very few documents (53 categories

10
had 10 or fewer documents, and 97 less than 100 documents), we decided to concentrate our
attention on the 12 largest categories.
4.2 Evaluation Measures
The standard performance measures for text categorization are recall and precision (Apté
et al. 1994). Each level of recall is associated with a level of precision. In general, the higher the
recall, the lower the precision, and vice versa. The point at which recall equals precision is the
break-even point (BEP), which is often used as a single summarizing measure for comparing
results.
There are instances where a real BEP does not exist. Other useful measures for evaluating
the effectiveness of classifiers are the F measures (Yang and Liu 1999). Among many variants
of them, F1 measure is used in this study.
These scores are often computed for the binary decisions on each individual category first
and then averaged. Both macro-averaging and micro-averaging are used in this study.
4.3 Experimental Results on Yahoo-Science Corpus
4.3.1 Experimental Tasks
The categorization task was treated as a series of sub-tasks, each performing binary
categorization on the chosen category except for the “Other”. For each category, we classified
whether a document is in the category (a "Is" document) or not in the category (a "Not"

11
document). To minimize the variations due to the selection of training data, we used a "3-fold
cross-validation": for each category, we partitioned the data into three sets, with "Is" and "Not"
documents equally distributed among them. We then ran three experiments for each category,
each experiment used two of the three sets as training set and the remaining as the test set and
calculated the average of the three runs as the final result for the category. These experiments
were run for categorization using only unigrams, and also for categorization using bigrams as
well as unigrams.
4.3.2 Bigrams extracted
The algorithm found bigrams effectively. It found average of 2520 unique bigrams over
10 categories and 1426 bigrams on each run (see Tan, 2000, for more detailed experimental
results).
Table 1 shows some of the 4439 unique bigrams found by our algorithm for the
Computer Science category. The algorithm was very successful at extracting bigrams that
accurately describe some concepts, such as “computer+science”, “genetic+algorithm”,
“source+code”, and “end+user”. Yet, there were bigrams found from the negative category, such
as “health+care”. Other categories showed similar findings.

12
Table 1. Sample bigrams extracted for Computer Science Category
computer+science artificial+intelligence
neural+networks department+computer
technical+reports machine+learning natural+language neural+network
computer+vision human+computer
genetic+algorithms
Evolutionary+computation school+computer
information+technology time+systems
research+artificial electrical+engineering
papers+technical source+code
vision+robotics intelligent+agents
higher+order
systems+fuzzy joint+conference
association+computational robotics+institute
finite+state ai+related
speech+technology message+passing
end+user ieee+transactions
health+care
Our observation was that the use of bigrams increased the infogain, thus improving the
quality of the features. On average in our experiment, 35.2 out of the top 100 features (in terms
of infogain) were bigrams. This is pretty good, considering that there was only an average of
1,426 bigrams and more than 160,000 unigrams in our experiment. Another observation we
made was that the bigrams improved the overall quality of the feature set. Without bigrams, the
average infogain of all the categories was 3.88963e-05. When the bigrams were added, it
increased by 31% to 5.09621e-05. Many of the bigrams were of significantly higher quality than
its constituent words. For example, "computer+science" was better than "computer" or "science."
4.3.3 Impact on performance
Figure 2 shows the Precision-Recall graph that summarizes the overall categorization
results for Yahoo-Science. As the figure shows, the overall performance improved when both
unigrams and bigrams were used.

13
Figure 2. Precision-Recall graph for Yahoo-Science
Table 2 summarizes the results for the entire corpus. Both BEP and F1 measure showed
that the performance of the classifier improved on each category when both unigrams and
bigrams were used. Five of the ten categories showed more than 10% increases, with the
highest at 27.6% in BEP and 28.6% in F1 measure.

14
Table 2. Performance improvements on Yahoo-Science
Category BEP (w/o bigrams)
BEP (with bigrams)
Improvement F1 Measure (w/o bigrams)
F1 Measure (with bigrams)
Improvement
agriculture 0.4295 0.5092 18.6 % 0.453 0.540 19.2 % astronomy 0.6950 0.7532 8.4 % 0.688 0.752 9.3 %
biology 0.5256 0.5788 10.1 % 0.519 0.599 15.4 % computer science 0.4383 0.5591 27.6 % 0.458 0.589 28.6 %
earth sciences 0.6229 0.6844 9.9 % 0.635 0.689 8.5 % engineering 0.6947 0.7183 3.4 % 0.693 0.720 3.9 % mathematics 0.4701 0.5628 19.7 % 0.497 0.595 19.7 %
physics 0.5209 0.6077 16.7 % 0.529 0.600 13.4 % space science 0.5397 0.5619 4.1 % 0.621 0.636 2.4 %
zoology 0.8489 0.8531 0.5 % 0.839 0.841 0.2 % Overall
(micro-average) 0.6509 0.6954 6.8% 0.661 0.705 6.7%
Average (macro-average)
0.57856 0.63885 11.9 % 0.5932 0.6561 12.1 %
4.4 Experimental Results on Reuters-21578
4.4.1 Experimental Tasks
For this experiment, we used the "ModLewis" raining/test split (13625/6188, with 1765
unused). Since a standard split already exists, we did not perform the resource-consuming
validation test.
4.4.2 Bigrams extracted
Like the Yahoo-Science experiment, the algorithm was very successful at extracting
bigrams that accurately describe some concepts. Examples included "federal+reserve",
"united+states", "soviet+union", "central+bank", and "crude+oil". However, once again, there

15
were bigrams that were captured which did not necessarily describe the category. For example,
"washington+march" in grain was formed because many of the articles on the topic were filed
from Washington in March.
On average, 44.6 out of the top 100 features (in terms of infogain) were bigrams, which
was even better than the case for Yahoo-Science. There was only an average of 531 bigrams and
about 40,000 unigrams. Again, we observed that the bigrams improved the overall quality of the
feature set. Without bigrams, the average infogain of the features over all the categories was
4.42648e-05. When the bigrams were added, it increased by 45.8% to 6.45557e-05.
4.4.3 Impact on performance
As Figure 3 shows, the overall performance improved when both unigrams and bigrams
were used.

16
Figure 3. Precision-Recall graph for Reuters-21578
Table 3 summarizes the results for the entire corpus. BEP increased in all categories, with
the highest at 21.4%. However, the performance as measured by F1 was mixed. While the largest
improvement remained at 27.1%, five out of twelve categories showed a drop. The possible
reasons of the degradation will be examined later.

17
Table 3. Performance improvements on Reuters-21578
Category BEP (w/o bigrams)
BEP (with bigrams)
Improvement F1 Measure (w/o bigrams)
F1 Measure (with bigrams)
Improvement
acq 0.7269 0.7325 0.8 % 0.680 0.669 -1.6 % corn 0.4956 0.6018 21.4 % 0.503 0.500 -0.6 % crude 0.7599 0.7968 4.8 % 0.790 0.796 0.8 %
dlr 0.5169 0.5619 8.7 % 0.457 0.581 27.1 % earn 0.8177 0.8379 2.5 % 0.765 0.787 2.9 % grain 0.7291 0.7826 7.3 % 0.710 0.703 -1.0 %
interest 0.6517 0.6966 6.9 % 0.664 0.678 2.1 % money-fx 0.6205 0.6427 3.6 % 0.661 0.656 -0.8 % oilseed 0.4211 0.4843 15.0 % 0.395 0.462 17.0 %
ship 0.6816 0.6928 1.6 % 0.681 0.695 2.1 % trade 0.4766 0.5192 8.9 % 0.515 0.550 6.8 % wheat 0.6714 0.6993 4.2 % 0.624 0.591 -5.3 %
Overall (micro-average)
0.7146 0.7334 2.6 % 0.700 0.705 0.7 %
Average (macro-average)
0.6308 0.6707 6.3 % 0.620 0.639 3.0 %
4.5 McNemar’s Test
So far we have shown that the algorithm enhanced text categorization in most categories.
However, how significant were the improvements? Was the better performance of the classifier
really due to the addition of bigrams? Could we safely say that our algorithm attributed to the
improvements? To answer these questions we ran a statistical test.
4.5.1 Procedure
McNemar’s test (Dietterich, 1997) is a statistical process that can validate the
significance of differences between two classifiers. Let Af̂ be the classifier trained with

18
unigrams only and Bf̂ be the one with both unigrams and bigrams. We tested them and recorded
how each category was classified to construct the following contingency table:
Number of Categories Correct by Af̂ Incorrect by Af̂
Correct by Bf̂ 00n 01n
Incorrect by Bf̂ 10n 11n
The McNemar’s test is based on the idea that there is little information in the numbers of
categories for which both classifiers get the correct results, or for which both get an incorrect
results; it is based entirely on the values of 01n and 10n . Under the null hypothesis ( 0H ), the two
algorithms should have the same error rate, meaning 1001 nn = . It is a 2χ test in disguise and
performs a test using the following statistic:
1001
21001 )1(
nn
nn
+
−−.
If the 0H is correct, then the probability that this number is bigger than
841459.32
95.0,1=χ is less than 0.05. So we may reject the 0H in favor of the hypothesis that the
two algorithms have different performance.

19
4.5.2 Test Results
Table 4 shows the results of performing McNemar’s test on all categories. Overall, the
test exhibited that the improvements made by employing bigrams were really due to the
algorithm the current study proposed. Yet, as shown in the table, some categories exhibited very
high degree of significance between the two algorithms, while a few categories, especially in
Reuter-21578, fell below the significant level.
Table 4. Results of McNemar’s Test
Category p-value Category p-value
agriculture 4.902e-10 acq 4.77e-06
astronomy 9.326e-15 corn 0.01192
biology 6.98e-10 crude 1.0
computer science 2.666e-11 dlr 1.0
earth sciences 2.516e-09 earn 2.065e-14
engineering 2.277e-08 grain 0.332
mathematics 5.679e-13 interest 0.2561
physics 0.001671 money-fx 0.5959
space science 0.8445 oilseed 0.5403
zoology 0.1360 ship 0.4497
trade 0.4881
wheat 0.002346
Yahoo-Science
Overall 2.2e-16
Reu
ter-21578
Overall 1.643e-14

20
5. Discussion
5.1 Summary of the results
The results of our experiments were very encouraging. Contrary to many research
findings that the use of multi-word phrases caused the performance of text categorization to
drop, our experiments showed that our approach to the extraction and use of bigrams could
significantly enhance the performance. In all categories the BEP increased, with the highest at
27.6%. The performance measured by the F1, however, was a little more mixed. While the
figures showed improvements in all categories in Yahoo-Science, five out of the twelve
categories actually showed a drop in Reuters-21578. The results of McNemar’s test indicated
that the improvements made by bigrams were really due to a better algorithm. Nonetheless,
some categories exhibited a very high degree of significance, while a few categories fell below
the significant level.
Even though we were able to show overall improvements using both BEP and F1
measure and McNemar test supported the improvements were significant, the uneven numbers
raised some issues. We will discuss them in some detail.

21
5.2 Low Performance Increases in Some Categories
It is immediately apparent that some categories benefited much more from the addition of
bigrams than others. Why is it, then, that some categories did not do significantly better with
bigrams?
5.2.1 Adequacy of Unigrams
There were cases where unigrams were adequate in describing the concepts in a
category. For illustration, examine Table 5, which shows the top 10 terms in the Computer
Science and Zoology categories.
Table 5. Top 10 terms in Computer Science and Zoology (numbers show infogain)
Computer Science Zoology
1.643893e-02 computer+science 1.596046e-02 artificial+intelligence 1.525400e-02 cs 1.447255e-02 computer 1.327625e-02 acm 1.217493e-02 intelligence 1.196061e-02 artificial 1.076363e-02 neural 9.479605e-03 systems 9.369088e-03 ai
4.979735e-02 dog 4.132053e-02 pet 3.748218e-02 dogs 3.436644e-02 cat 3.189234e-02 breed 3.059738e-02 cats 2.832415e-02 pets 2.695699e-02 animals 2.237056e-02 animal 2.224228e-02 university
We see that single terms could describe the concepts in Zoology adequately. While the
top two terms in Computer Science (“computer+science”, “artificial+intelligence”) could not
have been adequately described by single words, all of the tops ten terms in Zoology were
22
unigrams that described concepts very well in this collection. In fact, unigrams were so strong in
this category that only 5 bigrams made it to the list of 100 top terms (as opposed to the average
of 33.2 for all categories).
Given the strength of the unigrams in such cases, the addition of bigrams did not make
much of a difference for this particular category.
5.2.2 Over-Emphasis of Common Concepts
Some categories in Reuters-21578 showed decreases in the F1 measure when bigrams
were added. The major cause of it was that some bigrams over-emphasized concepts that were
common to documents in both positive and negative categories.
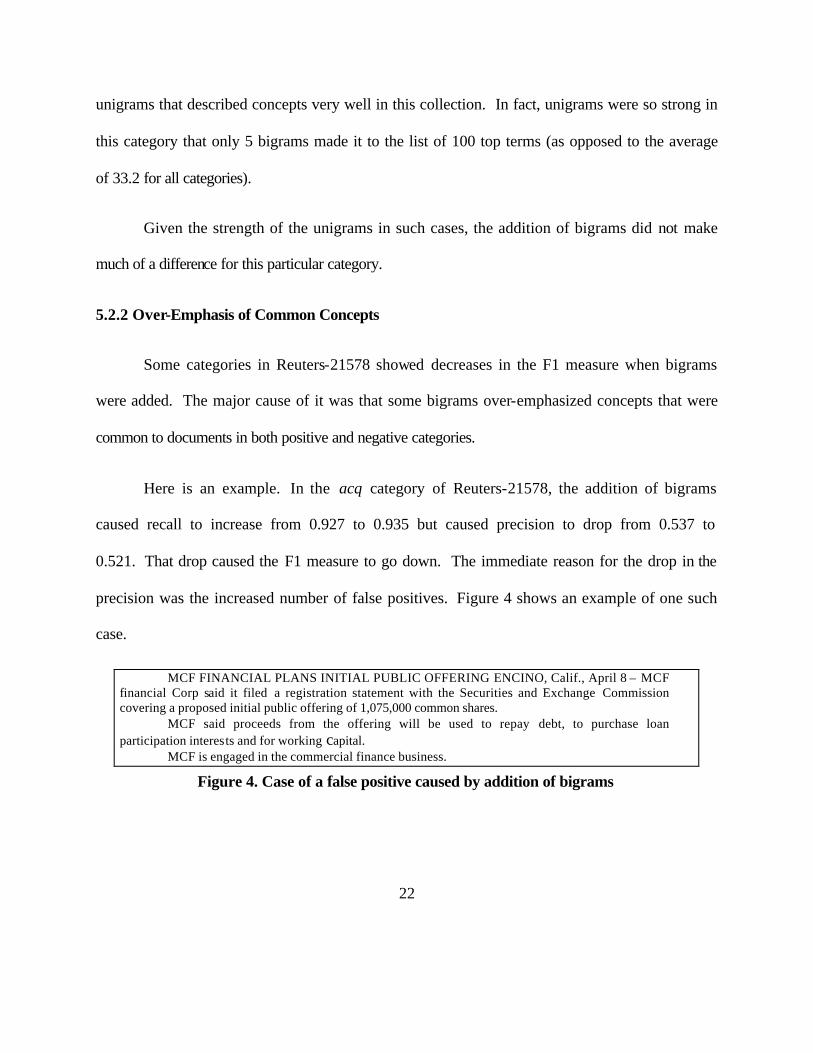
Here is an example. In the acq category of Reuters-21578, the addition of bigrams
caused recall to increase from 0.927 to 0.935 but caused precision to drop from 0.537 to
0.521. That drop caused the F1 measure to go down. The immediate reason for the drop in the
precision was the increased number of false positives. Figure 4 shows an example of one such
case.
MCF FINANCIAL PLANS INITIAL PUBLIC OFFERING ENCINO, Calif., April 8 – MCF financial Corp said it filed a registration statement with the Securities and Exchange Commission covering a proposed initial public offering of 1,075,000 common shares.
MCF said proceeds from the offering will be used to repay debt, to purchase loan participation interests and for working capital.
MCF is engaged in the commercial finance business.
Figure 4. Case of a false positive caused by addition of bigrams

23
Even though this document was originally classified as “NOT acq”, it was changed to
acq, since it contained the bigrams which were more common in the acq category than the "NOT
acq" category, such as “common+shares”, “financial+corp”, and “securities+exchange”. The
false positives occurred because concepts that were common to many documents in both positive
and negative category were over-emphasized.
We discovered that this problem occurred much more often in Reuters-21578. It is not
clear at this time why this was the case. One likely cause could be that Reuters-21578 started at
a much higher recall rate than Yahoo-Science, hence it was more vulnerable to false
positives. We also speculated that one possible cause could be that the documents in Reuters-
21578 referred to fewer concepts on average than Yahoo-Science. On average, there were 1.91
unique unigrams per document in Reuters-21578, while 11.1 unique unigrams per document in
Yahoo-Science. Finally, the problem might be solved if our algorithm could find the right
bigrams to reinforce the negative category. For example, if we had found bigrams such as
"public+offering" and "repay+debt" to reinforce the "Not acq" category, then documents such as
the one in Figure 4 might not be wrongly classified.
5.3 Low Performance Increases in Reuters-21578 Our algorithm was able to increase the categorization performance on Yahoo-Science
significantly, but not as much on Reuters-21578. This seems to be because our algorithm is good
at increasing recall but not as good at increasing precision. Table 6 shows the recall and
precision rates before and after adding bigrams.

24
Table 6. Recall and Precision without and with bigrams
Yahoo-Science Reuters-21578 Corpora Terms Recall Precision Recall Precision
Unigrams only 58.8 % 75.4% 88.6 % 57.9% Unigrams + Bigrams 65.1% 76.7% 90.8% 57.6%
Apparently, our algorithm works by increasing recall more than precision. This is the
way it is expected to work, as the algorithm uses bigrams to reinforce existing unigrams and
most of the bigrams found by our algorithm are from the positive category. Hence, they work
better on the positive documents than the negative ones. In other words, our algorithm is better at
increasing correct positives than at reducing false positives. Hence, it works best in cases where
recall is originally low because, in such cases, our algorithm can increase the performance by
increasing correct positives.
The evidence we found from our experimental results agreed with our hypothesis. Table
7 shows how the documents were reclassified when bigrams were added. Additional correct
positive/negative documents were those correctly classified as positive/negative due to the
addition of bigrams. Additional false positive/negative documents were those wrongly classified
as positive/negative due to the addition of bigrams.

25
Table 7. Increases in correct/false positives/negatives upon adding bigrams
Yahoo-Science Reuters -21578
Correct positives 686 82
Correct negatives 182 156
False positives 237 222
False negatives 52 19
Net increase in correct positives 634 63
Net increase in correct negatives -55 -66
The number of additional positive documents correctly classified (Increase in correct
positives – Increase in false negatives) increased in both Yahoo-Science and Reuters-
21578. But the number of additional negative documents correctly classified (Increase in correct
negatives – Increase in false positives) decreased in both cases. This suggested that the
algorithm was much more successful in increasing correct positives than correct negatives. That
was why it performed much better on Yahoo-Science, where the recall rate was originally low,
than in Reuters-21578, where recall was already very high to start with.
5.4 The Main Strength and Weakness of the Algorithm
As demonstrated in the preceding subsection, the strength of our algorithm is its ability to
increase the number of positive documents classified correctly, but its weakness is that it may
cause more negative documents to be classified incorrectly.
26
The most likely reason is that our algorithm favors finding bigrams from the positive
category. Indeed, we found that of all the bigrams found in our experiments, less than 5% came
from the negative category. This happened because we used the same criteria for finding
bigrams in both categories, but the size of the positive category tended to be much smaller than
that of negative category.
6. Conclusion
In this paper, we proposed an efficient algorithm to enhance the performance of text
categorization using bigrams. The algorithm was tested on two different corpora, yielding
improved performances. However, the algorithm behaved poorly on some categories; we did
some analysis to pinpoint the reason.
We found that the algorithm caused more negative documents to be classified incorrectly.
One way to remedy the problem is to find more bigrams from the negative category by using
different parameters. Another idea is to combine the bigrams we found in other categories and
use them in the negative category. Yet another approach is a two-stage classifier. The first stage
basically consists of the classifier we currently have. If the document is classified as positive in
the first pass, we run it through the second stage. In this stage, we classify the document again
using a different set of classifier weights. The idea behind the second stage is to increase the
precision by filtering out negative documents that are very close to positive documents

27
The corpora we used for the current study might have contributed to the poor
performances in some categories. It would be desirable to run the experiment on the other
standard corpora as well. This is the research direction we will follow in the near future.
Acknowledgement
Part of the research was supported by NSF grant IIS-9908441. Taejon University
supported the third author for his sabbatical year. He is grateful for providing him with
computing facilities to the Department of Computer Science, University of California, Santa
Barbara where this work was performed.
References
Apté, C., Damerau, F., and Weiss, S. (1994). Automated learning of decision rules for text
categorization. ACM Transactions on Information Systems, 12(3), 233-251.
Apté, C., Damerau, F., and Weiss, S. (1998). Text Mining with Decision Trees and Decision
Rules. Presented at the Conference on Automated Learning and Discovery. Pittsburgh, PA.
Billsus, D. and Pazzani, M. (1997). Learning Probabilistic User Models. In Workshop Notes of
“Machine Learning for User Modeling,” Sixth International Conference on User Modeling,
Chia Laguna, Sardinia.
28
Dietterich, T. (1997). Approximate Statistical Tests for Comparing Supervised Classification
Learning Algorithms. Neural Computation, 10(7), 1895-1924.
Fürnkranz (1998). A Study Using n-gram features for Text Categorization. Technical Report
OEFAI-TR-98-30, Austrian Research Institute for Artificial Intelligence, Vienna, Austria.
Lewis, D. (1992a). Representation and Learning in Information Retrieval. Technical Report UM-
CS-1991-093. Department of Computer Science, University of Massachusetts, Amherst, MA.
Lewis, D. (1992b). Feature selection and feature extraction for text categorization. In
Proceedings of a Workshop on Speech and Natural Language, (pp. 212-217). San Mateo, CA:
Morgan Kaufmann.
Lewis, D. (1992c). An evaluation of phrasal and clustered representations on a text
categorization task. In Croft et. al. (Ed.), Proceedings of SIGIR-95, 15th ACM International
Conference on Research and Development in Information Retrieval (pp. 37-50). New York:
ACM Press
Lewis, D. (1992d). Text representation for intelligent text retrieval: A categorization-oriented
view. In Jacobs, P. (Ed.), Text-Based Intelligent Systems, (pp. 179-197). Hillsdale, NJ: Lawrence
Erlbaum.
Lewis, D. and Ringuette, M. (1994). A comparison of two learning algorithms for text
categorization. In Third Annual Symposium on Document Analysis and Information Retrieval,
(pp. 81-93). Las Vegas, NV.

29
Lewis, D. (1998). Naive (bayes) at forty: The independence assumption in information retrieval.
In Proceedings of ECML-98, 10thEuropean Conference on Machine Learning, (pp. 4-15).
Chemnitz, Denmark.
McCallum, A. (1996). Bow: A toolkit for statistical language modeling, text retrieval,
classification and clustering. http://www.cs.cmu.edu/~mccallum/bow.
McCallum, A. and Nigam K. (1998). A Comparison of Event Models for Naive Bayes Text
Categorization. Presented to AAAI-98 Workshop on Learning for Text Categorization.
Mladeni), D. and Grobelnik, M. (1998). Word sequences as features in text learning. In
Proceedings of the 17th Electrotechnical and Computer Science Conference (ERK-98) (pp. 145-
148), Ljubljana, Slovenia.
Salton, G. and McGill, M. (1983). Introduction to Modern Information Retrieval. New York:
McGraw-Hill.
Schapire, R, Singer, Y., and Singhal, A. (1998). Boosting and Rocchio Applied to Text Filtering.
In Croft et. al. (Ed.), Proceedings of SIGIR-98, 21st ACM International Conference on Research
and Development in Information Retrieval (pp. 215-223). New York: ACM Press.
Schütze, H., Hull, D., and Pederson, J. (1995). A Comparison of Classifiers and Document
Representations for the Routing Problem. In Croft et. al. (Ed.), Proceedings of SIGIR-95, 15th
ACM International Conference on Research and Development in Information Retrieval (pp. 229-
237). New York: ACM Press

30
Sebastiani, F. (1999). Machine Learning in Automated Text Categorisation: A Survey. Technical
Report IEI-B4-31-1999, Instituto di Elaborazione dell’Informazione, Consiglio Nazionale delle
Richerche. Pisa, Italy.
Tan, C.-M. (2000). Finding and Using High Quality Word-Pairs for Enhanced Text
Categorization. Unpublished Master’s Thesis. Department of Computer Science, University of
California, Santa Barbara.
Yang, Y. and Pedersen J. (1997). A Comparative Study on Feature Selection in Text
Categorization In Proceedings of ICML-97, 14th International Conference on Machine Learning,
(pp. 412-420). Nashville, TN.
Yang, Y. and Liu, X. (1999). A re-examination of text categorization methods. In Croft et. al.
(Ed.), Proceedings of SIGIR-99, 22nd ACM International Conference on Research and
Development in Information Retrieval (pp. 42-49). New York: ACM Press.