NAVAL POSTGRADUATE SCHOOL - Defense … POSTGRADUATE SCHOOL Monterey, California DTI I LECTrLP....
94
AD-A245 764 NAVAL POSTGRADUATE SCHOOL Monterey, California DTI I LECTrLP. THESIS"""" INVESTIGATION OF DEEP DIELECTRIC CHARGING AND SUBSEQUENT CURRENTS ON GEOSYNCHRONOUS SPACECRAFT by Donald S. Smith Thesis Advisor: R. C. Olsen Approved for public release; distribution is unlimited 92-03292 H i. ) I 1!!I11!i1LI1 lI,!I,,II ,!! :' !,11il il
Transcript of NAVAL POSTGRADUATE SCHOOL - Defense … POSTGRADUATE SCHOOL Monterey, California DTI I LECTrLP....
AD-A245 764
NAVAL POSTGRADUATE SCHOOL
Monterey, California
DTII LECTrLP.
THESIS""""INVESTIGATION OF DEEP DIELECTRIC CHARGING
AND SUBSEQUENT CURRENTSON
GEOSYNCHRONOUS SPACECRAFT
by
Donald S. Smith
Thesis Advisor: R. C. Olsen
Approved for public release; distribution is unlimited
92-03292H i. ) I 1!!I11!i1LI1 lI,!I,,II ,!! :' !,11il il
UNCLASSIFIESf CURITY CLASSIFICATION OF THIS PAGE
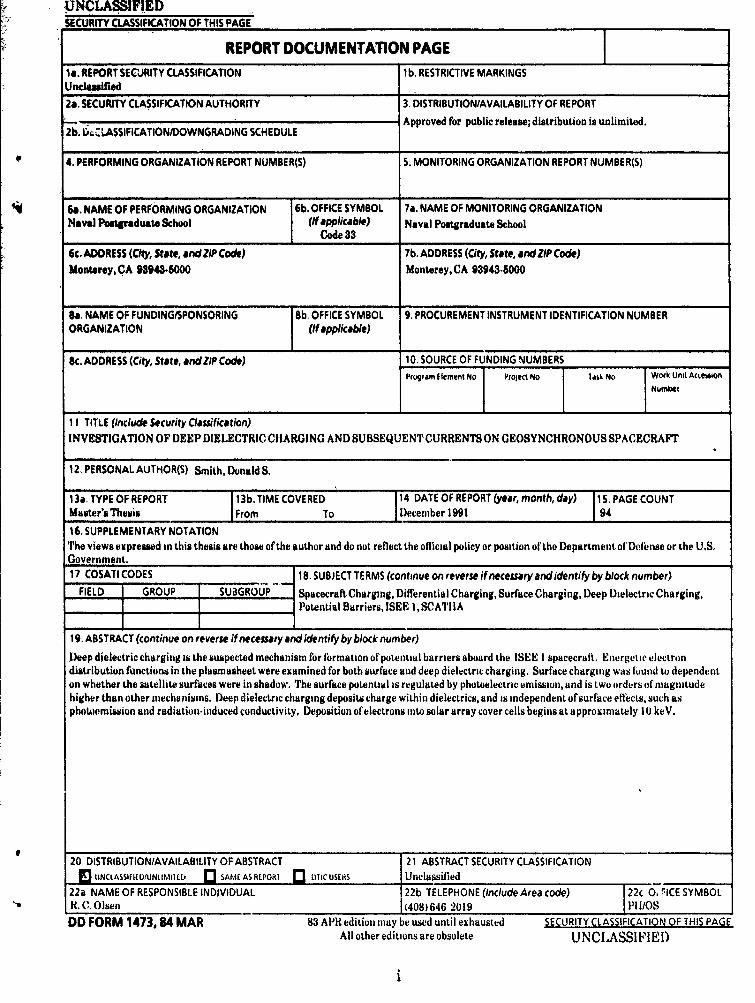
REPORT DOCUMENTATION PAGEis, REPORT SECURITY CLASSIFICATION Ilb, RESTRICTIVE MARKINGSUnclwifuled _____________________
2a, SECURITY CLASSIFICATION AUTHORITY 3. DISTRIBUTIONIAVAILABILITY OF REPORTApproved for public release; distribution is unlimited.
2b. DrCLASSIFICATIONIDOWNGRADING SCHEDULE
4. PERFORMING ORGANIZATION REPORT NUMBER(S) 5. MONITORING ORGANIZATION REPORT NUMBER(S)
6a. NAME OF PERFORMING ORGANIZATION 6b. OFFICE SYMBOL 7a. NAME OF MONITORING ORGANIZATIONNaval Postgraduate. School O (f applicable) Naval Postgraduate School
_______________________________ Code 33 _________________________
6c. ADDRESS (City, State, and ZIP Code) 7b. ADDRESS (City, State, and ZIP Code)Monterey, CA 93943-5M0 Monterey, CA 93943-5000
Ba. NAME OF FUNDING/SPONSORING 8b. OFFICE SYMBOL 9. PROCUREMENT INSTRUMENT IDENTIFICATION NUMBERORGANIZATION (Ifapplicable)
Sc. ADDRESS (City, State, and ZIP Code) 10. SOURCE OF FUNDING NUMBERSProgram Eleent No Project No lasi, No Work Unit Acifewon
I I Number
I I TITLE (include Security Classification)INVESTIGATION OF DEEP DIELECTRIC CHARGING AND SUBSEQUENT CURRENTS ON GEOSYNCHRONOUS SPACECRAFT
12. PERSONAL AUTHOR(S) Smith, Donald S,
1 3a. TYPE OF REPORT 13b. TIME COVERED 14 DATE OF REPORT (year, month, day) jIS. PAGE COUNTMaster's Thesis I From To December 1991 19
16, SUPPLEMENTARY NOTATIONThe views expressed in this thesis are those of the author and do not reflect the official policy or position of the Department of Defe~nse or the U.S.Government.17 COSATI CODES 18. SUBJECT TERMS (continue on reverse if necessary and identify by block number)
FIELD I GROUP I SUaGRUP ISpacecraft Charging, Differential Charging, Surface Charging, Deep Dielectric Charging,Potential Barriers, ISEE 1, SCATIIA
19, ABSTRACT (continue on reverse if necessary and identify by block number)Deep dielectric charging is the suspected mechanism for formation of poteittial barriers aboard the ISEE I spacecraft. EnergetiL' electrondistribution functions in the plasmasheet were examined for both surface aid deep dielectric charging. Surface charging was found to dependenton whether the satellite surfaces were in shadow, The surface potential is regulated by photoelectric emission, and is two orders of magnitudehigher than other mechanisms. Deep dielectric charging deposits charge within dielectrics, and is independent of surface eff'ects, stich asphotoemission and radiation-induced conductivity, Deposition of electrons into solar array cover cells begins at approximately 10 keV.
20 DISTRIBUTION/AVAILABILITY OF ABSTRACT 21 ABSTRACT SECURITY CLASSIFICATIONIsUNCLASSIFIEDUNUM0111t, 3SAME AS REPOR) [3 ICUSERS Unclassified
22a NAME OF RESPONSIBLE INDIVIDUAL 22b TELEPHONE (include Area code) 22 c 0. rICE SYMBOLR. C. Olsen (408)646 2019 1 Pl-1/OSDD FORM 1473.84 MAR 83 APR edition may be used until exhausted SECUIT CLSIIATION OF THIS PAGE
All other editions are obsolete U NCLASSI FIED)
i

Approved for ptblic release; distribution is unlimited.
Investigation of Deep Dielectric Chargingand Subsequent Currents
onGeosynchronous Spacecraft
by
Donald S. SmithCaptain, United States Marine Corps
B.S., University of Utah, 1983
Submitted in partial fulfillment
of the requirements for the degree of
MASTER OF SCIENCE IN PHYSICS
from the
NAVAL POSTGI-Af0ATE SCHOOLEC R 991
Author: ,._ _ __._,Donald S. Smith
Approved by: ! / (,-/ _ s.-, -----R. C.. pisen, Thesis Advisor
1/1
X. "ar ya a ond Reader
K. E. Woehler, ChairmanDepartment of Physics
ii
ABSTRACT
Deep dielectric charging is the suspected mechanism for
formation of potential barriers aboard the ISEE 1
spacecraft. Energetic electron distribution functions in
the plasmasheet were examined for both surface and deep
dielectric charging. Surface charging was found to be
dependent on whether the satellite surfaces were in shadow.
The surface potential is regulated by photoelectric
emission, and is two orders of magnitude higher than other
mechanisms. Deep dielectric charging deposits charge within
dielectrics, and is independent of surface effects, such as
photoemission and radiation-induced conductivity.
Deposition of electrons into solar array cover cells begins
at approximately 10 keV.
A9068210b Par~AKTIS QGA&I
ID1O TAB0
Availability CodgajAva l odr
Dist1 Spee- il
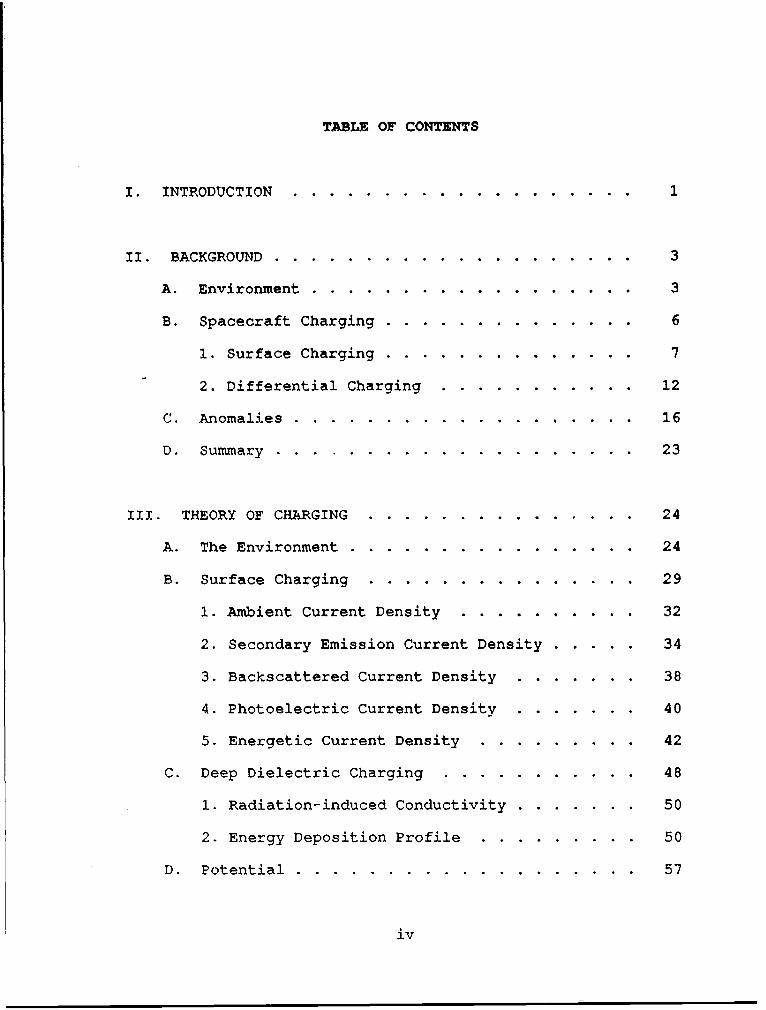
TABLE OF CONTENTS
I. INTRODUCTION . . . . . . . . . . . . . . . . . . 1
II. BACKGROUND ........... .................... 3
A. Environment ......... .................. 3
B. Spacecraft Charging ....... .............. 6
1. Surface Charging ....... .............. 7
2. Differential Charging ... ........... 12
C. Anomalies ....... .................. 16
D. Summary ........ .................... 23
Ill. THEORY OF CHARGING ..... ............... 24
A. The Environment ..... ................ 24
B. Surface Charging ..... ............... 29
1. Ambient Current Density ... ........ 32
2. Secondary Emission Current Density ..... .. 34
3. Backscattered Current Density ....... . 38
4. Photoelectric Current Density ....... . 40
5. Energetic Current Density .. ......... 42
C. Deep Dielectric Charging ... ........... 48
1. Radiation-induced Conductivity ........ . 50
2. Energy Deposition Profile .. ......... 50
D. Potential ....... ................... 57
iv
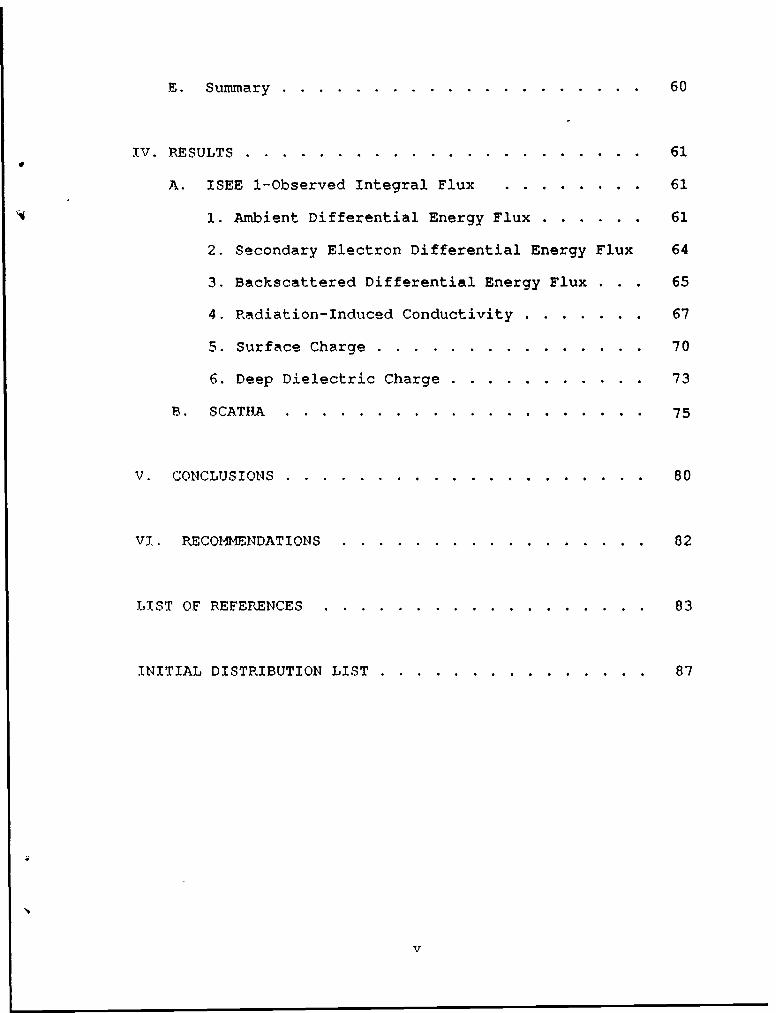
E. Summary . . . . . . . . . . . . . . . . . . . . 60
IV. RESULTS . . . . . . . . . . . . . . . . . . . . . . 61
A. ISEE 1-Observed Integral Flux . ........ 61
1. Ambient Differential Energy Flux ...... . 61
2. Secondary Electron Differential Energy Flux 64
3. Backscattered Differential Energy Flux . . . 65
4. Radiation-Induced Conductivity ........ . 67
5. Surface Charge ..... ............... 70
6. Deep Dielectric Charge ... ........... . 73
B. SCATHA ........ .................... 75
V. CONCLUSIONS ........ ................... 80
VI. RECOMMENDATIONS ........ ................. 82
LIST OF REFERENCES ....... .................. 83
INITIAL DISTRIBUTION LIST ..... ............... 87
v

ACKNOWLEDGMENTS
I am indebted to Professor Olsen for his help in the
development of this thesis, particularly for his
encouragement, insight, and patience in answering many
questions. I also would like to thank Professor Maruyama
who was instrumental in explaining the concept of radiation-
induced conductivity.
A special note of thanks to my family who endured late
hours, no Dad, and relentless requests for quiet.
vi

I. INTRODUCTION
This thesis will examine spacecraft charging and, in
particular, deep dielectric charging. Spacecraft charging
is an important consideration in operating satellites in a
plasma environment. A build-up of charge on the surface and
within dielectric materials is identified with abnormal
system behavior. 'These anomalies have been linked with
unexpected system xasets, false signals, and even total
satellite failure.
Theoretical calculations of energetic electron fluxes
will be compared to observed in-situ data, to determine if
charged particles present ha--e sufficient energy to cause
deep dielectric charging. The particle energy level for
which differential charging begins will also be
investigated.
In subsequent chapters, the structure and
characteristics of the magnetosphere will be explored.
Several different electron distribution functions are used
to describe the ambient plasma and how it effects surface
and deep dielectric charging of satellites. Radiation-
induced conductivity can alter the characteristics of
exposed dielectrics, which in turn, can effect the re-
distribution of deposited charge. Contributions to the
charging process by different mechanisms vary by several
orders of magnitude. Comparisons will show which are
important, and those that can be ignored. Finally, a
correlation will be made between the calculated integral
flux and data from geosynchronous satellite charging events.
2

II. BACKGROUND
A. Znvironment
The earth is subject to a magnetized flow of plasma
called the Folar wind (Figure 1). Interruption of the solar
wind flow around the earth, by the earth's magnetic field
forms a structure called the magnetosphere. Within the
magnetosphere are several components which comprise its
Figure 1
(Ref 1 ]
infrastructure. The magnetopause separates the earth's
magnetic field from the solar wind. Inside the
3
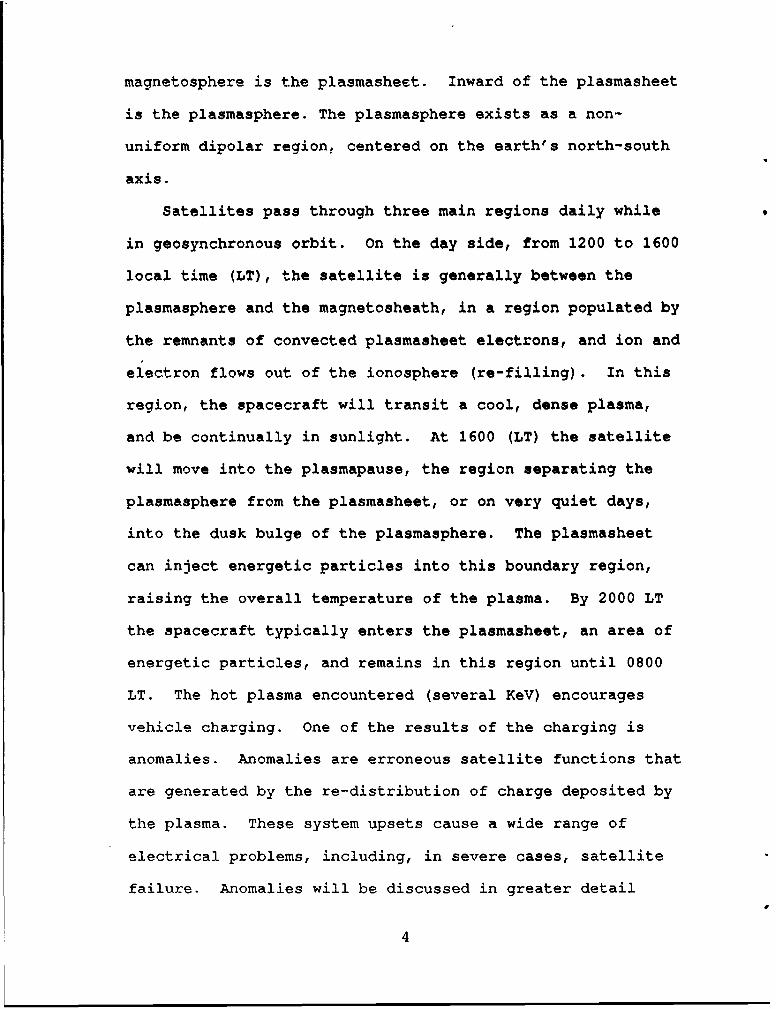
magnetosphere is the plasmasheet. Inward of the plasmasheet
is the plasmasphere. The plasmasphere exists as a non-
uniform dipolar region, centered on the earth's north-south
axis.
Satellites pass through three main regions daily while
in geosynchronous orbit. On the day side, from 1200 to 1600
local time (LT), the satellite is generally between the
plasmasphere and the magnetosheath, in a region populated by
the remnants of convected plasmasheet electrons, and ion and
electron flows out of the ionosphere (re-filling). In this
region, the spacecraft will transit a cool, dense plasma,
and be continually in sunlight. At 1600 (LT) the satellite
will move into the plasmapause, the region separating the
plasmasphere from the plasmasheet, or on very quiet days,
into the dusk bulge of the plasmasphere. The plasmasheet
can inject energetic particles into this boundary region,
raising the overall temperature of the plasma. By 2000 LT
the spacecraft typically enters the plasmasheet, an area of
energetic particles, and remains in this region until 0800
LT. The hot plasma encountered (several KeV) encourages
vehicle charging. One of the results of the charging is
anomalies. Anomalies are erroneous satellite functions that
are generated by the re-distribution of charge deposited by
the plasma. These system upsets cause a wide range of
electrical problems, including, in severe cases, satellite
failure. Anomalies will be discussed in greater detail
4
later in this section. By 0800 LT, the electron temperature
has dropped, as the plasmasheet electrons drift sunward.
The probability of satellite charging drops rapidly as the
satellite moves into the day side. Table 1 summarizes the
composition and characteristics of the magnetospheric
TABLE 1
Region Lm L., *-/cm 3 Energies(*V)
Plasmasphere .2 4 10-103 .1 - 1.0
Plasmasheet 8 30 .1-10 103 - 4xl0 4
plasma [Ref 1, p. 2-14 to 2-35, Ref 2, p. 3681 to 3691, Ref
3, p. 7 to 11, p. 81 to 85).
The magnetosphere is populated with charged particles
via diffusion/acceleration from the ionosphere and perhaps
the solar wind. At quiet times, the outer plasmasphere can
move out to include geosynchronous orbit [Ref 4, p. 3587 to
3611]. During magnetic substorms, injections of 10 KeV to
several MeV electrons from the plasmasheet are observed at
geosynchronous altitude. It is thought the infusion of
these energetic electrons is responsible for spacecraft
charging [Ref 5, p. 278 to 308, Ref 6, p. 4-1 to 4-16].
5
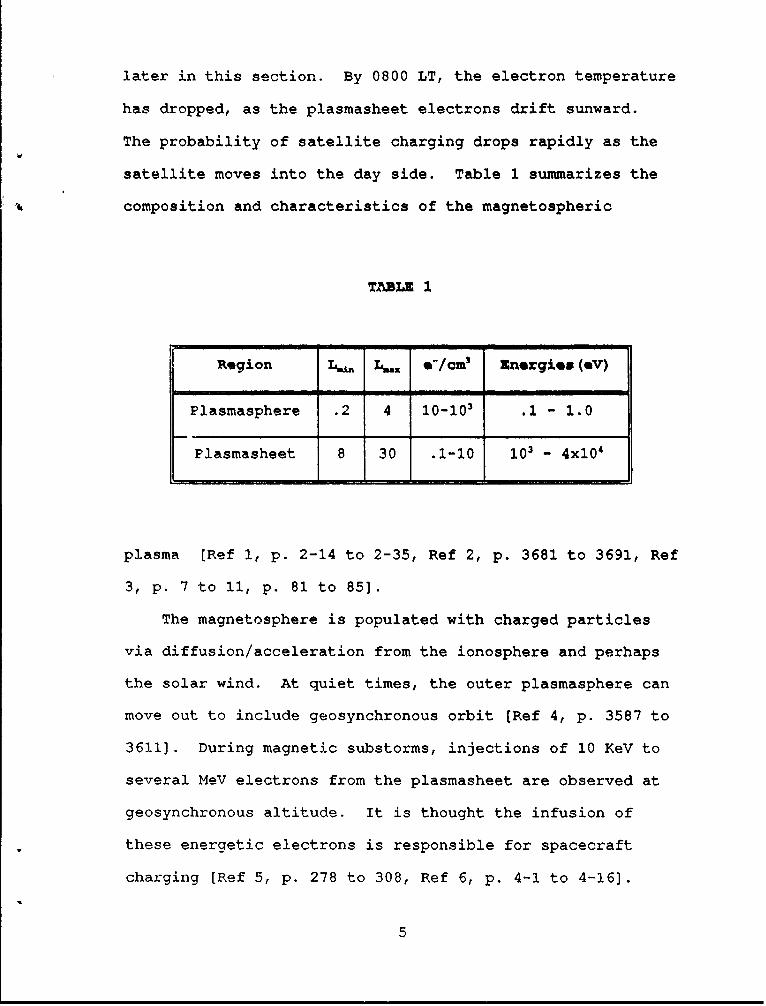
Figure 2 summarizes the movement of the regions at
geosynchronous altitude.
Down
Soler wind ,..s"n rit.... ..eoo nhonou.
.o, lom A M
Noon MidnIght
% P ~ ......... ,......
Ousk
Figure 2
P. Spacecraft Charging
Spacecraft charging is a phenomena obserled when a
spacecraft interacts with any plasma. The result of this
interaction is an accumulation of charge within the body of
the satellite as well as a buildup on the surface. The
accumulation of charge on a spacecraft appears in two
distinct ways. Absolute charging is where the potential of
the entire spacecraft changes with respect to the ambient
plasma. The uniform change in potential, with respect to
the plasma will not, in general, effect the onboard
6
electronic systems. Differential charging is where
dielectric surfaces of the spacecraft are charged to
different potentials relative to each other. A significant
result of differential charging is strong local electric
fields on the surface and within the body of the satellite.
These electric fields give rise to the possibility of
damaging electrical discharges [Ref 1, p. 2-1 to 2-3].
1. Surface Charging
Surface charging is the buildup of charge on the
surface of a satellite from its interaction with the plasma
environment. The phenomena of large negative potentials was
first recognized in the early 1970's from data taken by the
Applied Technology Satellite (ATS) 5 [Ref 7, p. 561 to 569].
Surface charging at geosynchronous orbit typically reaches
several hundred volts negative in sunlight, and to more than
-10 volts in eclipse. The potentials vary with the
environment, on very short time scales (T < 1 second) in
eclipse, longer in sunlight (Ref 8, p. 5657 to 5667, Ref 9,
p. 263 to 276].
There have been historically many instances of
satellite charging. Deforest showed a correspondence
between injections of energetic plasma from magnetic
substorms and large negative potentials on Applied
Technology Satellite (ATS) 5 when tne spacecraft was in
eclipse (Ref 7, p. 651 to 659, Ref 4, p. 3587 to 3611]. ATS
7
5 was found to charge to potentials of -5 to -10 kV in
eclipse, and later, ATS 6 was found to charge to similar
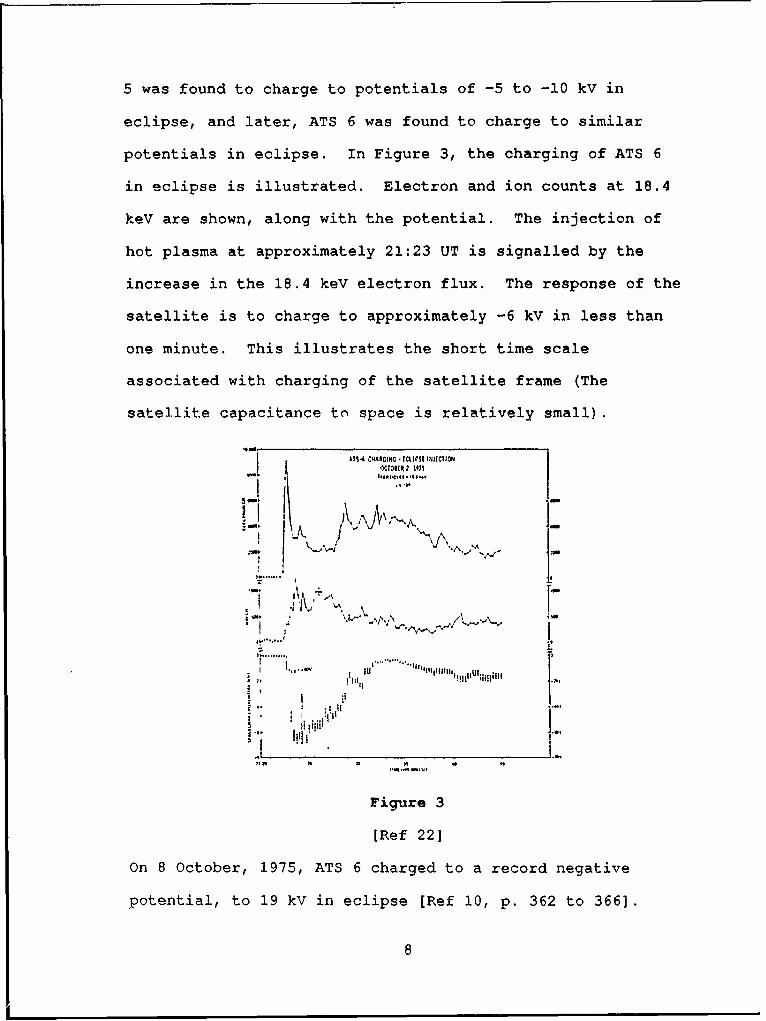
potentials in eclipse. In Figure 3, the charging of ATS 6
in eclipse is illustrated. Electron and ion counts at 18.4
keV are shown, along with the potential. The injection of
hot plasma at approximately 21:23 UT is signalled by the
increase in the 18.4 key electron flux. The response of the
satellite is to charge to approximately -6 kV in less than
one minute. This illustrates the short time scale
associated with charging of the satellite frame (The
satellite capacitance to space is relatively small).
IIICII ,,i Z e
........... .,..
. . . . . . . . . . ................ A
'I "
.Figure 3
. . . . . . . . . .....L . ........ [• ,(llI~ lll II
UI II
tll I
4.I |II 'I
, I 4 I . .
Figure 3
[Ref 22]
On 8 October, 1975, ATS 6 charged to a record negative
potential, to 19 kV in eclipse [Ref 10, p. 362 to 3661.
8
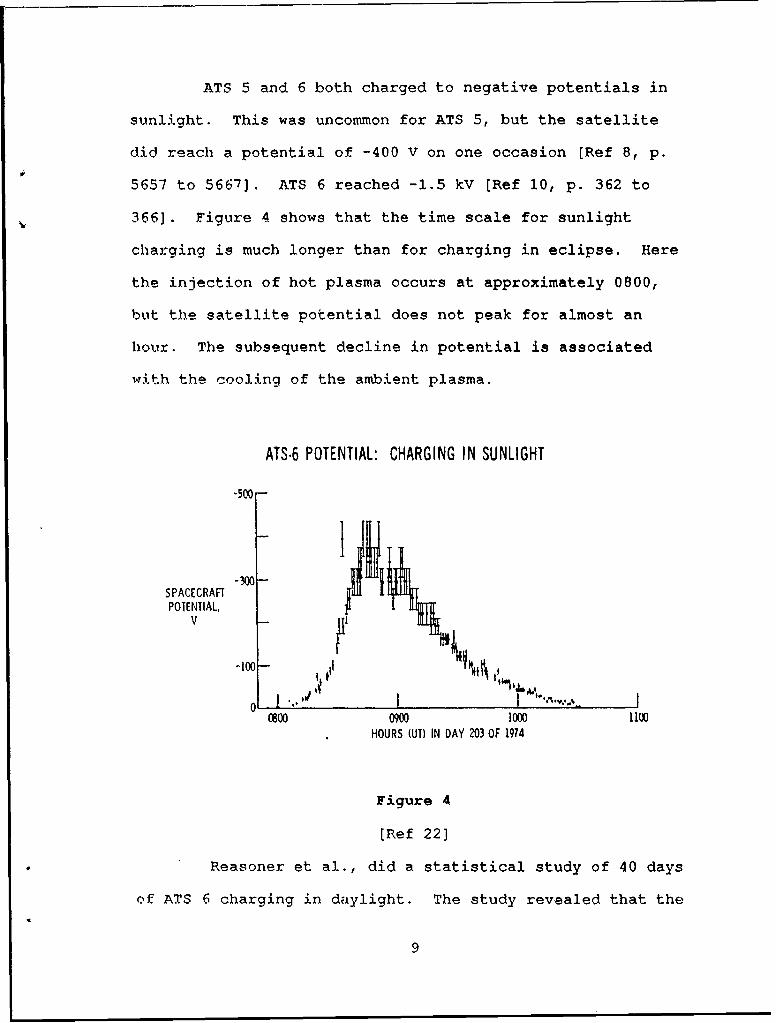
ATS 5 and 6 both charged to negative potentials in
sunlight. This was uncommon for ATS 5, but the satellite
did reach a potential of -400 V on one occasion [Ref 8, p.
5657 to 5667]. ATS 6 reached -1.5 kV [Ref 10, p. 362 to
366]. Figure 4 shows that the time scale for sunlight
charging is much longer than for charging in eclipse. Here
the injection of hot plasma occurs at approximately 0800,
but the satellite potential does not peak for almost an
hour. The subsequent decline in potential is associated
with the cooling of the ambient plasma.
ATS.6 POTENTIAL: CHARGING IN SUNLIGHT
.500
SPACECRAFTPOTENTIAL,
V
0 . I I000090100 000
HOURS (UT) IN DAY 203 OF 1914
Figure 4
[Ref 22]
Reasoner et al., did a statistical study of 40 days
of ATS 6 charging in daylight. The study revealed that the
9
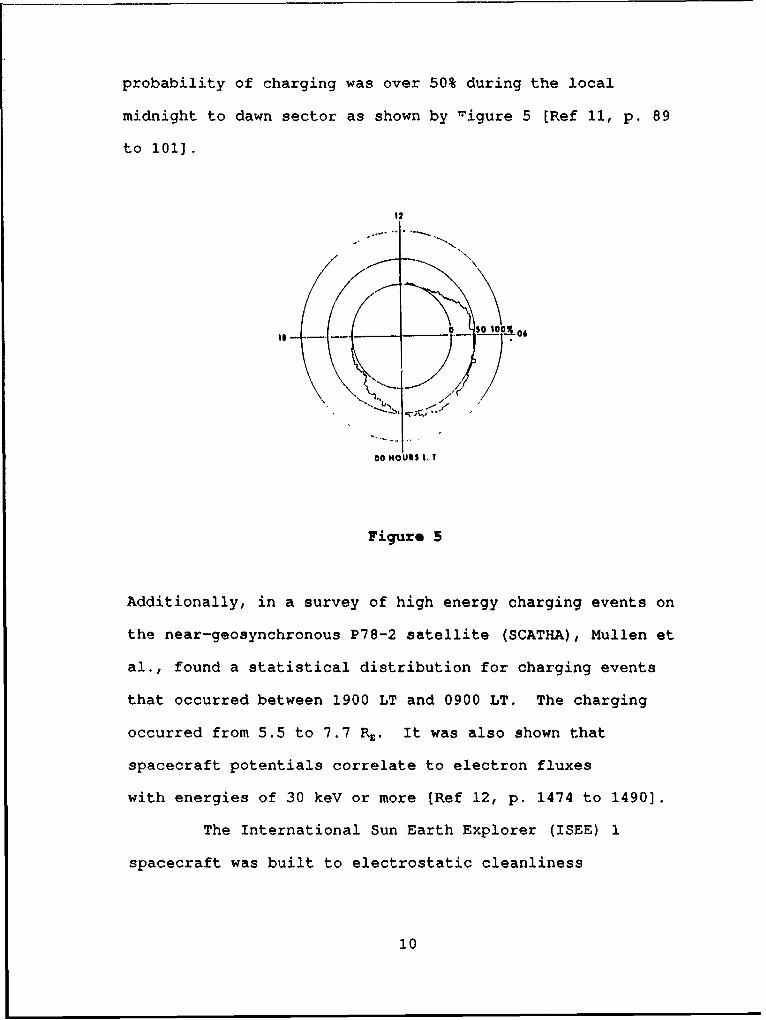
probability of charging was over 50% during the local
midnight to dawn sector as shown by migure 5 [Ref 11, p. 89
to 101].
1-2
00 HOUR$ t' I
Figure 5
Additionally, in a survey of high energy charging events on
the near-geosynchronous P78-2 satellite (SCATHA), Mullen et
al., found a statistical distribution for charging events
that occurred between 1900 LT and 0900 LT. The charging
occurred from 5.5 to 7.7 Rz. It was also shown that
spacecraft potentials correlate to electron fluxes
with energies of 30 keY or more (Ref 12, p. 1474 to 1490].
The International Sun Earth Explorer (ISEE) 1
spacecraft was built to electrostatic cleanliness
10
specifications which it was thought would prevent daylight
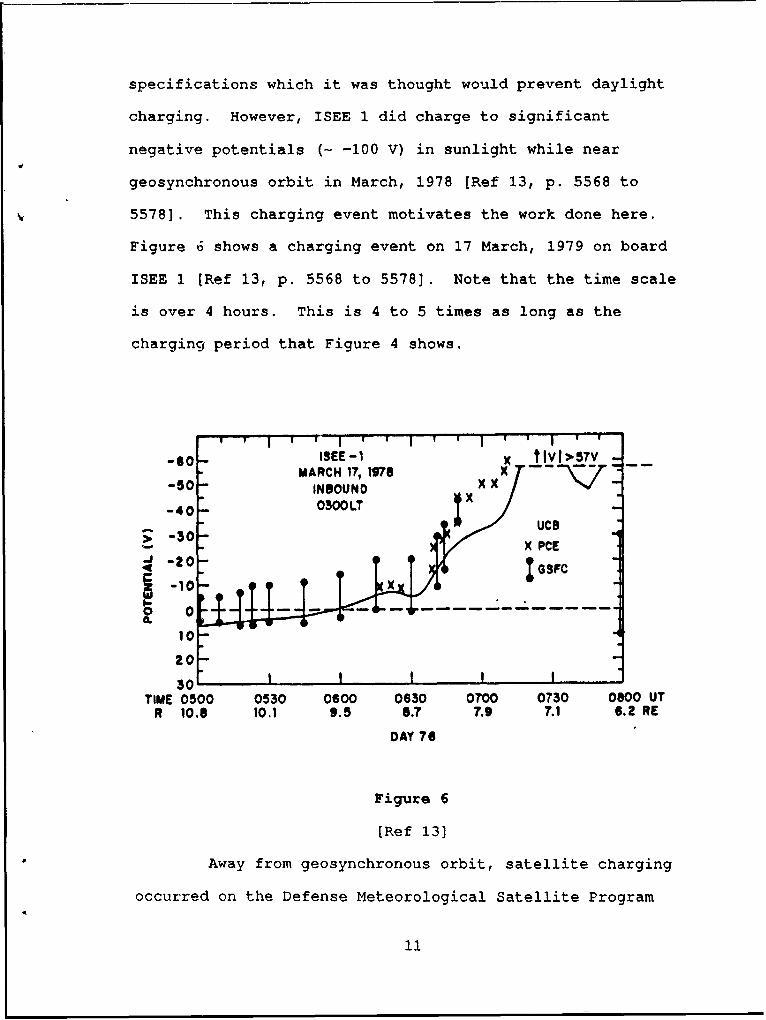
charging. However, ISEE 1 did charge to significant
negative potentials (- -100 V) in sunlight while near
geosynchronous orbit in March, 1978 [Ref 13, p. 5568 to
5578]. This charging event motivates the work done here.
Figure 6 shows a charging event on 17 March, 1979 on board
ISEE 1 [Ref 13, p. 5568 to 5578]. Note that the time scale
is over 4 hours. This is 4 to 5 times as long as the
charging period that Figure 4 shows.
1 I ' ' I ' ! ' I ' '
-so ISEE-1 X tlVI> 57 -MARCH 17, 1978T -
-50- INBOUND X X
-40 - 030 LT x
>-3 X PCE
10 ., xGSFC
0
10-
20
TIME 0500 0530 0600 0630 0700 0730 000 UTR 10.8 10.1 9.5 8.7 7.9 7.1 6.2 RE
DAY 76
Figure 6
[Ref 13]
Away from geosynchronous orbit, satellite charging
occurred on the Defense Meteorological Satellite Program
11
(DMSP) satellite while flying through auroral regions.
Negative potentials from 50 V to 1.5 kV were observed while
the satellite crossed high magnetic latitudes in low earth
orbit (LEO) [Ref 14, manuscript].
2. Differential Charging
Differential Charging is the charging of a piece of
a spacecraft relative to an adjacent section. Differential
charging occurs, in general, because of variations in
materials, shadowing of surfaces, and the deposition of
charge into dielectrics. There are a variety of materials
used for satellite surfaces, many of which are non-
conductors (dielectrics), such as kapton, teflon, and glass.
Photons from the sun incident on a spacecraft cause
electrons to be emitted from the surface, provided the
energy of each photon is greater than the work function of
the material. Because of this shadowing is important. The
nature of such shadowing depends on satellite geometry and
stabilization technique. The most popular techniques are
three-axis and spin stabilization. In the latter case, the
orientation of the spin axis relative to the sun-satellite
line is important.
12
As previously mentioned, surface charging in eclipse
can reach kilovolt potentials, while the satellite potential
in sunlight is generally not as large (Ref 8, p. 5657 to
5667]. Shadowed dielectrics will behave as though they are
in eclipse, and charge to much larger negative potentials
than the satellite frame or illuminated dielectrics. A
potential gradient of kV/cm across dielectrics can lead to
arcs and electrical discharges if the accompanying electric
fields exceed the dielectric breakdown strength [Ref 5, p.
277 to 308].
The effects of differential charging have been
observed. ATS 6 data revealed evidence of differential
charging. Figure 7 shows an electron distribution observed
by ATS 6. [Ref 15, p. 715 to 719]. This figure shows that
electrons with energy below 50 eV must have been generated
on or near the satellite surface. Hence, the photoelectrons
and secondary electrons generated on the satellite surface
were being reflected by some form of barrier, and were
unable to escape the vehicle. Otherwise, astronomical
values for the plasma density result. Olsen et al.,
13
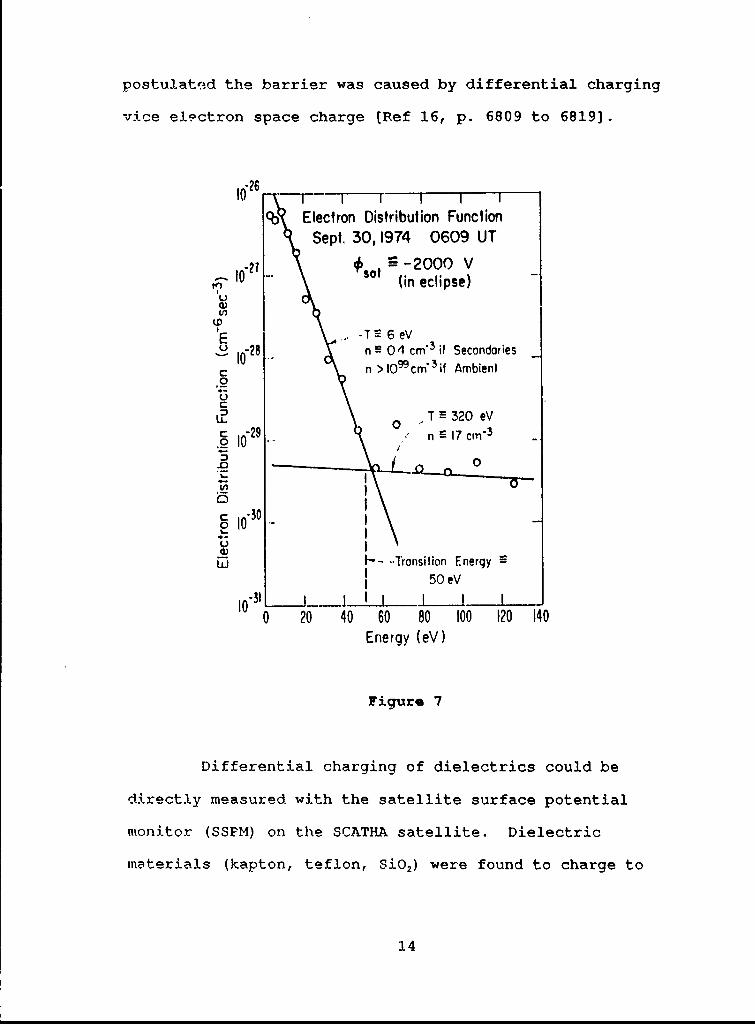
postuiatrid the barrier was caused by differential charging
vice electron space charge [Ref 16, p. 6809 to 6819].
26 1_______ 1______1__
RElectron Distribution FunctionSept. 30,1974 0609 UT
-21 - 2000 V10Sl (in eclipse)-
E -T56eV- ! 128 n E 0 4 cm'3 if SecondariesC n >'I O mif Ambient
C
LE 0 T LO 320 eVCg1 n 7 cm'3.0
~I0
0
uL 1- Transition Energy5
50 eVJ0L31 1L1L
00 20 40 60 80 100 120 140Energy (e)
Figure 7
Differential charging of dielectrics could be
.irectly measured with the satellite surface potential
mionitor (SSPM) on the SCATHA satellite. Dielectric
ma~terials (kapton, teflon, 3i02) were found to charge to
14

negative kilovolt potentials when shadowed as shown in
Figure 8.
SSPMSUPriI 74. 1919
1600
140 -
MO - 31 6700
RD. 600Bon 1 31 5000
400 I5600 >
31111 5400
34011 5700
3700 5111111
KIL-11117800
740
7400
0651 00 0657(10 065300 U170 40 70 40
Figure 8
[Ref 18]
This differential charging occurred with a time
constant of tens of seconds, as appropriate to the
capacitance associated with the thin dielectrics. This is
in contrast to the more rapid charging of the satellite as a
whole (T < 1 second), which has a relatively lower
capacitance to space (Ref 18, p. 506 to 509]. The
differential charging is also responsible for the charging
of the vehicle as a whole (Ref 17, p. 14-1 to 14-12].
Modelling of daylight charging showed that the barrier
15
induced by differential charging allowed a net negative
current to the sunlit surfaces.
C. Anomalies
The magnetosphere is often an unfriendly environment in
which satellites must survive and operate. Spacecraft are
subjected to high energy particle fluxes, and discharges
resulting from surface and differential charging can produce
electromagnetic pulses (EMP). These EMP can enter into the
internal circuitry through unshielded cables, ungrounded
components, and any external conduit that will t-ansport the
Fourier spectra of the EMP. Additionally, very high energy
particles can cause single event upsets (SEU) [Ref 1, p. 4-
22 to 4-23].
Satellite anomalies were attributed to charging
following the realization in the mid-1970's that large
negative potentials could be found on satellites positioned
at 6.6 earth radii. Figure 9 shows a distribution of
anomalies as a function of time of day for several
geostationary spacecraft. This historical figure was
promptly related to the charging distribution obtained from
ATS 6 (see Figure 5) and a correspondence was suggested [Ref
11, p. 39 to 101].
A variety of anomalies for several different satellites
are tabulated in Reference 1. They include power-on resets,
16

EMP, spin-up, false flags in software, clock shifts, false
or phantom commands, telemetry errors, power-downs,
circuit noise, power system shutdowns, system upsets, and
total satellite failures. The figure is a distribution of
anomalies observed on several geosynchronous satellites.
The times are local and the distance from the origin is
solely to allow visual resolution of the events [Ref 1, p.
5-2 to 5-11].
ofa
*'/ \
Figure 9
[Ref 11]
Although there are many examples of anomalies in
geosynchronous satellites, most are difficult to relate
unambiguously to satellite charging as a cause. The most
revealing case was with the SCATHA satellite on 22
September, 1982, when differential charging, EMPs, and
17

anomalies were found together as shown in Figure 10 [Ref 19,
p. 239 to 243].
AAPA.8) 0
1.0
2 4 6b) VES SAL TId, Iv
a) The abeolute veave of the voltSe on the Satllile SurftcePotential Monltor gold ample a a fuaintom of Ume. The poteitil ofthe ample Is neptive witl repect to the ground refermee; b) thecomet rote for 11.4 kev dectroa m a fountiog of dne.
I I I l l
M I -Cj---ES
E O0 '- '- -" -' -' /EXPECTEDM1A
001:40 036.20WVEISAL TIME. Iv.iamc
Mie thimin -mm ie maemo eswkt thu VLF Ainldyaexpe erid g we ti pichi wha amaliom bAsi'soed onimSeplunber 22, l9SL
Figure 10
During a period of energetic rlectron flux and high
surface potentials, the timing sequence of a switch in an
18
experimental package showed anomalous behavior. The arrows
at the bottom of the figure show a flip in logic states
coinciding with discharge events.
An example from a completely different environment, the
Jovian magnetosphere, provides an unusually clear
demonstration of the relationship between anomalies and an
environmental cause. A sequence of anomalies occurred when
Voyager I passed Jupiter on 5 March, 1979, as seen in Figure
11.
3, -
POR 11
II1? -9- /'/ - 'qIOMVI
3-/
1 4 0 It It U 14 * 16 I P1 02 1
Oi ) 6 | I | 1 11EIAPSID 4hr|
Juslbr "al.a
Figure 11
(Ref 20]
Prior to and during the fly-by at 5 Rj, a series of
powear-on resets (POR) plagued a critical photographic
sequence. Figure 11 shows resets and the energetic electron
flux. There is a clear correspondence [Ref 20, p. 21 to
30].
19
Laboratory simulation of the POR process identified
unterminated spare leads in a cable bundle in which the POR
cable co-existed. A portion of this cable exited the
spacecraft body and was exposed to the plasma environment.
Re-creation of the observed environment produced 25 mA
current pulses capable of inducing the POR. Surface
charging in a cold dense plasma was ruled out and a
correspondence was established between the POR and the 10
MeV e- flux component measured by on-board instruments [Ref
20, p. 21 to 30].
This example shows the importance of energetic
electrons, the universality of spacecraft charging, and
anomalies. It is also one of the prime examples of deep
dielectric charging, which is the deposition of charge into
dielectrics (like cable insulation) where the charge is
trapped, accumulates, and ultimately is released as an EMP.
Deep dielectric charging is the primary focus of this
thesis.
Reagan et al., were among the first to discuss deep
dielectric charging (Figure 12). They presented SCATHA data
for days with large fluxes of high energy electrons (several
MeV) and found a correspondence to charging. Energetic
electrons incident on satellite surfaces can bury themselves
either into dielectric materials or into floating metal
(conductors not connected to the spacecraft ground). As
charge builds up within the satellite body, it may exceed
20
the breakdown strength of the material and arc. The
associated EMP may be sufficiently large to induce anomalous
behavior in one or more of the satellite electronic
components.
ELECTRON FLUX........................2 .......... ..... .iii: ....
SPACECFIAFT
SPACECRAFTCIRCUITFLOATING METAL -
BULK
CHARIGE TRAPPEDON ISOLATEDCONDUCTOR
C IIAnGE iRAPPED IN BULKDIELECTRIC
Figure 12
[Ref 1]
The deposition and buildup of charge in the dielectric
were modelled and found in agreement with in situ
measurements. Although peak electric field strength was
21
below material breakdown levels, rapid changes in these
fields resulted in large EMP [Ref 21, p. 354 to 365].
Baker et al., have also looked at the consequences of
high energy electron fluxes. Figure 13 shows a connection
between high energy electrons at geosynchronous orbit
(measured on 1982-019) and failure of a' Geosynchronous Orbit
Earth Satellite (GOES) 5 encoder lamp.
S/C 1982-019 (-700W)GEOSTATIONARY ORBIT
lot -GOES-5
FAILURE
W-
o0 i
100135 M.VW
-~ACKROUND.LEVELS
JUL 13 14 1s 16 17 18 19 20 21 22 23 24 25 26
Figure 13
[Ref 6]
Another clear indication of the high energy electron
flux-anomaly cause and effect relationship is shown in
Figure 14. Over a period of two years, spacecraft 1979-053
22

experienced multiple malfunctions in its star tracker
system, as indicated by arrows above 3 MeV fluxes. Notably,
anomalies occurred only when the electron flux exceeded
approximately 6 count rate units. After several days of
erratic upsets, the anomalous behavior disappeared (Ref 6,
p. 4-1 to 4-16).
S-logo less. ot-
3 MOV WN INACKIN
i"" I
DAYS FROM t JAN. 1979
Figuro 14
[Ref 6]
D. Summary
Surface and differential charging are common occurrences
on geosynchronous satellites. Deep dielectric charging can
also occur in the presence of high energy electron fluxes.
These mechanisms are important aspects of spacecraft
operation and survivability. This thesis will build on the
work done in previous examinations of spacecraft charging
and extend it.
23

III. THEORY OF CHARGING
A. The Environment
Charging is the buildup of charge on the surface and
within the body of a spacecraft immersed in a plasma. The
plasma environment considered here is the magnetosphere,
particularly at geosynchronous orbit. The plasma at
7eosynchronous orbit has it's origins in the solar wind and
the earth's ionosphere. These sources of electrons and ions
continually introduce energetic particles into the earth's
geosynchronous altitude region where stationary satellites
orbit. The energies of the particles vary from fractions of
an eV to MeV. Magnetospheric storms and sub-storms inject
high energy particles into this region. This is especially
common from 2000 LT to 0900 LT, when geosynchronous
spacecraft transit the plasmasheet.
The distribution function, or phase space density,
characterizes a plasma. Equation (1) shows a Maxwellian
distribution, as a function of the velocity of the
particles. Such distributions are often used to describe
the plasma observed at geosynchronous orbit.
24
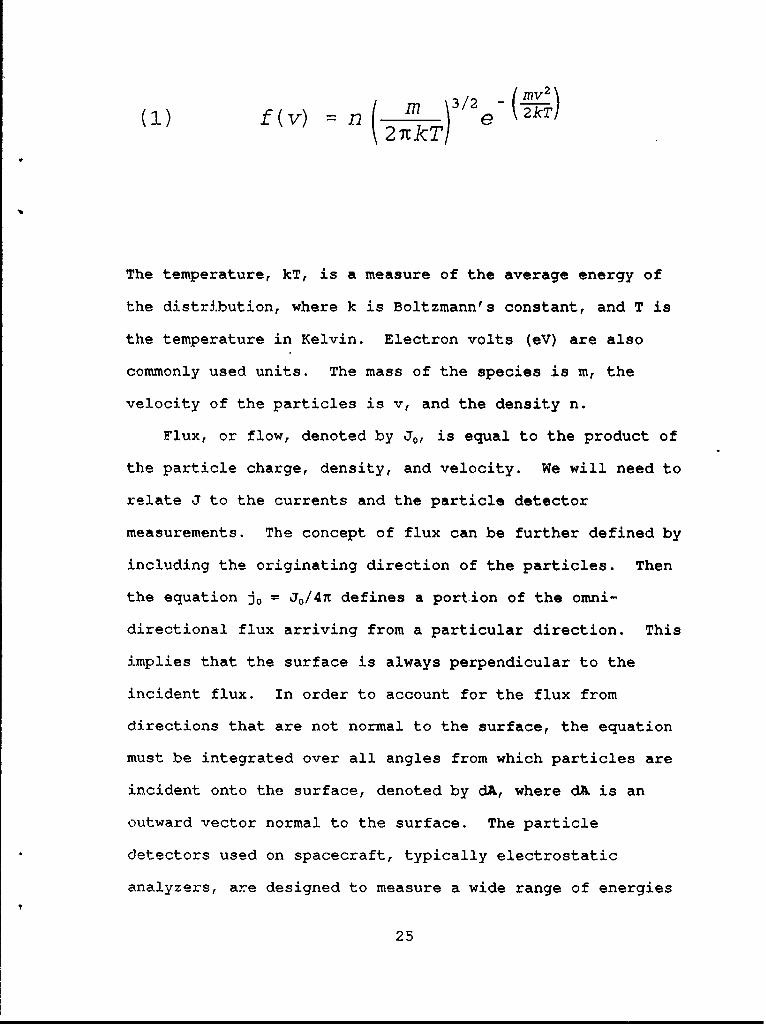
M )3/2 _V { 2
() f (v) n 21kT e /
The temperature, kT, is a measure of the average energy of
the distribution, where k is Boltzmann's constant, and T is
the temperature in Kelvin. Electron volts (eV) are also
commonly used units. The mass of the species is m, the
velocity of the particles is v, and the density n.
Flux, or flow, denoted by J0, is equal to the product of
the particle charge, density, and velocity. We will need to
relate J to the currents and the particle detector
measurements. The concept of flux can be further defined by
including the originating direction of the particles. Then
the equation j0 = J0/4n defines a portion of the omni-
directional flux arriving from a particular direction. This
implies that the surface is always perpendicular to the
incident flux. In order to account for the flux from
directions that are not normal to the surface, the equation
must be integrated over all angles from which particles are
incident onto the surface, denoted by dA, where dA is an
outward vector normal to the surface. The particle
detectors used on spacecraft, typically electrostatic
analyzers, are designed to measure a wide range of energies
25
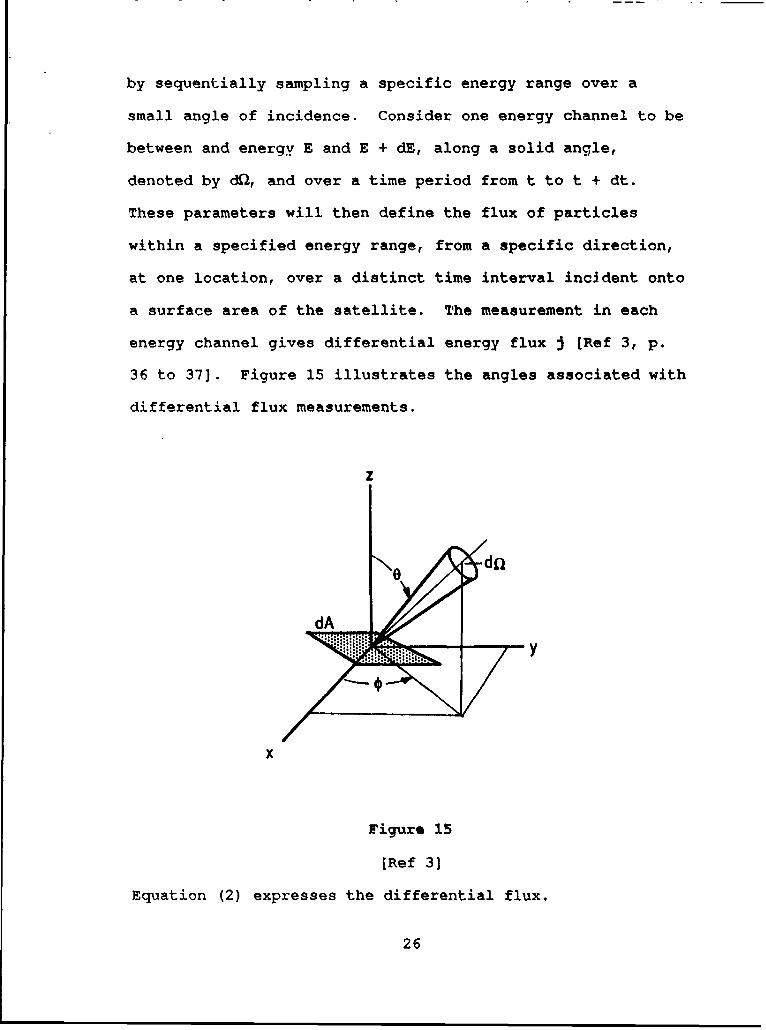
by sequentially sampling a specific energy range over a
small angle of incidence. Consider one energy channel to be
between and energy E and E + dE, along a solid angle,
denoted by dQ, and over a time period from t to t + dt.
These parameters will then define the flux of particles
within a specified energy range, from a specific direction,
at one location, over a distinct time interval incident onto
a surface area of the satellite. The measurement in each
energy channel gives differential energy flux j (Ref 3, p.
36 to 37]. Figure 15 illustrates the angles associated with
differential flux measurements.
z
Figure 15
(Ref 3]
Equation (2) expresses the differential flux.
26
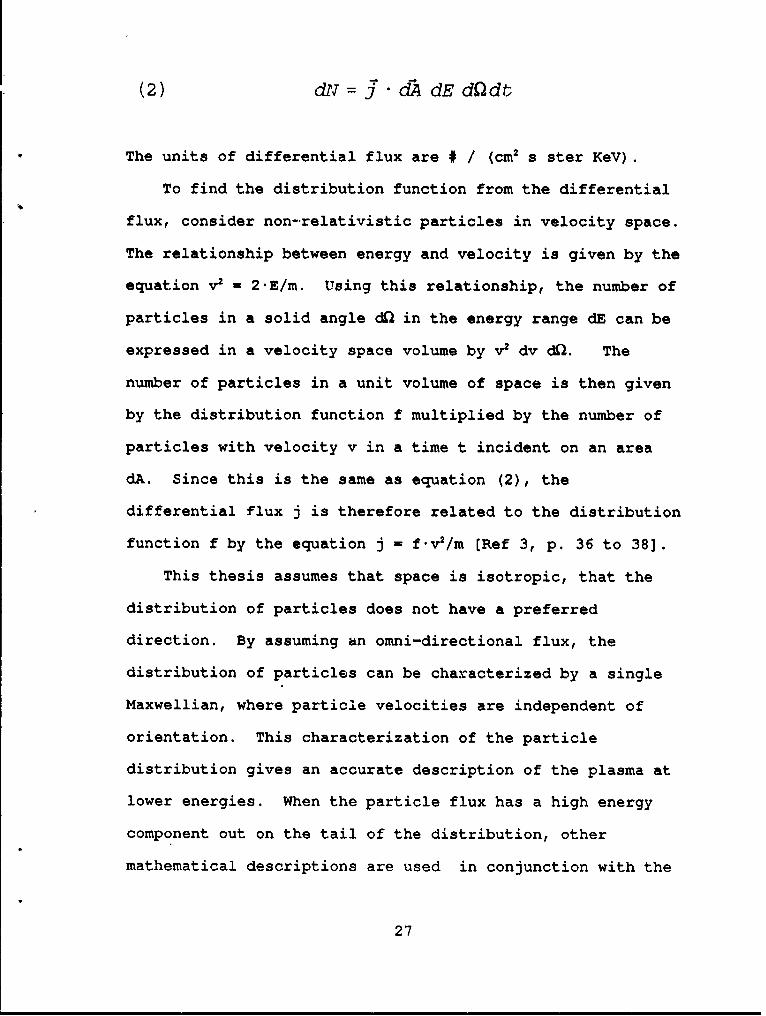
(2) dN= "A dE d2dt
The units of differential flux are # / (cm2 s ster KeV).
To find the distribution function from the differential
flux, consider non-,relativistic particles in velocity space.
The relationship between energy and velocity is given by the
equation v2 - 2.E/m. Using this relationship, the number of
particles in a solid angle d( in the energy range dE can be
expressed in a velocity space volume by v2 dv dQ. The
number of particles in a unit volume of space is then given
by the distribution function f multiplied by the number of
particles with velocity v in a time t incident on an area
dA. Since this is the same as equation (2), the
differential flux j is therefore related to the distribution
function f by the equation j - f.v2/m [Ref 3, p. 36 to 38].
This thesis assumes that space is isotropic, that the
distribution of particles does not have a preferred
direction. By assuming an omni-directional flux, the
distribution of particles can be characterized by a single
Maxwellian, where particle velocities are independent of
orientation. This characterization of the particle
distribution gives an accurate description of the plasma at
lower energies. When the particle flux has a high energy
component out on the tail of the distribution, other
mathematical descriptions are used in conjunction with the
27
Maxwellian. The higher energy particles used herein are
characterized by an inverse power law.
Further assumptions about the plasma are that it exists
in a charge-balanced state. This concept of quasi-
neutrality states that the overall charge of the plasma will
be neutral. Additionally, the Debye length is large enough
for statistical concepts to have meaning. This implies that
collisions are rare and particle interaction can be
neglected [Ref 3, p. 22].
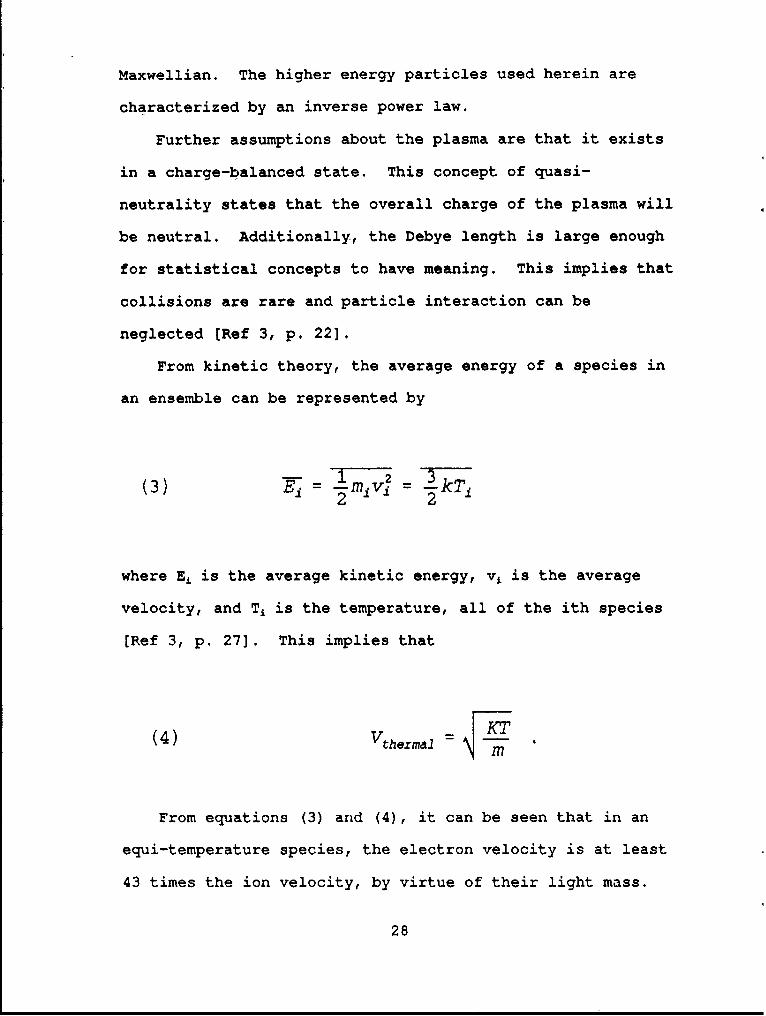
From kinetic theory, the average energy of a species in
an ensemble can be represented by
(3) =1Mi 2 3 kT.
2' 2
where Ej is the average kinetic energy, vi is the average
velocity, and Tj is the temperature, all of the ith species
[Ref 3, p. 27]. This implies that
(4) Vthermal
From equations (3) and (4), it can be seen that in an
equi-temperature species, the electron velocity is at least
43 times the ion velocity, by virtue of their light mass.
28
Therefore, for comparable temperature, the effects of ions
can largely be ignored.
B. Surface Charging
Spacecraft are constructed from conducting and
insulating materials. Metal surfaces provide a ready
pathway for incident charges to re-distribute themselves.
Insulators or dielectrics, on the other hand, do not easily
allow charges to move within or over them. As particles of
varying energy hit the satellite surfaces, some strike
conductors and move to establish equi-potential surfaces.
Other particles collide with dielectrics and are fixed, thus
establishing electric fields over localized portions of the
spacecraft surface. These electric fields are dynamic in
nature, always trying to move the charge to positions of
minimum energy.
The distribution of charge and currents on the
spacecraft surface at equilibrium will minimize the
potential energy. This implies that any charge on the
satellite surface will, if mobile, arrange itself, with
respect to the plasma currents and surface potential, at
minimum energy.
29
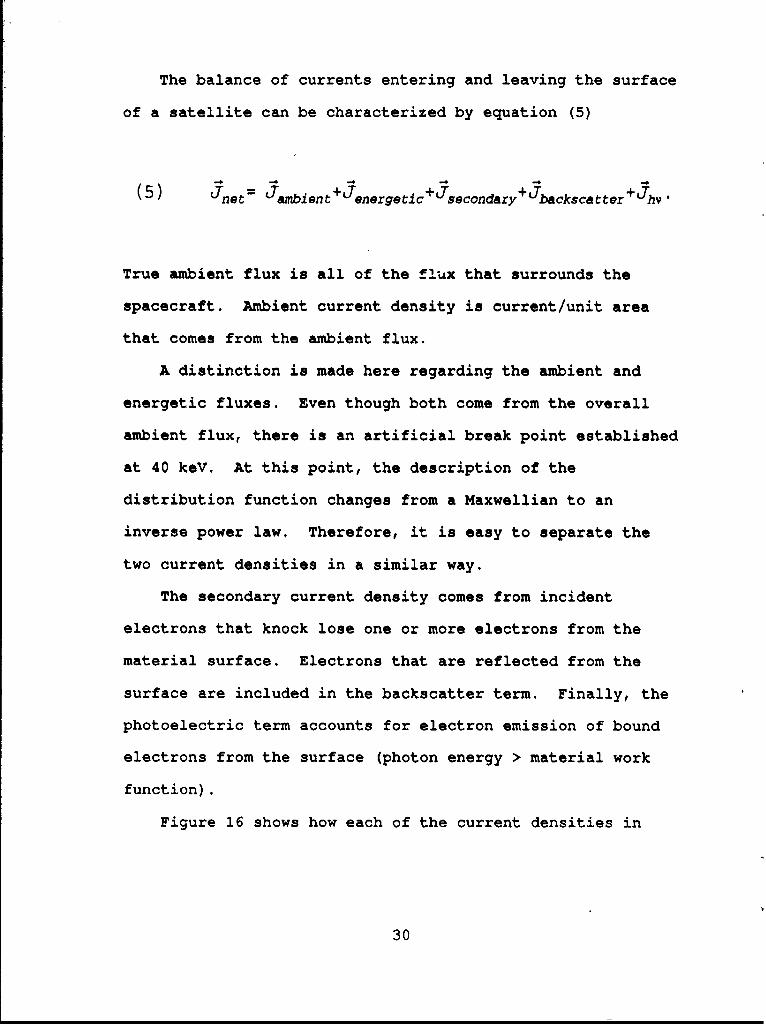
The balance of currents entering and leaving the surface
of a satellite can be characterized by equation (5)
(5) + eegetic+Jsecondary+ backscatter+jh
True ambient flux is all of the flux that surrounds the
spacecraft. Ambient current density is current/unit area
that comes from the ambient flux.
A distinction is made here regarding the ambient and
energetic fluxes. Even though both come from the overall
ambient flux, there is an artificial break point established
at 40 keY. At this point, the description of the
distribution function changes from a Maxwellian to an
inverse power law. Therefore, it is easy to separate the
two current densities in a similar way.
The secondary current density comes from incident
electrons that knock lose one or more electrons from the
material surface. Electrons that are reflected from the
surface are included in the backscatter term. Finally, the
photoelectric term accounts for electron emission of bound
electrons from the surface (photon energy > material work
function).
Figure 16 shows how each of the current densities in
30
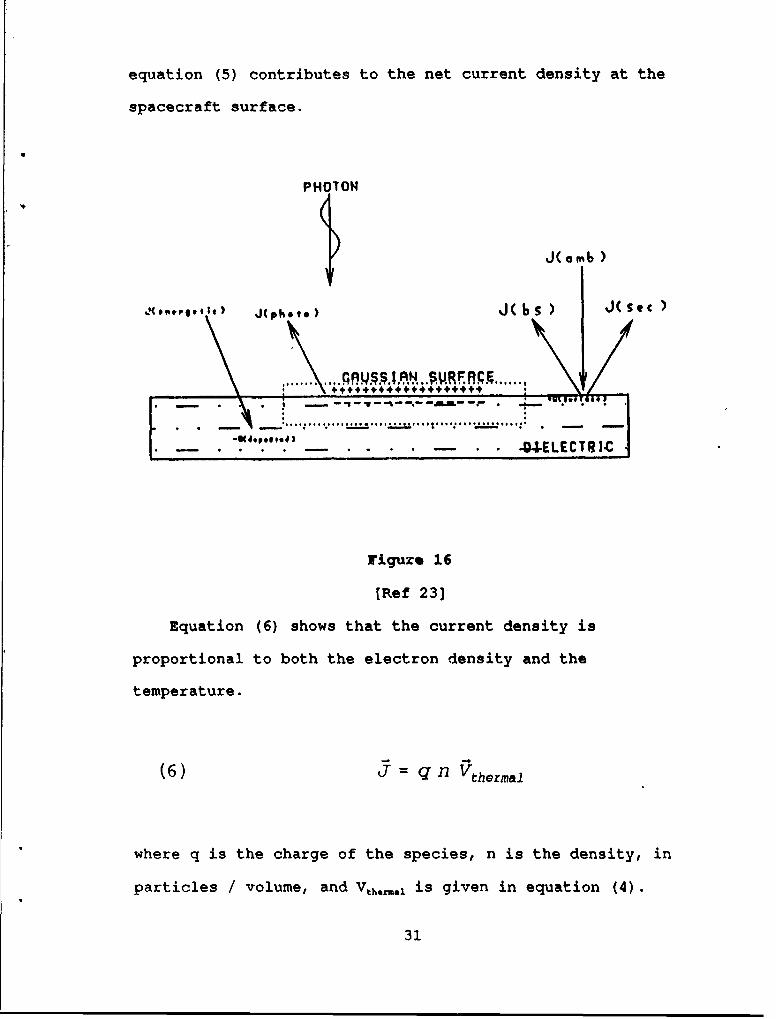
equation (5) contributes to the net current density at the
spacecraft surface.
PHOTON
J(aImb)
J(# epo* I. J(phe to) J( bs J( .)
..................... ........ ..... ...
* - SU~~t,4) - . . - .4ELECTRI-C
Figure 16
[Ref 23]
Equation (6) shows that the current density is
proportional to both the electron density and the
temperature.
(6) J=q nl Vthermal
where q is the charge of the species, n is the density, in
particles / volume, and Vt.,,.. is given in equation (4).
31

The net current density is dependent on many different
parameters. The temperature of the ambient and energetic
distributions, plasma density, velocity of the spacecraft in
the plasma, percentage of projected area that is dielectric,
materials from which the dielectric surfaces are made, and
whether the satellite is in sunlight or eclipse, are all
factors in determining J,.t.
Additional sources of current come from secondary ion
emission, movemeant of the satellite across local magnetic
fields or relative to the ambient ion population, ions from
satellite outgassing, and induced current flows from high
differential potentials. These are usually minor effects
that will be ignored. (Ref 1, p. 2-1, Ref 24, p. 168]
Equation (5) describes a delicate balance between
different mechanisms that contribute to the surface charge
of a spacecraft. In turn, each of the contributions to J,.t
will be examined.
1. Ambient Current Density
Current density equals the charge multiplied by the
flux. The flux is found when differential energy flux is
integrated over the applicable energy range. The flux is
given by
(7) f 3
32
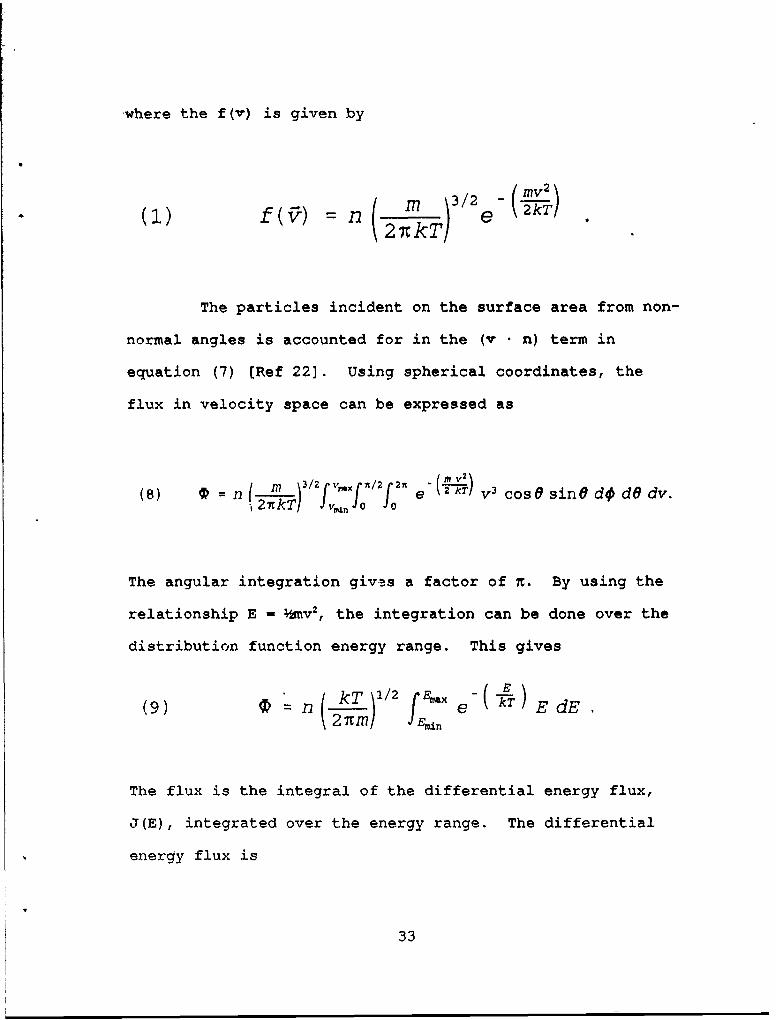
where the f(v) is given by
(1) f (-) -n( 2 )kT / e- \ )
The particles incident on the surface area from non-
normal angles is accounted for in the (v • n) term in
equation (7) (Ref 22). Using spherical coordinates, the
flux in velocity space can be expressed as
(8) = n 2',2 )3 2f'~/ I' 2o f 2 e(2 kT) v 3 cosO sine dO dO dv.
The angular integration givas a factor of n. By using the
relationship E = mv2, the integration can be done over the
distribution function energy range. This gives
(9) = n (- -m )1/ Emin e- E dE,2 7tm JjeEd E.
The flux is the integral of the differential energy flux,
J(E), integrated over the energy range. The differential
energy flux is
33
(10) J(E) =n -2 7mE
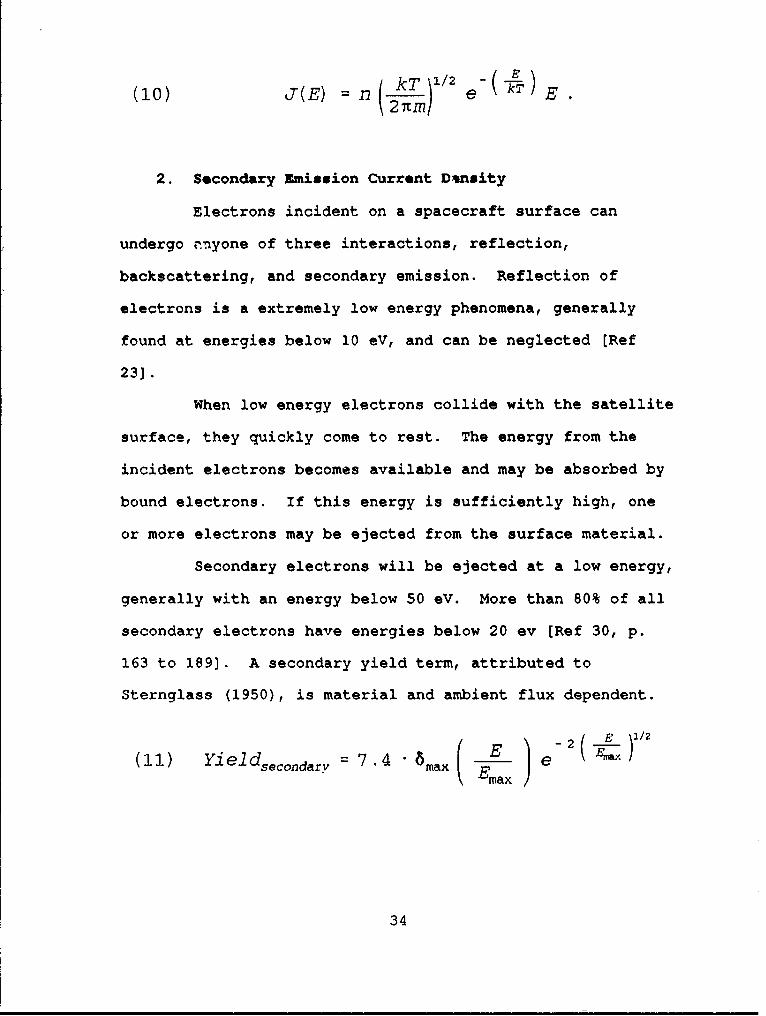
2. Secondary Emission Current Dinsity
Electrons incident on a spacecraft surface can
undergo anyone of three interactions, reflection,
backscattering, and secondary emission. Reflection of
electrons is a extremely low energy phenomena, generally
found at energies below 10 eV, and can be neglected (Ref
23].
When low energy electrons collide with the satellite
surface, they quickly come to rest. The energy from the
incident electrons becomes available and may be absorbed by
bound electrons. If this energy is sufficiently high, one
or more electrons may be ejected from the surface material.
Secondary electrons will be ejected at a low energy,
generally with an energy below 50 eV. More than 80% of all
secondary electrons have energies below 20 ev (Ref 30, p.
163 to 189]. A secondary yield term, attributed to
Sternglass (1950), is material and ambient flux dependent.
(1) Yieldsecondarv = 7 .4 " max E e( )"34Ema
34
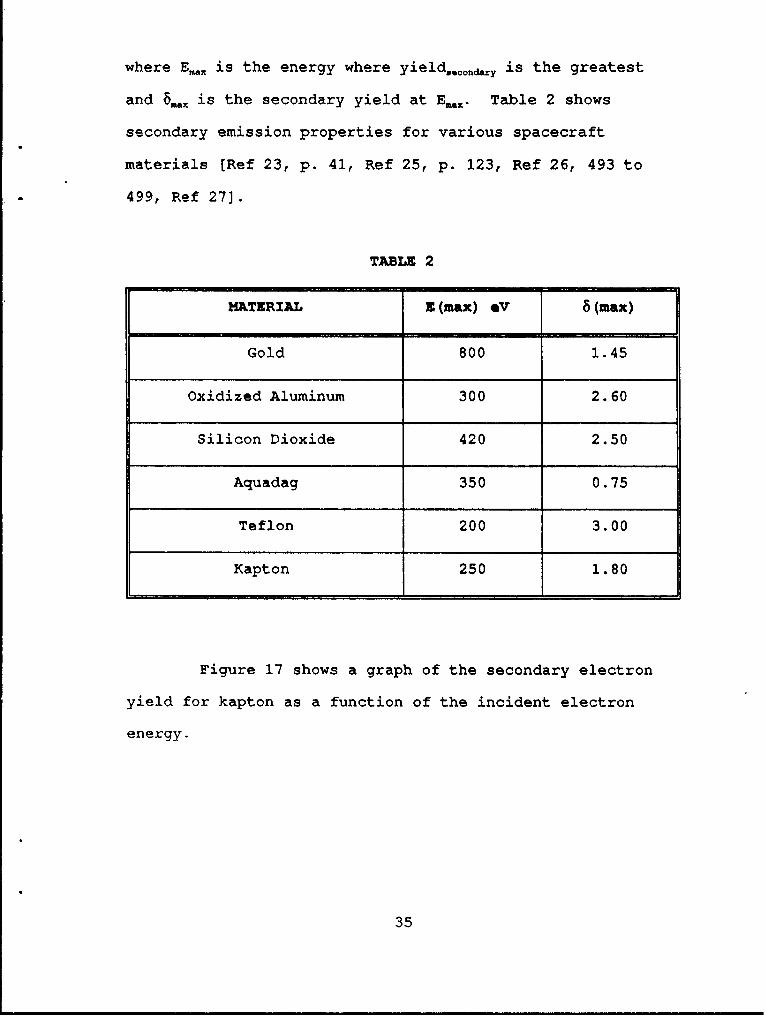
where E., is the energy where yieldaonr is the greatest
and 6max is the secondary yield at Ea. Table 2 shows
secondary emission properties for various spacecraft
materials (Ref 23, p. 41, Ref 25, p. 123, Ref 26, 493 to
499, Ref 27].
TABLE 2
MATERIAL E(max) *V 8(max)
Gold 800 1.45
Oxidized Aluminum 300 2.60
Silicon Dioxide 420 2.50
Aquadag 350 0.75
Teflon 200 3.00
Kapton 250 1.80
Figure 17 shows a graph of the secondary electron
yield for kapton as a function of the incident electron
energy.
35
The figure is typical for most spacecraft materials.
The maximum yield on the curve, usually from an incident
electron at a few hundred eV, results in more than one
electron ejected from the surface.
In the figure, secondary emission electrons
outnumber incident electrons between 50 eV and 1 keV. These
two energies, where the secondary yield is one, are known as
the lower and upper crossover energies, respectively. If
the ambient flux is sufficiently rich in particles between
the two crossover energies, more electrons will leave the
surface than are deposited, J.., >,J. 43* , and the
spacecraft will charge positively, typically a few volts
positive.
The upper crossover energy suggests the threshold
energy effect. When the electron distribution function
contains sufficient high energy components and of sufficient
energy to balance the out-flux of secondary electrons, the
satellite potential will become negative. Therefore, the
temperature of the ambient electron distribution will be
instrumental in the determination of the spacecraft
potential. The energy at which balancing occurs is known as
the threshold energy and is the start of negative charging.
The threshold energy will vary among spacecraft
because of geometry and dielectric materials, but lies
36
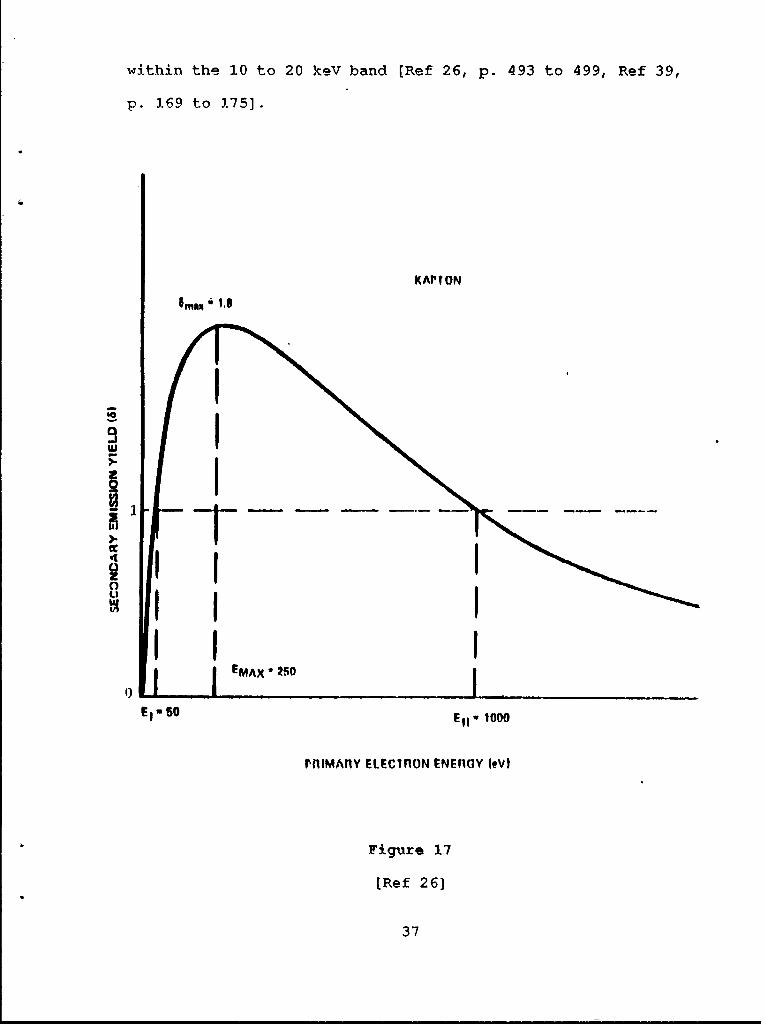
within the 10 to 20 key band [Ref 26, p. 493 to 499, Ref 39,
p.169 to 175].
K APIVON
1.8'I
EMA
I0El,10PnIM~n FLEC~ON ENEIYIV
Fiue1
[Rf 6
37I
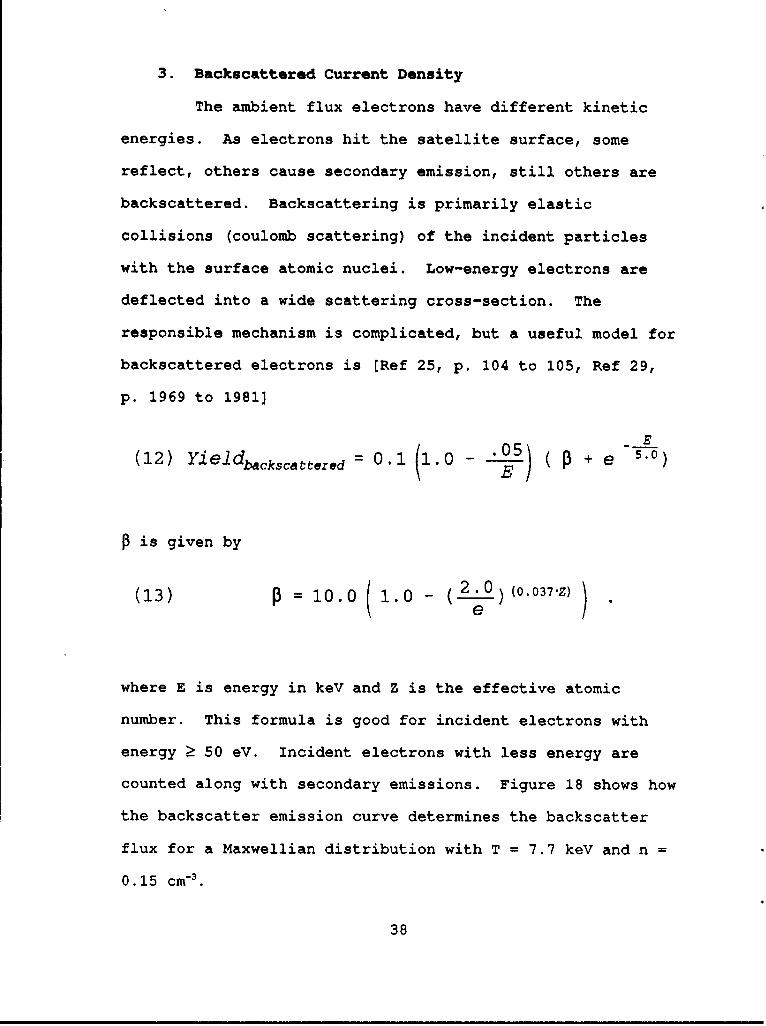
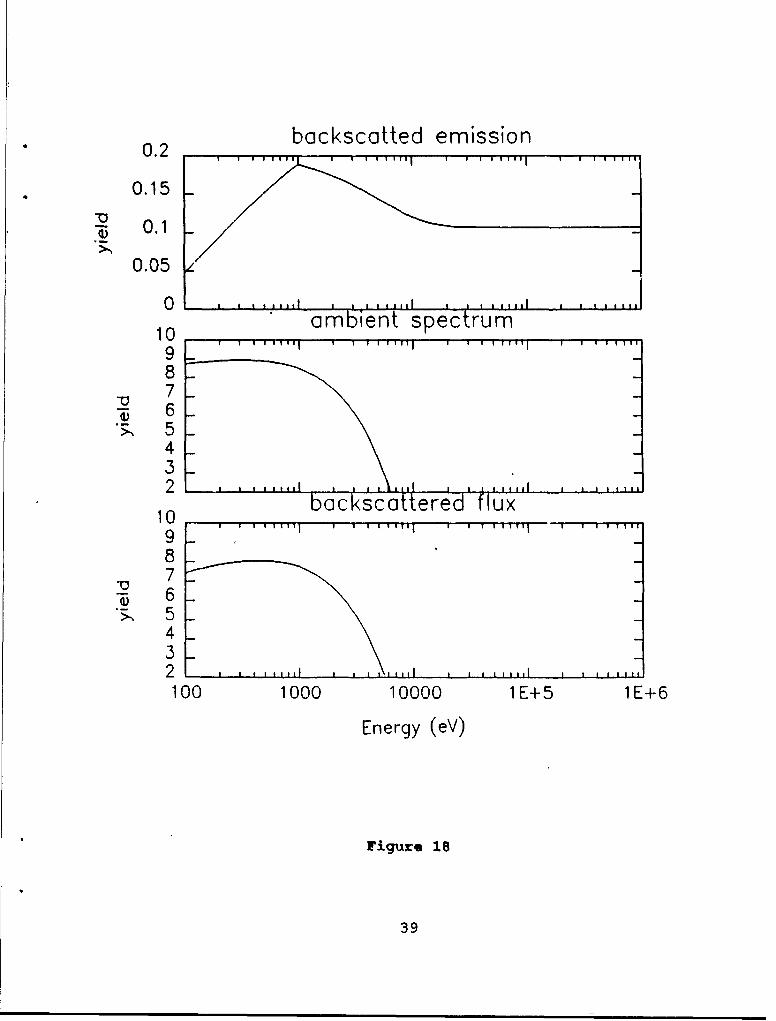
3. Backscattered Current Density
The ambient flux electrons have different kinetic
energies. As electrons hit the satellite surface, some
reflect, others cause secondary emission, still others are
backscattered. Backscattering is primarily elastic
collisions (coulomb scattering) of the incident particles
with the surface atomic nuclei. Low-energy electrons are
deflected into a wide scattering cross-section. The
responsible mechanism is complicated, but a useful model for
backscattered electrons is [Ref 25, p. 104 to 105, Ref 29,
p. 1969 to 1981]
E(12) Yieldbackscattred = 0.1 (1.0 -. 05 + e 5.0)
is given by
(13) = 0.0 (I.0 - (2.0) (0.037Z))
where E is energy in keY and Z is the effective atomic
number. This formula is good for incident electrons with
energy 50 eV. Incident electrons with less energy are
counted along with secondary emissions. Figure 18 shows how
the backscatter emission curve determines the backscatter
flux for a Maxwellian distribution with T = 7.7 key and n =
0.15 cm-3.
38
*0.2 backscotted emission
0.15
0.05
10 ambient spectrum98
-~ 76
.~ 5
432
backscattered fux
87
>~5
4 632 L aa
1 a a 11 Imai ii,
100 1000 10000 1 E+5 1 E±6
Energy (eV)
Figure 18
39
Two transcription errors were noted in References 23
and 25. The exponential term in 0 was not raised to a
power, and the 0.05 was written as 0.5. This could have
resulted in a very slight under-calculation of the
backscattered flux between 100 and 500 eV in the referenced
work.
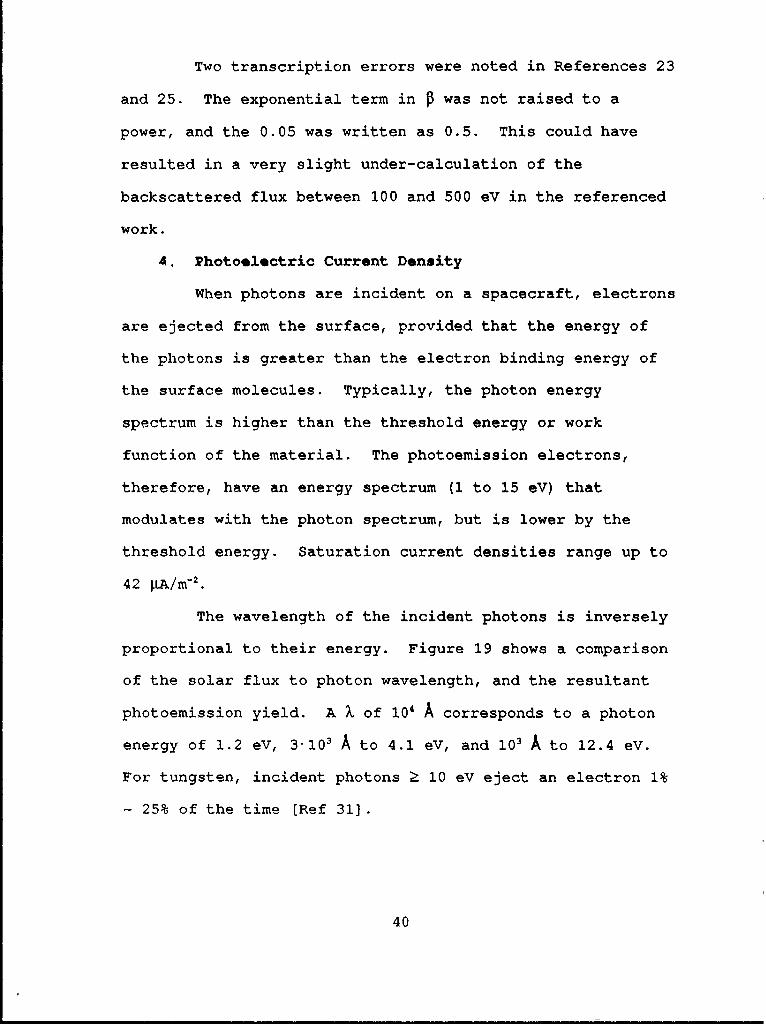
4. Photoelectric Current Density
When photons are incident on a spacecraft, electrons
are ejected from the surface, provided that the energy of
the photons is greater than the electron binding energy of
the surface molecules. Typically, the photon energy
spectrum is higher than the threshold energy or work
function of the material. The photoemission electrons,
therefore, have an energy spectrum (1 to 15 eV) that
modulates with the photon spectrum, but is lower by the
threshold energy. Saturation current densities range up to
42 KA/m-2.
The wavelength of the incident photons is inversely
proportional to their energy. Figure 19 shows a comparison
of the solar flux to photon wavelength, and the resultant
photoemission yield. A X of 104 A corresponds to a photon
energy of 1.2 eV, 3'103 A to 4.1 eV, and 103 A to 12.4 eV.For tungsten, incident photons 10 eV eject an electron 1%
- 25% of the time [Ref 31].
40
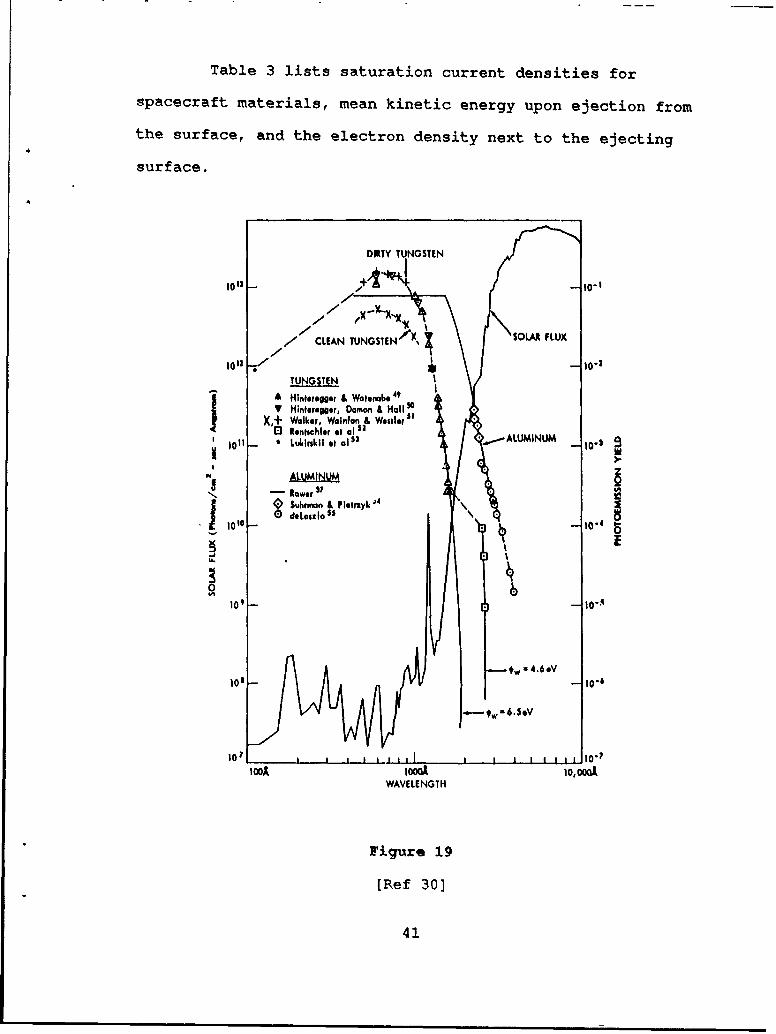
Table 3 lists saturation current densities for
spacecraft materials, mean kinetic energy upon ejection from
the surface, and the electron density next to the ejecting
surface.
DIRTY TUNGSTEN
1013 +1 to-
7 CLEAN TUNGSTEN 7 x, SOLAR FLUX
l0ll to-10.TUNGSTEN
A Hinteregger & Walonabe 4Y Hinteregger, Damon & Hall O
X,+ Walker, Wainfan & WeilerEO RentsCkler $I at$
101 Liiklrskl ot 0a$3 y.ALUMINUM 10-3
ALUMINUM
~Rwer 3 ? A40Suhrman & Plelrzyk
0d*Laszlo 5
U.
0
*w4.6 *V10810
100A I IOWA II I oI 00
WAVELENGTH
Figure 19
[Ref 30]
41
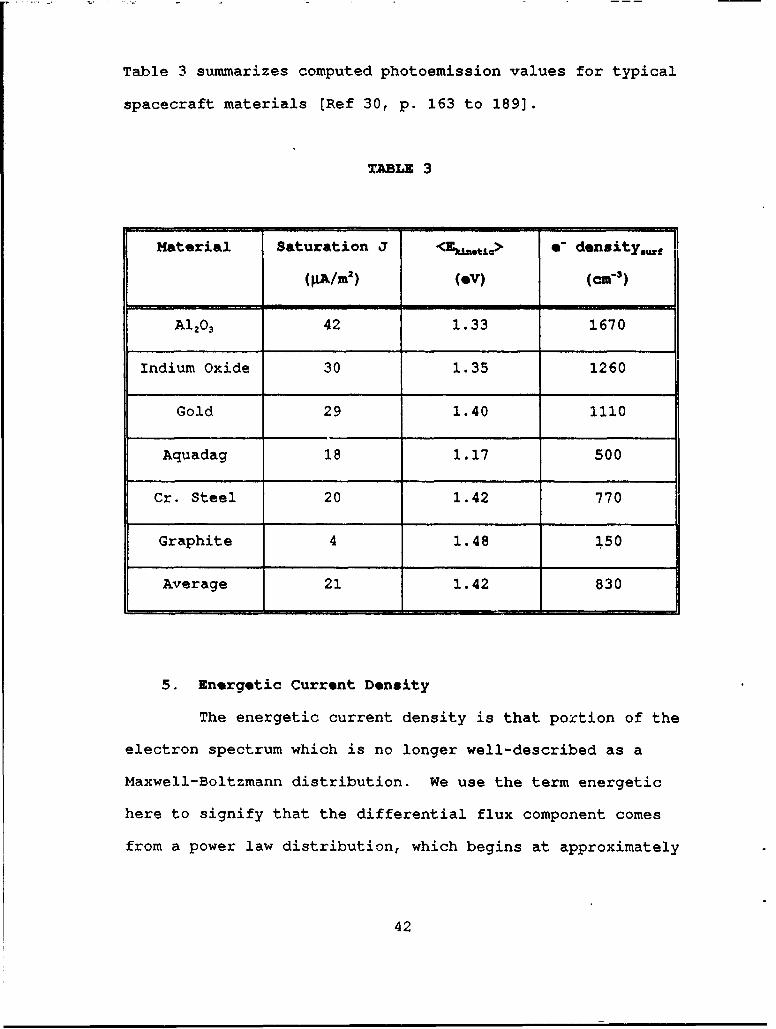
Table 3 summarizes computed photoemission values for typical
spacecraft materials [Ref 30, p. 163 to 189].
TABLE 3
Material Saturation J <E..t~c> e- density...
(KA/r 2) (ev) (cr "')
AI20 3 42 1.33 1670
Indium Oxide 30 1.35 1260
Gold 29 1.40 1110
Aquadag 18 1.17 500
Cr. Steel 20 1.42 770
Graphite 4 1.48 150
Average 21 1.42 830
5. Energetic Current Density
The energetic current density is that portion of the
electron spectrum which is no longer well-described as a
Maxwell-Boltzmann distribution. We use the term energetic
here to signify that the differential flux component comes
from a power law distribution, which begins at approximately
42

40 keV for data considered here. The distribution function
is proportional to (E/Eo)--, where x typically 4 to 6. In
our case, x = 5 (this gives a flux that in proportional to
E-3). The flux is found when differential energy flux is
integrated over the applicable energy range.
Now f(v) is given in terms of energy by
(14) f(E) = 7 M )3/2 ( E 5
The distribution function is given in terms of energy. The
mass is m, q is the charge, E0 is the minimum energy for the
distribution function, in eV [Ref 13, p. 5568 to 5578, Ref
22]. The normalization is such that n - IJlf(E) when done
with limits E = Eo to infinity.
Inserting the distribution function into equation 7,
and using the relationship E = V mv2, the integration can be
done over the distribution function energy range. The upper
limit of integration is infinity. Since the distribution
function tail asymptotically approaches zero, the
contribution from the upper limit is zero. Therefore, the
energetic flux is -rimarily determined by the lower limit of
integration.
43
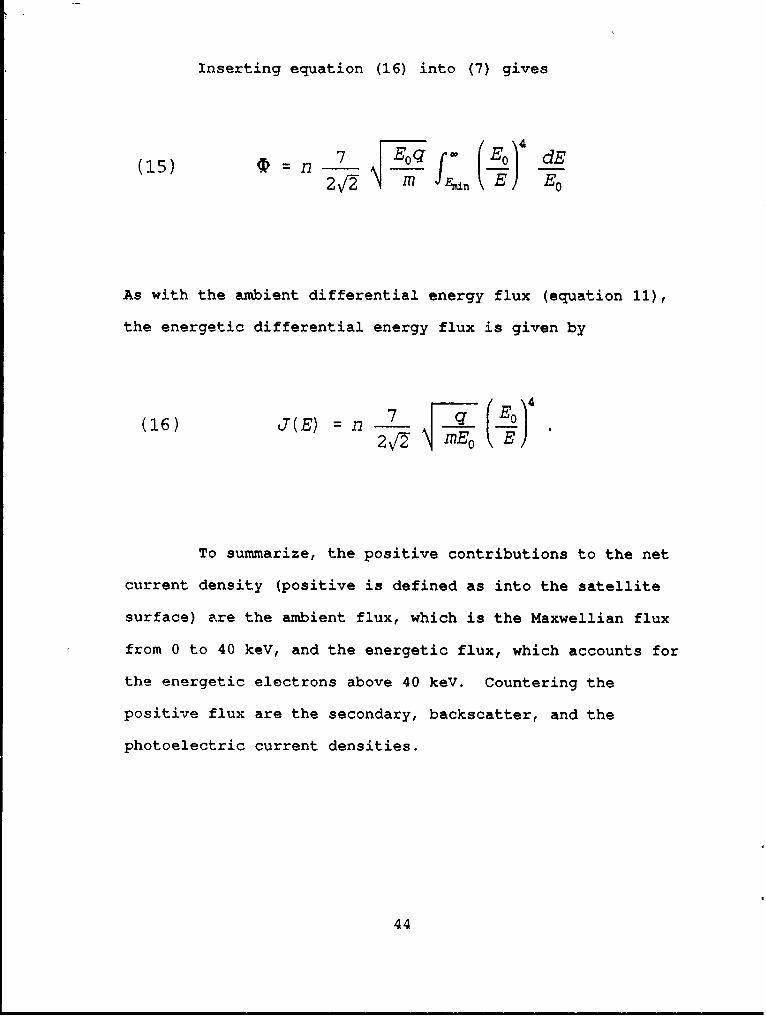
Inserting equation (16) into (7) gives
/ 4
(15) E dE
2 2F mn E)E
As with the ambient differential energy flux (equation 11),
the energetic differential energy flux is given by
(16) J(E) = n 7-(o E ')1
To summarize, the positive contributions to the net
current density (positive is defined as into the satellite
surface) are the ambient flux, which is the Maxwellian flux
from 0 to 40 keV, and the energetic flux, which accounts for
the energetic electrons above 40 keV. Countering the
positive flux are the secondary, backscatter, and the
photoelectric current densities.
44
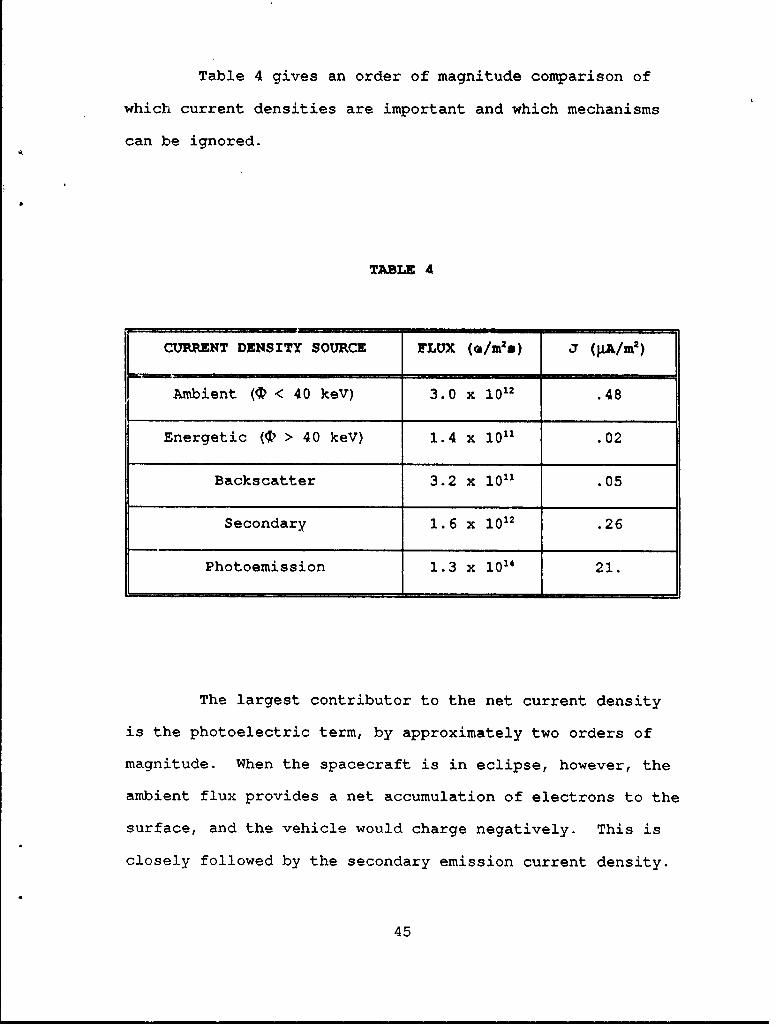
Table 4 gives an order of magnitude comparison of
which current densities are important and which mechanisms
can be ignored.
TABLE 4
CURRENT DENSITY SOURCE FLUX (oa/ms) J (A/m 2 )
Ambient (4 < 40 keY) 3.0 x 10¹² .48
Energetic (V > 40 keV) 1.4 x 10¹¹ .02
Backscatter 3.2 x 10¹¹ .05
Secondary 1.6 x 10¹² .26
Photoemission 1.3 x 10¹⁴ 21.
The largest contributor to the net current density
is the photoelectric term, by approximately two orders of
magnitude. When the spacecraft is in eclipse, however, the
ambient flux provides a net accumulation of electrons to the
surface, and the vehicle would charge negatively. This is
closely followed by the secondary emission current density.
45
The distribution function used here is for a hot
plasma distribution, where the temperature is higher than
for a quiet day. During quiet days, when the ambient and
energetic fluxes would be lower, the sum of the secondary
and backscatter terms would be closer to the positive
fluxes. This would allow the net current density to self-
balance, precluding large negative potentials from forming.
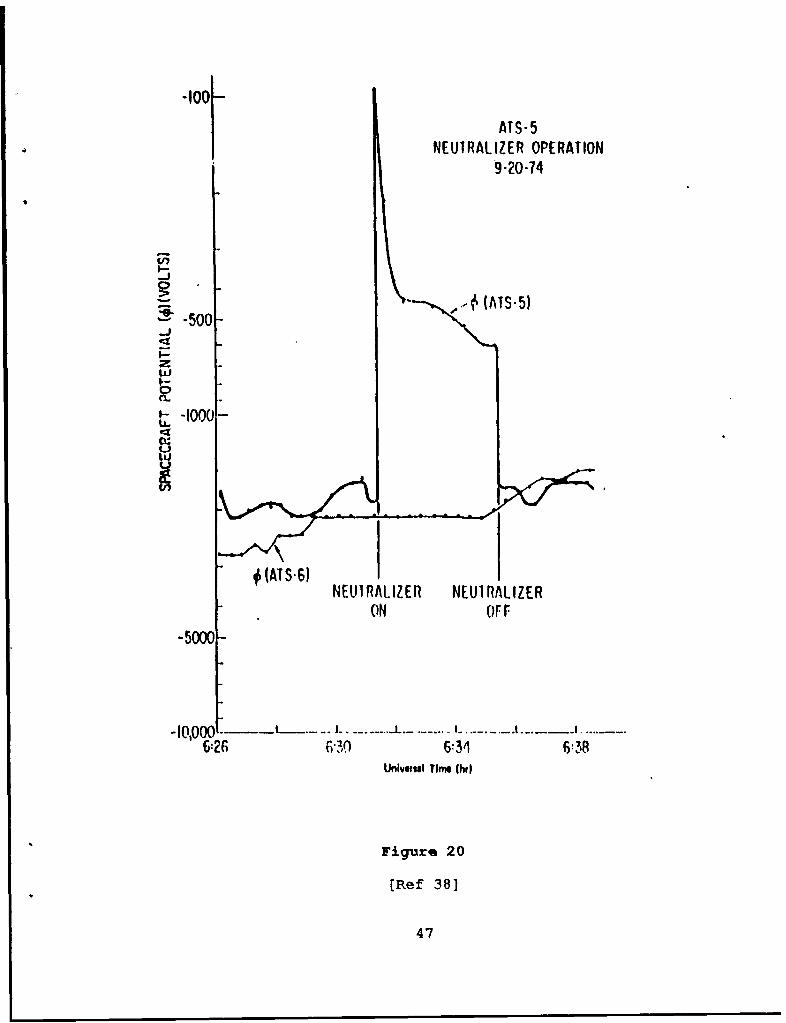
The effect on the potential from the net flow of
charge to the surface of the spacecraft is clearly shown in
Figure 20. On 20 September, 1974, ATS 5 and ATS 6 were
immersed in the same plasma, and both charged to similar
negative potentials, prior to the active experiments which
were the focus of this work. An experiment on spacecraft
potential modification was conducted with the electron
source on ATS 5. The electrons came from a filament source,
from - 0632 to 0635 [Ref 38, p. 527 to 532]. Prior to 0632
and after 0635, ATS 5 and ATS 6 charged to the same
potential.
This shows that although surface material
characteristics are important (e.g., secondary yield),
variations between these vastly different vehicles did not
lead to greatly different potentials in eclipse. Hence,
simple assumptions about yield terms, such as assigning
"typical" values for glass or aluminum are not unreasonable.
46
"100I~ ATS-5
NEUIRALIZER OPERATION9-20-74
" -505)I.-
-J~ 50 - ~,.1iAIS5
wI.-
1" -IO000-U-
NEUIRALIZER NEUIRALIZER
ON OFF
-5000
6 "2 , 6 0 6 34 6:38Universal Tini thrl
Figure 20
[Ref 38]
47
C. Deep Dielectric Charging
Energetic electrons lie in the high-energy tail of the
electron distribution function. As the average temperature
of the distribution increases, the number of high energy
particles increases, and so does the likelihood of deep
dielectric charging.
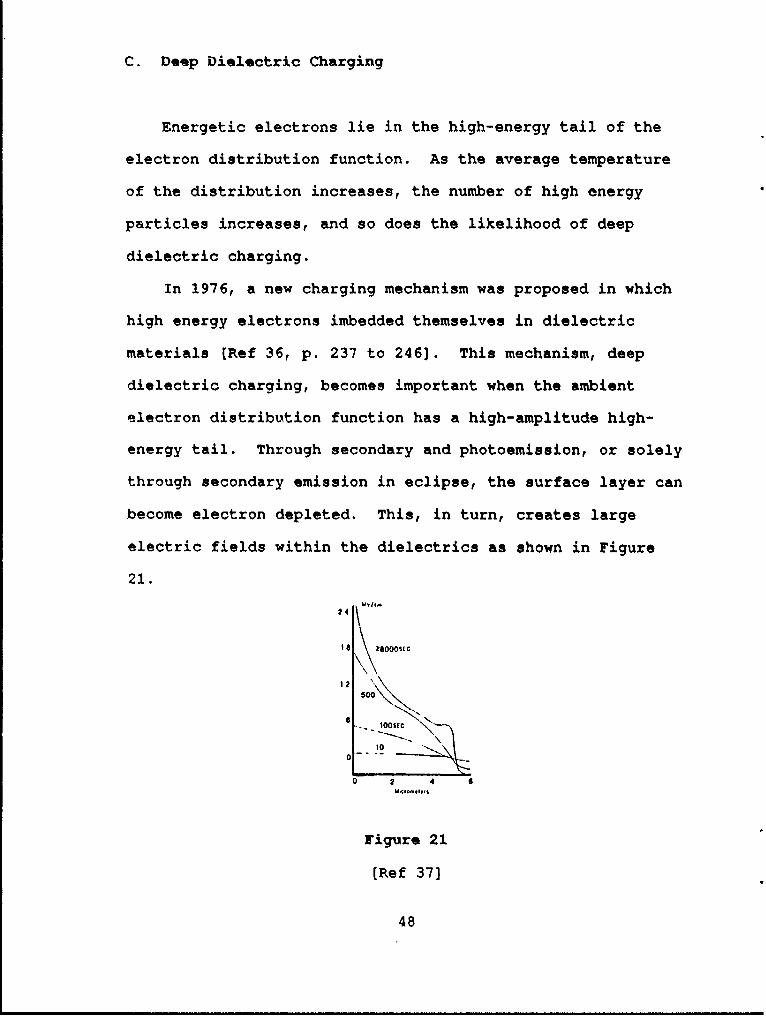
In 1976, a new charging mechanism was proposed in which
high energy electrons imbedded themselves in dielectric
materials (Ref 36, p. 237 to 246]. This mechanism, deep
dielectric charging, becomes important when the ambient
electron distribution function has a high-amplitude high-
energy tail. Through secondary and photoemission, or solely
through secondary emission in eclipse, the surface layer can
become electron depleted. This, in turn, creates large
electric fields within the dielectrics as shown in Figure
21.
24
IS k00oSIC
10011
0
0 2 4 6
Figure 21
(Ref 37]
48

When the top layer is "hole" rich, the electric fields
that are produced are on the order of 106 volts per cm. As
time increases from minutes to hours, the potential will
draw electrons within the dielectric toward the surface.
The consequence of "energetic electrons" in the
distribution function is deep dielectric charging.
Important results of deep dielectric charging are energy
deposition profiles, radiation-induced conductivity,
localized formation of strong electric fields, and formation
of potential barriers.
The build up of charge within the dielectrics is
governed by two competing processes, the rate which charge
is deposited, and the rate which it leaks out. The net
charging rate can be modelled by considering the dielectric
to be a one-dimensional slab of thickness d. If the current
density entering is Ji and J, is that which exits the
dielectric, then the divergence of the current density is
approximately (Ji - J0)/d. The continuity equation
(17) at JD + ' E
can then be used to model the net rate of accumulation.
Equation (18) shows the mechanism for the net buildup of
charge, but does not include surface conductivity effects,
as modified by radiation.
49
Solving the continuity equation for charge density as a
function of time , assuming no charge at t = 0, as would be
the case when the spacecraft environment is calm and there
is photoemission, gives
(18) p(t) j 1Joe- [1-e -d a
These simple equations show that the time constant T -
C/o. For glass, T is many hours since deposited electrons
will remain practically forever.
1. Radiation-induced Conductivity
The conductivity in equation (18) is a free
parameter in the charge balance equation. The conductivity
of the dielectric can be altered over time by a phenomena
known as radiation-induced conductivity (RIC). This effect
varies with the depth of the material, and is confined
primarily to the surface of the dielectric. The effects of
RIC will be discussed below. First the electron deposition
process must be considered.
2. Energy Deposition Profile
The energy deposition process is a complex mixture
of elastic and inelastic collisions, scattering, and
material penetration, as described by scattering theory [Ref
32, p. 2-1, 2-2]. Figure 22 shows the deposition depth of
electrons in silicon glass as a function of the incident
50
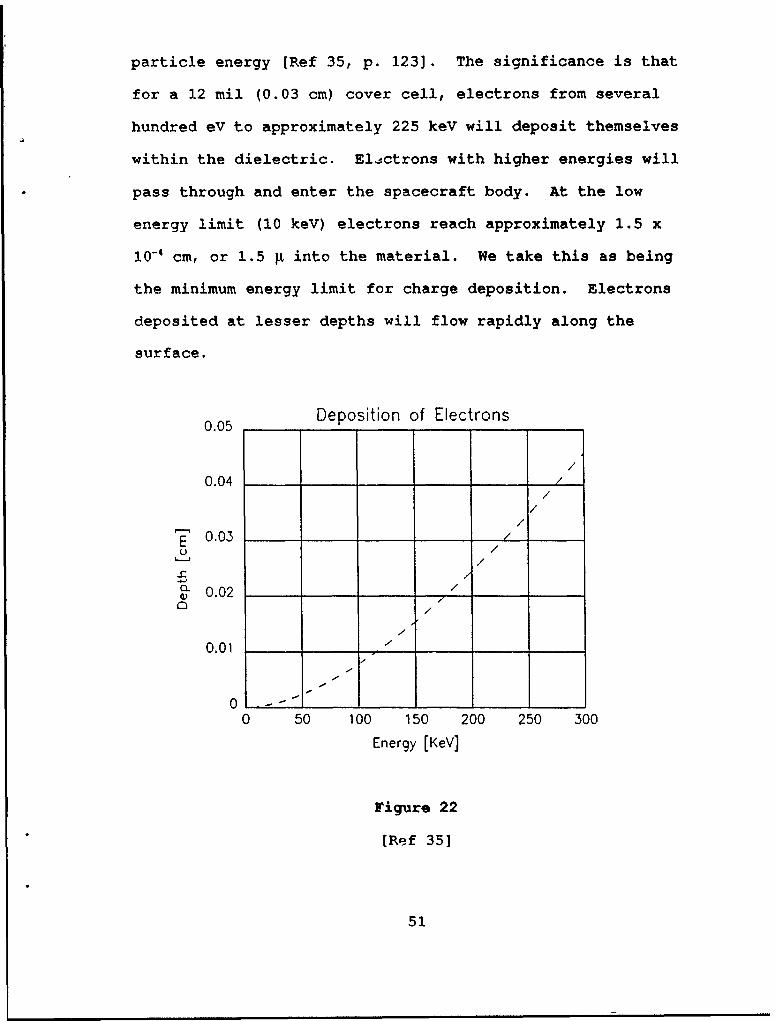
particle energy (Ref 35, p. 123]. The significance is that
for a 12 mil (0.03 cm) cover cell, electrons from several
hundred eV to approximately 225 keV will deposit themselves
within the dielectric. Electrons with higher energies will
pass through and enter the spacecraft body. At the low
energy limit (10 keV) electrons reach approximately 1.5 x
10-' cm, or 1.5 R into the material. We take this as being
the minimum energy limit for charge deposition. Electrons
deposited at lesser depths will flow rapidly along the
surface.
0.05 Deposition of Electrons
/
0.04/
//
E 0.03
0.02
0.01.,
//
0/
0 50 100 150 200 250 300
Energy [KeV]
Figure 22
[Ref 35]
51
The effective conductivity of the dielectric is a
combination of the intrinsic conductivity 91 and the
radiation-induced conductivity OaRc, and can be expressed as
(19) aeffective = ri + URIC
(Ref 33, p. 2282]. Radiation-induced conductivity can be
modelled by
(20) URIC K5A
where K is the coefficient of RIC, and A is a material
dependent parameter. Although theory predicts that both are
constants and are independent of type and energy of the
radiation, there is disagreement on their empirical values.
A is frequently found to lie within 0.9 to 1.1, and can be
taken as 1.0. K lies within a greater range of minimum and
maximum values, hence introduces greater uncertainty into
equation (20) than does A.
52

Table 5 lists maximum and minimum values for typical
spacecraft dielectrics. Units are 10-19 sec/(Q cm rad) [Ref
34, p. 580].
TABLE 5
Material 1 . KUL
Kapton 60 1.2
Teflon 1000 20
Mylar 2.1 1.8
The dose rate in equation (20) is given by dD/dt,
and is the rate at which energy is deposited into the
material, in units of rads per second. A rad is defined as
100 ergs per gram. The dose rate consists of three parts,
the collision stopping power, the specific thickness, and
incident flux.
The collision stopping power (CSP) is a measure of
how far into a material electrons will penetrate as a
function of their incident energy and the thickness of the
material. By dividing the CSP by the density of the
material, the CSP becomes independent of the material and
comparative analysis can be performed. At low energies, the
CSP measure loses its usefulness, and ceases to be
53
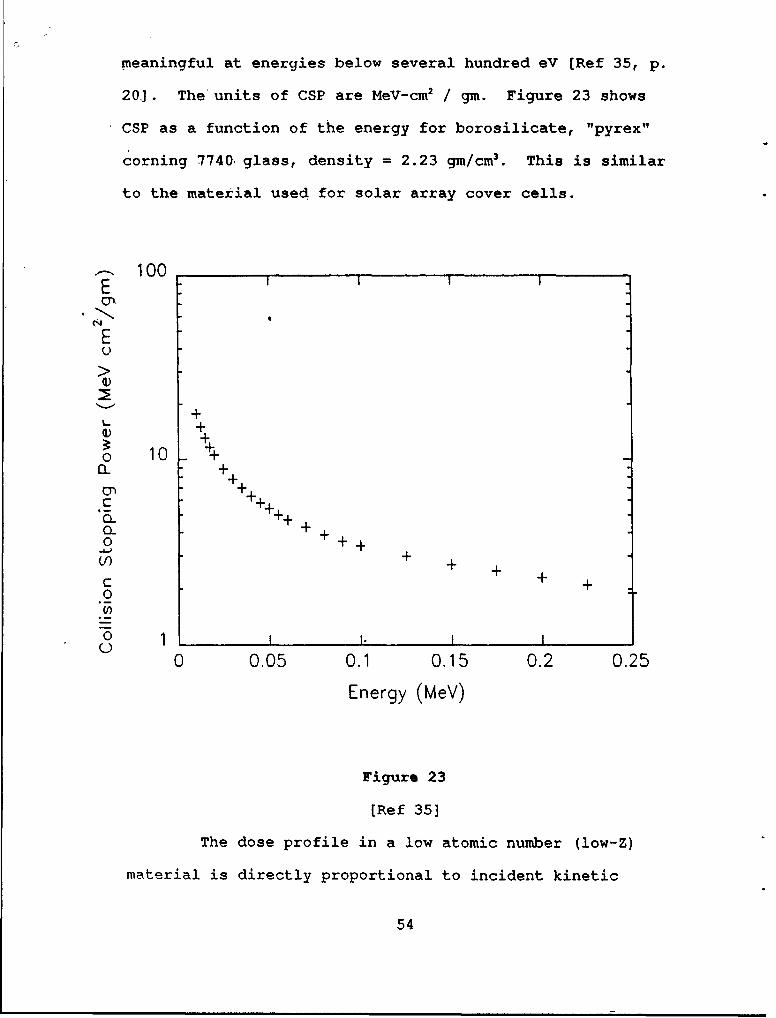
meaningful at energies below several hundred eV [Ref 35, p.
20.]. The'units of CSP are MeV-cm 2 / gm. Figure 23 shows
CSP as a function of the energy for borosilicate, "pyrex"
corning 7740 glass, density = 2.23 gm/cm3 . This is similar
to the material used for solar array cover cells.
100E I I
E
+
+
Cl ++
+++
o 10 +
+ +0 +++ ++
+ +
C + +0
0 0.05 0.1 0.15 0.2 0.25
Energy (MeV)
Figure 23
[Ref 35]
The dose profile in a low atomic number (low-Z)
material is directly proportional to incident kinetic
54

energy. By defining the incident thickness in terms of e-
/cm2-MeV, the dose profile will be independent of the
particle's incident energy and the nature of the material.
This- thickness is defined as specific thickness (T.), and is
given by
(21) T = p xN IZ\T A
where f. is the weight fraction of the ith element of the
material, and is given by
(22) f ni AiA,
and where the parameters are defined as:
- p = material density (gm/cm3)
- x = depth in the material in cm
No = Avogadro' number
T = e- energy in MeV
- A = Atomic weight
- n. = number of atoms in the ith element of the material
The Incident differential energy flux is calculated from the
plasma parameters in units of e-/ (cm2 s ster MeV).
55
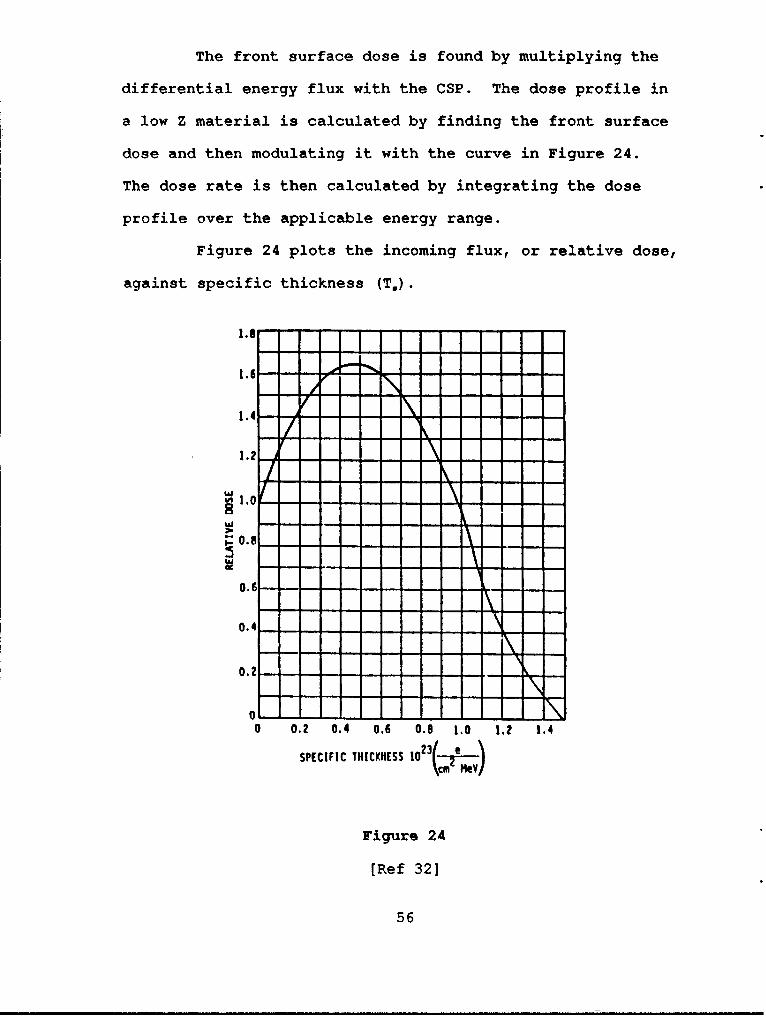
The front surface dose is found by multiplying the
differential energy flux with the CSP. The dose profile in
a low Z material is calculated by finding the front surface
dose and then modulating it with the curve in Figure 24.
The dose rate is then calculated by integrating the dose
profile over the applicable energy range.
Figure 24 plots the incoming flux, or relative dose,
against specific thickness (T,).
0.8
0.4--
0.2--------------
1.?
0 0. 0. 0 0 0 - - - .2 -.-
0 0.2 0.4 0.6 o.S 1.0 1.2 1.4
CC (Me)
Figure 24
(Ref 32]
56
If the saturation electric field at any time exceeds
the dielectric breakdown threshold, as modified by RIC,
charge re-distribution or arcing will occur.
Using a teflon sample (d = 10 mils), a breakdown
threshold of 107 coulombs/cm 2 and a discharge time of
roughly 50 nanoseconds, peak structural currents (geometry
dependent) can range from 1 to 10 amps [Ref 33, p. 2281 to
2284]. The use of teflon, a dielectric material, is for an
order of magnitude picture of the peak currents that can
occur.
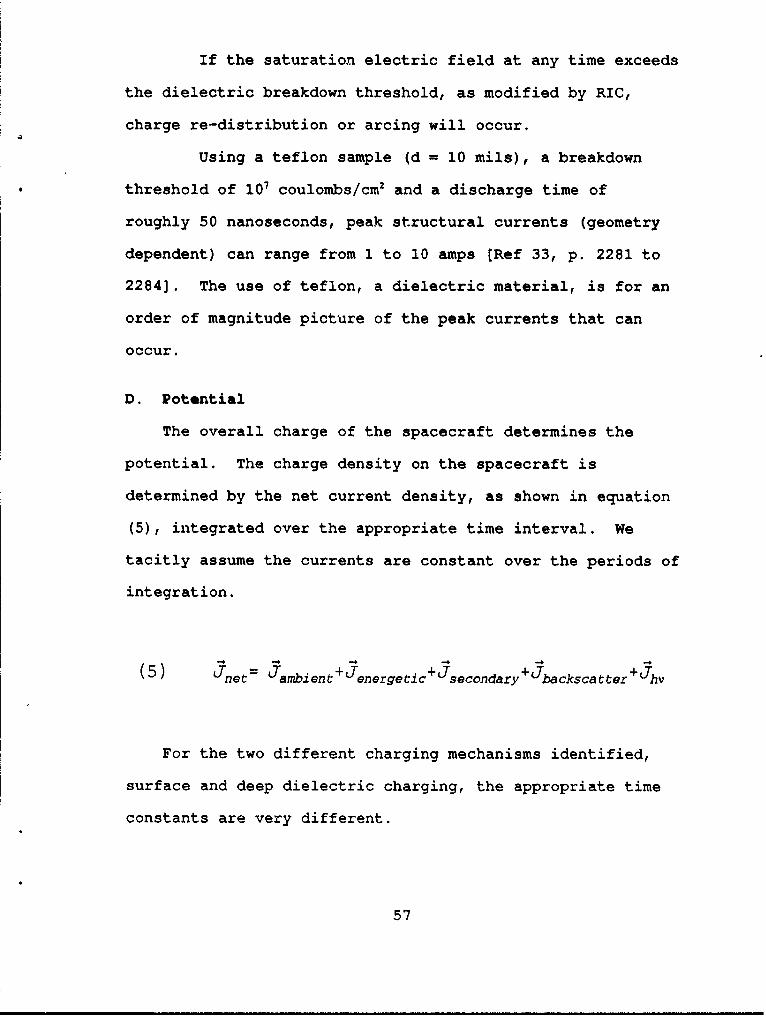
D. Potential
The overall charge of the spacecraft determines the
potential. The charge density on the spacecraft is
determined by the net current density, as shown in equation
(5), integrated over the appropriate time interval. We
tacitly assume the currents are constant over the periods of
integration.
(5) Lnet= nambient +Jenergetic+Jsecondary+ Jbackscatter+ Jhv
For the two different charging mechanisms identified,
surface and deep dielectric charging, the appropriate time
constants are very different.
57

For surface charging, the time periods which are
appropriate are typically a second or less. This is because
the relatively small capacitance associated with satellite
potentials can lead to significant charge buildup (changes
in potential) within a millisecond time frame. If the
satellite is near equilibrium, the net current will be
small, and it should be possible to estimate the net charge
density accumulated in one spin period by taking the
currents to be constant over that period.
(23) q/m 2 stzrf (Jamb- Jphoto/2- Jsec- Jb5) spin time
Sunlight shines on approximately 20% to 25% of the
spacecraft surface at any given time, depending on the
vehicle geometry. The spin time for a satellite can range
from less than a second to about one minute per revolution.
In deep dielectric charging, the charge density comes
from the energetic current density. Therefore, the
deposition of charge is dependent on te energetic tail of
the distribution function. This gives a net deposition of
charge into the dielectric material over long periods of
time, that is minutes to hours.
The deposition of charge into the dielectrics will occur
slowly, but can eventually become significant if the
resistivity is high. Hence the charge distribution can be
58
similar to that induced with shadowed differentially charged
surfaces [Ref 40, p. 6809 to 6819].
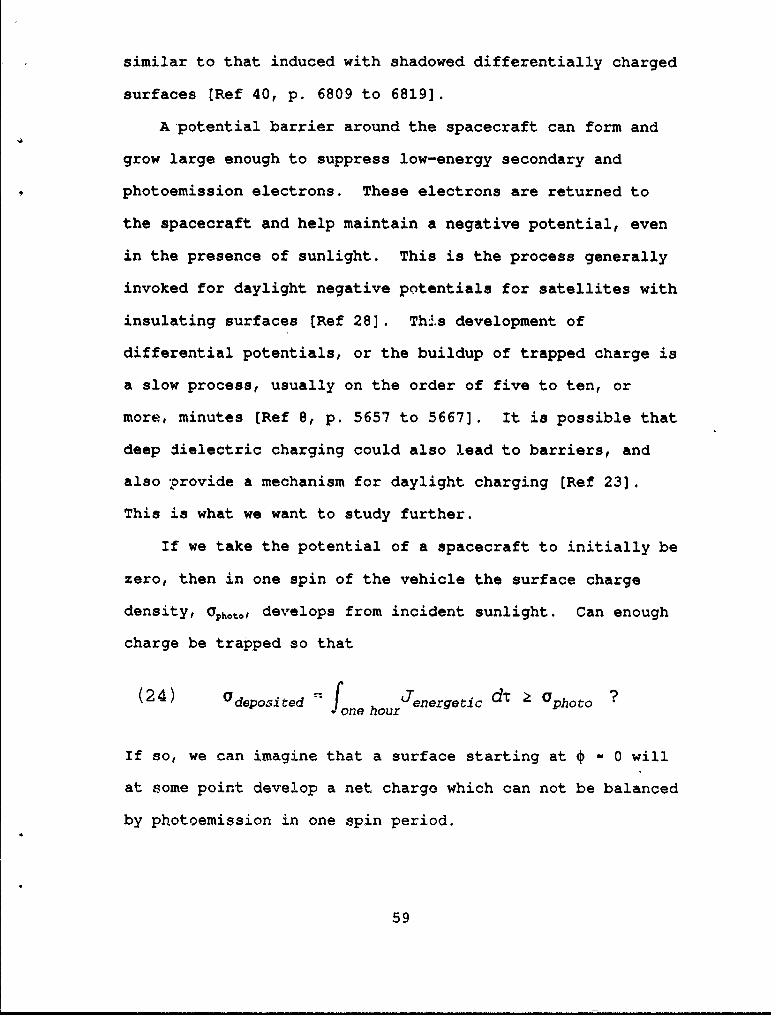
Apotential barrier around the spacecraft can form and
grow large enough to suppress low-energy secondary and
photoemission electrons. These electrons are returned to
the spacecraft and help maintain a negative potential, even
in the presence of sunlight. This is the process generally
invoked for daylight negative potentials for satellites with
insulating surfaces [Ref 28]. Th-.s development of
differential potentials, or the buildup of trapped charge is
a slow process, usually on the order of five to ten, or
more, minutes [Ref 8, p. 5657 to 5667]. It is possible that
deep dielectric charging could also lead to barriers, and
also provide a mechanism for daylight charging [Ref 23].
This is what we want to study further.
If we take the potential of a spacecraft to initially be
zero, then in one spin of the vehicle the surface charge
density, Cphot., develops from incident sunlight. Can enough
charge be trapped so that
(24) 0 deposited * Jone hourJenergetic dr a 0 photo ?
If so, we can imagine that a surface starting at * 0 will
at some point develop a net charge which can not be balanced
by photoemission in one spin period.
59
E. Summary
Lower energy ambient flux is responsible for surface
charging. This phenomena occurs in eclipse, when the
photoelectric emission is blocked. Surface charging appears
in a very short time span (T < 1 second), charges uniformly
to several keY, and returns rapidly to equilibrium potential
when photoemission is restored.
A second mechanism, deep dielectric charging, occurs
when there is an energetic tail on the distribution
function. These energetic electrons bury themselves into
the dielectrics covering the satellite surface. Movement of
the electrons out of the dielectrics is slow (T can range
from seconds to several minutes). If a buildup of charge
exceeds the breakdown strength of the material, electrical
discharges may cause anomalies in satellite systems.
Associated with deep dielectric charging is the
formation of potential barriers. Upon entering sunlight,
photoelectrons emitted from the satellite surface are not
energetic enough to overcome the potential barrier, and are
returned to the satellite, thus maintaining the negative
charge. Negative potentials in the range of several hundred
volts will remain until the charge buried within the
dielectric can leak out.
60
IV. RESULTS
A. ISEE 1-Observed Integral Flux
1. Ambient Differential Energy Flux
On 17 March, 1978 (day 76), ISEE 1 transited
geosynchronous altitude during a period when high energy
electrons fluxes were observed. ISEE 1 moved through the
plasmasheet and was observed to charge to at least -70 volts
in sunlight. The time of maximum charging, near -100 volts,
was at 0300 LT. Another geosynchronous satellite, ATS 5,
was orbiting through the same plasma environment at local
midnight, and charged to -6 kV in eclipse. The indication
of charging on ATS 5, indicates that the plasma environment
was sufficiently hot for spacecraft charging [Ref 13, p.
5568 to 5578]. Recall that ATS 5 and ATS 6 are two vastly
different satellites, but charged to similar potentials in
eclipse (Figure 20).
Instrumentation on-board ISEE I included two
electron detectors, the University of Iowa LEPEDEA, and the
Medium Energy Particle Instrument, or MEPI. The LEPEDEA
detector data was taken from the radial direction, a 6*x
380solid angle. The telemetry for this data covered the 20C
eV to 45 KeY energy range in 32 steps [Frank et al., 1978].
61
The MEPI covered the 20 to 1200 KeV energy range
with eight channels. The detectors provided an angular
resolution of 10*x 450 with a geometric factor of 10-2 cm2
ster (Williams et al., 1978].
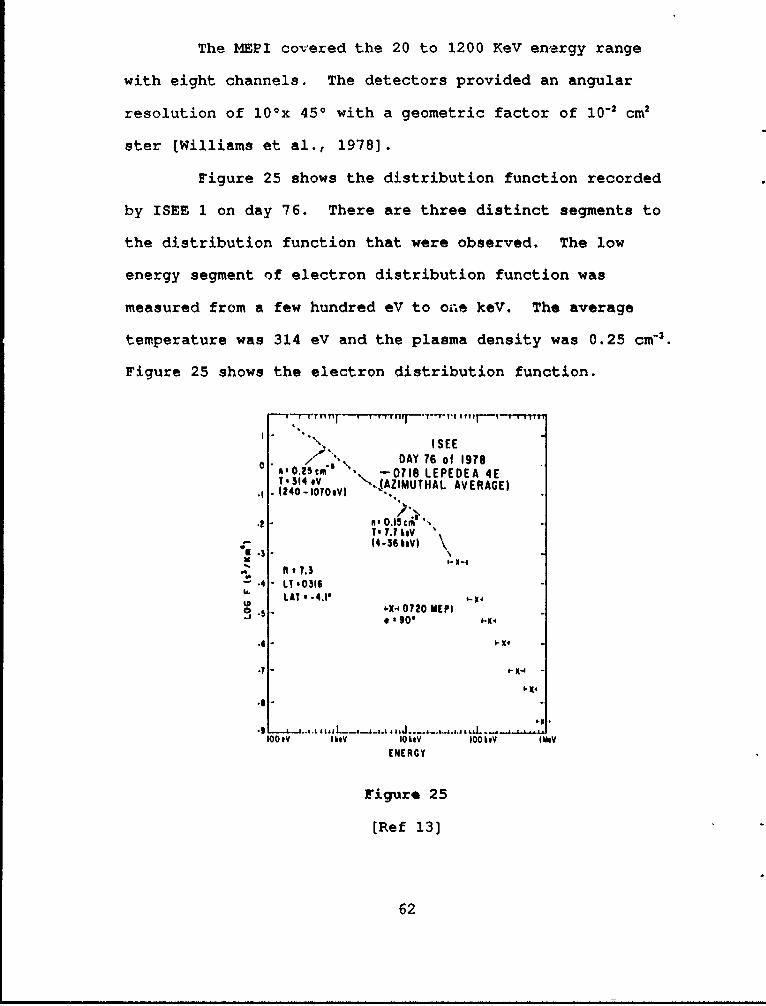
Figure 25 shows the distribution function recorded
by ISEE 1 on day 76. There are three distinct segments to
the distribution function that were observed. The low
energy segment Qf electron distribution function was
measured from a few hundred eV to oe keV. The average
temperature was 314 eV and the plasma density was 0.25 cm"3.
Figure 25 shows the electron distribution function.
DAYXI SEE0 '0. !S , DAY 76 of 1978
- 18 LEPEDEA 4E1314 eV \,,(AZIMUTHAL AVERAGE)1240 - 1070V) ..
T'77.k,'V
14-36keV1 \
• '7.3-.4 LT 0316
LAT .4.10.5 *4 0720 MEPI
8'90*
I- X4 -
X-4
OOtV lIeV 101kV 00 IeV BMOV
ENERGY
Figure 25
[Ref 13]
62

The second electron population can also be described
as a Maxwellian distribution. The average temperature of
this group of electrons is 7.7 keY and the density is 0.15
cm- . The data was collected over an energy range of 4 to
36 keV. There is a boundary between the two Maxwellian
distribution functions at 1.7 keV. The values recorded for
the energy spectrum below 40 keY are typical of the plasma
found in the plasmasheet. This data is plotted as a series
of "+" and labelled "low" and "mid" in Figure 26.
> 9 Ambient Differential Energy Flux
u 7 4:
6 +4" 5
(j,
0)
O 4_
W+
"5 3 - Low Thermol Density = 0.25 cm "' \X
C Low Plosmo Temp = 0.314 keV
2 Mid Thermol Density = 0.15 cm 3
Mid Plasmo Temp = 7.700 keV \ XEnergetic Desity, 0.002 cm 3
o 0.1 1 10 100 1000
Energy (KeY)
Figure 26
Above 40 keY, the MEPI data is plotted with "X", and
is labelled "energetic". The energy spectrum follows an
inverse power law distribution and is approximately
63
proportional to an E-' distribution function. To smoothly
connect the mid-Maxwellian and the energetic distribution
functions, an energetic density of 0.002 cm-3 was fitted.
This fit agrees with the previous work done (Ref 23].
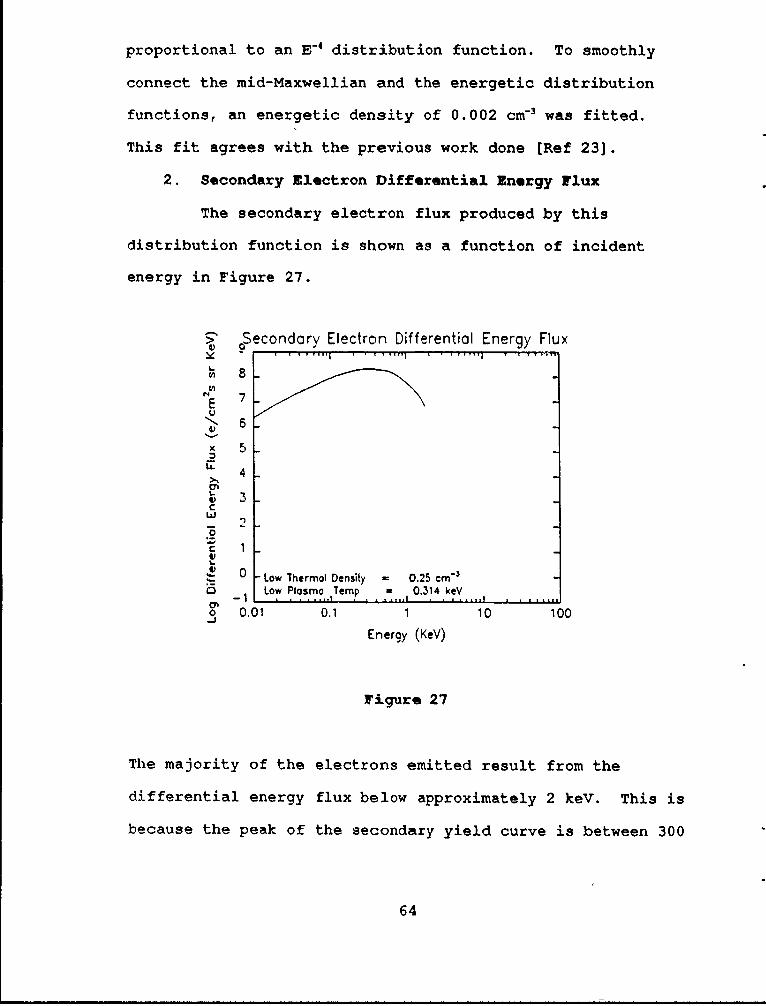
2. Secondary Electron Differential Energy Flux
The secondary electron flux produced by this
distribution function is shown as a function of incident
energy in Figure 27.
econdory Electron Differentiol Energy Flux
8
E 7UN 6
x 54
3C
,t 1_
Low Thermol Density = 0.25 cm 3
o Low Plasm , emp ,=, 0.314 keVo 0.01 0.1 1 10 100-J
Energy (KeV)
Figure 27
The majority of the electrons emitted result from the
differential energy flux below approximately 2 key. This is
because the peak of the secondary yield curve is between 300
64
and 400 eV. This corresponds to the peak in the low energy
segment of the incident flux (Figure 26). The flux due to
secondary emission is higher than the ambient flux. For 0
to 1.5 keV, the peak incident flux is 1 x 10⁸ e/(cm2 s sr
keV) and the peak outgoing secondary flux is 4 x 10 e/(cm2
s sr keV).
This reflects the fact that the low energy segment
of the differential energy flux is between the first and
second crossover energies for this satellite material, as
seen in Figure 17. This shows that for low energy electrons
in the ambient differential energy flux incident onto the
spacecraft surface, the secondary yield differential energy
flux over-balances the incident flux.
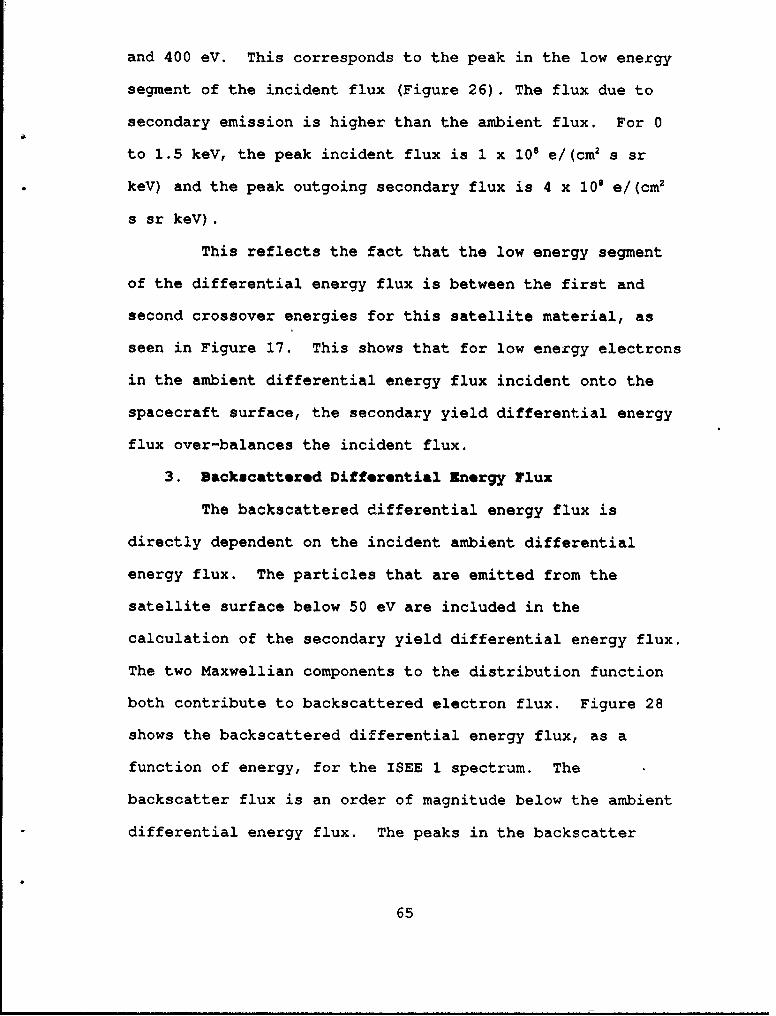
3. Backscattered Differential Energy Flux
The backscattered differential energy flux is
directly dependent on the incident ambient differential
energy flux. The particles that are emitted from the
satellite surface below 50 ev are included in the
calculation of the secondary yield differential energy flux.
The two Maxwellian components to the distribution function
both contribute to backscattered electron flux. Figure 28
shows the backscattered differential energy flux, as a
function of energy, for the ISEE 1 spectrum. The
backscatter flux is an order of magnitude below the ambient
differential energy flux. The peaks in the backscatter
65
curve correspond with the peaks in the incident spectrum
because the yield curve is relative flat. The net effect of
backscattering is to reduce the net current due to the
ambient (0 to 40 keV) electrons by a factor of 10% to 20%.
I> Back Scattered Differential Energy Flux
L 89
I I fi l[I
I I ' , i I I I I I
U, 3
E
4
3C
2
C 1 _Low Thermal Density = 0.25 cm-
0Low Plasma Temp = 0.314 keV0 _ Mid Thermal Density = 0.15 cm "3
C Mid Plasma Temp = 7.700 keVIII I . ..... I I , , l, I I,, I, ... I . . . ,
o 0.01 0.1 1 10 100 1000
Energy (KeV)
Figure 28
For more energetic electrons, the influence of
surface atom interaction will decrease and they will be more
likely to bury themselves into dielectric surfaces, as shown
66
in Figure 22. The remaining calculations, therefore, are
associated with correctly determning the deposited charge.
To do this we need to determine the radiation-induced
conductivity.
4. Radiation-Induced Conductivity
Incident solar radiation onto dielectric materials
on spacecraft surfaces will, over time, cause the RIC of the
surface to change. The change in conductivity directly
effects the rate at which charge that enters the dielectric
material when energetic electrons bury themselves, leaks
out. This, in turn, helps determine whether enough charge
can build up in the dielectric to surpass the dielectric
breakdown threshold and cause an electrical discharge. The
energetic portion of the differential energy flux is shown
in Figure 29, in units of e/(cm 2 s MeV), from 10 to 200 keV.
Calcula\ion of RIC requires a calculation of dose.
This is done by convolving the energetic current density,
J(E), the collisional stopping power (Figure 23), and the
specific thickness curve (Figure 24) to obtain the
differential dose rate (gm sec) -. Integrating the
differential dose rate from 10 to 450 keV gives the dose
rate in MeV/(gm sec). Figure 30 shows a graph of the
penetration depth, in cm, of energetic electrons as a
function of the incid,;nt dose rate.
67
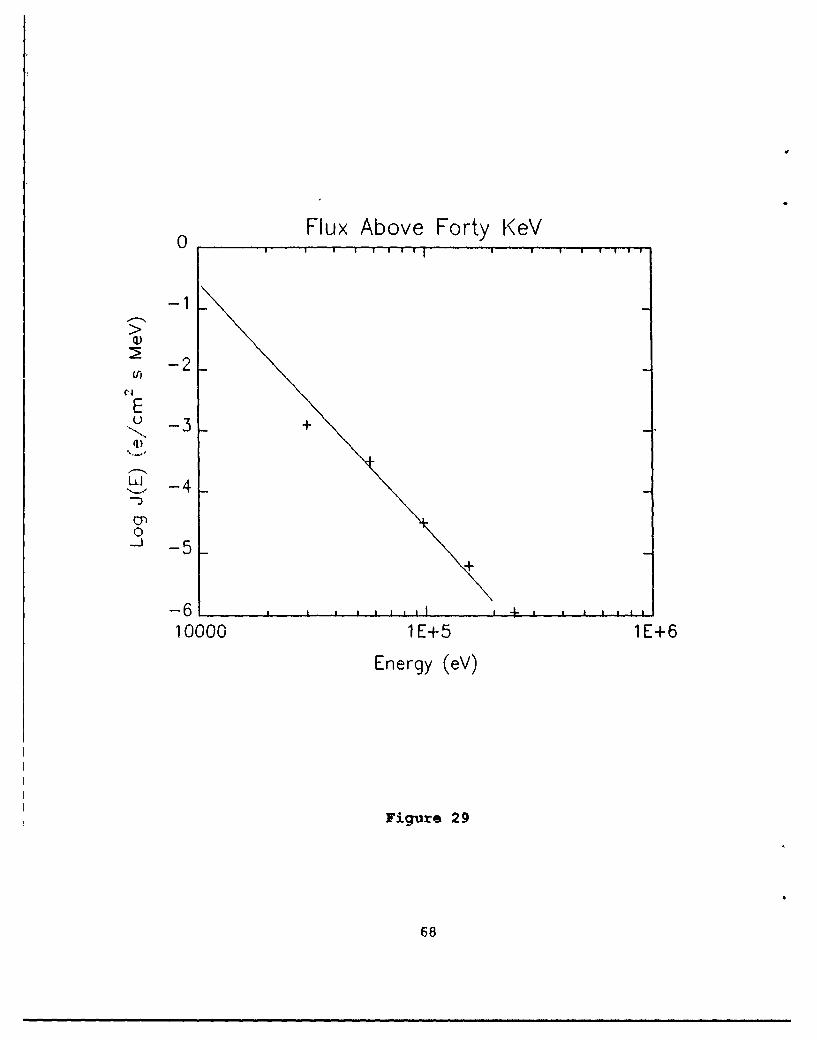
Flux Above Forty, KeV
-2
E-3 +
S-4
0-J-5
-6 j
10000, 1 E±5 1E+6Energy (eV)
Tigr. 29
68
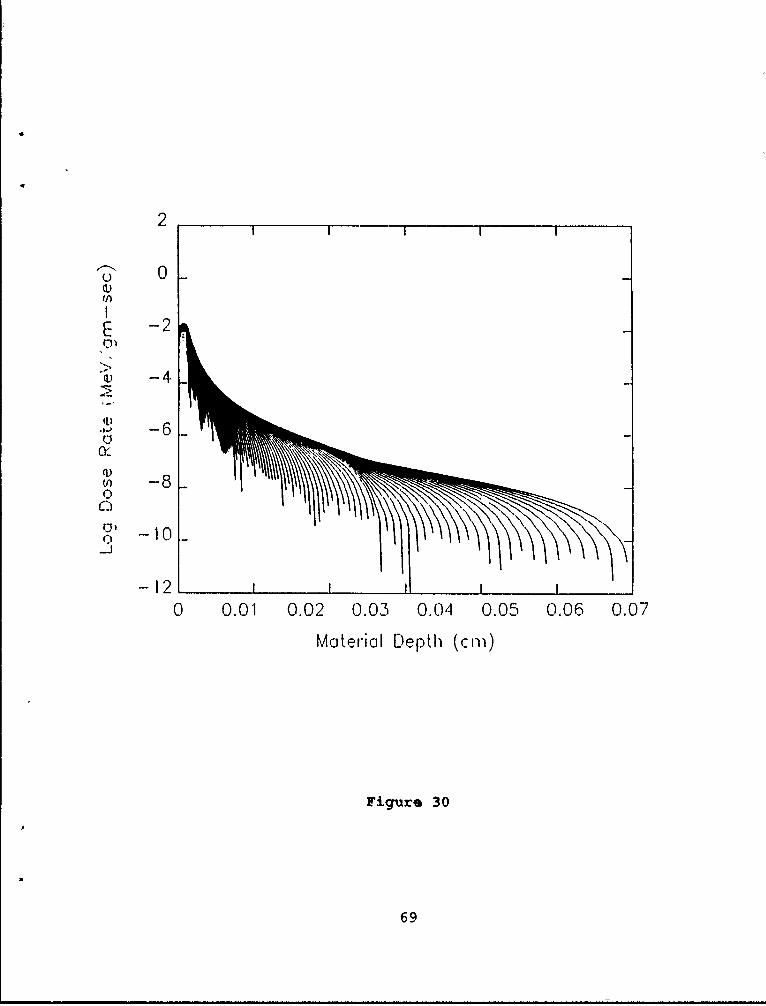
2
u 0
-2
L) -4
(1)V) -8
S-10.
-1210 0.01 0.02 0.03 0.04 0.05 O06 0.07
Material Depth (cm))
Figrure 30
69
The figure shows an overlay of different energies
and how far into the dielectric material they penetrate,
The lowest energy was 10 keV and the highest was 450 keV.
The dielectric material used for this graph was borosilicate
glass. An upper bound of 230 key was used as it is the
maximum energy incident onto a .03 cm solar array cover cell
that will deposit itself into the material. Higher energy
electrons will pass through the cover cells and into the
body of the spacecraft.
The integrated dose rate for the 0.03 cm dielectric,
is - 0.06 rad/sec. Multiplying this dose rate by the
largest value in table 5 ( = 10"6 sec/(Q cm rad) gives
URxc = 6 x 10- (fl cm) - . The value of 0Y for Corning 7940
glass is 1 x 10 - 15 (Q cm) -1 [Ref 41, p. 141]. The
conductivity change from radiation is - two orders of
magnitude below the intrinsic conductivity of the
dielectric. This shows that RIC is an minor factor in the
overall deposition of charge and, for the purposes of this
thesis, RIC can be ignored.
5. Surface Charge
The distribution function for day 76, as shown in
Figure 25, was used to calculate the flux components through
the satellite surface. Table 6 shows the flux components
and their respective contributions to the net flux. The
table is organized as follows. The ambient flux is divided
70

into three components, the low, mid, and energetic energies.
Summing each contribution gives the incident flux. That
flux which is produced from secondary emission is labelled
secondary flux. The backscatter flux is made up of two
components, the low and mid energy fluxes. The net flux is
the incident flux minus the sum of the secondary and
backscattered fluxes.
TABLE 6
COMPONENT e/m2 S x 1011
Flux < 1.7 key 7.24
Flux > 1.7 keV & < 40 keV 20.76
Flux > 40 keY 1.39
Total Incident Flux 29.4
Secondary Flux 15.9
BS Flux > .05 key & <1.7 keV .65
BS Flux > 1.7 key & < 40 keV 2.53
Total BS Flux 3.18
Net Flux 10.3
The ambient current is .47 A/m 2 . The energetic
flux alone contributes a current density of 0.022 pA/m2 , a
71
very small part of the total. Combining the secondary and
backscatter fluxes gives the amount of flux that leaves the
surface. The current density J leaving the surface is
Jbacksaott.r + ..or, = .306 pA/m2. The net current due to the
ambient electrons is approximately 0.16 pA/m 2 negative.
Hence, a glass surface in shadow should charge negatively.
The photoelectric saturation current density from Table 4 is
nominally 21 pA/m2 . This shows that when the satellite is
in sunlight, the current density from incident photons is
two orders of magnitude higher than the current due to the
plasma. Therefore, whenever the satellite is in sunlight,
the amount of charge that leaves the surface is greater than
that deposited, and the potential of the vehicle should be
positive.
If we make the assumption that the satellite exits
the midnight to dawn sector with a vehicle potential close
to zero, then the potential will become positive from
photoelectric emission in the absence of a warm/hot plasma.
The ISEE 1 period of rotation is three seconds. This means
that while in sunlight, approximately 20% to 25% of the
vehicle is in sunlight. Using equation (24) and a spin
period of three seconds, a net charge of 12.7 gC/m2 leaves
the spacecraft surface each period. This effect dominates
the other mechanisms and is responsible for maintaining the
potential close to zero in the absence of an energetic
plasma.
72
6. Deep Dielectric Charge
There is an additional aspect of the charging
process that must be considered. Energetic electrons of a
few keY and above began to bury themselves into the body of
the dielectric, where they become trapped. This buildup of
charge withi, the dielectric can deve'.op over an extended
period of time, and the associated 1,ectric fields may
surpass the breakdown dielectric strength, typically on the
order of 106 V/cm [Ref 34, p. 569 to 591]. For a 0.03 cm
cover cell, the potential threshold can be as low as 3000
volts negative, but is more likely to be higher. This has
been the focus of previous studies of deep dielectric
charging such as the one by Reagan [Ref 21]. This charge
deposition has another consequence, however.
Consider the time for the spacecraft to move through
the eclipse to be one hour. The deposited charge which
results from the "energetic" portion of the spectrum depends
on the lower limit in the integration of J(E) over E.
Previous work at the Naval Postgraduate School focused on
Exin = 100 keV. If the lower limit is reduced, a wider
energy range is included in the integration. This
substantially increases the energetic current, and hence the
deposited charge.
Figure 31 shows J(E) integrated over energy from Emn
to infinity. The data used for the calculation are from
73
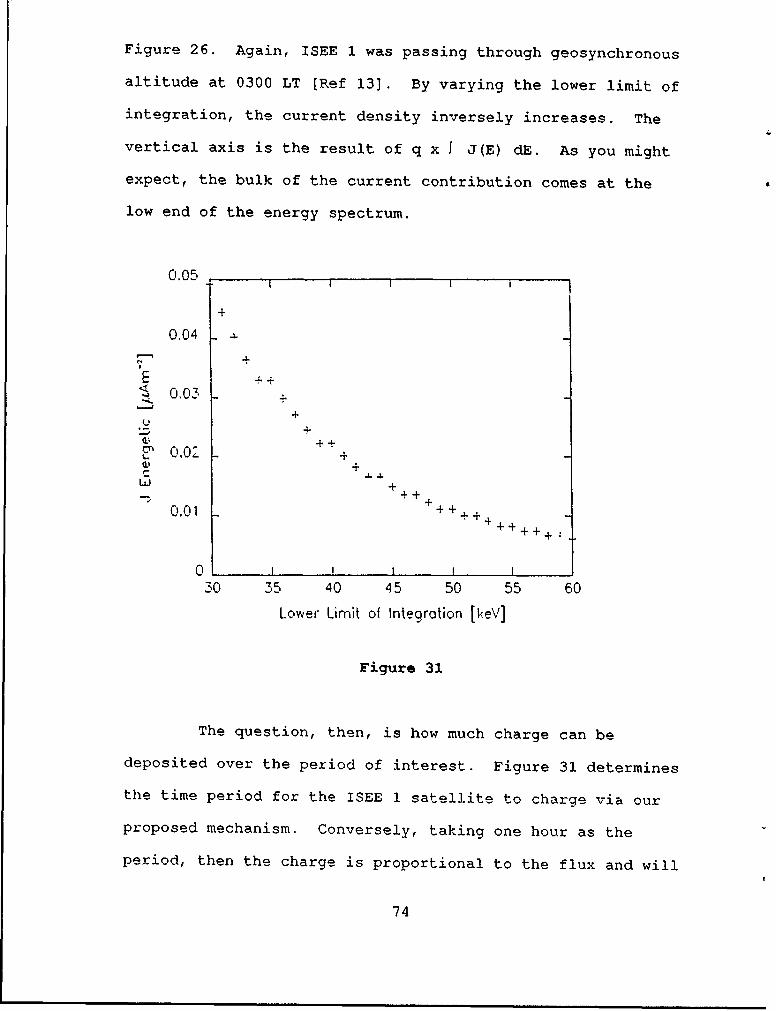
Figure 26. Again, ISEE 1 was passing through geosynchronous
altitude at 0300 LT [Ref 13]. By varying the lower limit of
integration, the current density inversely increases. The
vertical axis is the result of q x I J(E) dE. As you might
expect, the bulk of the current contribution comes at the
low end of the energy spectrum.
0.05
+
0.04 ~
E +++ 0.03+
+ +++
0 +
w + ++
0.01
0 I30 35 40 45 50 55 60
Lower Limit of Integration [keV]
Figure 31
The question, then, is how much charge can be
deposited over the period of interest. Figure 31 determines
the time period for the ISEE 1 satellite to charge via our
proposed mechanism. Conversely, taking one hour as the
period, then the charge is proportional to the flux and will
74
range from - 180 1C/m2 down to - 20 C/m 2. These numbers
are comparable to, or larger, than the net charge which is
emitted as a result of photoemission in a spin period. This
differs substantially from the previous result [Ref 23]
where the low energy limit was 100 keV. This shows that the
recommendation for further calculations at lower energies
was correct. Note that the energy range (10 to 30 keV) not
included here, will also contribute, though surface
conductivity will render these less deeply buried electrons
ineffective for long time scale processes. The inequality
in equation (24) is satisfied, indicating that the mechanism
proposed for the development of differential charge on ISEE
1 satellite should be viable.
The ISEE 1 charging event was nearly unique for this
vehicle. The reason appears to be that the energetic
electron flux was relatively high on this day. Data from a
second satellite provides selected examples of events with
very high fluxes of energetic electrons.
B. SCATHA
Reagan et al., surveyed the near-geosynchronous SCATHA
data set and identified the peak energetic flux events [Ref
21]. Figure 32 shows all of these high flux days. One of
these large events was on 29 August, 1979. The data was
recorded by the P78-2 SCATHA satellite, which was at 6.5 R,
in sunlight, and at 0230 LT. The differential flux, as
75
shown in Figure 32 for day 241a, was used here. This
energetic plasma was then compared to day 76. The energetic
current density integrated from 40 keV to 1 MeV gives
J.,orgatia = 0.235 pA/m2 . Figure 33 shows the calculations for
The energetic plasma of day 241a provided 5 times
more current than observed on ISEE 1. Such fluxes would
cause substantial charge deposition in 5 to 10 minutes.
This implies that although high, the ISEE 1 fluxes were
not record setting, and that deep dielectric charging could
become important on a time scale of - 10 minutes. Note that
on day 241a, the electron flux is very high from 4 to 40
keY. This energy range is responsible for both deep
dielectric charging and subsequent surface charging in the
SCATHA survey. Figure 34 shows the SCATHA potential on day
241a plotted against time. This event was one of largest
recorded on SCATHA.
76
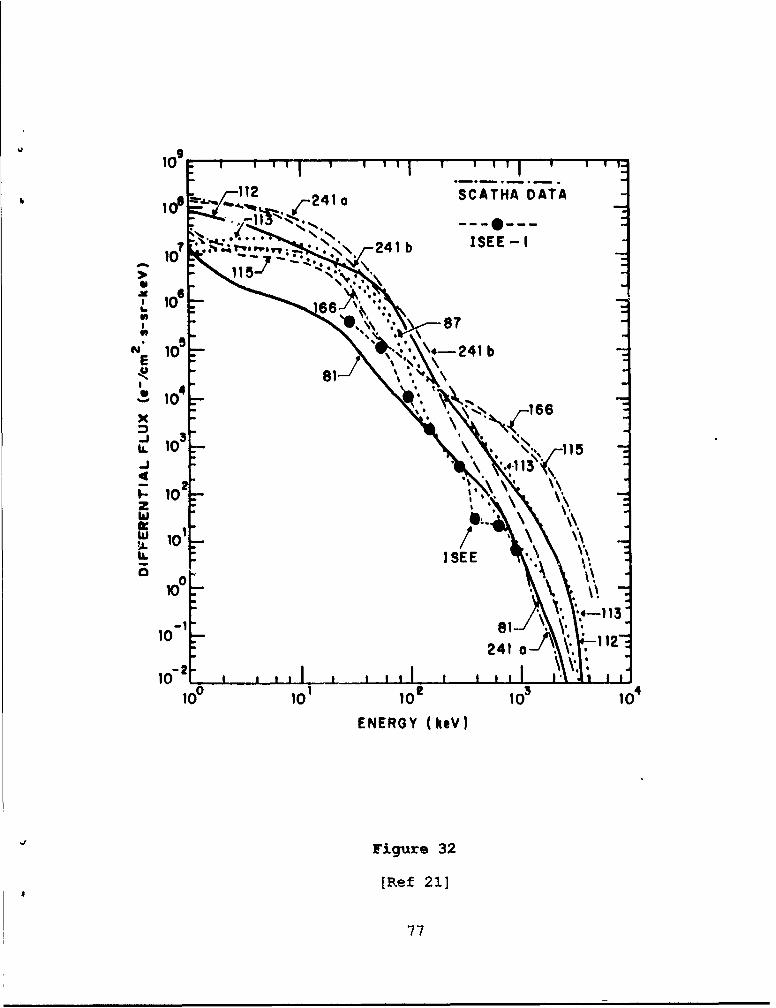
109
1124l SCATHA DATA
ITT. O*>.N\241 b ISEE- I
*16
tL 10 r 1
1-0z
0
10-
lo0 10 10 1C 1
ENERGY (key)
4 Figu~re 32
(Ref 21]
77

>9 Ambient Differential Energy Flux
E 7
"X 6
u_5LL,
4 '\
3 Low Thermal Density = 0.25 cm - S
C Low Plasma Temp = 0.314 keV'1)
2 Mid Thermal Density 0.15 cm-Mid Plasma Temp = 7.700 keV X
0 Energetic Density = 0.002 cm1 a .. 1 11111 I 1 111111 1 I 1, 1111 1 ,1.
o 0.1 1 10 100 1000-J
Energy (leV)
Figure 33
78
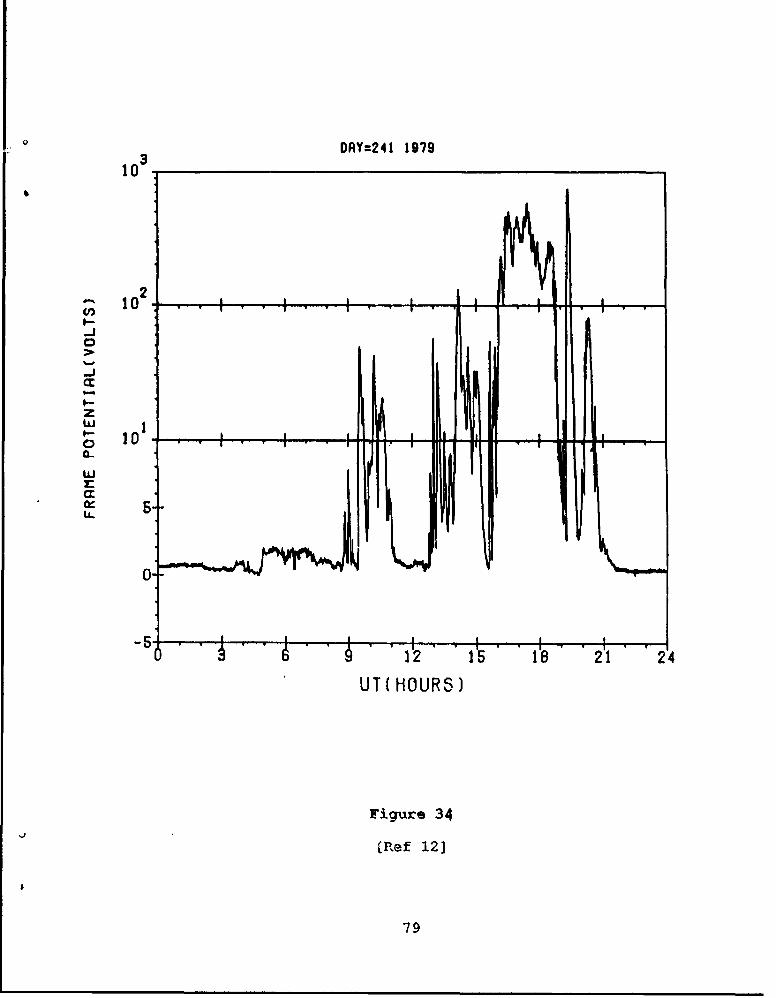
DRY=241 1979
103
-JtoI
a-J
zw
10-
0--
- 6 1 ' ' 2 " IE 'S 118 2'1 " 2 4
UT(HOURS)
Figure 34
(Ref 12]
79

V. CONCLUSIONS
Spacecraft at geosynchronous altitude encounter
energetic plasmas as they move through the plasmasheet.
These hot plasmas can effect satellite functions. EMPs
induced in spacecraft electrical systems can cause data
upsets, system resets, and even system failures.
Traditional charging studies focused on the nearly
instantaneous processes found in eclipse [Ref 7], and
daylight charging processes with time constants of minutes
[(Ref 17, Ref 8]. This work has shown that deep dielectric
charging, which occurs on time scales of many minutes, may
also be significant for daylight charging.
Deep dielectric charging, occurs when the distribution
function of the hot plasma contains electrons whose average
temperature exceeds about 10 key. This mechanism deposits
energetic electrons deep within the dielectric materials on
the satellite surface. The charge deposited within the
dielectric remains stationary, leaking out over a period of
many hours. This buildup of charge within the dielectrics
is independent of the other processes involving the surface.
The critical question is, if more charge can be
deposited in an hour or less than emitted from the surface
80

in ove spin of the satellite, will an isolated segment of
dielectric develop a net negative charge?
Records from very energetic plasmas were examined. Data
from ISEE 1 daylight negative potential event and the record
daylight event for SCATHA were studied. The ISEE data
showed that if 40 to 250 keV electrons are considered,
sufficient charge is deposited in an hour to result in a net
negative charge. The five times higher fluxes observed on
SCATHA would reduce the charging time scale to a few
Minutes..
Deep dielectric charging is important and may determine
the daylight potential behavior of geosynchronous
satellites. In particular, it may provide c charging
mechanism for rapidly spinning satellites, which do not
otherwise have the tendency to diffei±entially charge.
81
VI. RECOMMENDATIONS
Follow up work should focus on the mechanism by which 10
keV to 200 keV electrons bury themselves into dielectric
materials. Modelling of the process would produce numerical
values that should be compared to recorded charging events
and the attendant electron distribution function. The
speculation that deep dielectric charging will lead to
daylight negative potentials needs to be studied via
modelling.
82
LIST OF REFERENCES
1. Robinson Jr., P. A., "Spacecraft Environmental AnomaliesHandbook", Jet Propulsion Laboratory, CaliforniaInstitute of Technology, August, 1989, for GeophysicsLaboratory, Hanscom AFB, Massachusetts.
2. McIlwain, C. E., Coordinates for mapping thedistribution of magnetically-trapped particles, Journalof Geophysical Research, vol. 66, 1961.
3. Parks, G. K., "Physics of Space Plasmas", Addison-Wesleytublishing Company, 1991.
4. Deforest, S. and McIlwain, C. E., Plasma Clouds in theMagnetosphere, Journal Of Geophysical Research, vol. 76,1971.
5. Fredricks, R. W. and Scarf, F. L., Observations ofSpacecraft Charging Effects in Energetic Plasma Regions,Proceedings of the 6th ESLAB Symposium, Noordwijk, TheNetherlands, edited by R. J. L. Grard, 26 - 29September, 1972.
6. Baker, D. N., et al, Hostile Energetic ParticleRadiation Environments in Earth's Outer Magnetosphere,The Aerospace Environment at High Altitudes and itsImplications for Spacecraft Charging and Communications,AGARD Conference Proceedings No. 406, The Hague, TheNetherlands, 1986.
7. Deforest, S.E., Spacecraft Charging at SynchronousOrbits, Journal of Geophysical Research, vol. 77, 1972.
8. Olsen, R. C., and Purvis, C. K., Observations ofCharging Dynamics, Journal of Geophysical Research, vol.88, 1983.
9. Deforest, S. E., Electrostatic Potentials Developed byATS-5, Photon and Particle Interactions with Surfaces inSpace, Proceedings of the 6th ESLAB Symposium,Noordwijk, The Netherlands, edited by R. J. L. Grard, 26- 29 September, 1972.
83
10. Olsen, R. C., Record Charging Events from AppliedTechnology Satellite 6, Journal of Spacecraft andRockets, Vol. 24, 1987.
11. Reasoner, D. L. et al., Relationship Between ATS-6Spacecraft-Charging Occurrences and Warm PlasmaEncounters, Progress in Astronautics and Aeronautics,edited by A. Rosen, vol. 47, 1976.
12. Mullen, E. G. et al, SCATHA Survey of High-LevelSpacecraft Charging in Sunlight, Journal Of Geophysicalresearch, Vol. 91, 1986.
13. Olsen, R. C. and Whipple, E. C., An Unusual ChargingEvent on ISEE I, Journal of Geophysical Research, vol.93, 1988.
14. Frooninckx, T. B. and Sojka, J. J., Solar CycleDependence of Spacecraft Charging in LEO, Journal ofGeophysical Research, 1991.
15. Whipple Jr., E. C., Observation of Photoelectrons andSecondary Electrons Reflected from a Potential Barrierin the Vicinity of ATS 6, Journal of GeophysicalResearch, vol. 81, 1976.
16. Olsen, R. C. et al, Observation of Dynamic ChargingEffects on ATS 6, Journal of Geophysical Research, Vol.86, 1981.
17. Katz, I. et al., Secondary Electron generation, Emissionand Transport: Effects on Spacecraft Charging and NASCAPModels, The Aerospace Environment at High Altitudes andits Implications for Spacecraft Charging andCommunications, AGARD Conference Proceedings No. 406,The Hague, The Netherlands, 1986.
18. Mizera, P. F., Charging Results from the SatelliteSurface Potential Monitor, Journal of Spacecraft, vol.18, no. 6, 1980.
19. Koons, H. C. et al, Severe Spacecraft charging Event onSCATHA in September 1982, Journal of Spacecraft, vol.18, no. 6, 1980.
20. Vampola, A. L., Thick Dielectric Charging on High-Altitude Spacecraft, Journal of Electrostatics, vol. 20,1987.
84
21. Reagan, J. B. et al, Space Charging Currents and TheirEffects on Spacecraft Systems, IEEE Transactions ofElectrical Insulation, vol. EI-18, June, 1983.
22. Olsen, R.C., private communication.
23. Young, M. E., Dielectric Charging as a Catalyst to theFormation of Potential Barriers on Synchronous OrbitSatellites, Master's Thesis, Naval Postgraduate School,Monterey, California, March, 1990.
24. Garrett, H. B., Spacecraft Charging: A Review, Progressin Astronautics and Aeronautics, vol. 71, 1980.
25. Olsen, R. C., Differential and Active Charging Resultsfrom the ATS Spacecraft, Ph.D. Dissertation, Universityof California, San Diego, San Diego, California, 1980.
26. Olsen, R. C., A Threshold Effect for SpacecraftCharging, Journal of Geophysical Research, vol. 88,1983.
27. Sternglass, E. J., Secondary Electron Emission andAtomic Shell Structure, Physics Review, No. 80, 1950.
28. Katz, I et al., A Three Dimensional Dynamic Study ofElectrostatic Charging in Materials, NASA CR-135256,SSS-R-77-3367, 1977.
29. Darlington, E. H. and Cosslett, V. E., Backscattering of0.5 - 10 keV Electrons from solid targets, J Physical D:Applied Physics, vol. 5, 1972.
30. Grard, R. J. L., Knott, K., and Pedersen, A., Theinfluence of Photoelectron and Secondary ElectronEmission on Electric Field Measurements in theMagnetosphere and Solar Wind, Proceedings of the 6thESLAB Symposium, Noordwijk, The Netherlands, edited byR. J. L. Graid, 26 - 29 September, 1972.
31. Whipple, E. C., The Equilibrium Electric Potential of aBody in the Upper Atmosphere and in InterplanetarySpace, Ph.D. Dissertation, George Washington University,Washington, D.C., June, 1965.
32. Rudie, N. J., Principles and Techniques of RadiationHardening, vol. I, Western Periodicals Company, 1986.
85
33. Wenaas, E. P., Spacecraft Charging Effects by the High-Energy Natural Environment, IEEE Transactions on NuclearScience, vol. 24, 1977.
34. Wall, J. A., et al., Results of Literature Search onDielectric Properties and Electron Interaction PhenomenaRelated to Spacecraft Charging, Proceedings of theSpacecraft Charging Technology Conference, edited byPike, C. P. and Lovell, R. R., AFGL-TR-77-0051, 1977.
35. Berger, M. J. and Seltzer, S. M., Stopping Powers andRanges of Electrons and Positrons (2nd Ed.), U. S.Department of Commerce, NSBIR 82-2550-A, 1982.
36. Meulenberg Jr., A. Evidence for a New DischargeMechanism for Dielectrics in a Plasma, Progress inAstronautics and Aeronautics, vol. 47, 1976.
37. Frederickson, D. B. et al., Spacecraft DielectricMaterial Properties and Spacecraft Charging, Progress inAstronautics and Aeronautics, M. Summerfield, SeriesEditor-in-Chief, vol. 107, 1986.
38. Olsen, R. C., Modification of Spacecraft Potentials byThermal Electron Emission on ATS-5, Journal ofSpacecraft and Rockets, Vol. 16, no. 6, 1981.
39. Lai, S. T. et al., The Concepts of Critical Temperatureand Energy Cutoff of Ambient Electrons in High VoltageCharging of Spacecraft, Proceedings of the 6th ESLABSymposium, Noordwijk, The Netherlands, edited by R. J.L. Grard, 26 - 29 September, 1972.
40. Olsen, R. C., McIlwain, C. E., and Whipple, Jr., E. C.,Observations of Differential Charging on ATS 6, Journalof Geophysical Research, vol. 86, 1981.
41. Reitz, J. R., Milford, F. J., and Christy, R. W.,Foundations of Electromagnetic Theory, Addison-Wesley,1980.
86
INITIAL DISTRIBUTION LIST
1. Defense Technical Information Center 2Cameron StationAlexandria, Virginia 22304-6145
2. Commandant of the Marine Corps 1Code TE 06Headquarters, U.S. Marine CorpsWashington, D. C. 20380-0001
3. Superintendent 2Attn: Library, Code 52Naval Postgraduate SchoolMonterey, California 93943-5000
4. Department Chairman, Code PH 1Department of PhysicsNaval Postgraduate SchoolMonterey, California 93943-5000
5. Dr. R. C. Olsen, Code PH/OS 4Department of PhysicsNaval Postgraduate SchoolMonterey, California 93943-5000
6. Dr. X. K. Maruyama, Code 61MX 1Department of PhysicsNaval Postgraduate SchoolMonterey, California 93943-5000
7. Capt. D. S. Smith 2P.O. Box 8152Truckee, California 96162-8152
8. Dr. E. C. Whipple 1NASA/HQ 155Washington, D. C. 20546
9. Mr. Gracen Joiner 1Code 1114 SpOffice of Naval Research800 N. Quincy StreetArlington, Virginia 22217
87