NAVAL POSTGRADUATE SCHOOL · 5. Clear Performance Metrics (Sigma Levels, Defects per ... V. CHANGE...
107
NAVAL POSTGRADUATE SCHOOL MONTEREY, CALIFORNIA MBA PROFESSIONAL REPORT STRATEGIC ASSESSMENT OF LEAN SIX SIGMA PRACTICALITY IN THE TURKISH ARMY December 2015 By: Sadik Dogan Sinan Kose Osman Ertugal Advisors: Bryan J. Hudgens Uday M. Apte Approved for public release; distribution is unlimited
Transcript of NAVAL POSTGRADUATE SCHOOL · 5. Clear Performance Metrics (Sigma Levels, Defects per ... V. CHANGE...

NAVAL POSTGRADUATE
SCHOOL
MONTEREY, CALIFORNIA
MBA PROFESSIONAL REPORT
STRATEGIC ASSESSMENT OF LEAN SIX SIGMA PRACTICALITY IN THE
TURKISH ARMY
December 2015
By: Sadik Dogan Sinan Kose Osman Ertugal
Advisors: Bryan J. Hudgens
Uday M. Apte
Approved for public release; distribution is unlimited

THIS PAGE INTENTIONALLY LEFT BLANK

i
REPORT DOCUMENTATION PAGE Form Approved OMB No. 0704–0188
Public reporting burden for this collection of information is estimated to average 1 hour per response, including the time for reviewing instruction, searching existing data sources, gathering and maintaining the data needed, and completing and reviewing the collection of information. Send comments regarding this burden estimate or any other aspect of this collection of information, including suggestions for reducing this burden, to Washington headquarters Services, Directorate for Information Operations and Reports, 1215 Jefferson Davis Highway, Suite 1204, Arlington, VA 22202-4302, and to the Office of Management and Budget, Paperwork Reduction Project (0704-0188) Washington, DC 20503. 1. AGENCY USE ONLY (Leave blank)
2. REPORT DATE December 2015
3. REPORT TYPE AND DATES COVERED MBA professional report
4. TITLE AND SUBTITLE STRATEGIC ASSESSMENT OF LEAN SIX SIGMA PRACTICALITY IN THE TURKISH ARMY
5. FUNDING NUMBERS
6. AUTHOR(S) Sadik Dogan, Sinan Kose and Osman Ertugal
7. PERFORMING ORGANIZATION NAME(S) AND ADDRESS(ES) Naval Postgraduate School Monterey, CA 93943-5000
8. PERFORMING ORGANIZATION REPORT NUMBER
9. SPONSORING /MONITORING AGENCY NAME(S) AND ADDRESS(ES)
N/A
10. SPONSORING / MONITORING AGENCY REPORT NUMBER
11. SUPPLEMENTARY NOTES The views expressed in this thesis are those of the author and do not reflect the official policy or position of the Department of Defense or the U.S. Government. IRB Protocol number NPS.2015.0060-IR-EMZ-A 12a. DISTRIBUTION / AVAILABILITY STATEMENT Approved for public release; distribution is unlimited
12b. DISTRIBUTION CODE
13. ABSTRACT (maximum 200 words)
Lean Six Sigma (LSS) has proven to be a very effective method of continuous process and quality improvement in the private sector for the last several decades. The achievement acknowledged by top companies like General Electric, Toyota, Motorola, and Raytheon Corporation has also propelled the utilization of LSS in the U.S. Department of Defense (DOD). The DOD has obtained successful results from LSS implementation in selected Army depots and arsenal facilities, Navy maintenance, and Air Force Material Command.
There has also been growing interest in the Lean Six Sigma concept in Turkish private industry since the 1990s. However, the Turkish military has not yet become acquainted with LSS. In this respect, the primary goal of this study is to introduce the LSS method, deliver examples of LSS implementation, and inquire into the practicality of LSS in the Turkish army. We conducted a survey to measure the organizational readiness to change and continuous improvement for Lean Six Sigma implementation with Turkish and U.S. students at the Naval Postgraduate School. The survey results indicate that there is no significant cultural difference between the U.S. and Turkish military organizations that likely would hinder the successful implementation of LSS. This report discusses the findings of the survey and concludes with recommendations and managerial guidelines for an effective practice of LSS in the Turkish army.
14. SUBJECT TERMS Lean Six Sigma, Turkish army, cultural difference, continuous quality improvement, organizational readiness for change
15. NUMBER OF PAGES
107 16. PRICE CODE
17. SECURITY CLASSIFICATION OF REPORT
Unclassified
18. SECURITY CLASSIFICATION OF THIS PAGE
Unclassified
19. SECURITY CLASSIFICATION OF ABSTRACT
Unclassified
20. LIMITATION OF ABSTRACT
UU NSN 7540–01-280-5500 Standard Form 298 (Rev. 2–89) Prescribed by ANSI Std. 239–18

ii
THIS PAGE INTENTIONALLY LEFT BLANK

iii
Approved for public release; distribution is unlimited
STRATEGIC ASSESSMENT OF LEAN SIX SIGMA PRACTICALITY IN THE TURKISH ARMY
Sadik Dogan, Captain, Turkish army Sinan Kose, First Lieutenant, Turkish army
Osman Ertugal, First Lieutenant, Turkish army
Submitted in partial fulfillment of the requirements for the degree of
MASTER OF BUSINESS ADMINISTRATION
from the
NAVAL POSTGRADUATE SCHOOL December 2015
Approved by: Bryan J. Hudgens, Lead Advisor Uday M. Apte, Support Advisor Rene Rendon Academic Associate, Graduate School of Business and Public Policy Jim Hitt Academic Associate, Graduate School of Business and Public Policy

iv
THIS PAGE INTENTIONALLY LEFT BLANK

v
STRATEGIC ASSESSMENT OF LEAN SIX SIGMA PRACTICALITY IN THE TURKISH ARMY
ABSTRACT
Lean Six Sigma (LSS) has proven to be a very effective method of continuous
process and quality improvement in the private sector for the last several decades. The
achievement acknowledged by top companies like General Electric, Toyota, Motorola,
and Raytheon Corporation has also propelled the utilization of LSS in the U.S.
Department of Defense (DOD). The DOD has obtained successful results from LSS
implementation in selected Army depots and arsenal facilities, Navy maintenance, and
Air Force Material Command.
There has also been growing interest in the Lean Six Sigma concept in Turkish
private industry since the 1990s. However, the Turkish military has not yet become
acquainted with LSS. In this respect, the primary goal of this study is to introduce the
LSS method, deliver examples of LSS implementation, and inquire into the practicality of
LSS in the Turkish army. We conducted a survey to measure the organizational readiness
to change and continuous improvement for Lean Six Sigma implementation with Turkish
and U.S. students at the Naval Postgraduate School. The survey results indicate that there
is no significant cultural difference between the U.S. and Turkish military organizations
that likely would hinder the successful implementation of LSS. This report discusses the
findings of the survey and concludes with recommendations and managerial guidelines
for an effective practice of LSS in the Turkish army.

vi
THIS PAGE INTENTIONALLY LEFT BLANK

vii
TABLE OF CONTENTS
I. THE TURKISH EXPERIENCE WITH SIX SIGMA ........................................1
II. SIX SIGMA LITERATURE REVIEW ...............................................................5 A. SIX SIGMA: STATISTICAL DEFINITION ..........................................5 B. SIX SIGMA PROGRAM: DEFINITION AND
INTERPRETATIONS ...............................................................................9 C. HISTORY AND EVOLUTION OF SIX SIGMA .................................10 D. SIX SIGMA AS A STRUCTURED IMPROVEMENT
METHODOLOGY: DEFINE-MEASURE ANALYZE-IMPROVE-CONTROL (DMAIC) .........................................................11
E. SIX SIGMA AS A QUALITY/PROCESS IMPROVEMENT STRATEGY..............................................................................................14
F. SIX SIGMA: SUCCESS DRIVING ELEMENTS AND CLAIMED DIFFERENCES ...................................................................16 1. Leadership Commitment and Top-Down Initiation of the
Implementation ............................................................................17 2. A Structured Organizational Workforce Infrastructure .........17 3. A Disciplined Approach to Process Management and
Structured Deployment of Tools.................................................18 4. Customer-Driven Approach .......................................................18 5. Clear Performance Metrics (Sigma Levels, Defects per
Million Opportunities) .................................................................19 6. Fact- and Data-Based Decisions .................................................19 7. Result-Oriented Approach ..........................................................19 8. Business-Oriented Approach ......................................................20 9. Intensive Training ........................................................................20
G. LEAN PRODUCTION ............................................................................20 H. LEAN SIX SIGMA ..................................................................................21
III. EXAMPLES OF LEAN SIX SIGMA IMPLEMENTATION IN THE MILITARY ...........................................................................................................23 A. ARMY IMPLEMENTATIONS ..............................................................23 B. NAVY IMPLEMENTATION .................................................................24 C. AIR FORCE IMPLEMENTATIONS ....................................................25
IV. CULTURAL DISTANCE ...................................................................................27 A. POWER DISTANCE INDEX (PDI) ......................................................28
viii
B. INDIVIDUALISM VERSUS COLLECTIVISM (IDV) .......................28 C. MASCULINITY VERSUS FEMININITY (MAS) ...............................28 D. UNCERTAINTY AVOIDANCE INDEX (UAI) ...................................28 E. LONG TERM ORIENTATION VERSUS SHORT TERM
NORMATIVE ORIENTATION (LTO) ................................................29 F. INDULGENCE VERSUS RESTRAINT (IND) ....................................29
1. Power Distance .............................................................................30 2. Individualism ................................................................................31 3. Masculinity ...................................................................................31 4. Uncertainty Avoidance ................................................................31 5. Long Term Orientation ...............................................................31 6. Indulgence .....................................................................................31
V. CHANGE MANAGEMENT AND LEAN SIX SIGMA ...................................35 A. THE BASIS OF CHANGE MANAGEMENT ......................................35 B. APPROACHES ON MANAGING ORGANIZATIONAL
CHANGE ..................................................................................................36 1. Lewin’s Three-Step Model ..........................................................36 2. Kotter’s Eight-Step Plan for Implementing Change ................37 3. Organizational Development ......................................................38
C. CHANGE MANAGEMENT WITHIN LEAN SIX SIGMA ................38 D. CHANGE MANAGEMENT AND LSS READINESS .........................39
VI. RESEARCH METHODOLOGY .......................................................................43 A. INTRODUCTION....................................................................................43 B. SURVEY GOALS ....................................................................................43 C. SURVEY DESIGN ...................................................................................44 D. SURVEY PARTICIPANTS ....................................................................45 E. METHOD OF ANALYSIS......................................................................46 F. SURVEY LIMITATIONS.......................................................................47
VII. RESULTS AND ANALYSIS ..............................................................................49 A. INTRODUCTION....................................................................................49 B. RESULTS .................................................................................................51
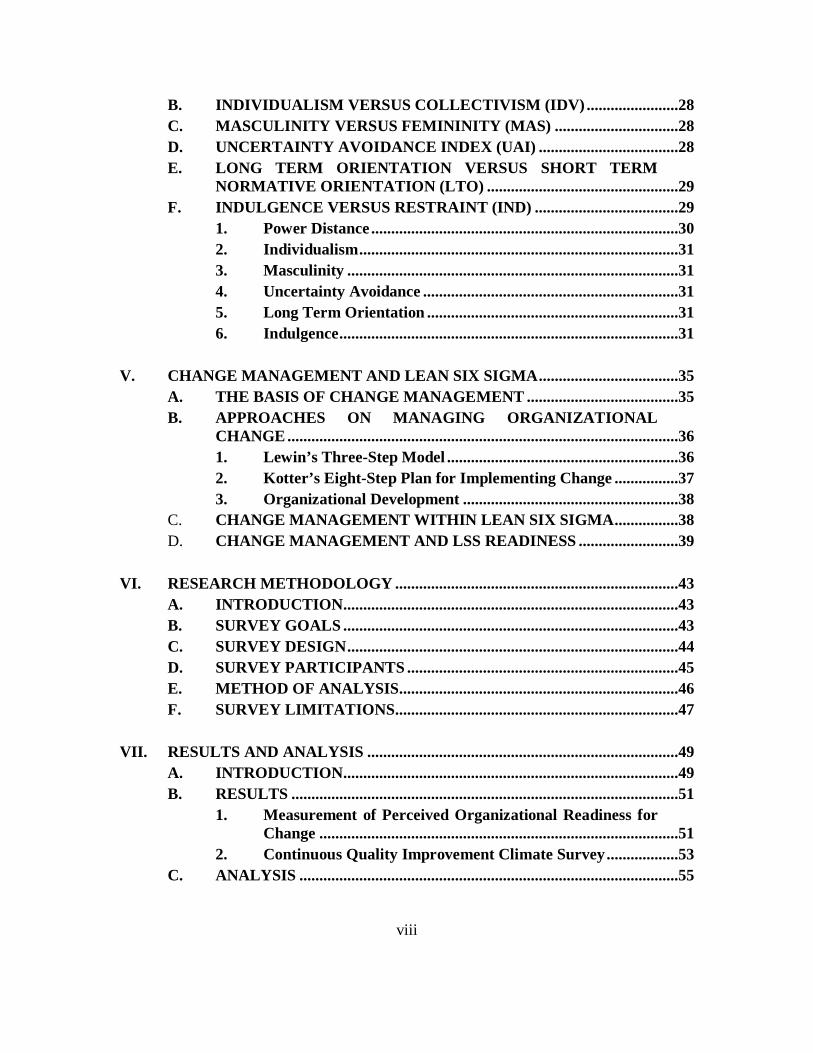
1. Measurement of Perceived Organizational Readiness for Change ..........................................................................................51
2. Continuous Quality Improvement Climate Survey ..................53 C. ANALYSIS ...............................................................................................55

ix
1. Measurement of Perceived Organizational Readiness for Change ..........................................................................................55 a. Commitment of Senior Management to the Change .......56 b. Competence of Change Agents .........................................57 c. Support of Immediate Manager .......................................59 d. Poor Communication of Change ......................................61 e. Adverse Impact of the Change on Work ..........................63
2. Continuous Quality Improvement Climate Survey ..................65 a. Internal Customer Focus and Use of Team Process .......65 b. Understanding of Process .................................................67 c. Use of Data in Decision Making ......................................68 d. Common Understanding of Quality and Customer’s
Wants and Needs ...............................................................69 e. Management’s Opportunity to Lead CQI ........................70
VIII. CONCLUSION AND RECOMMENDATIONS ...............................................73 A. CONCLUSION ........................................................................................73 B. RECOMMENDATIONS .........................................................................73
APPENDIX SURVEY RESULTS ..................................................................................77
LIST OF REFERENCES ................................................................................................81
INITIAL DISTRIBUTION LIST ...................................................................................87

x
THIS PAGE INTENTIONALLY LEFT BLANK

xi
LIST OF FIGURES
Figure 1. A Centered Process ( , ) .....................................................6
Figure 2. A 1.5 Sigma Off-Centered Process ( , ) .............................6
Figure 3. Six Sigma Data Types ................................................................................13
Figure 4. Six Sigma Improvement Framework .........................................................14
Figure 5. Turkey Country Comparison .....................................................................30
Figure 6. Turkey in Comparison with USA ..............................................................32
Figure 7. Six Sigma Cross Cultural Perspective .......................................................33
Figure 8. Lewin’s Three-Step Change Model ...........................................................37
Figure 9. Change Management in DMAIC ...............................................................39
Figure 10. The Readiness Assessment Model .............................................................41
Figure 11. Distribution of the Participants According to Their Service Branches......50
Figure 12. Distribution of the Participants According to Their Years of Experience..................................................................................................50
Figure 13. Comparison of Measurement of Perceived Organizational Readiness for Change Survey Results.........................................................................52
Figure 14. Comparison of CQI Climate Survey Results .............................................54
Figure 15. Comparison of PORC Survey Responses for Q1 to Q4 ............................56
Figure 16. Comparison of PORC Survey Responses for Factor 1 ..............................57
Figure 17. Comparison of PORC Survey Responses for Q5 to Q8 ............................58
Figure 18. Comparison of PORC Survey Responses for Factor 2 ..............................59
Figure 19. Comparison of PORC Survey Responses for Q9 to Q11 ..........................60
Figure 20. Comparison of PORC Survey Responses for Factor 3 ..............................61
Figure 21. Comparison of PORC Survey Responses for Q12 to Q14 ........................62
Figure 22. Comparison of PORC Survey Responses for Factor 4 ..............................63
Figure 23. Comparison of PORC Survey Responses for Q15 to Q17 ........................64
Figure 24. Comparison of PORC Survey Responses for Factor 5 ..............................65
Figure 25. Comparison of CQI Survey Results for Factor 1 .......................................66
Figure 26. Comparison of CQI Survey Results for Factor 2 .......................................67
Figure 27. Comparison of CQI Survey Results for Factor 3 .......................................69
2Cp = 2Cpk =
2Cp = 1.5Cpk =

xii
Figure 28. Comparison of CQI Survey Results forFactor 4 ........................................70
Figure 29. Comparison of CQI Survey Results for Factor 5 .......................................71
Figure 30. Lean Six Sigma Belts Hierarchy and Roles in the Organization ...............74

xiii
LIST OF TABLES
Table 1. The Number of Defectives (Pans Per Million, or ppm) for Specified Off-Centering of the Process and Quality Levels ........................................8
Table 2. NPS Turkish Students Organizational Readiness for Change Results ......77
Table 3. NPS U.S. Students Organizational Readiness for Change Results ............78
Table 4. NPS Turkish Students CQI Climate Survey Results .................................79
Table 5. NPS U.S. Students CQI Climate Survey Results .......................................80

xiv
THIS PAGE INTENTIONALLY LEFT BLANK

xv
LIST OF ACRONYMS AND ABBREVIATIONS
COPQ Cost of Poor Quality COPQ
CQI Continuous Quality Improvement
CTQ Critical to Quality
CTS Critical-to-satisfaction
DFSS Design for Six Sigma
DMADV Define, Measure, Analyze, Design, Verify
DMAIC Define, Measure, Analyze, Improve and Control
IND Indulgence versus Restraint
LSS Lean Six Sigma
OD Organizational Development
PDCA Plan-Do-Check-Act
PORC Perceived Organizational Readiness for Change
PPM Parts per Million
SME Small and Medium Size Enterprises

xvi
THIS PAGE INTENTIONALLY LEFT BLANK

xvii
ACKNOWLEDGMENTS
The project members owe a debt of gratitude. Therefore, we would like to thank
the following professors whose assistance, experience and highly valuable knowledge
made this project possible:
• Lecturer LTC Bryan J. Hudgens, USAF (Ret.): Lead advisor, mentor, primary editor, and great source of guidance, direction and knowledge.
• Professor Uday Apte: Co-advisor, mentor, and source of new ideas and direction.
We would also like to thank all our Turkish and U.S. friends at NPS for their
support to complete this research project.
Finally, we are very grateful to our families for their continuous love,
encouragement and support.

xviii
THIS PAGE INTENTIONALLY LEFT BLANK

1
I. THE TURKISH EXPERIENCE WITH SIX SIGMA
In the competitive business environment of the twenty-first century, corporations
need to be “dynamic and quickly-responsive to disturbances, which are not deterministic
functions of time, but rather, exhibit random fluctuations” (Pande, Neuman, & Cavanagh,
2000). Such a stochastic environment stimulates business into new efforts to formulate
cures which yield dramatic improvements. New approaches are being built on a set of
well-established traditional methods and tools looking at any possibility of cost-cutting
and wise use of scarce resources. Today the emerging consensus is a high rate of quality
improvement since competition in quality has become a permanent reality. Customers’
expectations of improved quality are transmitted through the entire supply chain which,
in return, necessitates increasing rates of operational performance and quality
improvement throughout the system. In such a challenging environment, statistical
methods play an ever more important role. Several quality improvement strategies
strongly rely on statistical methods. These strategies are very useful since they can guide
quality professionals through structured methodologies, including a coherent series of
steps, rules, and tools to achieve effective problem identification and a solution
framework.
One of these approaches, Six Sigma, has become a successful quality
improvement framework across corporations in the last decade. Popularized with the
Define, Measure, Analyze, Improve and Control (DMAIC) cycle, and then extended to
the Design for Six Sigma (DFSS) or Define, Measure, Analyze, Design, Verify
(DMADV) methodologies, Six Sigma methodology has experienced an exponential
growth in deployment (Pande et al., 2000).
With its high-profile adoption by industry giants such as General Electric,
Motorola, Honeywell (formerly Allied Signal), and Raytheon Corporation, business has
witnessed numerous corporations claiming notable successes from use of this
methodology. Six Sigma consulting organizations mushroomed correspondingly, and
books and information in print, in audio-visual media, and on Internet sites grew
exponentially (Goh, 2002). Many people believe that Six Sigma works well because it is

2
based on statistical science and focused on achieving business goals. It relies on project
by-project improvement and a high level of top management commitment and
involvement.
Organizations experience various outcomes from process management techniques
like Six Sigma because they do not implement the efficiency-generating practices at all
(Westpal, Gulati, & Shorteli, 1997; Zbaracki, 1998), they implement them ineffectively,
or they fail to give the new practices sufficient time to work (Sterman, Repenning, &
Kofman, 1997). Six Sigma can help organizations deal with the increasing pressure to
improve quality and customer satisfaction while decreasing costs and increasing
operational performance.
Although Six Sigma has gained popularity in business, academic research on the
methodology is limited (Linderman, Schroeder, Zaheer, & Choo, 2003). Many benefits
are attributed to implementing Six Sigma, from improving operations to reducing
variability; however, empirical data relating to Six Sigma and its benefits is limited.
There are numerous papers by practitioners and consultants recommending Six Sigma,
but empirical research on key requirements for Six Sigma is scarce. This study is
designed to supplement current research on its use in both the service sector and the
army.
Turkish industry faced the so-called Six Sigma phenomenon in the middle of the
nineties during a campaign for quality and long-term business excellence. Its expansion
was stagnant during the years before 2000. Since then, its influence has gained
acceleration for the Turkish companies that have embraced it. Initially adopted by an
organization that manufactures parts for GE, one of the Six Sigma pioneers in the world,
the methodology is also being applied by some small and medium size enterprises
(SMEs). However, the majority of SMEs either do not use the approach or consider it
unsuitable for their organizations due to financial and personal capacity restrictions. We
could not find a suitable example of Six Sigma implementation in Turkey’s service
sector. The best implementations of Six Sigma in Turkey are in manufacturing, where the
success of Six Sigma is clear in terms of the products produced and time and money
saved. However, Six Sigma is becoming increasingly important not only for SMEs,

3
which employ the greatest portion of the working population and provide the largest
portion of manufacturing output in Turkey, but also for the service-related sectors like
health care and education. SMEs, with their small but flexible structures, are more
resilient to economic disturbances and have a critical role in supplying goods and
services to large corporations. Therefore, encouraging them to implement Six Sigma can
be beneficial to both parties.
The growing interest in the Six Sigma approach in Turkey, because of its
successful implementation in many well-known Turkish companies and its spread curve
pattern similar to the one observed in the global business arena, suggests the need to
investigate the current status of Six Sigma implementations not only in Turkish industry
but also in the service sector. Based on experiences of several major world leader
organizations, both in industrial fields and in the service sector, we have derived some
recommendations for Lean Six Sigma (LSS) implementation, which can guide
organizations, including the military. Simultaneously, we sought to introduce Lean Six
Sigma phenomenon to the Turkish army by presenting the results of the implemented
practices by the Department of Defense of the United States of America. Looking at the
implementations of the best-in-class Lean Six Sigma practitioners should result in
identification of key success factors which will be useful in applying the fundamental
rules for quality improvement.
Since Lean Six Sigma is a new phenomenon to Turkish private industry, in the
Turkish army, there are no studies related to implementation of Lean Six Sigma. Thus,
we first needed to determine whether the Turkish military mindset would be open to a
new concept in quality improvement methodology, so we conducted a survey. To observe
the differences between the cultures of Turkey and the United States, we conducted our
survey among the Turkish and U.S. military resident students at the Naval Postgraduate
School.

4
THIS PAGE INTENTIONALLY LEFT BLANK

5
II. SIX SIGMA LITERATURE REVIEW
Six Sigma claims to improve process or product quality. Although a unique
definition of quality cannot be made, since different meanings can be assigned to this
concept depending on the context and content in which it is used, it is mainly associated
with meeting customer needs and expectations, fitness for use, and freedom from non-
conformances to achieve superiority to competitors.
A. SIX SIGMA: STATISTICAL DEFINITION
It is a well-known fact that “Six Sigma statistic measures the capability of the
process to perform defect-free work” (Jackson, 2006). Assuming that a typical process is
likely to “deviate from its natural centering conditions by approximately 1.5 standard
deviations at any given moment” in time such that the mean no longer equals the target,
the tolerance limits are set to for a Six Sigma process (“What is Six Sigma,” 2015).
That means that the edge of the process distribution ends at 4.5 from the shifted
process mean. Figure 1 displays short-term performance of a single Critical-to-Quality
(CTQ) characteristic when the Six Sigma process is centered, while Figure 2 illustrates
the long-term performance of the same process, which shows 1.5 sigma shifts after the
influence of process factors such as tool wear, machine set-up, and operators.
The capability of a process refers to its performance when it is operating in
control. It is usually expressed in terms of a process capability ratio (Cp), as shown in the
following equation:
Equation (2.1)
The definition of the Cp given by Equation (2.1) assumes that the process is
centered (see Figure 1). If the process is off-centered (see Figure 2), then the actual
± 6δ
± δ
6USL LSLCp
δ− =

6
capability will be less than indicated by Cp, known as a measure of potential capability,
and is measured by Cpk as shown in Equation (2.2):
Figure 1. A Centered Process ( , )
Source: Ramberg, J. A. (n.d.), Six Sigma: Fad or fundamental?, retrieved June 14, 2015, from http://www.qualitydigest.com/may00/html/sixsigmapro.html
Figure 2. A 1.5 Sigma Off-Centered Process ( , )
Source: Wu, Y., (n.d.), Six sigma programs, retrieved June 14, 2015, from http://www.public.iastate.edu/~vardeman/IE361/s00mini/wu2.htm
2Cp = 2Cpk =
2Cp = 1.5Cpk =

7
Equation (2.2)
As seen in Equation (2.2), Cpk is a “one-sided process capability ratio calculated
relative to the specification limit nearest to the process mean” (“Process Capability
Index,” 2015). Thus, a Six Sigma process corresponds to the capability indices ,
after the shift. Assuming a normally distributed process, the defect rate
increases from 0.002 ppm (parts per million) to 3.4 ppm. Consequently, the mean of a Six
Sigma process can shift 1.5 standard deviations from the center of the specifications and
still maintain a fallout of 3.4 parts per million. This number of defectives corresponds to
a yield rate of 99.9997 per cent. Table 1 (Tadikamala, 1994) shows “the number of
defects of a process as a function of the sigma value of the process (e.g., 6 ) and the off-
centering value of the process (e.g., 0 or 1.5 ).” Thus, the sigma value of a process or
represents the number of defectives of that process, therefore, describes its quality level.
The higher the process sigma value, the less likely a process will produce defects.
One should be cautious about using the Six Sigma concept because the defect
rates and the process capability indices discussed are based on the assumption that “the
underlying process distribution is approximately bell shaped or normal, yet in some
situations, the distribution may not be normal” (Khlebnikova, 2012). For example, such
distributions related to flatness, pull strength, and waiting time might naturally follow a
skewed structure. In such cases, calculating Cpk and defect rates in the usual way might
be misleading. Thus, a basic restriction of Six Sigma concept is that the actual process
distribution is usually unknown.
If a process shifts at all, it might be out of statistical control. The shift can signal
an out-of-control situation due to the presence of special (assignable) causes. Changing
solely the tolerance limits does not correct this situation. In such cases, the meaning of
defect rates and Cpk are unclear.
( ) ( )min3
USL LSLCpk
µ µδ
− − − =
2Cp =
1.5Cpk =
δ
δ
8
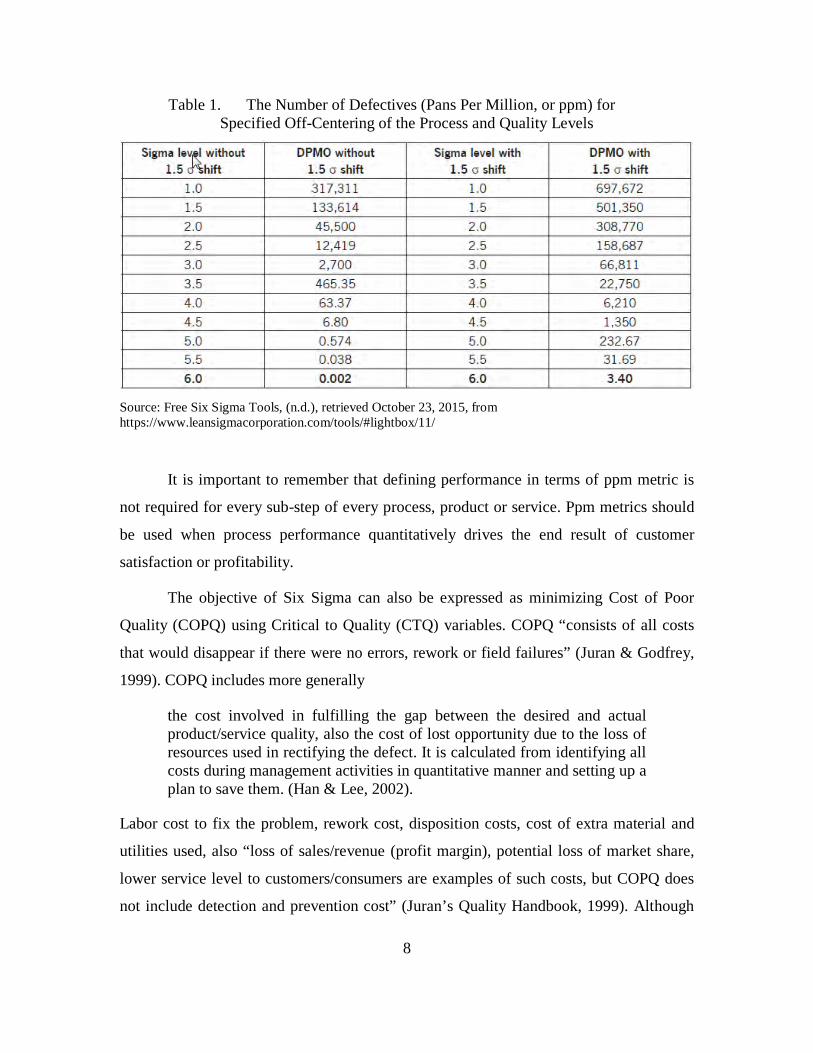
Table 1. The Number of Defectives (Pans Per Million, or ppm) for Specified Off-Centering of the Process and Quality Levels
Source: Free Six Sigma Tools, (n.d.), retrieved October 23, 2015, from https://www.leansigmacorporation.com/tools/#lightbox/11/
It is important to remember that defining performance in terms of ppm metric is
not required for every sub-step of every process, product or service. Ppm metrics should
be used when process performance quantitatively drives the end result of customer
satisfaction or profitability.
The objective of Six Sigma can also be expressed as minimizing Cost of Poor
Quality (COPQ) using Critical to Quality (CTQ) variables. COPQ “consists of all costs
that would disappear if there were no errors, rework or field failures” (Juran & Godfrey,
1999). COPQ includes more generally
the cost involved in fulfilling the gap between the desired and actual product/service quality, also the cost of lost opportunity due to the loss of resources used in rectifying the defect. It is calculated from identifying all costs during management activities in quantitative manner and setting up a plan to save them. (Han & Lee, 2002).
Labor cost to fix the problem, rework cost, disposition costs, cost of extra material and
utilities used, also “loss of sales/revenue (profit margin), potential loss of market share,
lower service level to customers/consumers are examples of such costs, but COPQ does
not include detection and prevention cost” (Juran’s Quality Handbook, 1999). Although

9
visible costs can be estimated, the hidden costs associated with defects and errors that
include costs related to configuration change, longer process duration, over-quality,
creation arrangement change, operation expense increment, revenue decrease, and brand
image damage is not included in the visible low quality cost (Han & Lee, 2002).
Critical-to-Quality variables (CTQ) can be defined as “the key measurable
characteristics of a product or process whose performance standards or specification
limits must be met in order to satisfy the customers” (“CTQ Tree,” 2015). CTQs
“represent the product or service characteristics that are defined by either internal or
external customers” and are the subject of the improvement project (“CTQ Tree,” 2015).
They are the main factors for COPQ. In other words, the critical elements for the quality
of the target system, thus qualitative customer needs should be translated into critical-to-
satisfaction (CTS) characteristics, which can be expressed in terms of either critical to
quality, delivery or cost (CTQ, CTD, CTC) such that actionable and quantitative business
specifications are identified. Harry (1997) defines the product is a function as “the design
and the manufacturing process which is represented as , where Y is characterized
as dependent (output) variables, and its role as to be monitored, while the X is described
as independent (input) variables, and its role as to be controlled.” The emphasis has to
shift from monitoring Y to controlling the relevant Xs (Harry, 1997).
B. SIX SIGMA PROGRAM: DEFINITION AND INTERPRETATIONS
Six Sigma is a results-oriented, project-focused approach to quality. It has
elements of Edwards Deming’s management and quality philosophy, but its tools are not
new. Rather, it is a clever compilation of proven techniques. It has been described and
interpreted in a variety of ways. Pande et al. (2000) define Six Sigma as “a
comprehensive and flexible system for achieving, sustaining, and maximizing business
success.” They list its major characteristics as a “close understanding of customer needs;
disciplined use of facts, data, and statistical analysis; and diligent attention to managing,
improving, and reinventing business processes.” It is a disciplined and “data-driven
approach to analyzing statistically the root causes of business problems and solving
them” (Blakeslee, 1999; Hahn, Doganaksoy, & Hoerl, 2000). By implementing this
( )Y f x=

10
company-wide quality improvement, daily activities can be designed and monitored so
that wastes are minimized while resources are optimized and customer satisfaction is
increased. Six Sigma is also defined as “a management philosophy, non-conformance
measure and problem-solving methodology for improving a business” (McAdam &
Evans, 2004).
These definitions and many others underline a customer-driven approach. They
emphasize reducing costs of poor quality and wastes, improving effectiveness and
efficiency, reducing cycle time, and maximizing profitability. Yet, perhaps its most
important characteristic is that decision-making and improvement processes are based on
quantitative facts or data, rather than emotional, abstract, or subjective discussion
(Antony & Banuelas, 2001; de Mast, Schippers, Does, & van den Heuvel, 2000; Han &
Lee, 2002; Juran & De Feo, 1999; Pande et al., 2000). Integrating the data-driven
approach in the culture of an enterprise is the main objective of Six Sigma.
A final interpretation of Six Sigma is from process systems engineers who
describe it as “enterprise-wide off-line activities that require accurate and sufficient
amount of data, statistical knowledge, teams of experts or consultants for setting goals
and checking progresses at each implementation step and active participation of all the
members” (Han and Lee, 2002).
C. HISTORY AND EVOLUTION OF SIX SIGMA
Six Sigma initiatives were originally developed by Motorola in the 1980s to
improve the performance of the company. Implementing these ideas helped Motorola win
its first Malcolm Baldrige National Quality Award in 1998. Then numerous big
corporations such as GE, Honeywell, Dow Chemical, Sony, Johnson & Johnson,
Bombardier Aerospace, and DuPont have implemented Six Sigma. As these other leading
companies added their own variations to the ideas developed by Motorola, Six Sigma has
turned into a restrained, quantitative methodology for enhancing operations in a wide
range of industry and business capacities. Simultaneously, the number of discussions—
spanning various types of media, from web pages to academic papers—has rapidly
increased. (Hahn, Hill, Hoerl, & Zinkgraf, 1999).

11
D. SIX SIGMA AS A STRUCTURED IMPROVEMENT METHODOLOGY: DEFINE-MEASURE ANALYZE-IMPROVE-CONTROL (DMAIC)
Six-Sigma is a problem-solving methodology that follows the Define, Measure,
Analyze, Improve and Control (DMAIC) cycle based on the Edwards Deming’s
(“Deming Cycle,” 2015) famous four-step Plan-Do-Check-Act (PDCA) cycle outlined
below:
• Plan (P): Plan what to do. Process description, goals, priorities, performance indicators.
• Do (D): Do it. Apply the plan and obtain the results.
• Check (C): Check results through tracking indicators and identify any problems.
• Act (A): Take action to eliminate identified problems, and standardize the process if results are satisfactory.
The objectives of the five phases and key points can be briefly summarized as
follows (Pande et al., 2000):
Define (D): In this phase, the core processes, the key customers and their
requirements are identified. Then critical-to-quality characteristics are defined
accordingly. Project goals and boundaries are set based on an organization’s business
goals and broad customer requirements are translated into specific CTQ requirements.
Goal theory suggests that “specific goals result in higher levels of performance
than vague non-quantitative goals such as do-best goals” (Locke & Latham, 2002). The
center piece of Six Sigma is a clear goal, although that goal can be extremely
challenging. Furthermore, specific goals also reduce performance variance. Thus, it is of
critical importance that the scope of the project is very clearly defined in order to
optimize the potential of the team. The full scope of the problem should be clearly
understood by every team member. On the other hand, the common mistake of executing
the Define phase very quickly should be avoided.
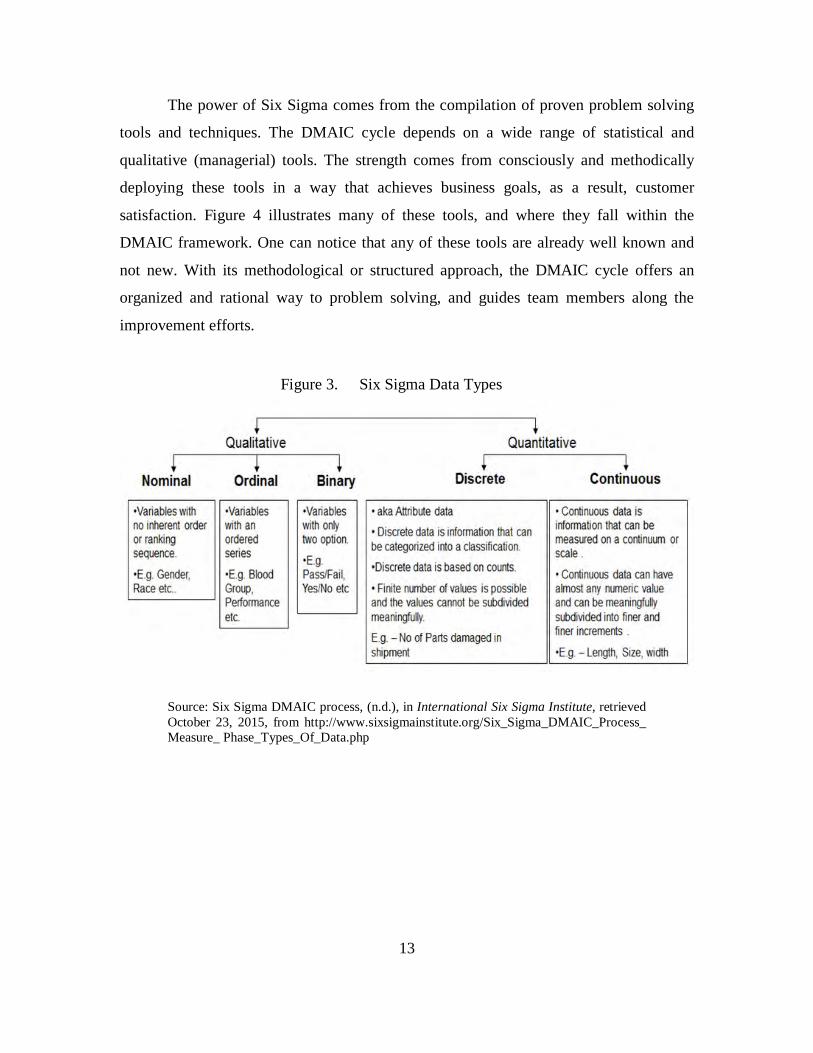
Measure (M): The objective of this phase is to locate the source of the problems
as precisely as possible, to measure current performance and to collect data (see Figure
3). CTQ characteristics “should be operationalized and its performance on the sigma
12
scale of quality [should] be defined” (Pande et al., 2000). The knowledge collected based
on data helps narrow the range of potential causes so they may be explored in the
Analyze phase.
Since data collected in this step will eventually be used to analyze the problem, it
is of critical importance that data collection systems should be tested to ensure accuracy
and consistency via studies like gage repeatability and reproducibility analysis.
Analyze (A): The question to be answered in this phase is which vital few process
and input variables affect CTQ process performance or output variables. The key
variables that are well on the way to make process variety in the CTQ are explored.
(Pande et al., 2000). By the end of this step, data that verifying which potential causes
actually contribute to the problem should be obtained. Figure 3 shows these different data
types.
Improve (I): In this stage, the objective is to remove the causes of the defects.
Pande et al. (2000), explain “[t]he vital few variables which govern the CTQ’s
performance are surfaced so that with this knowledge, operating limits for the leverage
variables can be established.” This phase develops the action plan to implement and
evaluate solutions targeted at verified causes. After quantifying their effects on the CTQs,
“the maximum acceptable ranges of the confirmed key variables are identified and a
system for measuring deviations of the variables is validated” (Pande et al., 2000). t is
demonstrated, with data, that implemented solutions solve the problem and lead to
improvement
Control (C): The Control phase “verifies that the improvements are in place.”
Team members should be able to answer the question “How can we make the process
stay fixed?” This step should ensure a control scheme for the vital few variables.
Control is a very important phase in the DMAIC process since it will determine
whether the improvement continues in the future. Effective control systems should be in
place to keep the process in control. Either simple or complex, they should become part
of the overall quality system to monitor implemented solutions.
13
The power of Six Sigma comes from the compilation of proven problem solving
tools and techniques. The DMAIC cycle depends on a wide range of statistical and
qualitative (managerial) tools. The strength comes from consciously and methodically
deploying these tools in a way that achieves business goals, as a result, customer
satisfaction. Figure 4 illustrates many of these tools, and where they fall within the
DMAIC framework. One can notice that any of these tools are already well known and
not new. With its methodological or structured approach, the DMAIC cycle offers an
organized and rational way to problem solving, and guides team members along the
improvement efforts.
Figure 3. Six Sigma Data Types
Source: Six Sigma DMAIC process, (n.d.), in International Six Sigma Institute, retrieved October 23, 2015, from http://www.sixsigmainstitute.org/Six_Sigma_DMAIC_Process_ Measure_ Phase_Types_Of_Data.php

14
Figure 4. Six Sigma Improvement Framework
Source: Chugh, R., (2009, November 19), Six Sigma process flow [Web log post], retrieved from http://sixsigmaworld.blogspot.com/2009_11_01_archive.html
E. SIX SIGMA AS A QUALITY/PROCESS IMPROVEMENT STRATEGY
In the aggressive business environment of the twenty-first century, quality
improvement procedures have come to play an important part in industry (Juran & De
Feo, 1999). In this context, “improvement” is defined as “the organized creation of
beneficial change; the attainment of unprecedented levels of performance,” whose
synonym can be stated as “breakthrough” (Juran & De Feo, 1999). These quality
improvement strategies often rely heavily on statistical techniques. Six Sigma is one of
these strategies that, in each step, uses appropriate tools in a structured way.
Normally, quality improvement projects happen venture by undertaking. It is
distinguished from quality control, “which is an on-line process reactive in nature, by its
proactive and project wise nature” (De Mast, 2003). Quality improvement projects rely
on empirical inquiry; hence statistical methods are applied in this context for problem
solving and fixing results.
15
A quality improvement strategy can be defined as “a coherent series of concepts,
steps (phases), methodological rules, and tools that guide a quality professional in
bringing the quality of a process or product to unprecedented levels” (de Mast, 2003).
Montgomery (2001) and Hoerl and Snee (2002) state that
it is statistical if the relations between the quality characteristic under study and influence factors in the process are to be discovered; improvement actions are derived from these relations; and conjectured relations are accepted as true after they are tested against empirical data. Thus, empirical inquiry is a must for qualifying a quality improvement strategy as statistical. (pp. 317–326)
The Six Sigma program suggests a wide collection of tools and techniques in each
step of the methodology. It also suggests empirical inquiry and the use of “statistical
science is a common thread through the phases of the methodology” (Montgomery, 2001;
Hoerl & Snee, 2002). Six Sigma’s goal of “improving the performance of a process by
identifying the causes of variation, eliminating them and generating improvement
actions” is a common objective of process improvement strategies (De Mast et al., 2000).
Thus, when combined with its statistics-based problem solving approach, Six Sigma can
be qualified as a ‘statistical quality improvement strategy’.
Quality improvement should be directed and built into the system. The key for Six
Sigma is to weave it thoroughly into all areas from business operations to factory
processes. Having improvement projects in different areas will ensure the widespread,
rapid propagation of Six Sigma. On the other hand, confining projects to a single area
(e.g., to manufacturing) will cause failure by restricting Six Sigma across functions.
One of the basic concepts in quality improvement is that it extends to all
parameters. “Published reports of quality improvements show that the effects have
extended to all parameters such as productivity, cycle time, human safety, and
environment” (Juran & Godfrey, 1999). Six Sigma’s quality improvement program can
provide benefits across multi-parameters, but the usage of a single quality criterion can
restrict multi-parameter optimization. Another basic concept in quality improvement is
that some vital few parameters bring major gains. Such projects need multifunctional
teams to carry them out because they are multifunctional in nature. The major Six Sigma

16
improvements can be similarly obtained by projects focused at the vital few critical-to-
quality parameters and driven by multifunctional teams.
The common belief that “higher quality costs more” inhibits quality improvement.
When higher quality means improved product features, and capital investment and
product development are required, it does cost more. However, when it means lower
chronic waste, higher quality costs less. As Six Sigma targets reduced process variations
with lower chronic waste and attempts to eliminate potential problems, rather than fixing
problems after they occur, it can create higher quality products at reduced costs.
However, initial investments in training, personnel allocation, and other opportunity costs
are not included in this comparison.
Quality improvement does not only affect business processes. Changes in a
company’s way of life are necessary when it has undergone quality improvement efforts.
In Juran’s Quality Handbook (Juran & Godfrey, 1999), that change is described as “a
mega-change that disturbs the peace and breeds many unwanted side effects.” Changes in
job descriptions mean new responsibilities and extra work for many employees. Some
employees resist this change because they perceive it as a threat to their jobs and/or
status. There are major changes associated with implementing Six Sigma initiatives,
including organizational restructuring, creation of new roles (such as black belts and
green belts), and developing multifunctional teams. As a consequence, the alarming
impact of these changes may bring about great resistance. Implementing Six Sigma is,
however, essential to remaining competitive, so it is important to persevere despite these
challenges.
F. SIX SIGMA: SUCCESS DRIVING ELEMENTS AND CLAIMED DIFFERENCES
While Six Sigma has been criticized by many as being nothing more than a
marketing scheme, many others claim that it differs from other quality improvement
strategies in many ways. During our research on this topic, we came across the following
important factors that set it apart.

17
1. Leadership Commitment and Top-Down Initiation of the Implementation
Leadership is a big issue in Six Sigma implementation. Active involvement of top
management and passionate leadership is indispensable in achieving Six Sigma
objectives. Employees must perceive active leadership from top-down administration in
implementing the initiatives.
One noticeable difference in a Six Sigma management philosophy, which is also
one of the major reasons for Six Sigma success, “is the high level of upper management
involvement and commitment” as opposed to previous quality efforts that emphasized
methodology or tactics (Eckes, 2003; Goh, 2002; Montgomery, 2001). As top
management is able to measure financial results accruing from Six Sigma, it becomes
easier to commit the necessary resources required for sustaining the program.
Strong leaders are key to the success of Six Sigma and are assigned important
responsibilities from the beginning. Top management should set up short-term and long-
term Six Sigma business objectives for the organization. Pande et al. (2000) list some of
these responsibilities:
• establishing the infrastructure of Six Sigma initiatives
• allocating the resources for Six Sigma projects
• reviewing the progress of various projects and providing the needed support
• negotiating the cross-functional teams to accomplish Six Sigma projects
• monitoring the personnel training
2. A Structured Organizational Workforce Infrastructure
Montgomery (2001) states that among the top reasons for Six Sigma’s success is
the organizational infrastructure consisting of “green belts, black belts, master black
belts, and champions [which are] very effective at identifying problems, then putting
teams together to solve them.” The hierarchy of expertise and execution is also one of the
critical factors that contributes to the potential of Six Sigma (Goh, 2002). Another
difference from other quality improvement strategies is the assignment of full-time staff.

18
Six Sigma recognizes that the managerial and organizational aspects are at least as
important as the technical strategies. Another strength comes from allocating the best
people to Six Sigma jobs and providing them with carefully designed training to guide
their projects. By defining the responsibilities of each stakeholder and team member at
the beginning, Six Sigma attacks projects efficiently.
3. A Disciplined Approach to Process Management and Structured Deployment of Tools
Six Sigma also succeeds because of its disciplined approach known as DMAIC
framework, where techniques are integrated into a logical flow (Goh, 2002; Pande et al.,
2000). Researchers propose two major claims. First, although quality management and
statistical methodologies are not “novel in concept and application, their integration into
a DMAIC framework,” which offers “an effective problem identification and solution
framework, has greatly facilitated their understanding, learning, and deployment by
practitioners” (Goh & Xie, 2004). Second, with its disciplined approach, Six Sigma
claims to provide a common language, roadmaps, sequences, and tools that guide people
through their projects providing them a common thought process so that the power of the
tools can be leveraged to achieve significant tangible business results (Hahn et al., 2000;
Snee, 1999).
4. Customer-Driven Approach
It is generally accepted that one of the major benefits of Six Sigma
implementation is the increase in customer satisfaction. Six Sigma recognizes the
customers of the process under investigation and defines expected customer benefits from
the beginning.
Due to Six Sigma’s focus on customers, success is measured by meeting customer
expectations, improvements are defined by their impact on customer satisfaction, and
consideration is given to the dynamic nature of customer needs (Pande et al., 2000). This
is just the contrary of an inward-looking standardization (Goh, 2002).
19
5. Clear Performance Metrics (Sigma Levels, Defects per Million Opportunities)
Organizations establish “clear performance metrics for each improvement in
costs, quality, yields, and capacity improvements” (Juran & De Feo, 1999). Metrics allow
team members to keep projects focused on goals and objectives and to take corrective
actions quickly to avert defects or damage.
6. Fact- and Data-Based Decisions
Perhaps the major reason for Six Sigma’s success is that all decision-making
processes are based on quantitative facts or data, rather than emotional, abstract, or
subjective discussion (de Mast et al., 2000; Han & Lee, 2002). Decisions are not based on
procedure or judgment, and “the use of statistical thinking is a common thread through
the phases” (Goh, 2002; Hoerl & Snee, 2002). Thus, Six Sigma can be defined as “a
disciplined method of using extremely rigorous data gathering and statistical analysis to
pinpoint sources of errors and ways of eliminating them” (Harry & Schroeder, 2000).
The strategy emphasizes data-driven practices. In his editorial “Beyond Six
Sigma,” Montgomery (2001) argues that, unlike TQM and other management programs
such as Business Process Engineering, Value Engineering, and Zero Defects, Six Sigma
actually works since it is based on sound statistical science. Data and analysis are the
primary means of understanding key variables to optimize results. “Common sense”
decision-making is avoided, and instead, knowledge is extracted based on data and used
in decision-making.
7. Result-Oriented Approach
Project-by-project implementation instead of “quality free concept” and crucial
project orientation also distinguish Six Sigma from other quality improvement procedures
(Goh, 2002; Montgomery, 2001). The progress of projects and of implemented solutions
is regularly monitored. One of the main project assessment criteria considers whether
results are worth the investment. Furthermore, managers consider how quickly results
will be evident, and potential projects are evaluated for their doability in limited time
periods, often in two to six months. These standards make progress tangible.

20
8. Business-Oriented Approach
In his editorial, “Beyond Six Sigma,” Montgomery (2001) says that the main
reason Six Sigma has been successful, even though its predecessors (such as TQM) are
dead, is that it focuses on achieving business goals. Determining “what measures are key
to gauging business performance” is the initial step in Six Sigma discipline (Pande et al.,
2000). Alignment with business priorities shapes projects goals and their contents.
Pande et al. (2000) state that business orientation also requires a proactive
management so that “an organization is dynamic and quick-responsive to disturbances,
which are not deterministic functions of time, rather exhibit random fluctuations.” This
requires that ambitious goals are made and reviewed frequently, that clear strategic
priorities are established, and that problem prevention mechanisms are in place. Reactive
habits should be replaced by a proactive style of management to facilitate competitive
advantages. As a business-oriented approach, Six Sigma introduces a proactive
management into the corporation dynamics (Pande et al., 2000).
9. Intensive Training
The training for Six Sigma staff is extensive, usually four or five weeks of
intensive, highly-quantitative training. Detailed training and certification, “in contrast to
the ad hoc or one-off nature of on-the-job training in the past, [is] offered to the
employees” (Goh, 2002). Furthermore, shaping the training curriculums to the needs of
employees and providing one-on-one coaching also contributes to Six Sigma’s success in
achieving goals.
In addition to these characteristics, Six Sigma’s wide range of applicability, in
transactional, commercial, and manufacturing operations, renders a “new dimension to
service sector quality in terms of rigor of problem solving and performance
improvement” (de Mast et al., 2000; Goh, 2002; Pande et al., 2000).
G. LEAN PRODUCTION
Dennis (2002) defines Lean production as a “set of principles and tools that helps
us eliminate process activities that do not add value, and create low in a process.” Lean

21
production can also be defined as a management ideology mainly focusing on reduction
of eight different wastes in processes: “human talent, over-production, waiting time,
transportation, processing, inventory, motion, and scrap” (“Lean Manufacturing,” 2015).
According to Levinson (2002), origins of Lean production can be traced to the scientific
management principles of Frederic Taylor (1911) and to the practical genius of Henry
Ford.
But the principles of Lean production were more fully embodied in its recent
incarnations: Just in Time Systems and Toyota Production System (Ohno, 1988).
According to Apte and Kang (2006) determination of the value lies in the center of Lean
production. Value can be defined as the feature, importance, or worth of something which
a customer is willing to pay. In a production line the processes which do not add value to
the whole production are also defined as waste. Therefore, we use Lean production, or
Lean framework, as a tool to identify the processes which add value or to identify and
eliminate non-value added processes (Apte & Kang, 2006). In summary, according to
Apte and Kang (2006), Lean manufacturing
• focuses on maximizing process velocity
• provides tools for analyzing process flow and delay times at each activity in a process
• emphasizes Value-stream Mapping which centers on the separation of value added from non-value added work with tools to eliminate the root causes of non-valued activities and their cost
• recognizes and attempts to eliminate 8 types of waste/non-value added work: defects, inventory, overproduction, waiting time, motion, transportation, processing, and human talent
• creates workplace organization through Five S methodology consisting of sort, straighten, sustain, sweep, and standardize
H. LEAN SIX SIGMA
The two well-known process improvement techniques, Six Sigma and Lean
production, have been used separately for many years. However, in recent years,
practitioners realized that the two process improvement methodologies achieve greater
success when used together (Apte & Kang, 2006).

22
According to Apte and Kang (2006, pp. 15–16),
Lean and Six Sigma approaches have their own strengths and weaknesses the specific action plan to be followed in effectively implementing Lean Six Sigma (for example, Lean first followed by Six Sigma later or vice versa) is dependent on the nature of the situation at hand.
Furthermore, Apte and Kang (2006, pp. 15–16), suggest that
the problems related to accuracy and/or completeness are usually addressed best by the tools of Six Sigma; consequently, those tools should be introduced first. However, if the customer needs quick results, and if the problem is related to timeliness or productivity, Lean should be implemented first with an understanding that deep and complex problems will be solved only by the subsequent use of the Six Sigma tools.
In summary, Apte and Kang (2006, p. 16) indicate that
Lean and Six Sigma are rich bodies of knowledge and are mature methodologies for solving a broad variety of process-related problems. Each methodology has its own approach to process improvement and its own tool set al.though Lean and Six Sigma methodologies can be mastered independently, they can and should be implemented together to realize the full benefits of process improvements by any organization.

23
III. EXAMPLES OF LEAN SIX SIGMA IMPLEMENTATION IN THE MILITARY
With its high profile adoption by industry giants such as General Electric,
Motorola, Honeywell (formerly, Allied Signal), and Raytheon Corporation, business has
witnessed many other big corporations claiming notable successes from the Lean Six
Sigma methodology. According to Apte and Kang (2006, p. 17),
the success realized by top companies such as Toyota and GE has inspired the use of Lean Six Sigma in the U.S. Department of Defense (DOD). Although the DOD has implemented a number of process improvement methodologies with varying degrees of success in the past decade, it has begun to explore the potential of implementing Lean Six Sigma throughout the entire DOD only recently.
When we look at the promising results of these Lean Six Sigma implementations made
by the U.S. DOD, the benefits of implementing similar programs in military
organizations around the world are evident. Apte and Kang (2006) state in their research
that
as the lean Six Sigma mindset continues to grow among the DOD community and both the Lean and Six Sigma practices become more commonplace, the equipment and personnel available to the DOD will provide considerably more capability per taxpayer dollar than ever before.
A. ARMY IMPLEMENTATIONS
In their research about Lean Six Sigma for Reduced Cycle Costs and Improved
Readiness, Apte and Kang (2006) detailed successful implementations of Lean Six Sigma
in the United States Army:
• In implementing Lean Six Sigma, the Red River [Army] Depot [Repair Facility] has made many changes to its HMMWV repair line, such as: forming an assembly-line process, using time-managed intervals to control the flow of work, organizing employees based on experience and proficiency, cleaning up and improving the overall work environment, stocking more and better quality parts to reduce stock-outs, and training employees to ensure there is no break in continuity on the assembly line. Improvement efforts have resulted in the ability to turn out 32 mission-ready HMMWV’s a day, compared with three a week in 2004. The Lean process has also lowered the cost of repair for one vehicle from $89,000 to

24
$48,000. Some of the biggest improvement ideas have come from the front-line employees themselves.
• Pine Bluff Arsenal in Arkansas reduced its repair recycle time by about 90% and increased its production rate by about 50% on M-40 protective gas masks.
• Letterkenny Army Depot in Pennsylvania has saved $11.9 million in the cost of building the Patriot air-defense missile system. In the Corpus Christi Army Depot, the overhaul time for one T700 helicopter engine was reduced by 64%. The depots improved the consistency of their repair operations by increasing the mean time between the engine overhauls from 309 hours to over 900 hours and improved the return to field accuracy to above 90%.
B. NAVY IMPLEMENTATION
Implementation of Lean Six Sigma by the U.S. Navy is called the AIRSpeed
program. Secretary of the Navy Donald Winter stated in 2006,
Lean Six Sigma (LSS) is a proven business process that several elements of the Navy and Marine Corps have initiated including training over 500 Black Belts and 1500 Green Belts who have facilitated 2800 events and projects. These activities have averaged a 4:1 return on investment.
In their research, Apte and Kang (2006) give examples of Lean Six Sigma
implementations in the U.S. Navy:
• In October 2005, Naval Air Warfare Center (NAWC) accounting practices yielded an annual savings of $176.9K with an additional anticipated saving of $146.3K in waste elimination.
• Since April 2004, Aviation Intermediate Maintenance Division (AIMD) Whidbey Island reduced J-52 aircraft engine repair time from 468 hours to 233 hours and reported significant inventory and operating cost savings. Since February 2006, AIMD Patuxent River has seen increased savings due to a 10% inventory reduction and a reallocation of 166 hours of full-time employees.
• In June 2006, Naval Aviation Systems Command’s (NAVAIR) PMA offices began replicating successes of other PMA offices, including one office that saw an estimated $163K/year savings due to reducing processing time from 240 days average to a predicted average of 15 days.
In their research Apte and Kang (2006, p.19) state that “the successes are due, in
large part, to the training received by the employees that emphasizes the use of DMAIC

25
(Define, Measure, Analysis, Improve and Control) methodology for process
improvement.” According to the AIRSpeed program, there are five anticipated long-term
benefits of implementing Lean Six Sigma methodology in the U.S. Navy (Apte & Kang
2006), these are:
• Reduce total cost of Naval Aviation by reducing inventory, manpower and operating expenses.
• Support the Fleet Response Plan by providing aircraft Ready for Tasking (RFT).
• Integrate Maintenance and Supply Support System to provide seamless support to the Fleet.
• Improve logistics and maintenance response by reducing cycle-time and the logistics footprint.
• Place ownership and accountability at the appropriate levels.
C. AIR FORCE IMPLEMENTATIONS
In their research about Lean Six Sigma for Reduced Cycle Costs and Improved
Readiness, Apte and Kang (2006) state that “over the next several years, the Air Force
(AF) is expected to lose approximately 40,000 personnel. This loss of manpower means
airmen must work smarter and leaner. Senior AF leadership has decided to utilize the
Lean Six Sigma strategy to accomplish this.” The U.S. Air Force created a new program
office called Air Force Smart Operations 21 (AFSO21) at the Pentagon with Brig. Gen.
S. Taco Gilbert as the director of the AFSO21 Office (Apte & Kang, 2006).
As Apte and Kang (2006, p. 20) mention in their paper,
the AF already has several examples of AFSO21 at work. AF Materiel Command has applied AFSO21 and returned 100 aircraft to duty, as well as reduced C-5 maintenance time by 50%. USAF Europe (USAFE) applied AFSO21 practices—they reduced the number of telephone operators by approximately 16% and saved the command $2.4 million (Lopez, 2006). The AF has also begun implementation of Lean Six Sigma concepts to their contracting activities. The goal is to reduce the cycle-time required to award a contract in support of new operational requirements. The Global Hawk team followed the Lean Thinking concepts to break down the contracting process into a value stream. They identified steps that do not add value and eliminated them. By eliminating

26
those unnecessary steps, their three process times were cut by 37%, 40%, and 73%.

27
IV. CULTURAL DISTANCE
Because Lean Six Sigma is about organizational improvement, mainly focusing
on process improvement and management, it is also about people’s behavior. These two
behaviors cannot be separated. Therefore, how various differences in national culture can
affect Six Sigma implementations appears to be a logical question in the minds of
possible Lean Six Sigma practitioners. In order to analyze the possible effects of national
cultural differences in management based topics, especially in international management
issues, using the Hofstede’s cultural dimensions theory may help to better understand or
at least predict what might be the future implications of a project. Hofstede’s cultural
dimensions theory is “a framework for cross-cultural communication,” developed by
Geert Hofstede. According to Geert Hofstede (as cited in The Hofstede’s Center, 2015), it
mainly describes “the effects of a society’s culture on the values of its members, and how
these values relate to behavior, using a structure derived from factor analysis.” Professor
Geert Hofstede (as cited in The Hofstede’s Center, 2015) defines culture as “the
collective programming of the mind distinguishing the members of one group or category
of people from others.”
Based on the model offered by Hofstede, national culture consists of six
dimensions. According to Hofstede,
the cultural dimensions represent independent preferences for one state of affairs over another that distinguish countries (rather than individuals) from each other. The country scores on the dimensions are relative, as we are all human and simultaneously we are all unique. In other words, culture can be only used meaningfully by comparison. (“National Culture,” n.d.)
The six dimensions described in the model are Power Distant Index (PDI), Individualism
Versus Collectivism (IDV), Masculinity Versus Femininity (MAS), Uncertainty
Avoidance Index (UAI), Long Term Orientation Versus Short Term Normative
Orientation (LTO), and Indulgence Versus Restraint (IND).
28
A. POWER DISTANCE INDEX (PDI)
According to Geert Hofstede (as cited in The Hofstede’s Center, 2015), PDI
expresses the degree to which the less powerful members of a society accept and expect that power is distributed unequally. The fundamental issue here is how a society handles inequalities among people. People in societies exhibiting a large degree of Power Distance accept a hierarchical order in which everybody has a place and which needs no further justification. In societies with low Power Distance, people strive to equalise the distribution of power and demand justification for inequalities of power. (“National Culture,” n.d.)
B. INDIVIDUALISM VERSUS COLLECTIVISM (IDV)
According to Geert Hofstede (as cited in The Hofstede’s Center, 2015),
high side of this dimension, called individualism, can be defined as a preference for a loosely-knit social framework in which individuals are expected to take care of only themselves and their immediate families. Its opposite, collectivism, represents a preference for a tightly-knit framework in society in which individuals can expect their relatives or members of a particular in-group to look after them in exchange for unquestioning loyalty. A society’s position on this dimension is reflected in whether people’s self-image is defined in terms of I or we. (“National Culture,” n.d.)
C. MASCULINITY VERSUS FEMININITY (MAS)
According to Geert Hofstede (as cited in The Hofstede’s Center, 2015) states
the Masculinity side of this dimension represents a preference in society for achievement, heroism, assertiveness, and material rewards for success. Society at large is more competitive. Its opposite, femininity, stands for a preference for cooperation, modesty, caring for the weak, and quality of life. Society at large is more consensus-oriented. In the business context Masculinity versus Femininity is sometimes also related to as tough versus tender cultures. (“National Culture,” n.d.)
D. UNCERTAINTY AVOIDANCE INDEX (UAI)
Geert Hofstede (as cited in The Hofstede’s Center, 2015) defines UAI as
the degree to which the members of a society feel uncomfortable with uncertainty and ambiguity. The fundamental issue here is how a society deals with the fact that the future can never be known: should we try to control the future or just let it happen? Countries exhibiting strong UAI

29
maintain rigid codes of belief and behaviour and are intolerant of unorthodox behaviour and ideas. Weak UAI societies maintain a more relaxed attitude in which practice counts more than principles. (“National Culture,” n.d.)
E. LONG TERM ORIENTATION VERSUS SHORT TERM NORMATIVE ORIENTATION (LTO)
According to Geert Hofstede (as cited in The Hofstede’s Center, 2015), “every
society has to maintain some links with its own past while dealing with the challenges of
the present and the future. Societies prioritize these two existential goals differently”
(“National Culture,” n.d.).
Societies who score low on this dimension, for example, prefer to maintain time-honoured traditions and norms while viewing societal change with suspicion. Those with a culture which scores high, on the other hand, take a more pragmatic approach: they encourage thrift and efforts in modern education as a way to prepare for the future. (“National Culture,” n.d.)
F. INDULGENCE VERSUS RESTRAINT (IND)
For the last dimension Hofstede (as cited in The Hofstede’s Center, 2015) states,
indulgence stands for a society that allows relatively free gratification of basic and natural human drives related to enjoying life and having fun. Restraint stands for a society that suppresses gratification of needs and regulates it by means of strict social norms. (“National Culture,” n.d.)
By looking to the national scores (from 1 for the lowest to 120 for the highest),
Hofstede’s six-dimensions model allows us to make an international comparison between
cultures, also called comparative research.

30
Figure 5. Turkey Country Comparison
Adapted from The Hoftstede Center, (n.d.), retrieved October 23, 2015, from http://geert-hofstede.com/turkey.html
According to the Hofstede Center, Turkey’s scores for the six dimensions can be
interpreted as follows:
1. Power Distance
Turkey scores high on this dimension (score of 66) which means that the following characterizes the Turkish style: Dependent, hierarchical, superiors often inaccessible and the ideal boss is a father figure. Power is centralized and managers rely on their bosses and on rules. Employees expect to be told what to do. Control is expected and attitude towards managers is formal. Communication is indirect and the information flow is selective. The same structure can be observed in the family unit, where the father is a kind of patriarch to whom others submit. (“What about Turkey,” n.d.)

31
2. Individualism
Turkey, with a score of 37 is a collectivistic society. This means that the We is important, people belong to in-groups (families, clans, or organizations) who look after each other in exchange for loyalty. Communication is indirect and the harmony of the group has to be maintained, open conflicts are avoided. The relationship has a moral base, and this always has priority over task fulfillment. Time must be invested initially to establish a relationship of trust. Nepotism may be found more often. Feedback is always indirect, also in the business environment. (“What about Turkey,” n.d.)
3. Masculinity
Turkey scores 45 and is on the Feminine side of the scale. This means that the softer aspects of culture such as leveling with others, consensus, sympathy for the underdog are valued and encouraged. Conflicts are avoided in private and work life and consensus at the end is important. Leisure time is important for Turks, it is the time when the whole family, clan, and friends come together to enjoy life. Status is shown, but this comes more out of the high PDI. (“What about Turkey,” n.d.)
4. Uncertainty Avoidance
Turkey scores 85 on this dimension, and thus there is a huge need for laws and rules. In order to minimize anxiety, people make use of a lot of rituals. For foreigners they might seem religious, with the many references to Allah, but often they are just traditional social patterns, used in specific situations to ease tension. (“What about Turkey,” n.d.)
5. Long Term Orientation
Turkey’s intermediate score of 46 is in the middle of the scale, so no dominant cultural preference can be inferred. (“What about Turkey,” n.d.)
6. Indulgence
With an intermediate score of 49, a characteristic corresponding to this dimension cannot be determined for Turkey. (“What about Turkey,” n.d.)
When we look at Turkey’s scores for the six different dimensions, we see
significant differences from the United States. Hofstede’s cultural dimensions model may
offer reasonable insight especially on management based topics. In implementing Lean
Six Sigma in the Turkish army, project managers should bear in mind that the approach
followed by the U.S. DOD for implementing a Lean Six Sigma project, may or may not

32
work for Turkey, due to significant cultural differences. Figure 6 demonstrates the
differences between Turkey and the United States in Hoftsede’s six cultural dimensions.
Figure 6. Turkey in Comparison with USA
Adapted from The Hoftstede Center, (n.d.), retrieved October 22, 2015, from http://geert-hofstede.com/turkey.html
By looking at the differences above, we can determine that Turkish and U.S.
cultures differ significantly, and this conclusion may lead us to assume that a specific
approach to implementing LSS in the United States may not work in Turkey if cultural
differences are not taken into consideration.
Trompenaars and Hampden-Turner (1998) stress that during the implementation
phase of a Lean Six Sigma project, one should pay attention to the cultural characteristics
of that society “because the way organizations change [is] mostly influenced by their
dominant culture.”
Trompenaars and Hampden-Turner (1998) see “four primary organizational
archetypes depending on the degree to which organizations are decentralized or
centralized, informal or formal.” Their research shows that the United States is “relatively

33
decentralized and formal in its approach to organizations.” He further notes that U.S.
culture “celebrates the achievement of individuals, and the result is a very receptive
environment for Six Sigma—an approach to improving process performance based on
competent individuals driving results.”
With the findings from this study, we can say that like most of the Southern
European countries (such as Italy and France), business organizations in Turkey are like
families. Figure 7 shows different cultural perspectives on Six Sigma. As stated in “Using
Six Sigma in Europe: A Cross-Cultural Perspective” (2014),
Power for the good of the group is ascribed by virtue of knowledge. For senior managers to lead change in that context, they have to internalize, then personalize, the change for themselves and those for whom they feel responsible. In France, it means spending plenty of time educating senior managers about the leadership aspects of Six Sigma before ever picking process-based projects.
Since it is obvious from Figure 7 that Turkish and U.S. cultures lie in opposite zones,
project managers who are implementing a Lean Six Sigma project in Turkey should
structure projects in ways that appeal to Turkey’s specific culture.
Figure 7. Six Sigma Cross Cultural Perspective
Source: “Using Six Sigma in Europe: A Cross-Cultural Perspective,” (2014), retrieved October 23, 2015, from http://lean6sigma4all.eu/2014/12/07/using-six-sigma-in-europe-a-cross-cultural-perspective/

34
As Steve Crom (2015) states in his article,
Six Sigma is universally applicable, though how one communicates the purpose of it and implements it should differ depending on the predominant national culture. Companies operating in Europe should beware of implementation approaches that are based on a U.S.-style emphasis on the capability of talented, well-trained individuals to get results no matter what it takes. CEOs should develop an explicit leadership strategy to introduce Six Sigma as a vehicle for strategic organizational change.
He continues, stating useful tips on implementing LSS across cultures:
Years of experience have shown that the major Lean Six Sigma implementation challenges are people-related; therefore, it is important to bear in mind these pointers:
• Take stock early on of who is involved and how to motivate them to change.
• Be sure to incorporate soft skills training (e.g., facilitation and change management) in the Six Sigma curriculum.
• Train teams as well as individuals to build the capability of groups and their commitment to implement and sustain improvements.
• Be aware that teams from different countries will progress at different rates.
• To summarize, as Carey (2015) states in his article,
While it is essential for a company to create familiarity with Lean and Six Sigma disciplines by training employees, it is even more important to integrate Lean Six Sigma into the company change culture. Lean Six Sigma should be a key component of the organization’s change infrastructure supporting all projects and change initiatives from the ground up.

35
V. CHANGE MANAGEMENT AND LEAN SIX SIGMA
As discussed in the six sigma literature review, the lean six sigma method focuses
on reducing the wastes and improving the quality of any kind of process. In this context,
Juran and De Feo (1999, p. 76) defines “improvement” as “the organized creation of
beneficial change; the attainment of unprecedented levels of performance.” The
beneficial change effects not only the processes, tools, practice techniques but also the
employers and managers within the organization.
Kettinger and Grover (1995) argues that any continuous improvement approach
like lean six sigma or another process change method aims to transform the current
business. They also indicate that “business process change management” is critical to
deploy this kind of systematic improvement methods. So for evaluating lean six sigma
practicality and readiness level, we desired to inquire the relationship between lean six
sigma and change management shortly in this section.
A. THE BASIS OF CHANGE MANAGEMENT
Change is emerging as a deep-rooted feature of any organization due to the
technological advancements, developing knowledge workforce and new work processes
(Burnes, 2004). Moreover the economic concerns, budget constraints, management
policy shifting impose private and public organizations to consider organizational change
as an urgent priority. Nevertheless, the complicated nature of change cause negative or
positive effects on the organizational climate and also culture. Hence the change action
should be managed effectively.
Although many organizations embrace the practice of change in some way, 70%
of the change initiatives fail to accomplish intended objectives (Balogun & Hope Hailey,
2004). Dawson (1994) states that managing change will be one of the biggest challenges
for modern organizations. The leaders should focus on managing change efficiently
especially to direct their organizations towards an advantageous position in this very
competitive business world.

36
Robbins and Judge (2011) articulate that organizations should adapt themselves to
the shifting environment, demographic changes, new sourcing initiatives and new
workforce. They also elaborate that rapid technology is persistently changing the job
descriptions and the climate of the organization. As external effects like “economic
shocks,” “social trends,” globalization and competition do not remain stagnant, the
organizations should concentrate on managing change in order not to suffer from the
negative effects of changing internal and external environment.
B. APPROACHES ON MANAGING ORGANIZATIONAL CHANGE
Robbins and Judge (2011, pp. 238–240) discusses three different approaches to
successfully manage organizational change.
1. Lewin’s Three-Step Model
In Figure 8, (as cited in Burnes, 2004) Kurt Lewin asserts that an organizational
change occurs in three consecutive phases. The first step is “unfreezing” described as an
equilibrium of resisting and supporting forces. It also includes the acceptance that the
status-quo is not responding to the current problem that the organization should create a
need to overcome resistance and mobilize commitment. The second step is the
“movement” defined as the starting and practicing change initiative. And the third step is
determined as “freezing” which depicts the efforts to sustain the change within the
organization.

37
Figure 8. Lewin’s Three-Step Change Model
Source: Thatte, D., & Khandelwal, N., (n.d.), Grabbing Hold of the GRPI Model, retrieved November 2, 2015, from http://www.isixsigma.com/implementation /teams/grabbing-hold-of-the-grpi-model/
2. Kotter’s Eight-Step Plan for Implementing Change
John Kotter (1995, p. 99) elaborated on Lewin’s model and created a more
detailed plan for implementing change. Kotter focused on the possible problems while
initiating and implementing change. He suggested some practical solutions to overcome
the obstacles and reached the following eight steps:
• Establish a sense of urgency by creating a compelling reason for why change is needed.
• Form coalition with enough power to lead the change.
• Create a new vision to direct the change and strategies for achieving the vision.
• Communicate the vision throughout the organization.
• Empower others to act on the vision by removing barriers to change and encouraging risk taking and creative problem solving.
• Plan for, create, and reward short-term wins that move the organization toward the new vision

38
• Consolidate improvements, reassess changes, and make necessary adjustments in the new programs.
• Reinforce the changes by demonstrating the relationship between new behaviors and organizational success.
3. Organizational Development
Robbins and Judge (2011, pp. 239–240) defines organizational development (OD)
as “A collection of change methods that try to improve organizational effectiveness and
employee well-being.” They contend that modern OD methods emphasizes human
factors, collaborative and cooperative facets of the working environment. They underline
five major efforts in OD:
• Respect for people. Individuals are perceived as responsible, conscientious and caring. They should be treated with dignity and respect
• Trust and support. An effective and healthy organization is characterized by trust, authenticity, openness, and a supportive climate.
• Power equalization. Effective organizations de-emphasize hierarchical authority and control.
• Confrontation. Problems should be openly confronted, not swept under the rug.
• Participation. The more engaged in the decisions they are, the more people are affected by a change will be committed to implementing them.
C. CHANGE MANAGEMENT WITHIN LEAN SIX SIGMA
The lean six sigma continuous improvement method brings some level of change
not only to the work processes but also to the human side of the work and organization.
The context of the change should be administered carefully while implementing the
improvement method. LSS initiatives are more successful when they produce permanent
change behavior by the effective practice of change management (Wilder, 2013). The
change management deals with the potential resistance to change utilizing structured
processes or tools for the desired outcomes of the project.
In Figure 9, Wilder (2013) offers the activities and deliverables of change
management within the DMAIC cycle of an LSS project.

39
Figure 9. Change Management in DMAIC
Source: Wilder, B., (2013), All Aboard: Lean/Six Sigma is a journey best travelled with change management, Plant Services Magazine, 33(2), 38–42, retrieved November 2, 2015 from http://www.lce.com/All_Aboard_LeanSix_Sigma_is_a_journey_best_ travelled_with_change_management_561-item.html
Cole (2008) suggests that the human side of change is very crucial for the success
of DMAIC projects and any project influencing people need some level of change
management. A green belt project potentially does not require comprehensive change
management tools as much as a black belt project. He additionally argues that the
integration of technical and human aspect of change management is essential as well as
the combination of Lean six sigma tools.
D. CHANGE MANAGEMENT AND LSS READINESS
Lagrosen, Chebl, and Max (2011) argue that as lean six sigma implementation
requires institutional learning, the institution can make readiness assessments by using
learning theories. They mainly combined the learning theories with the human side of the
change imposed by the process improvement. Hence they offered a readiness assessment

40
model (Figure10) for the deployment of Lean six sigma that includes change environment
and also change management.
Strategic initiatives indicates the senior and top management support for the
success of process change by continuous improvement methods. Cultural readiness is
another essential factor because organizational culture determines the individual or
organizational learning capacity as well as the flow of the information in a changing
environment (Kilman et al., 1986).
Change management indicates the organization’s ability to overcome the
resistance to change problem. (Kettinger and Grover, 1995). Lagrosen et al. (2011) note
that “the structural elements of the Six Sigma framework all stimulate change.”
Magnusson et al. (2003), as cited in Lagrosen et al. (2011, p. 31), suggest the following
concerns for the successful implementation of lean six sigma by getting the support of
members of the organization:
to take care of people in order to align their mental models favorably through coaching, workshops and group-building initiatives; to formulate goals, to create a sense of purpose for individuals; to instill feelings that they own the change; being aware that change takes time and finally to have the support and commitment of senior management for improvement in general.
Figure 10 summarizes their readiness for six sigma implementation model.

41
Figure 10. The Readiness Assessment Model
Source: Lagrosen, Y., Chebl, R., & Max, R. T., (2011), Organisational learning and six sigma deployment readiness evaluation: A case study, International Journal of Lean Six Sigma, 2(1), 23–40. doi:http://dx.doi.org/10.1108/20401461111119431

42
THIS PAGE INTENTIONALLY LEFT BLANK

43
VI. RESEARCH METHODOLOGY
A. INTRODUCTION
This chapter discusses the research methods we used in this project. First we will
describe the goals of the survey and how we aimed to answer the research questions.
Next, we will describe the survey design, the specific instrument type used for this
survey, and the survey participants. We conclude with the method of analysis and the
limitations of the survey.
B. SURVEY GOALS
The main goal of our survey was to answer the following research questions:
• Are there any significant cultural differences between Turkish and U.S.military organizations in terms of readiness to change and continuousimprovement?
• How amenable is Turkish military culture to change and continuousimprovement?
• What might be the major obstacles to implement Lean Six Sigma (LSS) inthe Turkish army?
• What steps can be taken for a successful LSS deployment plan in theTurkish army?
Before deploying LSS into an organization, the current culture within the
organization must be assessed. Some cultures will accept it more easily than others.
These assessments will enable the leaders to decide whether the organization is
responsive to LSS or in need of adaptation in order to align with LSS thinking. Thus,
organizations need to assess their preparedness before implementing LSS. Since this
method is a change initiative for the organization’s culture, we focused on the change
readiness and continuous improvement readiness to determine the practicality of
implementing LSS in the Turkish army.
Our goal was to understand how amenable Turkish military culture would be to
LSS in terms of change with continuous improvement and to draw a cultural comparison
from the mid-level manager perspective. To do this, we conducted an online survey titled

44
“Measuring organizational readiness to change and continuous improvement for Lean Six
Sigma implementation” with Turkish and U.S. students at the Naval Postgraduate School
(NPS).
C. SURVEY DESIGN
We conducted an anonymous online survey to achieve the research objectives.
The NPS Institutional Review Board reviewed and approved the survey. We administered
the survey electronically, via Lime Survey, an open-source surveying tool that is hosted
by NPS during the time period of August 27, 2015 to October 12, 2015. The details about
the survey design and questions are provided below. We address the results and analysis
of the survey in the next chapter.
The survey consisted of two groups of questionnaires. The first questionnaire
asked the survey participants about their perception of their organization’s readiness for
change as it pertains to their previous experiences. Instead of developing new scales for
our survey, we used validated surveys in published studies. So in order to measure the
organizational readiness for change of two different cultures, we used the perceived
organizational readiness for change (PORC) scale developed by Cinite, Duxbury and
Higgins (2009). There are two main reasons why we have chosen this scale. First, this
scale was developed specifically for the public sector which includes military
organizations. Second, it includes not only readiness subscales but also unreadiness
subscales.
The first questionnaire included a total of 17 five-point Likert scale questions in
five subcategories. The first three categories of the scale measured the readiness for
change whereas section 4 and 5 aimed to measure the unreadiness for change. Questions
1 through 4 addressed the factor of commitment of senior management to the change.
Questions 5 through 8 pertained to the factor of competence of change agents. Questions
9 through 11 related to the support of immediate manager factor. Questions 12 through
14 asked about poor communication of change factor. And finally questions 15 through
17 investigated “the adverse impact of the change on work” (Cinite et al., 2009). The
PORC scale is located in the Appendix section of this report.

45
In addition to measuring readiness to change with the first questionnaire, we also
inquired into the readiness level for a continuous improvement method in another
questionnaire. For this purpose, we used continuous quality improvement (CQI) readiness
assessment scale developed by Dana (2004). CQI scale aimed to measure the opinions of
the participants on the areas that are essential for the successful implementation of the
continuous process or quality improvement by some changes in the culture of the
organization. The survey also sought to identify possible obstacles in practicing Lean Six
Sigma method in Turkish military culture and steps for a successful LSS deployment plan
in the Turkish army.
CQI readiness survey included a total of 25 five-point Likert scale questions
describing five different dimensions. Questions 1 through 10 asked the dimension of
internal focus and team process indicating the engagement of the employees in the
overall mission of the organization. Questions 11 through 14 related to the dimension that
measures the process understanding of the employee while doing his/her job
requirements. Questions 15 through 18 addressed the dimension that describes the use of
data in decision-making, which is one of the key tools in Lean Six Sigma projects.
Questions 19 through 21 related to the fourth dimension and asked for the “common
understanding of quality and customers’ needs and expectations” (Dana, 2004). Finally,
questions 22 through 25 aimed to measure the capability of the management to direct
CQI. The scale is also located in the Appendix section of the report.
Both questionnaires were taken at the same time. At the end of the survey, in
order to differentiate between Turkish and American participants, they were asked to
provide their country of origin, military service and years of professional military
experience.
D. SURVEY PARTICIPANTS
U.S. and Turkish military officers studying at NPS participated in this survey. We
invited the participants via recruitment email and also personal contact (face-to-face,
phone, text). They received the consent form as the first question of the survey and only

46
those who provide consent were allowed to continue and complete the survey. Then they
answered a series of questions online via Lime Survey.
There are 47 Turkish students at NPS. We aimed to get 40 complete responses
from Turkish participants. And for a sufficient statistical comparison, we needed at least
the same number of U.S. officers. This sample size provided a sufficient variety of mid-
manager perspectives and provided us with a wide pool of experiences. The size of the
survey was relatively large and diverse enough to supply relevant information for the
research.
In order to minimize the risk to the subjects, we did not ask the participants for
their names or any personal identification. Only the rank, service information, and years
of experience were requested from the participants. They could choose to withdraw from
the study at any time.
E. METHOD OF ANALYSIS
For the analysis of the first questionnaire, we used basic statistical tools like mean
and standard deviation to get the average distribution of five point Likert scale results.
Then we used Pearson’s chi-square test of independence to determine the statistical
difference the between Turkish and U.S. participant groups.
“Pearson’s chi-squared test is a statistical test applied to sets of categorical data to
evaluate how likely it is that any observed difference between the sets arose by chance. It
is suitable for unpaired data from large samples” (“Pearson’s chi-squared test,” n.d.).
There are several types of chi-square test but Pearson’s is the most common. The
characteristic of this test was first established by Karl Pearson (1900). Pearson’s chi-
squared test is very useful in identifying the statistical difference between the actual test
results and the distribution of the statistics.
We used Dana’s (2009) CQI Climate Survey Report Generator to analyze the
responses of the second questionnaire. In this generator, the author calculated the
averages of the each questions and then made an assessment according to the total
agreement rate of the respondents.
47
F. SURVEY LIMITATIONS
Firstly, due to the self-reporting nature of the survey, it is limited in that the
responses of the participants reflect only their personal opinions and not the official
viewpoints of each military organization. The results of the survey were generalized to
make organization level assessments.
Secondly, the participants of the survey were limited to the U.S. and Turkish
military officers studying at the Naval Postgraduate School. The participants were all
nearly the same age and had roughly the same amount of military experience. They
generally represented only the mid-manager opinions of their military organizations.
Hence, the research lacks the perspective of senior managers.
Thirdly, the respondents of the survey were an isolated group away from their
typical daily working environments. They could be influenced by academic conditions
rather than their original military organizations.
Fourthly, there was a possible bias in the CQI survey, question 9, because the
subjects were students at NPS and primed for learning.

48
THIS PAGE INTENTIONALLY LEFT BLANK

49
VII. RESULTS AND ANALYSIS
A. INTRODUCTION
This chapter summarizes the outcomes obtained from the “Measuring
Organizational Readiness to Change and Continuous Improvement for Lean Six Sigma
Implementation” survey answered by U.S. and Turkish officers at the Naval Postgraduate
School. Appendix provides an overall review of survey responses.
Our goal was to get a comparable number of answers from students of each
country. We invited 47 Turkish students to take the survey and all of them answered but
7 of surveys were incomplete. So we tried to get at least 40 answers from U.S. students.
We sent invitations to 85 U.S. students from different services and we finished the survey
when we had 40 completed surveys. In summary, 132 U.S. and Turkish Naval
Postgraduate School students from various military services got the survey. We excluded
47 incomplete surveys (7 incomplete Turkish responses and the 45 potential student after
we closed the survey) from the analysis. The demographics of the 40 Turkish and 40 U.S.
officer respondents is as follows (see Figure 11): 19 Turkish army, 10 Turkish Navy and
11 Turkish Air Force; 6 U.S. Army, 15 U.S. Navy, 5 U.S. Air Force and 12 U.S. Marine
Corps.

50
Figure 11. Distribution of the Participants According to Their Service Branches
All of the participants are considered mid-managers of their organizations.
Participants’ number of years of service is shown in Figure 12.
Figure 12. Distribution of the Participants According to Their Years of Experience
19
10 11
6
15
7
12
0
2
4
6
8
10
12
14
16
18
20
Army Navy Air Force Marine Corps
TR US
13
21
6 0 1
22
12
5
0
5
10
15
20
25
1-5 yrs 6-10 yrs 11-15 yrs >15 yrs
TR US

51
B. RESULTS
The “Measuring Organizational Readiness to Change and Continuous
Improvement for Lean Six Sigma Implementation” survey consists of two separate
surveys: “Measurement of Perceived Organizational Readiness for Change” (Cinite et al.,
2009) and “Continuous Quality Improvement Climate Survey” (Dana, 2004). Using these
surveys participants’ military organizations may be analyzed separately. But since our
goal is to determine cultural differences between Turkish and U.S. military organizations,
we will focus on comparing results in general.
1. Measurement of Perceived Organizational Readiness for Change
This survey consists of five subtitles; the first three provide information about
readiness for change, and the last two subtitles evaluate unreadiness of the organization
for change. Cinite, Duxbury, and Higgins allocate the questions according to the
following subheadings:
• Readiness for change:
• Part 1 Commitment of senior management to the change Q1-Q4
• Part 2 Competence of change agents Q5-Q8
• Part 3 Support of immediate manager Q9-Q11
• Unreadiness for change:
• Part 4 Poor communication of the change Q12-Q14
• Part 5 Adverse impact of the change on the work Q15-Q17 (Cinite at al., 2009)
Table 2 of the appendix shows PORC survey results for Turkish students, and
Table 3 shows PORC survey results for U.S. students.
The results of the survey indicate that the U.S. military’s readiness for change is
slightly higher than the Turkish military’s readiness for change. The means of the U.S.
officers’ answers for the readiness for change questions are higher than the means of the
Turkish officers’ answers for the same questions. Similarly, the means of U.S.
participants’ answers for the unreadiness for change questions are slightly lower than the

52
means of Turkish participants’ answers for the same questions. Although results show
differences between U.S. and Turkish military organizations, there are two important
points. First, as Figure 13 shows, the difference between the means is not largely
significant—the average of the differences of the means is 0.4.
Figure 13. Comparison of Measurement of Perceived Organizational Readiness for Change Survey Results
Secondly, for each question of the survey we conducted Pearson’s chi-square test
of independence to determine if there is a statistically significant difference between the
responses of two groups. Null hypothesis and alternative hypothesis are as follows:
• Ho: Survey results are independent of nationality.
• Ha: Survey results are not independent, that is Turkish and U.S. students’
responses are different.
As a result of chi-square test, five of seventeen questions chi-square p-value was
smaller than 0.05 so we rejected null hypothesis and we decided that answers of five
questions show statistically significant difference between U.S. and Turkish participants.
0.0
0.5
1.0
1.5
2.0
2.5
3.0
3.5
4.0
4.5
Q1 Q2 Q3 Q4 Q5 Q6 Q7 Q8 Q9 Q10 Q11 Q12 Q13 Q14 Q15 Q16 Q17
Mea
n
Survey Questions
TR US

53
The following are the Cinite, Duxbury and Higgins’s survey questions that we interpret to
be different for the two groups:
• Q6. Change agents provide valid arguments to justify the change (p-value: 0.0100)
• Q8. Change agents are competent to answer employee questions about the change. (p-value: 0.0069)
• Q9. Managers are held accountable for passing information on the change to their staff. (p-value: 0.0057)
• Q13. The reasons for the change are not well explained (p-value: 0.0264)
• Q16. Workloads do not permit people to get involved in the change initiatives. (p-value: 0.0200) (Cinite et al., 2009)
For other questions chi-square p-values were greater than 0.05 so we accepted
null hypothesis. Results of responses to the other questions were independent of
nationality.
2. Continuous Quality Improvement Climate Survey
Dana divides the questions into five parts for further analysisas follows:
• Internal customer (employee) focus and use of team process (Q1-Q10)
• Understanding of process (Q11-Q14)
• Use of data in decision-making (Q15-Q18)
• Common understanding of quality and customers’ needs and wants (Q19-Q21)
• Management’s opportunity to lead CQI (Q22-Q25) (Dana, 2004)
We used Dana’s (2004) CQI Climate Survey Report Generator to organize the
responses. Appendix Table 4 shows CQI Climate Survey Report for Turkish students and
Table 5 shows CQI Climate Survey Report for U.S. students. “Total agree” column in the
table shows sum of “strongly agree” and “agree” columns and defines the support of
respondents for that statement.

54
The results of CQI Climate Survey show that all means of U.S. participants’
responses are higher than the means of Turkish participants’ responses. The average of
the differences of the means is 0.5 (see Figure 14).
Figure 14. Comparison of CQI Climate Survey Results
As we did in the first survey, for each question of the CQI Climate Survey we
conducted Pearson’s chi-square test of independence to determine if there is a statistically
significant difference between the responses of the two groups. We had the same null and
the alternative hypothesis.
Results of the chi-square test of independence for the CQI Climate Survey was
different than the first survey. P-values for almost 50% of the questions (twelve of
twenty-five) were smaller than 0.05 so we rejected null hypothesis for the Dana’s
following survey questions and we concluded that responses to the questions show
statistically significant difference between U.S. and Turkish participants:
• Q1. I know what is expected of me at work. (p-value: 0.0108)
• Q2. I have the materials and equipment I need to do my work well. (p-value: 0.0012)
• Q4. Someone at work encourages me to develop my skills. (p-value: 0.0381)
0.00.51.01.52.02.53.03.54.04.55.0
Q1
Q2
Q3
Q4
Q5
Q6
Q7
Q8
Q9
Q10
Q11
Q12
Q13
Q14
Q15
Q16
Q17
Q18
Q19
Q20
Q21
Q22
Q23
Q24
Q25
Mea
n
Survey Questions
TR US
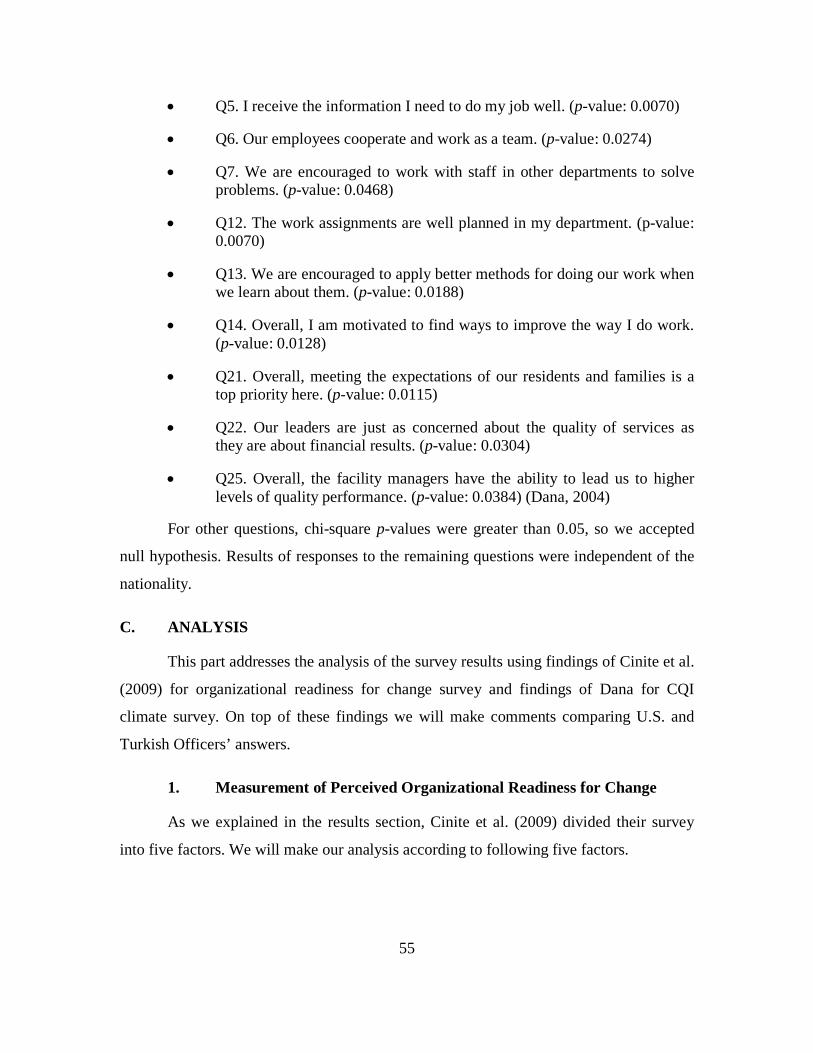
55
• Q5. I receive the information I need to do my job well. (p-value: 0.0070)
• Q6. Our employees cooperate and work as a team. (p-value: 0.0274)
• Q7. We are encouraged to work with staff in other departments to solve problems. (p-value: 0.0468)
• Q12. The work assignments are well planned in my department. (p-value: 0.0070)
• Q13. We are encouraged to apply better methods for doing our work when we learn about them. (p-value: 0.0188)
• Q14. Overall, I am motivated to find ways to improve the way I do work. (p-value: 0.0128)
• Q21. Overall, meeting the expectations of our residents and families is a top priority here. (p-value: 0.0115)
• Q22. Our leaders are just as concerned about the quality of services as they are about financial results. (p-value: 0.0304)
• Q25. Overall, the facility managers have the ability to lead us to higher levels of quality performance. (p-value: 0.0384) (Dana, 2004)
For other questions, chi-square p-values were greater than 0.05, so we accepted
null hypothesis. Results of responses to the remaining questions were independent of the
nationality.
C. ANALYSIS
This part addresses the analysis of the survey results using findings of Cinite et al.
(2009) for organizational readiness for change survey and findings of Dana for CQI
climate survey. On top of these findings we will make comments comparing U.S. and
Turkish Officers’ answers.
1. Measurement of Perceived Organizational Readiness for Change
As we explained in the results section, Cinite et al. (2009) divided their survey
into five factors. We will make our analysis according to following five factors.

56
a. Commitment of Senior Management to the Change
Cinite et al. (2009) say this factor explains perception of the officers “how senior
management acted during transformational change.” Higher results mean “there was a
champion of change at the most senior level, a senior management team who was
decisive with respect to organizational goals, priorities and strategies concerning change,
who defined the course of change and did not digress from it and who supported the
change, and leaders who demonstrated their commitment to change through their
behaviors” (Cinite et al., 2009). Figure 15 shows these results.
Figure 15. Comparison of PORC Survey Responses for Q1 to Q4
0%10%20%30%40%50%60%
SD D N A SA
Q1. Senior management is decisive with respect to organizational goals, priorities and
strategies concerning the change.
TR US
0%
10%
20%
30%
40%
50%
SD D N A SA
Q2. Leaders themselves have bought into the change and promote it by behaving in a
manner consistent with the change.
TR US
0%
10%
20%
30%
40%
50%
SD D N A SA
Q3. Senior management defines the course of change and stays the course for several
years
TR US
0%
10%
20%
30%
40%
50%
60%
SD D N A SA
Q4. There is a champion of change at the most senior level of the organization
TR US

57
As indicated in Figure 16, for this factor there is almost no difference between the
answers of the U.S. and Turkish students. Moreover as a result of Pearson’s chi-square
test of independence, none of four questions shows statistically significant difference
between two groups. So we inferred that senior management of the two military
organizations consistently support the change initiatives.
Figure 16. Comparison of PORC Survey Responses for Factor 1
Figure 16 makes it easier to compare all four questions of factor 1. We can easily
see in Figure 16 that responses of two groups are very similar, with the U.S. respondents
generally having slightly greater agreement with the statements..
b. Competence of Change Agents
Cinite et al. (2009) point out that “this factor was related to the actions and
behaviors of those who had been charged with implementing the change-change agents.”
Higher results imply organization is ready for change “when change agents had done
research to select the right types of change, considered different options with respect to
3%
3%
3%
8%
3%
3%
3%
3%
15%
15%
10%
10%
15%
8%
13%
10%
40%
13%
43%
30%
30%
20%
20%
25%
33%
53%
35%
30%
43%
43%
53%
45%
10%
18%
10%
23%
10%
28%
13%
18%
0% 10% 20% 30% 40% 50% 60% 70% 80% 90% 100%
Q4 TR
Q4 US
Q3 TR
Q3 US
Q2 TR
Q2 US
Q1 TR
Q1 US
A. Commitment of senior management to the change
Strongly Disagree Disagree Neither A Nor D Agree Strongly Agree

58
implementing the change, had provided valid arguments to justify the change, and could
answer employee questions about the change” (Cinite et al., 2009).
This factor shows the most prominent difference between two groups; two of four
questions are significantly different. Figure 17 shows the results. Firstly, every change
initiative needs responsible change agents. Lack of these agents may cause failure of
understanding the cause of the problem by other employees. Secondly, the roles of the
change agents are specifically crucial for a successful implementation of a LSS project.
Because LSS requires an assigned project group members of green, yellow or black belts
to conduct the LSS project and track improvements. Hence, while practicing LSS, this
factor could be a critical obstacle for the Turkish army. In order to cope with this
problem, Turkish change agents should be more willing to answer the questions about the
change model and convince others assuring all aspects of the change including solid
results driven by the improvements.
Figure 17. Comparison of PORC Survey Responses for Q5 to Q8
0%10%20%30%40%50%
SD D N A SA
Q5. Change agents have done research to select the right type of change that addresses the underlying causes of organizational problems rather than just
symptoms
TR US
0%
10%
20%
30%
40%
50%
SD D N A SA
Q6. Change agents provide valid arguments to justify the change
TR US
0%
10%
20%
30%
40%
50%
SD D N A SA
Q7. Change agents have considered different options of change implementation
TR US
0%10%20%30%40%50%60%
SD D N A SA
Q8. Change agents are competent to answer employee questions about the change
TR US

59
Figure 18. Comparison of PORC Survey Responses for Factor 2
Figure 18 makes it easier to compare all four questions of factor 2. Differences for
Question 6 and Question 8 are clear in Figure 18.
c. Support of Immediate Manager
Cinite et al. (2009) state that this factor indicates whether supervisors support
their subordinates throughout the change process or not. They say this factor assesses
whether “employees perceived their organization to be ready for change when their
immediate manager encouraged their staff to participate in the change initiatives,
acknowledged the impact of the change on people, and shared information provided from
upper management on the change” (Cinite et al., 2009). Figure 19 shows these results.
3%
0%
5%
3%
0%
0%
0%
3%
33%
5%
25%
5%
33%
5%
33%
10%
30%
30%
20%
38%
25%
45%
25%
30%
33%
50%
30%
43%
35%
35%
33%
45%
3%
15%
20%
13%
8%
15%
10%
13%
0% 10% 20% 30% 40% 50% 60% 70% 80% 90% 100%
Q8 TR
Q8 US
Q7 TR
Q7 US
Q6 TR
Q6 US
Q5 TR
Q5 US
B. Competence of change agents
Strongly Disagree Disagree Neither A Nor D Agree Strongly Agree

60
Figure 19. Comparison of PORC Survey Responses for Q9 to Q11
Participants of our survey are middle supervisors of their organizations so they
will be the immediate managers for any change effort among the organization. Their role
to deliver the information about the change to their team is crucial. We infer from the
results of this factor questions that Turkish middle supervisors should be held more
responsible in their role as immediate managers. We may also say that middle managers
in Turkish military organizations are less effective in supporting the change.
0%
20%
40%
60%
80%
SD D N A SA
Q9. Managers are held accountable for passing information on the change to their
staff
TR US
0%
10%
20%
30%
40%
50%
SD D N A SA
Q10. Managers acknowledge the impact the change may have on their staff
TR US
0%
10%
20%
30%
40%
50%
SD D N A SA
Q11. The immediate supervisors encourage their staff to participate in the change
process
TR US

61
Figure 20. Comparison of PORC Survey Responses for Factor 3
Figure 20 makes it easier to compare all three questions of factor 3 and the
difference in Question 9 is clearly noticeable.
d. Poor Communication of Change
Starting from this factor, last two factors indicate incorrect practices for the
change so results of these questions show how unready organizations are for a change
process. According to Cinite et al. (2009) first part examines the effects of poor
communication on change. “Public servants believed the organization was not ready to
implement change successfully when employees were not provided a vision for the
change, the reasons behind the change or the expected outcomes and benefits of the
change” (Cinite et al., 2009). Figure 21 summarizes the results.
15%
3%
15%
3%
18%
3%
43%
33%
33%
28%
30%
18%
23%
45%
35%
48%
30%
70%
15%
20%
13%
23%
20%
10%
0% 10% 20% 30% 40% 50% 60% 70% 80% 90% 100%
Q11 TR
Q11 US
Q10 TR
Q10 US
Q9 TR
Q9 US
C. Support of immediate manager
Strongly Disagree Disagree Neither A Nor D Agree Strongly Agree

62
Figure 21. Comparison of PORC Survey Responses for Q12 to Q14
For the three questions of this factor, average of Turkish participants answers are
0.4 point higher than U.S. participants. Therefore, we may infer that due to
communication of change Turkish military organizations seem less ready to implement
change. But there is siginificant difference between two groups only for explaining the
reasons of the change. So Turkish military organizations should pay attention explaining
reasons of a change effort throughout the organization.
0%
10%
20%
30%
40%
SD D N A SA
Q12. The outcomes and benefits of the change are not well explained
TR US
0%
10%
20%
30%
40%
50%
SD D N A SA
Q13. The reasons for the change are not well explained
TR US
0%
10%
20%
30%
40%
SD D N A SA
Q14. There is no vision for the change that everybody in the organization understands
TR US

63
Figure 22. Comparison of PORC Survey Responses for Factor 4
Figure 22 makes it easier to compare all three questions of factor 4 and the
difference for Question 13 is clear.
e. Adverse Impact of the Change on Work
Cinite et al. (2009) state this factor involved five questions related to perception
of change’s negative effect on work environment. “Public servants saw their organization
as not being ready for change when new duties were added on top of the old ones, people
were discouraged from saying ‘no’ to work, and their workloads increased” (Cinite et al.,
2009). Figure 23 summarizes the results.
13%
8%
10%
5%
8%
5%
23%
33%
15%
30%
18%
38%
13%
35%
23%
40%
33%
30%
30%
15%
40%
25%
25%
23%
23%
10%
13%
0%
18%
5%
0% 10% 20% 30% 40% 50% 60% 70% 80% 90% 100%
Q14 TR
Q14 US
Q13 TR
Q13 US
Q12 TR
Q12 US
D. Poor communication of change
Strongly Disagree Disagree Neither A Nor D Agree Strongly Agree

64
Figure 23. Comparison of PORC Survey Responses for Q15 to Q17
Similar to the previous factor, Turkish participants’ average of answers are higher
than U.S. participants meaning that any change process may result negative effects on
work for Turkish military organization members. The main reason for this adverse impact
looks like caused by extra workload created from change process. If organization
members are already too busy with their current assignments, they may not want to
support and be involved in any change initiative. Therefore, change process should
remove some of old tasks and create space for members to work and think about change.
0%10%20%30%40%50%
SD D N A SA
Q15. The change process does not involve the phasing out of old duties, and the
employee is expected to do both the old and the new duties
TR US
0%
10%
20%
30%
40%
SD D N A SA
Q16. Workloads do not permit people to get involved in the change initiatives
TR US
0%
10%
20%
30%
40%
SD D N A SA
Q17. People are discouraged from saying ‘no’ to work – even when the assigned task
is not a priority
TR US

65
Figure 24. Comparison of PORC Survey Responses for Factor 5
Figure 24 makes it easier to compare all three questions of factor 5 and we can see
the difference for Q15 obviously.
2. Continuous Quality Improvement Climate Survey
We will divide Dana’s CQI Climate Survey into five parts and separately analyze
what each factor means and compare our results from NPS U.S. and Turkish students’
responses.
a. Internal Customer Focus and Use of Team Process
According to Dana, low “total agree” results for the questions in this factor (Q1-
Q10) show that personnel is not convinced with the goal of the organization and may not
assist change efforts. There may also problems with the participation of employees to
team projects. Responses to Questions 1–5 indicate personnel’s individual involvement in
his or her job. Questions 6–10 are more likely about team work in the organization and
especially question 10 is the summary of this factor (Dana, 2004).
8%
8%
5%
8%
5%
8%
15%
23%
20%
23%
15%
40%
10%
30%
18%
30%
20%
20%
38%
18%
23%
35%
40%
20%
30%
23%
35%
5%
20%
13%
0% 10% 20% 30% 40% 50% 60% 70% 80% 90% 100%
Q17 TR
Q17 US
Q16 TR
Q16 US
Q15 TR
Q15 US
E. Adverse impact of the change on work
Strongly Disagree Disagree Neither A Nor D Agree Strongly Agree

66
Figure 25. Comparison of CQI Survey Results for Factor 1
This factor shows the most dominant distinction between the Turkish and U.S.
respondants. Difference between the average of means is highest with the average of 0.7
for the first ten questions. And according to the Pearson’s chi-square test six of ten
questions’ responses show statistically significant difference among the two groups.
Moreover “total agree” columns for the first ten questions in Table 4 and Table 5 are
another indicator for the gap between Turkish and U.S. officers. We can make many
comments on these results but we think this factor has a small effect on LSS aplication in
an organization since questions in this factor focus on individual employees’ perceptions.
So we will focus on some remarkable findings that may affect the change process in a
Turkish military organization.
Dana’s (2004) question 5 has the smallest “total agree” percentage of 38% for
Turkish respondants in this factor: “ I receive the information I need to do my job
well.”The same percentage for U.S. participants is 73%. Poor communication between
leaders and employees may cause severe damage to the organization. Leaders may have
the perfect plans for change but they will probably fail if the personnel do not show the
performance they are asked for. Immediate managers play a critical role as a bridge
between senior management and the staff. As a result, Turkish military organizations may
0%10%20%30%40%50%60%70%80%90%100%
0.0
0.5
1.0
1.5
2.0
2.5
3.0
3.5
4.0
4.5
Q1 Q2 Q3 Q4 Q5 Q6 Q7 Q8 Q9 Q10
Tota
l Agr
ee
Mea
n Internal customer focus and use of team process
TR Mean US Mean TR Total Agree US Total Agree

67
need to increase communication channels among the organization and encourage
personnel to participate more in team assignments.
There is 11% difference between the “total agree” column of Dana’s question 10
about leaders’ care on staff; 78% in U.S. responses and 67% in Turkish responses. There
is not a significant difference and we assess these percentages are low for both sides. As
expected from a military organization, leaders always need to care about their
subordinates. This would also help them to understand what they need to focus on
implementing a change process. Leaders in military organizations need to remove
obstacles both between them and their staff and among their personnel so that everyone
can easily communicate about their job including change processes.
b. Understanding of Process
Dana (2004) says low “total agree” in this factor points out that senior
management and personnel do not understand how control of work processes affect
quality of the job they do. Responses of questions in this factor indicate how the
organization behaves when something goes wrong and personnel’s perception of quality
of planning in the organization. And lastly we can see if staff try to improve the work
processes by themselves.
Figure 26. Comparison of CQI Survey Results for Factor 2
2.7 2.9
3.2 3.7
3.3 3.5
4.0 4.3
23% 28%
46%
68%
48% 53%
75% 85%
0%10%20%30%40%50%60%70%80%90%100%
0.00.51.01.52.02.53.03.54.04.5
Q11 Q12 Q13 Q14
Tota
l Agr
ee
Mea
n
Understanding of process
TR Mean US Mean TR Total Agree US Total Agree

68
In this factor also difference between two groups is explicitly certain. Difference
between the average of means is 0.6 for questions 11–14. And according to the Pearson’s
chi-square test three of four questions’ responses show statistically significant difference
between the two groups. Dana’s (2004) Question 11 in this factor “When something goes
wrong, we look at the way we do our work rather than blaming people” has the smallest
“total agree” percentage of the whole survey with 23% for Turkish respondants. U.S.
officers’ “total agree” percentage is 48% for the same question. We can accept results
normal for a military organizations since every military personnel is held accountable for
his or her action. But this should not prevent leaders to look for possible problems in the
work processes. Another problem we can infer from results is potential problems about
planning. A twenty-eight percent “total agree” percentage in question 12 about
assignment planning for Turkish respondents tells us we need to work on this issue.
Lean Six Sigma may be a perfect solution to organizational problems related to
this factor about work processes since with LSS, change agents will focus on improving
processes whether personnel causes the problems or not. Ultimate goal must be having a
better work process without blaming anyone in the organization. Once a process is
analyzed and reallocated with LSS, the new process will also help planning the workload
according to workforce.
c. Use of Data in Decision Making
In this factor for question 15–18, Dana (2004) points out a low “total agree”
means personnel in an organization does not evaluate quality of their work properly and
organization does not use the information system effectively to improve their quality and
for decision-making. An organization may find the reasons of many of its problems with
the data among the organization; see Figure 27.

69
Figure 27. Comparison of CQI Survey Results for Factor 3
There are little differences between Turkish and U.S. officers’ responses both in
average and “total agree” columns and Pearson’s chi-square test of independence does
not show any statistically significant difference for four questions in this factor. The
reason may be there are certain standards for almost every military assignment and
personnel and jobs are evaluated according to these standards. This standardization
practices might make it easier for LSS specialists to analyze processes and identify
possible problems. But we are not saying data collection in military organizations is
perfect. None of the “total agree” columns is over 80% for both Turkish and U.S.
participants. So during a LSS analysis standards for that job need to be reevaluated.
d. Common Understanding of Quality and Customer’s Wants and Needs
In this factor, a low “total agree” score indicates confusion about the meaning of
quality and the perception that other priorities are frequently “trumping” a commitment to
meet the needs and wants of the residents” (Dana, 2004). Questions 19–21 aim to explain
organization’s priorities among the customers. Figure 28 summarizes the findings.
3.6 3.5 3.3 3.3
4.1 4.0 3.8 3.6
55% 56%
43% 45%
79% 74%
70%
53%
0%10%20%30%40%50%60%70%80%90%100%
0.0
0.5
1.0
1.5
2.0
2.5
3.0
3.5
4.0
4.5
Q15 Q16 Q17 Q18
Tota
l Agr
ee
Mea
n Use of data in decision-making
TR Mean US Mean TR Total Agree US Total Agree

70
Figure 28. Comparison of CQI Survey Results forFactor 4
This factor does not seem to contribute our study about Lean Six Sigma
implementation but it might worthwhile to discuss the noteworthy difference between
two groups for question 21: “Overall, meeting the expectations of our residents and
families is a top priority here.” This is the only statement in this factor that shows
statistically significant difference according to the results of Pearson’s chi-square test of
independence. We can also see the gap between two groups in “total agree” percentages;
35% for Turkish students and 75% for U.S. students.
e. Management’s Opportunity to Lead CQI
Dana (2004) says a low “total agree” result for this factor shows we need to
question management styles in the organization before attempting to make any important
changes. We will assess question 22 differently than the author since military
organizations are non-profit organizations. But still financial decisions are as important as
private companies because military organizations spend the taxpayer’s money. See
Figure 29 for a summary of the results.
3.3
3.9
3.2 3.6
4.3 3.8
45%
70%
35%
53%
92%
75%
0%10%20%30%40%50%60%70%80%90%100%
0.00.51.01.52.02.53.03.54.04.5
Q19 Q20 Q21
Tota
l Agr
ee
Mea
n Common understanding of quality and customers' needs
and wants
TR Mean US Mean TR Total Agree US Total Agree

71
Figure 29. Comparison of CQI Survey Results for Factor 5
Two of four questions show statistically significant difference according to
Pearson’s chi-square test; Q22 about concerns of financial results over quality and Q25
about faith in managers achieving higher quality performance. Looking at the gap
between “total agree” columns for Q22, 40% of Turkish respondents and over 69% of
U.S. respondents, we may conclude that financial results have an important effect on
Turkish military organizations’ decisions.
It is reasonable that military leaders need to focus more on financial issues than
before due to the burden of accomplishing more goals with smaller budgets. Lean Six
Sigma may help military organizations become more cost effective while getting the
same level of outcome. Lean Six Sigma will also increase the trust of personnel to their
managers for reaching greater levels of quality. Accepting and implementing Lean Six
Sigma method will prove the desire of management to improve their organization.
3.2 3.3
2.7
3.2
3.9 3.5
3.1
3.7
40% 43%
25%
43%
69%
58%
36%
64%
0%10%20%30%40%50%60%70%80%90%100%
0.0
0.5
1.0
1.5
2.0
2.5
3.0
3.5
4.0
4.5
Q22 Q23 Q24 Q25
Tota
l Agr
ee
Mea
n Management's opportunity to lead
TR Mean US Mean TR Total Agree US Total Agree

72
THIS PAGE INTENTIONALLY LEFT BLANK
73
VIII. CONCLUSION AND RECOMMENDATIONS
A. CONCLUSION
The purpose of our study was to determine if Lean Six Sigma can be successfully
implemented in the Turkish army. As demonstrated in Chapter III of this study, many
military organizations in United States took advantage of Lean Six Sigma and improved
their processes. Since the change is extremely related with the organizational culture, we
tried to find out possible obstacles of LSS implementation due to cultural differences
between Turkish and U.S. military organizations.
Even if Hoftsede’s cultural dimensions results, explained in Chapter IV and seen
in Figure 6, say Turkish and U.S. cultures differ significantly in general we found out that
these cultural differences get smaller in the comparison of Turkish and U.S. military
organizations. As a result of our “Measuring Organizational Readiness to Change and
Continuous Improvement for Lean Six Sigma Implementation” survey, cultural
differences between two groups is not an insurmountable hurdle. Cultural differences in
terms of readiness to change and continuous improvement between Turkish and U.S.
military organizations are not significant. These differences will not prevent
implementations of successful Lean Six Sigma projects in Turkish military organizations.
Military organizations generally have a disadvantage for change since change
happens slowly and requires quite a lot effort in military organizations. For Turkish
military culture we found out that our respondents as middle managers of their
organizations are as open to change as their U.S. counterparts. Turkish military culture
will accept change initiatives as long as they are supported by senior management and
change is communicated well enough among the organization.
B. RECOMMENDATIONS
We believe Lean Six Sigma is a solid, proven methodology for improving any
work process. Many large companies all around the world have been using this
methodology for a long time and firms in Turkey started to join this group. In Chapter III
we analyzed successful implementations of LSS in military organizations.

74
Based on the results of our survey, we suggest a brief roadmap to implement LSS
in the Turkish army. The first step would be determining the processes to which LSS
should be applied and discussing the potential benefits.
The second step would be training personnel to apply Lean Six Sigma projects.
LSS has an expertise hierarchy that defines the role of individuals in a LSS project shown
in Figure 30. Training of personnel and implementing LSS projects may start at the same
time. A green belt certificate requires to finish a LSS project so during their training
military personnel might work on small projects coordinated and assigned by instructors
and military organizations.
Figure 30. Lean Six Sigma Belts Hierarchy and Roles in the Organization
Source: Lean Six Sigma, (n.d.), retrieved October 23, 2015, from https://en.wikipedia.org/wiki/Lean_Six_Sigma
Cole (2011, pp. 13–29) describes challenges for the public sector to use Lean Six
Sigma. In the light of results of our survey, we must consider both Cole’s challenges for
the Turkish army and possible solutions:
• Hierarchical environment: This can be converted to an advantage if senior management fully support the change efforts and LSS projects.

75
• Lack of common goals: Military organizations’ goals may vary but separate LSS projects can be applied to support different goals.
• Leadership support for organization-wide programs is difficult to obtain: It will be very difficult to monitor change efforts for all Turkish army. Instead LSS project groups can carry out projects in battalion or brigade level even if project subjects are similar.
• Lack of profit or revenue focus: Military organizations can assess success of LSS projects with cost savings and improvements on the standards.
• Lack of customer focus: Military organizations do not have direct customers to measure customer satisfaction level but LSS project teams should publish their results among the whole organization or with the public.
• Limited sense of urgency: Leaders and change agents need to create necessary urgency among the organization subject to change effort.
• High employee turnover: This rate is even higher in military organizations than the other public groups so LSS project team must explain current LSS projects in an organization to newcomers during orientation training. Also change agents need to keep procedures and culture created by LSS teams.
• Mix employee types: LSS project teams will need to explain change initiatives from senior leaders to privates since change will affect all personnel in the organization.
Apte and Kang (2006) provide valuable lessons as a result of their study about
Lean Six Sigma implementation experiences in U.S. military organizations. The
following lessons are also applicable for LSS deployment in the Turkish army since we
have concluded that the perception of readiness for change and continuous improvement
in the Turkish army is slightly similar to U.S. military:
• Active support of senior leaders is a necessity: Senior commanders must clarify need for change and promote the change initiative throughout the organization.
• Initial successes are critically important: First projects to implement Lean Six Sigma must be chosen carefully and talented personnel should be assigned. The first successful results will lead expanding organizational support for future LSS projects.
• Emphasize continuing education and training: Belt training is an integral part of Lean Six Sigma. Turkish army needs to start a LSS certification program and deliver required belts to LSS project team members. Each

76
project must be directed by a black belt and team members should have green belts.
• Monitor the Lean Six Sigma projects: Senior management must give tangible objectives to LSS project leaders and hold them responsible for outcomes.
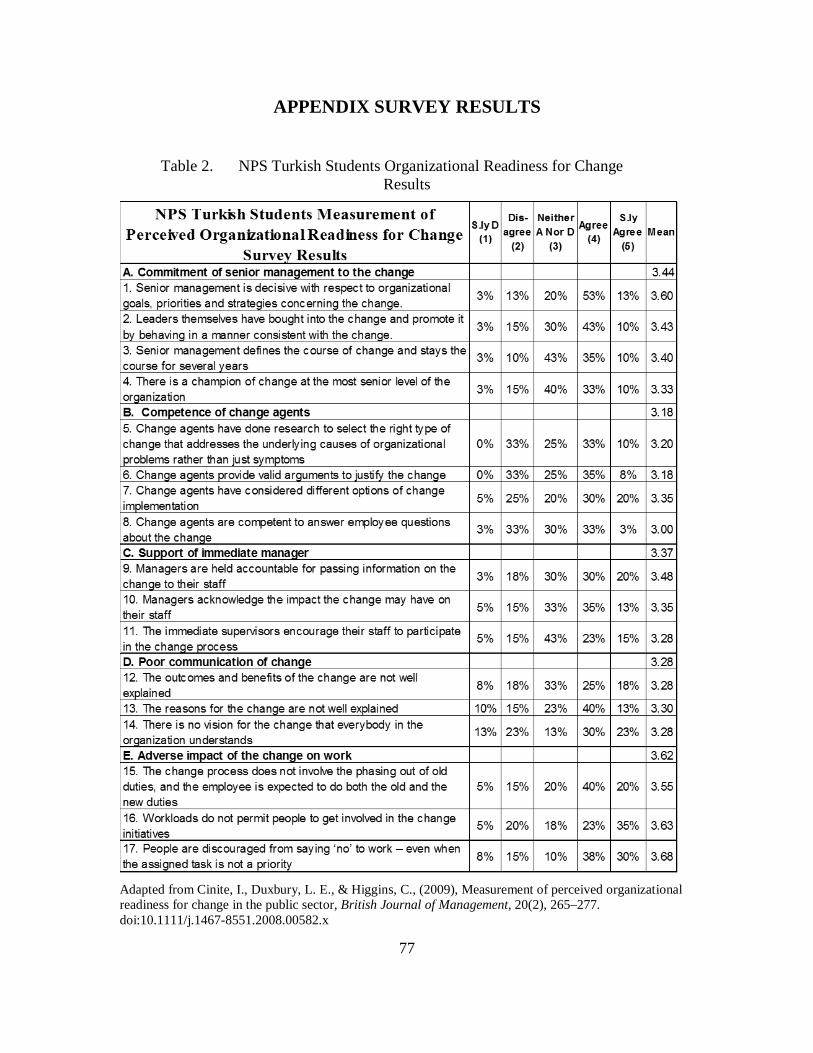
77
APPENDIX SURVEY RESULTS
Table 2. NPS Turkish Students Organizational Readiness for Change Results
Adapted from Cinite, I., Duxbury, L. E., & Higgins, C., (2009), Measurement of perceived organizational readiness for change in the public sector, British Journal of Management, 20(2), 265–277. doi:10.1111/j.1467-8551.2008.00582.x
NPS Turkish Students Measurement of Dis- Neither S.ly
Perceived Organizational Readiness for Change S.lyD
agree A NorD Agree
Agree Mean (1)
(2) (3) (4)
(5) Survey Results
A. Commitment of senior management to the change 3.44 1. Senior management is decisive with respect to organizational
3% 13% 20% 53% 13% 3.60 goals, priorities and strategies concerning the change. 2. Leaders themselves have bought into the change and promote it
3% 15% 30% 43% 10% 3.43 by behaving in a manner consistent with the change. 3. Senior management defines the course of change and stay s the
3% 10% 43% 35% 10% 3.40 course for several years 4. There is a champion of change at the most senior level of the
3% 15% 40% 33% 10% 3.33 organization B. Competence of change agents 3.18 5. Change agents have done research to select the right type of change that addresses the underlying causes of organizational 0% 33% 25% 33% 10% 3.20 problems rather than just symptoms 6. Change agents provide valid arguments to justify the change 0% 33% 25% 35% 8% 3.18 7. Change agents have considered different options of change
5% 25% 20% 30% 20% 3.35 implementation 8. Change agents are competent to answer employee questions
3% 33% 30% 33% 3% 3.00 about the chanqe C. Support of immediat e manaoer 3.37 9. Managers are held accountable for passing information on the
3% 18% 30% 30% 20% 3.48 change to their staff 10. Managers acknowledge the impact the change may have on
5% 15% 33% 35% 13% 3.35 their staff 11. The immediate supervisors encourage their staff to participate
5% 15% 43% 23% 15% 3.28 in the change process D. Poor communication of change 3.28 12. The outcomes and benefits of the change are not well
8% 18% 33% 25% 18% 3.28 explained 13. The reasons for the change are not well explained 10% 15% 23% 40% 13% 3.30 14. There is no vision for the change that everybody in the
13% 23% 13% 30% 23% 3.28 organization understands E. Adverse impact of the change on work 3.62 15. The change process does not involve the phasing out of old duties, and the employee is expected to do both the old and the 5% 15% 20% 40% 20% 3.55 new duties 16. Workloads do not permit people to get involved in the change
5% 20% 18% 23% 35% 3.63 initiatives 17. People are discouraged from saying 'no' to work - even when
8% 15% 10% 38% 30% 3.68 the assigned task is not a priority

78
Table 3. NPS U.S. Students Organizational Readiness for Change Results
Adapted from Cinite, I., Duxbury, L. E., & Higgins, C., (2009), Measurement of Perceived Organizational Readiness for Change in the Public Sector, British Journal Of Management, 20(2), 265–277. doi:10.1111/j.1467-8551.2008.00582.x
NPS U.S. Students Measurement of Perceived Cis· Neither S.ly
Organizational Readiness for Change Survey S.lyO
agree ANorO Agree
Agree Mean (1)
(2) (3) (4)
(5) Results
A. Commitment of senior management to the change 3.67 1. Senior management is decisive Vvith respect to organizational
3% 10% 25% 45% 18% 3.65 goals, priorities and strategies concerning the change. 2. Leaders themselves have bought into the change and promote it
3% 8% 20% 43% 28% 3.85 by behaving in a manner consistent Vvith the change. 3. Senior management defines the course of change and stays the
8% 10% 30% 30% 23% 3.50 course for several years 4. There is a champion of change at the most senior level of the
3% 15% 13% 53% 18% 3.68 organization B. Competence of change agents 3.62 5. Change agents have done research to select the right type of change that addresses the underlying causes of organizational 3% 10% 30% 45% 13% 3.55 problems rather than just symptoms 6. Change agents provide valid arguments to justify the change 0% 5% 45% 35% 15% 3.60 7. Change agents have considered different options of change
3% 5% 38% 43% 13% 3.58 implementation 8. Change agents are competent to answer employee questions
0% 5% 30% 50% 15% 3.75 about the change C. Suooort of immediate manaaer 3.87 9. Managers are held accountable for passing information on the
0% 3% 18% 70% 10% 3.88 change to their staff 10. Managers acknoVvledge the impact the change may have on
0% 3% 28% 48% 23% 3.90 their staff 11. The immediate supervisors encourage their staff to participate
0% 3% 33% 45% 20% 3.83 in the change process D. Poor communication of change 2.86 12. The outcomes and benefits of the change are not well
5% 38% 30% 23% 5% 2.85 exolained 13. The reasons for the change are not well explained 5% 30% 40% 25% 0% 2.85 14. There is no vision for the change that everybody in the
8% 33% 35% 15% 10% 2.88 organization understands E. Adverse imoact of the chanae on work 3.08 15. The change process does not involve the phasing out of old duties, and the employee is expected to do both the old and the 8% 40% 20% 20% 13% 2.90 new duties 16. Workloads do not permit people to get involved in the change
8% 23% 30% 35% 5% 3.08 initiatives 17. People are discouraged from saying 'no' to mrk - even Vvhen
8% 23% 30% 18% 23% 3.25 the assigned task is not a priority

79
Table 4. NPS Turkish Students CQI Climate Survey Results
Adapted from Dana, B., (2004), Continuous Quality Improvement (CQI) Readiness Assessment Process and Tool, American Health Care Association, retrieved September 11, 2015 from http://www.ahcancal.org/ncal/quality/documents/cqi_rai_tool.pdf
20"/o 25% 20"/o 30% 5% 3.3 45%
m y 25% 45% 23% 8% 0% 3.9 70%
the expectations o f our resi~nts and famili e s is 10"/o 25% 43% 20% 3% 3.2 35%
18% 23% 28% 25% 8% 3.2 40%
r athe r tban

80
Table 5. NPS U.S. Students CQI Climate Survey Results
Adapted from Dana, B., (2004), Continuous Quality Improvement (CQI) Readiness Assessment Process and Tool, American Health Care Association, retrieved September 11, 2015 from http://www.ahcancal.org/ncal/quality/documents/cqi_rai_tool.pdf
2 1% 32% 34% 13% 0"/o 3.6 53%
38% 54% 5% 3% 0"/o 43 92%
17% 58% 17% 8% 0"/o 3.8 75%
2 8% 42% 2 5% 6% 0"/o 3 9 69%

81
LIST OF REFERENCES
Antony, B., & Banuelas, R. (2001). A strategy for survival. Manufacturing Engineer, 80(3), 119–121.
Apte, U., & Kang, K. (2006). Lean Six Sigma for Reduced Cycle Costs and Improved Readiness. (NPS-GSBPP-06-019). Monterey, CA: Naval Postgraduate School. Retrieved from https://calhoun.nps.edu/bitstream/handle/10945/33800/NPS-LM-06-033.pdf?sequence=3&isAllowed=y
Balogun, J., & Haily, V. H. (2004). Exploring Strategic Change (2nd ed.). London: Prentice Hall.
Blakeslee, J. A. (1999). Implementing the Six Sigma solution. Quality Progress, 32(7), 77–85.
Burnes, B. (2004). Managing Change: A Strategic Approach to Organizational Dynamics (4th ed.). Harlow: Prentice Hall.
Carey, B. (n.d.). Integrating Lean Six Sigma into culture is like a merger. Retrieved October 22, 2015, from http://www.isixsigma.com/implementation/change-management-implementation/integrating-lean-six-sigma-culture-merger/
Cinite, I., Duxbury, L. E., & Higgins, C. (2009). Measurement of perceived organizational readiness for change in the public sector. British Journal of Management, 20(2), 265–277. doi:10.1111/j.1467-8551.2008.00582.x
Cole, B. (2011). Lean Six Sigma for the Public Sector. Milwaukee: ASQ Quality Press.
Cole, J. (2008). A Few Thoughts on Six Sigma Change Management. Retrieved November 3, 2015 from http://www.processexcellencenetwork.com/lean-six-sigma-business-transformation/articles/a-few-thoughts-on-six-sigma-change-management/http://www.processexcellencenetwork.com/lean-six-sigma-business-transformation/articles/a-few-thoughts-on-six-sigma-chang
Crom, S. (n.d.). Using Six Sigma in Europe: A cross-cultural perspective. Retrieved October 22, 2015, from http://www.isixsigma.com/regional-views/europe/using-six-sigma-europe-cross-cultural-perspective/
CTQ Tree. (2015). In Wikipedia. Retrieved June 13, 2015, from https://en.wikipedia.org/wiki/CTQ_tree
Dana, B. (2004). Continuous quality improvement (CQI) readiness assessment process and tool. Retrieved from http://www.ahcancal.org/ncal/quality/documents/cqi_ rai_ tool.pdf

82
De Mast, J. (2003). Quality improvement from the viewpoint of statistical method. Quality and Reliability Engineering International, 19, 255–264.
De Mast, J., Schippers, W. A. J., Does, R. J., & van den Heuvel, E. R. (2000). Steps and strategies in process improvement. Quality and Reliability Engineering International, 16, 300–311.
Dennis, p. (2002). Lean production simplified: A plain-language guide to the world’s most powerful production system. New York, NY: Productivity Press.
Deming Cycle. (2015). In Isixsigma. Retrieved June 13, 2015, from http://www.isixsigma.com/dictionary/deming-cycle-pdca/
Eckes, G. (2003). Six Sigma team dynamics: The elusive key to project success. Hoboken, NJ: John Wiley & Sons.
Goh, T. N. (2002). A strategic assessment of Six Sigma. Quality and Reliability Engineering International, 18, 403–410.
Goh, T. N., & Xie, M. (2004). Improving on the Six Sigma paradigm. The TQM Magazine, 16(4), 235–240.
Hahn, G.J., Hill, W.J.,Hoerl, R.W. & Zinkgraf, S.A. (1999). The impact of Six Sigma improvement – A glimpse into the future of statistics, The American Statistician, 53(3), 208–215
Hahn, G. J., Doganaksoy, N., & Hoerl, R. W. (2000). The evolution of Six Sigma. Quality Engineering, 12(3), 317–326.
Han, C., & Lee, Y. H. (2002). Intelligent integrated plant operation system for Six Sigma. Annual Reviews in Control, 26, 27–43.
Harry, M. J. (1997). The vision of Six Sigma: A roadmap for breakthrough (5th ed.). Phoenix, AZ: Tri Star.
Harry, M., & Schroeder, R. (2000). Six Sigma: The breakthrough management strategy revolutionizing the world’s top corporations. New York, NY: Doubleday.
Henderson, K. M., & Evans, J. R. (2000). Successful implementation of Six Sigma: Benchmarking General Electric Company. Benchmarking: An International Journal, 7(4), 260–281.
Hoerl, R. W., & Snee, R. D. (2002). Statistical thinking improving business performance. Pacific Grove, CA: Duxbury Press.
Jackson, T. (2006). Hoshin kanri for the lean enterprise: Developing competitive capabilities and managing profit. New York: Productivity Press.

83
Juran, J. M., & De Feo, J. (1999). Juran’s quality handbook: The Complete Guide to Performance Excellence (6th ed). New York, NY: McGraw-Hill.
Juran, J. M., & Godfrey, A. B. (Eds.). (1999). Juran’s quality handbook (5th ed.). New York, NY: McGraw-Hill.
Kettinger, W. J., & Grover, V. (1995). Special Section: Toward a Theory of Business Process Change Management. Journal of Management Information Systems, 12(1), 9–30.
Khlebnikova, E. (2012). Statistical tools for process qualification. Journal of Validation Technology, 18(2), 60–66.
Kotter, J. P. (1995). Leading Change: Why Transformation Efforts Fail. Harvard Business Review, 73(2), 59–67.
Lagrosen, Y., Chebl, R., & Max, R. T. (2011). Organisational learning and six sigma deployment readiness evaluation: A case study. International Journal of Lean Six Sigma, 2(1), 23–40. doi:http://dx.doi.org/10.1108/20401461111119431
Lean manufacturing. (2006). In Wikipedia. Retrieved August 8, 2006, from http://en.wikipedia.org/wiki/Lean_manufacturing
Levinson, W. A. (2002). Henry Ford’s Lean vision: Enduring principles from the first Ford Motor plant. New York, NY: Productivity Press.
Linderman, K., Schroeder, R. G., Zaheer, S., & Choo, A. S. (2003). Six Sigma: A goal theoretic perspective. Journal of Operations Management, 21, 193–203.
Locke, E. A., & Latham, G. P. (2002). A theory of goal setting & task performance. Englewood Cliffs, NJ: Prentice Hall.
Magnusson, K., Kroslid, D. and Bergman, B. (2003), Six Sigma: the Pragmatic Approach (2nd ed.). Lund: Studentlitteratur.
McAdam, R. & Evans, A. (2004). Challenges to Six Sigma in a high technology mass manufacturing environments. Total Quality Management, 15(6), 699–706.
Montgomery, D. C. (2001). Beyond Six Sigma. Quality and Reliability Engineering International, 17(4), iii–iv.
National culture. (n.d.). Retrieved October 22, 2015, from http://geert-hofstede.com/national-culture.html
Ohno, T. (1988). Toyota production system: Beyond large-scale production. New York, NY: Productivity Press.

84
Pande, p.S., Neuman, R. P., & Cavanagh, R. R. (2000). The Six Sigma way. New York, NY: McGraw-Hill.
Pearson’s chi-squared test. (n.d.). In Wikipedia. Retrieved October 23, 2015, from https://en.wikipedia.org/wiki/Pearson%27s_chi-squared_test
Pearson, K. (1900). On the criterion that a given system of deviations from the probable in the case of a correlated system of variables is such that it can be reasonably supposed to have arisen from random sampling. Philosophical Magazine Series, 550(302), 157–175. doi:10.1080/14786440009463897
Process Capability Index. (n.d.). In Wikipedia. Retrieved October 23, 2015, from https://en.wikipedia.org/wiki/Process_capability_index
Robbins, S., & Judge, T. (2011). Essentials of organizational behavior (11th ed.). Upper Saddle River, N.J: Prentice Hall.
Sterman, J. D., Repenning, N. P., & Kofman, F. (1997). Unanticipated side effects of successful quality programs: Exploring a paradox of organizational improvement. Management Science, 43, 503–521.
Tadikamalla, p.R. (1994). The confusion over six sigma quality. Quality Progress, 27(10), 83–85
Trompenaars, A., & Hampden-Turner, C. (1998). Riding the waves of culture: Understanding cultural diversity in global business (2nd ed.). New York, NY: McGraw-Hill.
Using Six Sigma in Europe: A Cross-Cultural Perspective. (2014). In Lean6sigma4all.eu Retrieved June 14, 2015, from http://lean6sigma4all.eu/2014/12/07/using-six-sigma-in-europe-a-cross-cultural-perspective/
Westpal, J. D., Gulati, R., & Shorteli, S. M. (1997). Customization or conformity? An institutional and network perspective on the content and consequences of TQM adoption. Administrative Science Quarterly, 42, 366–394.
What is Six Sigma? (n.d.). In PQA.net. Retrieved June 13, 2015, from http://www.pqa.net/ProdServices/sixsigma/W06002002.html
What about Turkey? (n.d.). Retrieved October 22, 2015, from http://geert-hofstede.com/turkey.html
Wilder, B. (2013). All Aboard: Lean/Six Sigma is a journey best travelled with change management. Plant Services Magazine, 33(2), 38–42. Retrieved from http://www.lce.com/All_Aboard_LeanSix_Sigma_is_a_journey_best_travelled_with_change_management_561-item.html

85
Zbaracki, M. J. (1998). The rhetoric and reality of total quality management. Administrative Science Quarterly, 43, 602–636.

86
THIS PAGE INTENTIONALLY LEFT BLANK
87
INITIAL DISTRIBUTION LIST
1. Defense Technical Information Center Ft. Belvoir, Virginia 2. Dudley Knox Library Naval Postgraduate School Monterey, California


![PDF] A Six Sigma and DMAIC application for the reduction of ...characteristics, Six Sigma identifies and eliminates defects, mistakes or failures that may affect processes or systems.](https://static.fdocuments.in/doc/165x107/612dc94f1ecc5158694267ea/a-six-sigma-and-dmaic-application-for-the-reduction-of-characteristics-six-sigma.jpg)