Natural Resource Condition Assessment for Sagamore Hill ... · and damselflies, and salt marsh...
176
National Park Service U.S. Department of the Interior Natural Resource Stewardship and Science Natural Resource Condition Assessment for Sagamore Hill National Historic Site Natural Resource Report NPS/NCBN/NRR-2013/617
Transcript of Natural Resource Condition Assessment for Sagamore Hill ... · and damselflies, and salt marsh...

National Park Service U.S. Department of the Interior Natural Resource Stewardship and Science
Natural Resource Condition Assessment for Sagamore Hill National Historic Site Natural Resource Report NPS/NCBN/NRR-2013/617

ON THE COVER View of Cold Spring Harbor from the bridge over the Eel Creek salt marsh at Sagamore Hill National Historic Site. Photograph by MJ James-Pirri.

Natural Resource Condition Assessment for Sagamore Hill National Historic Site Natural Resource Report NPS/NCBN/NRR-2013/617
Mary-Jane James-Pirri Graduate School of Oceanography University of Rhode Island Narragansett, RI 02882
January 2013 U.S. Department of the Interior National Park Service Natural Resource Stewardship and Science Fort Collins, Colorado

ii
The National Park Service, Natural Resource Stewardship and Science office in Fort Collins, Colorado, publishes a range of reports that address natural resource topics. These reports are of interest and applicability to a broad audience in the National Park Service and others in natural resource management, including scientists, conservation and environmental constituencies, and the public.
The Natural Resource Report Series is used to disseminate high-priority, current natural resource management information with managerial application. The series targets a general, diverse audience, and may contain NPS policy considerations or address sensitive issues of management applicability.
All manuscripts in the series receive the appropriate level of peer review to ensure that the information is scientifically credible, technically accurate, appropriately written for the intended audience, and designed and published in a professional manner.
Data in this report were collected and analyzed using methods based on established, peer-reviewed protocols and were analyzed and interpreted within the guidelines of the protocols. This report received formal, high-level peer review based on the importance of its content, or its potentially controversial or precedent-setting nature. Peer review was conducted by highly qualified individuals with subject area technical expertise and was overseen by a peer review manager.
Views, statements, findings, conclusions, recommendations, and data in this report do not necessarily reflect views and policies of the National Park Service, U.S. Department of the Interior. Mention of trade names or commercial products does not constitute endorsement or recommendation for use by the U.S. Government.
This report is available from the IRMA Data Store (https://irma.nps.gov) and the Natural Resource Publications Management website (http://www.nature.nps.gov/publications/nrpm/).
Please cite this publication as:
James-Pirri, M. J. 2013. Natural resource condition assessment for Sagamore Hill National Historic Site. Natural Resource Report NPS/NCBN/NRR-2013/617. National Park Service. Fort Collins. Colorado.
NPS 419/119622, January 2013

iii
Contents Page
Figures............................................................................................................................................. v
Tables ............................................................................................................................................ vii
Appendices ..................................................................................................................................... ix
Executive Summary ....................................................................................................................... xi
Acknowledgments......................................................................................................................... xv
Chapter 1. NRCA Background Information ................................................................................... 1
Chapter 2. Introduction and Resource Setting ................................................................................ 5
2.1 Introduction ........................................................................................................................ 5
2.1.1 Enabling Legislation .................................................................................................. 5
2.1.2 Geographic Setting..................................................................................................... 5
2.1.3 Visitation Statistics .................................................................................................... 6
2.2 Natural Resources .............................................................................................................. 8
2.2.1 Ecological Units and Watershed ................................................................................ 8
2.2.2 Natural Resource Descriptions ................................................................................ 11
2.2.3 Resource Issues Overview ....................................................................................... 12
2.3 Resource Stewardship ...................................................................................................... 16
2.3.1 Management Directives and Planning Guidance ..................................................... 16
2.3.2 Status of Supporting Science ................................................................................... 16
2.4 Literature Cited ................................................................................................................ 20
Chapter 3 Study Scoping and Design ........................................................................................... 23
3.1 Preliminary Scoping ........................................................................................................ 23
3.1.1 Reporting Areas, Indicator framework, and General Approach .............................. 23
Chapter 4 Natural Resource Conditions ....................................................................................... 25

iv
Contents (continued) Page
4.1 Biological Integrity .......................................................................................................... 25
4.1.1 Upland Vegetation Community ............................................................................... 25
4.1.2 Salt Marsh Vegetation Community ......................................................................... 43
4.1.3 Managed Field Vegetation ....................................................................................... 49
4.1.4 Avian Community .................................................................................................... 53
4.1.5 Herpetofauna Community ........................................................................................ 59
4.1.6 Mammal Community ............................................................................................... 65
4.1.7 Odonata (dragonflies and damselflies) Community ................................................ 70
4.1.8 Salt Marsh Nekton Community ............................................................................... 76
4.2 Physical Integrity ............................................................................................................. 81
4.2.1 Freshwater Quality and Quantity ............................................................................. 81
4.2.2 Estuarine Water Quality ........................................................................................... 86
4.2.3 Geologic and Coastal Resources .............................................................................. 94
4.2.4 Air Quality-Ozone ................................................................................................. 103
4.2.5 Air Quality-Wet Deposition ................................................................................... 108
4.2.6 Air Quality-Visibility ............................................................................................. 113
4.2.7 Night Sky and Natural Lightscape ......................................................................... 116
4.2.8 Soundscape ............................................................................................................ 118
Chapter 5 Discussion .................................................................................................................. 121
5.1 The Park ......................................................................................................................... 121
5.2 Resource Synopsis ......................................................................................................... 122
5.3 Potential Research and Monitoring Activities ............................................................... 125

v
Figures Page
Figure 1. Location of Sagamore Hill National Historic Site.......................................................... 6
Figure 2. Average annual (top graph) and monthly (bottom graph) visitation statistics for SAHI.......................................................................................................................................... 7
Figure 3. Map of Northern Long Island watershed, location of SAHI, and Oyster Bay National Wildlife Refuge. ............................................................................................................... 9
Figure 4. Land cover from the 2006 National Land Cover Database . ........................................ 10
Figure 5. Primary natural resource types at SAHI. ...................................................................... 13
Figure 6. Sampling locations of natural resource studies or inventories at SAHI. ...................... 19
Figure 7. Upland vegetation sampling locations, National Vegetation Association classifications, and Anderson Level II land cover categories at SAHI......................................... 28
Figure 8. Areas where invasive plant species were present as mapped by Werier (2006), map 1 of 5 ......................................................................................................................... 32
Figure 9. Areas where invasive plant species were present as mapped by Werier (2006), map 2 of 5. ........................................................................................................................ 33
Figure 10. Areas where invasive plant species were present as mapped by Werier (2006), map 3 of 5. ........................................................................................................................ 34
Figure 11. Areas where invasive plant species were present as mapped by Werier (2006), map 4 of 5. ........................................................................................................................ 35
Figure 12. Areas where invasive plant species were present as mapped by Werier (2006), map 5 of 5. ........................................................................................................................ 36
Figure 13. Exceptional areas identified by Werier (2006). .......................................................... 38
Figure 14. Map indicating the three fields (Areas 1, 2, and 3) included in the recent (circa 2010) historical landscape preservation scope of work plan). ............................................ 52
Figure 15. Comparison of overall NETN guild scores for forest breeding bird guilds for selected NPS units in the Northeast Region. ........................................................................... 57
Figure 16. Distribution of herpetofauna observed at SAHI in 2002.. .......................................... 61
Figure 17. Comparison of the expected percentage of detected mammal species for parks surveyed by Gilbert et al. (2008) ......................................................................................... 69

vi
Figures (continued) Page
Figure 18. Distribution of odonates observed at SAHI in 2004-2005. ........................................ 75
Figure 19. Woodpile/Hog Pond as it appeared in 2003 and in 2010 .......................................... 83
Figure 20. Heron Pond as it appeared in 2010. ............................................................................ 84
Figure 21. Water quality sampling stations inventoried for the NPS Baseline Water Quality Inventory and Analysis .................................................................................................... 88
Figure 22. Water quality sampling stations monitored by Friends of the Bay ............................ 89
Figure 23. Geological Resources Inventory map for SAHI ......................................................... 96
Figure 24. 2007 EAARL topography (contour lines in white) for SAHI. ................................... 97
Figure 25. Shoreline mapped in 2009 (red line) overlaid 2007 EAARL topography (contour lines in white) showing the shoreline profiles for both years......................................... 98
Figure 26. Historic and current shoreline at SAHI. ................................................................... 100
Figure 27. National trends in annual 4th-highest 8-hour ozone concentration, 1999–2008............................................................................................................................................. 107
Figure 28. Historic and recent estimates of total N and total S deposition for SAHI ................ 110
Figure 29. National trends in nitrate concentrations in precipitation, 1999-2008. .................... 111
Figure 30. National trends in sulfate concentrations in precipitation, 1999-2008 .................... 112
Figure 31. National trends in Haze Index (deciviews) on haziest days, 1999-2008 .................. 114

vii
Tables Page
Table 1. Land use (2006 data) and land use change (1992 to 2006) at SAHI and within a 1km buffer around the park............................................................................................... 8
Table 2. State listed and other species of importance historically or recently observed at SAHI. ........................................................................................................................................ 14
Table 3. High priority vital signs to be or currently monitored at SAHI. Shading indicates protocols that are in development by the NCBN ........................................................... 17
Table 4. Status of natural resource supporting science at SAHI. ................................................. 18
Table 5. Land cover types at SAHI. ............................................................................................. 26
Table 6. Area (hectares) of invasive plants mapped by Werier (2006) at SAHI. ........................ 31
Table 7. Metrics and SAHI scores used to evaluate the upland vegetation community condition. ...................................................................................................................................... 39
Table 8. Non-indigenous forest pests and susceptibility of forests to infestation (USDA Forest Service 2011) at SAHI. ......................................................................................... 41
Table 9. Relative percent cover of live vegetation for the SAHI salt marsh based on NCBN sampling. ........................................................................................................................... 44
Table 10. Salt marsh vegetation benchmark values based on percent cover of plant community as presented by James-Pirri et al. ............................................................................... 46
Table 11. Native field grasses and forbes suggested for planting in the restored fields. ............. 50
Table 12. Percent species richness for avian guilds and NETN guild-based rating for breeding birds at SAHI observed in residential-landscaped and woodland habitats by Barton ............................................................................................................................................ 55
Table 13. Herpetofauna historically and recently observed at SAHI. .......................................... 61
Table 14. Mammal species observed at SAHI or in proximity (Nassau County) to the park. .............................................................................................................................................. 68
Table 15. Odonata potentially occurring and present at SAHI. ................................................... 72
Table 16. Salt marsh nekton community condition based on benchmark values presented James-Pirri et al. ........................................................................................................... 78

viii
Tables (continued) Page
Table 17. Relative abundance (percent of catch) for nekton sampled at the SAHI salt marsh. ............................................................................................................................................ 78
Table 18. Summary of estuarine water quality for Cold Spring Harbor and its tidal tributaries ...................................................................................................................................... 92
Table 19. Plants observed at SAHI that are sensitive to ozone. ................................................. 104
Table 20. Historic (2001-2005) and recent (2006-2010) 5-year averages for air quality at SAHI and NPS ARD assessed air quality condition. .................................................. 106
Table 21. Summary of natural resource conditions for Sagamore Hill NHS. ............................ 127

ix
Appendices Page
Appendix A: Raw Plant Data ...................................................................................................... 133
Appendix B: Raw Bird Data ....................................................................................................... 147
Appendix C: Water Quality Data and Standards ........................................................................ 153


xi
Executive Summary Sagamore Hill National Historic Site (SAHI), a small historic park located on the north shore of Long Island, NY, preserves the Family home of Theodore Roosevelt, the 26th President of the United States. Sagamore Hill served as the “Summer White House” from 1902 until 1908 and the residence of the Roosevelt family until 1948. The park consists of the main house, historic farm buildings, gardens, pastures, agricultural fields, surrounding forest, and a maritime salt marsh/tidal creek/dune/beach complex adjacent to Cold Spring Harbor. The Park’s single greatest resource is the combination of varied natural areas found in close proximity to each other. These diverse resources and their associated flora and fauna provide habitat for a variety of wildlife and the enjoyment of park visitors.
This Natural Resource Condition Assessment (NRCA) evaluated the condition of sixteen natural resources related to Biological and Physical Integrity. The biological resources were split into two broad categories representing the park plant communities (upland, salt marsh, and managed field vegetation) and faunal communities (birds, amphibians and reptiles, mammals, dragonflies and damselflies, and salt marsh nekton), while the physical resources were divided into water quality (fresh and estuarine waters), geologic and coastal resources (specifically shoreline extent), air quality (ozone, total wet deposition, and visibility), night sky, and soundscape. A brief discussion for each resource includes the relevance and context for the resource, extent of existing data, reference condition (if available) including metrics and benchmarks, summary of the current status, statement of current condition and trend, confidence in the data used to assess condition and trend, identification of data gaps for the resource, threats and or stressors to the resource, and sources of expertise and literature used to compile information. The statement of condition used a rating system of Good, Caution, Significant Concern, or Unknown, while trends were assessed as Stable, Improving (moving towards a desirable condition), Declining (moving away from a desirable condition), or Unknown.
Forests comprised the largest single natural habitat at SAHI and portions of this ecosystem contained areas of native plants and very old, large trees that were likely present in Roosevelt’s time. Several state listed plants were found in the forests, although there were also extensive areas of invasive non-native vegetation that threaten the integrity of the entire ecosystem. Aside from baseline inventories, routine monitoring of forest vegetation was only recently initiated. Of the six metrics used to assess the status of forest vegetation, one (structural stage) was rated as Good condition, one rated as Good to Caution (tree canopy condition), one as Caution (snag biomass), and the remaining three as Significant Concern (coarse woody debris, forest regeneration, and extent of invasive vegetation). Due to a lack of historic and/or long-term data, trends could not be evaluated.
The forested areas provide habitat for a variety of wildlife. While not routinely monitored the avian community (the only inventory was in 2003) of the park was quite impressive with 116 recorded species, 69 of which may breed within the park. In addition, seven state listed and 19 Partners in Flight (PIF) species were documented at SAHI. The Northeast Temperate Inventory and Monitoring Network avian guild-based assessment, which was used to estimate condition, indicated the overall condition of the avian forest community as Significant Concern to Unknown (as the data may not reflect the current community). Since the data used to assess condition were outdated, a trend of Unknown was given. During the 2003 inventory, a lower

xii
than desired number of specialist species (e.g., bark gleaners, forest canopy foragers and nesters, and single brooders) and a higher than desired number of generalist species (e.g., exotics, residents, omnivores, and shrub-nesters) were observed.
Similar to the avian community, the mammal community at SAHI was only inventoried. The 2004 survey indicated low species diversity with only eight species recorded in the park; however, it was likely more species were present, as a few additional common species have been observed by park staff (e.g., cottontail rabbit, Eastern chipmunk, and white-tailed deer). Based on the low to moderate species richness, this community was rated as Caution to Unknown (due to the outdated nature of the data) with a trend of Unknown due a lack of historic and/or long-term data.
Recently, the park has cleared overgrown areas in an effort to restore former fields and reclaim the cultural agricultural character of the park. These areas were seeded with native grasses and forbes and are being managed as open fields. In addition to their historic and cultural importance, the managed field provide habitat for a variety of wildlife including birds, turtles, and odonates. The managed field vegetation has never been inventoried and the condition and trend were evaluated as unknown since there were no data for this resource.
The forests, fields, and maritime areas at SAHI provide habitat for a variety of herpetofauna. Amphibians were primarily associated with the two freshwater wetlands found in the park, Woodpile/Hog Pond and Heron Pond. During the only inventory (conducted in 2002) five of eight possible species of amphibians were observed, and based on species richness, a condition of Caution to Unknown (as the data may not reflect the current community) was given. Since there were no long-term, data the trend was rated as Unknown. Reptiles were found in the forests, fields, and maritime areas of the park. During the herpetofauna inventory, five of nine possible reptile species were observed including the state listed Eastern box turtle. Based on reptile species richness the condition was evaluated as Significant Concern to Unknown (as the outdated data may not reflect the current community). The trend for reptiles was assessed as Unknown to Possibly Declining as anecdotal evidence may indicate a decline in some species (e.g., painted turtle and snakes) from historic times.
Odonates (dragonflies and damselflies) were found in the park’s wetlands, fields, and maritime areas. Twenty-two species, including the state listed comet darner and NY state watch listed citrine forktail, were observed at SAHI. This represented 71% of the possible species pool, and the community was evaluated as Caution. The trend for odonates was Unknown as there was only one survey in 2004-2005.
The freshwater resources at SAHI were limited to two small ponds: Woodpile/Hog Pond, small waterbody adjacent to the visitor center parking lot, and Heron Pond, a vernal pond with a short hydroperiod located in the park’s oak-tulip forest. The ponds were important habitat for several species of Odonata and the park’s amphibians, which were almost exclusively found in these wetlands. Freshwater quality of the ponds has never been monitored, although some water quality measurements were taken in 1999-2000 by the National Park Service, but the data were never interpreted or finalized in a report. Due to absence of data the condition and trend for freshwater quality was evaluated as Unknown.

xiii
The maritime complex (salt marsh/tidal creek/dune/beach) at SAHI was the most extensively monitored resource. Salt marsh vegetation and nekton communities have been routinely surveyed and data collection on shoreline extent were recently initiated by the Northeast Coastal and Barrier Network. Several species of odonates and birds, including PIF listed waterfowl, were found in the marsh and tidal creek, while horseshoe crabs and diamondback terrapins nest on the beach. Monitoring during the past decade indicated that the marsh was dominated by desirable salt marsh vegetation, including a few state listed plants with no invasive species present. The salt marsh vegetation community was rated as Good and appeared to be Stable in regards to short-term trends. The salt marsh nekton community of Eel Creek was dominated by Palaemonidae shrimp with resident fish comprising only 20% of the relative abundance. In recent sampling, the relative abundance of resident and transient fish decreased compared to earlier surveys. This community was rated as Significant Concern and the trend was evaluated as Stable to Possibly Declining. The shoreline both north and south of the park’s boundary has been modified by the building of docks, marinas, and channels. The shoreline of the park was surveyed in 2009 and analyses on shoreline change were not yet available. The condition of shoreline change was rated as Unknown to Caution (since there were modifications to the shoreline adjacent to SAHI). The trend was rated as Unknown.
The estuarine water resources at SAHI are Eel Creek and the adjacent waters of Cold Spring Harbor. Water quality is routinely monitored by the state and other agencies. Cold Spring Harbor and its associated tidal creeks (e.g., Eel Creek) have impaired water quality for several designated uses (e.g., public bathing, recreation, and shellfishing) both historically and recently. The primary impairment was pathogens related to storm and urban runoff. Steps are being taken to improve water quality of the estuary and the condition of this resource was rated as Caution with a trend of Stable to Improving.
The NPS Air Resources Division (NPS ARD) evaluated several air quality metrics for national park units within the continental US from interpolated data over a five-year period. Ozone air quality was assessed using the human ozone standard (established by the Environmental Protection Agency), and two ecologically based standards that assessed ozone risk for sensitive vegetation (W126 and SUM06 metrics). The human ozone standard at SAHI was assessed as Significant Concern with No Trend; while the two metrics based on ozone sensitive vegetation were assessed as Caution (trends were not estimated for the ecological-based standards by the NPS ARD). Total nitrogen (N) and sulfur (S) wet deposition were both assessed as Significant Concern. Visibility, evaluated as a Haze Index, was assessed as Good for the park. Trends were not estimated by the NPS ARD for SAHI, but the Northeast region of the US has generally experienced improving trends in total N and total S wet deposition, and haze index over the last decade.
Night sky and soundscape have never been inventoried or monitored at SAHI. Since there were no data available for these resources, the condition and trend for both were assessed as Unknown.
Threats to the natural resources at SAHI include global and regional impacts from air-borne pollution, acid rain, habitat fragmentation, and watershed development. Local threats include land and shoreline development, urban and storm runoff, impaired water quality of adjacent marine waters, habitat fragmentation and loss, predation by domestic and feral cats, and vehicle

xiv
mortality. Park specific threats include impairment to freshwater wetlands from on-site septic systems, parking lot runoff, and fertilizers/pesticides. Invasive vegetation is extensive and represents a persistent threat to plant and animal communities. Activities on adjacent properties alter the hydrology of wetlands, especially Woodpile/Hog Pond where the adjacent landowner has repeatedly altered the natural flow into and out of the pond. The activities may further facilitate the expansion of invasive vegetation in the park. Routine mowing of fields may negatively affect the diversity of odonates and is a source of mortality to the park’s reptile community. Shoreline development adjacent to SAHI may negatively influence natural processes (e.g., water quality, sedimentation transport, and hydrology) in the salt marsh, tidal creek, and beach area.
In general, data were available to assess most of the natural resources; however, in many cases the data were from one sampling event and/or were collected several years ago. SAHI is in the Northeast Coastal and Barrier Network, and its coastal resources (e.g., salt marsh communities, shoreline extent) were sufficiently monitored, but the park lacks routine terrestrial monitoring (with the exception of recently initiated forest monitoring), and some resources (e.g., managed field vegetation, night sky, and soundscape) have never been inventoried. The lack of repeated sampling events combined with the outdated nature of many of datasets were probably the most important findings of this NRCA and highlights the need for periodic sampling events to maintain an accurate status of the park’s natural resources.

xv
Acknowledgments I would like to thank Thomas Ross, Scott Gurney, and Sherry Justus of Sagamore Hill National Historic Site; Sara Stevens, Dennis Skidds, and Erika Patenaude of the National Park Service (NPS) Northeast Coastal and Barrier Network; Jim Comiskey and Sarah Wakamiya of the NPS Mid-Atlantic Network; and Peter Sharpe, Charles Roman, Patti Rafferty, and Alan Ellsworth of the NPS Northeast Region – all of whom provided invaluable assistance, access to data and reports, and provided thoughtful suggestions. Amanda Meisner of the University of Rhode Island assisted early on with the collection of information. Many thanks go to Rebecca Bannon, Roland Duhaime, and Chuck LaBash of the National Park Service Field Technical Support Center at the University of Rhode Island for assistance with geospatial data collection, spatial analyses, and GIS map production. Several reviewers provided helpful suggestions that improved this Natural Resource Condition Assessment.


1
Chapter 1. NRCA Background Information Natural Resource Condition Assessments (NRCAs) evaluate current conditions for a subset of natural resources and resource indicators in national park units, hereafter “parks”. For these condition analyses they also report on trends (as possible), critical data gaps, and general level of confidence for study findings. The resources and indicators emphasized in the project work depend on a park’s resource setting, status of resource stewardship planning and science in identifying high-priority indicators for that park, and availability of data and expertise to assess current conditions for the things identified on a list of potential study resources and indicators.
NRCAs represent a relatively new approach to assessing and reporting on park resource conditions. They are meant to complement, not replace, traditional issue and threat-based resource assessments. As distinguishing characteristics, all NRCAs:
• strive to provide credible condition reporting for a subset of important natural resources and indicators;
• are multi-disciplinary in scope (however, the number and type of indicators will vary by park);
• employ hierarchical indicator frameworks to help guide a selection of multi-disciplinary indicators to report condition and condition summaries by broader topics and park areas;
• identify or develop logical reference conditions/values to compare current condition data against;
• emphasize spatial evaluation of conditions and GIS (map) products; • summarize key findings by park areas; and • follow national NRCA guidelines and standards for study design and reporting product.
Although current condition reporting relative to logical forms of reference conditions and values is the primary objective, NRCAs also report on trends for any study indicators where the underlying data and methods support it. Resource condition influences are also addressed. This can include past activities or conditions that provide a helpful context for understanding current park resource conditions. It also includes present-day condition influences (threats and stressors) that are best interpreted at park, watershed, or landscape scales. NRCAs consider ecologically based reference conditions, consider applicable legal and regulatory standards, and can consider other management-specified condition objectives or targets; each study indicator can be evaluated against one or more types of logical reference conditions. Reference values can be expressed in qualitative to quantitative terms, as a single value or range of values; they represent desirable resource conditions or, alternatively, condition states that we wish to avoid or that require a follow-on response (e.g., ecological thresholds or management “triggers”). As possible and appropriate, NRCAs describe condition gradients or differences across the park for important natural resources and study indicators through a set of GIS coverages and map products. NRCAs do not judge or report on condition status per se for land areas and natural resources beyond the park’s boundaries. Intensive cause and effect analyses of threats and stressors or development of detailed treatment options is outside the project scope.
Credibility for study findings derives from the data, methods, and reference values used in the project work—are they appropriate for the stated purpose and adequately documented? For each

2
study indicator where current condition or trend is reported it is important to identify critical data gaps and describe level of confidence in at least qualitative terms. Involvement of park staff and National Park Service (NPS) subject matter experts at critical points during the project timeline is also important: 1) to assist selection of study indicators; 2) to recommend study data sets, methods, and reference conditions and values to use; and 3) to help provide a multi-disciplinary review of draft study findings and products.
NRCAs provide a useful complement to more rigorous NPS science support programs such as the NPS Inventory and Monitoring Program. For example, NRCAs can provide current condition estimates and help establish reference conditions or baseline values for some of a park’s “vital signs” monitoring indicators. They can also bring in relevant non-NPS data to help evaluate current conditions for those same vital signs. In some cases, NPS inventory data sets are also incorporated into NRCA analyses and reporting products.
In-depth analysis of climate change effects on park natural resources is outside the project scope. However, existing condition analyses and data sets developed by a NRCA will be useful for subsequent park-level climate change studies and planning efforts.
NRCAs do not establish management targets for study indicators. Decisions about management targets must be made through sanctioned park planning and management processes. NRCAs do provide science-based information that will help park managers with an ongoing, long-term effort to describe and quantify their park’s desired resource conditions and management targets. The success of an NRCA relies on obtaining good input from park and other NPS subjective matter experts at critical points in the project timeline and using study frameworks that accommodate meaningful condition reporting at multiple levels (measures indicators broader resource topics and park areas). In the near term, NRCA findings assist strategic park resource planning and help parks report to government accountability measures. While accountability reporting measures are subject to change, the spatial and reference-based condition data provided by NRCAs will be useful for most forms of “resource condition status” reporting as may be required by the NPS, the Department of the Interior, or the Office of Management and Budget. NRCAs are an especially useful lead-in to working on a park Resource Stewardship Strategy (RSS) but study scope can be tailored to also work well as a post-RSS project.
Due to their modest funding, relatively quick timeframe for completion and reliance on existing data and information, NRCAs are not intended to be exhaustive. Study methods typically involve an informal synthesis of scientific data and information from multiple and diverse sources. Level of rigor and statistical repeatability will vary by resource or indicator, reflecting differences in our present data and knowledge bases across these varied study components.
NRCAs can yield new insights about current park resource conditions but in many cases their greatest value may be the development of useful documentation regarding known or suspected resource conditions within parks. Reporting products can help park managers as they think about near-term workload priorities, frame data and study needs for important park resources, and communicate messages about current park resource conditions to various audiences. A successful NRCA delivers science-based information that is credible and has practical uses for a variety of park decision making, planning, and partnership activities.

3
Over the next several years, the NPS plans to fund a NRCA project for each of the ~270 parks served by the NPS Inventory and Monitoring Program. Additional NRCA Program information is posted at: http://www.nature.nps.gov/water/NRCondition_Assessment_Program/Index.cfm .
NRCA reporting products provide a credible snapshot-in-time evaluation for a subset of important park natural resources and indicators, to help park managers:
• direct limited staff and funding resources to park areas and natural resources that represent high need and/or high opportunity situations (near-term operational planning and management); and
• improve understanding and quantification for desired conditions for the park’s “fundamental” and “other important” natural resources and values (longer-term strategic planning).


5
Chapter 2. Introduction and Resource Setting 2.1 Introduction 2.1.1 Enabling Legislation In 1962, Congress established Sagamore Hill National Historic Site (SAHI) (Public Law 87-547). The legislation authorized the NPS to accept the donation of properties from the Theodore Roosevelt Association along with an endowment to support the management and operation of the property. The Theodore Roosevelt Association continues to play an advisory role in the management of the endowment and is among the park’s primary partners (NPS 2007). The primary mandate of SAHI is to maintain the historical features and cultural landscape of Sagamore Hill; however, the cultural landscape also has important ecological features. In order to maintain the cultural landscape, the integrity of the existing natural resources must also be maintained (Stevens et al. 2005).
2.1.2 Geographic Setting Sagamore Hill was the home of Theodore Roosevelt, the 26th President of the United States, from 1885 until his death in 1919. Sagamore Hill served as Theodore Roosevelt’s “Summer White House”, from 1902 until 1908 (NPS 2007). During that time, Roosevelt used his home to host luminaries from around the country and around the world (NPS 2011b). After Roosevelt’s death in 1919, his widow and other members of the Roosevelt family resided at Sagamore Hill until 1948. The 83-acre (33.6 hectares) historic site includes the Theodore Roosevelt Home and associated cultural landscape, historic farm buildings, and archeological resources. The main house is perched atop a hill on Cove Neck peninsula, a one mile wide by three miles long peninsula that extends into and divides Cold Spring Harbor and Oyster Bay Harbor on the north shore of Long Island, New York (Figure 1). The eastern-most edge of the park touches Cold Spring Harbor and includes small patches of salt marsh, a tidal creek, and maritime dune and beach. The site continues west, uphill through a relatively mature oak-tulip tree forest, then grades into the more-developed central and western half of the park that includes Roosevelt’s home and other park facilities (Edinger et al. 2008). The Roosevelt home is a large Queen Anne-style house that was once surrounded by a working farm, including gardens, pasture, and agriculture fields. Also located on the grounds of Sagamore Hill is Old Orchard, the home of Theodore Roosevelt Jr. (NPS 2007). Since Sagamore Hill opened to the public in the 1950s, its character has changed from the original configuration of working farm and woodland to a more park-like commemorative setting. The lawn and field areas near the residence are intact, but former farmlands have been replaced by the oak-tulip tree forest that slopes down to the four-hectare Eel Creek salt marsh on Cold Spring Harbor (Milstead et al. 2004). As a National Historical Site, Sagamore Hill continues to embody Theodore Roosevelt’s ideal of home, country, family, and love of nature (NPS 2007).
The park is located in Nassau County, a county that defined the post-World War II suburbanization boom (Schlauch 1978). SAHI is in the least urbanized portion of the county and the adjoining landscape is dominated by low-density residential development with significant amounts of native-dominated woodland and lesser amounts of open lawn (Cook et al. 2010, Schlauch 1978).

6
2.1.3 Visitation Statistics Visitation statistics at SAHI have been recorded since 1964 and annual visitation averages just over 118,500 visitors with the highest visitation occurring during the Bicentennial in 1976. Annual visitation peaks during the summer months (July and August) (NPS 2011a) (Figure 2).
Figure 1. Location of Sagamore Hill National Historic Site.

7
Figure 2. Average annual (top graph) and monthly (bottom graph) visitation statistics for SAHI.

8
2.2 Natural Resources 2.2.1 Ecological Units and Watershed The park is located within the Northern Long Island watershed (USGS cataloging unit 02030201) (US Environmental Protection Agency [US EPA] 2011b). The watershed encompasses the entire north shore of Long Island and the southern portion of Long Island Sound (Figure 3). The US Fish and Wildlife Service’s (USFWS) Oyster Bay National Wildlife Refuge (NWR) is located northeast of SAHI and its waters surround the park (Figure 4). The eastern boundary of SAHI intersects with Oyster Bay NWR at the mean high water line and the water and lands below mean high water are under the jurisdiction of the refuge. The refuge is managed as part of the USFWS Long Island National Refuge Complex. Oyster Bay NWR is unique in the Refuge system as it serves primarily as a marine refuge rather than the more traditional terrestrial refuge. The refuge encompasses just over 1290 ha of bay bottom, subtidal waters, and marshes of Oyster Bay and Cold Spring Harbor (USFWS 2006). Primary management and enforcement issues that are concerns for Oyster Bay NWR include the construction and expansion of un-permitted docks, illegal moorings, and other construction of shoreline structures such as seawalls, as well as general water quality (USFWS 2006).
Land use in the area of Cove Neck is a mixture of residential development and forests (Figure 4). At SAHI, undeveloped areas dominate the landscape (66%, forest, wetland and open water combined), with agricultural (open pastures, 15%) and residential/urban (19%) areas comprising the rest of park (Table 1). Within a one-kilometer area surrounding the park there is a greater degree of undeveloped areas (91%) and lesser amount of urban/residential area (8%), with little agricultural land (1%) (Table 1). The difference in land cover within and surrounding the park is likely due to the maintenance of the cultural legacy of Sagamore Hill as a working farm, whereas old agricultural fields outside the park have converted to woodlands. There was little change in land use at SAHI or the surrounding area over the past two decades. Based on data from 1992 to 2006, the primary land cover change inside the park was a conversion of forest to urban lands (0.38 ha) representing 1.3% of the park area. Only 0.4% (2.30 ha) of the land use in the one-kilometer buffer around the park changed, mostly represented by conversion of agricultural and open areas to wetlands (Table 1). Table 1. Land use (2006 data) and land use change (1992 to 2006) at SAHI and within a 1km buffer around the park. Percent of area indicated in parentheses.
Land cover SAHI (ha) 1km buffer around SAHI (ha)
Land use change within SAHI (ha)
Land use change within 1km buffer (ha)
Total area 33.1 636.9 - -
Urban lands 6.3 (19%) 50.8 (8%) + 0.38 -0.66
Agricultural and open lands 5.0 (15%) 4.0 (1%) +0.01 -1.61
Forest 19.9 (60%) 205.1 (32%) - 0.38 +0.18
Wetlands (forested and non-forested) 1.8 (5%) 30.5 (5%) -0.04 +1.57
Open water 0.1 (0.4%) 346.5 (54%) +0.03 +0.55
1 Land use statistics based on National Land Cover Data from 2006 and 1992 (Fry et al. 2011, US EPA 2011a).

9
Figure 3. Map of Northern Long Island watershed, location of SAHI, and Oyster Bay National Wildlife Refuge.

10
Figure 4. Land cover from the 2006 National Land Cover Database (Fry et al. 2011). Note: Park staff has indicated that the developed areas along the park’s eastern edge do not exist.

11
2.2.2 Natural Resource Descriptions The natural resources at SAHI include upland areas (woodlands and managed fields), salt marsh, beach, estuarine and freshwater habitats, and their associated flora and fauna (Stevens et al. 2005) (Figure 5). Approximately 41% of the park (13.8 of 33.6 ha) is comprised of oak-tulip tree forest, salt marsh, and beach bordering Cold Spring Harbor. Congress designated the woodland and salt marsh/tidal creek/dune/beach area a National Environmental Study Area (NESA) during the 1970s (the NESA program no longer exists) (NPS 2007). The forests and maritime areas at SAHI were used, appreciated, and studied by the Roosevelts and were virtually untouched with the exception of trails created for the enjoyment of the outdoors (Bellavia and Curry 1995). Therefore, the forests and maritime areas that existed during Roosevelt’s time and persist today are not only important natural resources but are cultural ones as well (Werier 2006). The managed agricultural fields are part of the cultural landscape of the park. During Roosevelt’s time, these fields provided fruits and vegetables for the family and hay and feed for the livestock (NPS 2007). In addition to the varied plant community of the forests, they are also home to a variety of both resident and migratory bird species, mammals, amphibians, and reptiles. The maritime salt marsh and beach support a variety of estuarine flora and fauna and provide habitat for nesting diamond back terrapins and horseshoe crabs. Mammals, turtles, and odonates use the fields for nesting, foraging, and resting. Other natural resources of note are the freshwater wetlands that include two freshwater ponds. Woodpile/Hog Pond, (this pond has been referred to as both Woodpile Pond and Hog Pond, and in this document it is referred to as Woodpile/Hog Pond), is located adjacent to the visitor parking lot along the park’s northern boundary. Heron Pond, sometimes referred to as Lower Lake (Bellavia and Curry 1995), is a vernal pond located in the eastern oak-tulip forest (Figure 5). These freshwater habitats are important areas for amphibians and several species of dragonflies and damselflies. The open areas, maintained as fields and dominated by grass and sedge, are favored by nesting turtles (Stevens et al. 2005). One of SAHI’s greatest natural resource values lies in the high number of varied habitat types in close proximity to each other (Stevens et al. 2005, NPS 2007). All of the natural areas at SAHI provide habitat for wildlife and present opportunities for the enjoyment of nature by park visitors.
The New York Department of Environmental Conservation (NY DEC) and the New York Natural Heritage Program (NY NHP) maintain lists of species in the state that are considered rare, endangered, threatened, or of special concern (Schlesinger 2007, Young 2008, 2010, NY DEC 2011). The NY NHP keeps two lists of rare animal species: the Active Inventory List and the Watch List. Species on the Active Inventory List are tracked by NY NHP and are usually those that are the most rare or most imperiled species in the state. Species on the Watch List are those that could become sufficiently imperiled in the future to warrant being actively inventoried, or are those for which there are not enough data to determine whether they should be actively inventoried. Species are moved between lists or off the lists entirely, as available information warrants.
Species of Importance
In addition to state and federally listed avian species, resident and migratory landbirds have also been categorized by Partners in Flight (PIF) for regional conservation in Southern New England (Physiographic Area 9) (Dettmers and Rosenberg 2000). Partners in Flight is a voluntary coalition of government agencies, conservation organizations, academic institutions, private industry, and citizens dedicated to reversing downward trends of declining species and to keep “common birds common” (Dettmers and Rosenberg 2000). PIF produces a series of Landbird

12
Conservation Plans for several physiographic areas in northeastern US. The goal of each conservation plan is to ensure long-term maintenance of healthy populations of native landbirds. Species identified in the conservation plan(s) are categorized by levels of priority for conservation at the both the continental and regional level, watch listed, federally listed, and state listed species (Dettmers and Rosenberg 2000) (refer to Avian Community section for more details on these categories).
Many species of animals and plants observed at SAHI were state listed species or were PIF listed landbirds (Table 2). No federally listed species were recorded at SAHI (USFWS 2011). Individual species are discussed in their respective section in the Biological Integrity portion of this document. Briefly, there were eleven state listed animals (seven bird species, one amphibian and one reptile species, and two dragon/damselfly species), 27 state listed plant species, and 26 PIF listed landbirds (seven of which were also state listed birds) (Table 2).
2.2.3 Resource Issues Overview Threats to the natural resources at SAHI include global and regional threats such as air-borne pollution, acid rain, habitat fragmentation, and watershed development. Local threats include land and shoreline development, urban and storm runoff, impaired water quality of adjacent marine waters, habitat fragmentation and loss, predation by domestic and feral cats, and vehicle mortality. Park specific threats include impairment to freshwater wetlands from on-site septic systems, parking lot runoff, and fertilizers/pesticides. Invasive vegetation is extensive and represents a persistent threat to plant and animal communities. Activities on adjacent properties alter the hydrology of wetlands and may facilitate the expansion of invasive vegetation. Routine mowing of managed fields may negatively affect the diversity of odonates and is a source of mortality to the park’s reptile community. Shoreline development adjacent to SAHI may negatively influence natural processes (e.g., water quality, sedimentation transport, and hydrology) in the salt marsh, tidal creek, and beach area.

13
Figure 5. Primary natural resource types at SAHI.

14
Table 2. State listed and other species of importance historically or recently observed at SAHI.
Scientific Name Common Name Listed Status1, 2 Year(s) observed3
Amphibians and Reptiles
Ambystoma opacum Marbled salamander SC Historically observed
Terrapene carolina Eastern box turtle SC 2002
Birds
Accipiter cooperii Cooper’s hawk V 2002-2005
Accipiter striatus Sharp-shinned hawk V, SC 2003
Anas rubripes American black duck IIC 2003
Ardea alba Great egret V 2002-2005, 2003
Ardea herodias Great blue heron V 2003
Carpodacus purpureus Purple finch IIA 2003
Chaetura pelagica Chimney swift IIA 2002-2005, 2003
Coccyzus erythropthalmus Black-billed cuckoo IA 2003
Contopus virens Eastern wood-pewee IIA 2002-2005, 2003
Dendroica fusca Blackburnian warbler IIC 2003
Egretta thula Snowy egret V 2002-2005, 2003
Gavia immer Common loon II, SC 2003
Haliaeetus leucocephalus Bald eagle V, T 2003
Hylocichla mustelina Wood thrush IA 2000-2005, 2003
Icterus galbula Baltimore oriole IA 2000-2005, 2003
Mniotilta varia Black-and-white warbler IIA 2000-2005
Nycticorax nycticorax Black-crowned night heron V 2000-2005, 2003
Pandion haliaetus Osprey V, SC 2000-2005, 2003
Picoides villosus Hairy woodpecker IIA 2003
Pipilo erythrophthalmus Eastern towhee IIA 2000-2005, 2003
Piranga olivacea Scarlet tanager IA 2000-2005, 2003
Podilymbus podiceps Pied-billed grebe V, T Historically observed
Scolopax minor American woodcock IA 2000-2005
Sterna antillarum Least tern V, T 2003
Sterna hirundo Common tern V, T 2003
Vermivora pinus Blue-winged warbler IA 2000-2005
Dragonfly and Damselfly
Anax longipes Comet darner A, G5, S2, U 2004-2005
Ischnura hastata Citrine forktail W, G5, S3, U 2004-2009
Plants
Asclepias tuberosa Butterfly milkweed EV 2005
Athyrium filix-femina Common lady fern EV 2008

15
Table 2. State listed and other species of importance historically or recently observed at SAHI (continued).
Scientific Name Common Name Listed Status1, 2 Year(s) observed3
Chimaphila maculata Spotted wintergreen EV 2008
Cornus florida Flowering dogwood EV 2005, 2008
Crataegus uniflora Dwarf hawthorn G5, S1, E Historically observed
Dryopteris carthusiana Spinulose woodfern EV 2005
Dryopteris intermedia Intermediate woodfern EV 2005
Dryopteris marginalis Marginal woodfern EV 2005
Euonymus americanus American strawberry-bush G5, S1, E Historically observed
Euonymus obovata Running strawberry bush EV 2008
Ilex opaca American holly EV 2005
Ilex verticillata Common winterberry EV 2005
Kalmia angustifolia Sheep laurel EV Historically observed
Kalmia latifolia Mountain laurel EV 2005
Limonium carolinianum Carolina sealavender EV 2004-2009
Morella pensylvanica Northern bayberry EV 2005
Osmunda cinnamomea Cinnamon fern EV Historically observed
Osmunda claytoniana Interrupted fern EV 2005
Osmunda regalis var. spectabilis Royal fern EV Historically observed
Panicum amarum Bitter panicgrass G5, S3, U 2004-2009
Paspalum setaceum Thin paspalum T Historically observed
Polystichum acrostichoides Christmas fern EV 2005, 2008
Salicornia bigelovii Dwarf saltwort G5, S2S3, T Historically observed
Suaeda linearis Annual seepweed G5, S1, E Historically observed
Thelypteris noveboracensis New York fern EV 2005, 2008
Thelypteris palustris Eastern marsh fern EV Historically observed
Vernonia gigantea Giant ironweed G5, S1, E 2005
1 Partners In Flight status (for avian community): IA: High Continental Priority, High Regional Responsibility; II: High Regional Priority (wintering species); IIA: High Regional Priority, High Regional Concern; IIC: High Regional Priority, High Regional Threat; V: Additional State Listed (Dettmers and Rosenberg 2000). 2 NY DEC State status and NY NHP codes (NY DEC 2011, Schlesinger 2007, Young 2008, 2010, US Department of Agriculture Natural Resource Conservation Service 2011) E: endangered, EV: exploitably vulnerable, T: threatened, SC: special concern, U: Unprotected, A: Active Inventory List of rare and imperiled species. W: Watch Listed species; Global Ranks (G) and State ranks (S) definitions: G4: Apparently secure rangewide (global) or in New York (state); G5: Demonstrably secure globally, though it may be quite rare; S1: Critically imperiled in New York State because of extreme rarity (5 or fewer sites or very few remaining individuals) or extremely vulnerable to extirpation from New York State due to biological or human factors. S2: Typically 6 to 20 occurrences, few remaining individuals, acres, or miles of stream, or factors demonstrably making it very vulnerable in New York State; S3:Typically 21 to 100 occurrences, limited acreage, or miles of stream in New York State; SH: Historically known from New York State, but not seen in the past 15 to 20 years. 3 Refer to Appendix A Table 1 for specific information on plant observation history. Historical presence based on listing in NPSpecies database (NPS 2010) or information from the literature.

16
2.3 Resource Stewardship 2.3.1 Management Directives and Planning Guidance As indicated in the park’s General Management Plan (GMP), retaining the combination of field and woodland habitat is an important consideration when evaluating rehabilitation of the cultural landscape (NPS 2007). Key natural resource management principles are maintenance of the varied habitat, including the combination of field and woodlands; maintenance of the salt marsh/tidal creek/dune/beach system integrity; controlling the expansion of invasive species; and the protection of rare species (NPS 2007, p. 2-12 to 2-13). Preservation of the natural viewshed, or vistas, from Park historic buildings is also a park management objective (Milstead et al. 2004). The GMP (NPS 2007, p. 1-18) stated that Park should ensure the long-term protection of the woodland and salt marsh/tidal creek/dune/beach complex. This area is unique and it should be protected from encroachment by invasive species and anthropogenic impacts to the greatest degree, to allow the continuity of natural processes (NPS 2007, p. 2-13). The GMP emphasized the resource protection and management of the forested area of the park as a non-development zone (NPS 2007, p. 2-5) with no formal walkways or trails. This area would be should be managed to limit the expansion of invasive plants and clearing should be limited to maintaining safety and accessibility on abutting roadways and walkways.
2.3.2 Status of Supporting Science The Northeast Coastal Barrier Network (NCBN) monitors or will monitor in the future several natural resource vital signs (Table 3) and several inventories have been conducted at SAHI (Table 3, Table 4, Figure 6). Several of these monitoring activities (e.g., forest health monitoring, avian inventory, herpetofauna inventory) have been collaborative efforts among the NCBN, Northeast Temperate Inventory and Monitoring Network (NETN), and Mid-Atlantic Inventory and Monitoring Network (MIDN). The NCBN maintains inventory and monitoring datasets for SAHI. Data and reports are accessible through the NCBN website and The NPS Integrated Resource Management Applications (IRMA) website.

17
Table 3. High priority vital signs to be or currently monitored at SAHI. Shading indicates protocols that are in development by the NCBN (Table modified from Stevens et al. 2005).
Vital Sign Monitored by NCBN
Monitored by entity other than
NCBN
Likely monitored in the future
Air Quality
Ozone X
Visibility X
Nitrogen/Sulfur deposition X
Weather and Climate
Weather X
Invasive Species
Exotic plants X
Focal Species or Communities
Forest vegetation and health X
Marsh birds X
Salt marsh nekton community structure X
Salt marsh vegetation community structure X
Landscape Dynamics
Landscape change X
Landscape Nutrient Dynamics
Estuarine nutrient loading X
Geomorphology
Shoreline position X
Water Quality
Estuarine water chemistry X
Estuarine water quality X

18
Table 4. Status of natural resource supporting science at SAHI.
Natural Resource Data period Type of data Source
Air Quality – ozone, wet deposition, visibility 2004 to present Inventory and Monitoring NPS Air Resources Division, Davey et al. 2006
Avian Community 2003 Inventory Barton 2005
Geological and Coastal Resources 2007, 2009 Overview and Monitoring Rafferty 2005, Brock et al. 2007, Psuty et al. 2010, Thornberry-Ehrlich 2011
Herpetofauna Community 2002 Inventory Cook et al. 2010
Mammal Community 2004 Inventory Gilbert et al. 2008
Nekton Community (salt marsh) 2004, 2009 Monitoring James-Pirri et al. 2005, Patenaude and Pooler 2010
Night sky No data No data No data
Odonata Community 2004-2005 Inventory Briggs et al. 2010
Soundscape No data No data No data
Vegetation Community – upland 2003 to 2009 Inventory and Monitoring Werier 2006, Edinger et al. 2008, Comiskey and Wakamiya 2011
Vegetation Community – salt marsh 2004, 2009 Inventory and Monitoring James-Pirri et al. 2005, Patenaude and Pooler 2010
Vegetation Community – managed fields No data No data No data
Water Quality - estuarine 1998 to present Monitoring Various federal, state, and local organizations
Water Quality - freshwater1 No data No data No data
1 Freshwater quality was briefly mentioned in the herpetofauna inventory.

19
Figure 6. Sampling locations of natural resource studies or inventories at SAHI.

20
2.4 Literature Cited Barton, H. April 2005. Avian inventory of Sagamore Hill National Historical Site. Natural
Resources Report NPS/NER/NRTR—2008/119. National Park Service, Philadelphia, Pennsylvania.
Bellavia, R. M., and G. W. Curry. 1995. Cultural landscape report for Sagamore Hill National Historic Site, Volume 1: Site history, existing conditions, and analysis. Olmstead Center for Landscape Preservation, Cultural Landscape Publication No. 8. National Park Service, Boston, Massachusetts.
Briggs, N., E. G. Schneider, J. Sones, and K. Puryear. 2010. Inventory of Odonata (dragonflies and damselflies) at Sagamore Hill National Historic Site. Natural Resources Technical Report NPS/NCBN/NRTR—2010/192. National Park Service, Fort Collins, Colorado.
Brock, J. C., C. W. Wright, A. Nayegandhi, M. Patterson, and L. J. Travers. 2007. EAARL topography-Sagamore Hill National Historic Site. USGS Open File Report 2007-1394. http://pubs.usgs.gov/of/2007/1394/ (accessed 1 November 2011).
Comiskey, J. A., and S. M. Wakamiya. 2011. Mid-Atlantic Network forest vegetation monitoring: 2007 to 2010. Natural Resource Technical Report NPS/MIDN/NRTR—2011/471. National Park Service, Fort Collins, Colorado.
Cook, R. P., D. K. Brotherton, and J. L. Behler. 2010. Inventory of amphibians and reptiles at Sagamore Hill National Historic Site. Natural Resource Technical Report NPS/NCBN/NRTR— 2010/379. National Park Service, Fort Collins, Colorado.
Davey, C. A., K. T. Redmond, and D. B. Simeral. 2006. Weather and climate inventory, National Park Service, Northeast Coastal and Barrier Network. Natural Resource Technical Report NPS/NCBN/NRTR— 2006/008. National Park Service, Fort Collins, Colorado.
Dettmers R., and K. Rosenburg. 2000. Draft Partners in Flight landbird conservation plan: Physiographic Area 9: Southern New England. Version 1.0, October 2000. American Bird Conservancy, Ithaca, New York.
Edinger, G. J., A. L. Feldmann, T. G. Howard, J. J. Schmid, E. Eastman, E. Largay, and L. A. Sneddon. 2008. Vegetation classification and mapping at Sagamore Hill National Historic Site, New York. Technical Report NPS/NER/NRTR—2008/124. National Park Service, Philadelphia, Pennsylvania.
Fry, J., G. Xian, S. Jin, J. Dewitz, C. Homer, L. Yang, C. Barnes, N. Herold, and J. Wickham, J. 2011. Completion of the 2006 National Land Cover Database for the conterminous United States, Photogrammetric Engineering and Remote Sensing 77:858-864. http://www.mrlc.gov/nlcd2006.php (Accessed 18 June 2012).
Gilbert A. T., A. F. O’Connell, Jr., E. M. Annand, N. W. Talancy, J. R. Sauer, and J. D. Nichols. 2008. An inventory of terrestrial mammals at National Parks in the Northeast Temperate

21
Network and Sagamore Hill National Historic Site. Scientific Investigations Report 2007-5245. US Geological Survey, Reston, Virginia.
Milstead, B., S. Stevens, M. Albert, and G. Entsminger. 2004. Northeast Coastal Barrier Network Vital Signs Monitoring Plan Phase III. December 15, 2004 Draft. National Park Service, Kingston, Rhode Island.
James-Pirri, M. J. 2005. Implementing long-term monitoring of salt marsh communities within the Northeast Coastal and Barrier Network of the National Park Service, Year 2: Monitoring at Boston Harbor Islands National Park Area, Cape Cod National Seashore, Gateway National Recreation Area, and Sagamore Hill National Historic Site. February 2005, Progress Report to National Park Service, Northeast Coastal and Barrier Network, Kingston, Rhode Island.
National Park Service (NPS). 2007. Sagamore Hill National Historic Site. Final General Management Plan Final Environmental Impact Statement. Department of the Interior, National Park Service, Northeast Region, Boston, Massachusetts.
National Park Service (NPS). 2010. NPSspecies Database. http://science.nature.nps.gov/im/apps/npspp/ (accessed 6 May 2010).
National Park Service (NPS). 2011a. National Park Service Public Use Statistics. http://www.nature.nps.gov/stats/park.cfm (accessed 16 May 2011).
National Park Service (NPS). 2011b. Sagamore Hill National Historic Site website. http://www.nps.gov/sahi/index.htm (accessed 16 May 2011).
New York Department of Environmental Conservation (NY DEC). 2011. List of endangered, threatened and special concern fish and wildlife species of New York State. http://www.dec.ny.gov/animals/7494.html (accessed 6 July 2011).
Patenaude, E. L., and P. S. Pooler. 2010. Salt marsh vegetation and nekton community monitoring at Sagamore Hill National Historical Site: 2009 summary report. Natural Resource Data Series NPS/NCBN/NRDS—2010/067. National Park Service, Fort Collins, Colorado.
Psuty, N. P., M. Duffy, J .F. Pace, D. E. Skidds, and T. M. Silveira. 2010. Northeast Coastal and Barrier Network geomorphological monitoring protocol: part I—ocean shoreline position. Natural Resource Report NPS/NCBN/NRR —2010/185. National Park Service, Fort Collins, Colorado.
Rafferty, P. January 31, 2005. An overview of coastal resources at Sagamore Hill National Historic Site. NPS Internal Report for General Management Plan. National Park Service, Oyster Bay, New York.
Schlauch, F.C. 1976. City snakes, suburban salamanders. Natural History 85:46-53.

22
Schlauch, F. C. 1978. New methodologies for measuring species status and their application to the herpetofauna of a suburban region. Engelhardtia 6:30-41.
Schlesinger, M. D. 2007. Rare Animal Status List. New York Natural Heritage Program. Albany, New York. www.nynhp.org (accessed June 21, 2011).
Stevens, S., B. Milstead, M. Albert, G. Entsminger. September 2005. Northeast Coastal and Barrier Network Vital Signs Monitoring Plan. Technical Report NPS/NER/NRTR—2005/025. National Park Service, Boston, Massachusetts.
Thornberry-Ehrlich, T. L. 2011. Geologic resources inventory scoping summary Sagamore Hill National Historic Site. October 19, 2011. Geologic Resources Division, National Park Service. http://www.nature.nps.gov/geology/inventory/publications/s_summaries/SAHI_Scoping_Summary_2011-0927.pdf (accessed 31 October 2011).
US Department of Agriculture Natural Resource Conservation Service (USDA NRCS). 2011. The PLANTS Database National Plant Data Team, Greensboro, North Carolina. http://plants.usda.gov (accessed 3 October 2011).
US Environmental Protection Agency (US EPA). 2011a. Multi-Resolution Land Characteristics Consortium. . http://www.epa.gov/mrlc/ (accessed 27 October 2011).
US Environmental Protection Agency (US EPA). 2011b. Surf Your Watershed website. http://cfpub.epa.gov/surf/huc.cfm?huc_code=02030201 (accessed 26 May 2011).
US Fish and Wildlife Service (USFWS). 2006. Long Island Complex National Wildlife Refuge Complex Comprehensive Conservation Plan. September 2006. Shirley, New York. http://www.fws.gov/northeast/planning/Long%20Island%20Refuges/ccphome.html (accessed 27 October 2011).
US Fish and Wildlife Service (USFWS). 2011.Endangered species program. http://www.fws.gov/endangered/ (accessed 3 Oct 2011).
Werier, D. July 2006. Sagamore Hill National Historic Site invasive non-native plant management plan. Technical Report NPS/NER/NRTR—2006/045. National Park Service, Boston, Massachusetts.
Young, S. M. 2008. New York Rare Plant Status Lists. New York Natural Heritage Program, Albany, New York.
Young, S. M. 2010. New York Rare Plant Status Lists. New York Natural Heritage Program, Albany, New York.

23
Chapter 3 Study Scoping and Design 3.1 Preliminary Scoping An initial scoping meeting was conducted on 18 June 2010. Meeting attendees included Charles Roman, NPS North Atlantic Coast Coastal Ecosystems Studies Unit Research Coordinator; Peter Sharpe, NPS Natural Resource Condition Assessment Coordinator; Tom Ross NPS SAHI Park Superintendent; Sherry Justus, NPS SAHI Chief, Interpretation, Visitor Services and Natural Resources; Scott Gurney, NPS SAHI Park Ranger, Dennis Skidds, NPS NCBN Data Manager; Patricia Rafferty, NPS Northeast Region Coastal Ecologist; Amanda Meisner, University of Rhode Island student; and Mary-Jane James-Pirri, Cooperator from the University of Rhode Island. At this meeting, the general framework for the Natural Resource Condition Assessment was presented and attendees toured the park. Park staff kindly supplied the author with digital and hard copies of General Management Plan(s). Throughout the compilation of this document the author communicated with SAHI park staff (Scott Gurney, Sherry Justus, and Thomas Ross), NCBN and Mid-Atlantic Network staff (Erika Patenaude, Dennis Skidds, Sara Stevens, Jim Comiskey, and Sarah Wakamiya), and Regional staff (Peter Sharpe, Charles Roman, Patti Rafferty, and Alan Ellsworth) for additional information and data for park resources.
3.1.1 Reporting Areas, Indicator framework, and General Approach This Natural Resource Condition Assessment report was organized by Biotic Integrity and Physical Integrity groups. Within each group, the reporting areas such as individual ecosystems, habitats and/or communities were summarized. The Biotic Integrity group included the following communities: upland vegetation, salt marsh vegetation, managed field vegetation, and avian, herpetofauna, mammal, Odonata, and salt marsh nekton communities. The Physical Integrity group included freshwater and estuarine water quality, geological and coastal resources (specifically shoreline extent), and air quality (ozone, total wet deposition, and visibility), night sky, and soundscape. Each of reporting areas was subdivided into the sections listed below:
Relevance and Context: A brief overview of the importance of the natural resource to the park. Data and Methods: Description of available information (e.g., research studies, surveys,
inventory and monitoring) for the resource and the methodology used to obtain data, including the period of data collection.
Reference Condition: Metrics and benchmarks used to compare the current condition of the resource, including the justification for the metric and benchmark. Depending on the available data, there may be one or several metrics for the resource. Whenever possible established NPS metrics and benchmarks (e.g., NPS vital sign parameters, Mid-Atlantic Network forest condition, Northeast Temperate Network landbird community assessment points, NPS air quality assessment) or metrics from established monitoring programs (e.g., US EPA water quality monitoring) were used to estimate the condition of the park’s natural resources. In cases where metrics and/or benchmarks were not available, they were based on the most recent, quantitative, and reliable data for the park or on best professional judgment.
Status of the Resource: A summary of the status of the resource based on historic, recent research, and/or monitoring efforts.
Condition and Trend: A statement of current condition (Good, Caution, Significant Concern, or Unknown) and trend (Stable, Improving Trend [moving towards a desirable condition], Declining Trend [moving away from a desirable condition], or Unknown) for each

24
benchmark previously described in the Reference Condition section. A brief justification for the statement of condition is presented if appropriate.
Confidence in Condition and Trend: A statement concerning the level of confidence in the data related to the statement of condition.
Data Gaps: A description of data gaps, if any, in the assessment of resource condition. Threats: A discussion of any threats to the resource. Sources of Expertise: A list of people that provided unpublished data or personal anecdotes
regarding the resource. Literature Cited: A list of information sources cited in the text.

25
Chapter 4 Natural Resource Conditions 4.1 Biological Integrity 4.1.1 Upland Vegetation Community
Information on plant community structure and composition is critical to developing desired conditions and park management goals relating to native and non-native plant communities (Edinger et al. 2008, NPS 2008). The identification, description, and mapping of plant communities provide important information about these habitats and allow inferences about the location and abundance of other species that are associated with these communities. A current (less than five years old) and accurate map of park vegetation is one of the 12 basic natural resource inventories recommended by the NPS Inventory and Monitoring Program (Edinger et al. 2008). Sixty-seven percent (24 ha) of SAHI is comprised of natural areas including forest, vernal wetland, estuarine salt marsh, dune, and maritime beach (Table 5). The oak-tulip tree forest, salt marsh, and beach complex of the park was designated as a NESA by Congress in the early 1970s. The NESA program no longer exists (NPS 2007).
Relevance and Context
Documenting and managing non-native and invasive plants is part of the NPS Strategic Plan for Managing Invasive Non-native Plants on NPS lands (NPS 1996) and as such, vegetation monitoring and management fits within a context of NPS policy and law aiming to preserve and protect native species, functioning ecosystems, and cultural and historical resources (Werier 2006). At SAHI, the presence and distribution of invasive non-native plants is a result of its location in a fragmented suburban landscape and past land use history (NPS 2008). Some of the invasive plants were cultivated by the Roosevelts or their neighbors and have spread from their plantings into the natural areas of the park after becoming naturalized (a naturalized species is a non-native plant that is able to maintain itself outside of cultivation in its new environment). If a naturalized species becomes extremely vigorous or grows aggressively, dominating large areas in a short period in its new environment or range, it is called a non-native invasive species (Werier 2006). Non-native invasive plants can negatively effect and/or threaten native species diversity and ecosystems, and seriously degrade the cultural landscape (NPS 2008).
The upland vegetation at SAHI was inventoried in conjunction with the National Vegetation Classification (NVC) mapping effort conducted from 2003 to 2006 (Edinger et al. 2008), the Invasive Non-native Plant Management Plan conducted in 2005 (Werier 2006), and the Mid-Atlantic Network Forest Vegetation Monitoring conducted in 2009 that was funded by the NCBN and supported by a shared NCBN/MIDN work team (Comiskey and Wakamiya 2011) (Appendix A Table 1). Earlier surveys of plant species observed at SAHI include inventories by Zaremba (1985), Dutton (1998), and Stalter (2000) (Appendix A Table 1, listed the NPSspecies column).
Data and Methods

26
Table 5. Land cover types at SAHI.
Land Cover Type Area (ha)1
Percent of area
Natural areas
American Beachgrass - Beach Pea Herbaceous Vegetation 0.65 1.8%
American Beech - Oak - Tuliptree - American Holly - Christmas Fern Forest 11.89 33.2%
Bays and Estuaries 0.69 1.9%
Beaches 0.12 0.3%
Black Cherry - Tuliptree - Red Maple - White Ash Forest 2.58 7.2%
Eastern Woodland Vernal Pool Sparse Vegetation 0.11 0.3%
Norway Maple Forest 2.55 7.1%
Oak - Flowering Dogwood - Mapleleaf Viburnum Forest 2.98 8.3%
Saltmarsh Cordgrass - Yellow Tang Acadian - Virginian Zone Herbaceous Vegetation 1.16 3.2%
Saltmeadow Cordgrass - Common Threesquare - Seaside Goldenrod Herbaceous Vegetation
0.54 1.5%
Saltmeadow Cordgrass - Saltgrass - Black-grass Herbaceous Vegetation 0.48 1.4%
Sea-rocket - Northern Seaside Spurge Sparse Vegetation 0.22 0.6%
Residential and manicured areas
Commercial and Services 10.04 28.0%
Cropland and Pasture 1.24 3.5%
Orchards 0.25 0.7%
Reservoirs 0.05 0.1%
Residential 0.26 0.7%
1 Total hectares (35.82) are based on GIS data from Edinger et al. (2008) and are slightly different than park area (33.6) because of the boundary used in that report.
The NVC mapping recorded vegetation in 23 plots/reference points (20m X 20m plots in the forests and 10m X 10m plots in shrublands and herbaceous vegetation) throughout the park. Vegetation was classified according to NVC associations (plant community types that are relatively homogeneous in composition and structure, and occur in uniform habitats) and a final digital geospatial vegetation map was created in 2007 showing the NVC vegetation associations and Anderson Level II land cover categories (Table 5, Figure 7) (Edinger et al. 2008). The NVC

27
mapping effort also produced a vascular plant species list (Appendix A Table 1) and descriptions of the vegetation associations of the park (Edinger et al. 2008).
Werier (2006) inventoried and mapped non-native, native, and rare plants (those identified by the New York Natural Heritage Program) in June and September 2005. This effort focused on plants outside of the cultivated, landscaped areas of the parks, but in a few instances, plants that were or could have been cultivated were noted. Belt transects (25 m wide) were surveyed in zones delineated by ecological community types. Werier (2006) recorded all plants seen during the survey work and consulted the SAHI herbarium for species documented in the park that were not directly observed during the surveys. Areas of exceptional ecological significance, those areas with a high percentage of native species, were functioning in a native state, and had other outstanding attributes (e.g., old trees or unique habitats), were also documented and mapped (Werier 2006).
The Mid-Atlantic Network (MIDN) monitored forest vegetation at SAHI in 2009 in four 20 x 20 m square plots. Due to the small size of the park, only four plots were established. The MIDN protocol used several metrics to evaluate forest condition, including structural stage of the forest, canopy tree condition, standing dead biomass of snags, amount of coarse woody debris, and degree of forest regeneration (Comiskey and Wakamiya 2011). Forest vegetation will be resurveyed once every four years by the MIDN (Comiskey and Wakamiya 2011).

28
Figure 7. Upland vegetation sampling locations, National Vegetation Association classifications, and Anderson Level II land cover categories at SAHI.

29
The MIDN forest vegetation monitoring evaluated the condition of the forest based on a variety of metrics including the structural stage of the forest, canopy tree condition based on evidence of pests or pathogens
Reference Condition
1
Structural stage of forest benchmark:
, biomass of snags, amount of coarse woody debris, and forest regeneration based on a seedling stocking score (Comiskey and Wakamiya 2011). Benchmarks for these metrics were:
Good: At least 25% of the forest was late-successional structure across the park. Caution: Less than 25% of the forest was late-successional structure across the park. Significant Concern: Less than 25% of the forest was combined mature and late-successional
structure across the park.
Canopy tree condition benchmark: Good: Average foliage problem with < 10% of canopy stems in plot, and no pests or pathogens
(e.g., HWA, BC, EHS, ALB, EAB or SOD, refer to footnote for pest definitions), and average BBD severity ≤ 2 among any stems in plot.
Caution: Average foliage problem with 10-50 % of canopy stems or species (species with at least two stems) in plot, or evidence of HWA, EHS or BC, or average BBD (refer to footnote for pest definitions) severity > 2 among any stems in plot.
Significant Concern: Average foliage problem with > 50% of canopy stems or species (species with at least two stems) in plot, or evidence of ALB, EAB or SOD (refer to footnote for pest definitions) among any stems in plot.
Snag biomass benchmark: Good: At least 10% of all standing trees and shrubs ≥ 10 cm diameter at breast height (DBH)
in a park or group of plots were snags and at least 10% of all medium-large (≥ 30 cm DBH) standing trees in a park or group of plots were snags.
Caution: Less than 10% of standing trees and shrubs ≥ 10 cm DBH in a park or group of plots were snags or less than 10% of all medium-large (≥ 30 cm DBH) standing trees in a park or group of plots were snags.
Significant Concern: Fewer than five medium-large snags (≥ 30 cm DBH) per hectare, calculated for the park or a group of plots.
Coarse woody debris (CWD) benchmark: Good: CWD volume > 15% of live tree volume Caution: CWD volume 5-15% of live tree volume Significant Concern: CWD volume < 5% of live tree volume Forest regeneration benchmark: Good: Seedling stocking score > 96 seedlings per plot. Caution: Seedling stocking score 24 to 96 seedlings per plot.
Significant Concern: Seedling stocking score < 24 seedlings per plot.
1 Pest and pathogens viewed as detrimental to forest condition were: Asian longhorned beetle (ALB), beech bark disease (BBD), butternut canker (BC), emerald ash borer (EAB), elongate hemlock scale (EHS), hemlock woolly adelgid (HWA), and sudden oak death (SOD) (Comiskey and Wakamiya 2011).

30
An additional metric considered in the evaluation of upland vegetation condition was the presence of invasive species. The NPS has “recognized the need to portray the landscape of Sagamore Hill as it existed during Theodore Roosevelt’s lifetime, much as it does the house” (Bellavia and Curry 1995). The landscape represents the cultivated areas around Roosevelt’s house as well as the natural areas of the park. The NPS Strategic Plan of 2001-2005 established goals related to invasive plant management. One of the long-term goals was that exotic vegetation should be contained on 6.3% of targeted acres of parkland (Goal Ia1B) at the National level (NPS 2000). In terms of SAHI, this translates to the containment of invasive vegetation to 1.51 ha of the 24 ha of natural area at SAHI. This national guideline was used as a benchmark to evaluate invasive vegetation:
Benchmarks for areal coverage of invasive vegetation: Good: < 6.3% of park (< 1.51 ha) covered by invasive vegetation (100% or greater than NPS
long-term goal) Caution: 6.3 to 9.4% of park (1.51 to 2.26 ha) covered by invasive vegetation (50% to 100% of
NPS long-term goal) Significant Concern: > 9.4% of park (> 2.26 ha) covered by invasive vegetation (less than 50%
of NPS long-term goal)
Vegetation sampling efforts at SAHI recorded 452 individual plant species, with an additional 53 identified only to genera (Appendix A Table 1). Twenty-seven (6% of identified species) were state listed plants (four endangered, 20 exploitably vulnerable, and two threatened) plus one additional species on the watch list (Table 2, Appendix A Table 1). Forty-eight percent (215 species) were non-native species. Werier (2006) indicated that at least 8% (17 species, refer to Appendix Table 22) of the non-native plants found in the natural areas were either planted by the Roosevelts or their neighbors and had expanded from cultivated plantings into the natural areas. Werier (2006) mapped the extent of the primary invasive species and estimated the percent cover of invasive species within each area. The amount of area infested with invasive plants, calculated from Werier’s (2006) map data, indicated that at least 2.36 ha (9.8%) of SAHI was composed of invasive vegetation (Table 6, Figures 8 to 12). Since Werier (2006) did not map all invasive species and additional invasive plants were recorded by other surveys, the amount of area covered by invasive vegetation was likely to be higher than 2.36 ha and greater than 9.8% of the park area, falling in the Significant Concern range (Table 7).
Status of the Resource
Werier (2006) identified four areas of exceptional ecological significance, areas with some elements of a high quality natural area, at SAHI (Figure 13). Brief descriptions of these exceptional areas follow (Werier 2006):
Exceptional Area #1 (0.51 ha) (Figure 13): A forested area with a tall canopy dominated by red oak (Quercus rubra) and black oak (Q. velutina), including some large and old specimens of each species. The shrub layer ranged from dense to open and was dominated by mapleleaf viburnum (Viburnum acerifolium). The herb/vine layer was dominated by roundleaf greenbrier (Smilax rotundifolia). There was one area where the shrub layer was sparse and dominated by wavy hair grass (Deschampsia flexuosa). Other herbs and vines present included ferns, sedges, blackberry, and grape with a notable absence of the invasive garlic mustard (Alliaria petiolata).

31
Table 6. Area (hectares) of invasive plants mapped by Werier (2006) at SAHI.
Scientific Name Common Name Area1 (ha)
Acer palmatum Japanese maple 0.026
Acer platanoides Norway maple 0.354
Ailanthus altissima Tree of Heaven 0.269
Alliaria petiolata Garlic mustard 0.156
Anthriscus sylvestris Wild chervil 0.021
Berberis thunbergii Japanese barberry 0.001
Celastrus orbiculatus Oriental bittersweet 0.006
Euonymus alatus Burning bush 0.013
Hedera helix English ivy 0.674
Ligustrum obtusifolium Border privet 0.006
Lonicera japonica Japanese honeysuckle 0.002
Lonicera maackii and Lonicera morrowii Morrow and Amur honeysuckle 0.072
Microstegium vimineum Japanese stilt grass 0.235
Pachysandra terminalis Japanese pachysandra 0.129
Paulownia tomentosa Princess tree 0.016
Phragmites australis var. australis Common reed 0.036
Robinia pseudoacacia Black locust 0.017
Rosa multiflora Multiflora rose 0.026
Securigera varia2 Crownvetch 0.005
Viburnum plicatum and V. dilatatum Japanese snowball and linden arrowwood 0.006
Vinca minor Common periwinckle 0.064
Wisteria floribunda, W. japonica, and W. sinensis Wisteria species 0.222
Sum of area infested by invasive species 2.356
2 Mapped as Coronilla varia by Werier (2006), accepted name is Securigera varia (USDA NRCS 2011).
1 Area calculated by multiplying the polygon area by the species percent cover as estimated by Werier (2006).

32
Figure 8. Areas where invasive plant species were present as mapped by Werier (2006), map 1 of 5.
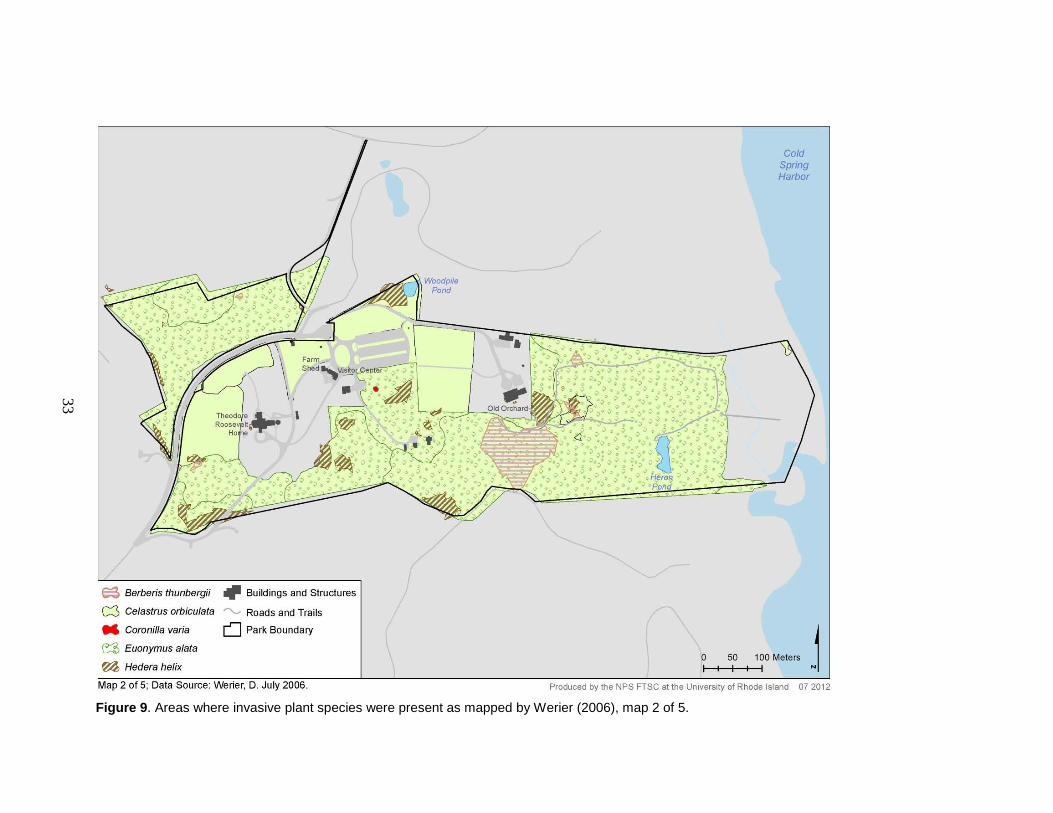
33
Figure 9. Areas where invasive plant species were present as mapped by Werier (2006), map 2 of 5.

34
Figure 10. Areas where invasive plant species were present as mapped by Werier (2006), map 3 of 5.

35
Figure 11. Areas where invasive plant species were present as mapped by Werier (2006), map 4 of 5.

36
Figure 12. Areas where invasive plant species were present as mapped by Werier (2006), map 5 of 5.

37
Some non-native trees, shrubs, and vines were present (e.g., Norway maple [Acer platanoides], Japanese barberry [Berberis thunbergii], Japanese honeysuckle [Lonicera japonica]), but their extent was limited and the dominants were native species. It was likely that most of this area was forested during Roosevelt’s time. Due to its small size and adjacent areas that were weedy with many aggressive invasive plants, Werier (2006) ranked this as the lowest priority in comparison to the other three exceptional areas.
Exceptional Area #2 (0.78 ha) (Figure 13): Forested area with abundant old dead red cedars (Juniperus virginiana), very old and large mockernut hickory (Carya alba), red and black oak, and abundant large, early successional trees (e.g., sassafras [Sassafras albidum], sweet birch [Betula lenta]). The shrub layer was moderately dense and dominated by mapleleaf viburnum. The herb layer was dense and dominated by Solomon’s-seal (Polygonatum biflorum) and roundleaf greenbrier. Invasive trees were present (Norway maple, tree-of-heaven [Ailanthus altissima]), but they were limited in distribution. This area was likely forested during Roosevelt’s time and was significant because native plants were dominant in all layers and there were some very old, large trees present. As with Exceptional Area #1, this area was small and surrounded by weedier areas. It was also adjacent to private property and for these reasons was given a low priority in comparison to Exceptional Areas #3 and #4.
Exceptional Area #3 (11.09 ha) (Figure 13): This large area contained the oak-tulip tree ecological community and comprised most of the forested area in the eastern section of park (Edinger et al. 2008). The area was dominated by old forest with some very old trees and snags present. The vernal pond (Heron Pond) was located in this area. Tree species in the canopy were diverse with numerous native species dominant (e.g., tulip tree [Liriodendron tulipifera], white oak [Quercus alba], chestnut oak (Q. montana]) with all the dominants having at least some specimens that were quite large. The shrub layer was dense with a large number of species present, although most were very limited in distribution. Vines were present and were mostly not dominant, although there were areas where the invasive Oriental bittersweet (Celastrus orbiculatus) had gotten quite large and extended into the canopy. The herb layer was also quite dense in places and was relatively rich in native species. The most problematic invasive herb was garlic mustard. State listed plants recorded in this area included flowering dogwood (Cornus florida), marginal wood fern (Dryopteris marginalis), mountain laurel (Kalmia latifolia), New York fern (Thelypteris noveboracensis), spotted wintergreen (Chimaphila maculata), and winterberry (Ilex verticillata). Non-native species were noted in all layers with Norway maple and garlic mustard identified as plants that were most problematic. This area was significant because it was relatively large and contiguous, had mostly native plants dominant, a large number of old trees present, and has been forested at least since Roosevelt’s time at SAHI. Edinger et al. (2008) remarked that this area was likely the best remaining example of this type of community on Cove Neck.
Exceptional Area #4 (3.88 ha) (Figure 13): This area was the eastern maritime area of the park boarding Cold Spring Harbor. It consisted of the tidal Eel Creek, estuarine salt marsh, and maritime dunes and beach. This maritime area represented habitat that was limited in distribution in New York as well as Long Island, and Werier (2006) suggested it as an area with a high priority for conservation. The community of this area is discussed in more detail in Section 4.1.2 Salt Marsh Vegetation.

38
Figure 13. Exceptional areas identified by Werier (2006).

39
Of the five MIDN forest vegetation metrics used to evaluate forest condition, Comiskey and Wakamiya (2011) rated two metrics as Significant Concern, one as Caution, and two as either Good or Good to Caution (Table 7). They observed that of the 11 parks monitored as part of the MIDN forest vegetation monitoring, SAHI was one of only two units (the other being the Five Forks unit of Petersburg National Battlefield) with low levels of coarse woody debris (evaluated as Significant Concern). Forest regeneration was also rated as Significant Concern with a mean of 0.3 seedlings per plot. Additionally, none of the four plots had adequate forest regeneration under either low (> 24 seedlings per plot) or high (> 96 seedlings per plot) deer density. Snag biomass was rated as Caution. Canopy tree condition was rated as Good to Caution with plots having minimal to no leaf damage in the canopy. SAHI rated as Good for structural stage of the forest, but Comiskey and Wakamiya (2011) noted that it was important to recognize that this metric only takes in to consideration the size of the trees and not the species composition. For example, at SAHI there was 100% combined mature and late-successional forests, but the plots were dominated by tulip poplar (Liriodendron tulipifera), a species that is primarily considered to be early-successional though it can persist in the canopy for many years. Lack of regeneration at SAHI was also noted, as these early-successional species will reach maturity and die and there will likely be no individuals to replace them in the canopy (Comiskey and Wakamiya 2011).
In 2009 to 2011, the Northeast Exotic Plant Management Team (EPMT) conducted inventories and worked closely with park staff and the Olmsted Center for Landscape Preservation to prepare a detailed scope of work for the Invasive Species Eradication contract. This plan also incorporated a historical landscape restoration plan to restore and plant fields with native grasses and forbs (Refer to Managed Field Vegetation section for more detail on the restoration plan) (Beard and Gibbons 2011, B. Lyman and B. McDonnell, National Park Service, personal communication June 2012). In 2010-2011, under the Invasive Species Eradication Scope of Work, a contractor treated at least 90% of the vinca around Heron Pond (T. Ross, National Park Service, personal communication, 2012). Table 7. Metrics and SAHI scores used to evaluate the upland vegetation community condition.
Metric SAHI value Rating
Invasive plants 9.8% (2.36 ha) of park is infested
with invasive plants. Significant Concern
Structural stage of forest 100% of the forest was mature and late successional forest
Good
Canopy tree condition Two plots in Good condition, two plots in Caution condition
Good/Caution
Snag biomass There were 6.25 snags ha-1 (4.5%) that were ≥ 30 cm DBH
Caution
Coarse woody debris 2% of live tree volume Significant Concern
Forest regeneration Mean seedling score was 3.5m-2. Significant Concern

40
Current Condition for upland vegetation communities: Caution to Significant Concern Condition and Trend
Three of the six metrics (coarse woody debris, forest regeneration, and amount of area infested by invasive vegetation) were rated as Significant Concern. One other metric (snag biomass) was rated as Caution. Therefore, the majority of the metrics used to evaluate upland vegetation fell within the Caution to Significant Concern range.
Current Trend for upland vegetation communities: Unknown There was a lack of historic and/or long-term data for the park. The three major upland vegetation surveys (Werier 2006, Edinger et al. 2008, Comiskey and Wakamiya 2011) were conducted within six years of each other (2003 to 2009), used different survey methods, and had differing goals. Therefore, trends in vegetation communities could not be evaluated.
The upland vegetation data were of good quality and there was high confidence in the accuracy of the data.
Confidence in Condition and Trend
NPS Inventory and Monitoring Program recommended sampling at five-year intervals to maintain accurate aerial vegetation maps. Since SAHI was last surveyed by the NVC in 2006, another mapping effort should be considered in the near future.
Data Gaps
There are 20 ha of forest that make up 83% of the SAHI’s natural area yet these areas have not been consistently monitored. The MIDN forest monitoring program will provide standardized data over the long term; however, this sampling was just initiated in 2009 and the next monitoring will not occur until 2013. Deer browsing likely affects the forest condition at SAHI and the park should consider at deer abundance study.
Disturbance events including the clearing of land, the cutting of trees, and even the creation of trails can create ideal conditions for invasive plants to establish themselves. SAHI is surrounded by residential housing with landscaping, and some of this landscaping has clearly included invasive species (e.g., bamboo, wisteria species) which have escaped into adjacent natural areas (Werier 2006). For example, the oak-tulip tree forest is threatened by invasive species, such as Norway maple (Acer platanoides), though to a lesser degree than other forested areas at SAHI. Within these tracts, non-native species are mostly associated with forest edges adjacent to developed areas or with man-made trails. Though threatened, these forests could probably be restored to their original healthy condition through appropriate management (NPS 2007). Roosevelt protected a large portion of the land at SAHI and as result, these lands have had minimal disturbance and have significantly less invasive species than more disturbed areas surrounding the park (Bellavia and Curry 1995). Overall, the presence and distribution of invasive plants at Sagamore Hill is not a result of random chance but of a clear land use history pattern (Werier 2006). If the invasive species are allowed to continue their infestation, they will likely crowd out native species in a short period of time (Werier 2006).
Threats
Although there have been no assessments of deer abundance in the park, deer overbrowsing was evident during the forest monitoring as indicated by the lack of regeneration in the forest

41
understory (J. Comiskey, National Park Service, personal communication, 2012). Therefore, deer browsing is a threat to the forests at SAHI.
Although Comiskey and Wakamiya (2011) noted that they did not encounter any high priority pests at SAHI, non-indigenous forest pests may also present a threat to the forests at SAHI. The US Forest Service maps the distribution and susceptibility of forests to infestation by a variety of non-indigenous forest pest species (USDA Forest Service 2011). Susceptibility of forests is based on the basal area of preferred host species (tree and shrubs). Several of these insect pests have distribution ranges that include Nassau County, NY, where SAHI is located (Table 8). The forests in Nassau County have a high susceptibility to one pest, the peach twig borer (Anarsia lineatella), and there were several other pests for which forest susceptibility for the county was low, but the susceptibility in adjacent Suffolk County was medium (Table 8). Additionally, four other insect pests pose potential threats to the forests at SAHI if their distributional ranges expand to Nassau County (Table 8). The extant orchards at SAHI, which contain approximately 43 common apple trees (NPS 2007), as well as other ornamental plantings may be susceptible to infestation from several of the pests listed in Table 8. Table 8. Non-indigenous forest pests and susceptibility of forests to infestation (USDA Forest Service 2011) at SAHI.
Scientific Name Common Name Presence in County Forest Susceptibility
Host Tree(s) Nassau County
Suffolk County
Nassau County
Suffolk County
Current insect pest threats
Anarsia lineatella Peach twig borer Yes Yes High High Fruit trees whose fruit have stone pits.
Cyrtepistomus castaneus Asiatic oak weevil Yes Yes Low Medium Red and sugar maple, white, Northern red, black oak.
Diaspidiotus perniciosus San Jose scale Yes Yes Low Medium Apple, pear, peach, plum
Lachnellula willkommii Golden oak scale Yes Yes Low Medium White and black oak
Lepidosaphes ulmi Oystershell scale Yes Yes Low Medium Maple, birch, ash, poplar, cherry, willow, and elm
Lymantria dispar Gypsy moth Yes Yes Low Medium Larch, birch, poplar, oak, willow, and others
Popillia japonica Japanese beetle Yes Yes Low Medium Maple, birch, apple, cherry, basswood, elm
Potential emerging insect pest threats
Ceratocystis fagacearum Oak wilt No No Low High Chestnut, oak, apple
Enarmonia formosana Cherry bark tortrix No No High High Hawthorn, apple, cherry, plum, mountain-ash
Euproctis chrysorrhoea Browntail moth No No Low High Apple, cherry, oak
Maconellicoccus hirsutus Pink hibiscus mealybug
No No High None Mulberry
Operophtera brumata Winter moth No Yes Low Medium Spruce, maple, birch, hawthorn, ash, crab apple, poplar, cherry, plum, oak willow, elm, and others

42
James Comiskey, National Park Service, Mid-Atlantic Network, Inventory and Monitoring Program, Program Manager.
Sources of Expertise
Betsy Lyman, National Park Service, Delaware Water Gap National Recreation Area, Northeast Exotic Plant Management Team, Liaison.
Brian McDonnell, National Park Service, Delaware Water Gap National Recreation Area, Northeast Exotic Plant Management Team, Natural Resource Specialist Team Leader.
Thomas Ross, National Park Service, Sagamore National Historic Site, Superintendent. Sarah Wakamiya, National Park Service, Mid-Atlantic Network, Inventory and Monitoring
Program, Data Manager.
Beard, R., and L. Gibbons. 2011. Exotic Plant Management Team Program: 2009 annual report. Natural Resource Report NPS/NRSS/NRR—2011/458. National Park Service, Fort Collins, Colorado.
Literature Cited
Bellavia, R. M., and G. W. Curry. 1995. Cultural landscape report for Sagamore Hill National Historic Site, Volume 1: Site history, existing conditions, and analysis. Olmstead Center for Landscape Preservation, Cultural Landscape, Publication No. 8. National Park Service, Boston, Massachusetts.
Comiskey, J. A., and S. M. Wakamiya. 2011. Mid-Atlantic Network forest vegetation monitoring: 2007 to 2010. Natural Resource Technical Report NPS/MIDN/NRTR—2011/471. National Park Service, Fort Collins, Colorado.
Dutton, B. 1998. Sagamore Hill National Historic Site Vascular Plant Survey, April 1998. National Park Service, as listed in NPSspecies Database. http://science.nature.nps.gov/im/apps/npspp/ (accessed 6 May 2010).
Edinger, G. J., A. L. Feldmann, T. G. Howard, J. J. Schmid, E. Eastman, E. Largay, and L. A. Sneddon. 2008. Vegetation classification and mapping at Sagamore Hill National Historic Site, New York. Technical Report NPS/NER/NRTR—2008/124. National Park Service, Philadelphia, Pennsylvania.
National Park Service (NPS). 1996. A strategic plan for managing invasive non-native plants on National Park System Lands. U. S. Department of the Interior, National Park Service, Washington DC.
National Park Service (NPS). 2000. Strategic Plan. National Park Service. FY 2001-FY 2005. U.S. Department of Interior, National Park Service, Washington, DC.
National Park Service (NPS). 2007. Sagamore Hill National Historic Site. Final General Management Plan Final Environmental Impact Statement. Department of the Interior, National Park Service, Northeast Region, Boston, Massachusetts.
National Park Service (NPS). 2008. Sagamore Hill National Historic Site General Management Plan. Boston, Massachusetts.

43
Stalter, R. 2000. Annotated checklist of the vascular plants of Sagamore Hill National Historic Site, New York. National Park Service, as listed in NPSspecies Database. http://science.nature.nps.gov/im/apps/npspp/ (accessed 6 May 2010).
USDA Forest Service. 2011. Alien forest pest explorer static maps and links. http://www.fs.fed.us/ne/morgantown/4557/AFPE/links.html. (accessed 11 June 2011).
USDA NRCS. 2011. The PLANTS Database National Plant Data Team, Greensboro, North Carolina. http://plants.usda.gov (accessed 3 October 2011).
Werier, D. 2006. Sagamore Hill National Historic Site invasive non-native plant management plan. Technical Report NPS/NER/NRTR—2006/045. National Park Service, Boston, Massachusetts.
Zaremba, R. 1985. Sagamore Hill Species List (Flora). National Park Service, as listed in NPSspecies Database. http://science.nature.nps.gov/im/apps/npspp/ (accessed 6 May 2010).
4.1.2 Salt Marsh Vegetation Community
Salt marsh plant communities can change in response to anthropogenic activities such as ditching (Bourn and Cottam 1950, Niering and Warren 1980), tidal flow restriction (Roman et al. 1984, 1997), and re-introduction of tidal flow (Burdick et al. 1997, Roman et al. 2002, Buchsbaum et al. 2006). Salt marshes serve as nutrient filters, intercepting and absorbing land-derived runoff, thereby reducing nutrient input to estuarine and coastal waters (Howes et al. 1996). They buffer upland areas from erosion and storm waves and respond to global changes such as sea level rise (Dean 1979). Atlantic Coast sea level is estimated to rise by 50 cm by 2100 (Intergovernmental Panel on Climate Change, 1995), and changes in salt marsh vegetation or the conversion of marsh to mudflats or open water may result if marshes cannot keep pace with sea level rise (Titus 1991). Increases in air temperature related to climate change can also affect salt marsh vegetation. For example, higher air temperatures accelerate evaporation, leading to an increase in marsh salinities, and perhaps resulting in the expansion of extreme salt tolerant halophytes and unvegetated marsh pannes. Since the salt marsh vegetation community responds to environmental changes, it provides an early warning system to larger ecosystem threats or alterations, and advances understanding of the interactions between salt marsh communities and the dynamic estuarine environment. The NCBN has included salt marsh vegetation community monitoring as a vital signs indicator (Stevens et al. 2005, James-Pirri and Roman In Review).
Relevance and Context
The four hectare (12% of the park) salt marsh complex at SAHI includes small patches of estuarine tidal marsh, tidal creek, and maritime dune and beach. Eel Creek, a small tidal creek on Cold Spring Harbor, bisects the marsh. In the early 1970s, Congress designated the oak-tulip tree forest, salt marsh, and beach area of the park as a NESA (the NESA program no longer exists) (NPS 2007). Maintenance of the salt marsh/tidal creek/dune/beach complex at SAHI was included as one of the critical management areas identified in the park’s General Management Plan (NPS 2007, 2008).

44
The plant community of the Eel Creek salt marsh and maritime dune complex at SAHI was sampled twice by the NCBN, once in 2004 during the pilot implementation of the salt marsh vegetation monitoring protocol (James-Pirri 2005) and again in 2009, the first year of NCBN long-term monitoring (Patenaude and Pooler 2010) (Table 9). Both sampling events recorded vegetation in 1m2 plots. In 2004, vegetation plots were placed into two distinct zones, a sand overwash/berm area bordering the eastern edge of the salt marsh and the salt marsh proper. In 2009, vegetation plots were located throughout the salt marsh zone and the sand overwash was not specifically included in the sampling effort (Erika Patenaude, National Park Service, personal communication, 2012). Within each plot, species composition and abundance were estimated. Vegetation will be monitored every two years, and was last monitored in 2011, according to the NCBN long-term monitoring schedule (Erika Patenaude, National Park Service, personal communication, 2011). Vegetation of the salt marsh and maritime dune complex was sampled to a lesser extent (three plots sampled, refer to Figure 7) during the NVC survey (Edinger et al. 2008). Werier (2006) included the salt marsh and maritime dune habitats as one of his areas of exceptional ecological significance (refer to Section 4.1.1 Upland Vegetation).
Data and Methods
Table 9. Relative percent cover of live vegetation for the SAHI salt marsh based on NCBN sampling. Bold type indicates state listed species (refer to Appendix Table 22 for a complete plant species list).
Scientific Name Common Name Wetland Category1
Relative percent vegetative cover2
20043 20094
Ammophila breviligulata5 American beachgrass HT 21.6 0.0
Atriplex pentranda5 Saltbush HT 4.4 0.0
Atriplex cristata Crested saltbush HT 0.0 0.8
Bassia hyssopifolia Fivehook bassia HT 0.0 0.5
Distichlis spicata Spikegrass HO 11.4 9.7
Iva frutescens Marsh elder HO 0.0 1.7
Limonium carolinianum Carolina sealavender HO 6.2 0.5
Panicum amarum Bitter panicgrass MT 0.0 0.4
Salicornia species Glasswort species HO 0.0 1.4
Solidago sempervirens5 Seaside goldenrod HO 1.8 0.8
Spartina alterniflora Saltmarsh cordgrass HO 46.0 57.8
Spartina patens Saltmeadow cordgrass HO 7.8 7.9
Suaeda maritima Herbaceous seepweed HO 0.5 1.8
Suaeda calceoliformis Pursh seepweed HO 0.0 16.4
Suaeda species Seepweed species - 0.0 0.4
Toxicodendron radicans5 Poison ivy MT 0.1 0.0
1 Wetland Category: HT: high salinity tolerant, transitional wetland plant; HO: high salinity tolerant, obligate wetland plant; MT: medium salinity tolerant, transitional wetland plant; dash indicates salinity tolerance cannot be identified for genera, based on James-Pirri (In Press). 2 In 2004 the salt marsh proper and overwash/berm areas were sampled; In 2009 the overwash/berm areas was not specifically sampled. The slight difference in sampling extent may account for differences in species cover between years. 3 Data source: James-Pirri 2005. 4 Data source: Patenaude and Pooler 2010. 5 Species only observed in the washover/berm area in 2004 (James-Pirri 2005).

45
Condition of the salt marsh vegetation community was based on benchmark values put forth by James-Pirri et al. (In Press) and currently used by the NCBN to assess condition of salt marsh vegetation (E. Patenaude and P. Pooler, National Park Service, personal communication, 2011). James-Pirri et al. (In Press) examined a regional (Maine to Virginia) salt marsh plant community dataset, collected using the same protocol as the NPS NCBN long-term monitoring protocol, from National Park Service Units, US Fish and Wildlife Service National Wildlife Refuges, and other sites. Sites ranged from relatively undisturbed marshes in low population watersheds to severely impacted marshes in urbanized watersheds. Condition was based on a suite of metrics based on the percent cover of live plants in categories related to wetland status (obligate
Reference Condition
2
Benchmarks for salt marsh vegetation community based on Table 10:
or transitional wetland plant) and salinity tolerance (high, medium, and low salinity tolerance); as well as the presence of invasive vegetation (James-Pirri et al. In Press). Each metric was evaluated as Good, Moderate, or Poor condition and given a score (1, 3, 5). The sum of the scores for the metrics was used to estimate an overall condition of the vegetation community (Table 10).
Good: Total score 18-20. Caution: Total score 10-17. Significant Concern: Total score 4-9.
Werier (2006) identified the salt marsh, maritime dune, and beach community as an area of exceptional ecological significance (Exceptional Area #4, refer to Section 4.1.1). He noted that the maritime area was dominated by native species, was contiguous, and relatively undisturbed (Werier 2006). Some non-native plants were present in this area (e.g., common reed [Phragmites australis var. australis], Oriental bittersweet, tree-of-heaven) (Werier 2006). State listed plants observed in the salt marsh and maritime dune area were bitter panicgrass (Panicum amarum), Carolina sea-lavender (Limonium carolinianum), and northern bayberry (Morella pensylvanica) (Werier 2006, Patenaude and Pooler 2010, Young 2010) (Appendix Table 22). Both Edinger et al. (2008) and Werier (2006) commented that the vegetation community of the salt marsh and maritime dune complex at SAHI represented a habitat that was limited in distribution in New York State and was an example of what was likely more common around the periphery of Cold Spring Harbor prior to urbanization of the area.
Status of the Resource
2 An obligate wetland plant is a plant that occurs almost exclusively in wetlands. A transition wetland plant is a plant that can occur in either wetlands or non-wetlands.

46
Table 10. Salt marsh vegetation benchmark values based on percent cover of plant community as presented by James-Pirri et al. (In Press). Score for condition rating is in parentheses.
Current Condition for salt marsh vegetation: Good Condition and Trend
The dominant plants in the salt marsh were wetland obligate halophytes (e.g., saltmarsh cordgrass [Spartina alterniflora], saltmeadow cordgrass [S. patens]) (Table 9). The current condition of the salt marsh vegetation community was rated as Good based on a total score of 20 for both vegetation surveys.
Current Trend for salt marsh vegetation: Stable to Unknown The trend for the salt marsh vegetation community was assessed as Stable since the condition for both sampling events (2004 and 2009) was rated as Good. A rating of Unknown was also given due to a lack of long-term or historic data.
The salt marsh vegetation data were of good quality and there was high confidence in the accuracy of the data.
Confidence in Condition and Trend
There were no data gaps for salt marsh vegetation. The NCBN monitors salt marsh vegetation at two-year intervals, with the next scheduled sampling event in 2011.
Data Gaps
Threats to salt marsh ecosystems include eutrophication, watershed development, wetland loss, changes in hydrology, sedimentation, and other human-induced problems. Most of these threats are beyond the control of the park. The park has erected fencing and regulatory signage to prevent trampling of the salt marsh-dune area by visitors (S. Gurney, National Park Service, personal communication, 2010).
Threats
Metric1
Percent cover
Good condition
(5)
Moderate condition
(3)
Poor condition
(1) 2004
Vegetation2 2009
Vegetation3
High salinity tolerant, obligate wetland plants >55% 40-55% <40% 74% (5) 98% (5) Medium salinity tolerant, obligate wetland plants <4% 4-12% >12% 0% (5) 0% (5)
Low salinity tolerant, obligate wetland plants <2% 2-20% >20% 0% (5) 0% (5)
Invasive plants <1% 1-20% >20% 0% (5) 0% (5)
Overall Condition (sum of scores) 18-20 10-17 4-9 Good
Condition (20)
Good Condition
(20) 1 Condition metrics and benchmarks from James-Pirri et al. (In Press). Do not reproduce without permission from author. 2 Condition based on data presented in James-Pirri 2005. 3 Condition based on data presented in Patenaude and Pooler 2010.

47
The stands of Phragmites australis var. australis adjacent to the salt marsh at SAHI could threaten the salt marsh community if it expands in into the marsh. NPS staff have indicated that the Phragmites patch along the southern boundary of the marsh has been treated and removed as per the Invasive Species Eradication Contract in 2010-2011 (T. Ross, National Park Service, personal communication, 2012).
Sheila Colwell, National Park Service, Boston Harbor Islands National Recreation Area, Senior Natural Resource Program Manager.
Sources of Expertise
Scott Gurney, National Park Service, Sagamore National Historic Site, Park Ranger. Erika Patenaude, National Park Service, Northeast Coastal and Barrier Network, Biologist. Penelope Pooler, National Park Service, Northeast Coastal and Barrier Network, Quantitative
Ecologist. Thomas Ross, National Park Service, Sagamore National Historic Site, Superintendent.
Bourn, W. S., and C. Cottam. 1950. Some biological effects of ditching tidewater marshes. Research Report 19. US Fish and Wildlife Service, Washington, DC.
Literature Cited
Buchsbaum R., J. Catena, E. Hutchins, M. J. James-Pirri, and A. Ridlon. 2006. Changes in salt marsh vegetation, Phragmites australis, and nekton in response to increased tidal flushing in a New England salt marsh. Wetlands 26:544-557.
Burdick, D. M., M. Dionne, R. M. Boumans, and F. T. Short. 1997. Ecological responses to tidal restorations of two northern New England salt marshes. Wetlands Ecology and Management 4: 129-144.
Dean, R. G. 1979. Effects of vegetation on shoreline erosional processes. Pages 415-426 in P. E. Greeson, J. R. Clark, and J. E. Clark, editors. Wetland Functions and Values: The State of our Understanding. American Water Resources Association, Minneapolis, Minnesota.
Edinger, G. J., A. L. Feldmann, T. G. Howard, J. J. Schmid, E. Eastman, E. Largay, and L. A. Sneddon. 2008. Vegetation classification and mapping at Sagamore Hill National Historic Site, New York. Technical Report NPS/NER/NRTR—2008/124. National Park Service, Philadelphia, Pennsylvania.
Howes, B. L., P. K. Weiskel, D. D. Goehringer and J. M. Teal. 1996. Interception of freshwater and nitrogen transport from uplands to coastal waters: the role of saltmarshes. Pages 287-310 in K. F. Nordstrom and C. T. Roman, editors. Estuarine Shores: Evolution, Environments and Human Alterations. John Wiley and Sons, New York.
Intergovernmental Panel on Climate Change. 1995. Climate Change. In J. T. Houghton, L. G. Meira Filho, B. A. Callendfar, N. Harris, A. Kattenberg, and K. Maskell, editors. The Science of Climate Change. Cambridge University Press, New York.
James-Pirri, M. J. 2005. Implementing long-term monitoring of salt marsh communities within the Northeast Coastal and Barrier Network of the National Park Service, Year 2: Monitoring at Boston Harbor Islands National Park Area, Cape Cod National Seashore, Gateway

48
National Recreation Area, and Sagamore Hill National Historic Site. February 2005, Progress Report to National Park Service, Northeast Coastal and Barrier Network, Kingston, Rhode Island.
James-Pirri, M. J., and C. T. Roman. In Review. Monitoring vegetation in salt marshes: A protocol for National Park Service’s Long-Term Monitoring Program, Northeast Coastal Barrier Network. Natural Resource Technical Report NPS/NCBN/NRTR—2010/XXX. National Park Service, Fort Collins, Colorado.
James-Pirri, M.J., J.L. Swanson, C.T. Roman, H.S. Ginsberg, and J.F. Heltshe. In Press. Case Study Chapter: Ecological thresholds for salt marsh nekton and vegetation communities. In G. R. Guntenspergen, editor. Application of Threshold Concepts in Natural Resource Decision Making. Springer, New York.
National Park Service (NPS). 2007. Sagamore Hill National Historic Site. Final General Management Plan Final Environmental Impact Statement. Department of the Interior, National Park Service, Northeast Region, Boston, Massachusetts.
National Park Service (NPS). 2008. Sagamore Hill National Historic Site General Management Plan. Boston, Massachusetts.
Niering, W. A., and R. S. Warren. 1980. Vegetation patterns and process in New England salt marshes. Bioscience 30:301-307.
Patenaude, E. L., and P. S. Pooler. 2010. Salt marsh vegetation and nekton community monitoring at Sagamore Hill National Historical Site: 2009 summary report. Natural Resource Data Series NPS/NCBN/NRDS—2010/067. National Park Service, Fort Collins, Colorado.
Roman, C. T., W. A. Niering, and R. S., Warren. 1984. Salt marsh vegetation change in response to tidal restriction. Environmental Management 8: 141-150.
Roman, C. T., J. A. Peck, J. R. Allen, J. W. King, and P. G. Appleby. 1997. Accretion of a New England (U.S.A.) salt marsh in response to inlet migration, storms, and sea-level rise. Estuarine, Coastal and Shelf Science 45: 717-727.
Roman, C. T., K. B. Raposa, S. C. Adamowicz, M. J. James-Pirri, and J. G. Catena. 2002. Quantifying vegetation and nekton response to tidal restoration of a New England salt marsh. Restoration Ecology 110: 450-460.
Stevens, S., B. Milstead, M. Albert, and G. Entsminger. September 2005. Northeast Coastal and Barrier Network Vital Signs Monitoring Plan. Technical Report NPS/NER/NRTR—2005/025. National Park Service, Boston, Massachusetts.
Titus, J. G. 1991. Greenhouse effect and coastal wetland policy: How Americans could abandon an area the size of Massachusetts at minimum cost. Environmental Management 15: 39-58.

49
Werier, D. 2006. Sagamore Hill National Historic Site invasive non-native plant management plan. Technical Report NPS/NER/NRTR—2006/045. National Park Service. Boston, Massachusetts.
Young, S. M. 2010. New York Natural Heritage Program Rare Plant Status List. New York Natural Heritage Program, Albany, New York.
4.1.3 Managed Field Vegetation
Agricultural fields are part of the cultural character of SAHI. During Roosevelt’s time, the fields provided fruits and vegetables for the family, and hay and feed for the livestock (NPS 2007). Cultivation of the agricultural fields at SAHI continued through the 1930s but declined significantly and eventually ceased in the early 1940s. Many of the former agricultural fields have gone into succession and returned to woodlands (NPS 2007). In an effort to restore the cultural agricultural character of Sagamore Hill, the park has opened up some of the landscape that had become overgrown and manages these areas as meadow or open field. Retaining and maintaining the combination of field and woodland habitats was listed as a key natural resource management principle for the park (NPS 2007). In addition to their historical and cultural importance, the fields are a natural resource for the park. Mammals, birds, turtles, and odonates (dragonflies and damselflies) use the fields at SAHI for foraging, resting, and nesting (Refer to specific community sections for more detail).
Relevance and Context
There have been no inventories or monitoring of the park’s field vegetation, and the fields have been mentioned only briefly as sampling locations in other community inventories (e.g., herpetofauna and odonate inventories).
Data and Methods
There was no established reference condition for the vegetation of the managed fields at SAHI. However, the proposed historical landscape preservation plan indicated that the vegetation of the restored fields should include native grasses and forbs that were low maintenance, require mowing no more than once or twice per year, and were relatively resistant to invasion by non-native plants (Anonymous date unknown). The historical landscape preservation plan suggested several native species that should be seeded in the restored field areas, and this could be used as a reference vegetation community for this resource (Table 11). Suggested benchmarks for reference condition, based on best professional judgment, would be the percent of the community that were native species of grasses and forbs:
Reference Condition
Managed field benchmark for vegetation community: Good: > 80% of plant species were native grasses and forbes. Caution: 50% to 80% of plant species were native grasses and forbes. Significant Concern: < 50% of plant species were native grasses and forbes.
In 2009 to 2011, the Northeast Exotic Plant Management Team (EPMT) worked closely with park staff and the Olmsted Center for Landscape Preservation to prepare a detailed scope of
Status of the Resource

50
work for a historical landscape preservation plan to restore some fields and plant them with native grasses and forbs (Beard and Gibbons 2011). This contract proposed to rehabilitate the West Lawn (Area 1), Southeast Field (Area 2), and North Field (Area 3), and by removing successional vegetation, planting a native grass/meadow mixture, and re-installing historic fence lines to define boundaries of the open areas with the purpose of furthering the park’s goal to stabilizing and rehabilitating cultural landscape features in the historic core of SAHI (Anonymous date unknown). The project components included: cutting and clearing of trees and stump grinding in three areas, totaling 0.88 ha, of the historic core (Areas 1, 2, and 3 in Figure 14); installation of 187 meters of historic fence; and hydroseeding of the cleared areas (Areas 1, 2, and 3 in Figure 14) with native, open meadow grasses and forbs (Table 11) (Anonymous date unknown). The scope of work called for the removal of approximately 385 trees/trunks plus vine removal in these three areas (130 trunks in Area 1, 100 trunks in Area 2, and 155 trunks in Area 3) (Anonymous date unknown). Park staff have indicated that this work was completed; however, no data on the success of the native grass and forb seeding were available. Table 11. Native field grasses and forbes suggested for planting in the restored fields.
Scientific Name Common Name Type
Agrostis perennans Autumn bentgrass Grass
Andropogon gerardii Big bluestem Grass
Asclepias tuberosa Butterfly milkweed Forb
Chamaecrista fasciculata Partridge pea Forb
Deschampsia flexuosa Wavy hair grass Grass
Dichanthelium clandestinum Deertongue Grass
Elymus virginicus Virginia wildrye Grass
Festuca rubra Red fescue Grass
Koeleria macrantha Prairie junegrass Grass
Monarda fistulosa Wild bergamot Forb
Monarda punctata Spotted beebalm Forb
Rudbeckia species Black or brown-eyed Susans Forb
Schizachyrium scoparium Little bluestem Grass
Sorghastrum nutans Indiangrass Grass
Sporobolus heterolepis Northern prairie dropseed Grass
Tridens flavus Purpletop tridens Grass

51
Current Condition for managed field vegetation: Unknown Condition and Trend
There have been no focused vegetation surveys in the managed fields at SAHI. Current Trend for managed field vegetation: Unknown There have been no focused vegetation surveys in the managed fields at SAHI.
There were no data on the success of the hydroseeding of native grasses and forbs in the restored fields; therefore, confidence in the data could not be assessed.
Confidence in Condition and Trend
There was very little information on the vegetation community of the managed fields. The work proposed landscape preservation plan was completed in 2010-2011; however, a report on the progress of the field restoration does not exist. The park may want to consider monitoring the vegetation of the managed fields to ensure that the restoration was successful (e.g., native field vegetation is established), to follow the progress of the restoration efforts, and to document the vegetation of the managed fields. Information on the managed field vegetation will help guide resource management decisions for future restoration activities and the development of appropriate field mowing schedules to enhance/protect wildlife (Refer to Herpetofauna Community for more information on mowing schedules).
Data Gaps
It was difficult to assess threats to the managed field vegetation due to the lack of information on this resource at SAHI. Possible threats are invasive vegetation, as it is ubiquitous throughout the park, as well as overgrowth by successional vegetation.
Threats
Sherry Justus, National Park Service, Sagamore Hill National Historic Site Chief, Interpretation, Visitor Services and Natural Resources.
Sources of Expertise
Thomas Ross, National Park Service, Sagamore National Historic Site, Superintendent.
Anonymous. Date unknown. Stabilize and rehabilitate cultural landscape (PMIS 106918 and 106961). National Park Service, Sagamore Hill National Historical Site, Oyster Bay, New York.
Literature Cited
Beard, R., and L. Gibbons. 2011. Exotic Plant Management Team Program: 2009 annual report. Natural Resource Report NPS/NRSS/NRR—2011/458. National Park Service, Fort Collins, Colorado.
National Park Service (NPS). 2007. Sagamore Hill National Historic Site. Final General Management Plan Final Environmental Impact Statement. Department of the Interior, National Park Service, Northeast Region, Boston, Massachusetts.

52
Figure 14. Map indicating the three fields (Areas 1, 2, and 3) included in the recent (circa 2010) historical landscape preservation scope of work plan (map provided by S. Justus, National Park Service).

53
4.1.4 Avian Community
The NETN uses forest breeding birds as a biotic indicator to assess the effects of habitat loss and fragmentation (Faccio et al. 2010). Birds are an important component of park ecosystems and their prominent position in most food webs make them a good sentinel of local and regional ecosystem change. As high profile taxa, many parks provide information on the status and trends of the park’s avian community through their interpretive materials and programs (Faccio et al. 2010).
Relevance and Context
Avian surveys, funded by the NCBN, were conducted at SAHI by the Theodore Roosevelt Sanctuary and Audubon Center from January through December 2003 (Barton 2005). Twelve census points, spaced a minimum of 250 m apart, were located throughout the park in major habitat types (suburban-residential-landscaped areas, forests, and the salt marsh-beach-estuary complex). While the fields at SAHI may have the potential to be a separate grassland habitat, Barton (2005) considered the fields to be part of the suburban-residential-landscaped habitat due to several factors, including fragmentation, seasonal mowing disturbance, and the inability of the fields to attract typical grassland birds. However, the field habitat does provide important foraging opportunities for common species like barn swallows (Hirundo rustica), Eastern kingbirds (Tyrannus tyrannus), and robins (Turdus migratorius) (NPS 2007).
Data and Methods
Barton (2005) used stratified point counts to measure bird density and occurrence throughout the year, recording birds that were seen and/or heard. A seven-minute sampling interval was used at each census point, with 32 census point surveys conducted during 2003. Guild3
The Audubon Society has conducted Christmas Bird Counts in the Long Island area since 1901 (National Audubon Society 2011). The nearest count circles to SAHI are the Huntington (circle NY37) and Mill Neck count circles (code NY3B). The New York Breeding Bird Atlas (NY DEC 2011b) has collected information (data from 2000-2005) on species near SAHI, (census block 6252A, which includes Cove Neck and adjacent areas). Together with the Barton (2005) data, these combined databases based yielded 127 species, 116 directly observed in SAHI and an additional 11 species known to occur near the park (Appendix B Table 1).
-specific surveys for owls, woodcock, nightjars, and nocturnal marsh birds were also conducted. These groups of birds were not well represented in standard breeding bird surveys due to their specific activity periods and/or habitat associations and therefore required more focused surveys (Barton 2005). Barton (2005) estimated that approximately 121 to 126 species of birds should be present at SAHI and recorded 116 species during 2003 inventory (Appendix B Table 1).
3 A guild is any group of species that exploit the same resources, often in related ways.

54
The NETN forest breeding bird guild-based (13 guilds) species richness scoring system (Faccio et al. 2010) was used to evaluate the biotic integrity of the forest avian community observed by Barton (2005) since these were the most reliable data for birds directly observed within the park. The NETN protocol focuses on forest breeding birds and only considers landbirds (small terrestrial birds). It does not include raptors, upland game birds, waterbirds, or waterfowl in its condition estimate (with the exception of including all species observed in the estimation of species richness percentages). The 13 guilds are broadly categorized as specialist or generalist (Table 12). Specialist guilds contain species with a narrow range of habitat tolerances or that exhibit low intrinsic rates of population increase. Therefore, these guilds are thought of as indicative of a high-integrity ecological condition while generalist guilds are considered indicative of a low-integrity ecological condition (Faccio et al. 2010).
Reference Condition
Faccio and Mitchell (2010) summarized the breeding bird community for several parks in the adjacent NETN Network: Eleanor Roosevelt NHS, Home of Franklin D. Roosevelt NHS, Marsh Billings-Rockefeller NHS, Minute Man National Historical Park (NHP), Morristown NHP, Saint-Gaudens NHS, Saratoga NHP, Vanderbilt Mansion NHS, and Weir Farm NHS using the guild-based rating system. The avian community at SAHI was evaluated using the NETN guild system and compared to the NETN parks summarized by Faccio and Mitchell (2010). While SAHI is not in the NETN, it is does have similarities with these other parks (e.g., small cultural parks with forested habitat), and in the absence of other methods to determine condition of the avian community this comparison was deemed appropriate based on best professional judgment. To compare these parks, a numerical score was given to each of three NETN ratings: Good=3, Caution=2, Significant Concern =1 (Table 12); and the sum of the scores for the 13 guilds was used as an indicator of overall condition relative to the other parks (Figure 15). Percentile breakpoints based on the range of possible scores were used to evaluate the condition of the avian community at SAHI (lowest possible score was 13, all guilds rated as Significant Concern; highest possible score was 39, all guilds rated as Good, Figure 15). The percentile breakpoints for sum of the guild scores were based on best professional judgment.
Benchmarks for scores based on NETN avian guild species richness: Good: > 80th percentile (total score: > 33.8) Caution: 50th to 80th percentile (total score: 26-33.8) Significant Concern: < 50th percentile (total score: < 26)
Barton (2005) detected 116 species of birds during the 2003 inventory at SAHI. He estimated between 121-126 species should be present at SAHI and was able to detect 92% of the expected species. Fifty were confirmed as breeding or probably breeding in the park. He identified another 19 species that were likely breeding in the park based on their presence in possible nesting habitat (Appendix B Table 1).
Status of the Resource
Seven bird species observed at SAHI were New York state listed species. Four were listed as threatened species (bald eagle [Haliaeetus leucocephalus], common tern [Sterna hirundo], least tern [Sterna antillarum], and pied-billed grebe [Podilymbus podiceps]) and three were listed as special concern (common loon [Gavia immer], osprey [Pandion haliaetus], and sharp-shinned hawk [Accipiter striatus]) (NY DEC 2011a, Table 2, Appendix B Table 1).

55
Table 12. Percent species richness for avian guilds and NETN guild-based rating for breeding birds at SAHI observed in residential-landscaped and woodland habitats by Barton (2005). Arrows after guilds indicate the desired direction of species richness to improve condition.
Biotic element and guild Guild type SAHI percent species richness
NETN guild rating (score)
Compositional
Exotic Generalist 7% Caution (2)
Nest predator Generalist 9% Good (3)
Resident Generalist 34% Caution (2)
Single brooder Specialist 41% Significant Concern (1)
Functional
Bark prober Specialist 9% Caution (2)
Ground gleaner Specialist 2% Significant Concern (1)
High canopy forager Specialist 5% Significant Concern (1)
Low canopy forager Specialist 14% Caution (2)
Omnivore Generalist 36% Caution (2)
Structural
Canopy nester Specialist 23% Significant Concern (1)
Forest ground nester Specialist 2% Significant Concern (1)
Interior forest nester Specialist 11% Caution (2)
Shrub nester Generalist 23% Significant Concern (1)
Total score for SAHI 21 Additionally, there were 19 species of birds observed at SAHI by Barton (2005) that were listed as priority species by Partners in Flight (PIF) for the Southern New England area (Dettmers and Rosenberg 2000) (Table 2, Appendix B Table 1).Ten PIF species were confirmed as breeding or probably breeding in SAHI. Two of these (Baltimore oriole [Icterus galbula] and wood thrush [Hylocichla mustelina]) had a PIF status of IA: High Continental Priority-High Regional Responsibility indicating that conservation of these species is of concern throughout their range and that conservation in the region is critical to the overall health of the species. Three species (chimney swift [Chaetura pelagica], Eastern wood-pewee [Contopus virens], and hairy woodpecker [Picoides villosus]) had a PIF status of IIA: High Regional Priority-High Regional Concern indicating that these species are of moderate continental priority, but important in regional conservation because they are experiencing declines in the core of their range and require short-term conservation to reverse or stabilize trends. The remaining PIF listed species that breed in the park had a status of V or Additional State Listed Species, indicating that the species is of special interest locally. These species were black-crowned night heron (Nycticorax nycticorax), great blue heron (Ardea Herodias), great egret (Ardea alba), osprey, and snowy egret (Egretta thula) (Table 2, Appendix B Table 1).
PIF listed species observed, but were not confirmed as breeding at SAHI, were: American black duck (Anas rubripes, PIF: IIC), black-and-white warbler (Mniotilta varia, PIF: IIA), black-billed cuckoo (Coccyzus erythropthalmus, PIF: IA), Blackburnian warbler (Dendroica fusca, PIF: IIC),

56
Eastern towhee (Pipilo erythrophthalmus, PIF: IIA), purple finch (Carpodacus purpureus, PIF: IIA), and scarlet tanager, which may possibly breed in the park (Piranga olivacea, PIF: IA). PIF status IIC is High Regional Priority-High Regional Threats indicating they are of moderate continental priority, are uncommon in the region whose remaining populations are threatened, usually because of extreme threats to sensitive habitats (Dettmers and Rosenberg 2000). Two species with a PIF status of V and were possibly breeding in the park were the common tern and least tern (Table 2, Appendix B Table 1).
Four PIF species detected during Christmas bird counts (data from 1900 to 2010) or were listed by the NY Breeding Bird Atlas (data from 2000-2005) for areas in the vicinity of SAHI were: American woodcock (Scolopax minor, PIF: IA), blue-winged warbler (Vermivora pinus, PIF: IA), Cooper’s hawk (Accipiter cooperii, PIF: V), and pied-billed grebe (Podilymbus podiceps, PIF: V) (Table 2, Appendix B Table 1).
Four exotic species, European starling (Sturnus vulgaris), house finch (Carpodacus mexicanus), house sparrow (Passer domesticus), and rock dove (Columba livia), were detected in the park by Barton (2005) (Appendix B Table 1).
The NETN forest breeding bird species richness guild rating system was applied to all possible breeding birds at SAHI that were observed in residential-landscaped and woodland habitats (Barton’s [2005] habitat descriptions of “suburban landscaped habitat”, “mature forest habitat”, and “successional forest habitat”) (Table 12, Appendix B Table 1). Six of the 13 guilds rated as Significant Concern with another six as Caution. Only the nest predator guild scored as a Good rating (Table 12). The sum of scores for the 13 avian guilds at SAHI was 21, falling in the Significant Concern range based on the benchmark metric (< 50th percentile) for this resource. Compared to other small cultural parks in the region, SAHI ranked just above the 25th percentile having the second lowest overall guild score, with only Saugus Iron Works NHS ranking lower (Figure 15).
Current Condition for avian community: Significant Concern to Unknown Condition and Trend
Based on the NETN guild rating system and comparison with other small cultural parks in the region, the avian community at SAHI scored as Significant Concern. A condition of Unknown was also given since the avian inventory was conducted almost a decade ago and may not reflect the current community at the park.
The 2003 avian inventory at SAHI observed a lower than desired number of specialist species, considered indicative of high-integrity ecological condition (e.g., bark probers, ground gleaners, forest canopy foragers and nesters, and single brooders), and a higher than desired number of generalist species, considered indicative of low-integrity ecological condition (e.g., exotics, residents, omnivores, and shrub nesters) (Table 12) (Faccio et al. 2010).
Current Trend for avian community: Unknown. There was a lack of historic and/or long-term data to determine trends.

57
Figure 15. Comparison of overall NETN guild scores for forest breeding bird guilds for selected NPS units in the Northeast Region. Percentile lines based on the range of possible guild scores (13 to 39) are shown for reference. Park abbreviations: ELRO: Eleanor Roosevelt NHS, MABI: Marsh-Billings-Rockefeller NHP, MIMA: Minute Man NHP, ROVA: Home of Franklin D. Roosevelt NHS, SAGA: Saint-Gaudens NHS, SAHI: Sagamore Hill NHS, SAIR: Saugus Iron Works NHS, SARA: Saratoga NHP, VAMA: Vanderbilt Mansion NHS, WEFA: Weir Farm NHS.
The existing data for the SAHI avian community were of good quality, but were collected almost a decade ago.
Confidence in Condition and Trend
There was only one avian inventory at SAHI and it was conducted almost a decade ago. The park has prominent forested habitat and 69 bird species likely breed in the park, including 13 of the 19 PIF listed birds found in the park. The NCBN is currently working on implementing either the NETN forest bird monitoring protocol or conducting another avian inventory within the next few years (by 2015) (S. Stevens, National Park Service, personal communication, email 10 September 2012).
Data Gaps
A primary threat to landbird populations is habitat loss due to development; however, Neotropical migrants (birds that breed in the US and Canada during the summer, but migrate to Mexico, Central America, South America, or the Caribbean Islands during the winter such as flycatchers, warblers, orioles, and vireos) are particularly vulnerable to habitat fragmentation (Robinson and Wilcove 1994, Faaborg et al. 1995, Rosenberg et al. 1999). Forest fragmentation leads to increases in edge habitat, an ideal habitat for non-migratory resident species, and results in higher rates of brood parasitism and nest predation in the remaining forest habitat (Faccio et al. 2010). While small parks like SAHI may have some control over forest fragmentation within their boundaries, habitat loss and fragmentation are widespread throughout much of the Northeast region (Faccio et al. 2010).
Threats

58
Sara Stevens. National Park Service, Northeast Coastal and Barrier Network Program Manager. Sources of Expertise
Barton, H. April 2005. Avian inventory of Sagamore Hill National Historical Site. Natural Resources Report NPS/NER/NRTR—2008/119. National Park Service, Philadelphia, Pennsylvania.
Literature Cited
Dettmers R., and K. Rosenburg. 2000. Draft Partners in Flight landbird conservation plan: Physiographic Area 9: Southern New England. Version 1.0, October 2000. American Bird Conservancy, Ithaca, New York.
Faaborg, J., M. Bittingham, T. Donovan, and J. Blake. 1995. Habitat fragmentation in the Temperate Zone. Pages 357-380 in T. E. Martin and D. M. Finch, editors. Ecology and Management of Neotropical Migratory Birds. Oxford University Press, Oxford, UK.
Faccio, S. D., and B. R. Mitchell. 2010. Northeast Temperate Network breeding landbird monitoring report: 2009 annual report. Natural Resource Report NPS/NETN/NRR—2010/190. National Park Service, Fort Collins, Colorado.
Faccio, S., B. R. Mitchell, and P. S. Pooler. 2010. Breeding landbird monitoring protocol: Northeast Temperate Network. Natural Resource Report NPS/NETN/NRR—2010/198. National Park Service, Fort Collins, Colorado.
National Audubon Society. 2011. Christmas Bird Count website. http://birds.audubon.org/christmas-bird-count (accessed 11 July 2011).
National Park Service (NPS). 2007. Sagamore Hill National Historic Site. Final General Management Plan Final Environmental Impact Statement. Department of the Interior, National Park Service, Northeast Region, Boston, Massachusetts.
New York Department of Environmental Conservation (NY DEC). 2011a. List of endangered, threatened and special concern fish and wildlife species of New York State. http://www.dec.ny.gov/animals/7494.html (accessed 6 July 2011).
New York Department of Environmental Conservation (NY DEC). 2011b. Google Maps and Earth, Breeding Bird Atlas: Eastern and Southern NY. http://www.dec.ny.gov/pubs/42978.html (accessed 7 July 2011).
Robinson, S. K., and D. S. Wilcove. 1994. Forest fragmentation in the Temperate Zone and its effects on migrating songbirds. Bird Conservation International 4:233-249.
Rosenberg, K. V., J. D. Lowe, and A. A. Dhondt. 1999. Effects of forest fragmentation on breeding tanagers: A continental perspective. Conservation Biology 13:568-583.

59
4.1.5 Herpetofauna Community
Habitats for herpetofauna (amphibians and reptiles) at SAHI are deciduous woodlands, old fields, two freshwater ponds (Woodpile/Hog Pond and Heron Pond, a vernal pond) and the estuarine habitats of Eel Creek and the salt marsh on the park’s eastern edge bordering Cold Spring Harbor (Cook et al. 2010). Given the impacts of urbanization on amphibians and reptiles, Cove Neck provides a landscape of relatively low density development. Within Cove Neck, SAHI provides a core of protected habitat with relatively intact native vegetation critical for the support of populations of box turtles and other native reptiles and amphibians in what is the least urbanized corner of Nassau County, NY (Cook et al. 2010).
Relevance and Context
Herpetofauna were inventoried at SAHI from March to September 2002 using six standard sampling methodologies: anuran calling surveys, egg mass counts, visual encounter surveys, coverboards, turtle traps, and minnow traps (Cook et al. 2010). Surveys were conducted approximately one week per month during this time. This inventory was funded by the NCBN and data are currently managed and archived by the NCBN.
Data and Methods
There were no established metrics to evaluate condition of herpetofauna in an urban-suburban setting. However, declines in herpetofauna diversity and/or species richness are generally viewed as undesirable (Cook et al. 2010). Therefore, herpetofauna species richness was used as a metric to evaluate condition, with the caveat that it was not known how many species would be appropriate for a small urban-suburban park such as SAHI.
Reference Condition
Benchmarks for herpetofauna species richness at SAHI were estimated based on previous surveys and historical accounts. Eight amphibian and nine reptile species occur or have historically occurred in the park (Cook et al. 2010). A percentile system was used to set benchmark condition values with a Good condition rated as 80% or more of the potentially or historically occurring species. Significant Concern was rated as a deviation of 50% or more, with the Caution rating falling in between these two values. These ratings were based on the best available data and best professional judgment.
Amphibian benchmark for species richness: Good: > 80% of potential species pool (≥ 6 species detected). Caution: 50% to 80% of potential species pool (5 species detected). Significant Concern: < 50% of potential species pool (≤ 4 species detected).
Reptile benchmark for species richness: Good: > 80% of potential species pool (≥ 7 species detected). Caution: 50% to 80% of potential species pool (6 species detected). Significant Concern: < 50% of potential species pool (≤ 5 species detected).
Most of the herpetofauna recorded at SAHI during the 2002 inventory were common, urban-tolerant species that typically have small home ranges, simple life histories, and broad habitat tolerances (Schlauch 1976, Cook et al. 2010). Eastern red-backed salamander (Plethodon
Status of the Resource

60
cinereus), spring peeper (Pseudacris crucifer), snapping turtle (Chelydra serpentine), painted turtle (Chrysemys picta), and Eastern gartersnake (Thamnophis s. sirtalis) are examples of urban tolerant species found at SAHI. However, there were species (e.g., wood frog [Rana sylvatica], spotted salamander [Ambystoma maculatum], gray treefrog [Hyla versicolor], and box turtle [Terrapene carolina]) that were locally uncommon and that do generally survive well in urban-suburban landscapes (Cook et al. 2010).
Thirty-eight species of herpetofauna are resident natives of Long Island (Noble 1927) and 36 species are native to Nassau County (Schlauch 1978). Cook et al. (2010) estimated that the local species pool was likely to be 29 species, 17 of which likely occurred on Cove Neck with 11 species occurring within SAHI itself. Thus, the 2002 SAHI inventory recorded 91% of the species (10 of 11 species) known to be historically present in the park and 59% of the species (10 of 17 species) that may have occurred on Cove Neck (Table 13). During this inventory, 82% of the individuals encountered were amphibians and 18% were reptiles (Table 13).
SAHI provides a variety of habitats that are used by herpetofauna, and many of the species present in the park depend upon a combination of habitat types. The two freshwater wetlands, Woodpile/Hog Pond (a permanent pond) and Heron Pond (a vernal pond with a relatively short hydroperiod), had the greatest numbers of species and individuals (Figure 16). Yet, most species at SAHI were primarily terrestrial, spending most of the year in woodland and field habitats. Amphibians use freshwater wetlands at SAHI primarily for reproduction and conversely, the three species of aquatic turtles at SAHI require well-drained, open uplands for nesting (Cook et al. 2010). The Cold Spring Harbor-Oyster Bay system supports one of the largest populations of diamondback terrapin (Malaclemys t. terrapin) in New York (Morreale 1992, USFWS 2006). Although only a small portion of this system, Eel Creek and the beach at SAHI provide habitat and nesting areas that are used by this species (Cook et al. 2010).
Cook et al. (2010) postulated that low species richness of herpetofauna at SAHI was a reflection of the relatively new geological nature of Long Island and its insular nature, the small size of SAHI (33.5 ha), and minimal freshwater habitats that limit the number of species the park can support. There is no freshwater stream or riparian habitat in the park and only two small freshwater ponds, one of which is an ephemeral vernal pond. It is also likely that urbanization and other habitat changes have reduced species richness at SAHI, but the limited amount historical information for SAHI prevents comparison (Cook et al. 2010). Comparatively the species pool of amphibians and reptiles at SAHI was proportionate to the local (Cove Neck) species pool; however, the community structure of turtles and snakes at SAHI deviates from the local species pool. SAHI historically supported five species of snakes; but only the Eastern gartersnake was observed in 2002. This suggests that snake species richness may have declined on Cove Neck, perhaps due to urbanization and other habitat changes (Ziminski 1970, Kjoss and Litvaitis 2001, Cook et al. 2010).
Two species known to occur at SAHI, the marbled salamander (Ambystoma opacum) and the Eastern box turtle (Terrapene carolina) are a New York State listed species of Special Concern (Schlesinger 2007, NY DEC 2011). Only the Eastern box turtle was observed during the 2002 surveys (Table 13).

61
Table 13. Herpetofauna historically and recently observed at SAHI.
Scientific Name1 Common Name Historically observed2 NPSpecies3 Observed in
20022
Amphibians-salamanders Ambystoma maculatum Spotted salamander X X X (6%) Ambystoma opacum (SC) Marbled salamander X Plethodon cinereus Eastern red-backed salamander X X X (1%)
Amphibians-frogs Bufo fowleri Fowler’s toad X Hyla versicolor Gray tree frog X X (1%) Pseudacris crucifer Spring peeper X X X (34%) Rana clamitans melanota Northern green frog X Rana sylvatica Wood frog X X X (40%)
Reptiles-snakes Coluber c. constrictor Northern black racer X Diadophis punctatus edwardsi Northern ring-neck snake X Lampropeltis t. triangulum Eastern milk snake X Storeria dekayii Northern brownsnake X Thamnophis s. sirtalis Eastern gartersnake X X X (1%)
Reptiles-turtles Chelydra serpentin Snapping turtle X X X (1%) Chrysemys picta Painted turtle X X X (2%) Malaclemys t. terrapin Northern diamond-backed terrapin X X (8%) Terrapene carolina (SC) Eastern box turtle X X X (5%)
1 Bold type indicates NY state listed species (E: endangered, T: threatened, SC: special concern) 2 Based on data presented in Cook et al. (2010). 3 NPSspecies database (NPS 2010)
Figure 16. Distribution of herpetofauna observed at SAHI in 2002. Number of species observed in each habitat is indicated above bars.

62
Current Condition for amphibians: Caution to Unknown Condition and Trend
Only five of eight possible amphibian species were observed in 2002, falling within the Caution range. A condition of Unknown was also given since the most recent survey was conducted a decade ago and may not reflect the current amphibian community.
Current Trend for amphibians: Unknown There was a lack of historic and/or long-term data to determine trends.
Current Condition for reptiles: Significant Concern to Unknown Only five of nine possible reptile species were observed in 2002, falling within the Significant Concern range. A condition of Unknown was given since the most recent survey was conducted a decade ago and may not reflect the current reptile community.
Current Trend for reptiles: Unknown to Declining There was a lack of historic and/or long-term data to determine trends. A trend of Declining was also given, as there was evidence that reptile species richness may be declining. Historically, more snake species have occurred in this part of Long Island. Painted turtles may also be declining based on historical anecdotal evidence as presented in Bellavia and Curry (1995) where Theodore Roosevelt Jr. wrote of Woodpile Pond:“…countless turtles sat on the rotten logs that lay there, or slowly swam over its surface, their heads sticking out of the green scum like small periscopes”. During the 2002 inventory, only six painted turtles were observed leading Cook et al. (2010) to conclude that the population had declined since the historic period.
The 2002 inventory of herpetofauna at SAHI provided good baseline data; however, it was conducted almost a decade ago. Additionally, 2002 was a dry year on Long Island (Cook et al. 2010) making detection of amphibians and reptiles more difficult, and some species actually present at SAHI may have gone undetected (Cook et al. 2010). SAHI would benefit from a re-inventory of herpetofauna.
Confidence in Condition and Trend
The wetlands (Heron Pond and Woodpile/Hog Pond) are important habitats for herpetofauna; however, there was little data on the physical conditions of these ponds (e.g., water quality, hydroperiod in the case of Heron Pond) that may affect herpetofauna communities.
Data Gaps
Although SAHI preserves important native vegetation and habitat for herpetofauna, it is located in an urban-suburban area and any herpetofauna in the park are influenced by a variety of anthropogenic impacts associated with suburban areas. Regional and global stressors include atmospherically transported pollutants, acid precipitation, and ultraviolet-B radiation (Cook et al. 2010). Habitat fragmentation can limit breeding success and spatial distribution of many herpetofauna. Other localized stressors that could negatively impact the herpetofauna at SAHI include pesticides, fertilizers, road-run off, degraded water quality, habitat degradation, disease such as viral and fungal infections, introduced species, and predation by feral and domestic cats (Dunson et al. 1992, Blaustein 1994, Pechmann and Wilbur 1994, Daszak et al. 2000). Spray
Threats

63
pesticides such as arsenated lead were applied during Theodore Roosevelt’s time to ornamental plantings (Bellavia and Curry 1995), but little is known about the amount, extent, or duration of these applications.
Cook et al. (2010) noted that most aluminum values from the only water quality sampling event (2001) at Heron and Woodpile/Hog Ponds were within the range for aluminum in Northeastern wetlands; however, there was one bottom sample (0.417 mg L-1) from Heron Pond that exceeded the lower LC50 value for northern leopard frog (Rana pipiens) embryos (0.403 mg L-1 at pH 4.8, refer to Freshwater Quality Section for more details). Suggesting there may be potential impacts to amphibians from aluminum inputs at this pond (Cook et al. 2010).
Stressors to Woodpile/Hog Pond, which had the highest abundance of herpetofauna, are storm-water and road-run off. Woodpile/Hog Pond is located adjacent to the visitor parking lot and run-off from the parking lot is diverted into the pond. The configuration of this drainage could be modified to redirect sheet flow from the impermeable parking area into an existing vegetated buffer and away from Woodpile/Hog Pond (Ellsworth 2003). Additionally, the adjacent property owner has repeatedly altered flow into and out of the pond, which negatively effects the pond’s natural hydrology (refer to Freshwater Quality Section for more details).
Eastern box turtles and snakes use the old fields at SAHI. Park management needs to ensure that the mowing of the fields necessary to maintain the cultural landscape is done without impacting or causing mortality to herpetofauna using the field and pasture habitat. The removal of woody vegetation and maintenance of open field habitat to restore the cultural landscape at SAHI (NPS 2007, 2008) has the potential to be beneficial, especially to reptiles, by enhancing basking and nesting habitat, but must be implemented carefully to minimize direct mortality, especially to NY State listed Eastern box turtles (Cook et al. 2010). Specific actions to reduce mortality of herpetofauna related to field mowing include (based on Cook et al. 2010):
• Mow fields during the colder months of the year (November to early April). This would also benefit odonates (dragonflies and damselflies) that use the fields from late-May through September (Refer to Odonata section).
• Reduce or eliminate mowing during mid-April through October when turtles and other herpetofauna are nesting and active.
• In manicured lawn areas, grass should be mowed frequently so it is close-cropped and herpetofauna are readily seen and can be avoided by staff operating mowing machinery.
• If fields must be mowed in the summer, limit mowing to the hottest months (July-August), but do not mow after a rain event, as herpetofauna become active following rain events.
• In taller grass, have a person walk ahead of the mower to detect turtles (and remove them from the mower’s path) and to scare snakes away from the mower.
Alan Ellsworth. National Park Service, Northeast Regional Hydrologist. Sources of Expertise
Bellavia, R. M., and G. W. Curry. 1995. Cultural landscape report for Sagamore Hill National Historic Site, Volume 1: Site history, existing conditions, and analysis. National Park
Literature Cited

64
Service, Olmstead Center for Landscape Preservation, Cultural Landscape Publication No. 8. Boston, Massachusetts.
Blaustein, A. R., P. D. Hoffman, D. G. Hokit, J. M. Kiesecker, S. C. Walls, and J. B.Hays. 1994. UV repair and resistance to solar UV-B in amphibian eggs: a link to population declines? Proceedings of the National Academy of Sciences 91:1791-1795.
Cook, R. P., D. K. Brotherton, and J. L. Behler. 2010. Inventory of amphibians and reptiles at Sagamore Hill National Historic Site. Natural Resource Technical Report NPS/NCBN/NRTR—2010/379. National Park Service, Fort Collins, Colorado.
Daszak, P., L. Berger, A. A. Cunningham, A. D. Hyatt, D. E. Green, and R. Speare. 2000. Emerging infectious diseases and amphibian population declines. Emerging Infectious Diseases 5:735-748.
Dunson, W. A., R. L. Wyman, and E. S. Corbett. 1992. A symposium on amphibian declines and habitat acidification. Journal of Herpetology 26:349-352.
Ellsworth, A. C. 2003. Report for travel to Sagamore Hill National Historic Site on 17 September 2003. Memorandum dated 23 September 2003. National Park Service, Troy, New York.
Kjoss, V. A., and J. A. Litvaitis. 2001. Community structure of snakes in a human-dominated landscape. Biological Conservation 98:285-292.
Morreale, S. J. 1992. The status and population ecology of the diamondback terrapin, Malaclemys terrapin, in New York. Okeanos Ocean Research Foundation, Hampton Bays, New York.
National Park Service (NPS). 2007. Sagamore Hill National Historic Site, Final General Management Plan, Final Environmental Impact Statement. USDI, National Park Service, Boston, Massachusetts.
National Park Service (NPS). 2008. Sagamore Hill National Historic Site, General Management Plan, USDI, National Park Service, Northeast Region, Boston, Massachusetts.
National Park Service (NPS). 2010. NPSpecies database. http://science.nature.nps.gov/im/apps/npspp/ (accessed 6 May 2010).
Noble, G. K. 1927. Distributional list of the reptiles and amphibians of the New York City region. Guide Leaflet Series No.69. American Museum of Natural History, New York.
New York Department of Environmental Conservation (NY DEC). 2011. List of endangered, threatened and special concern fish and wildlife species of New York State. http://www.dec.ny.gov/animals/7494.html (accessed 16 June 2011).
Pechmann, J. H. K., and H. W. Wilbur. 1994. Putting declining amphibian populations in perspective: natural fluctuations and human impacts. Herpetologica 50:65-84.

65
Schlauch, F.C. 1976. City snakes, suburban salamanders. Natural History 85:46-53.
Schlauch, F. C. 1978. New methodologies for measuring species status and their application to the herpetofauna of a suburban region. Engelhardtia 6:30-41.
Schlesinger, M. D. 2007. Rare Animal Status List. New York Natural Heritage Program. Albany, New York. www.nynhp.org (accessed June 21, 2011).
US Fish and Wildlife Service (USFWS). 2006. Long Island Complex National Wildlife Refuge Complex Comprehensive Conservation Plan. September 2006. http://www.fws.gov/northeast/planning/Long%20Island%20Refuges/ccphome.html (accessed 27 October 2011).
Ziminski, S. W. 1970. Notes on the decline of snakes at the Long Island Village of Hempstead and its vicinities. Engelhardtia 3:2.
4.1.6 Mammal Community
Mammals contribute to species richness and diversity and play a major role in ecosystem dynamics as consumers of plant material and invertebrates and as prey for snakes, raptors, and carnivorous mammals. Small mammals may directly influence population levels of insect pests and disease vectors such as gypsy moths and deer ticks, as well as regionally rare raptorial birds (Elkinton et al. 1996, Cook et al. 2004). The abundance and composition of small mammal communities can also affect the structure, species composition, and successional trends of plant communities (Ostfeld 2002). NPS units can serve as a temporary refuge for species such as bats that migrate through these areas, or species with large home ranges (for example, carnivores) that extend beyond park boundaries (Gilbert et al. 2008).
Relevance and Context
The only mammalian survey at SAHI was conducted in 2004 (Gilbert et al. 2008). The 2004 inventory used non-random sample points (due to the small size of the park and the potential overlap of sampling stations) selected from a systematic, random design to maximize distance between stations and number of sample points in as many different habitats (strata) as possible. This resulted in four or fewer stations in each of the habitat strata: maritime dune and beach, fields, salt marsh, scrub-shrub, and woodland habitats (Gilbert et al. 2008).This inventory was funded by the NCBN and data are currently managed and archived by the NCBN.
Data and Methods
There were no established metrics to evaluate the condition of mammal communities in suburban-urban parks. In the absence of these metrics, species richness could be used with the caveat that it is not known how many species would be appropriate for a small urban park such as SAHI. In a study examining mammal communities of suburban and urban parks in Pennsylvania, lower species richness was associated with parks containing manicured habitats and surrounded by human-modified landscapes, whereas higher species richness was observed in parks with mature riparian forests (Mahan and O’Connell 2005). Therefore, lower species
Reference Condition

66
richness and/or a decreasing trend in species richness could be viewed as an undesirable condition.
The goal of the mammal inventory was to document 90% of the terrestrial mammal species (bats were excluded from this inventory) expected to occur within park boundaries (Gilbert et al. 2008). Using best professional judgment, benchmarks based on the percent of species expected to be detected were used to evaluate the mammal community at SAHI. A Good condition was rated as 80% or more of the expected species detected; Significant Concern was rated as 50% or less of the expected species detected, with the Caution rating falling in between these two values. Gilbert et al. (2008) estimated that 55 species (excluding bats) would be expected to occur at SAHI; however, this estimate included many species the where the presence was possible (e.g., elk, coyote, moose), whereas in all likelihood the probability that these species actually exist at SAHI is very low. Therefore, the species list was revised to include only species that had either been observed in the park or documented (either recently or historically) in Nassau County. The revised species list had 30 mammals, excluding bats and marine mammals (Table 14).
Benchmarks for mammal species richness: Good: ≥ 80% of expected species detected (> 24 species detected) Caution: 50% to 80% of expected species detected (15 to 23 species detected) Significant Concern: <50% of expected species detected (< 15 species detected).
Ten species (33% of 30 possible species) were detected during the 2004 mammal inventory (Gilbert et al. 2008). Park staff and historical accounts have documented an additional five species, for a total of 15 mammals (50% of 30 possible species, excluding bats and marine mammals) observed in the park (Table 14). During the 2004 inventory, raccoon (Procyon lotor) was the most frequently detected mammal and was detected in all habitat types. Virginia opossum (Didelphis virginiana) was the second most frequently detected species and was found in areas with trees. The domestic cat (Felis catus) was detected in all habitats except the maritime dune and salt marsh communities (Gilbert et al. 2008), and was included in the estimate of the mammal community as they were prevalent and could be feral cats.
Status of the Resource
Shrews were not well detected and moles were not observed or captured during the inventory, and this may be related to the absence of pitfall traps (for shrews) in the inventory (they were not used due to concern over disturbance of sensitive archaeological resources), or gear bias (moles are usually not captured in small-mammal traps) (Gilbert et al. 2008). Meadow voles (Microtus pennsylvanicus) were likely present in the park’s fields, but the trapping occurred after the fields were mowed, which may have caused the voles to move out of the trapping area (Gilbert et al. 2008). Bats were not surveyed during the inventory. The coyote (Canis latrans) does not currently occur on Long Island but was recently (spring 2010) documented in Manhattan, NY, and it is likely that this species’ range will eventually extend into Long Island (Gilbert et al. 2008, NewsDay 2010).
Overall, Gilbert et al. (2008) noted that the diversity of detected small mammals was low despite the large number traps relative to the size of the park. While species diversity varied among the park’s habitats, there was no geographic area of the park that appeared to be more diverse. In general, more species were detected in the forest; however, the park was dominated by forested

67
landscape and less equipment was used in other habitats, so this was not unexpected (Gilbert et al. 2008).
None of the species detected were considered threatened, endangered, or species of special concern (NY DEC 2011). Some state listed mammals may occur in the park, specifically the Indiana bat (Myotis sodalis), small-footed myotis (Myotis leibii), and New England cottontail (Sylvilagus transitionalis), but additional targeted surveys would be required to understand the distribution of these species (Gilbert et al. 2008). Park staff has recently observed cottontail rabbits at SAHI. These could be Eastern cottontail (S. floridanus) or New England cottontail rabbits. The New England cottontail is a species of special concern in New York (NY DEC 2011). The range of the New England cottontail is much reduced from its former range (Litvaitis et al. 2003), but it does occur from the Hudson River Valley southeast to Long Island (Whitaker and Hamilton 1998). The New England cottontail is closely related to the Eastern cottontail, which is common across Long Island (Connor 1971) and positive species identification is only possible through DNA analysis of tissue, skull, or fecal material (USFWS 2006).
Museum specimens of both species are available for Nassau County (Connor 1971), and it is possible that the New England cottontail occurs at SAHI (Gilbert et al. 2008). Compared to other small parks in the Northeast, SAHI fell below the 25th percentile and had the lowest detection rate (based on data and estimates of probable species from Gilbert et al. 2008) (Figure 17).
Current Condition for mammal community: Caution Condition and Trend
Fifty percent (15 of 30 species) of mammals likely to be present (excluding bats and marine mammals) have been observed in the park falling in the Caution range.
Current Trend for mammals: Unknown There was a lack of historic and/or long-term data to determine trends.
The mammal community data were of good quality, but were collected several years ago and are lacking in some areas such as the detection of moles and shrews. There were many common mammal species (e.g., cottontail rabbit, chipmunk [Tamias striatus], white-tailed deer [Odocoileus virginianus]) that were not detected by the inventory, but were recently observed by park staff, indicating that the current species list for the park could be improved.
Confidence in Condition and Trend
There was only one mammal inventory at SAHI and it was conducted several years ago (in 2004), and some common species that are known to occur in the park were not detected by the inventory. The cottontail rabbits observed by park staff could either be the NY listed New England cottontail or Eastern cottontail and positive identification would be possible by DNA analyses of fecal material or further targeted surveys as suggested by Gilbert et al. (2008).
Data Gaps
Threats to mammal communities include habitat fragmentation, vehicle mortality, and predation by domestic and feral cats.
Threats

68
Table 14. Mammal species observed at SAHI or in proximity (Nassau County) to the park1. Bold type indicates species observed during the mammal inventory.
Scientific Name Common Name Community Type where Detected2 Proximity to Park
Blarina brevicauda Northern short-tailed shrew F, W In park Canis lupus Gray wolf n/a In county Condylura cristata Star-nosed mole n/a In county Delphinus delphis Common dolphin n/a In county Didelphis virginiana Virginia opossum SS, W In park Eptesicus fuscus Big brown bat n/a In county Felis catus Domestic cat F, W In park Glaucomys volans Southern flying squirrel W In park Globicephala melas Long-finned pilot whale n/a In county Kogia breviceps Pygmy sperm whale n/a In county Lasiurus borealis Red bat n/a In county Lepus americanus Snowshoe hare n/a In county Marmota monax Woodchuck n/a In county Microtus pennsylvanicus Meadow vole n/a In county Microtus pinetorum Woodland vole n/a In county Mus musculus House mouse n/a In county Mustela frenata Long-tailed weasel n/a In county Mustela species4 Weasel species n/a In park Mustela vision3 Mink SM In park Myotis lucifugus5 Little brown bat n/a In park Odocoileus virginianus5 White-tailed deer n/a In park Ondatra zibethicus Muskrat n/a In county Peromyscus leucopus White-footed mouse SM, SS, W In park Phocoena phocoena Atlantic harbor porpoise n/a In county Procyon lotor Raccoon B, F, SM, SS, W In park Rattus norvegicus Norway rat n/a In county Scalopus aquaticus Eastern mole n/a In county Sciurus carolinensis Eastern gray squirrel W In park Sorax cinereus Masked shrew n/a In county Sus scrofa European wild boar n/a In county Sylvilagus floridanus Eastern cottontail n/a In county Sylvilagus species5, 6 Cottontail rabbit n/a In park Sylvilagus transitionalis New England cottontail n/a In county Tamias striatus5 Eastern chipmunk n/a In park Unknown mouse or vole Mouse/vole spp. W In park Unknown shrew species Shrew species B In park Vulpes vulpes Red fox SM, W In park Ziphius cavirostris Goose-beaked whale n/a In county Zapus hudsonius Meadow jumping mouse n/a In county 1 Based on data from Gilbert et al. 2008 unless otherwise noted. 2 Community types: B: beach complex, F: field, SM: salt marsh, SS: scrub-shrub, W: woodland area. “n/a”: not available. 3 Theodore Roosevelt killed a mink in the marsh because it was getting into the house and eating the pet guinea pigs (S. Gurney, National Park Service, personal communication, email 20 July 2011). 4 Based on a historic account that SAHI was “…infested with weasels…” (Roosevelt 1959). 5 Observed by park staff (S. Gurney, National Park Service, personal communication, e-mail 21 July 2011). 6 The Eastern cottontail (Sylvilagus floridanus) and New England cottontail (S. transitionalis), a NY listed species are difficult to distinguish and require DNA analysis for correct species identification.

69
Figure 17. Comparison of the expected percentage of detected mammal species for parks surveyed by Gilbert et al. (2008). Percentile lines are shown for reference, numbers inside bars are estimates of probable mammal species for each park (after Gilbert et al. 2008). Park abbreviations: ACAD: Acadia NP, MABI: Marsh-Billings-Rockefeller NHP, MIMA: Minute Man NHP, MORR: Morristown NHP, ROVA: Home of Franklin D. Roosevelt NHS, SAGA: Saint-Gaudens NHS, SAHI: Sagamore Hill NHS, SAIR: Saugus Iron Works NHS, SARA: Saratoga NHP, WEFA: Weir Farm NHS.
Scott Gurney, National Park Service, Sagamore Hill National Historic Site, Park Ranger. Sources of Expertise
Connor, P. F. 1971. The mammals of Long Island, New York. New York State Museum and Science Service, Bulletin 416. Albany, New York.
Literature Cited
Cook, R. P., K. M. Boland, and T. Dolbeare. 2004. Inventory of small mammals at Cape Cod National Seashore with recommendations for long-term monitoring. Long-term Coastal Ecosystem Monitoring Program Cape Cod National Seashore. National Park Service, Wellfleet, Massachusetts.
Elkinton, J. S., W. M. Healy, J. P. Buonaccorsi, G. H. Boettner, A. M. Hazzard, and H. R. Smith. 1996. Interactions among gypsy moths, white-footed mice and acorns. Ecology 77:2332- 2342.
Gilbert A. T., A. F. O’Connell, Jr., E. M. Annand, N. W. Talancy, J. R. Sauer, and J. D. Nichols. 2008. An inventory of terrestrial mammals at National Parks in the Northeast Temperate Network and Sagamore Hill National Historic Site. Scientific Investigations Report 2007-5245. US Geological Survey, Reston, Virginia.
Litvaitis, J. A., B. Johnson, W. Jakubas, and K. Morris. 2003. Distribution and habitat features associated with remnant populations of New England Cottontails in Maine. Canadian Journal of Zoology 81:877–887.

70
Mahan, C. G., and T. J. O’Connell. 2005. Small mammal use of suburban and urban parks in central Pennsylvania. Northeastern Naturalist 12:307-314.
NewsDay. 2010. Expert: Coyotes’ arrival on LI only a matter of time. Article by J. Smith, 25 March 2010. http://www.newsday.com/long-island/expert-coyotes-arrival-on-li-only-a-matter-of-time-1.1831116 (accessed 12 July 2011).
New York Department of Environmental Conservation (NY DEC). 2011. List of endangered, threatened and special concern fish and wildlife species of New York State. http://www.dec.ny.gov/animals/7494.html (accessed 16 June 2011).
Ostfeld, R. S. 2002. Little loggers make a big difference. Natural History 111:64-71.
Roosevelt, E. A. 1959. Day Before Yesterday. Doubleday and Company, Garden City, New York.
U.S. Fish and Wildlife Service (USFWS). 2006. New England cottontail fact sheet. Fish and Wildlife Service, Northeast Region, Hadley, Massachusetts.
http://www.fws.gov/northeast/pdf/necotton.fs.pdf (accessed 9 August 2011).
Whitaker, J. O., and J. Hamilton, Jr. 1998. Mammals of the Eastern United States (3rd ed.). Comstock Publishing, Ithaca, New York.
4.1.7 Odonata (dragonflies and damselflies) Community
Odonates (Class Insecta, Order Odonata - damselflies and dragonflies) are noted indicators of water quality, biodiversity, and ecological change. As predators, dragonflies and damselflies are essential components of the food web, both as nymphs and adults, with an individual capable of consuming thousands of mosquitoes and other insects during the course of its lifetime (Briggs et al. 2010, White et al. 2010a, 2010b). Additionally, it is desirable for the park to know if rare Odonata species occur in the park to guide and improve management for odonate populations. Habitats that support Odonata populations in the park include SAHI’s freshwater ponds (Woodpile/Hog Pond and Heron Pond, a vernal pond), fields, salt marsh, dune, and beach habitat (Briggs et al. 2010).
Relevance and Context
The NCBN funded Briggs et al. (2010) to survey seven sites at SAHI in 2004-2005 for odonates. The survey was based on the potential of the habitat to support Odonata breeding, likely migration routes (e.g., dunes and beaches), and recommendations from park staff. Sites surveyed included fields (four sites), wetland areas (Heron and Woodpile/Hog Pond [referred to as Hog Pond in Briggs et al. 2010]), and the salt marsh/beach complex. All sites were surveyed five times (once per month from May to September) in 2004, but were only visited once in 2005 (in June) due to cold and stormy weather. The diversity of odonate species was quantified for each survey site using species richness (Briggs et al. 2010).
Data and Methods
The USGS has compiled distribution information (last updated in 2003) on odonates nationwide and lists species checklists, by county, for all the states (Kondrateiff 2000). Additionally, the

71
New York Natural Heritage Program surveyed damselflies and dragonflies throughout the state from 2005-2009. This survey relied heavily on citizen scientists that were trained in odonate identification at workshops held throughout the state (White et al. 2010a). The main objective of the NY Damselfly and Dragonfly Survey (NYDDS) was to document the distribution of all odonate species occurring in New York and to build upon previously compiled county distribution (Donnelly 1992, 1999, White et al. 2010a). The NYDDS lists 48 potential odonates for Nassau County with 41 (17 damselflies and 23 dragonflies) confirmed in the county, while the USGS lists an additional six species for the county (Kondrateiff 2000, White et al. 2010a). These efforts have produced a county species list consisting of 57 Odonate species historically present, 47 species recently observed (since 2003), and 22 confirmed species within SAHI. The potential species list for Nassau County from all data sources is 70 species (Table 15).
There were no established metrics to evaluate condition of odonates in an urban-suburban setting. In the absence of these metrics, odonate species richness at the park can be compared to the number of potential species present in Nassau County, with lower species richness and/or a decreasing trend in species richness viewed as an undesirable condition.
Reference Condition
Twenty-two species of odonates were recently recorded at SAHI (Briggs et al. 2010), with 47 recently recorded in Nassau County out of 70 potentially occurring species (Table 15) (Kondrateiff 2000, White et al. 2010a). Therefore, 67% (47 of 70) of species likely present in Nassau County were detected in the county. Assuming that this percentage reflects a reasonable detection probability, then a likely species pool for SAHI would be 31 species of odonates (67% of 47 species), of which 22, or 71%, were recorded. A percentile system was used to set benchmark condition values with a Good condition rated as 80% or more of the occurring or historically occurring species pool (31 species). Significant Concern was rated as a deviation of 50% or more, with the Caution rating falling in between these two values. These ratings were based on the best available data and best professional judgment.
Benchmarks for odonate species richness: Good: > 80% of potential species pool (≥ 24 species detected). Caution: 50% to 80% of potential species pool (15 to 23 species detected). Significant Concern: < 50% of potential species pool (≤ 14 species detected).

72
Table 15. Odonata potentially occurring and present at SAHI.
Scientific Name Common Name1 Potential Species List2
SAHI3
(2004-2005)
Nassau County4
(2005-2009) Damselflies Amphiagrion saucium Eastern red damsel X Xa
Archilestes grandis Great spreadwing X Argia apicalis Blue-fronted dancer (W, G5, S3, U) Xb
Argia fumipennis violacea Variable dancer X Xa,b Argia moesta Powdered dancer Xb Calopteryx maculata Ebony jewelwing X Xa,b Chromagrion conditum Aurora damsel X Xa Enallagma aspersum Azure bluet X Xa Enallagma civile Familiar bluet X X Xa,b Enallagma divagans Turquoise bluet X Xa Enallagma durum Big bluet (W, G5, S3, U) X Xb Enallagma geminatum Skimming bluet Xb Enallagma signatum Orange bluet X Xb Enallagma traviatum Slender bluet Xb Enallagma traviatum traviatum Slender bluet Xb Enallagma vesperum Vesper bluet X Xb Ischnura hastata Citrine forktail (W, G5, S3, U) X X Xa,b Ischnura kellicotti Lilypad forktail (W, G5, S3, U) Xb Ischnura posita Fragile forktail X X Xb Ischnura ramburii Rambur’s forktail (A, G5, S2, U) X Xb Ischnura verticalis Eastern forktail X X Xb Lestes australis Southern spreadwing X Lestes congener Spotted spreadwing X Lestes disjunctus Common spreadwing X Lestes eurinus Amber-winged spreadwing X Lestes forcipatus Sweetflag spreadwing X Lestes inaequalis Elegant spreadwing X Lestes rectangularis Slender spreadwing X X Xa,b Lestes vigilax Swamp spreadwing X Nehalennia gracilis Sphagnum sprite X Nehalennia irene Sedge sprite X Dragonflies Aeshna umbrosa Shadow darner Xb Anax junius Common green darner X X Xa,b Anax longipes Comet darner (A, G5, S2, U) X Arigomphus villosipes Unicorn clubtail X Xa,b Celithemis elisa Calico pennant X Celithemis eponina Halloween pennant X X Xb

73
Table 15. Odonata present and potentially occurring at SAHI (continued).
Scientific Name Common Name1 Potential Species List2
SAHI3
(2004-2005)
Nassau County
(2005-2009) Celithemis fasciata Banded pennant X Celithemis martha Martha’s pennant (W, G4, S3, U) X Dorocordulia lepida Petite emerald X Epiaeschna heros Swamp darner X X Xb Epicordulia princeps Prince baskettail Xb Epitheca cynosura Common baskettail X X Epitheca semiaquea Mantled baskettail (A, G5, SH, U) X Erythemis simplicicollis Eastern pondhawk X X Xb Erythrodiplax berenice Seaside dragonlet X X Xb Gomphus exilis Lancet clubtail X Hagenius brevistylus Dragonhunter X Xa Libellula axelina Bar-winged skimmer X Libellula cyanea Spangled skimmer X Libellula exusta White corporal X Libellula incesta Slaty skimmer X Xb Libellula luctuosa Widow skimmer X X Xb Libellula lydia Common whitetail X X Libellula needhami Needham’s skimmer (A, G5, S2S3, U) X Xb Libellula pulchella Twelve-spotted skimmer X X Xb Libellula semifasciata Painted skimmer X X Xb Libellula vibrans Great blue skimmer X X Xb Pachydiplax longipennis Blue dasher X X Xb Pantala flavescens Wandering glider X X Xb Pantala hymenaea Spot-winged glider X X Xb Perithemis tenera Eastern amberwing X Xb Plathemis lydia Common whitetail Xb Stylurus plagiatus Russet-tipped clubtail X Xa Sympetrum internum Cherry-faced meadowhawk X X Xb Sympetrum obtrusum White-faced meadowhawk Xb Sympetrum rubicundulum Ruby meadowhawk (W, G5, S3, U) X Sympetrum semicinctum Band-winged meadowhawk Xb Tramea carolina Carolina saddlebags X Xb Tramea lacerata Black saddlebags X X Xb Total species 57 22 47 1 Bold type indicates state listed species. NY State listed status codes: A: Active Inventory List of rare and imperiled species. W: watch listed species; G4: Apparently secure rangewide (global) or in New York (state); G5: Demonstrably secure globally, though it may be quite rare; S2: Typically 6 to 20 occurrences, few remaining individuals, acres, or miles of stream, or factors demonstrably making it very vulnerable in New York State; S3:Typically 21 to 100 occurrences, limited acreage, or miles of stream in New York State; SH: Historically known from New York State, but not seen in the past 15 to 20 years; U: Unprotected (Schlesinger 2007).
2 Potential list compiled from Briggs et al. (2010) and White et al. (2010a) 3 Data source: Briggs et al. 2010. a Observed Nassau County during NY Dragonfly and Damselfly Survey in 2005-2009 (White et al. 2010a). b Confirmed record in Nassau County as of 2003 (Kondrateiff 2000).

74
Briggs et al. (2010) identified 22 odonate species (17 dragonflies and five damselflies, 71% of the expected species) across seven survey sites at SAHI from 2004-2005. Only 11 odonate species were previously recorded in Nassau County prior to this inventory (Donnelly 1999). The most abundant odonates at SAHI were common green darner (Anax junius), fragile forktail (Ischnura posita), great blue skimmer (Libellula vibrans), and black saddlebags (Tramea lacerata) (Briggs et al. 2010).
Status of the Resource
SAHI contains good foraging habitat for odonates and potential habitat (fields and dune/beach areas) for migrating odonates; however, it lacks suitable breeding habitat (Briggs et al. 2010). Odonates require permanent or temporary standing water to reproduce successfully. The freshwater ponds at SAHI supported little breeding activity during the 2004-2005 survey, while the salt marsh lacked well-developed salt pannes and supported no odonate breeding. Briggs et al. (2010) surmised that most of the odonates observed in the park were probably breeding in temporary waters in residential areas within flying distance of the park and used SAHI primarily for cover and foraging. At SAHI the fields supported the greatest species richness and abundance of odonates (Figure 18) with un-mowed fields containing tall grasses for perches (> 1m in height) supporting more odonate activity than mowed fields (Briggs et al. 2010). In general, fields support a broad assemblage of prey for odonates, provide cover from predators and shelter when temperatures drop at night, and contain perches where odonates can rest between feedings (Briggs et al. 2010). The fields at SAHI may be prime foraging habitat for adult odonates and may therefore offer one of the best locations within Nassau County for sampling odonate species (Briggs et al. 2010).
One state listed species, the comet darner (Anax longipes), was recorded at SAHI in the field east of the visitor center during the 2004 survey (Briggs et al. 2010). The comet darner is on the active NY state list with a status of G5, S2, U (demonstrably secure, though it may be quite rare in parts of its range, but imperiled in the state because of its rarity [6-20 occurrences], and currently unprotected) (Schlesinger 2007). This was the first recorded sighting of a comet darner in Nassau County (Briggs et al. 2010). Another species observed by Briggs et al. (2010) in the park, the citrine forktail (Ischnura hastata), is on the NY state watch list with a status of G5, S3, U (demonstrably secure, though it may be quite rare in parts of its range, but uncommon or local [typically with 21 to 100 occurrences], and currently unprotected) (Schlesinger 2007).
Current Condition for Odonata: Caution. Condition and Trend
During the most recent inventory,71% (22 species) of the possible odonate species were observed and this community was evaluated as Caution.
Current Trend for Odonata: Unknown There was a lack of historic and/or long-term data to determine trends.
The 2004-2005 inventory provides good baseline data for Odonata in the park; however, there was a lack of trend data for SAHI.
Confidence in Condition and Trend

75
Figure 18. Distribution of odonates observed at SAHI in 2004-2005. Number of individuals observed in each habitat is indicated above bars.
The 2004-2005 inventory established a good baseline species list and identified habitats used by odonates at SAHI; however, the majority of sampling occurred in one year (2004) and only had one survey date in another (2005). Briggs et al. (2010) indicated it was unlikely that any new species would be recorded in 2005 due to a lack of suitable breeding habitat (e.g., little or no standing water in the wetlands). However, given that the NYDDS survey and the USGS have recorded 47 species in Nassau County during this same period (Kondrateiff 2000; White et al. 2010a), it is possible that some species were missed. Given that this survey was conducted over five years ago, a re-survey of odonates in SAHI may be a worthwhile and would provide data to evaluate trends in odonate species richness.
Data Gaps
Mowing of fields at SAHI may reduce the abundance and diversity of odonates as Briggs et al. (2010) noted that the un-mowed fields at SAHI supported the highest diversity of odonates. These authors recommended that surveys be conducted prior to mowing of the fields when the grasses were > 1m in height during late-May to mid-September. Although no specific mowing schedule was given by Briggs et al. (2010), it would seem (based on best professional judgment) that limiting or ceasing mowing of the fields from May through September, so grasses achieve a height > 1m during this period, would benefit the odonate community at SAHI.
Threats
Threats to odonate populations include habitat loss, degradation of breeding and foraging habitats, loss of migration corridors due to residential development and shoreline modifications,

76
and activities that negatively influence freshwater habitats such as water withdrawal, increases in sediment loading, invasive species encroachment, and pesticides and other pollutants (White et al. 2010b).
Briggs, N., E. G. Schneider, J. Sones, and K. Puryear. 2010. Inventory of Odonata (dragonflies and damselflies) at Sagamore Hill National Historic Site. Natural Resources Technical Report NPS/NCBN/NRTR—2010/192. National Park Service. Fort Collins, Colorado.
Literature Cited
Donnelly, T. W. 1992. The Odonata of New York State. Bulletin of American Odonatology 1:1 27.
Donnelly, T. W. 1999. Dragonflies and damselflies of New York. Prepared for the 1999 International Congress of Odonatology Society and 1st Symposium of the Worldwide Dragonfly Association. Binghamton, New York.
Kondratieff, B. C. (coordinator). 2000. Dragonflies and Damselflies (Odonata) of the United States (Version 12DEC2003). Northern Prairie Wildlife Research Center, Jamestown, North Dakota http://www.npwrc.usgs.gov/resource/distr/insects/dfly/index.htm (accessed 21 June 2011).
Schlesinger, M. D. 2007. New York Natural Heritage Program Rare Animal Status List. Albany, New York. www.nynhp.org (accessed June 21, 2011).
White, E. L., J. D. Corser, and M. D. Schlesinger. 2010a. The New York dragonfly and damselfly survey 2005-2009: Distribution and status of the odonates of New York. New York Natural Heritage Program, Albany, New York. ftp://ftp.dec.state.ny.us/dfwmr/nynhp/nydds/nyddspublicreport.pdf (accessed 21 June 2011).
White, E. L., V. Zaremba, and S. Diehl. 2010b. Flying jewels of New York. New York State Conservationist, June 2011. http://www.dec.ny.gov/pubs/74680.html (accessed 23 June 2011).
4.1.8 Salt Marsh Nekton Community
Nekton (an assemblage of free-swimming fish, shrimp, and crabs), are abundant estuarine salt marsh fauna that respond rapidly in response to environmental change, such as changes in salt marsh hydrology (Able et al. 2000, Neckles and Dionne 2000, Neckles et al. 2002, Roman et al. 2002, Raposa et al. 2003). The estuarine nekton community is an integral link among primary producers, consumers, and top predators and is likely to respond to top-down (e.g., removal of predatory fishes) and bottom-up estuarine perturbations (e.g., nutrient loading). Development of the Index of Biotic Integrity (Karr 1981) and the Estuarine Index of Biotic Integrity (Deegan et al. 1997) attests to the value of monitoring nekton to document ecosystem level responses to anthropogenic stress. The foundation of these indices lies in the notion that fishes and crustaceans incorporate and reflect multiple ecosystem processes, and therefore indicate overall
Relevance and Context

77
ecosystem integrity. The NCBN has included salt marsh nekton community monitoring as a vital signs indicator (Stevens et al. 2005, James-Pirri et al. 2012)
The salt marsh nekton community at SAHI was sampled twice, once in 2004 during the pilot implementation of the NCBN salt marsh nekton monitoring protocol (James-Pirri 2005) and again in 2009, the first year of NCBN long-term monitoring (Patenaude and Pooler 2010). Nekton were sampled twice in each sampling period (mid-summer and later summer) at randomly located stations along Eel Creek using 1-m2 throw traps. All nekton were identified and enumerated.
Data and Methods
The condition of the salt marsh nekton community was based on benchmark values put forth by James-Pirri et al. (In Press) and currently used by the NCBN to assess condition of salt marsh nekton communities (James-Pirri et al. 2012; E. Patenaude and P. Pooler, National Park Service, personal communication, 2011). James-Pirri et al. (In Press) examined a regional (Maine to Virginia) salt marsh nekton community dataset, collected using the same protocol as the NPS NCBN long-term monitoring protocol, from National Park Service Units, US Fish and Wildlife National Wildlife Refuges, and other sites. Sites ranged from relatively undisturbed marshes in low population watersheds to severely impacted marshes in urbanized watersheds. James-Pirri et al. (In Press) observed that the nekton community of relatively undisturbed marshes (e.g., reference marshes) in low population watersheds was characterized by a high proportion of resident marsh fish species (e.g., killifish), the presence of transient fish (e.g., nursery species), and a low proportion of Palaemonidae shrimp. As watershed population increased there was a transition from a resident fish-based community to a Palaemonidae shrimp-based community.
Reference Condition
These authors based the condition of the nekton community on a suite of metrics related to nekton life history association with the salt marsh environment as well as the presence of exotic species and species richness. The life history groupings were salt marsh resident fish (e.g., killifish species), resident shrimp (e.g., marsh grass shrimp [family Palaemonidae]), transient fish (e.g., flounders), presence of exotic species, and species richness (James-Pirri et al. In Press). Each metric was evaluated as Good, Moderate, or Poor condition and given a score (1, 3, 5), with the sum of the scores used to estimate the condition of the nekton community (Table 16).
Benchmarks for salt marsh nekton community based on Table 16: Good: Total score 21-25. Caution: Total score 20-12. Significant Concern: Total score 5-11.
In 2004 and 2009, the dominant nekton were resident shrimp (Palaemonetes pugio) that comprised more than 75% of the nekton catch. Resident fish were next most abundant, but comprised less than 20% of the total catch. Transient fish were present, albeit at low percentages. One exotic species, the green crab, a well-established species that is abundant in coastal waters from Maine to Maryland (Benson 2004), was observed in 2004. Total species richness ranged from 7 to 10 species (Table 17). The overall condition score ranked as “poor” (score of 11) in both sampling years. The relative abundance of resident killifish species (e.g., mummichog,
Status of the Resource

78
Fundulus heteroclitus; stripped killifish, F. majalis; sheepshead minnow, Cyprinodon variegatus) and transient fish (e.g., winter flounder, Pseudopleuronectes americanus; Atlantic silverside, Menidia menidia) declined in the most recent sampling event in 2009, while the relative abundance of Palaemonidae shrimp increased (Table 17). Table 16. Salt marsh nekton community condition based on benchmark values presented James-Pirri et al. (In Press). Score for condition rating is in parentheses.
Table 17. Relative abundance (percent of catch) for nekton sampled at the SAHI salt marsh.
Metric1 Good
condition
(5)
Moderate condition
(3)
Poor condition
(1) 20042 20093
Resident fish (% of total catch) >60% 30-60% <30% 19% (1) 10% (1)
Resident shrimp (% of total catch) <15% 15-50% >50% 76% (1) 89% (1)
Transient fish (% of total catch) >15% 15-4% <4% 5% (3) 1% (1)
Exotic species absent - present Yes (1) No (5)
Species richness (number of species present) ≥ 10 6-9 ≤5 10 (5) 7 (3)
Overall Condition (sum of scores) 21-25 20-12 5-11 Poor (11) Poor (11)
1 Condition metrics and benchmarks from James-Pirri et al. (In Press). Do not reproduce without permission from authors. 2 Condition based on data presented in James-Pirri 2005. 3 Condition based on data presented in Patenaude and Pooler 2010.
Scientific name Common name Category1 Percent of
catch 20042 20093
Anguilla rostrata American eel TF 0.1 0.1
Callinectes sapidus Blue crab TC 0.2 - Carcinus maenas Green crab RC, E 0.1 -
Crangon septemspinosa Sevenspine bay shrimp TC 0.2 -
Cyprinodon variegatus Sheepshead minnow RF 0.3 0.1
Fundulus heteroclitus Mummichog RF 12.6 9.2
Fundulus majalis Striped killifish RF 5.7 0.7
Limulus polyphemus Horseshoe crab TC - 0.1 Menidia menidia Atlantic silverside TF 5.0 1.3
Palaemonetes pugio Daggerblade grass shrimp RS 75.6 88.7
Pseudopleuronectes americanus Winter flounder TF 0.2 -
Unknown fish Unknown fish - - 0.1 1 Categories: E: exotic species; RC: resident crustacean; RF: resident fish; RS: resident shrimp; TC: transient crustacean; TF transient fish, based on James-Pirri (In Press). 2 Data source: James-Pirri 2005. 3 Data source: Patenaude and Pooler 2010.

79
Current Condition for salt marsh nekton community: Significant Concern Condition and Trend
The total score for the nekton community rated as poor (score of 11) for both sampling events so the condition of the salt marsh nekton community was rated as Significant Concern.
Current Trend for salt marsh nekton: Stable to Possibly Declining The trend for the salt marsh nekton community was assessed as stable to possibly declining. A rating of Stable was given since the total score for the nekton community remained the same (score of 11) in both sampling events. A rating of Possibly Declining was also given since the relative abundance of Palaemonidae shrimp increased from 2004 to 2009, while resident and transient fish declined over this same time (Table 17).
Confidence in the data used to assess condition and trend for the salt marsh nekton community at SAHI was high.
Confidence in Condition and Trend
There were no data gaps for salt marsh nekton. The NCBN monitors salt marsh nekton at three-year intervals. Sampling was conducted in 2011 but the data were yet summarized for inclusion in this report. The next sampling event will occur in 2014.
Data Gaps
Threats to the estuarine community include eutrophication, degraded water quality, changes in sedimentation, watershed development, wetland loss, overfishing, and other anthropogenic-related issues. Most of these threats are beyond the control of the park.
Threats
Erika Patenaude, National Park Service, Northeast Coastal and Barrier Network, Biologist. Sources of Expertise
Penelope Pooler, National Park Service, Northeast Coastal and Barrier Network, Quantitative Ecologist.
Able, K. W., D. M. Nemerson, P. R. Light, and R. O. Bush. 2000. Initial response of fishes to marsh restoration at a former salt hay farm bordering Delaware Bay. Pages 749-773 in M. P. Weinstein and D. A. Kreeger, editors. Concepts and Controversies in Tidal Marsh Ecology. Kluwer Academic Publishers, The Netherlands.
Literature Cited
Benson, A. 2004. Carcinus maenas. Nonindigenous Aquatic Species Database. Gainesville, Florida. http://nas.er.usgs.gov/queries/FactSheet.aspx?speciesID=190 (accessed 11 March 2010).
Deegan, L. A., J. T. Finn, S. G. Ayvazian, C. A. Ryder-Kieffer, and J. Buonaccorsi. 1997. Development and validation of an estuarine biotic integrity index. Estuaries 20:601-617.
James-Pirri, M. J. 2005. Implementing long-term monitoring of salt marsh communities within the Northeast Coastal and Barrier Network of the National Park Service, Year 2: Monitoring at Boston Harbor Islands National Park Area, Cape Cod National Seashore, Gateway National Recreation Area, and Sagamore Hill National Historic Site. February 2005, Progress

80
Report to National Park Service, Northeast Coastal and Barrier Network, Kingston, Rhode Island.
James-Pirri, M. J., C. T. Roman, E. L. Nicosia. 2012. Monitoring nekton in salt marshes: A protocol for the National Park Service’s long-term monitoring program, Northeast Coastal and Barrier Network. Natural Resource Report NPS/NCBN/NRR—2012/579. National Park Service, Fort Collins, Colorado.
James-Pirri, M. J., J. L. Swanson, C. T. Roman, H. S. Ginsberg, and J. F. Heltshe. In Press. Case Study Chapter: Ecological thresholds for salt marsh nekton and vegetation communities. In G. R. Guntenspergen, editor. Application of Threshold Concepts in Natural Resource Decision Making. Springer, New York.
Karr, J. R. 1981. Assessment of biotic integrity using fish communities. Fisheries 6:21-27.
Neckles, H. A., and M. Dionne (Eds). 2000. Regional standards to identify and evaluate tidal wetland restoration in the Gulf of Maine. Wells National Estuarine Research Reserve Technical Report. Wells, Maine.
Neckles, H. A., M. Dionne, D. M. Burdick, C. T. Roman, R. Buchsbaum, and E. Hutchins. 2002. A monitoring protocol to assess tidal restoration of salt marshes on local and regional scales. Restoration Ecology 10:556-563.
http://www.pwrc.usgs.gov/resshow/neckles/Gpac.pdf (accessed 8 June 2011).
Patenaude, E. L., and P. S. Pooler. 2010. Salt marsh vegetation and nekton community monitoring at Sagamore Hill National Historical Site: 2009 summary report. Natural Resource Data Series NPS/NCBN/NRDS—2010/067. National Park Service, Fort Collins, Colorado.
Raposa, K. B., C. T. Roman, and J. F. Heltshe. 2003. Monitoring nekton as a bioindicator in shallow estuarine habitats. Environmental Monitoring and Assessment 81:239-255.
Roman, C. T., K. B. Raposa, S. C. Adamowicz, M. J. James-Pirri, and J. G. Catena. 2002. Quantifying vegetation and nekton response to tidal restoration of a New England salt marsh. Restoration Ecology 110: 450-460.
Stevens, S., B. Milstead, M. Albert, and G. Entsminger. September 2005. Northeast Coastal and Barrier Network Vital Signs Monitoring Plan. Technical Report NPS/NER/NRTR—2005/025. National Park Service, Boston, Massachusetts.

81
4.2 Physical Integrity 4.2.1 Freshwater Quality and Quantity
The freshwater habitats at SAHI consist of two freshwater ponds: Woodpile/Hog Pond and Heron Pond. Woodpile/Hog Pond, is located adjacent to the visitor parking lot. Heron Pond (sometimes referred to as Lower Lake) is a vernal pond with a relatively short hydroperiod (Cook et al. 2010) and is located in the eastern oak-tulip tree forest (Figure 5). A map of the property made by Roosevelt noted a spring (“Frog Springs”) in the woodlands in the northeast corner of the property, but the spring no longer exists (Bellavia and Curry 1995, NPS 2007). The ponds provide valuable habitat for the park’s amphibians that are almost exclusively found in these two areas. They also provide habitat for odonate (damselfly and dragonfly), avian, and mammal species populations within SAHI (NPS 2007, Briggs et al. 2010) and are sources of water for other wildlife in the park.
Relevance and Context
The only water quality information available for the freshwater resources at SAHI were the NPS baseline water quality inventory conducted in 1998 and NPS unpublished data from 1999-2000 that were recently interpreted for the herpetofauna inventory report (NPS 1998, Cook et al. 2010). Baseline water quality inventory and analysis were conducted by the NPS Water Resources Division for SAHI in 1998 (NPS 1998). The baseline inventory presented results from surface water quality data retrievals from six of the EPA’s national databases. None of the water quality stations were located within the park (refer to Estuarine Water Quality Section for details on station location) Cook et al. (2010), in his herpetofauna report, reported and interpreted unpublished water quality data for SAHI collected by NPS staff in 1999-2000, but did not detail the sample collection methodology.
Data and Methods
The water quality for the freshwater resources at SAHI was only sampled once (NPS unpublished data as cited in Cook et al. 2010) therefore there were no existing reference conditions for water quality within the park.
Reference Condition
New York State water quality criteria for surface waters should be used as reference conditions for any future water quality monitoring at SAHI (NY DEC 2011) (Appendix C Table 1 and 2).
Woodpile/Hog Pond is a kettle pond located adjacent to the northern boundary of the property (Figure 5). During Roosevelt’s time, the pond was a natural feature in close proximity to the working agricultural portion of the property. Theodore Roosevelt Jr. recalled the location as an area with countless turtles and “a noisome bit of stagnant water and black mud into which the pig-sty drained” (Layton and Brown 2010). Woodpile/Hog Pond was in an eutrophic state both recently in 2010 (personal observation) and in 2003 (Ellsworth 2003) (Figure 19). Currently, the pond’s water level is maintained by precipitation and natural drainage. Water run-off from the visitor center parking lot also drains into the pond via a vegetated and stone riprap swale (Layton and Brown 2010). A stream from Woodpile/Hog Pond runs through the adjacent property (currently the Wang property) and empties into Cold Spring Harbor. Construction on the Wang property has caused the stream to fill in, resulting in high water levels in Woodpile/Hog Pond that in turn flood the Wang property (Bellavia and Curry 1995). This same landowner has also
Status of the Resource

82
constructed a water control system/retaining wall at the pond’s outlet (Ellsworth 2003) and reportedly diverted several kettle ponds that connected to Woodpile/Hog Pond (Rafferty 2005). The intended purpose of the water control system and potential effects on the hydrology of Woodpile/Hog Pond are unknown. Further alterations to the pond occurred in February 2012, when the adjacent landowner inserted a pipe into the cement barrier at the downstream portion of the pond and drained the pond. The action was quickly reversed, but the pond was completely drained by this action and the park is relying upon rain events to restore the pond’s waterlevel (P. Rafferty, National Park Service, Northeast Regional Biologist, personal communication, 2012). These alterations were made without any issuance of permits (Rafferty 2005).
The second freshwater body at SAHI is Heron Pond (Figure 5, Figure 20). The pond is a natural feature that was present during Roosevelt’s time. Heron Pond is located in the eastern woodlands approximately 275 m west from the Cold Spring Harbor shoreline. It is a spring-fed vernal pond with a fluctuating water level that is highest during early spring but becomes dry during the hot summer months (Layton and Brown 2010), and becomes completely overgrown with herbaceous vegetation late in the season (Werier 2006). At its highest water level, the pond is 40 X 15 m in size (Werier 2006). In the spring, the vernal pond is an important habitat for amphibians, reptiles, and odonates (Briggs et al. 2010, Cook et al. 2010). The area surrounding the pond supports native understory shrub species (e.g., winter berry [Ilex verticillata]); however, invasive vegetation (e.g., Oriental bittersweet, multiflora rose [Rosa multiflora], vinca [Vinca minor]) are also present near the pond (Werier 2006, Layton and Brown 2010). The 2010-2011 Invasive Species Eradication Contract treated at least 90% of the vinca around Heron Pond (T. Ross, National Park Service, personal communication, 2012).
Based on data from 1999-2000, the freshwater ponds at SAHI are acidic (Cook et al. 2010). On five occasions between November 1999 and September 2000, the pH of Woodpile/Hog Pond ranged from 5.25 to 6.82 (Farris unpublished data cited in Cook et al. 2010). At Heron Pond, which only had water on one date during the sampling period, pH was 5.49 (Farris unpublished data cited in Cook et al. 2010). Aluminum levels of samples collected in March 2001 ranged from 0.199 to 0.417 mg L-1 in Heron Pond and from 0.022 to 0.041 mg L-1 in Woodpile/Hog Pond (Farris unpublished data cited in Cook et al. 2010). Cook et al. (2010) noted that although most aluminum values from water quality sampling in 2001 were within the range for aluminum in Northeastern wetlands, there was one bottom sample (0.417 mg L-1) from Heron Pond that exceeded the lower LC50 value for northern leopard frog (Rana pipiens) embryos (0.403 mg L-1 at pH 4.8).
Current Condition for freshwater water quality and quantity: Unknown Condition and Trend
There were no data on the freshwater resources at SAHI.
Current Trend for freshwater water quality and quantity: Unknown There was a lack of historic and/or long-term data to determine trends.
Data were extremely limited for this resource; therefore, confidence in the available data was low.
Confidence in Condition and Trend

83
Figure 19. Woodpile/Hog Pond as it appeared in 2003 (top, photo courtesy of A. Ellsworth, National Park Service) and in 2010 (bottom, photo courtesy of M.J. James-Pirri).

84
Figure 20. Heron Pond as it appeared in 2010 (photo courtesy of M.J. James-Pirri).
Aside from the one-time water quality sampling in 1999-2000 (these data were never interpreted or reported in a finalized document), there has been no freshwater water quality sampling at SAHI. Water quality and water level/hydroperiod should be monitored at both Woodpile/Hog and Heron Ponds. Cooper and Borjan (2010) recommended analyzing pond sediments for a full suite of metals and organic compounds. These ponds are important habitats and their water quality and water levels can affect other natural resources at SAHI, especially amphibian, reptile, and odonate communities.
Data Gaps
Storm-water and road runoff from the visitor center parking lot are possible stressors to Woodpile/Hog Pond (Bellavia and Curry 1995, NPS 2007, Cooper and Borjan 2010). Configuration of the parking lot drainage could be modified to redirect sheet flow from the impermeable parking area into an existing vegetated buffer and away from Woodpile/Hog Pond (Ellsworth 2003). Construction on the Wang property has altered the pond’s drainage pattern, causing high water in the pond that threatens both the Wang property and Woodpile/Hog Pond (Bellavia and Curry 1995). In early 2012, the same landowner completely drained the pond, and the park is currently relying on natural rain events to restore the pond’s water level. The recent Cultural Landscape Report (Layton and Brown 2010) suggested removing the large yew tree (Taxus species, an ornamental, non-historic plant) from the south side of the Woodpile/Hog Pond as it blocks the view shed of the pond from the visitor center parking lot. There are several septic
Threats

85
systems on park property that could be a source of contaminants (e.g., nitrogen, phosphorous, trace metals, pharmaceuticals, personal care products, organic compounds) to ground and surface runoff water that may impact both freshwater ponds (Cooper and Borjan 2010). Any chemicals applied to manicured (e.g., herbicides and pesticides) and asphalt areas would travel downslope to the freshwater ponds (Cooper and Borjan 2010).
There may be potential impacts to amphibians from aluminum inputs at Heron Pond. Invasive vegetation surrounding the pond (e.g., multiflora rose, Oriental bittersweet, and vinca) threatens native plant diversity and potentially disrupts natural hydrologic function. The park’s 2010-2011 Invasive Species Eradication Contract had made great progress by removing the vinca from around Heron Pond, listed as a high priority action by the Cultural Landscape Report, and the park should continue to work with Northeast Exotic Plant Management Team on specific removal treatments for invasive vegetation (Layton and Brown 2010)
Alan Ellsworth. National Park Service, Northeast Regional Hydrologist. Sources of Expertise
Patricia Rafferty, National Park Service, Northeast Regional Biologist. Thomas Ross, National Park Service, Sagamore National Historic Site, Superintendent.
Bellavia, R. M., and G. W. Curry. 1995. Cultural landscape report for Sagamore Hill National Historic Site, Volume 1: Site history, existing conditions, and analysis. National Park Service, Olmstead Center for Landscape Preservation, Cultural Landscape Publication No. 8. Boston, Massachusetts.
Literature Cited
Briggs, N., E. G. Schneider, J. Sones, and K. Puryear. 2010. Inventory of Odonata (dragonflies and damselflies) at Sagamore Hill National Historic Site. Natural Resources Technical Report NPS/NCBN/NRTR—2010/192. National Park Service, Fort Collins, Colorado.
Cook, R. P., D. K. Brotherton, and J. L. Behler. 2010. Inventory of amphibians and reptiles at Sagamore Hill National Historic Site. Natural Resource Technical Report NPS/NCBN/NRTR—2010/379. National Park Service, Fort Collins, Colorado.
Cooper, K. R., and M. Borjan. 2010. Northeast Coastal and Barrier Network assessment of contaminant threats: Sagamore Hill National Park. Natural Resource Technical Report NPS/NCBN/NRTR—2010/344. National Park Service, Fort Collins, Colorado.
Ellsworth, A. C. 2003. Report for travel to Sagamore Hill National Historic Site on 17 September 2003. Memorandum dated 23 September 2003. National Park Service, Troy, New York.
Layton, T. W., and M. C. Brown. 2010. Cultural landscape report for Sagamore Hill National Historic Site, Oyster Bay, NY, Volume 1I: Treatment. Olmstead Center for Landscape Preservation. National Park Service, Boston, Massachusetts.
National Park Service (NPS). 1998. Baseline water quality data inventory and analysis Sagamore Hill National Historic Site. Water Resources Division. Technical Report NPS/NRWRD/NRTR—98/190. National Park Service, Fort Collins, Colorado.

86
National Park Service (NPS). 2007. Sagamore Hill National Historic Site Final General Management Plan Final Environmental Impact Statement. National Park Service, Boston, Massachusetts.
New York Department of Environmental Conservation (NY DEC). 2011. Regulations, Chapter X- Division of Water, Part 703: Surface water and groundwater quality standards and groundwater effluent limitations. http://www.dec.ny.gov/regs/4590.html (accessed 10 August 2011).
Rafferty, P. 2005. An overview of coastal resources at Sagamore Hill National Historic Site. Report submitted in support of the General Management Plan. January 31, 2005. National Park Service, Oyster Bay, New York.
Werier, D. 2006. Sagamore Hill National Historic Site invasive non-native plant management plan. Technical Report NPS/NER/NRTR—2006/045. National Park Service, Boston, Massachusetts.
4.2.2 Estuarine Water Quality
The estuarine water resources at SAHI are the tidal Eel Creek that flows through the salt marsh and the adjacent waters of Cold Spring Harbor. Cold Spring Harbor is open to Long Island Sound and is influenced by tidal inflows and water quality within the Sound. Although the SAHI boundary ends at the mean high water (waters below mean high water are under the jurisdiction of the USFWS Oyster Bay NWR), the water quality of the estuary influences park natural resources such as the salt marsh and its associated flora and fauna. The park coordinates with Oyster Bay NWR to ensure that park policies complement efforts undertaken by the wildlife refuge and works with the USFWS to explore opportunities for cooperative resource management and interpretative planning (NPS 2007). Maintenance of the salt marsh/tidal creek/dune/beach complex at SAHI is included as one of the critical management areas identified in the park’s General Management Plan (NPS 2007).
Relevance and Context
Baseline water quality inventory and analysis were conducted by the NPS Water Resources Division for SAHI in 1998 (NPS 1998). The baseline inventory presented results from surface water quality data retrievals from six of the EPA’s national databases. Most of baseline water quality data were from one-time or intensive single-year sampling efforts, with only four stations, all of which were outside of the park’s boundary, yielding long-term records. There were no stations located within the park’s boundary (Figure 21).
Data and Methods
Friends of the Bay (FOB), a local non-profit organization dedicated to the protection of Oyster Bay/Cold Spring Harbor estuary and the surrounding watershed, has a volunteer water quality monitoring program, in cooperation with the USFWS, EPA, NY DEC, local governments, and volunteer monitoring groups around Long Island Sound. They conducted weekly water quality monitoring from April through October at 19 stations (four of which are in Cold Spring Harbor, FB 1-FB 4, Figure 22) since 1999 (FOB 2007, 2009). Water quality parameters monitored by trained volunteers include dissolved oxygen, salinity, water temperature, water clarity, coliform

87
bacteria, and nitrogen. The most recent summary of monitoring data from the FOB was in 2006 (FOB 2007). The FOB data were not summarized herein as the New York State and US EPA water quality assessments provide more complete temporal coverage (1998 to 2010).
To fulfill the requirements of the Federal Clean Water Act (CWA) the state of New York provides regular assessments of water quality to the EPA. Section 305(b) of the CWA outlines the process whereby waters are evaluated for their ability to support each state’s designated use water quality standards. Designated uses include aquatic life support, fish and shellfish consumption, drinking water supply, and primary (swimming) and secondary (boating) contact recreation. Waterbodies that are assessed for these designated uses are listed as 305(b) assessed waters. Section 303(d) of the CWA requires states to identify those waterbodies that do not meet or are not expected to meet surface water quality standards and to schedule them for development of a Total Maximum Daily Load (TMDL). The goal of a TMDL is to bring the waterbody into compliance with water quality standards by establishing the maximum amount of a pollutant that can be present while still meeting public health water quality standards and maintaining the designated beneficial uses for those waters. Waters awaiting the development of a TMDL are listed as 303(d) waters. Once a TMDL is completed then the waterbody is removed, or delisted, from the 303(d) list.
In New York, waters in drainage basins are monitored on a rotating assessment schedule with each basin monitored every three years. The Long Island basin was monitored in 1998-2000, 2003-2005, and most recently in 2008-2010 (NY DEC 2011a). The waterbody of interest for the park is Cold Spring Harbor and its tidal tributaries, waterbody segment #1702-0018 (NY DEC 2011a). The state of New York assesses waterbodies and assigns them to one of five Water Quality Assessment Categories based on the degree of use support, severity of impact and/or impairment, and the level of documentation. The Water Quality Assessment Categories are (NY DEC 2009, 2011a):
Impaired Waters: Waterbodies with documented water quality problems that have resulted in precluded or impaired uses and, in most cases, a have a known level of documentation. The state must consider the development of a TMDL for impaired waters.
Waters with Minor Impacts: Waterbodies where less severe water quality impacts are apparent, but uses are considered fully supported. These waters correspond to waters listed as having stressed uses and a known or suspected level of documentation.
Threatened Waters: Waterbodies for which uses are not restricted and no water quality problems exist, but where data suggest declining water quality trends or specific land use or other changes in the surrounding watershed are known to be threatening water quality.
Waters with Impacts Needing Verification: Waterbodies that are thought to have water quality problems or impacts, but for which there is not sufficient or definitive documentation. Such waterbodies require additional monitoring to determine whether uses are restricted or threatened.
Waters Having No Known Impact: Waterbodies where monitoring data and information indicate that there are no use restrictions or other water quality impacts, threats or issues.
Unassessed Waters: Waterbodies where there is no available water quality information to assess the support of designated uses.

88
Figure 21. Water quality sampling stations inventoried for the NPS Baseline Water Quality Inventory and Analysis (map excerpted from NPS 1998). Circles indicate the four stations with long-term data.

89
Figure 22. Water quality sampling stations monitored by Friends of the Bay (map excerpted from FOB 2007).
The reference conditions for estuarine water quality are New York State and EPA’s national recommended surface water quality standards (US EPA 2011b, NY DEC 2011b) (Appendix C Table 1 and 2).
Reference Condition
The NPS baseline water quality report conducted in 1998 (NPS 1998) summarized water quality data for 14 basic Level I parameters: alkalinity, pH, conductivity, dissolved oxygen, rapid bioassessment baseline (e.g., fish, macroinvertebrates), temperature, flow, toxic elements, clarity/turbidity, nitrate/nitrogen, phosphate, phosphorus, chlorophyll, sulfates, and bacteria). Ten water quality parameters exceeded screening criteria within the study area that included both Cold Spring Harbor and Oyster Bay. Dissolved oxygen, pH, chloride, and copper exceeded their respective screening criteria at least once in the study area for the protection of freshwater aquatic life. Copper, silver, zinc, and pH exceeded their respective criteria for the protection of marine aquatic life. Chloride, sulfate, and nitrate exceeded their respective criteria for drinking water. Fecal-indicator bacteria concentrations (fecal-coliform and total coliform) exceed the NPS Water Resources Division screening limits for freshwater and marine bathing (NPS 1998).
Status of the Resource

90
The state has conducted water quality assessments for Cold Spring Harbor and its tidal tributaries, including Eel Creek (waterbody #1702-0018) since 1998 (Table 18). This waterbody is a designated SA waterbody (a waterbody suitable for shellfishing for market purposes, primary and secondary contact recreation, and fishing). The waters are also suitable for fish propagation and survival (FOB 2009). Cold Spring Harbor and its tidal tributaries were listed on the states’ 303(d) Impaired Waters list from 1998 to 2006 for pathogens (e.g., fecal coliform) related to urban and storm runoff (all years), and for fish consumption related to polychlorinated biphenyls (PCBs) in migratory species (in 2002 and 2004) (FOB 2007, 2009, NY DEC 2007, 2008, 2009, 2010, 2011a, US EPA 2011a,) (Table 18). Cold Spring Harbor was removed from the 303(d) list in 2006 for PCB contamination in migratory fish species because the advisory was largely precautionary due to the susceptibility to contamination and wide migratory range of these species (NY DEC 2007). In 2008, the waterbody was also removed from the 303(d) list for pathogens because Cold Spring Harbor was included the New York Shellfish Pathogen TMDL that was completed in 2007 (Batelle 2007, FOB 2009, NY DEC 2009). Currently, this waterbody is assessed by the state as impaired for the designated uses of aquatic life, fishing, primary and secondary contact recreation, shellfish, and other (NY DEC 2011a) (Table 18). This area was declared a federal No-Discharge Zone for vessel sewage in 2008. The designation prohibits the discharge of sewage (whether treated or untreated) from vessels, providing an additional level of protection to address water quality issues associated with sewage contamination in marine waters (FOB 2009).
In the most recent (2010) water quality assessment of Cold Spring Harbor and its tidal tributaries, public bathing, recreation, and shellfishing were assessed as impaired due to pathogen contamination that has resulted in restrictions on shellfishing for consumption and periodic closures of bathing beaches for recreation (NY DEC 2011a) (Table 18). The primary sources of pathogens were urban and storm runoff, although various other sources (boat discharge, waterfowl) may contribute. Aquatic life in the harbor experiences minor impacts due to periodic low dissolved oxygen events, a result of elevated nitrogen loadings. Nutrient sources include municipal waste water discharges, urban storm runoff and other non-point sources including atmospheric deposition and tidal exchange with Long Island Sound and Connecticut waters (NY DEC 2011a) (Table 18). Fish consumption also experiences minor impacts due to precautionary health advisories that limit the consumption of certain migratory species (American eel [Anguilla rostrata], bluefish [Pomatomus saltatrix], striped bass [Morone saxatilis], weakfish [Cynoscion regalis]) due to elevated PCB levels, a result of their migratory behavior rather than contamination in this specific waterbody (NY DEC 2011a).
Current Condition for estuarine water quality: Caution Condition and Trend
The estuarine waters adjacent to SAHI have been listed as impaired for several designated uses for more than a decade.
Current Trend for estuarine water quality and quantity: Stable to Improving Trend The estuarine water quality has been impaired by pathogens for over a decade; however, steps are being taken (e.g., recently implemented TMDL; No-Discharge Zone for vessels) to improve water quality.
Confidence in Condition and Trend

91
The data were of good quality and adhere to national standards for quality control and assurance, and the confidence in the current condition and trend were high.
There were no data gaps concerning this resource. The estuarine waters adjacent to SAHI are regularly monitored by both the State of New York and Friends of the Bay, a local non-profit group.
Data Gaps
Cooper and Borjan (2010) recommended a one-time analysis of the sediments under the walkway that crosses the marsh for the presence of copper, chromium, and arsenic. They also suggested analyzing salt marsh sediment samples below the high tide mark for contaminants.
Factors that contribute to and control estuarine water quality are largely beyond the control of the park. Changes in land use within park boundaries and on adjacent properties also influence estuarine water quality in the park (Rafferty 2005). The lands surrounding Cold Spring Harbor and the beach/marsh/creek/tidal creek complex of SAHI are down-slope of the surrounding higher elevation lands. Thus, stormwater, groundwater, and surface water runoff drain into these areas and they may act as a sink for terrestrial contaminants (FOB 2009, Cooper and Borjan 2010). The park’s septic systems could also be a source of contaminants (e.g., nitrogen, phosphorous, trace metals, pharmaceuticals, personal care products, organic compounds) to estuarine water quality (Cooper and Borjan 2010). Any chemicals applied to grass and asphalt areas would travel downslope to the salt marsh complex and Cold Spring Harbor. The walkway leading down to the beach was constructed using wood treated with chromium, copper, and arsenic and could be a source metal contaminants. The marina to the south of the salt marsh/tidal creek complex could be a source of other pollutants from gasoline-powered watercraft that are docked in the marina (Cooper and Borjan 2010).
Threats

92
Table 18. Summary of estuarine water quality for Cold Spring Harbor and its tidal tributaries (NY #1702-0018).
Listing Cycle Listing type Cause(s) of Impairment Impairment Source(s) Action
19981 Impaired waterbody, 303(d) listed,
designated uses not assessed
Pathogens Urban and storm runoff TMDL needed.
20021 Impaired waterbody, 303(d) listed, designated uses not assessed
Pathogens, PCBs in migratory fish
Urban and storm runoff TMDL needed.
20041 Impaired waterbody, 303(d) listed, designated uses not assessed
Pathogens, PCBs in migratory fish, toxic organics
Urban and storm runoff TMDL needed.
20061,2 Impaired waterbody, 303(d) listed, designated uses not assessed
Pathogens Urban and storm runoff Removed from 303(d) list for PCBs because advisory was largely precautionary. TMDL needed for pathogens.
20081,3 Impaired waterbody for Designated Uses: Aquatic life, Fishing, Primary and Secondary Contact Recreation, Shellfish, and Other
Pathogens Urban and storm runoff, municipal discharge/sewage
Removed from 303(d) list for pathogens because the TMDL was completed in 2007.4
20101,5 Impaired waterbody for Designated Uses: Aquatic life, Fishing, Primary and Secondary Contact Recreation, Shellfish, and Other
Pathogens, low dissolved oxygen, nutrients
Urban and storm runoff, municipal discharge/sewage
TMDL currently implemented.
Data sources: 1 US EPA 2011a, 2NY DEC 2007, 3NY DEC 2008, 4Batelle 2007, 5NY DEC 2011a

93
Battelle. 2007. Final report for shellfish pathogen TMDLs for 27 303(d)-listed Waters. Duxbury, Massachusetts.
Literature Cited
Cooper, K. R., and M. Borjan. 2010. Northeast Coastal and Barrier Network assessment of contaminant threats: Sagamore Hill National Park. Natural Resource Technical Report NPS/NCBN/NRTR—2010/344. National Park Service, Fort Collins, Colorado.
Friends of the Bay (FOB). 2007. 2006 Annual Water Quality Report, Open Waterbody and Water Quality Monitoring Program. Oyster Bay, New York. www.friendsofthebay.org (accessed 21 November 2011).
Friends of the Bay (FOB). 2009. State of the Watershed Report Oyster Bay/Cold Spring Harbor. Draft report. Oyster Bay, New York. http://friendsofthebay.org/pdfs/StateoftheWatershed110909.pdf (accessed 21 November 2011).
National Park Service (NPS). 1998. Baseline water quality data inventory and analysis Sagamore Hill National Historic Site. Water Resources Division. Technical Report NPS/NRWRD/NRTR—98/190. National Park Service, Fort Collins, Colorado.
National Park Service (NPS). 2007. Sagamore Hill National Historic Site. Final General Management Plan Final Environmental Impact Statement. Department of the Interior, National Park Service, Northeast Region, Boston, Massachusetts.
New York Department of Environmental Conservation (NY DEC). 2007. 2006 Section 303(d) List of Impaired Waters requiring a TMDL/other strategy. Albany, New York. http://www.dec.ny.gov/docs/water_pdf/303dlist06.pdf (accessed 13 November 2011).
New York Department of Environmental Conservation (NY DEC). 2008. New York State Water Quality 2008. Bureau of Watershed Assessment and Management, Division of Water. Albany, New York. http://www.dec.ny.gov/chemical/23837.html (accessed 13 November 2011).
New York Department of Environmental Conservation (NY DEC). 2009. Consolidated assessment and listing methodology. Waterbody Inventory/Priority Waterbodies List. Albany, New York. http://www.dec.ny.gov/docs/water_pdf/asmtmeth09.pdf (accessed 13 November 2011).
New York Department of Environmental Conservation (NY DEC). 2010. 2010 Section 303(d) List of Impaired Waters requiring a TMDL/other strategy. Albany, New York. http://www.dec.ny.gov/docs/water_pdf/303dlistfinal10.pdf (accessed 13 November 2011).
New York Department of Environmental Conservation (NY DEC). 2011a. The Atlantic Ocean/Long Island Basin Waterbody Inventory and Priority Waterbodies List. Volume 2: Nassau and Suffolk County Waters. Bureau of Watershed Assessment and Management,

94
Division of Water. Albany, New York. http://www.dec.ny.gov/chemical/36748.html (accessed 13 November 2011).
New York Department of Environmental Conservation (NY DEC). 2011b. Regulations, Chapter X- Division of Water, Part 703: Surface water and groundwater quality standards and groundwater effluent limitations. Albany, New York. http://www.dec.ny.gov/regs/4590.html (accessed 10 August 2011).
US Environmental Protection Agency (US EPA). 2011a. National Assessment Database. http://www.epa.gov/waters/305b/index.html (accessed 13 November 2011).
US Environmental Protection Agency (US EPA). 2011b. Water Quality Criteria. http://water.epa.gov/scitech/swguidance/standards/criteria/index.cfm (accessed 21 November 2011).
4.2.3 Geologic and Coastal Resources
The coastal resources at SAHI include a series of barrier spit/islands moving from north to south along the shoreline, gravel and pebble ridges, and erosional embayments (Thornberry-Ehrlich 2011). Changes in shoreline position interact with many other elements of the ocean beach-dune system and thus both drive and respond to a variety of natural and cultural factors at various temporal and spatial scales (Psuty et al. 2010). The coastline at SAHI is constantly changing due to shoreline geomorphological evolution, sea level change, and sediment supply. In a recent NPS Geologic Resources Division scoping summary report, coastal processes and management were identified as the most significant issues for the park. Coastline development both north and south of the SAHI shoreline can affect the shoreline of the park. The public also lands boats on the park’s beach and this can degrade the coastal area. Affluent neighbors adjacent to the park affect SAHI’s coastal resources by dredging, erecting pilings, and planting invasive vegetation (e.g., bamboo) in the coastal area (NPS 2012). It was noted in the scoping summary that the entire coast and the associated salt marsh/tidal creek/dune/beach complex of SAHI could change in one storm event (Thornberry-Ehrlich 2011). Maintenance of this system was included as one of the critical management areas identified in the park’s General Management Plan (NPS 2007). Aside from the salt marsh complex, that provides important wetland habitat for the park’s flora and fauna, the coastal beach and sandy slopes of the tidal inlet provide nesting habitat for horseshoe crabs while the coarse gravel beach ridge is favored by nesting diamondback terrapins. Other geologic resource issues for SAHI include slope processes, fluvial and lacustrine features, seismicity, disturbed lands, and climate change impacts (Thornberry-Ehrlich 2011).
Relevance and Context
The NPS Geologic Resources Division is currently preparing a Geologic Resources Inventory (GRI) report for the SAHI. The recent scoping survey identified geologic mapping needs, geologic processes and features, resource management issues, and monitoring and research needs for SAHI (Thornberry-Ehrlich 2011, NPS 2012). A digital map of the geologic resources for SAHI was derived from geologic map of the Huntington-Smithtown area of Suffolk County, NY (NPS 2012) (Figure 23). The forthcoming GRI report will provide information and map products for the geologic resources of SAHI, but as of this writing, this report was not available.
Data and Methods

95
LiDAR (Light Detection and Ranging)-derived topographic maps of SAHI were produced in 2007 as part of a collaborative effort between the USGS, NCBN, and National Aeronautics and Space Administration (NASA) using Experimental Airborne Advanced Research LiDAR (EAARL) (Brock et al. 2007, USGS 2011). EAARL sensors are sensitive enough to measure subaerial and submarine topography. These techniques are used to survey coral reefs and barrier islands for geomorphic change studies, habitat mapping, ecological monitoring, change detection, and event assessment (USGS 2011). This project created bare earth topography for the park (Figure 24). The NCBN is currently monitoring shoreline change at SAHI. Data on shoreline position were collected by traversing the mean high-tide swash line with a GPS unit capable of sub-meter accuracy (Psuty et al. 2010). Shoreline data collection was recently started (in 2009) and will continue every spring and fall by the NCBN following established monitoring protocols (Psuty et al. 2010). The 2009 shoreline data were overlaid on the EAARL topography to depict the 2007 and 2009 shorelines (Figure 25, 2009 data courtesy of D. Skidds, National Park Service, personal communication, e-mail 1 November 2011).
Historic (Bellavia and Curry 1995) and recent aerial imagery (GoogleEarth) were available for the region and visual comparison of this imagery was used to describe past changes of the SAHI shoreline.
The NCBN has not yet established reference benchmarks for shoreline extent at SAHI; however, it is assumed that the reference condition will be based on the best available historic shoreline extent, possibly the 1957 aerial imagery as depicted in Bellavia and Curry (1995) (Figure 26). Since geo-rectifying the 1957 imagery for comparison to recent imagery and/or GIS data was beyond the scope of NRCA, a visual comparison of the shoreline was used to describe the condition of the SAHI coastal resources.
Reference Condition

96
Figure 23. Geological Resources Inventory map for SAHI (NPS 2012).

97
Figure 24. 2007 EAARL topography (contour lines in white) for SAHI (data from Brock et al. 2007, USGS 2011).

98
Figure 25. Shoreline mapped in 2009 (red line) overlaid 2007 EAARL topography (contour lines in white) showing the shoreline profiles for both years. LiDAR data from Brock et al. (2007), USGS (2011).

99
The park sits north of the maximum extent of Pleistocene glacial advance into New York. The coastal areas of the park contain very young, Holocene sands and gravels, derived primarily from the glacial deposits being eroded at the head of Cove Neck and transported down the eastern shore of the neck by longshore drift (NPS 2012). The GRI digital map of SAHI indicates that, geologically, the majority of the park is composed of Hill Harbor ground moraine and retreated glacial outwash deposits (Pleistocene) (NPS 2012). This till is composed of unassorted clay, sand, and boulders deposited by glacial ice. At the eastern edge of the park bordering Cold Spring Harbor there are geologically recent marsh deposits composed clay, silt, sand, and organic matter (NPS 2012) (Figure 23).
Status of the Resource
The shoreline to the south of SAHI has been highly modified over the past several decades. Examination of historic aerial imagery (Bellavia and Curry 1995) indicates that a boat basin was constructed just to the south of SAHI between 1957 and 1962 (Figure 26). The boat basin was built prior to the establishment of Oyster Bay NWR and is considered grandfathered in regards to shoreline modifying structures (Rafferty 2005). Construction of the boat basin created a 33.5 m wide access channel to Cold Spring Harbor, and a 33.5 m by 32 m marina with bulk headed boat slips (Rafferty 2005). Rafferty (2005) concluded that the course of Eel Creek was diverted and truncated when the boat basin was constructed based on a comparison of aerial photographs taken from 1957-2010 (Figure 26). This decreased the overall length of the tidal creek and diverted its southern extent and mouth to a more northward position. The sand and channel to the marina naturally migrate southward and impinge on the marina entrance and the landowner has frequently dredged the channel (Thornberry-Ehrlich 2011). Approximately five dredging events occurred from the time of construction to the late 1960s, and six events happened in the 1970s to late 1980s (Rafferty 2005). In 1990, the NY DEC issued a permit and three dredging events were conducted under that permit with the spoil material placed on the adjacent open beach (Rafferty 2005). The most recent dredging occurred in 2002. During this event, the owner of the marina violated permit conditions by placing a substantial amount of spoil below mean high water on Oyster Bay NWR lands, this violation resulted in a settlement that included a monetary fine and restoration of refuge lands (Rafferty 2005).
The only noticeable anthropogenic modification to the shoreline north of SAHI was a boat dock that was present in the 1957 aerial imagery and still persists today (Figure 26). Since the dock was present prior to the establishment of Oyster Bay NWR, it is considered grandfathered by the USFWS (Rafferty 2005). Littoral drift is primarily from north to south along the western edge of Cold Spring Harbor and the lack of development to this northern shore is particularly important for the protection of the beach and salt marsh at SAHI (Rafferty 2005). The landowner to the north has increased the residential buildings and landscaping of his property over time (S. Gurney, National Park Service, personal communication, 2010, Figure 26). The impact of the upland development on the coastal and other natural resources at SAHI is unknown.

100
Figure 26. Historic and current shoreline at SAHI. Upper arrows indicate dock to the north of SAHI and lower arrows indicate the boat basin to the south. 1957 and 1962 imagery excerpted from Bellavia and Curry (1995). 1994 and 2010 imagery from GoogleEarth.

Horseshoe crabs spawn on the coastal beach and along sand shores that border Eel Creek (personal observation). Horseshoe crab nests and eggs were present in 2011 and juvenile horseshoe crabs were observed in Eel Creek (personal observation). A few (five) horseshoe crabs were tagged at the SAHI beach in 2011 as part of a research project surveying horseshoe crabs in Mid-Atlantic coastal parks (James-Pirri and Rafferty 2010). One tagged crab was found dead on the SAHI beach two weeks after tagging and another was reported alive 39 days later across Long Island Sound in Stratford, CT (James-Pirri unpublished data). In 2012, horseshoe crab spawning surveys, horseshoe crab tagging, and sediment coring to evaluate horseshoe crab egg densities were conducted at SAHI in conjunction with this multi-park proposal (data were not yet summarized as of August 2012) (James-Pirri and Rafferty 2010). It is anticipated that volunteer-based spawning surveys will continue at SAHI in the future.
Current Condition Geologic and Coastal Resources- shoreline extent: Unknown to Caution Condition and Trend
The current condition for the extent of the SAHI shoreline was rated as Unknown since the NCBN has yet to interpret recent data and/or historical imagery. A rating of Caution was also given as there has been and continues to be development that can influence the shoreline both to the north and south of SAHI.
Current Trend Geologic and Coastal Resources: Unknown Shoreline change monitoring was recently initiated at SAHI and as of this writing change analysis for the park’s shoreline was not yet completed.
It is anticipated that the data collected for shoreline change will be of good quality; however, these data have not been analyzed or interpreted.
Confidence in Condition and Trend
The NCBN is initiating monitoring of the shoreline and it is anticipated that the Network will complete a full analysis of historic and current shoreline extent.
Data Gaps
Shoreline development on adjoining properties (e.g., currently the Wang property to the north and the Yampol property to the south) threatens beach and shoreline resources at SAHI. Coastal development alters natural shoreline process such as littoral drift, sedimentation rates, and hydrology that in turn can negatively affect the salt marsh/tidal creek/dune/beach complex at SAHI (NPS 2007). Fortunately, Oyster Bay NWR, which owns the intertidal and subtidal property surrounding SAHI, prohibits new development. Additionally, any activity that affects the submerged resources of the Refuge requires USFWS Special Use Permit (Rafferty 2005, USFWS 2006). Therefore, the presence of Oyster Bay NWR adjacent and surrounding SAHI greatly reduces the threat of anthropogenic alteration of the shoreline.
Threats
Unauthorized recreational use is also a threat to the coastal resources at SAHI. The public often land boats on park’s beach and degrade the shoreline and coastal area (Thornberry-Ehrlich 2011).

102
Other threats to coastal resources include sea-level rise and water quality. Current estimates of relative sea-level rise near SAHI (Port Jefferson, NY) are 2.44 mm yr-1 or 24.4 cm per century (NOAA 2011). To ensure the persistence of the SAHI marsh, the elevation of the marsh surface must increase at a rate equal or greater to sea level rise through processes such as sediment accretion or lateral retreat to the upland. Since the SAHI salt marsh is adjacent to an upland slope there is little opportunity for lateral shoreline retreat.
Dennis Skidds, National Park Service, Northeast Coastal and Barrier Network, Data Manager Sources of Expertise
Scott Gurney, National Park Service, Sagamore National Historic Site, Ranger.
Bellavia, R. M., and G. W. Curry. 1995. Cultural landscape report for Sagamore Hill National Historic Site, Volume 1: Site history, existing conditions, and analysis. Olmstead Center for Landscape Preservation, Cultural Landscape Publication No. 8. National Park Service, Boston, Massachusetts.
Literature Cited
Brock, J. C., C. W. Wright, A. Nayegandhi, M. Patterson, and L. J. Travers. 2007. EAARL topography-Sagamore Hill National Historic Site. USGS Open File Report 2007-1394. http://pubs.usgs.gov/of/2007/1394/ (accessed 1 November 2011).
James-Pirri, M. J. and P. Rafferty. 2010. Assessment of spawning horseshoe crabs within Mid-Atlantic coastal NPS units. National Park Service, Task Agreement #P11AT40781 under Cooperative Agreement #H4503090700 with the University of Rhode Island, funding years: 2012 to 2015.
National Park Service (NPS). 2012. Geologic Resource Inventory Publications, Sagamore Hill NHS, scoping summary and GIS geological map data. http://www.nature.nps.gov/geology/inventory/gre_publications.cfm (accessed 15 June 2012).
National Park Service (NPS). 2007. Sagamore Hill National Historic Site. Final General Management Plan Final Environmental Impact Statement. Department of the Interior, National Park Service, Northeast Region, Boston, Massachusetts.
NOAA. 2011. Tides and Currents Sea Levels Online. Port Jefferson, New York station # 8514560. http://tidesandcurrents.noaa.gov/sltrends/index.shtml (accessed 25 October 2011).
Psuty, N. P., M. Duffy, J .F. Pace, D. E. Skidds, and T. M. Silveira. 2010. Northeast Coastal and Barrier Network geomorphological monitoring protocol: part I—ocean shoreline position. Natural Resource Report NPS/NCBN/NRR —2010/185. National Park Service, Fort Collins, Colorado.
Rafferty, P. 2005. An overview of coastal resources at Sagamore Hill National Historic Site. Report submitted in support of the General Management Plan. January 31, 2005. National Park Service, Oyster Bay, New York.
Thornberry-Ehrlich, T. L. 2011. Geologic Resources Inventory Scoping Summary Sagamore Hill National Historic Site. October 19, 2011. Geologic Resources Division, National Park

103
Service. http://www.nature.nps.gov/geology/inventory/publications/s_summaries/SAHI_Scoping_Summary_2011-0927.pdf (accessed 31 October 2011).
US Fish and Wildlife Service (USFWS). 2006. Long Island Complex National Wildlife Refuge Complex Comprehensive Conservation Plan. September 2006. Shirley, New York. http://www.fws.gov/northeast/planning/Long%20Island%20Refuges/ccphome.html (accessed 27 October 2011).
USGS. 2011 USGS-NPS-NASA EAARL Topography website. Project Description. http://pubs.usgs.gov/of/2007/1394/HTML/purpose.html (accessed 1 November 2011).
4.2.4 Air Quality-Ozone
The National Park Service Air Resources Division (NPS ARD) oversees the national air resource management program for the NPS. To assess ozone air quality condition, the NPS ARD uses all available monitoring data (e.g., NPS, EPA, state, tribal, and local monitors) over a five-year period to generate interpolations for all NPS units within the continental US, including those without on-site monitoring.
Relevance and Context
Ozone is not directly emitted into the air but at ground level, is produced by a chemical reaction with certain air pollutants (e.g., nitrogen oxides and volatile organic compounds from industrial and automobile emissions) in the presence of intense, high-energy sunlight during hot summer months (US EPA 2011). Ground-level ozone is a health and environmental hazard. It is a respiratory irritant, can reduce lung function, cause asthma attacks, and reduce resistance to infection (US EPA 2011). The US EPA ozone human health standard (revised in 2008 to be more protective of human health) is generally used as a benchmark for rating current ozone condition (NPS 2011a). Ozone can also damage vegetation, and some plant species are sensitive to ozone injury at levels lower than the US EPA human health standard (NPS 2006).
The NPS ARD (2010, 2011a) has developed park-specific estimates based on five-year interpolations for ozone. The interpolations were used by the NPS ARD to determine an index for ozone-related air quality, and each index was assigned one of three condition categories: Good Condition, Moderate Condition, or Significant Concern (NPS ARD 2010, 2011a). The data used to estimate ozone air quality at SAHI were from monitors outside of the park as there were no air quality or weather/climate stations located at SAHI; but there were several stations within 30 km of the park (Davey et al. 2006).
Data and Methods
The US EPA human health ozone standard is the 3-year average of the fourth-highest daily maximum 8-hour average ozone concentrations measured at each monitor within an area over each year which must not exceed 75 parts per billion (ppb) (NPS ARD 2011a). The NPS ARD uses the US EPA human health standard as a benchmark for ozone condition (refer to Reference Condition section for specific benchmark values).

104
In 2004, the NPS ARD completed a risk assessment for ozone related vegetation injury using an ecologically based rating system that focused on ozone plant sensitivity and the presence of ozone sensitive vegetation within park units (NPS 2006, NPS ARD 2011a). The NPS ARD ozone sensitive plant list was cross-referenced with the SAHI plant list (Appendix A Table 1) and resulted in 17 plants observed at SAHI that are sensitive to ozone injury (Table 19).
The NPS ARD risk assessment for ozone sensitive vegetation uses the W126 and SUM06 metrics to evaluate ozone risk. W126 measures cumulative ozone exposure during daylight hours over the growing season and is expressed in parts per million-hours (ppm-hrs). The SUM06 metric sums hourly daylight ozone concentrations ≥ 0.060 ppm over the growing season, and is expressed in ppm-hrs. Both metrics are better predictors of plant response to ozone condition than the 8-hour US EPA human health standard metric (NPS ARD 2011a). The NPS ARD rated parks at low, moderate, or high risk for ozone injury to vegetation, based on presence of sensitive plant species, ozone exposures, and environmental conditions (e.g., soil moisture). For ozone condition assessment, parks that were evaluated at high risk were moved into the next condition category (e.g., a park with an average ozone concentration of 72 ppb, but judged to be at high risk for vegetation injury, would move from the Moderate to Significant Concern for ozone) (NPS 2006, 2011a). The NPS ARD uses the W126 and SUM06 metrics, in addition to the human health standard, as ecological benchmarks for ozone condition (refer to Reference Condition section for specific benchmark values). Table 19. Plants observed at SAHI that are sensitive to ozone.
Scientific Name Common Name
Ageratina altissima var. altissima White snakeroot
Ailanthus altissima Tree-of-heaven
Apocynum cannabinum1 Common dogbane
Asclepias syriaca Common milkweed
Corylus americana American hazelnut
Gaylussacia baccata Black huckleberry
Liquidambar styraciflua Sweetgum
Liriodendron tulipifera Tulip poplar
Parthenocissus quinquefolia Virginia creeper
Philadelphus coronarius1 Sweet mock orange
Prunus serotina Black cherry
Rhus copallina Dwarf sumac
Robinia pseudoacacia Black locust
Rubus allegheniensis Allegheny blackberry
Sambucus nigra ssp. canadensis American black elderberry
Sassafras albidum Sassafras
Spartina alterniflora Saltmarsh cordgrass 1 Species was not listed in either NPSpecies (NPS 2010) or by NPS ARD for SAHI (NPS 2006) but was observed in the park (refer to Appendix A Table 1).

The NPS ARD reference conditions and benchmarks for ozone air quality parameters (NPS ARD 2010, 2011a) are:
Reference Condition
Ozone (human health standard): Good: ≤ 60 ppb Moderate: 61-75 ppb Significant Concern: >76 ppb Ozone Exposure – W126, 5-year averages (vegetation-based ecological standard): Good: < 7 ppm-hrs Moderate: 7-13 ppm-hrs Significant Concern: > 13 ppm-hrs Ozone Exposure – SUM06, 5-year averages (vegetation-based ecological standard): Good: < 8 ppm-hrs Moderate: 8-15 ppm-hrs Significant Concern: > 15 ppm-hrs
The recent (2006-2010) NPS ARD (2012) assessment for the human ozone health standard was evaluated as Significant Concern for SAHI (Table 20). The ecological-based ozone metrics (WW126 and SUM06 parameters) were both assessed as Moderate (equivalent to Caution in this NRCA) for the same period (NPS ARD 2012). The NPS ARD (2010) rated the trend in ozone (10-yr average annual 4th-highest 8-hour ozone concentration) as No Trend for SAHI; however, the Northeastern region of the US has generally experienced improving trends in ozone condition over the past decade (Figure 27). Earlier estimates (2001-2005) of the ozone health standard and the ecological SUM06 metric (there were no conversation guidelines for the 2001-2005 W126 metric) were both slightly higher than recent estimates (NPS ARD 2011b) (Table 20).
Status of the Resource
Current Condition for ozone (human health standard): Significant Concern Condition and Trend
Trend for ozone (human health standard): No Significant Trend The NPS ARD interpolated 2006-2010 average for ozone was 80.0 ppb with No Significant Trend.
Current Condition for W126 ozone exposure: Caution Trend for W126 ozone exposure: Not estimated
The NPS ARD interpolated 2006-2010 average for W126 was 11.6 ppm-hrs. The trend was not estimated.
Current Condition for SUM06 ozone exposure: Caution Trend for SUM06 ozone exposure: Not estimated
The NPS ARD interpolated 2006-2010 average for SUM06 was 14.1 ppm-hrs. The trend was not estimated.

Table 20. Historic (2001-2005) and recent (2006-2010) 5-year averages for air quality at SAHI and NPS ARD assessed air quality condition.
Air Quality Parameter SAHI 2001-2005, 5-yr average (historic)
SAHI 2006-2010, 5-yr average (recent)
NPS ARD Rating from 2006-2010 data
NPS ARD Trend from 2006-2010 data
Ozone– human health standard 88.22 ppb 80.03 ppb Significant Concern No trend4
Ozone W1261 – ecological standard Not available 11.63 ppm-hrs Moderate Not estimated
Ozone SUM06 – ecological standard 18.92 ppm-hrs 14.13 ppm-hrs Moderate Not estimated
1 The 2006-2010 W126 presented in this table is the 3-month cumulative 12-hour W126 (NPS 2012). The historic W126 (2001-2005) is the as 24-hour annual W126 presented as 24176.8 ppb-hrs by the NPS ARD (2011b). Conversion factors for these values were not listed in either NPS ARD table. 2 Data source: NPS ARD 2011b. 3 Data source: NPS ARD 2012. 3 NPS ARD (2010) trend assessment based on data from 1999-2008.

Figure 27. National trends in annual 4th-highest 8-hour ozone concentration, 1999–2008 (map excerpted from NPS ARD 2010).
The data were of good quality and the confidence in the current condition and trend was high. Confidence in Condition and Trend
There were no data gaps for this resource as air quality is regularly monitored and interpreted by both federal and state agencies (NPS, EPA, NY DEC).
Data Gaps
While SAHI contains very little emission sources that contribute to air pollution, air quality at the park is highly influenced by local and regional air pollution transport as it is influenced by both local (Long Island) and regional (Northeast) emissions from automobile traffic and industry.
Threats

Davey, C. A., K. T. Redmond, and D. B. Simeral. 2006. Weather and climate inventory, National Park Service, Northeast Coastal and Barrier Network. Natural Resource Technical Report NPS/NCBN/NRTR—2006/008. National Park Service, Fort Collins, Colorado.
Literature Cited
National Park Service (NPS). 2010. NPSspecies Database. http://science.nature.nps.gov/im/apps/npspp/ (accessed 6 May 2010).
National Park Service (NPS). 2006. Ozone Sensitive Species in Parks. Ozone risk assessment for Vital Signs Networks. http://www.nature.nps.gov/air/Permits/ARIS/networks/ozoneRisk.cfm (accessed 13 June 2012).
National Park Service Air Resources Division (NPS ARD). 2010. Air quality in national parks: 2009 annual performance and progress report. Natural Resource Report NPS/NRPC/ARD/NRR—2010/266. National Park Service, Denver, Colorado. http://www.nature.nps.gov/air/Pubs/pdf/gpra/AQ_Trends_In_Parks_2009_Final_Web.pdf
National Park Service Air Resources Division (NPS ARD). 2011a. Rating air quality conditions.
(accessed 6 December 2010).
http://www.nature.nps.gov/air/planning/index.cfm (accessed 13 June 2012).
National Park Service, Air Resources Division (NPS ARD). 2011b. 2001-2005 5-year average ozone estimates. NPS Air Quality Estimates. National Park Service. Denver, Colorado. http://www.nature.nps.gov/air/Maps/AirAtlas/IM_materials.cfm (accessed 19 June 2012).
National Park Service, Air Resources Division (NPS ARD). 2012. 2006-2010 5-year average ozone estimates. NPS Air Quality Estimates. National Park Service. Denver, Colorado. http://www.nature.nps.gov/air/Maps/AirAtlas/IM_materials.cfm (accessed 19 June 2012).
US Environmental Protection Agency (US EPA). 2011. Ground level ozone. http://www.epa.gov/air/ozonepollution/ (accessed 17 June 2011).
4.2.5 Air Quality-Wet Deposition
The NPS ARD oversees the national air resource management program for the NPS. To assess air quality condition related to total nitrogen (N) wet deposition and total sulfur (S) wet deposition the NPS ARD uses all available monitoring data (e.g., NPS, EPA, state, tribal, and local monitors) over a five-year period to generate interpolations all NPS units within the continental US, including those without on-site monitoring. The data used to estimate wet deposition at SAHI were from monitors outside of the park as there were no air quality or weather/climate stations located at SAHI; but there are several stations within 30 km of the park (Davey et al. 2006).
Relevance and Context
Ammonium, nitrate, and sulfate ions in precipitation (rain and snow) are used as indicators of atmospheric deposition because they can be directly linked to ecological effects (e.g., acidification of surface waters or nutrient enrichment that disrupts natural systems). The NPS ARD uses the amount of total N wet deposition and total S wet deposition (dry deposition data

109
are not available for most areas) as a measure of condition for atmospheric deposition (NPS ARD 2010, 2011a).
The NPS ARD (2010, 2011a) has developed park-specific estimates based on five-year interpolations for wet deposition. The interpolations were used by the NPS ARD to determine an index for wet deposition-related air quality, and each index was assigned one of three condition categories: Good Condition, Moderate Condition, or Significant Concern (NPS ARD 2010, 2011a). The NPS ARD estimates wet deposition for park units within the continental US by multiplying N or S concentrations in precipitation by a normalized precipitation amount. Several factors are considered in rating deposition condition, including natural background deposition estimates and deposition effects on ecosystems. Estimates of natural background deposition for total N or S deposition are approximately 0.50 kg ha-1 yr-1 in the East, which is roughly equivalent to a wet deposition only rate of 0.25 kg ha-1 yr-1. Certain sensitive ecosystems respond to levels of deposition on the order of 1.5 kg ha-1 yr-1 wet deposition and evidence is not currently available that indicates that wet deposition amounts less than 1 kg ha-1 yr-1 cause ecosystem harm (NPS 2011a). For parks with ecosystems potentially sensitive to N or S, interpolated values are adjusted up one category (e.g., a park with a Moderate N deposition of 1-3 kg ha-1 yr-1 that contains N-sensitive ecosystems would be assigned the deposition condition of Significant Concern). Refer to Reference Condition section for specific N and S wet deposition benchmark values.
Data and Methods
Sullivan et al. (2011) evaluated the sensitivity of all Inventory and Monitoring National Parks to potential acidification effects caused by acidifying atmospheric deposition. The assessment considered three factors that influence acidification risk to park resources: pollutant exposure, inherent ecosystem sensitivity (the extent and distribution of sensitive aquatic and terrestrial ecosystems in the park), and park protection mandates. They ranked each park according to these factors and calculated a summary risk ranking for each park based on the averages of the three theme rankings.
The NPS ARD reference conditions and benchmarks for total N and total S wet deposition (NPS ARD 2010, 2011a) are:
Reference Condition
Total N wet deposition: Good: 1 kg ha-1 yr-1 Moderate: 1-3 kg ha-1 yr-1 Significant Concern: > 3 kg ha-1 yr-1 Total S wet deposition: Good: < 1 kg ha-1 yr-1 Moderate: 1-3 kg ha-1 yr-1 Significant Concern: > 3 kg ha-1 yr-1
Recent (2006-2010) interpolated value for total N deposition at SAHI was 4.3 kg ha-1 yr-1 and was 4.9 kg ha-1 yr-1 for total S deposition (NPS ARD 2012). Earlier estimates (2001-2005) were
Status of the Resource

110
slightly higher (4.7 and 5.9 kg ha-1 yr-1, respectively for total N and total S deposition) (Figure 28) (NPS ARD 2011b). Both recent and historic estimates of wet deposition values assessed as Significant Concern by the NPS ARD. The NPS ARD (2010) did not estimate trends in N or S deposition for SAHI, but the Northeast region of the US has generally experienced improving trends in both metrics over the last decade (Figure 29, Figure 30).
Sullivan et al. (2011) estimated the potential effects caused by acidifying atmospheric deposition and ranked SAHI as very high for pollutant exposure, moderate for park protection, and low for ecosystem sensitivity. The overall summary risk for potential acidification effects caused by atmospheric deposition was assessed as moderate for SAHI (Sullivan et al. 2011).
Current Condition for total N wet deposition: Significant Concern by NPS ARD Condition and Trend
Trend for total N wet deposition: Not estimated by NPS ARD The NPS ARD interpolated 2006-2010 average for N wet deposition was 4.3 kg ha-1 yr-1. The trend was not estimated.
Condition for total S wet deposition: Significant Concern by NPS ARD Trend for total S wet deposition: Not estimated by NPS ARD
The NPS ARD interpolated 2006-2010 average for S wet deposition was 4.9 kg ha-1 yr-1. The trend was not estimated
The data were of good quality and the confidence in the current condition and trend was high. Confidence in Condition and Trend
There were no data gaps for this resource as air quality is regularly monitored and interpreted by both federal and state agencies (NPS, EPA, NY DEC).
Data Gaps
Figure 28. Historic and recent estimates of total N and total S deposition for SAHI (NPS ARD 2011b, 2012). Lines indicate NPS ARD threshold values for condition assessment of total N and total S deposition.

Figure 29. National trends in nitrate concentrations in precipitation, 1999-2008 (map excerpted from NPS ARD 2010).

Figure 30. National trends in sulfate concentrations in precipitation, 1999-2008 (map excerpted from NPS ARD 2010).
While SAHI contain very little emission sources that contribute to air pollution, wet deposition-related air quality at the park is highly influenced by local and regional air pollution transport as it is influenced by both local (Long Island) and regional (Northeast) emissions from automobile traffic and industry.
Threats
Davey, C. A., K. T. Redmond, and D. B. Simeral. 2006. Weather and climate inventory, National Park Service, Northeast Coastal and Barrier Network. Natural Resource Technical Report NPS/NCBN/NRTR—2006/008. National Park Service, Fort Collins, Colorado.
Literature Cited
National Park Service Air Resources Division (NPS ARD). 2010. Air quality in national parks: 2009 annual performance and progress report. Natural Resource Report NPS/NRPC/ARD/NRR—2010/266. National Park Service, Denver, Colorado. http://www.nature.nps.gov/air/Pubs/pdf/gpra/AQ_Trends_In_Parks_2009_Final_Web.pdf (accessed 6 December 2010).

113
National Park Service Air Resources Division (NPS ARD). 2011a. Rating air quality conditions. http://www.nature.nps.gov/air/planning/index.cfm (accessed 13 June 2012).
National Park Service, Air Resources Division (NPS ARD). 2011b. 2001-2005 5-year average wet deposition estimates. NPS Air Quality Estimates. National Park Service. Denver, Colorado. http://www.nature.nps.gov/air/Maps/AirAtlas/IM_materials.cfm (accessed 19 June 2012).
National Park Service, Air Resources Division (NPS ARD). 2012. 2006-2010 5-year average wet deposition estimates. NPS Air Quality Estimates. National Park Service. Denver, Colorado. http://www.nature.nps.gov/air/Maps/AirAtlas/IM_materials.cfm (accessed 19 June 2012).
Sullivan, T. J., G. T. McPherson, T. C. McDonnell, S. D. Mackey, and D. Moore. 2011. Evaluation of the sensitivity of inventory and monitoring national parks to acidification effects from atmospheric sulfur and nitrogen deposition: main report. Natural Resource Report NPS/NRPC/ARD/NRR—2011/349. National Park Service, Denver, Colorado.
4.2.6 Air Quality-Visibility
The NPS ARD oversees the national air resource management program for the NPS. To assess visibility condition, NPS ARD uses all available monitoring data (e.g., NPS, EPA, state, tribal, and local monitors) over a five-year period to generate interpolations all NPS units within the continental United States, including those without on-site monitoring (NPS ARD 2011a). The NPS ARD estimates visibility using a Haze Index, as the Haze Index increases, visibility worsens. The data used to estimate visibility at SAHI are from monitors outside of the park as there are no air quality or weather/climate stations located at SAHI; but there are several stations within 30 km of the park (Davey et al. 2006).
Relevance and Context
The EPA’s Region Haze Program has identified National Parks and Wilderness Areas as either Class 1 or Class 2 areas. Class 1 areas include National Parks greater than 6,000 acres and Wilderness Areas greater than 5,000 acres that were in existence or authorized as of August 7, 1977. Class 1 areas receive the highest degree of air quality protection under the Clean Air Act (NPS ARD 2010, US EPA 2012) and have specific national regional haze goals. Generally, all other parks that do not meet the criteria for Class 1 are considered Class 2 areas. SAHI is considered a Class 2 area.
The NPS ARD (2010, 2011a) has developed park-specific estimates based on five-year interpolations for visibility conditions. The interpolations were used by the NPS ARD to determine an index for visibility-related air quality, and each index was assigned one of three condition categories: Good Condition, Moderate Condition, or Significant Concern (NPS ARD 2010, 2011a). The NPS ARD estimates visibility conditions (expressed as the Haze Index in deciviews [dv]) for park units based on the deviation of current visibility from the natural visibility (the visibility in a given area in the absence of human caused visibility impairment). Visibility is estimated from the Group 50 natural visibility conditions using an interpolation of the five-year averages. The Group 50 natural visibility condition is the mean of the visibility
Data and Methods

114
observations falling between the 40th and 60th percentiles, as estimated from interpolation of five-year averages. The range of categories for visibility condition (refer to Reference Condition section for benchmark values) were chosen to reflect the variation in visibility conditions across the monitoring network (NPS ARD 2011a, 2012).
The NPS ARD reference conditions and benchmarks for visibility (NPS ARD 2010, 2011a) are: Reference Condition
Visibility: Good: > 8 dv Moderate: 2-8 dv Significant Concern: < 2 dv
NPS ARD’s (2012) recent (2006-2010) visibility estimate was 10.3 dv for SAHI, and was assessed as Good. Earlier estimates (2001-2005, 7.8 dv) were also assessed as Good (NPS ARD 2011b). The NPS ARD did not estimate trends for these metrics; however, the Northeast region of the US has generally experienced improving trends in the Haze Index (as measured on the haziest days) in the last decade (Figure 31).
Status of the Resource
Figure 31. National trends in Haze Index (deciviews) on haziest days, 1999-2008 (map excerpted from NPS ARD 2010).

Condition for visibility: Good by NPS ARD Condition and Trend
Trend for visibility: Not estimated by NPS ARD The NPS ARD interpolated 2006-2010 average for visibility was 10.3 dv. The trend was not estimated.
The data were of good quality and the confidence in the current condition and trend was high. Confidence in Condition and Trend
There were no data gaps for this resource as air quality is regularly monitored and interpreted by both federal and state agencies (NPS, EPA, NY DEC).
Data Gaps
While SAHI contain very little emission sources that contribute to air pollution, visibility-related air quality at the park is highly influenced by local and regional air pollution transport as it is influenced by both local (Long Island) and regional (Northeast) emissions from automobile traffic and industry.
Threats
Davey, C. A., K. T. Redmond, and D. B. Simeral. 2006. Weather and climate inventory, National Park Service, Northeast Coastal and Barrier Network. Natural Resource Technical Report NPS/NCBN/NRTR—2006/008. National Park Service, Fort Collins, Colorado.
Literature Cited
National Park Service Air Resources Division (NPS ARD). 2010. Air quality in national parks: 2009 annual performance and progress report. Natural Resource Report NPS/NRPC/ARD/NRR—2010/266. National Park Service, Denver, Colorado. http://www.nature.nps.gov/air/Pubs/pdf/gpra/AQ_Trends_In_Parks_2009_Final_Web.pdf
National Park Service Air Resources Division (NPS ARD). 2011a. Rating air quality conditions.
(accessed 6 December 2010).
http://www.nature.nps.gov/air/planning/index.cfm (accessed 13 June 2012).
National Park Service, Air Resources Division (NPS ARD). 2011b. 2001-2005 5-year average visibility estimates. NPS Air Quality Estimates. National Park Service. Denver, Colorado. http://www.nature.nps.gov/air/Maps/AirAtlas/IM_materials.cfm (accessed 19 June 2012).
National Park Service, Air Resources Division (NPS ARD). 2012. 2006-2010 5-year average visibility estimates. NPS Air Quality Estimates. National Park Service. Denver, Colorado. http://www.nature.nps.gov/air/Maps/AirAtlas/IM_materials.cfm (accessed 19 June 2012).
US Environmental Protection Agency (US EPA). 2012. Visibility, EPA’s Regional Haze Program. http://www.epa.gov/airquality/visibility/program.html (accessed 19 June 2012).

4.2.7 Night Sky and Natural Lightscape
Night sky and natural darkness are easily altered and, in many places, are becoming lost in the glow of artificial lights. Only recently has the NPS recognized the importance of protecting and conserving the night sky as cultural, natural, and scientific natural resource (NPS 2012). In 2011, the Night Skies Program and the Natural Sounds Program merged to form the NPS Natural Sounds and Night Skies Division. This program has pioneered techniques for measuring sound and light levels in remote locations, has advanced research into noise and light pollution, and is noted for their application of science to sensory resources (NPS 2012).
Relevance and Context
The night sky as we see it is a combination of both natural and human-caused sources of light. Natural light sources include moonlight, starlight from individual stars and planets, and other celestial bodies. The NPS uses the term "natural lightscape" to describe resources and values that exist in the absence of human-caused light at night. Natural lightscapes are critical for nighttime scenery, such as viewing a starry sky, but are also critical for maintaining nocturnal habitat. Alteration of the night sky can be in the form of astronomical light pollution, where stars and other celestial bodies are obscured from view, or in the form of ecological light pollution where lighting (e.g., glare, illumination, fluctuations in lighting) can disrupt natural ecosystem processes and wildlife behavior (Longcore and Rich 2004). The largest human-caused source of ecological light pollution is outdoor electrical lighting, but other sources include skyglow (human-caused light scattered through the atmosphere), aircraft, fishing boats, vehicle lights, and satellites (Longcore and Rich 2004, NPS 2012). Ecological light pollution can alter behavior and affect the population ecology of organisms in the natural world. Such effects include, but are not limited to, changes in orientation or disorientation, and attraction or repulsion from altered lightscape, changes in the timing of diurnal or crepuscular behaviors that may in turn influence foraging, reproduction, migration, communication, and survivorship (Longcore and Rich 2004). Lightscapes can be cultural as well, and may be integral to the historical fabric of a place. Human-caused light may be obtrusive in the same manner that noise can disrupt a contemplative or peaceful scene (NPS 2012).
The quality of natural lightscapes and starry night skies are dependent on the weather, the clarity of the air, and the amount of light pollution present (NPS 2012). The brightness and appearance of skyglow depends on atmospheric factors such as moisture, air pollution, and dust particles. Clean, dry air scatters light pollution less, resulting in darker skies for observers close to the light source. Poor air quality has the opposite effect, increasing light pollution close to the source and decreasing it at longer distance (NPS 2012).
Since 2001, the NPS Night Skies Team has systematically inventoried night sky quality in approximately 100 parks (Duriscoe et al. 2007, NPS 2012).
Data and Methods
The team’s approach uses a rapid capture of the night sky in a high-resolution mosaic resulting in a precise measurement of sky brightness and glare across the entire celestial hemisphere using a charged coupled device camera (CCD, a research-grade digital camera). In addition, the team identifies sources of light pollution and separates natural from human-caused sky brightness (Duriscoe et al. 2007, NPS 2012).

117
There are other simpler qualitative methods that could be used in the absence of the sophisticated CCD camera, these include the Bortle Dark-Sky Scale and star counts (NPS 2012).
• The Bortle Dark-Sky Scale (Bortle 2001) – The Bortle Dark-Sky Scale is a nine-step scale, based on the visibility of certain celestial features (e.g., Milky Way, Zodiacal features), that can be used to estimate night sky quality. This is a simple way to make qualitative appraisals of the night sky that can be done quickly by a dark-adapted individual, but can be biased from one person to another (NPS 2012).
• Star counts – A defined area of the sky (e.g., the constellation Orion) is examined and the number of stars are counted or a constellation is compared to a series of images (Globe at Night 2012). Each image shows an increasing number of stars in the constellation; the more light pollution, the less contrast is afforded the observer and the less stars are seen (NPS 2012). This estimate can easily be completed in 20 to 30 minutes by a dark-adapted observer, but also can be biased from one observer to another (NPS 2012). The Globe at Night Program (2012) is one example of a popular star count to estimate the quality of the night sky.
In the highest quality skies, human-caused sources of light are less luminous than natural sources, and natural features of the night sky predominate. In a degraded natural lightscape condition, human-caused light is greater than that produced by natural sources, in some cases, many tens of times brighter (NPS 2012).
Reference Condition
Currently, the night sky and natural lightscape are not monitored at SAHI and reference conditions were not available for an urban park in the Northeast region.
There were no data available to evaluate this resource. Status of the Resource
Current Condition for night sky and natural lightscape: Unknown Condition and Trend
The night sky and natural lightscape have not been surveyed at SAHI. Current Trend for night sky natural lightscape: Unknown
The night sky and natural lightscape have not been surveyed at SAHI.
There were no data available for this resource. Confidence in Condition and Trend
Data were not available for this metric. An inventory and/or monitoring of the night sky and natural lightscape would be beneficial for the park.
Data Gaps
Since the night sky and natural lightscape have not been inventoried or monitored at SAHI, it is difficult to assess the threats to this resource. These resources could be influenced by the proximity of SAHI to large urban centers (e.g., skyglow from New York City) and populated
Threats

118
areas of Long Island that illuminate the night. There are wildlife species at SAHI that have specific nocturnal behaviors that may be negatively impacted by ecological light pollution (e.g., nesting diamondback terrapin, spawning horseshoe crabs).
Bortle, J. E. 2001. Introducing the Bortle Dark-Sky Scale. Sky and Telescope, February 2001: 126-129.
Literature Cited
Duriscoe, D. M., C. B. Luginbuhl, and C. A. Moore. 2007. Measuring night-sky brightness with a wide field CCD camera. Publications of the Astronomical Society of the Pacific 119:192-213.
Globe at Night Program. 2012. http://www.globeatnight.org (accessed 9 July 2012).
Longcore T. and C. Rich. 2004. Ecological light pollution. Frontiers in Ecology and the Environment 2: 191-198.
National Park Service. 2012. Natural Sounds and Night Skies. http://www.nature.nps.gov/night/index.cfm(accessed 9 July 2012).
4.2.8 Soundscape
A soundscape refers to the total acoustic environment of an area. In the National Park setting, both natural (e.g., wind, water, wildlife, vegetation) and cultural and historic sounds (battle reenactments, tribal ceremonies, quiet reverence) may be desirable and appropriate depending on the purpose and values of the park (NPS 2012). The soundscape, like water, scenery, or wildlife, is a valuable resource that can easily be degraded by inappropriate sounds or sound levels and as a result, the soundscape requires careful management just as any other park resource.
Relevance and Context
In 2011, the Night Skies Program and the Natural Sounds Program merged to form the NPS Natural Sounds and Night Skies Division. This program has pioneered techniques for measuring sound and light levels in remote locations, has advanced research into noise and light pollution, and is noted for their application of science to sensory resources. The NPS Natural Sounds Program assist park managers with specialized resource management and policy expertise as well as technical expertise in the form of acoustical monitoring, data collections and analysis, and all aspects of park planning and compliance (NPS 2012).
The acoustic data collected by the NPS Natural Sounds Team are collected in representative areas of a park and data collection may be tailored to park-specific management needs or specific sound-sensitive areas. Data are collected during at least two seasonal periods, and ideally, for all four seasons (NPS 2012). When specific sound sources are monitored, data collection occurs in the season when the activity happens and in the season when the activity occurs the least (or not at all) (NPS 2012). Generally, acoustic data are collected for a minimum of 25 days to ensure statistical confidence in the data, but may be shorter or longer depending on specific situations or environments.
Data and Methods

119
At each site, acoustic monitoring equipment records sound pressure level (loudness, recorded in decibels [dB]) and frequency (pitch, recorded in hertz [Hz]) once per second. The frequency spectrum is split into separate ranges so both high frequency (a cricket chirping) and low frequency (water flowing in a river) sounds can be monitored. Each acoustic monitoring system is paired with a miniature weather station that logs temperature, humidity, wind speed and direction, as sound waves traveling through the air are influenced by these parameters. Days with winds in excess of 5 meters per second are excluded from certain types of analysis due to interference (NPS 2012). Digital audio recordings are made to provide an accurate characterization of the natural and non-natural acoustic conditions and to identify specific sound sources. Sound technicians also conduct several hours of on-site listening at each monitoring site. These data are valuable to discern how often and low long each sound is audible to the human observer, and how much noise-free time occurs in an area.
Currently, soundscape is not monitored at SAHI and a reference condition for SAHI was not available.
Reference Condition
There were no data available to evaluate this resource. Status of the Resource
Current Condition for soundscape: Unknown Condition and Trend
The soundscape has not been surveyed at SAHI. Current Trend for soundscape: Unknown
The soundscape has not been surveyed at SAHI.
There were no data available to assess of this metric. Confidence in Condition and Trend
Data were not available for this metric. An inventory and/or monitoring of the soundscape would be beneficial for the park.
Data Gaps
Since the soundscape has not been inventoried or monitored at SAHI it is difficult to assess the threats to this resource. The naturally and culturally appropriate soundscape at SAHI could be threatened by human-produced sound outside of the park’s boundary. Examples could be noise from boat traffic on Cold Spring Harbor or from neighboring private properties (e.g., construction noise, loud music) that might impede upon the natural soundscape at SAHI.
Threats
National Park Service. 2012. Natural Sounds and Night Skies. Literature Cited
http://www.nature.nps.gov/sound/index.cfm (accessed 9 July 2012).


121
Chapter 5 Discussion 5.1 The Park Sagamore Hill National Historic Site’s single greatest resource is the combination of varied natural areas that are found in close proximity to each other. These diverse resources and their associated flora and fauna provide habitat for wildlife and the enjoyment of park visitors. The habitats at SAHI range from mature forests to agricultural fields, and freshwater wetlands to a maritime salt marsh/tidal creek/dune/beach complex. This Natural Resource Condition Assessment evaluated the condition of 16 natural resources related to Biological and Physical Integrity. The condition of each resource was rated as Good, Caution, Significant Concern, or Unknown; and the trend was evaluated as Stable, Improving (moving towards a desirable condition), Declining (moving away from a desirable condition), or Unknown. Biological resources assessed were three types of plant communities (upland, salt marsh, and managed field vegetation) and five faunal communities (birds, amphibians and reptiles, mammals, dragon and damselflies, salt marsh nekton), while the physical resources were water quality (fresh and estuarine waters), geologic and coastal resources, specifically shoreline extent, and air quality (ozone, total wet deposition, and visibility), night sky, and soundscape (Table 21). In general, data were available to assess most of the natural resources; however, in many cases data were from one sampling event and/or were several years old. SAHI is in the Northeast Coastal and Barrier Network, and its coastal resources (e.g., salt marsh communities, shoreline extent) are sufficiently monitored, but the park lacks routine terrestrial monitoring (with the exception of recently initiated forest monitoring), and some resources (e.g., managed field vegetation, night sky and soundscape) have never been inventoried. The lack of repeated sampling events combined with the outdated nature of many of the datasets is probably the single most important finding of this report and highlights the need for periodic sampling events to maintain an accurate status of the park’s natural resources.
The forests comprise the largest single habitat at SAHI. Congress designated the oak-tulip tree forest in the park’s eastern portion a NESA in the 1970s (the NESA program no longer exists). This is likely the best remaining example of this type of forest on Cove Neck. Mostly native plants and very old, large trees that were likely present during Roosevelt’s time typify a large portion of the forest area. Several state listed plants and birds are found in the forests along with a variety of reptiles, amphibians, and mammals. Unfortunately, only forest vegetation has been and is currently routinely surveyed, with information on faunal communities using these areas severely lacking. Forest monitoring has indicated very low forest regeneration likely related to poor soil chemistry or deer overbrowsing, or both. Data on the forest bird community is severely lacking, as the forest certainly provides breeding, nesting, and foraging habitat for many species, including important neo-tropical migrants. Invasive plants pose a serious threat to the integrity of the forest community. In several locations, invasive plants such as Norway maple, Oriental bittersweet, and garlic mustard are problematic and the extent of invasive vegetation should be periodically assessed.
The fields at SAHI are mowed by the NPS to maintain the cultural legacy of Sagamore Hill as a working farm. The park has recently restored some former fields and seeded native grasses and forbs, but the fields themselves have never been the focus of an inventory or monitoring effort. These managed fields provide habitat to a diverse array of Odonata, including the state listed comet darner. Small mammals, snakes, and other reptiles, including the state listed Eastern box

122
turtle, also frequent the fields. While small, the fields might provide habitat for grassland birds, although these areas have not been specifically surveyed for this group.
The freshwater wetland resources at SAHI are limited to Woodpile/Hog Pond, a small kettle pond adjacent to the visitor center parking lot, and Heron Pond, a vernal pond with a short hydroperiod that is located in the eastern oak-tulip tree forest. Although small, these two ponds provide important habitat for several species of Odonata and the park’s amphibians, which are almost exclusively found in these wetlands. The ponds also supply habitat and water sources for birds and mammals found in the park. Little data exist on the water quality and quantity for these areas and periodic sampling would provide invaluable information on the ecological integrity of the ponds.
The maritime salt marsh/tidal creek/dune/beach complex bordering Cold Spring Harbor was designated a National Environmental Study Area (this program no longer exists) and maintenance of this area was identified in the park’s General Management Plan. A few state listed plants are found in the salt marsh and dune areas, while the beach along Eel Creek and Cold Spring Harbor provides spawning habitat for horseshoe crabs and nesting area for diamondback terrapins. The beach and dune area may also provide habitat for foraging and migrating odonates. Several species of birds including Partners in Flight listed waterfowl and shorebirds use the salt marsh, while the tidal Eel Creek supports a community of estuarine and salt marsh nekton. This area is relatively devoid of invasive plants; however, shoreline development to the north and south of the park may negatively affect this important area.
5.2 Resource Synopsis Upland vegetation was surveyed during three separate studies since 2003 and the Mid-Atlantic Network currently monitors forest vegetation every four years. Of the five metrics used to assess the status of the forest, one (structural stage) was rated as Good condition, one rated as Good to Caution (tree canopy condition), one as Caution (snag biomass), and the remaining two as Significant Concern (coarse woody debris and forest regeneration). An additional metric, the extent of invasive vegetation, was also used to assess the park’s vegetation and this was rated as Significant Concern (Table 21). While the data for upland vegetation were of good quality, there was a lack of long-term data and trends could not be evaluated. Continued monitoring should provide long-term data in the future to evaluate trends in forest condition; however, this sampling will not estimate changes in the extent of invasive vegetation, which is a major threat to the plant communities at SAHI. Additionally, deer overbrowsing likely impacts the forest at SAHI and the park would benefit from a deer density study. Further coordination with the MIDN Inventory and Monitoring team, who manage the forest vegetation and soil chemistry data, would also be beneficial.
The Northeast Coastal and Barrier Network regularly monitors the salt marsh plant community at SAHI. Sampling conducted over the past decade indicates that the marsh was dominated by typical and desirable salt marsh vegetation with little to no invasive plants. This community was rated as Good for all four metrics and appears to be Stable in regards to short-term trends (Table 21). Similar to upland vegetation, long-term trends could not be evaluated due to a lack of historic data; however, the current sampling program (conducted every three years) should provide this information in the future. This community is responsive to changes in water quality and sedimentation rates, and processes and activities outside of the park boundaries, such as

123
coastal development and expansion of invasive species from adjoining properties, pose threats to the salt marsh plant community.
The managed fields at SAHI are a historic and cultural resource as well as an important natural resource. There has never been a focused inventory or monitoring effort for the managed fields and it is not known if the seeded native grasses and forbs have been successful in establishing a native field vegetation community. The condition and trend for managed field vegetation were rated as unknown as there were no data available for this resource. Threats to the fields at SAHI include invasive vegetation and overgrowth by successional vegetation.
The avian community at SAHI was only surveyed once in 2003, and there is currently no program to monitor birds in the park. This was surprising given the extent of the available habitat for both resident and migratory birds, the number of species observed in the park (116 species), the potential number of species breeding in the park (69), and the presence of both state listed species (7 species) and Partners in Flight species (19 species). Using the Northeast Temperate Network’s avian guild-based species richness assessment, the condition of the avian community at SAHI was evaluated as Significant Concern (Table 21). During the 2003 inventory, there were a lower than desired number of specialist species (e.g., bark gleaners, forest canopy foragers and nesters, and single brooders) and a higher than desired number of generalist species (e.g., exotics, residents, omnivores, and shrub-nesters). Since this assessment was based on data collected almost a decade ago, a condition of Unknown was also given since the data may not reflect the current community of the park. Trends for the avian community were not evaluated due to a lack of long-term data. Primary threats to the avian community are habitat loss, forest fragmentation, and competition with other non-migratory resident birds (e.g., exotics, brood-parasites, nest predators) that thrive in fragmented landscapes. Habitat loss and fragmentation are widespread throughout the Northeast region and there is little control that SAHI has over these stressors outside of the park’s boundaries.
The amphibian and reptile community at SAHI was inventoried once in 2002. During this survey, five of eight possible amphibian species and five of nine possible reptile species were observed. Two state listed species of Special Concern, the marbled salamander and Eastern box turtle, were also observed. Based on the species richness benchmark a rating of Caution and Significant Concern, respectively, were given for the amphibian and reptile communities (Table 21). A condition of Unknown was also given since the survey was conducted almost a decade ago and these data may not reflect the current herpetofauna community of the park. Trends for the herpetofauna community could not be evaluated since there was only one sampling event, although anecdotal reports possibly indicate a decline in the some species (e.g., painted turtles and snakes) at SAHI from historic times. Herpetofauna are threatened by a variety of regional and local stressors, including but not limited to, air-borne pollutants, acid precipitation, habitat fragmentation, land and road runoff (e.g., pesticides, fertilizers, road salts), poor water quality, and predation by domestic and feral cats. Locally at SAHI, the amphibian community may be negatively impacted by parking lot run off into Woodpile/Hog Pond, while the reptile community may be threatened by park landscape practices (e.g., mortality from field mowing equipment).
Similar to the avian and herpetofauna community, the mammal community was inventoried only once. During the 2004 survey, species diversity was low with only eight of 30 current or

124
historically recorded species detected; however, it was likely that more species were present in the park as a few additional common species were observed by park staff (e.g., cottontail rabbit, Eastern chipmunk, white-tailed deer). Based on the low to moderate mammal species richness this community was rated as Caution and the trend was evaluated as Unknown since mammals were only surveyed once (Table 21). Mammal communities are threatened by vehicle mortality, habitat fragmentation, and predation by domestic and feral cats.
The Odonata (dragonflies and damselflies) inventory in 2004-2005 detected 22 species, including one state listed species (the comet darner) and one species on the NY state watch list (citrine forktail). This represented 71% of the possible species pool, and the community was evaluated as Caution. The trend for odonates was Unknown as there was only one survey (Table 21). Locally, the Odonata community could be impacted by mowing of fields since un-mowed fields at SAHI supported the highest diversity of odonates. Other threats include habitat loss, degradation of wetland breeding areas, and loss of migration corridors due to land development.
Salt marsh nekton were regularly sampled by the Northeast Coastal and Barrier Network in the tidal Eel Creek. The nekton community was rated as Significant Concern and the trend was evaluated as Stable to Possibly Declining (Table 21). The community was dominated by Palaemonidae shrimp with resident fish comprising only 20% of the relative abundance. In recent sampling, the relative abundance of resident and transient fish decreased compared to earlier surveys. Estuarine nekton communities are threatened by degraded water quality, watershed development, and other anthropogenic impacts, most of which are beyond the park’s control.
The freshwater resources at SAHI were limited to two freshwater ponds, Woodpile/Hog Pond and Heron Pond, a vernal pond. Freshwater quality has never been monitored in the park, although some water quality measurements were taken in 1999-2000 by the NPS, but these data were never interpreted or finalized in a report. Information for this resource was gleaned from other studies (e.g., herpetofauna inventory, Odonata inventory, invasive plant management plan) that mentioned these ponds in passing. Due to absence of data the condition and trend for freshwater quality was evaluated as Unknown (Table 21). Threats to these freshwater resources include storm and road runoff, on-site septic systems, construction on adjacent private property, and invasive plants.
The estuarine water resources at SAHI were the tidal Eel Creek and the adjacent waters of Cold Spring Harbor. Due to rigorous state and federal compliance with the Clean Water Act, this resource had the most extensive data. Cold Spring Harbor and its associated tidal creeks (e.g., Eel Creek) have impaired water quality for several of its designated uses (e.g., public bathing, recreation, and shellfishing) both historically and recently. The primary impairment was pathogens related to storm and urban runoff. A TMDL for pathogens was implemented in 2007 and the harbor was declared a no discharge zone for vessels in 2008. Based on this the condition of this resource was rated as Caution with a trend of Stable to Improving (Table 21). Estuarine water quality is influenced by adjacent land use and water use (e.g., marinas), surface runoff, and water quality of the surrounding marine waters, which is largely beyond the control of the park.
The shoreline extent at SAHI was only recently surveyed and analyses on shoreline change were not yet available. Based on visual examination of aerial photography, the shoreline both north

125
and south of the park’s boundary has been modified. The most extensive modifications, created in the late 1950s, were the boat marina and channel to the south, although dredging of the marina channel has occurred in recent years. The adjacent intertidal and subtidal habitats fall under the ownership of US Fish and Wildlife Service’s Oyster Bay National Wildlife Refuge, which offers protection from new development. The condition of shoreline change was rated as Unknown to Caution with a trend of Unknown, since analyses have not yet been conducted (Table 21). The major threat to the SAHI shoreline is coastal development, which can alter natural processes such as littoral drift, sedimentation rates, and hydrology.
Air quality at SAHI was reflective of the air quality of the region. The NPS Air Resources Division evaluated ozone air quality as Significant Concern for the human health standard, and as moderate (Caution) for two metrics based on vegetation sensitivity to ozone (Table 21). Total nitrogen and sulfur wet deposition were assessed Significant Concern, and visibility was rated as Good. The NPS ARD estimated the trend for the human health ozone standard as No Trend. Trends were not estimated for any of these parameters for SAHI. The night sky and soundscape at SAHI have never been inventoried and both parameters were evaluated as Unknown for condition and trends.
5.3 Potential Research and Monitoring Activities There were several areas where data gaps existed or information was outdated for the park’s natural resources. The following is a list of potential research activities that would provide information for these areas. The list is loosely organized by priority (higher and lower priority) based on best professional judgment. Higher priority activities:
• Establish a monitoring program for freshwater resources (there has been no monitoring of this resource).
• Establish a monitoring program for forest breeding birds (the last and only inventory was conducted in 2003).
• Establish a monitoring program for herpetofauna (the last and only inventory was conducted in 2002).
• Survey managed fields to evaluate if the vegetation community is equivalent to the seeded community proposed in the rehabilitation plan.
• Monitor wildlife use (birds, herpetofauna, odonate) of the managed fields. • Conduct deer density study and evaluate extent of deer overbrowsing. • Continue invasive vegetation eradication efforts; document eradication efforts so GIS
data for the park can be updated. • Conduct a night sky inventory. • Conduct a soundscape inventory. • Conduct an analysis of the sediments under the bridge that crosses the marsh for the
presence of copper, chromium, and arsenic. Analyze salt marsh sediment below the high tide mark for contaminants.
Lower priority activities: • Document if cottontail rabbits are New England cottontail (NY species of special
concern) or Eastern cottontail.

126
• Repeat NVC mapping survey. NPS Inventory and Monitoring Program recommended sampling at five-year intervals to maintain accurate aerial vegetation maps (last effort was in 2006).
• Re-survey odonates (last and only survey was in 2004-2005). • Re-survey the mammal community of the park (last and only inventory was conducted in
2004). • Document the outcome of the recent invasive plant eradication efforts. • Update/correct NPSpecies database for the park (e.g., species listed in Werier 2006,
Edinger et al. 2008, Briggs et al. 2010, and Cook et al. 2010 were missing from NPSpecies). No insect species were listed in NPSpecies for the park. Nativity status for several plant species was incorrect.
• Update and/or correct existing GIS data for park, inconsistencies that were found included:
o Park GIS data: The trail should be a complete loop and should connect to bridge over
marsh; Kiosk is no longer there; Rename “Carriage Cottage” as “Farm Shed”; Revise GIS data to incorporate recent tree clearing and field restoration
activities. o NVCS GIS data:
Location of Norway maple forest south of road is incorrect; o NLCD and US EPA Land Use data
Location of orchards is incorrect; Some residential areas appear to be inside the park; Residential land use area on the park’s boundary with Cold Spring Harbor
is incorrect.

127
Table 21. Summary of natural resource conditions for Sagamore Hill NHS.
Natural Resource and Metric Benchmark Current Condition Trend
Biotic Integrity
Upland vegetation
Forest structural stage Good: ≥25% of forest was late-successional.
Caution: <25% of forest was late-successional.
Significant Concern: <25% of forest was combined mature and late successional.
Good 100% of the forest was mature and late successional forest.
Unknown There was a lack of historic and/or long-term data (only one sampling event).
Canopy tree condition Good: <10% canopy stems with foliage problems, no pests or pathogens, BBD1 severity ≤ 2 stems plot-1.
Caution: 10-50% canopy stems with foliage problem, evidence of evidence HWA, EHS, or BC pests1, BBD severity >2 stems plot-1.
Significant Concern: >50% canopy stems with foliage problem, evidence ALB, EAB, or SOD pests1, BBD severity >2 stems plot-1.
Good to Caution Two plots were in Good condition and two plots were in Caution condition.
Unknown There was a lack of historic and/or long-term data (only one sampling event).
Snag biomass Good: ≥10% of trees and shrubs were ≥10cm DBH2 snags and ≥10% of medium-large (≥30cm DBH) trees are snags.
Caution: <10% of trees and shrubs were ≥10cm DBH2 snags or <10% of medium-large (≥30cm DBH) trees were snags.
Significant Concern: <5 medium-large snags (≥30cm DBH) per hectare.
Caution There were 6.25 snags ha-1 (4.5%) that were ≥30 cm DBH.
Unknown There was a lack of historic and/or long-term data (only one sampling event).

128
Table 21. Summary of natural resource conditions for Sagamore Hill NHS (continued).
Natural Resource and Metric Benchmark Current Condition Trend
Coarse woody debris (CWD) Good: CWD volume >15% of live tree volume.
Caution: CWD volume 5-15% of live tree volume.
Significant Concern: CWD volume <5% of live tree volume.
Significant Concern Coarse woody debris was only 2% of live tree volume.
Unknown There was a lack of historic and/or long-term data (only one sampling event).
Forest regeneration Good: >96 seedlings per plot. Caution: 24 to 96 seedlings per plot. Significant Concern: <24 seedlings
per plot.
Significant Concern Mean of 0.3 seedlings per plot.
Unknown There was a lack of historic and/or long-term data (only one sampling event).
Invasive plants Good: <6.3% of park (<1.51 ha) covered by invasive vegetation.
Caution: 6.3 to 9.4% of park (1.5 to 2.26 ha) covered by invasive vegetation.
Significant Concern: >9.4% of park (>2.26 ha) covered by invasive vegetation.
Significant Concern 9.8% (2.36 ha) of the park was infested with invasive plants.
Unknown There was a lack of historic and/or long-term data.
Salt marsh vegetation
High salinity tolerant plants Good: >55% cover of community. Caution: 40-55% cover of community. Significant Concern: <40% cover of
community.
Good In recent surveys 74% to 98% of the community was composed of high salinity tolerant plants.
Stable to Unknown The condition remained unchanged in recent surveys, but there was a lack of historic and/or long-term data.
Medium salinity tolerant plants Good: <4% cover of community. Caution: 4-12% cover of community. Significant Concern: >12% cover of
community.
Good In recent surveys 0% of the community was composed of medium salinity tolerant plants.
Stable to Unknown The condition remained unchanged in recent surveys, but there was a lack of historic and/or long-term data.

129
Table 21. Summary of natural resource conditions for Sagamore Hill NHS (continued).
Natural Resource and Metric Benchmark Current Condition Trend
Low salinity tolerant plants Good: <2% cover of community. Caution: 2-20% cover of community. Significant Concern: >20% cover of
community.
Good In recent surveys 0% of the community was composed of low salinity tolerant plants.
Stable to Unknown The condition remained unchanged in recent surveys, but there was a lack of historic and/or long-term data.
Invasive plants Good: <1% cover of community. Caution: 1-20% cover of community. Significant Concern:>20% cover of
community.
Good In recent surveys 0% of the community was composed of invasive plants.
Stable to Unknown The condition remained unchanged in recent surveys, but there was a lack of historic and/or long-term data.
Managed field vegetation
Native grasses and forbs Good: >80% cover of community. Caution: 50-80% cover of community. Significant Concern: <50% cover of
community
Unknown The managed fields have not been surveyed.
Unknown The managed fields have not been surveyed.
Avian community
Total NETN avian guild -based species richness score
Good: >80th percentile (score >33.8). Caution: 50th-80th percentile (score
26-33.8). Significant Concern:>50th percentile
(score <26).
Significant Concern to
Unknown Of the 13 NETN avian guild metrics 1 ranked as Good, 6 ranked as Caution, and 6 ranked as Significant Concern. SAHI’s overall score was 21 and was the lowest of 11 NPS units compared. Last survey was over a decade ago and may not reflect the current community.
Unknown There was a lack of historic and/or long-term data (only one sampling event).

130
Table 21. Summary of natural resource conditions for Sagamore Hill NHS (continued).
Natural Resource and Metric Benchmark Current Condition Trend
Herpetofauna community
Amphibian species richness Good: >80% of species (≥6 species). Caution: 50% to 80% of species (5
species). Significant Concern: <50% of species
(≤4 species).
Caution toUnknown Five species were detected in 2002. Last survey was almost a decade ago and may not reflect current community.
Unknown There was a lack of historic and/or long-term data (only one sampling event).
Reptile species richness Good: >80% of species (≥7 species). Caution: 50% to 80% of species (6
species). Significant Concern: <50% of species
(≤5 species).
Significant Concern to
Unknown Five species were detected in 2002. Last survey was almost a decade ago and may not reflect current community.
Unknown to Declining There was a lack of historic and/or long-term data (only one sampling event). Anecdotal evidence that some reptiles (painted turtles) may have declined.
Mammal community
Mammal species richness Good: >80% of species (>24 species). Caution: 50% to 80% of species (15-
23 species). Significant Concern: <50% of species
(<15 species).
Caution 50% of species were observed in the park.
Unknown There was a lack of historic and/or long-term data (only one sampling event).
Odonate (dragonfly/damselfly) community
Odonate species richness Good: >80% of species (≥24 species). Caution: 50% to 80% of species (15-
23 species). Significant Concern: <50% of species
(≤14 species).
Caution 71% (22 species) of species were detected.
Unknown There was a lack of historic and/or long-term data (only one sampling event).

131
Table 21. Summary of natural resource conditions for Sagamore Hill NHS (continued).
Natural Resource and Metric Benchmark Current Condition Trend
Salt marsh nekton
Nekton community composition score
Good: Community composition score of 21-25.
Caution: Community composition score of 20-12.
Significant Concern: Community composition score of 11-5..
Significant Concern The overall nekton community score ranked as “poor” (score of 11) in recent surveys.
Stable to Possibly Declining Community scores were the same in both sampling events, although the relative abundance of resident and transient fish declined in the most recent survey.
Physical Integrity
Freshwater quality New York State water quality criteria for freshwater surface waters3.
Unknown The freshwater ponds at SAHI have not been monitored for water quality.
Unknown The freshwater ponds at SAHI have not been monitored for water quality.
Estuarine water quality New York State water quality criteria for marine waters3. Caution The estuarine waters
adjacent to SAHI have been listed as impaired for several uses for more than a decade.
Stable to Improving Estuarine water quality has been impaired for over a decade; however, steps are being taken (TMDL implemented) to improve water quality.
Geologic and coastal resources-shoreline change
The NCBN has not yet established benchmarks for shoreline change at SAHI.
Unknown to Caution The NCBN has not yet analyzed shoreline extent data. Historically, there have been modifications both to the north and to south of SAHI that may affect the SAHI shoreline.
Unknown The NCBN is currently conducting analyses to assess shoreline change.
Air quality - ozone
Ozone (human health standard)
Good: ≤ 60 ppb Moderate: 61-75 ppb Significant Concern: >76 ppb
Significant Concern Interpolated mean: 80.0 ppb
No Significant Trend

132
Table 21. Summary of natural resource conditions for Sagamore Hill NHS (continued).
Natural Resource and Metric Benchmark Current Condition Trend
Ozone (W126 ecological standard)
Good: < 7 ppm-hr Moderate: 7-13 ppm-hr Significant Concern: >13 ppm-hr
Caution Interpolated mean: 11.6 ppm-hr
Not Estimated4
Ozone (SUM06 ecological standard)
Good: < 8 ppm-hr Moderate: 8-15 ppm-hr Significant Concern: >15 ppm-hr
Caution Interpolated mean: 14.1 ppm-hr
Not Estimated4
Air quality - wet deposition
Total nitrogen wet deposition Good: 1 kg ha-1 yr-1 Moderate: 1-3 kg ha-1 yr-1 Significant Concern: > 3 kg ha-1 yr-1
Significant Concern Interpolated mean: 4.3 kg ha-1 yr-1
Not Estimated4
Total sulfur wet deposition Good: < 1 kg ha-1 yr-1 Moderate: 1-3 kg ha-1 yr-1 Significant Concern: > 3 kg ha-1 yr-1
Significant Concern Interpolated mean: 4.9 kg ha-1 yr-1
Not Estimated4
Air quality - visibility Good: > 8 dv Moderate: 2-8 dv Significant Concern: < 2 dv
Good
Interpolated mean: 10.3 dv
Not Estimated4
Night sky & natural lightscape Reference condition not available Unknown The night sky & natural lightscape have not been surveyed.
Unknown The night sky & natural lightscape have not been surveyed.
Soundscape Reference condition not available Unknown The soundscape has not been surveyed.
Unknown The soundscape has not been surveyed.
1 ALB: Asian longhorned beetle, BBD: Beech bark disease, BC: butternut canker, EAB: emerald ash borer, EHS: elongate hemlock scale, HWA: hemlock woolly adelgid SOD: sudden oak death. 2 DBH: Diameter at breast height. 3 Refer to Appendix C Table 1 and 2 for New York State water quality criteria. 4 NPS ARD did not estimate a trend for this metric at SAHI.

133
Appendix A: Raw Plant Data Appendix A Table 1. Vegetation observed at SAHI by nativity, state listed status (given after scientific name), and data source (year observed). State listed plants are indicated by bold type. A dash (-) indicates nativity status could not be determined. Names follow terminology of ITIS (2011) and PLANTS Database (USDA NRCS 2011).
Scientific Name`1 Common Name Nativity status NPS2 2004,
20092 20052 20082 20092
Acalypha gracilens Slender threeseed mercury Native X X Acalypha rhomboidea Virginia threeseed mercury Native X X3 Acer campestre Hedge maple Non-native X Acer palmatum Japanese maple Non-native X X X X Acer platanoides Norway maple Non-native X X X X Acer pseudoplatanus Sycamore maple Non-native X X Acer rubrum Red maple Native X X X X Acer saccharinum Silver maple Non-native X X Acer saccharum Sugar maple Native X X X Achillea millefolium Common yarrow Non-native X X Aesculus hippocastanum Horse chestnut Non-native4
X Aesculus species Buckeye species Non-native4
X Aethusa cynapium Fool’s parsley Non-native X X3
Agastache scrophulariifolia Purple giant hyssop Native X Ageratina altissima var. altissima White snakeroot Native X X Agrimonia gryposepala Tall hairy agrimony Native X Agrostis capillaris Colonial bentgrass Non-native X Agrostis gigantea Black bent Non-native X Agrostis perennans Autumn bentgrass Native X Ailanthus altissima Tree-of-heaven Non-native X X X Ajuga species Bugle species Non-native X Albizia julibrissin Mimosa Non-native X Alliaria petiolata Garlic mustard Non-native X X X X Alliaria species Alliaria species - X Allium vineale Wild garlic Non-native X X Amaranthus blitum Purple amaranth Non-native X X Amaranthus hybridus Slim amaranth Non-native X X Amaranthus retroflexus Redroot amaranth Non-native X X Amaranthus viridis Slender amaranth Non-native X Ambrosia artemisiifolia Annual ragweed Native X X Amelanchier arborea Downy serviceberry Native X Amelanchier canadensis Canadian serviceberry Native X X Amelanchier laevis Allegheny serviceberry Native X Amelanchier species Serviceberry species - X

134
Appendix A Table 1. Vegetation observed at SAHI, nativity, and state listed status (given after scientific name). State listed plants are indicated by bold type. A dash (-) indicates nativity status could not be determined. Names follow terminology of ITIS (2011) and PLANTS Database (USDA NRCS 2011) (continued).
Scientific Name`1 Common Name Nativity status NPS2 2004,
20092 20052 20082 20092
Ammophila breviligulata American beachgrass Native X X X X Ampelopsis brevipedunculata Amur peppervine Non-native X X X Anaphalis margaritacea Western pearlyeverlasting Native X Antennaria parlinii Parlin’s pussytoes Native X Antennaria plantaginifolia Woman’s tobacco Native X X Anthoxanthum odoratum Sweet vernalgrass Non-native X X Anthriscus sylvestris Wild chervil Non-native X Apocynum cannabinum Common dogbane Native X Arabidopsis lyrata ssp. lyrata Lyrate rockcress Non-native X Arabidopsis thaliana Mouse-ear cress Non-native X Aralia elata Japanese angelica tree Non-native X X X Aralia nudicaulis Wild sarsaparilla Native X X Aralia spinosa Devil’s walkingstick Native X X Arctium minus Lesser burrdock Non-native X Arctium species Burrdock Non-native X Arenaria serpyllifolia Thymeleaf sandwort Non-native X X Arisaema triphyllum Jack-in-the-pulpit Native X X Arrhenatherum elatius Tall oatgrass Non-native X Artemisia stelleriana Oldwoman Non-native X X3
Artemisia vulgaris Common wormwood Non-native X X Asclepias syriaca Common milkweed Native X X Asclepias tuberosa (EV) Butterfly milkweed Native X X Asparagus officinalis Garden asparagus Non-native X X Aster species Aster species - X Athyrium filix-femina (EV) Common lady fern Native X Athyrium filix-femina ssp. angustum Subartic ladyfern Native X Atriplex cristata Crested saltbush Native X X Atriplex mucronata Quelite Native X Atriplex patula Spear saltbush Native X X X Atriplex prostrata Triangle orache Non-native X X Avenella flexuosa Wavy hairgrass Native X Baccharis halimifolia Eastern baccharis Native X X X Barbarea vulgaris Yellow rocket Non-native X Bassia hirsuta Hairy smotherweed Non-native X Bassia hyssopifolia Fivehorn smotherweed Non-native X X X Berberis thunbergii Japanese barberry Non-native X X X Betula alleghaniensis Yellow birch Native X Betula lenta Sweet birch Native X X X X

135
Appendix A Table 1. Vegetation observed at SAHI, nativity, and state listed status (given after scientific name). State listed plants are indicated by bold type. A dash (-) indicates nativity status could not be determined. Names follow terminology of ITIS (2011) and PLANTS Database (USDA NRCS 2011) (continued).
Scientific Name`1 Common Name Nativity status NPS2 2004,
20092 20052 20082 20092
Betula populifolia Gray birch Native X X Betula species Birch species - X Bidens bipinnata Spanish needles Native X Bidens frondosa Devil’s beggarticks Native X Bidens species Beggarticks species - X X X Boehmeria cylindrica smallspike false nettle Native X X Bolboschoenus robustus Sturdy bulrush Native X X Bromus commutatus Hairy brome Non-native X Cakile edentula American searocket Native X X X Calamagrostis epigeios Chee reedgrass Non-native X Calystegia sepium Hedge false bindweed Native X Capsella bursa-pastoris Shepherd’s-purse Non-native X X3
Cardamine species Bittercress species - X Carex albicans var. albicans Whitetinge sedge Native X Carex annectens Yellowfruit sedge Native X Carex appalachica Appalachian sedge Native X Carex blanda Woodland sedge Native X Carex debilis var. rudgei White edge sedge Native X Carex digitalis Slender wood sedge Native X Carex laxiflora Broad looseflower sedge Native X Carex lurida Shallow sedge Native X Carex pensylvanica Pennsylvania sedge Native X X X Carex radiata Eastern star sedge Native X Carex rosea Rosy sedge - X Carex silicea Beach sedge Native X Carex species Sedge species - X Carex swanii Swan sedge Native X Carex virescens Ribbed sedge Native X Carya alba Mockernut hickory Native X X X X Carya glabra Pignut hickory Native X X X Carya species Hickory species - X X Castanea dentata American chestnut Native X X Catalpa bignonioides Southern catalpa Non-native X X3
Catalpa speciosa Northern catalpa Non-native X X X Celastrus orbiculatus Oriental bittersweet Non-native X X X X Celtis occidentalis Common hackberry Native X Centaurea stoebe ssp. micranthos Spotted knapweed Non-native X Cerastium fontanum Common chickweed Non-native X

136
Appendix A Table 1. Vegetation observed at SAHI, nativity, and state listed status (given after scientific name). State listed plants are indicated by bold type. A dash (-) indicates nativity status could not be determined. Names follow terminology of ITIS (2011) and PLANTS Database (USDA NRCS 2011) (continued).
Scientific Name`1 Common Name Nativity status NPS2 2004,
20092 20052 20082 20092
Cerastium fontanum ssp. vulgare Big chickweed Non-native X Chamaecyparis obtusa Hinoki false cypress Non-native X Chamaecyparis species Cedar species Non-native4
X Chamaesyce maculata Spotted spurge Native X X Chamaesyce polygonifolia Seaside spurge Native X X3
Chelidonium majus Celandine Non-native X X Chelidonium species Celandine species - X Chenopodium album Lambsquarters Non-native X X X Chimaphila maculate (EV) Spotted wintergreen Native X X Chimaphila species Prince’s pine species - X Cichorium intybus Chicory Non-native X X Circaea lutetiana Broad-leaf enchanter’s nightshade Native X Circaea lutetiana ssp. canadensis Broadleaf enchanter’s nightshade Native X Cirsium arvense Creeping thistle Non-native X Cirsium species Thistle species - X Cirsium vulgare Bull thistle Non-native X Clematis terniflora Sweet autumn virginsbower Non-native X Clethra alnifolia Coastal sweetpepperbush Native X Collinsonia canadensis Richweed Native X Commelina communis Asiatic dayflower Non-native X X Convallaria majalis European lily of the valley Non-native X X Convolvulus species Bindweed species - X Conyza canadensis Canadian horseweed Native X X Cornus alternifolia Alternateleaf dogwood Native X X X Cornus florida (EV) Flowering dogwood Native X X X X Corylus americana American hazelnut Native X X Crataegus monogyna Oneseed hawthorn Non-native4
X Crataegus uniflora (G5, S1, E) Dwarf hawthorn Native X Cynodon dactylon Bermudagrass Non-native X Cyperus esculentus Yellow nutgrass Non-native X Cyperus grayi Gray’s flatsedge Native X X Cyperus lupulinus spp. macilentus Great Plains flatsedge Native X Cyperus species Flatsedge species - X Cyperus strigosus Stawcolored flatsedge Native X Dactylis glomerata Orchardgrass Non-native X X Danthonia spicata Poverty danthonia Native X X Daucus carota Queen Anne’s lace Non-native X X Deutzia scabra Fuzzy pride-of-Rochester Non-native X
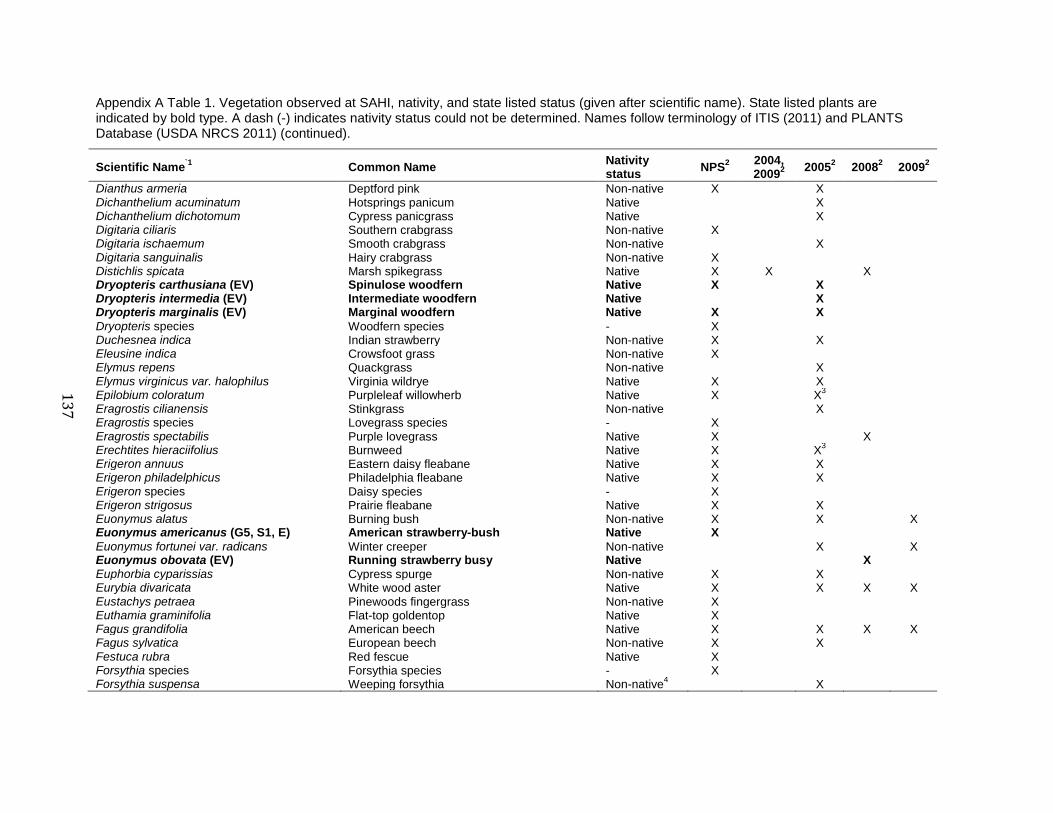
137
Appendix A Table 1. Vegetation observed at SAHI, nativity, and state listed status (given after scientific name). State listed plants are indicated by bold type. A dash (-) indicates nativity status could not be determined. Names follow terminology of ITIS (2011) and PLANTS Database (USDA NRCS 2011) (continued).
Scientific Name`1 Common Name Nativity status NPS2 2004,
20092 20052 20082 20092
Dianthus armeria Deptford pink Non-native X X Dichanthelium acuminatum Hotsprings panicum Native X Dichanthelium dichotomum Cypress panicgrass Native X Digitaria ciliaris Southern crabgrass Non-native X Digitaria ischaemum Smooth crabgrass Non-native X Digitaria sanguinalis Hairy crabgrass Non-native X Distichlis spicata Marsh spikegrass Native X X X Dryopteris carthusiana (EV) Spinulose woodfern Native X X Dryopteris intermedia (EV) Intermediate woodfern Native X Dryopteris marginalis (EV) Marginal woodfern Native X X Dryopteris species Woodfern species - X Duchesnea indica Indian strawberry Non-native X X Eleusine indica Crowsfoot grass Non-native X Elymus repens Quackgrass Non-native X Elymus virginicus var. halophilus Virginia wildrye Native X X Epilobium coloratum Purpleleaf willowherb Native X X3
Eragrostis cilianensis Stinkgrass Non-native X Eragrostis species Lovegrass species - X Eragrostis spectabilis Purple lovegrass Native X X Erechtites hieraciifolius Burnweed Native X X3
Erigeron annuus Eastern daisy fleabane Native X X Erigeron philadelphicus Philadelphia fleabane Native X X Erigeron species Daisy species - X Erigeron strigosus Prairie fleabane Native X X Euonymus alatus Burning bush Non-native X X X Euonymus americanus (G5, S1, E) American strawberry-bush Native X Euonymus fortunei var. radicans Winter creeper Non-native X X Euonymus obovata (EV) Running strawberry busy Native X Euphorbia cyparissias Cypress spurge Non-native X X Eurybia divaricata White wood aster Native X X X X Eustachys petraea Pinewoods fingergrass Non-native X Euthamia graminifolia Flat-top goldentop Native X Fagus grandifolia American beech Native X X X X Fagus sylvatica European beech Non-native X X Festuca rubra Red fescue Native X Forsythia species Forsythia species - X Forsythia suspensa Weeping forsythia Non-native4
X

138
Appendix A Table 1. Vegetation observed at SAHI, nativity, and state listed status (given after scientific name). State listed plants are indicated by bold type. A dash (-) indicates nativity status could not be determined. Names follow terminology of ITIS (2011) and PLANTS Database (USDA NRCS 2011) (continued).
Scientific Name`1 Common Name Nativity status NPS2 2004,
20092 20052 20082 20092
Forsythia x intermedia Showy forsythia Non-native4 X
Fragaria virginiana Virginia strawberry Native X Galinsoga parviflora Gallant soldier Non-native X Galinsoga quadriradiata Shaggy soldier Non-native X X Galium aparine Bedstraw Native X X Galium mollugo False baby’s breath Non-native X Galium species Bedstraw species - X Galium triflorum Fragrant bedstraw Native X Gaylussacia baccata Black huckleberry Native X X Geranium maculatum Spotted geranium Native X X Geum canadense White avens Native X X Glyceria striata Fowl mannagrass Native X Hedera helix English ivy Non-native X X X X Helianthus annuus Common sunflower Native X X3
Hemerocallis fulva Orange daylily Non-native X X Hibiscus moscheutos ssp. moscheutos Crimsoneyed rosemallow Native X Hieracium aurantiacum Orange hawkweed Non-native X Hieracium caespitosum Meadow hawkweed Non-native X X Hieracium paniculatum Panicled hawkweed Native X X Hieracium species Hawkweed species - X Hieracium vulgatum Common hawkweed Non-native X Hieracium x flagellaris Hawkweed Non-native X Hieracium x floribundum Hawkweed Non-native X Holcus lanatus Common velvetgrass Non-native X Hudsonia tomentosa Woolly beachheather Native X X Hydrangea species Hydrangea species Non-native4
X Hypericum perforatum Common St. Johnswort Non-native X Hypericum species St. Johnswort species - X Hypochaeris radicata Hairy catsear Non-native X X Ilex crenata Japanese holly Non-native X Ilex opaca (EV) American holly Native X X Ilex verticillata (EV) Common winterberry Native X Impatiens capensis Jewelweed Native X X X X Iva frutescens Jesuit’s bark Native X X X X Juglans nigra Black walnut Native X X X Juncus tenuis Poverty rush Native X X Juniperus virginiana Eastern redcedar Native X X X X

139
Appendix A Table 1. Vegetation observed at SAHI, nativity, and state listed status (given after scientific name). State listed plants are indicated by bold type. A dash (-) indicates nativity status could not be determined. Names follow terminology of ITIS (2011) and PLANTS Database (USDA NRCS 2011) (continued).
Scientific Name`1 Common Name Nativity status NPS2 2004,
20092 20052 20082 20092
Kalmia angustifolia (EV) Sheep laurel Native X Kalmia latifolia (EV) Mountain laurel Native X X Kochia scoparia Mexican fireweed Non-native X Lactuca biennis Tall blue lettuce Native X X Lactuca canadensis Canada lettuce Native X X Lamium amplexicaule Henbit deadnettle Non-native X X3
Lamium purpureum Purple deadnettle Non-native X Lapsana communis Common nipplewort Non-native X X Lechea maritima Beach pinweed Native X X Lemna minor Common duckweed Native X X Leonurus cardiaca Common motherwort Non-native X X Lepidium densiflorum Common pepperweed Non-native X X3
Lepidium species Pepperweed species - X Lepidium virginicum Virginia pepperweed Native X X Leucanthemum vulgare Oxeyedaisy Non-native X X Ligustrum amurense Amur privet Non-native X Ligustrum obtusifolium Border privet Non-native X X Ligustrum ovalifolium California privet Non-native4
X Ligustrum vulgare European privet Non-native X Limonium carolinianum (EV) Carolina sealavender Native X X X X Linaria vulgaris Butter and eggs Non-native X X Lindera benzoin Northern spicebush Native X X X X Liquidambar styraciflua Sweetgum Native X X Liriodendron tulipifera Tulip poplar Native X X X X Lolium perenne Perennial ryegrass Non-native X X Lonicera japonica Japanese honeysuckle Non-native X X X X Lonicera maackii Amur honeysuckle Non-native X Lonicera morrowii Morrow’s honeysuckle Non-native X X Lonicera species Honeysuckle species - X Lonicera tatarica Bush honeysuckle Non-native X Lonicera x bella Bell’s honeysuckle Non-native X Lotus corniculatus Birdfoot deervetch Non-native X Ludwigia palustris Marsh seedbox Native X X X Lunaria annua Annual honesty Non-native X Luzula multiflora spp. multiflora Common woodrush Native X Lysimachia nummularia Creeping jenny Non-native X Lythrum salicaria Purple loosestrife Non-native X X3 Magnolia macrophylla Bigleaf magnolia Non-native X

140
Appendix A Table 1. Vegetation observed at SAHI, nativity, and state listed status (given after scientific name). State listed plants are indicated by bold type. A dash (-) indicates nativity status could not be determined. Names follow terminology of ITIS (2011) and PLANTS Database (USDA NRCS 2011) (continued).
Scientific Name`1 Common Name Nativity status NPS2 2004,
20092 20052 20082 20092
Magnolia tripetala Umbrella magnolia Non-native4 X X Maianthemum canadense Canada mayflower Native X X X Maianthemum racemosum ssp. racemosum False Solomon’s seal Native X X X X Malus baccata Siberian crabapple Non-native X Malus pumila Paradise apple Non-native X Malva moschata Musk mallow Non-native X Malva neglecta Common mallow Non-native X X3
Medicago lupulina Black medick Non-native X X3
Melilotus officinalis Yellow sweet-clover Non-native X Mentha arvensis Wild mint Native X Mentha rotundifolia Bigleaf mint Non-native X Microstegium species Microstegium species - X Microstegium vimineum Japanese stiltgrass Non-native X X Mitchella repens Partridgeberry Native X Mollugo verticillata Green carpetweed Non-native X X Monarda punctata Spotted beebalm Native X Monotropa uniflora Indianpipe Native X X Morella pensylvanica (EV) Northern bayberry Native X X Morus alba White mulberry Non-native X X Morus rubra Red mulberry Native X Muhlenbergia schreberi Nimblewill muhly Native X X Muhlenbergia species Muhly species - X Narcissus species Daffodil species Non-native X Nuttallanthus canadensis Canada toadflax Native X Oenothera biennis Common evening-primrose Native X X Oenothera parviflora Northern evening-primrose Native X X3
Onoclea sensibilis Sensitive fern Native X X X Ornithogalum umbellatum Star-of-Bethlehem Non-native X X3
Osmorhiza longistylis Longstyle sweetroot Native X Osmorhiza species Sweetroot species - X Osmunda cinnamomea (EV) Cinnamon fern Native X Osmunda claytoniana (EV) Interrupted fern Native X Osmunda regalis var. spectabilis (EV) Royal fern Native X Oxalis stricta Common yellow oxalis Native X X Pachysandra procumbens Allegheny-spurge Non-native X Pachysandra terminalis Japanese pachysandra Non-native X X Panicum amarum (G5, S3, U) Bitter panicgrass Native X X X X
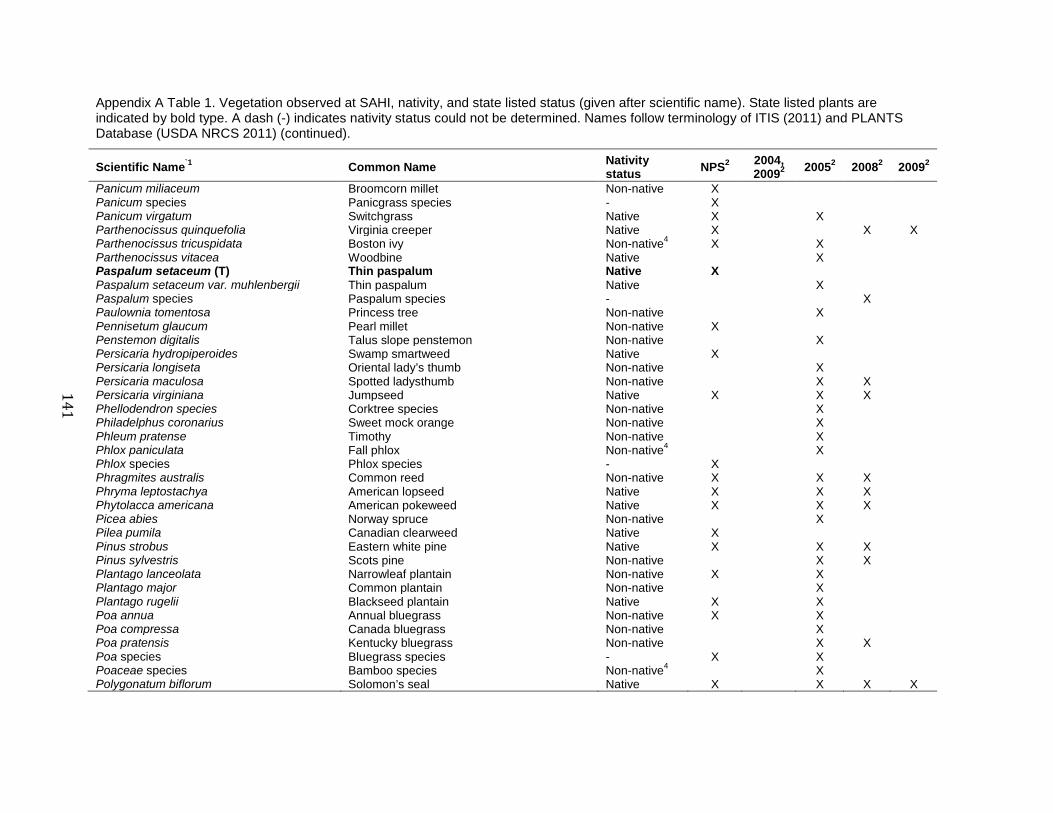
141
Appendix A Table 1. Vegetation observed at SAHI, nativity, and state listed status (given after scientific name). State listed plants are indicated by bold type. A dash (-) indicates nativity status could not be determined. Names follow terminology of ITIS (2011) and PLANTS Database (USDA NRCS 2011) (continued).
Scientific Name`1 Common Name Nativity status NPS2 2004,
20092 20052 20082 20092
Panicum miliaceum Broomcorn millet Non-native X Panicum species Panicgrass species - X Panicum virgatum Switchgrass Native X X Parthenocissus quinquefolia Virginia creeper Native X X X Parthenocissus tricuspidata Boston ivy Non-native4 X X Parthenocissus vitacea Woodbine Native X Paspalum setaceum (T) Thin paspalum Native X Paspalum setaceum var. muhlenbergii Thin paspalum Native X Paspalum species Paspalum species - X Paulownia tomentosa Princess tree Non-native X Pennisetum glaucum Pearl millet Non-native X Penstemon digitalis Talus slope penstemon Non-native X Persicaria hydropiperoides Swamp smartweed Native X Persicaria longiseta Oriental lady’s thumb Non-native X Persicaria maculosa Spotted ladysthumb Non-native X X Persicaria virginiana Jumpseed Native X X X Phellodendron species Corktree species Non-native X Philadelphus coronarius Sweet mock orange Non-native X Phleum pratense Timothy Non-native X Phlox paniculata Fall phlox Non-native4
X Phlox species Phlox species - X Phragmites australis Common reed Non-native X X X Phryma leptostachya American lopseed Native X X X Phytolacca americana American pokeweed Native X X X Picea abies Norway spruce Non-native X Pilea pumila Canadian clearweed Native X Pinus strobus Eastern white pine Native X X X Pinus sylvestris Scots pine Non-native X X Plantago lanceolata Narrowleaf plantain Non-native X X Plantago major Common plantain Non-native X Plantago rugelii Blackseed plantain Native X X Poa annua Annual bluegrass Non-native X X Poa compressa Canada bluegrass Non-native X Poa pratensis Kentucky bluegrass Non-native X X Poa species Bluegrass species - X X Poaceae species Bamboo species Non-native4 X Polygonatum biflorum Solomon’s seal Native X X X X

142
Appendix A Table 1. Vegetation observed at SAHI, nativity, and state listed status (given after scientific name). State listed plants are indicated by bold type. A dash (-) indicates nativity status could not be determined. Names follow terminology of ITIS (2011) and PLANTS Database (USDA NRCS 2011) (continued).
Scientific Name`1 Common Name Nativity status NPS2 2004,
20092 20052 20082 20092
Polygonatum pubescens Hairy Solomon’s seal Native X Polygonella articulata Coastal jointweed Native X X X Polygonum aviculare Prostrate knotweed Non-native X X Polygonum species Smartweed species - X Polystichum acrostichoides (EV) Christmas fern Native X X X Portulaca oleracea Common purslane Non-native X X Potentilla argentea Silver cinquefoil Non-native X X3
Potentilla canadensis Dwarf cinquefoil Native X Potentilla recta Sulphur cinquefoil Non-native X X Potentilla simplex Common cinquefoil Native X X Prenanthes species Rattlesnakeroot - X Prunella vulgaris Common selfheal Non-native X X Prunus avium Sweet cherry Non-native X X X Prunus serotina Black cherry Native X X X X Pteridium aquilinum Bracken fern Native X X Pteridium aquilinum var. latiusculum Bracken fern Native X Pyrola americana American wintergreen Native X X Pyrus communis Common pear Non-native X Quercus alba White oak Native X X Quercus bicolor Swamp white oak Native X Quercus coccinea Scarlet oak Native X X Quercus prinus Chestnut oak Native X X X Quercus rubra Northern red oak Native X X X X Quercus species Oak species - X X Quercus velutina Black oak Native X X X X Ranunculus abortivus Littleleaf buttercup Native X Ranunculus acris Tall buttercup Non-native X Ranunculus ficaria Fig buttercup Non-native X Ranunculus hispidus var. hispidus Bristly buttercup Native X Ranunculus recurvatus Blisterwort Native X Ranunculus repens Creeping buttercup Non-native X Ranunculus sceleratus Celeryleaf buttercup Native X Rhus copallina Dwarf sumac Native X Rhus copallinum Flameleaf sumac Native X X Rhus glabra Smooth sumac Native X Rhus hirta Staghorn sumac Native X X X Ribes rubrum Cultivated currant Non-native X X

143
Appendix A Table 1. Vegetation observed at SAHI, nativity, and state listed status (given after scientific name). State listed plants are indicated by bold type. A dash (-) indicates nativity status could not be determined. Names follow terminology of ITIS (2011) and PLANTS Database (USDA NRCS 2011) (continued).
Scientific Name`1 Common Name Nativity status NPS2 2004,
20092 20052 20082 20092
Robinia pseudoacacia Black locust Non-native X X X Rosa multiflora Multiflora rose Non-native X X X X Rosa rugosa Rugosa rose Native X Rubus allegheniensis Allegheny blackberry Native X X X Rubus flagellaris Northern dewberry Native X X3 Rubus occidentalis Black raspberry Native X X Rubus odoratus Purpleflowering raspberry Native X Rubus phoenicolasius Wine raspberry Non-native X X Rubus species Blackberry species - X Rudbeckia hirta Blackeyed Susan Native X Rudbeckia hirta var. pulcherrima Blackeyed Susan Non-native X X Rumex acetosella Common sheep sorrel Non-native X X Rumex crispus Curly dock Non-native X X Rumex obtusifolius Bitter dock Non-native X X Rumex species Dock species - X Ruppia maritima Widgeongrass Native X Sagina procumbens Procumbent pearlwort Non-native X Salicornia bigelovii (G5, S2S3, T) Dwarf saltwort Native X Salicornia depressa Virginia glasswort Native X X Salicornia maritima5 Slender glasswort - X Salicornia species Glasswort species - X Salix cinerea European gray willow Non-native X Salix discolor Pussy willow Native X Salsola kali Russian thistle Non-native X X Salsola kali ssp. pontica Russian thistle Non-native X Salsola tragus Prickly Russian thistle Non-native X Sambucus nigra ssp. canadensis American black elderberry Native X X Sanicula canadensis Canadian blacksnakeroot Native X Sarcocornia pacifica Perennial glasswort Native Sarcocornia perennis Chickenclaws Native X Sassafras albidum Sassafras Native X X X X Schedonorus arundinaceus Tall fescue Non-native X Schizachyrium scoparium Little bluestem Native X X Schoenoplectus pungens var. pungens Common threesquare Native X Securigera varia Crownvetch Non-native X Senecio vulgaris Common groundsel Non-native X Setaria faberi Giant foxtail Non-native X

144
Appendix A Table 1. Vegetation observed at SAHI, nativity, and state listed status (given after scientific name). State listed plants are indicated by bold type. A dash (-) indicates nativity status could not be determined. Names follow terminology of ITIS (2011) and PLANTS Database (USDA NRCS 2011) (continued).
Scientific Name`1 Common Name Nativity status NPS2 2004,
20092 20052 20082 20092
Setaria parviflora Marsh bristlegrass Native X X3 Setaria pumila Yellow bristle grass Non-native X Setaria viridis Green bristle grass Non-native X Silene latifolia Bladder campion Non-native X X Sisymbrium officinale Hairypod hedgemustard Non-native X Sisyrinchium angustifolium Narrowleaf blue-eyed grass Native X Sisyrinchium atlanticum Eastern blueeyed grass Native X X3
Smilax glauca Cat greenbrier Native X X Smilax rotundifolia Roundleaf greenbrier Native X X X X Smilax species Greenbrier species - X Solanum americanum American black nightshade Native X Solanum carolinense Carolina horsenettle Native X Solanum dulcamara Climbing nightshade Non-native X X Solanum ptychanthum Black nightshade Native X X Solidago bicolor Silverrod Native X Solidago caesia Wreath goldenrod Native X X X Solidago canadensis Canada goldenrod Native X Solidago canadensis var. hargeri Harger’s goldenrod Native X Solidago juncea Early goldenrod Native X X Solidago rugosa Wrinkleleaf goldenrod Native X X Solidago sempervirens Seaside goldenrod Native X X X X Solidago species Goldenrod species - X Solidago speciosa Showy goldenrod Native X X Sonchus species Sow thistle species Non-native X Spartina alterniflora Saltmarsh cordgrass Native X X X X Spartina patens Saltmeadow cordgrass Native X X X X Sporobolus cryptandrus Sand dropseed Non-native X Stellaria graminea Grassy starwort Non-native X X Stellaria media Common chickweed Non-native X X Suaeda calceoliformis Pursh seepweed Native X X X Suaeda linearis (G5, S1, E) Annual seepweed Native X Suaeda maritima Herbaceous seepweed Native X X X Suaeda species Seepweed species - X X Symphyotrichum cordifolium Common blue wood aster Native X Symphyotrichum lanceolatum White panicle aster Native X X Symphyotrichum lanceolatum var. lanceolatum
White panicle aster Native X

145
Appendix A Table 1. Vegetation observed at SAHI, nativity, and state listed status (given after scientific name). State listed plants are indicated by bold type. A dash (-) indicates nativity status could not be determined. Names follow terminology of ITIS (2011) and PLANTS Database (USDA NRCS 2011) (continued).
Scientific Name`1 Common Name Nativity status NPS2 2004,
20092 20052 20082 20092
Symphyotrichum lateriflorum var. lateriflorum Calico aster Native X Symphyotrichum undulatum Waxyleaf aster Native X Taraxacum officinale Common dandelion Non-native X X Taxus canadensis Canada yew Native X Taxus cuspidata Japanese yew Non-native4 X X X Teucrium canadense Germander Native X Thelypteris noveboracensis (EV) New York fern Native X X X Thelypteris palustris (EV) Eastern marsh fern Native X Thymus species Thyme species - X Tilia americana American basswood Native X X Tilia petiolaris Pendent silver linden Non-native X Tilia species Basswood species - X Toxicodendron radicans, Toxicodendron radicans spp. radicans Poison ivy Native X X X X X
Trichostema dichotomum Blue curls Native X Tridens flavus Purpletop tridens Native X X X Trifolium arvense Rabbitfoot clover Non-native X X Trifolium dubium Suckling clover Non-native X Trifolium hybridum Alsike clover Non-native X Trifolium pratense Red clover Non-native X X Trifolium repens White clover Non-native X X Triodanis perfoliata, Triodanis perfoliata var. perfoliata Clasping Venus’ looking-glass Native X X
Triplasis purpurea Purple sand grass Native X Ulmus americana American elm Native X Vaccinium corymbosum Highbush blueberry Native X Vaccinium pallidum Blueridge blueberry Native X Verbascum blattaria Moth mullein Non-native X X Verbascum thapsus Common mullein Non-native X X Verbena scabra Sandpaper vervain Native X Verbena species Vervain species - X Verbena urticifolia White vervain Native X X Vernonia gigantea (G5, S1, E) Giant ironweed Native X Veronica arvensis Corn speedwell Non-native X Veronica filiformis Slender speedwell Non-native X Veronica officinalis Common gypsyweed Non-native X X Veronica persica Birdeye speedwell Non-native X

146
Appendix A Table 1. Vegetation observed at SAHI, nativity, and state listed status (given after scientific name). State listed plants are indicated by bold type. A dash (-) indicates nativity status could not be determined. Names follow terminology of ITIS (2011) and PLANTS Database (USDA NRCS 2011) (continued).
Scientific Name`1 Common Name Nativity status NPS2 2004,
20092 20052 20082 20092
Veronica species Speedwell species - X Viburnum acerifolium Mapleleaf viburnum Native X X X X Viburnum dentatum Southern arrowwood Native X Viburnum dilatatum Linden arrowwood Non-native X X X Viburnum lentago Nannyberry Native X Viburnum opulus European cranberrybush Native X Viburnum opulus var. opulus European cranberrybush Non-native X Viburnum plicatum Japanese snowball Non-native X X Viburnum prunifolium Blackhaw Native X X Viburnum recognitum Northern arrow-wood Native X X Viburnum setigerum Tea viburnum Non-native4
X Viburnum sieboldii Siebold’s arrowwood Non-native X Viburnum species Viburnum species - X Vicia cracca Bird vetch Non-native X X Vicia sativa Garden vetch Non-native X Vicia tetrasperma Lentil vetch Non-native X Vinca major Bigleaf periwinkle Non-native X Vinca minor Common periwinkle Non-native X X Viola sororia Common blue violet Native X X Vitis aestivalis Summer grape Native X X Vitis species Grape species - X X Vulpia myuros Rattail fescue Non-native
X Wisteria floribunda Japanese wisteria Non-native4
X Wisteria japonica Summer wisteria Non-native4
X Wisteria sinensis Chinese wisteria Non-native4 X X X Zostera marina Eelgrass Native X 1 NY DEC State status and NY NHP codes (Young 2008, 2010, NY DEC 2011a, USDA NRCS 2011) E: endangered, EV: exploitably vulnerable, T: threatened, SC: special concern, U: Unprotected, but on Watch List; Global (G) and State (S) rank definitions: G4: Apparently secure rangewide (global) or in New York (state); G5: Demonstrably secure globally, though it may be quite rare; S2: Typically 6 to 20 occurrences, few remaining individuals, acres, or miles of stream, or factors demonstrably making it very vulnerable in New York State; S3:Typically 21 to 100 occurrences, limited acreage, or miles of stream in New York State; SH: Historically known from New York State, but not seen in the past 15 to 20 years. 2 Data sources: NPS: NPSpecies database (NPS 2010) includes Zaremba (1985), Dutton (1998), and Stalter (2000); 2004, 2009: NCBN salt marsh monitoring (James-Pirri 2005, Patenaude and Pooler 2010); 2005: Invasive species inventory (Werier 2006), 2008: NVC vegetation survey (Edinger et al. 2008); 2009: Mid-Atlantic Network forest vegetation monitoring (J. Comiskey, unpublished data, Program Manager, Mid-Atlantic network, National Park Service, email communication 4 November 2011) 3 Species observed by Werier (2006) in herbarium specimens only. 4 Species indicated by Werier (2006) as possible planted cultivars that had naturalized. 5 New York State is not within the geographic range of Salicornia maritima, so nativity could not be determined. This could be a mis-identification.

147
Appendix B: Raw Bird Data Appendix B Table 1. Avian species observed at SAHI, breeding status, habitat(s) where observed, NETN forest guild classification, and observation history. Bold type indicates state listed and Partners in Flight species (status given in parentheses after scientific name).
Scientific Name1,2 Common Name Breeding Status3
Habitat Where Observed4
NETN Forest Guild(s)5
CBC6 1900-2010
NYBBA7 2000-2005
Barton8 2003
Accipiter cooperii (V) Cooper’s Hawk - - - X Accipiter striatus (SC) Sharp-shinned hawk P R, W - X Actitis macularius Spotted sandpiper - M - X X Agelaius phoeniceus Red-winged blackbird C M, R, W O, S X X
Anas crecca Green-winged teal X Anas platyrhynchos Mallard L M, R - x X X
Anas rubripes (IIC) American black duck - M - X X Ardea alba (V) Great egret L M - X X Ardea herodias (V) Great blue heron C M - X X Aythya marila Greater scaup - M - X X
Aythya valisineria Canvasback - - - X Baeolophus bicolor Tufted titmouse C F, M, R, W LC, R, SB X X X Bombycilla cedrorum Cedar waxwing P R, W C, SB, R X X Branta canadensis Canada goose C M - X X Bubo virginianus Great horned owl L W - X X Bucephala albeola Bufflehead - M - X Bucephala clangula Common goldeneye - M - X Buteo jamaicensis Red-tailed hawk L M, R, W - X X X Butorides virescens Green heron C M, R - X X Calidris alba Sanderling - M - X Cardinalis cardinalis Northern cardinal C F, M, R, W O, R, S X X Carduelis pinus Pine siskin - M - X Carduelis tristis American goldfinch C F, M, R, W O, R, S, SB X X X Carpodacus mexicanus House finch L M, R, W E, R X X

148
Appendix B Table 1. Avian species observed at SAHI, breeding status, habitat(s) where observed, NETN forest guild classification, and observation history. Bold type indicates state listed and Partners in Flight species (status given in parentheses after scientific name) (continued).
Scientific Name1,2 Common Name Breeding Status3
Habitat Where Observed4
NETN Forest Guild(s)5
CBC6 1900-2010
NYBBA7 2000-2005
Barton8 2003
Carpodacus purpureus (IIA) Purple finch - W - X Cathartes aura Turkey vulture - - - X Catharus fuscescens Veery P R, W FG, IF, O, SB X X Catharus guttatus Hermit thrush - W - X
Certhia americana Brown creeper - - BP, IF, R, SB X Chaetura pelagica (IIA) Chimney swift L R SB X X Cistothorus palustris Marsh wren - M - X Clangula hyemalis Long-tailed duck/Oldsquaw - M - X X Coccyzus americanus Yellow-billed cuckoo - M, W - X X Coccyzus erythropthalmus (IA) Black-billed cuckoo - W - X Colaptes auratus Northern flicker C M, R, W GG X X Columba livia Rock dove P M, W E, O, R X X Contopus virens (IIA) Eastern wood-pewee L R, W C, SB X X Corvus brachyrhynchos American crow C F, M, R, W C, NP, O, R, SB X X X Corvus ossifragus Fish crow L M, R, W C, NP, O, R, SB X X Cyanocitta cristata Blue jay L F, M, R, W C, NP, O, R X X X Cygnus olor Mute swan - M - x X X Dendroica coronata Yellow-rumped warbler - M, R, W - X X Dendroica fusca (IIC) Blackburnian warbler - W - X Dendroica magnolia Magnolia warbler - W - X Dendroica palmarum Palm warbler - M, R, W - X Dendroica petechia Yellow warbler L M, R, W LC, S, SB X X Dendroica pinus Pine warbler P R, W BP, C, IF, SB X X Dendroica striata Blackpoll warbler - R, W - X Dendroica tigrina Cape May warbler - M, W - X

149
Appendix B Table 1. Avian species observed at SAHI, breeding status, habitat(s) where observed, NETN forest guild classification, and observation history. Bold type indicates state listed and Partners in Flight species (status given in parentheses after scientific name) (continued).
Scientific Name1,2 Common Name Breeding Status3
Habitat Where Observed4
NETN Forest Guild(s)5
CBC6 1900-2010
NYBBA7 2000-2005
Barton8 2003
Dendroica virens Black-throated green warbler - W - X
Dumetella carolinensis Gray catbird C M, R, W O, S X X
Egretta thula (V) Snowy egret L M - X X
Euphagus carolinus Rusty blackbird - M - X
Gallinago delicata Wilson’s snipe - M - X Gavia immer (SC) Common loon - M - X Gavia stellata Red-throated loon - M - X Geothlypis trichas Common yellowthroat P R, W LC, S X X Haliaeetus leucocephalus (V, T) Bald eagle - W - X Hirundo rustica Barn swallow C M, R SB X X Hylocichla mustelina (IA) Wood thrush C R, W O, S X X Icterus galbula (IA) Baltimore oriole C M, R, W C, SB, O X X Icterus spurius Orchard oriole L M, R, W C, O, SB X X Junco hyemalis Dark-eyed junco - M, R, W - X X Larus argentatus Herring gull P M - X X Larus atricilla Laughing gull P M - X Larus delawarensis Ring-billed gull P M - X X Larus marinus Great black-backed gull P M - X X Megaceryle alcyon Belted kingfisher P M, W - X X Megascops asio Eastern screech-owl L R, W - X X X Melanerpes carolinus Red-bellied woodpecker C F, M, R, W BP, R X X Meleagris gallopavo Wild turkey P M, R, W - X X Melospiza melodia Song sparrow L M, R, W O X X X Mergus serrator Red-breasted merganser - M - X X Mimus polyglottos Northern mockingbird C M, R, W O, R, S X X

150
Appendix B Table 1. Avian species observed at SAHI, breeding status, habitat(s) where observed, NETN forest guild classification, and observation history. Bold type indicates state listed and Partners in Flight species (status given in parentheses after scientific name) (continued).
Scientific Name1,2 Common Name Breeding Status3
Habitat Where Observed4
NETN Forest Guild(s)5
CBC6 1900-2010
NYBBA7 2000-2005
Barton8 2003
Mniotilta varia (IIA) Black-and-white warbler - R, W - X X Molothrus ater Brown-headed cowbird C M, R, NP, O X X Myiarchus crinitus Great crested flycatcher C R, W SB X X Nycticorax nycticorax (V) Black-crowned night heron L M - X X Pandion haliaetus (V, SC) Osprey L M - X X Parula americana Northern parula - R, W - X Passer domesticus House sparrow C M, R, W E, R X X X Passerina cyanea Indigo bunting P W O, S X X Phalacrocorax auritus Double-crested cormorant P M - X Phasianus colchicus Ring-necked pheasant - R, W - X X Picoides pubescens Downy woodpecker L R, W BP, R X X X Picoides villosus (IIA) Hairy woodpecker C R, W BP, IF, R x X Pipilo erythrophthalmus (IIA) Eastern towhee - W - X X Piranga olivacea (IA) Scarlet tanager P R, W C, HC, IF, SB X X Podilymbus podiceps (V, T) Pied-billed grebe - - - X Poecile atricapilla Black-capped chickadee C F, R, W LC, R, SB X X X Polioptila caerulea Blue-gray gnatcatcher - - C, HC, SB X Progne subis Purple martin - R - X X Quiscalus quiscula Common grackle L M, R, W O X X
Rallus limicola Virginia rail L M - X X Regulus calendula Ruby-crowned Kinglet - M, R, W - X Regulus satrapa Golden-crowned kinglet - W - X X Riparia riparia Bank swallow - - SB X Sayornis phoebe Eastern phoebe - M, R, W - X X Scolopax minor (IA) American woodcock - - - X

151
Appendix B Table 1. Avian species observed at SAHI, breeding status, habitat(s) where observed, NETN forest guild classification, and observation history. Bold type indicates state listed and Partners in Flight species (status given in parentheses after scientific name) (continued).
Scientific Name1,2 Common Name Breeding Status3
Habitat Where Observed4
NETN Forest Guild(s)5
CBC6 1900-2010
NYBBA7 2000-2005
Barton8 2003
Seiurus aurocapilla Ovenbird - W - X X Seiurus noveboracensis Northern waterthrush - W - X Setophaga ruticilla American redstart L W C, IF, LC, SB X X Sialia sialis Eastern bluebird - R - X X Sitta carolinensis White-breasted nuthatch L R, W BP, IF, R, SB X X X Sphyrapicus varius Yellow-bellied sapsucker - W - X X Spizella arborea American tree sparrow - M - X X Spizella passerina Chipping sparrow C R, W O, S X X
Spizella pusilla Field sparrow - - O X X Stelgidopteryx serripennis Northern rough-winged
swallow - - SB X Sterna antillarum (V, T) Least tern P M - X Sterna hirundo (V, T) Common tern P M - X Sturnus vulgaris European starling C F, M, R, W E, NP, O, R X X X Tachycineta bicolor Tree swallow P R SB X X Thryothorus ludovicianus Carolina wren C M, R, W LC, R X X Tringa melanoleuca Greater yellowlegs - M - X Troglodytes aedon House wren L R, W LC X X Troglodytes troglodytes Winter wren - W - X Turdus migratorius American robin C M, R, W O, S X X X Tyrannus tyrannus Eastern kingbird C M, R, W C, SB X X Vermivora pinus (IA) Blue-winged Warbler - - LC, SB X Vireo flavifrons Yellow-throated vireo - W - X X
Vireo gilvus Warbling vireo L R, W C, HC, SB X X Vireo griseus White-eyed vireo P R, W LC, S, SB X X Vireo olivaceus Red-eyed vireo L M, R, W HC, S, SB X X

152
Appendix B Table 1. Avian species observed at SAHI, breeding status, habitat(s) where observed, NETN forest guild classification, and observation history. Bold type indicates state listed and Partners in Flight species (status given in parentheses after scientific name) (continued).
Scientific Name1,2 Common Name Breeding Status3
Habitat Where Observed4
NETN Forest Guild(s)5
CBC6 1900-2010
NYBBA7 2000-2005
Barton8 2003
Vireo solitarius Blue-headed vireo - W - X Zenaida macroura Mourning dove C M, R, W C, R X X Zonotrichia albicollis White-throated sparrow - M, R, W - X X 1 Partners in Flight (PIF) status: IA: High Continental Priority, High Regional Responsibility; II: High Regional Priority (wintering species); IIA: High Regional Priority, High Regional
Concern; IIC: High Regional Priority, High Regional Threat; V: Additional State Listed (Dettmers and Rosenberg 2000). 2 New York State listed status: E: endangered, T: threatened; SC: special concern (NY DEC 2011a) 3 Breeding status codes (after Barton 2005): C: confirmed breeding in park; L: likely breeds in park; P: possibly breeds in park; “-“ does not breed in park or breeding status
unknown. 4 Habitats where observed: M: marsh/estuary, includes salt marsh, beach, and open water habitats; R: residential-landscaped area includes; W: woodlands, includes mature forest
and successional forest habitats (after Barton 2005). “-“ habitat where observed not available. 5 NETN Forest Guilds for birds breeding in the park: BP: bark prober forager, C: canopy nester, E: exotic; FG: forest-ground nester, GG: ground gleaner forager, HC: high canopy
forager, IF: interior forest obligate nester, LC: low canopy forager, NP: nest predator, O: omnivore, R: resident, S: shrub nester, SB: single brooded; NETN grassland guilds: EG: edge generalist; E: exotic; GO: grassland obligate; SD: shrub dependent; “-“: not a forest breeding bird (after Faccio et al. 2010).
6 Data source:, National Audubon Society (2011) Christmas Bird Counts for Mill Neck, NY (count circle: NY3B) and Huntington, NY (count circle: NY37) from 1900 to 2010 (counts 1 to 103).
7 Data source: NY DEC (2011b) Breeding Bird Atlas 2000-2005 data, census block 6252A. 8 Data source: Barton 2005.

153
Appendix C: Water Quality Data and Standards Appendix C Table 1. New York (NY DEC 2011c) narrative surface water quality standards. “n/a”: not applicable.
Parameter Waterbody Classes Standard Fresh Marine Taste-, color-, and odor producing, toxic and other deleterious substances
A, B, C SA, SB, SC None in amounts that will adversely affect the taste, color or odor thereof, or impair the waters for their best usages.
Turbidity A, B, C SA, SB, SC No increase that will cause a substantial visible contrast to natural conditions.
Suspended, colloidal and settleable solids
A, B, C SA, SB, SC None from sewage, industrial wastes or other wastes that will cause deposition or impair the waters for their best usages.
Oil and floating substances
AA, A, B, C SA, SB, SC No residue attributable to sewage, industrial wastes or other wastes, nor visible oil film nor globules of grease.
Garbage, cinders, ashes, oils, sludge and other refuse
n/a SA, SB, SC None in any amounts.
Phosphorus and nitrogen
A, B, C SA, SB, SC None in amounts that will result in growths of algae, weeds and slimes that will impair the waters for their best usages.
Thermal discharges AA, A, B, C SA, SB, SC Details in 6 NYCRR Part 704 (NY DEC 2011).
Flow A, B, C n/a No alteration that will impair the waters for their best usages.

154
Appendix C Table 2. New York (NY DEC 2011c) numerical surface water quality standards.
Parameter Waterbody Classes Standard
pH-freshwater A, B, C Shall not be less than 6.5 nor more than 8.5.
pH-saltwater SA, SB, SC The normal range shall not be extended by more
than one-tenth (0.1) of a pH unit.
Dissolved oxygen (DO)-freshwater
A, B, C For trout spawning waters, the DO concentration shall not be less than 7.0 mg L-1 from other than natural conditions. For trout waters, the minimum daily average shall not be less than 6.0 mg L-1, and at no time shall the concentration be less than 5.0 mg L-1. For non-trout waters, the minimum daily average shall not be less than 5.0 mg L-1, and at no time shall the DO concentration be less than 4.0 mg L-1.
Dissolved oxygen (DO)-saltwater
SA, SB, SC Chronic: Shall not be less than a daily average of 4.8 mg L-1 Acute: Shall not be less than 3.0 mg L-1 at any time.
Dissolved solids-freshwater
A, B, C Shall be kept as low as practicable to maintain the best usage of waters but in no case shall it exceed 500 mg L-1.
Total coliforms (number per 100 ml)-freshwater/saltwater
A, B, C, D, SB, SC The monthly median value and more than 20 percent of the samples, from a minimum of five examinations, shall not exceed 2,400 and 5,000, respectively.
Total Coliforms (number per 100 ml)-saltwater
SA The median most probable number (MPN) value in any series of representative samples shall not be in excess of 70.
Fecal Coliforms (number per 100 ml)-freshwater/saltwater
A, B, C, SB, SC The monthly geometric mean, from a minimum of five examinations, shall not exceed 200.

155
Literature Cited (Appendixes)
Barton, H. 2005. Avian inventory of Sagamore Hill National Historical Site. Natural Resources Report NPS/NER/NRTR—2008/119. National Park Service, Northeast Region. Philadelphia, Pennsylvania.
Dettmers R., and K. Rosenburg. 2000. Draft Partners in Flight landbird conservation plan: Physiographic Area 9: Southern New England. Version 1.0, October 2000. American Bird Conservancy, Ithaca, New York.
Dutton, B. 1998. Sagamore Hill National Historic Site vascular plant survey, April 1998. National Park Service, as listed in NPSspecies Database. http://science.nature.nps.gov/im/apps/npspp/ (accessed 6 May 2010).
Edinger, G. J., A. L. Feldmann, T. G. Howard, J. J. Schmid, E. Eastman, E. Largay, and L. A. Sneddon. 2008. Vegetation classification and mapping at Sagamore Hill National Historic Site, New York. Technical Report NPS/NER/NRTR—2008/124. National Park Service, Philadelphia, Pennsylvania.
Faccio, S., B. R. Mitchell, and P. S. Pooler. 2010. Breeding landbird monitoring protocol: Northeast Temperate Network. Natural Resource Report NPS/NETN/NRR—2010/198. National Park Service, Fort Collins, Colorado.
James-Pirri, M. J. 2005. Implementing long-term monitoring of salt marsh communities within the Northeast Coastal and Barrier Network of the National Park Service, Year 2: Monitoring at Boston Harbor Islands National Park Area, Cape Cod National Seashore, Gateway National Recreation Area, and Sagamore Hill National Historic Site. February 2005, Progress Report to National Park Service, Northeast Coastal and Barrier Network, Kingston, Rhode Island.
Integrated Taxonomic Information System (ITIS). http://www.itis.gov/ (accessed 21 October 2011).
National Audubon Society. 2011. Christmas Bird Count website. http://birds.audubon.org/christmas-bird-count (accessed 11 July 2011).
National Park Service (NPS). 2010. NPSspecies Database. http://science.nature.nps.gov/im/apps/npspp/ (accessed 6 May 2010).
New York Department of Environmental Conservation (NY DEC). 2011a. List of endangered, threatened and special concern fish and wildlife species of New York State. http://www.dec.ny.gov/animals/7494.html (accessed 6 July 2011).
New York Department of Environmental Conservation (NY DEC). 2011b. Google Maps and Earth, Breeding Bird Atlas: Eastern and Southern NY. http://www.dec.ny.gov/pubs/42978.html (accessed 7 July 2011).

156
New York Department of Environmental Conservation (NY DEC). 2011c. Regulations, Chapter X- Division of Water, Part 703: Surface water and groundwater quality standards and groundwater effluent limitations. http://www.dec.ny.gov/regs/4590.html (accessed 10 August 2011).
Patenaude, E. L., and P. S. Pooler. 2010. Salt marsh vegetation and nekton community monitoring at Sagamore Hill National Historical Site: 2009 summary report. Natural Resource Data Series NPS/NCBN/NRDS—2010/067. National Park Service, Fort Collins, Colorado.
Stalter, R. 2000. Annotated checklist of the vascular plants of Sagamore Hill National Historic Site, New York. National Park Service, as listed in NPSspecies Database.
USDA NRCS. 2011. The PLANTS Database National Plant Data Team, Greensboro, North Carolina. http://plants.usda.gov (accessed 3 October 2011).
Werier, D. 2006. Sagamore Hill National Historic Site invasive non-native plant management plan. Technical Report NPS/NER/NRTR—2006/045. National Park Service. Boston, Massachusetts.
Young, S. M. 2008. New York Rare Plant Status Lists. New York Natural Heritage Program. Albany, New York.
Young, S. M. 2010. New York Rare Plant Status Lists. New York Natural Heritage Program, Albany, New York.
Zaremba, R. 1985. Sagamore Hill Species List (Flora). National Park Service, as listed in NPSspecies Database. http://science.nature.nps.gov/im/apps/npspp/ (accessed 6 May 2010).

The Department of the Interior protects and manages the nation’s natural resources and cultural heritage; provides scientific and other information about those resources; and honors its special responsibilities to American Indians, Alaska Natives, and affiliated Island Communities. NPS 419/119622, January 2013

National Park Service U.S. Department of the Interior
Natural Resource Stewardship and Science 1201 Oakridge Drive, Suite 150 Fort Collins, CO 80525 www.nature.nps.gov
EXPERIENCE YOUR AMERICA TM