Natural Hazards, 2e Climate and Climate Change Chapter 11.
66
Natural Hazards, 2e Climate and Climate Change Chapter 11
-
Upload
theodore-esco -
Category
Documents
-
view
216 -
download
3
Transcript of Natural Hazards, 2e Climate and Climate Change Chapter 11.

Natural Hazards, 2e
Climate and Climate ChangeChapter 11

Learning Objectives Understand the difference between climate and
weather, and how their variability is related to natural hazards
Know the basic concepts of atmospheric science such as structure, composition, and dynamics of the atmosphere
Understand how climate has changed during the last million years, through glacial and interglacial conditions, and how human activity is altering our current climate
Learning Objectives, cont. Understand the potential causes of climate
change
Know how climate change is related to natural hazards
Know the ways we may mitigate climate change and associated hazards
Climate and Weather Weather refers to atmospheric conditions over
short periods of time.
Climate refers to characteristic atmospheric conditions over a long period of time.
Climate zones Defined using Koeppen System
Uses monthly average temperature and precipitation associated with different types of vegetation

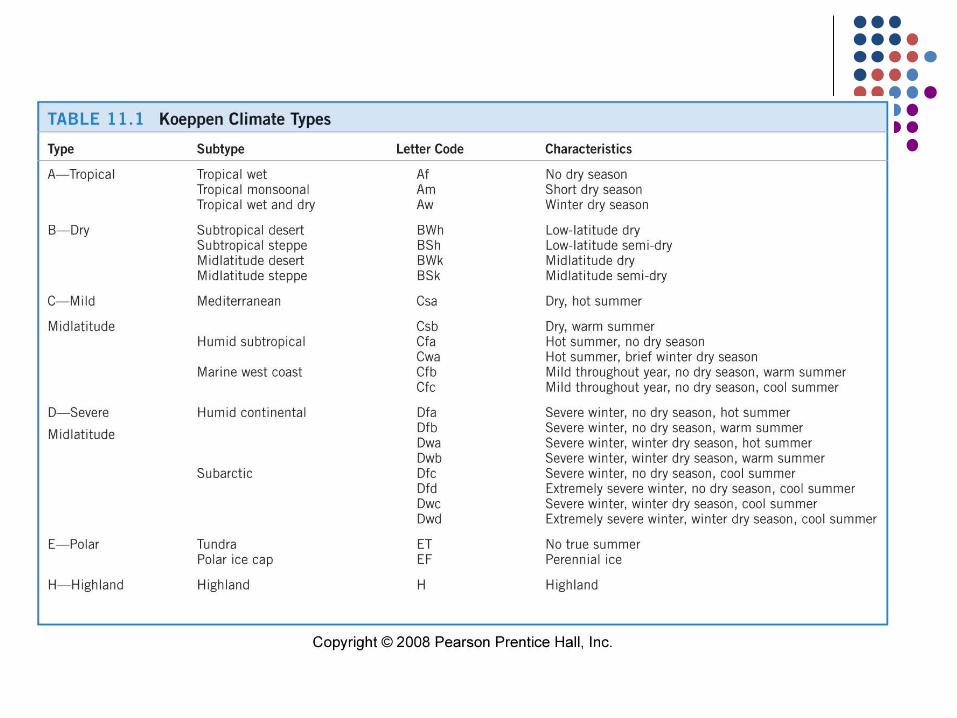
Koeppen’s Classification System A-tropical, temp>18oC (64oF) year round
B-Dry, evaporation > precipitation
C- Mild Mid-latitude, 18oC (64oF)>coldest month> -3oC (27oF)
D- Severe Mid-latitude, coldest month< -3oC (27oF)
E – Polar, temp < -3oC (27oF) year round
H-Highland, Mountain areas

Atmospheric Conditions
Permanent gasses Gasses whose
proportions stay constant
Ex. Nitrogen
Variable gasses Gasses whose
proportions vary with time and space
Ex. Carbon dioxide
Permanent Gasses Percentages in atmosphere remain essentially
constant
Nitrogen, oxygen, and argon
Compose approx. 99% by volume
Relatively unimportant to atmospheric dynamics
Variable Gasses – Carbon Dioxide (CO2)
Extremely important, but small in percentage (approx. 0.038%) Describe in parts per million (ppm) or billion (ppb)
Released naturally by volcanic activity, plant and animal respiration, decay of organic material
Removed through photosynthesis, chemical weathering in soil, and mixing of air and seawater

Variable Gasses – Carbon Dioxide (CO2), cont.
Anthropogenic sources Burning of fossil fuels increases CO2 . Deforestation decreases amount used by trees,
increasing ppm in atmosphere.
Natural processes that remove CO2 don’t work as rapidly as amounts are increasing.
Levels increase by 2 ppm per year.
Variable Gasses – Water Vapor Created from evaporation at Earth’s surface.
Returns to surface through hydrologic cycle.
Air temperature is primary control of water vapor content.
Variable Gasses – Ozone O3
Forms when atomic oxygen (O) collides with oxygen molecule (O2)
Mostly found in stratosphere
Acts as a shield for ultraviolet light and is essential to life on earth
Chlorofluorocarbons (CFCs) partially destroyed ozone shield Increases skin cancer, cataracts, caused local crop failures
Can also be found in smog
Variable Gasses – Methane (CH4)
Primary constituent of natural gas
Occurs naturally from bacterial decay, intestinal tracks of termites, cows, and sheep
Anthropogenic sources: coal mines, oil wells, leaking natural gas pipelines, rice cultivation, landfills, and livestock
Levels have doubled since 1700 and is a significant contributor to warming

Variable Gasses – Nitrous Oxide (N2O)
Natural sources include microbiological processes in soil and ocean and wildfires.
Anthropogenic sources include fertilizers and burning fossil fuels.
Contributes to atmospheric warming.
Variable Gasses – Halocarbons Chemical compounds containing halogen
elements bonded with carbon
Include CFCs and are almost entirely anthropogenic
Used in industrial processes, fire fighting, and as fumigants, refrigerants, and propellants
Contribute to warming in troposphere and ozone depletion in stratosphere
Aerosols Microscopic liquid or solid particle that acts as
nuclei for water particles to condense to form clouds
Associated with air pollution
Natural sources: desert dust, wildfires, sea spray, and volcanoes
Anthropogenic sources: burning of forests and fossil fuels
Effects are complex

Structure of Atmosphere, revisited Defined by changes in
air temperature
Troposphere is where weather happens
Stratosphere dry, cold layer Little weather occurs
here Strong winds circulate
aerosolsFigure 8.7
Atmospheric Circulation Responsible for location of climate zones
At equator, warm air rises towards poles As it rises, it cools and loses moisture as rain
Dry air descends between 15o and 30o North and South Descending air produces high pressure and low rainfall
High pressures at North and South Poles Polar deserts
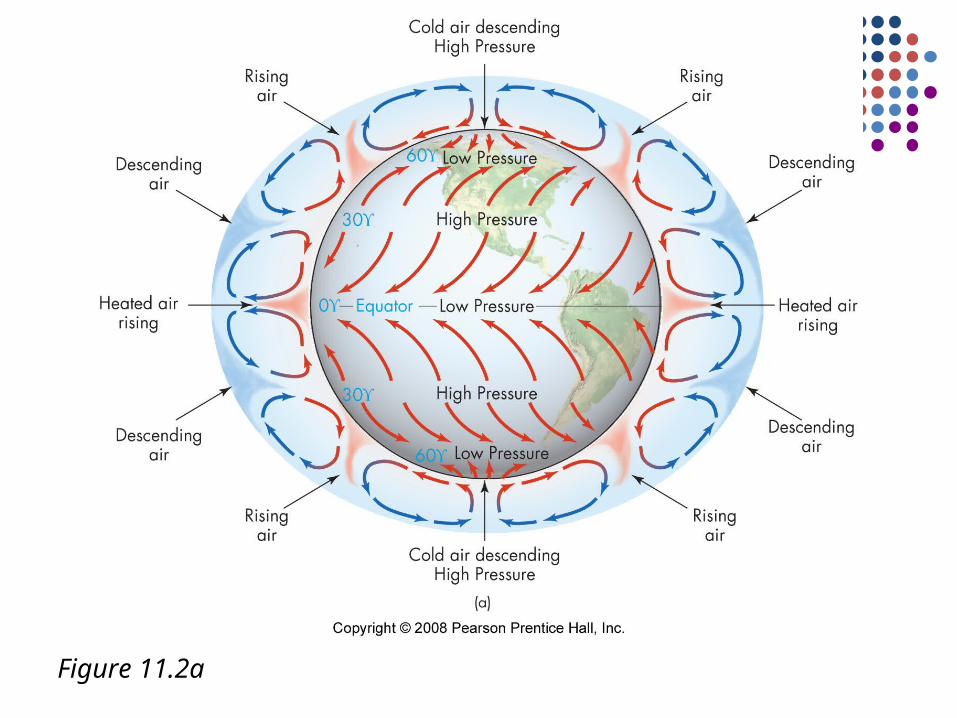
Figure 11.2a
Climate Change Currently, the climate is warming
Based on 30 years of warming in atmosphere Also, global increase in sea temp, widespread melting of snow,
glaciers, ice sheets, and permafrost, and sea level rise
Referred to as global warming 90% probability that humans are responsible Ecosystems capable of adjusting, but changes are too fast for
these to take place
Studies changes in atmosphere and linkages with lithosphere, cryosphere, hydrosphere, and biosphere

Cryosphere Part of the hydrosphere where most of the water is
frozen
Includes permafrost, sea ice, ice caps, glaciers, and ice sheets
Glaciers Flow from high to low elevations under weight of
accumulated ice Have budgets with input and output Periods of continental glaciation called glacial intervals
Interglacial intervals occur in between

Glaciations Refer to multiple advances and retreats of
glaciers.
Rare during the earth’s 4.6 billion year history.
Several in the last 1 billion years.
We are now living during one of those events that began 2.5 million years ago.
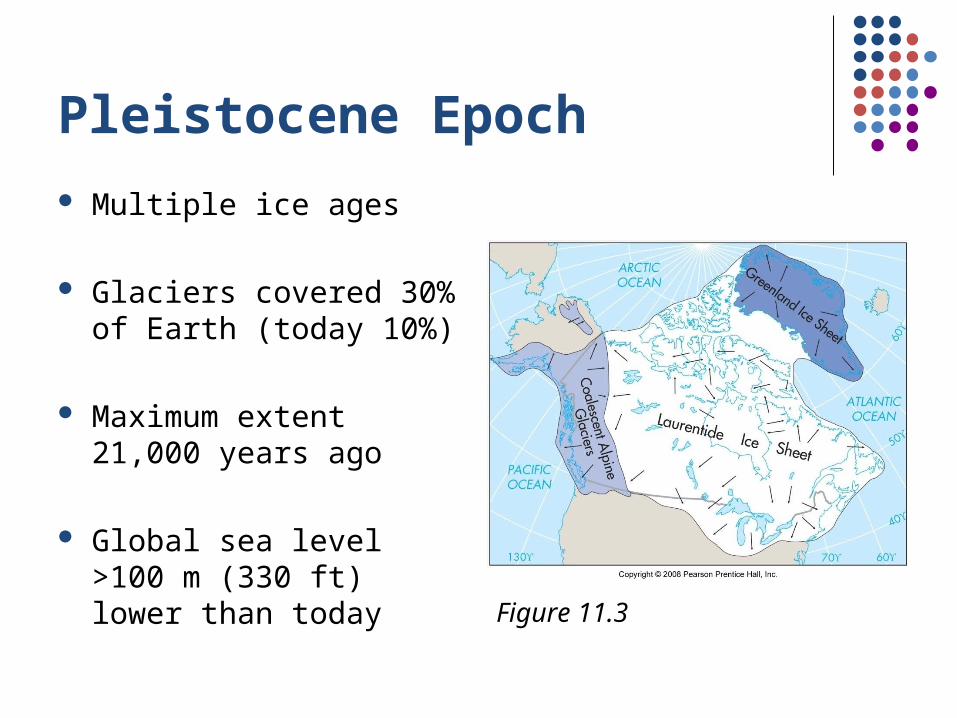
Pleistocene Epoch Multiple ice ages
Glaciers covered 30% of Earth (today 10%)
Maximum extent 21,000 years ago
Global sea level >100 m (330 ft) lower than today
Figure 11.3

Causes of Glaciation Mostly unknown
Related to position of continents
Changes in amount of solar radiation influence advance and retreat Milankovitch cycles Changes in Earth’s orbit around Sun, tilt and wobble of
Earth’s axis of rotation Correlate well with minor changes in global temperatures
Explain the “Medeival Warming Period” and the “Little Ice Age” They are not the primary cause of glaciation or global
temperature changes.

Glacial Hazards Huge, actively flowing masses of ice and debris
Hazards include: property damage, injuries, and deaths People can fall into deep crevasses. Can expand to overrun villages, etc. Produce an ice jam to cause flooding. Blocks of ice may fall. Calving produces icebergs in ocean.

The Greenhouse Effect Discovered by Joseph Fourier in 1824: the Sun’s
energy passes through, but reradiated heat is absorbed by, Earth’s atmosphere.
Fourier also described the planetary balance of heat gain and loss ( the “heat budget”)
The greenhouse effect was first reliably experimented on by John Tyndall in the year 1858 and first reported quantitatively by Svante Arrhenius in his 1896 paper.
The mathematics were first proposed by Jožef Stefan in 1879, based on experiments by John Tyndall.
Thermodynamic formulas describing the effects of greenhouse gas concentrations of the heat balance of Earth were developed by Ludwig Boltzmann, 1884.

The Greenhouse Effect In 1896, Swedish scientist Svante Arrhenius was the
first to claim that fossil fuel combustion may eventually result in enhanced global warming.
He proposed a relation between atmospheric carbon dioxide concentrations and temperature.
He found that the average surface temperature of the earth is about 15oC because of the infrared absorption capacity of water vapor and carbon dioxide.
This is called the natural greenhouse effect.
The Greenhouse Effect Arrhenius suggested a doubling of the CO2
concentration would lead to a 5oC temperature rise.
He and Thomas Chamberlin calculated that human activities could warm the earth by adding carbon dioxide to the atmosphere.
This research was a by-product of research of whether carbon dioxide would explain the causes of the great Ice Ages.
This was not actually verified until 1987.
In 1972, eminent atmospheric scientist J.S. Sawyer summarized what was known about the role of carbon dioxide in enhancing the natural greenhouse effect, and made a remarkable prediction of the warming expected at the end of the twentieth century. He concluded that the 25% increase in atmospheric carbon dioxide predicted to occur by 2000 corresponded to an increase of 0.6 °C in world temperature. (Nature 239, 23-26; 1972).
In 1988, NASA scientist Jim Hansen gave congressional testimony showing model projections of continued global warming. In spite of being one of the earliest transient climate model experiments, there is an impressive match between the recently observed data and Hansen’s projections.
The Greenhouse Effect
Scientific Agreement By the early 1990’s, climatologists generally agreed that
humans were making significant contributions to climate change.
In 1995, the National Academy of Sciences reported that the research strongly supported anthropogenic warming. By this time, the burden of proof had now shifted to scientists who disagreed with these findings.
Since this time, the research has not provided evidence to refute the basic findings. On the contrary, thousands of papers have been published providing further evidence of anthropogenic warming.
Since 2007, no scientific body of national or international standing has maintained a dissenting opinion.
In a recent University of Illinois at Chicago survey sent to 10,257 Earth Scientists, 97.4% of the climatologists who responded answered "yes" when asked "do you think human activity is a significant contributing factor in changing mean global temperatures?"

The Greenhouse Effect
Earth’s temperature depends on three things:1. Amount of sunlight received
• Most is ultraviolet with short wavelength• About 2/3 is absorbed to warm the atmosphere
2. Amount of sunlight reflected• Mostly reflected as infrared radiation
3. Degree to which the atmosphere retains heat• Water vapor, carbon dioxide, methane, nitrous oxides,
and halocarbons absorb IR radiation• Gasses act as “blanket” to retain heat in troposphere

Figure 11.5
The Greenhouse Effect, cont. Greenhouse effect is a natural and necessary
process. Earth would be 33o colder without it. All surface water would be frozen. Little life would exist. Natural effect is from water vapor.
Absorption by greenhouse gasses (carbon dioxide, methane, nitrous oxide, halocarbons) Enhance the greenhouse effect
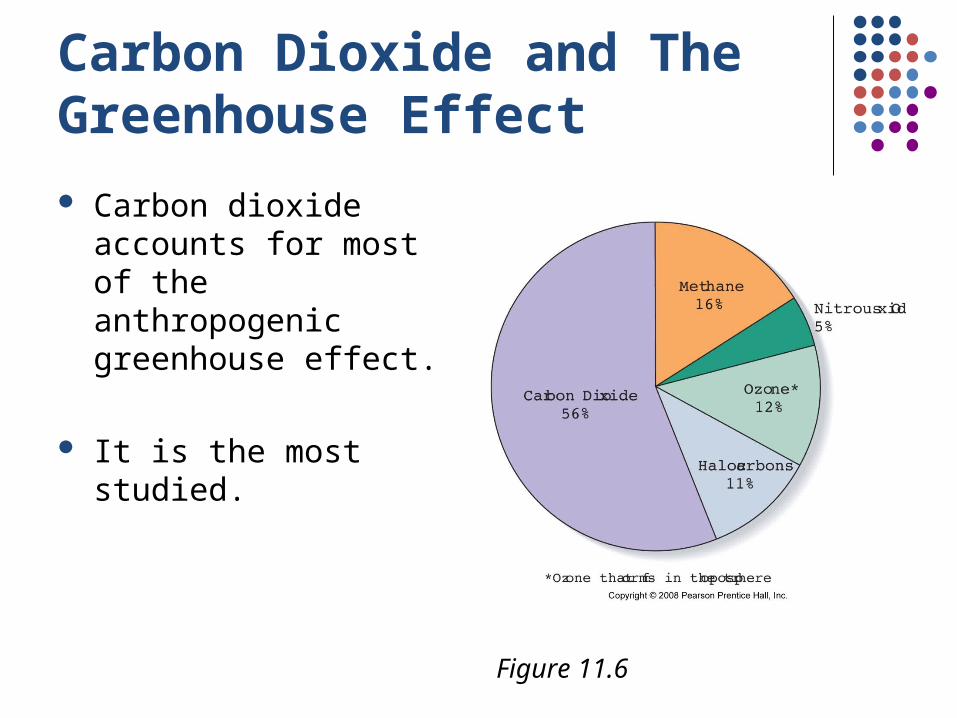
Carbon Dioxide and The Greenhouse Effect Carbon dioxide
accounts for most of the anthropogenic greenhouse effect.
It is the most studied.
Figure 11.6
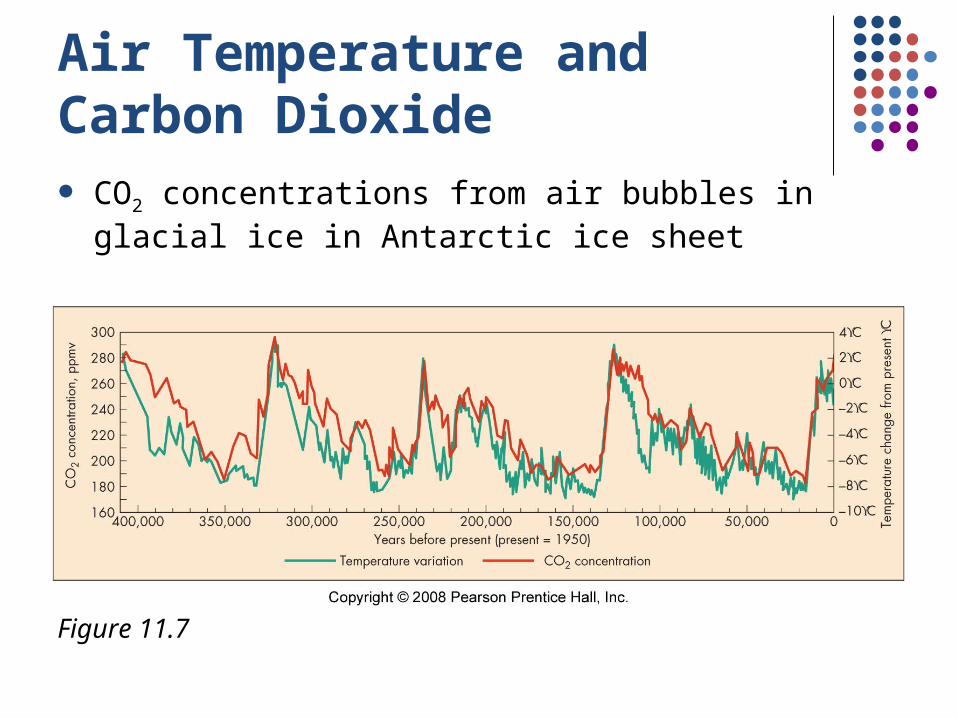
Air Temperature and Carbon Dioxide CO2 concentrations from air bubbles in glacial
ice in Antarctic ice sheet
Figure 11.7
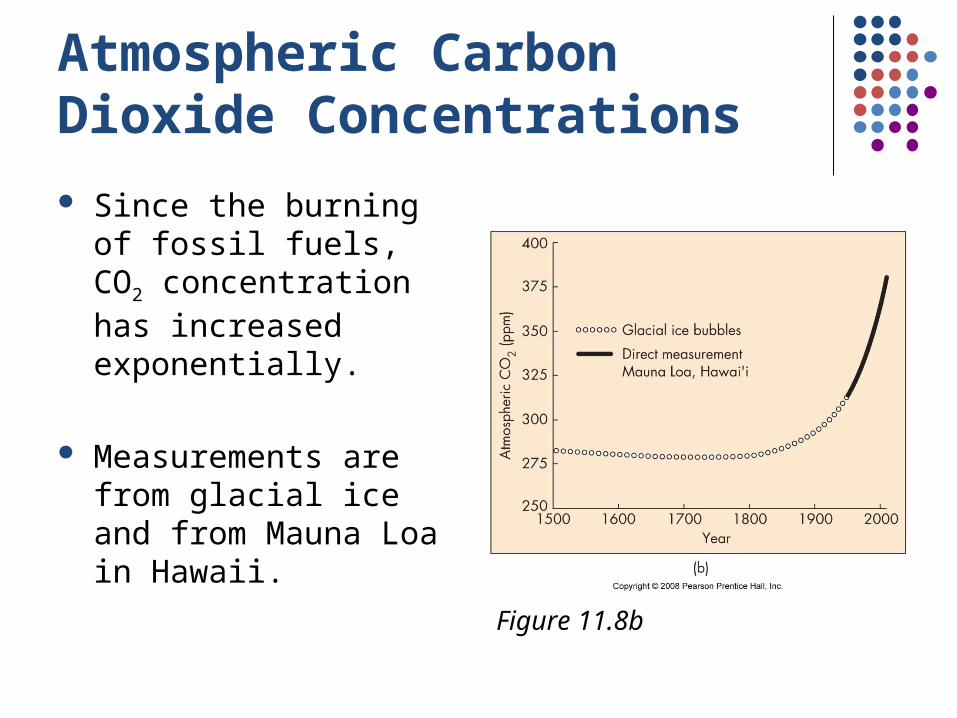
Atmospheric Carbon Dioxide Concentrations Since the burning of
fossil fuels, CO2 concentration has increased exponentially.
Measurements are from glacial ice and from Mauna Loa in Hawaii.
Figure 11.8b
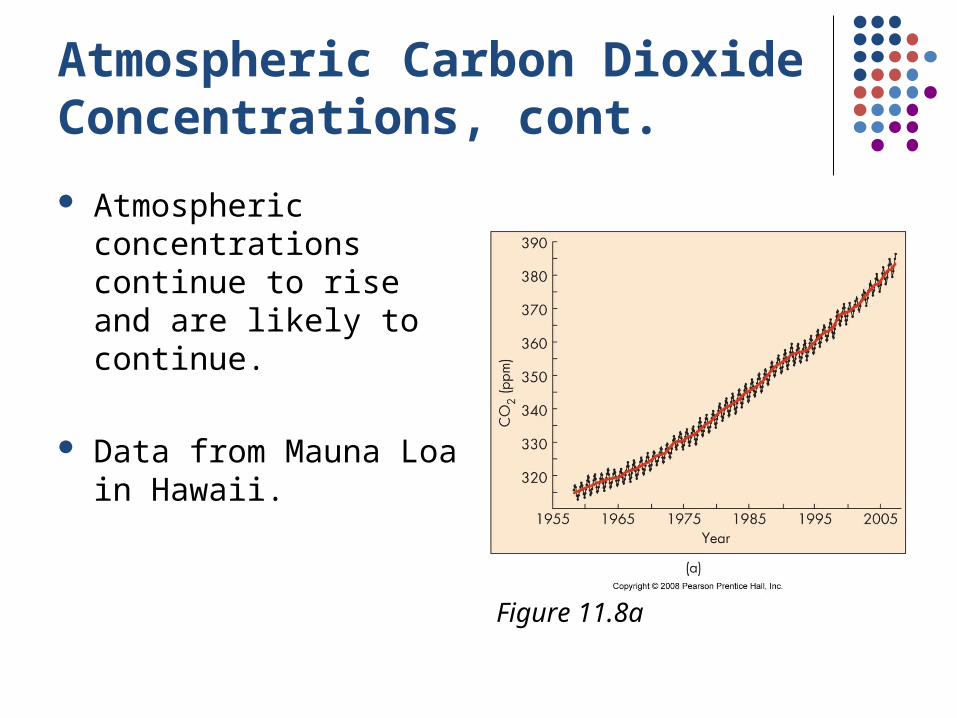
Atmospheric Carbon Dioxide Concentrations, cont.
Atmospheric concentrations continue to rise and are likely to continue.
Data from Mauna Loa in Hawaii.
Figure 11.8a
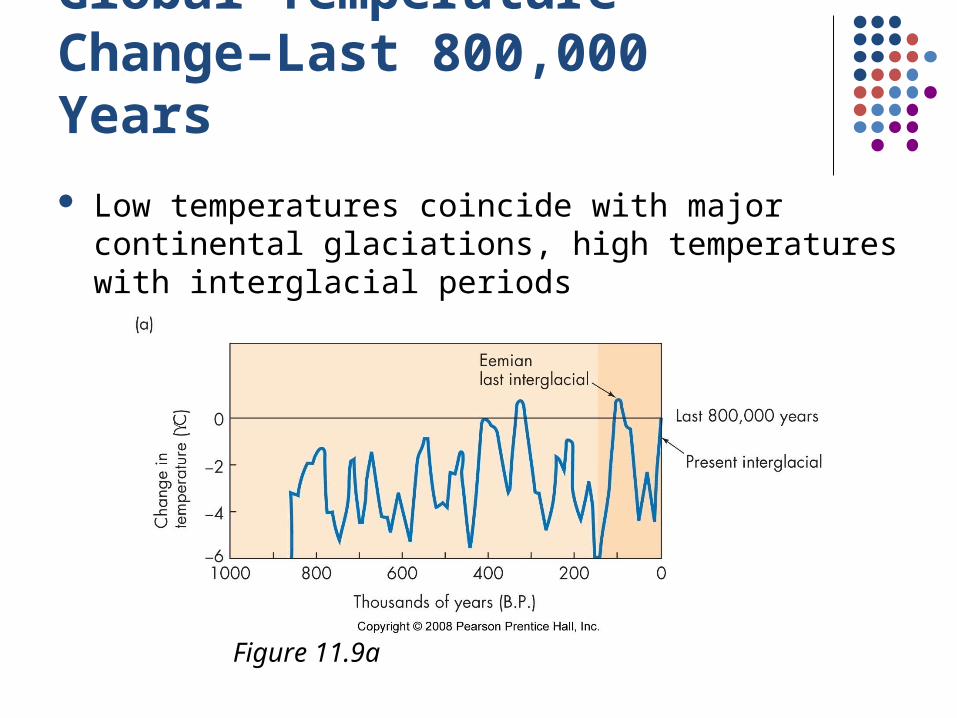
Global Temperature Change–Last 800,000 Years Low temperatures coincide with major
continental glaciations, high temperatures with interglacial periods
Figure 11.9a

Global Temperature Change–Last 150,000 Years Last major interglacial period, Eemian, sea level
was 4–6 ft higher than today
Figure 11.9b
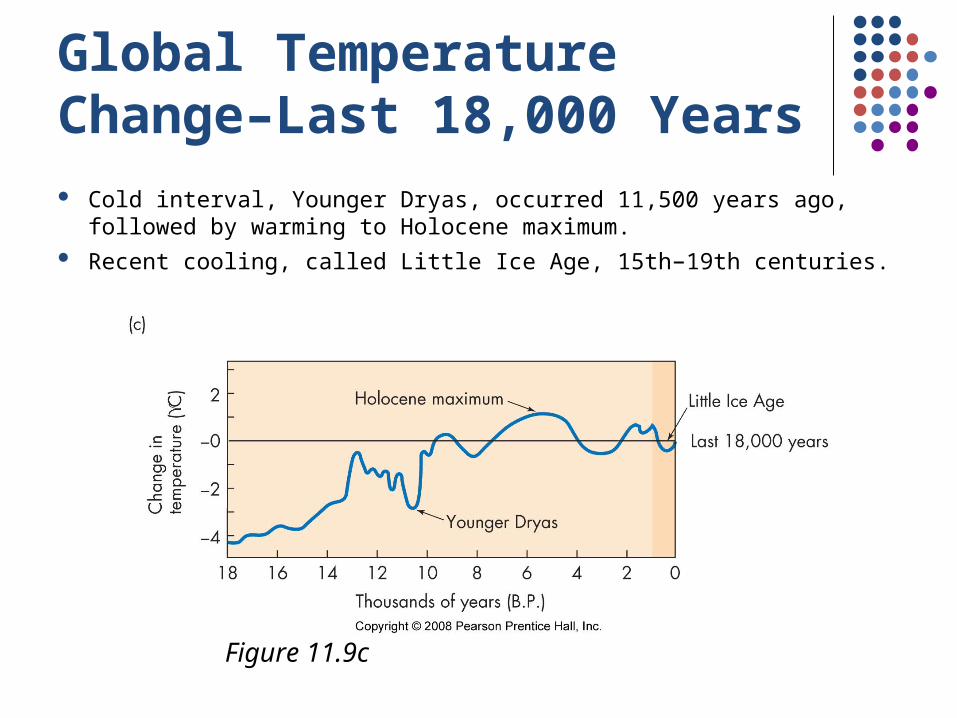
Global Temperature Change–Last 18,000 Years Cold interval, Younger Dryas, occurred 11,500 years ago,
followed by warming to Holocene maximum. Recent cooling, called Little Ice Age, 15th–19th centuries.
Figure 11.9c

Global Temperature Change–Last 1000 Years Several warming and cooling trends Warming in 11–1300 allowed Vikings into Iceland,
Greenland, and North America
Figure 11.9d
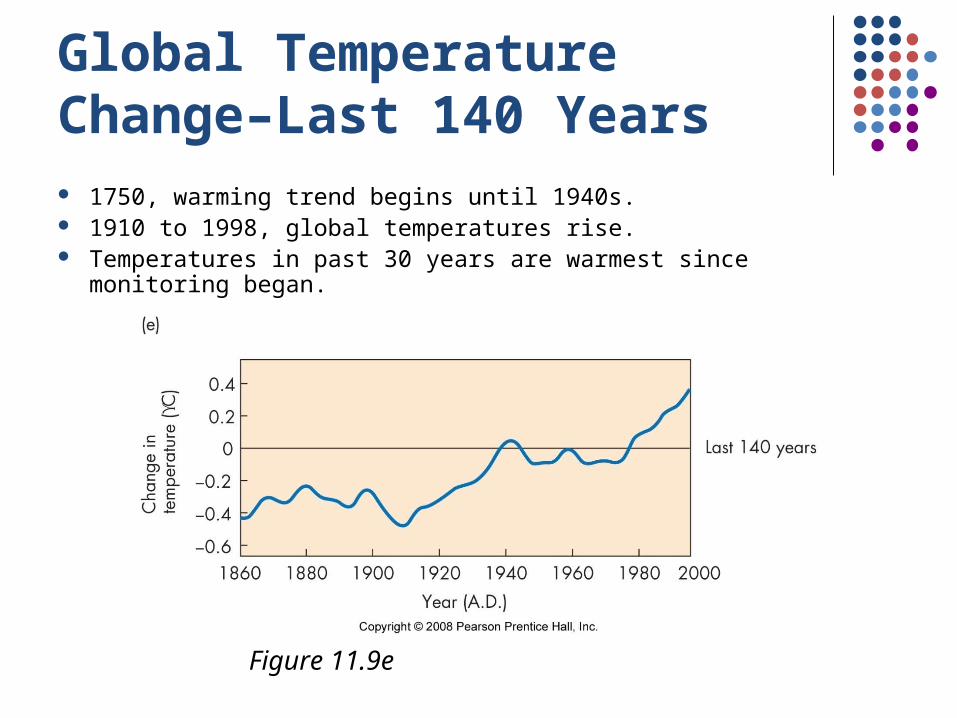
Global Temperature Change–Last 140 Years 1750, warming trend begins until 1940s. 1910 to 1998, global temperatures rise. Temperatures in past 30 years are warmest since monitoring
began.
Figure 11.9e
Why Does Climate Change? Milankovitch Cycles
Natural changes in Earth’s Orbit, tilt, and precession Explain some changes, but not the observed large-scale
changes
Ocean conveyor belt Circulation of ocean water in oceans Can cause fast changes in climate Keeps Northern Europe warmer than without it

Ocean Conveyor Belt –Atlantic Ocean West side, strong warm current flows northward
to Arctic.
At Greenland, it is cool and salty and sinks to bottom.
Cold, dense water flows southward around Africa.
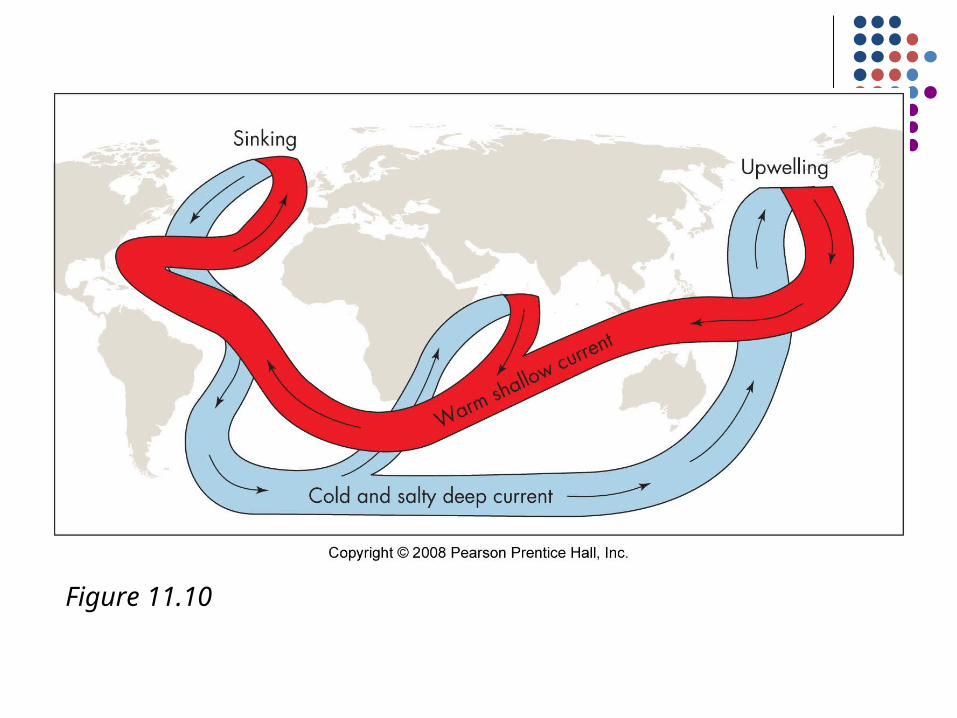
Figure 11.10

United Nations Intergovernmental Panel on Climate Change UN report found that shutdown of conveyor belt
current has occurred historically, but there is no evidence that it will occur again this century.
There is sufficient evidence to state:1. There is widespread evidence of human
influence on global climate.2. Warming is now occurring.3. Mean surface temperature of Earth will likely
increase between 1.80 and 40 C (30 and 70 F) during this century.

Solar Forcing There is a relationship between changes in solar
energy and climate change.
Medieval Warm Period (A.D. 1000–1300) corresponds to increased solar radiation.
Little Ice Age corresponds to decreased solar radiation.
Partially explains climate change, but effect is very small.

Volcanic Forcing Ash from eruptions becomes suspended in the
atmosphere, reflects sunlight having a cooling effect.
Mount Tambora, 1815 eruption contributed to cooling in North America and Europe.
Mount Pinatubo in 1991 counterbalanced global warming during 1991 and 1992.

Anthropogenic Forcing Mathematical models of climate can isolate
human causes from solar and volcanic forcing of climate change.
Models found that present warming greatly exceeds natural variability.
Models agree with climate change predicted from greenhouse gas forcing.
pconnelly
Should something following this word?

Figure 11.12

Effects of Climate Change
Figure 11.13

Climate Patterns Climate important to agriculture
Rainfall patterns, soil moisture, etc. Northern Canada and Eastern Europe may be more
productive. Lands closer to equator become more arid.
Violent storms may intensify Warmer oceans provide more energy.

Changes in Hydrosphere Increased sea surface temperature
Increased precipitation in polar and temperate regions
Decreased precipitation in tropical and subtropical regions
Changes in Hydrosphere, cont. Rising sea level
Thermal expansion of ocean Melting glaciers Increases coastal erosion Increases vulnerability of structures to waves Flood low-lying Pacific and Indian Ocean islands Flood coastal cities, New York, Boston, Tampa,
Washington, D.C.
Changes in Cryosphere Global warming effects occur more rapidly here.
Shrinking permafrost.
Decreased Arctic Ice cap, ice sheets, and glaciers Affects communities dependent on snowmelt for water
supply
Changes in Biosphere Shifts in range of plants and animals
Changes in plant and animal habitat Mosquitoes are moving to higher elevations. Northward movement of butterflies in Europe and birds in
U.K. Expansion of sub-alpine forests in Cascades. Sea ice melting stresses seabirds, walruses, and polar
bears. Warming in Florida Keys bleaching coral reefs. Seawater increasing in acidity, threatening coral animals
and algae. These are areas of extreme animal diversity.

Desertification and Drought Climate change increases human induced
conversion of land to desert
Causes soil and natural vegetation degradation Long-term loses for agriculture and grazing
Increase in drought events
Wildfires Wildfire events will increase due to global
warming. Both in in frequency and intensity

Minimizing the Effects of Climate Change Focus on reduction of greenhouse gasses
Most scientists believe that we have a decade to reduce gas emissions to avoid catastrophe.
Reduction of gasses must be done on an individual, community, national, and international level.
Carbon sequestration Necessary as we make transition to new energies


International Agreements Montreal Protocol
1987 agreement to limit depletion of ozone layer by CFCs CFCs have declined since 1989
Kyoto Protocol United Nations Framework Convention on climate change Establishes targets to reduce greenhouse gas emissions by
2012
Copenhagen No binding agreement was achieved. The U.S. Congress did
not pass new laws in advance, and President Obama attended without any real authority to take meaningful action.
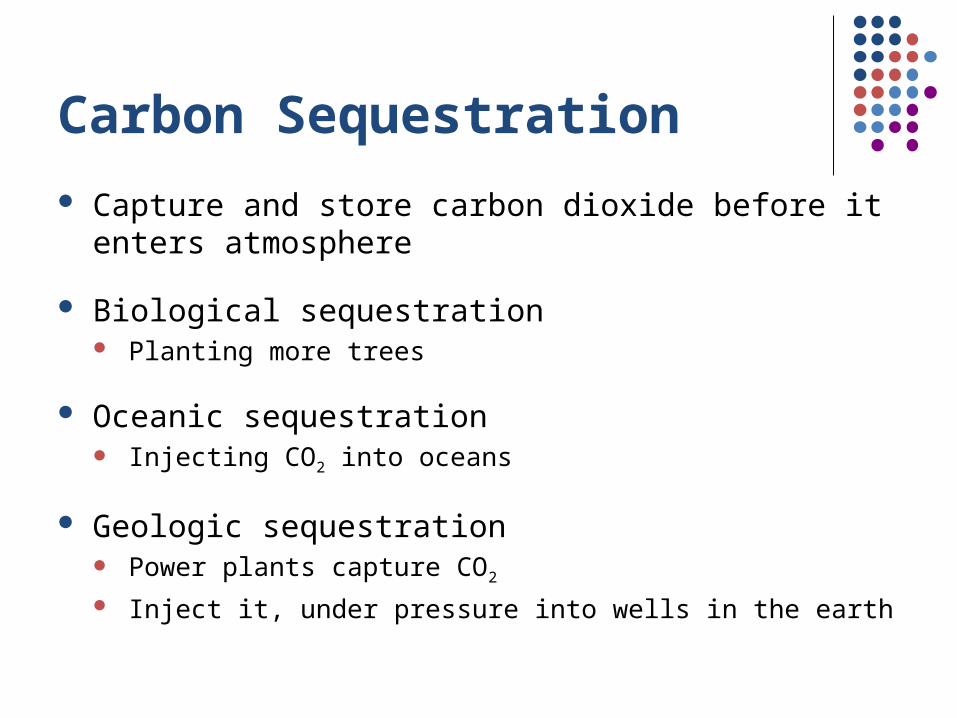
Carbon Sequestration Capture and store carbon dioxide before it enters
atmosphere
Biological sequestration Planting more trees
Oceanic sequestration Injecting CO2 into oceans
Geologic sequestration Power plants capture CO2 Inject it, under pressure into wells in the earth

Fossil Fuels and Future Threat of Climate Change Two scenarios for global warming in which there is rapid
economic growth with population peaking and declining
A1–More efficient energy technologies, but still fossil fuel intensive
B1 – Clean resource-efficient technologies, economic structures change
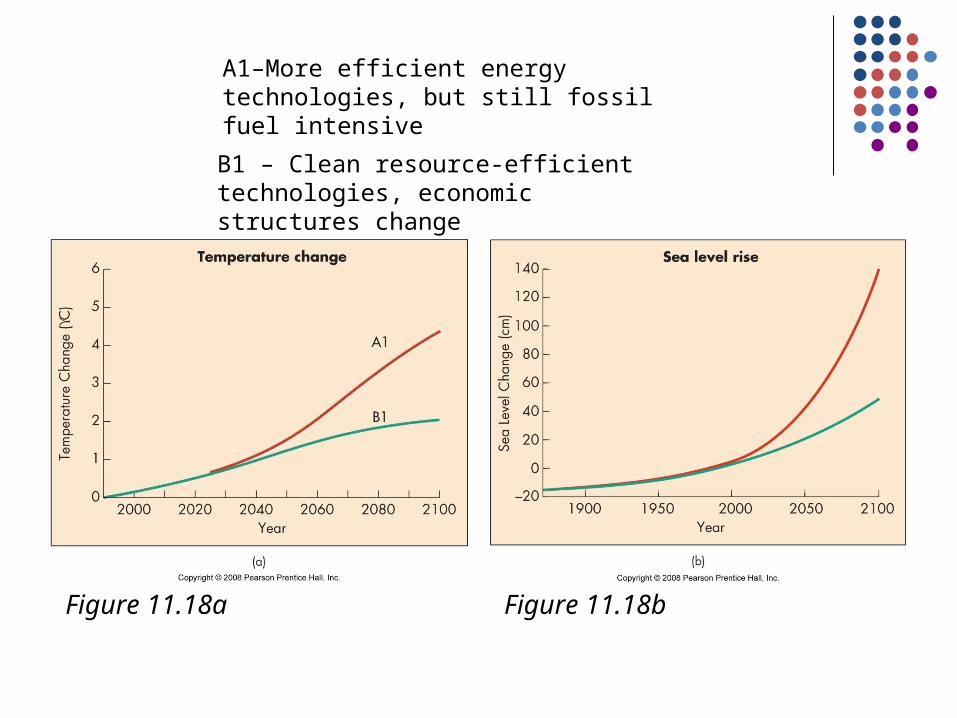
Figure 11.18a Figure 11.18b
B1 – Clean resource-efficient technologies, economic structures change
A1–More efficient energy technologies, but still fossil fuel intensive

End
Climate and Climate ChangeChapter 11
You are now free to walk about the cabin