
NATURAL GAS WORLD
30
VOL 5, ISSUE 17 14 SEPTEMBER 2020 NEWS. ANALYSIS. THE INSIDE TRACK. NATURAL GAS WORLD M A G A Z I N E IGU charts course for gas Gas and its renewable rivals US LNG assets change hands Russia’s NGVs Saudi beefs up its gas business Upstream pursues Australia’s shale once more
Transcript of NATURAL GAS WORLD

VOL 5, ISSUE 17 14 SEPTEMBER 2020
NEWS. ANALYSIS. THE INSIDE TRACK.
NAT U R A L GAS WOR LDM A G A Z I N E
IGU charts course for gas
Gas and its renewable rivals
US LNG assets change hands
Russia’s NGVs
Saudi beefs up its gas business
Upstream pursues Australia’s shale once more
3EDITORIAL: THE GREAT ENERGY TRANSITION
4GAS TO FUEL SAUDI EXPANSION
20GREEN GAS MEANS GO
16US LNG ASSETS CHANGE HANDS
27A YEAR OF TWO HALVES?
INDEX
24E EUROPE LIBERALISES BORDER TRADE
7ELECTIONS PAVE WAY FOR OZ SHALE
18RUSSIA JUMP-STARTS NGVS
10GLOBAL GAS DEMAND: FORKING PATHS

It is only to be expected if a magazine with a title such as ours comes across occasionally as a little defensive about gas. Take gas out of the global energy mix and we have little reason to exist. That said, NGW does not exist to defend gas but to write about it. For much of the time, the facts and figures of gas speak eloquently for themselves, which is why it has on the face of it such a great future.
Its biggest threat, such as it is, is political. The economics seem fine, in light of the cost of competition and the externali-ties. But the negative associations of gas with autocracies that do not follow Western ideals is certainly one risk it faces. This though can very often be managed through rational diversifi-cation of supplier and/or the application of carefully-directed political or economic pressure.
But all is not rosy on the horizon. Policy-makers, and industries with competing business models – chiefly in the electricity generation sector – are ignoring the affordability and reliability elements of the trilemma and focusing exclu-sively on sustainability, for which read zero carbon.
This is certainly winning friends in the investment com-munity. It needs a safer haven for other people’s money, in today’s environment, than the former milk-cows – such as international oil companies – are able to provide.
The major oil and gas companies are playing along with this – for now at least. BP and Statoil for instance have just announced a major wind project off the US even as they, in common with the rest of their peer group, announce cuts and delays in upstream oil and gas. BP is expected to explain, over a few days mid-month, how it will achieve its ambitious climate goals. Demand for oil and gas will grow along with the world’s population.
But obfuscation and deceit of the public on ‘clean’ electric-ity, for example, is a bad approach when collaboration across industry and governments is vital to achieve the man-made targets for carbon emissions reductions.
It is normal business practice for new entrants to carve out a niche for themselves at the incumbents’ expense. This has been the story of Europe’s gas market since liber-alisation: those without take or pay contracts backed up by no-longer-captive customers can move in.
But the cost of the niche this time round is apparently going to be borne by the consumer. The conventional approach has been ignored: rather than find a cheaper alternative approach to gain market share, entrepreneurs have developed more expen-sive technologies. These have often been shoehorned into an existing market by governments eager to please.
Misleading claims are being made for the wind and solar industry: as has been pointed out elsewhere, the
much-vaunted grid parity for UK wind farms is only possible in the context in which they operate: dispatchable nuclear or gas fired generation picks up the cost of balancing the system when wind or solar unexpectedly dip. Take that support system away and the real cost of generating despatchable renewable energy becomes infinitely higher – at least in a developed economy with an aversion to power-cuts.
In a process that started late last century, the ideas about rising carbon emissions being bad for the environment have crystallised into fixed percentages and degrees, and fossil fuels were targeted as the villain of the piece, regardless of their carbon content.
Whether or not that is right or wrong, it is well known that gas can replace fuel oil in shipping and heavy duty road transport and thereby cut greenhouse gas emissions, particu-lates and other harmful matter. And that gas can replace coal in the power sector, with even greater benefits for society. But those attributes are seemingly not enough: it must go the extra few miles to justify its continuing place in the world, and reconfigure itself chemically.
Blue and green hydrogen, carbon capture and storage and LNG carbon offsets all loomed large on the Gastech 2020 conference agenda – along with the destructive effects of Covid-19, which poses a threat to world prosperity that appears incompatible with the former goals.
By contrast, what is to replace much oil and gas has been given a green light at least from a policy point of view, with very little objection made to the lifecycle cost.
This is leading to paradoxes such as the felling of hard-woods to make wood pellets at the same time that companies are – presumably – planning to plant acres of woodland to offset the carbon inherent in their LNG.
And renewably-produced hydrogen, if used as a fuel for power generation, is surely the most scandalous energy scheme ever foisted on consumers, reminiscent of Jonathan Swift’s joke about extracting sunbeams from cucumbers for use as winter heating, in his noted early-18th century satire, Gulliver’s Travels.
The time now has come for collaboration, however: a better social and natural environment is not a proper area for competition but it is an urgent objective. Suppliers of all kinds of energy must in the coming months include better and honest communication – both with each other and with gov-ernments – about the realities of their businesses and what measurements to use to assess their cleanness.
— NGW
EDITORIAL
THE GREAT ENERGY TRANSITIONEnergy companies must move toward collaboration
3 THE GREAT ENERGY TRANSITION

State-owned Saudi Aramco started the year with the announce-ment of regulatory approval to proceed with the expansion of unconventional gas production capabilities. While the company has since become distracted by the twin challenges of the ill-timed oil price war with Russia and the dramatic decline in demand caused by reduced travel and commerce as a result of the Covid-19 pandemic, Aramco is at pains to assure the market and its investors that its gas plans remain in focus.
The primary target of the February announcement was Jafurah, which is by far the kingdom’s largest unconventional gas deposit, holding an estimated 200 trillion ft³, with liquids making up more than half of the resource. Aramco said that it planned to spend $110bn developing the field, with production expected to begin in early 2024, ramping up to 2.2bn ft³/day of sales gas by 2036. Given recent events, doubts have been cast over the Dhahran-based company’s larger capital projects.
Aramco’s Jafurah Basin has the potential to fuel a major transformation in the kingdom’s economy, against a weak global economic backdrop.
GAS TO FUEL SAUDI EXPANSION
Ian Simm
4 VOL 5, ISSUE 17 | 14 SEPTEMBER 20204
CAPITAL CUTS
In early April, it set a single-day oil production record of 12.1mn barrels/day but less than three weeks later, as demand crashed, crude prices fell to an historic low of -$37.63/b for US West Texas Intermediate. Aramco’s response was to cut oil output to 7mn-8mn b/d.
In early August, the company announced that it was reel-ing in its full year spending plans, first half capital expenditure amounted to $13.6bn. Meanwhile, the full-year 2020 capital programme was cut by around $11-13bn as the company retrenched to stem the bleeding.
A company source speaking to NGW on condition of anonymity, said that Aramco’s full-year 2020 gas expenditure is expected to be more than $3bn lower than it was at the end of 2019, with the number of gas wells drilled dropping by 15-20 year on year.
Numerous large projects are being reconsidered, while the Berri and Marjan crude increment programmes have been pushed back by six months. Costing a total of $18bn, the projects will more than double oil production capacity from the assets to a combined 1.35mn b/d, while delivering up to 2.5bn ft³ (71mn m³)/day of associated gas, which will be piped to the Berri gas plant.
Total raw gas production is expected to grow by around 0.5bn ft³/d to 13.5bn ft³/d, which is roughly 5bn ft³/d below capacity. This includes 8.5-9bn ft³/d of sales gas. Meanwhile, Aramco’s gas unit costs are expected to rise slightly to just under $2/mn Btu. Including the Partitioned Neutral Zone (PNZ) Saudi shares with Kuwait, the kingdom has around 324 trillion ft³ of proven gas reserves.
Despite the cuts, Aramco has stuck to its word in several key areas. As with the company’s promised $75bn/yr dividend to shareholders, NGW understands that plans for gas remain largely unchanged.
During Q2, the company made progress in expanding its gas production capacity with the Fadhili gas plant reaching full production capacity of 2.5bn ft³/d following the successful completion of commissioning activities.
While early work has been ongoing on Jafurah throughout Q1 and Q2, the evaluation of bids for three of the main con-tracts on the project’s $3.5bn first phase has been extended,
while the deadline for submissions for the other two has also been pushed back.
However, according to the company source, while the project’s completion date has been delayed as a result of the capital expenditure cut, this will only see it pushed back by a few months.
Building out its gas capabilities is an important part of both Aramco’s and Saudi Arabia’s plans on track as Riyadh seeks to reduce the 3-3.5mn bpd of Saudi crude that is burnt at home to provide electricity.
In mid-August, CEO Amin Nasser said: “Gas is a growth area for us, especially considering increasing gas demand in the kingdom. The Northern area is declining, but there is pick-up in the Eastern province, the Jafurah basin and South Ghawar in conventional gas.”
CHALLENGES AND CONNECTIVITY
However, much of Saudi Arabia’s gas is associated with oil production, and developing unconventional, non-associated resources will require large volumes of water in an area where it is in scarce supply.
It is possible that water could be supplied from the Al-Qurayyah Sea Water Plant, south of Dhahran, which pipes millions of barrels of water daily to Ghawar, the world’s largest oilfield, and Khurais. The facility’s full 14mn b/d of water is understood to be utilised at the oilfields and Qurayyah would require expansion to also serve Jafurah.
In addition, given the field’s very low well flow and steep decline rates, consultancy Wood Mackenzie expects thou-sands of wells will be required to maintain production. Indeed, Woodmac expects Jafurah to require an investment of $50bn to achieve the 2.2bn ft³/d target.
However, considering that the reservoir has a high ratio of condensate to gas, Jafurah is expected to also produce peak flows of 550,000 b/d of condensate and LPG, as well as roughly 0.4bn ft³/d of ethane.
In addition, its proximity to the Saudi gas grid – the Master Gas System (MGS) – provides relatively convenient infrastruc-ture through which the gas can be transported. The MGS connects non-associated gas developments in Eastern Prov-ince to industrial facilities up the coast at Ju’aymah and Jubail and the Yanbu’ Industrial Complex on the Red Sea coast.
This also applies to conventional gas assets in South Ghawar, which are likely to use existing processing facilities at Haradh, Hawiyah or ‘Uthmaniyah, which are already con-nected to the MGS.
Apart from the MGS connection to Yanbu’, Saudi Arabia does not have a gas grid on its west coast. The development of the Jafurah and South Ghawar resources would certainly support the expansion of the MGS, thereby increasing the role of gas in the Saudi energy mix.
GASSING UP AND GOING GREEN
The gas is also likely to be diverted to Aramco’s petrochemical plants. Having recently closed the acquisition of a 70% stake in
“ Gas is a growth area for us, especially considering increasing gas demand in the kingdom.”
— SAUDI ARAMCO CEO AMIN NASSER
5 GAS TO fuEL SAuDI ExpANSION

petrochemicals firm Saudi Basic Industries Corp. (Sabic) from the Public Investment Fund for $69.1bn, the company has become one of the world’s largest petchem producers. The deal was concluded the week after Aramco cuts its expat workforce by 500-1,000, according to the company source, showing that the firm can maintain its appetite for massive investments, even in the toughest of economic climates.
In 2019, Aramco and Sabic produced nearly 90mn metric tons of petrochemicals combined, and the increased availabil-ity of gas feedstock will only improve economies of scale.
Meanwhile, Riyadh’s focus on building out its electrical network was highlighted by the recent signing of a memoran-dum of understanding with neighbouring Jordan covering a framework for the connection of the two countries’ grids. This was followed by comments from the Iraqi government that it was looking to join up with its neighbours in the development of a broader Gulf grid.
The deal with Jordan was signed between Saudi energy minister Prince Abdulaziz Bin Salman and his counterpart Hala Zawati. In an official statement, Prince Abdulaziz said: “There are promising opportunities from the project to support the reliability of the electrical networks between the two coun-tries, achieve economic savings, [enable] electrical networks to use renewable energy, and achieve optimal investments in electricity generation projects.”
His mention of renewable energy gives some insight into the Kingdom’s vision of the future. Riyadh is investing heavily in renewables as part of Crown Prince Mohammed bin Salman’s Vision 2030 initiative, highlighted by the 2019 launch of the 300MW Sakaka project in the north-western Al-Jawf province, which at the time was one of the world’s cheapest producers of energy from solar.
The key project associated with Vision 2030 though is the development of the $500bn Neom smart city on the Red Sea coast near the border with Jordan, which is to be built and powered exclusively by renewable energy. In July, the Neom project company announced a $5bn deal with Air Products and ACWA Power to build the world’s largest hydrogen facility.
While the hydrogen produced at Neom will be ‘green’ as it will be generated from renewable sources, Saudi’s increased
gas production could facilitate the growth of ‘blue’ or ‘grey’ hydrogen for use in fuel cells for industrial transportation.
With a stated aim of diversifying the economy, it should not come as a surprise if the government ringfences the development of its large gas assets in much the same way they have done with Neom, protecting them from any poten-tial reductions in capital spending.
The benefits of ramping up gas production are clear for Saudi Arabia: it can thereby increase its revenues from crude exports, diversify its energy mix, create new industries, jobs, and assume the role of a world leader in clean energy. Given Riyadh’s penchant for statement projects and deals that pro-ject it favourably, Jafurah might just be too big to fail, even if it faces delays amid oil price and demand volatility.
“ There are promising opportunities from the project to support the reliability of the electrical networks between [Saudi Arabia and Jordan], achieve economic savings, [enable] electrical networks to use renewable energy, and achieve optimal investments in electricity generation projects.”
— SAUDI ENERGY MINISTER PRINCE ABDULAZIZ BIN SALMAN
6 GAS TO fuEL SAuDI ExpANSION

The Northern Territory elections have returned the Labor Party to power and, in doing so, have secured a promising future for the local upstream sector.
In the run-up to the election doubts had begun to surface as to whether Labor would be able to deliver on its promised gas-led economic recovery, following the Territory Alliance Party’s (TAP) pledge in June to ban hydraulic fracturing (see sidebar).
Although the NT is a major producer of conventional gas – both onshore and offshore – the territory’s resource future is widely believed to be tied to its significant shale gas potential in the Beetaloo Basin, which is estimated to hold 500 trillion ft³.
But while TAP was founded by former Country Liberals Party (CLP) leader Terry Mills as a “grassroots alternative” to the two-party system in 2019, the fact that it lost two of its three seats suggests voters have moved on from the fracking-related concerns that overshadowed 2016’s election.
RECOVERY AMBITIONS
Labor saw its share of the parliament’s 25 seats fall from 15 to 14 following the elections, while the CLP quadrupled its seat count to eight.
The CLP, however, has been a major proponent of shale gas development and has encouraged NT Chief Minister Michael Gun-ner’s administration to do more to support the industry following the end of two-year fracking ban in 2018. With the territory’s new nine-person cabinet sworn in on September 8, it appears Labor is ready to do just that. Gunner took on the additional portfolio of minister for major projects and Territory economic reconstruction while deputy chief minister Nicole Manison will double up as the mining and industry minister.
Gunner believes the NT could become the nation’s economic “comeback capital” in the wake of the Covid-19 pandemic. His government expects to achieve this through expanding the Darwin
Local elections in Australia’s Northern Territory have handed the vast majority of the parliamentary seats to backers of shale gas development.
ELECTIONS PAVE WAY FOR
OZ SHALE
Andrew Kemp
7 VOL 5, ISSUE 17 | 14 SEPTEMBER 20207
LNG export terminal, growing the NT’s service and supply industry and establishing gas-based processing and manufacturing.
The chief minister established the Territory Economic Reconstruction Commission in May to help guide his government toward its goal of adding 35,000 jobs within 10 years while also quadrupling the NT’s economy to A$40 (US$28.9)bn within the same time frame.
In the commission’s first report, which was published in July, it noted that the “Beetaloo sub-basin shows significant potential to provide gas and liquids for energy use and to underpin a petro-chemical manufacturing industry in the territory – driving significant economic benefit”. The commission is set to deliver a final report in November and, given recent comments from Gunner, it is unlikely to deviate to much from its original conclusions.
“We have a clear plan to create jobs, to get out ahead of this [economic downturn], to be the comeback capital for the country, about how we can invest in manufacturing, how we turn Darwin into an answer to Australia’s problems right now,” national broad-caster the ABC quoted the chief minister as saying on September 6.
Labor’s return to power has been welcomed by the Australian upstream, with the director of the Australian Petroleum Production and Exploration Association’s (Appea) NT branch, Keld Knudsen, congratulating the ministers on their appointment.
COULDN’T BE HAPPIER
Lobby group Appea’s default setting is resigned disappointment at state or federal government decisions to limit the opportuni-ties for gas production, so NT’s decision is a welcome change. Knudsen said: “The Northern Territory is home to a world-class natural gas industry that already makes a substantial contribution to the national and territory economy and this will grow and continue to for decades to come.”
He added: “We have a tremendous opportunity to continue to turn the territory’s existing and prospective natural resources into long-term prosperity, creating more jobs, driving investment and increasing economic growth.”
Beyond Labor’s victory, however, the upstream must be relieved not only that the CLP is once more a viable opposition party but that TAP faired so poorly in the election.
The TAP had managed briefly to claim opposition status in the NT parliament after independent Robyn Lambley joined the party thereby bringing its seat count to three. A secret parliamentary ballot a week later, however, returned opposition status to the CLP.
However, the most recent election not only gave the CLP eight seats but also decimated TAP’s parliamentary position. On the
national stage, CLP Senator Sam McMahon described the results as a “resounding rejection” of TAP’s “anti-gas policies”.
Labor and the CLP now hold 22 seats between them and are firmly on the same page when it comes to gas’ role in the territo-ry’s economic future. Indeed, McMahon called on the Australian Senate on September 2 to acknowledge the importance of the territory’s onshore gas industry and in particular the Beetaloo Basin’s development.
She moved a general business notice calling on the Gunner government to “urgently work with the federal government and industry to ensure that the potential benefits of developing the Beetaloo Basin are fully realised”.
Appea’s Knudsen has said that if exploration in the Beetaloo is successful then it could take the shale gas industry three to four years to start producing.
“We’re looking to invest up to A$10bn in a production scenario, over the 40-to-50-year life of the project, and everything that we’ve seen has indicated that the long-term demand for gas is still there, particularly in Asia,” the ABC quoted Knudsen as saying.
PROJECTS AND PIPELINES
Industry observers are watching Origin Energy’s development of EP117 in the Beetaloo closely, with fracking of the Kyalla 117 well slated to begin in the second half of this year.
Junior partner Falcon Oil and Gas said in August that initial results from the production test were expected by the end of the year, with final results anticipated in the first quarter of next year. Kyalla 117 was drilled in February, but Origin suspended its Bee-taloo operations in March in response to the Covid-19 pandemic. Origin operates EP117, EP76 and EP98 with a 70% interest, while Falcon owns the remaining 30%.
And late last month Sydney-listed Empire Energy announced it had raised A$10mn through a share placement to further its own Beetaloo exploration programme. Empire said it was fully funded to drill Carpentaria-1 in September, and planned fracture stimulation and flow testing for Q2 2021. The company has started work in preparation for drilling the Carpentaria-1 well in EP187 including upgrading the access track, construction of the well pad and water bore drilling.
While the private sector is forging ahead with proving up the NT’s shale potential, the government is taking steps to help realise its gas-fed manufacturing ambitions, reportedly awarding a pre-fea-sibility study for a gas pipeline to transport gas from Beetaloo to Darwin. CNC Project Management won a A$327,000 contract for the study, the Katherine Times reported on September 8. The
The Commonwealth Australian Domestic Gas Security Mechanism has also spooked the market with many established companies exiting Australian projects citing the inability to secure long term supply contracts.
8 ELEcTIONS pAvE WAY fOR Oz SHALE

project will consider route options within a 100-metre wide corridor that will start in Tennant Creek and run through Katherine and Pine Creek before terminating in Darwin.
“This [study] is aimed to provide clarity to the Gas Taskforce and government for future decisions regarding acquisition of a corridor to transport gas from on shore reserves to existing and planned gas industry infrastructure,” the paper quoted tender documents as saying.
CNC will also be expected to “conduct and record initial land-owner discussions with regard to the position of the corridor within their property”.
The award comes after Central Petroleum, Australian Gas Infra-structure Group and Macquarie Mereenie unveiled plans in August to seek government funding for a pipeline to connect the Amadeus gas field to the Moomba pipeline in South Australia.
The existing Moomba pipeline feeds the Santos-run Moomba gas hub, which is an important nexus of gas trading in the coun-try’s southeast that connects Queensland, New South Wales and Victoria.
The Amadeus-Moomba Gas Pipeline (AMGP), which has a projected price tag of A$1bn and would span 950 km, is less than half the current 2,200 km route that Amadeus gas must travel to reach Moomba. Central said the AMGP, which will have a free-flow capacity of 45 PJ/yr and will be expandable with compression, will transport gas from discovered offshore gas fields as well as the territory’s various unconventional exploration programmes.
With elections out of the way and both the federal and NT governments singing from the same hymn sheet when it comes to gas’s economic importance, there is every reason for the upstream to be upbeat.
CRISIS AVERTED
TAP’s proposal to halt hydraulic fracturing this summer caught the upstream on the hop, as it had earlier approved it. TAP said existing exploration licences will not be renewed, and no more production permits will be issued. Existing production may only continue where sufficient community and environmental safeguards are implemented.
Apart from the alleged environmental risk posed by hydraulic fracturing, TAP justified its proposal on a number of grounds that might be for the investor to take after assessing the risks, rather than for the government.
These include the gas oversupply in world markets. It said: “The glut is not expected to clear until after 2030. This is not simply a short-term blip caused by a Covid related down-turn but was a well-established trend even before the pandemic forced widespread industrial closures. It has been well known since 2017 that production was far outstripping demand, with both investors and production companies taken to task for their addiction to growth and to ‘stop counting barrels and start making money’.
Another factor was sovereign risk, scaring off investors upstream with Canberra’s plan to limit exports: “The Com-monwealth Australian Domestic Gas Security Mechanism has also spooked the market with many established compa-nies exiting Australian projects citing the inability to secure long term supply contracts,” it said.
Another factor is the shrinking pool of money to finance these projects: natural gas is also becoming too risky for major investors and risk-averse major investment banks are divesting shares. And another reason it gave is the Euro-pean Union’s plan to impose a carbon tax on imports, which would apply to LNG as well.
Appea responded: “The backflip is staggering given [party leader] Mr Mills said in January: ‘If onshore gas is a viable industry in every way, then we should welcome it as a part of our economy. To do otherwise would send a message of uncertainty and governmental incompetence to all businesses right at the time when the NT is most in need of additional business investment.”
– William powell
9 ELEcTIONS pAvE WAY fOR Oz SHALE

Published in August, the International Gas Union’s Global Gas Report 2020 reviews last year in gas, but also assesses the effect of Covid-19 on the industry in the first half of 2020 and analyses the drivers for recovery in the next few years.
It also includes a special section on the role hydrogen might play in the gas industry in the low-carbon transition, from the point of view of its market potential and the techno-logical options available for – and the costs of – its production, storage and transport.
Its main conclusion is that the disruption caused by Covid-19 is on course to reduce gas demand and LNG trade by 4% in 2020. This and over-supply have kept prices at historic lows.
But on the positive side, GGR points out that “abundant supply and continued cost-competitiveness, aided by a push for cleaner air, can lead to a recovery in demand to pre-Covid-19 levels in the next two years, as the global economy regains momentum.”
This will be critically dependent on continuing gas infrastruc-ture investment, supported by technological innovation to raise efficiency and keep prices low. These are key to ensuring a role for gas during the energy transition. This includes scaling up of low-carbon gas technologies, such as biomethane and carbon cap-ture and storage (CCS), the necessary enabler of blue hydrogen.
GGR concludes that technological innovation and policy support can help the gas industry to bounce back strongly over the next few years.
The IGU president, Joe Kang, said: “This pandemic crisis comes at great cost to the industry, the economy and society at large. It also reminded the world about the value of clean air and healthy environment for well-being, providing a unique opportunity to rebuild better.”
He said gas was not only a cleaner alternative to coal and oil in the short term but also the infrastructure could be used to transport ever larger quantities of clean gas.
The annual Global Gas Report 2020 (GGR) published by the International Gas Union with BloombergNEF (BNEF) and Snam takes the –
naturally – optimistic view. Others are more cautious.
GLOBAL GAS DEMAND: FORKING PATHS
charles Ellinas
10 VOL 5, ISSUE 17 | 14 SEPTEMBER 202010

Fig. 1 — Northwest Europe lignite/coal-to-gas fuel switching range Source: BloombergNEF
KEY FINDINGS
GGR sees a long-term role for gas in the global energy sector driven by sustainability, competitiveness and supply security. Its key findings are:
— Cost-competitiveness is enabling new demand: rising supply and affordable prices were already enabling record demand for gas and LNG in 2019 and this will continue post-2020.
— Security of supply is increasing: future supply growth is expected to be led by the Middle East, but the US, Russia and Iran are expected to remain the top-producing countries in the medium and long term. China has seen domestic supply rise by a third in the last five years and could double its production by 2040.
— Sustainability and enabling policy will define the future of the gas industry: clean air policies provided an impetus for gas consumption in major markets. This will continue in future, particularly in Asia, driven by China and India. Also important is the increasing role of gas-fired power generation as a flexi-ble resource to complement growing renewable generation.
— Gas technologies can play a major role in the low-carbon transition: technologies such as biomethane, hydrogen and natural gas with CCS could play an important role, serving to decarbonise sectors of the economy seen as ‘hard to abate’, thus providing opportunities for long-term growth for the gas industry.
— The amount of interest in hydrogen presents an oppor-tunity: while clean hydrogen is not yet cost-competitive, delivered costs could become increasingly competitive between 2030 and 2050. For hydrogen to achieve its potential, not only will strong policy action be needed to drive scale, but there will also be a significant need for infrastruc-ture investment.
— Infrastructure investment can propel demand growth for gas and prepare the ground for hydrogen: both LNG and gas pipeline infrastructure will be critical to deliver continuous supply to end-users. As the energy transition proceeds, gas transport and storage infrastructure can be readied for hydrogen blending, and indeed for pure hydrogen transport, at much lower cost than constructing new purpose-built hydrogen networks.
— New market mechanisms are fuelling trade growth: global gas trade is being facilitated by a combination of market deregulation, establishment of trading hubs and growth in financial derivatives. These will support the commoditisation of gas and LNG, and help manage risk.
However, investment and policy support are needed to scale up these solutions. GGR expects that through these and continuing low gas prices the industry will rebound quickly in 2021 and beyond. It may though be too early to gauge the full impact.
LOOKING AHEAD
In the longer term, the industrial sector is expected to become more important for the gas industry, as switching from coal, fuel oil and diesel means more gas is needed. Industrial natural gas demand is expected to grow by 2.3% a year to 2040.
In the power sector, gas demand can also continue to grow as gas displaces coal and complements renewables. Appropri-ately priced carbon pricing schemes can be very effective in encouraging coal-to-gas switching. This has proved to be quite effective in north-west Europe, although the UK government felt it could be more effective still and added a supplementary tax to tip the scales towards gas. Low gas prices – expected to persist long into the future – have been driving coal-to-gas switching since 2018 (figure 1).
0
5
10
15
20
25
30
Gas-coal averagefuel switching
Bottom of the lignite-to-gas fuel switching range
Historical prices Forward pricesTTF*
Eur/MWh
201720162015 20192018 20212020 20232022
Gas-lignite averagefuel switching
11 GLObAL GAS DEmAND: fORKING pATHS
However, Covid-19 could push back the start of carbon market schemes elsewhere in the world.
GGR states that LNG demand might also go up for heavy-duty vehicles and shipping. However, gas demand in buildings is likely to remain relatively flat.
However, more investment in infrastructure, including transmission and distribution networks and storage, as well as new technologies and innovation, will be required to bring gas to consumers.
The GGR says that “establishment of trading hubs and financial derivatives will contribute to enhanced competitive-ness and liquidity in the market through transparent price discovery and risk management.”
Cost-competitiveness, enabling policy and the speed of infrastructure build-out are key to drive the recovery in natural gas demand in emerging markets after the Covid-19 pandemic. This is particularly so in the Asia-Pacific region which is most likely to be the largest growth centre with 28% of the total by 2040. China is on the way to grow its gas network by about 60% by 2025.
According to the International Energy Agency (IEA) global gas demand is expected to fall by 4% this year versus last year but then to recover, resulting in average gas demand growth
64
3
76
18
15
15
8
Middle East
CIS
Asia Pacific
North America
Africa
Latin America
Europe
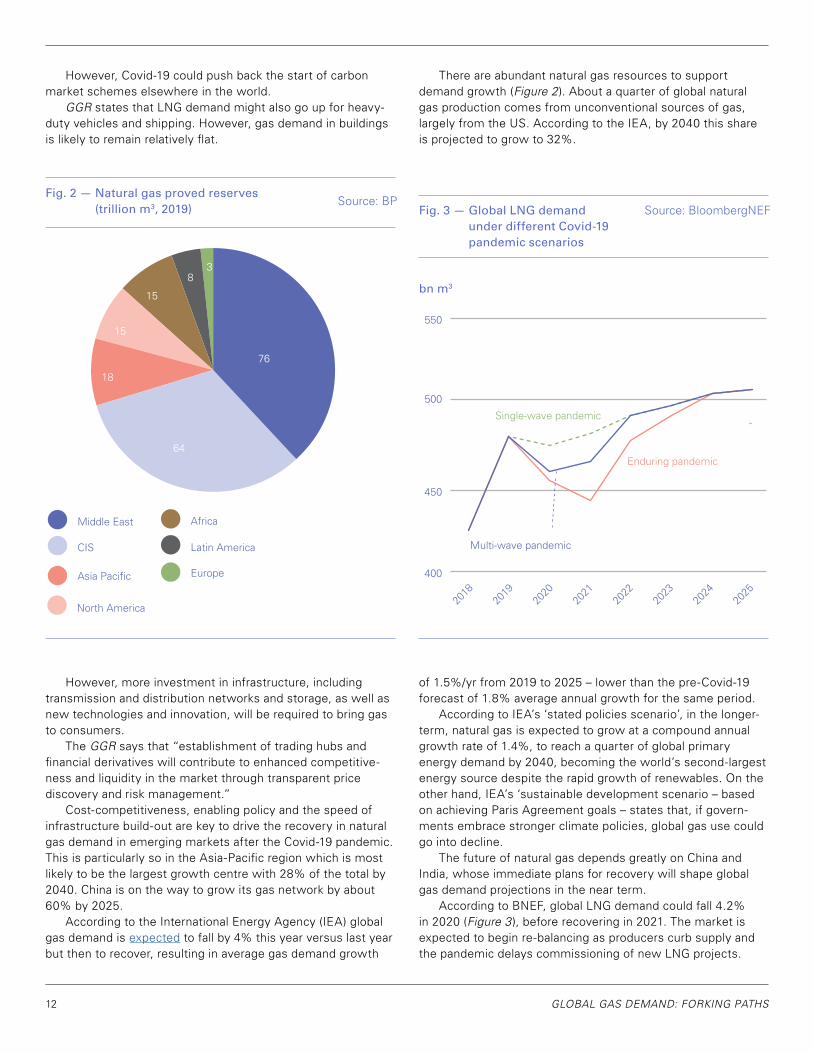
There are abundant natural gas resources to support demand growth (figure 2). About a quarter of global natural gas production comes from unconventional sources of gas, largely from the US. According to the IEA, by 2040 this share is projected to grow to 32%.
Fig. 2 — Natural gas proved reserves (trillion m3, 2019) Fig. 3 — Global LNG demand
under different Covid-19 pandemic scenarios
bn m3
Source: BPSource: BloombergNEF
of 1.5%/yr from 2019 to 2025 – lower than the pre-Covid-19 forecast of 1.8% average annual growth for the same period.
According to IEA’s ‘stated policies scenario’, in the longer-term, natural gas is expected to grow at a compound annual growth rate of 1.4%, to reach a quarter of global primary energy demand by 2040, becoming the world’s second-largest energy source despite the rapid growth of renewables. On the other hand, IEA’s ‘sustainable development scenario – based on achieving Paris Agreement goals – states that, if govern-ments embrace stronger climate policies, global gas use could go into decline.
The future of natural gas depends greatly on China and India, whose immediate plans for recovery will shape global gas demand projections in the near term.
According to BNEF, global LNG demand could fall 4.2% in 2020 (figure 3 ), before recovering in 2021. The market is expected to begin re-balancing as producers curb supply and the pandemic delays commissioning of new LNG projects.
400
500
550
BCM
450
Enduring pandemic
Multi-wave pandemic
Single-wave pandemic
2025
2024
2023
2022
2021
2020
2019
2018
12 GLObAL GAS DEmAND: fORKING pATHS

2013
2010
2016
2019
2022
2025
2028
2031
2033
2037
2040
0
BCM
700
600
500
400
300
200
100
RussiaAtlantic Basin
U.S.
East AfricaWest AfricaOther MENA
Qatar
Pacific Basin
Australia
Demand
However, if the pandemic stretches well into 2021 there will be knock-on implications for critical gas infrastructure build-out in emerging Asia – creating bottlenecks for gas demand growth. That may have greater implications on demand recovery post-2021. Nevertheless, post-2021 to 2022 global LNG demand growth will return driven by low prices
Continuing oversupply of LNG is expected to keep prices low until at least 2030. Abundant supplies and low prices can make LNG more accessible to new importers. And with increas-ing commoditisation and new market developments, LNG can remain a cost-competitive energy supply option in the long-run.
What happens beyond 2030 depends greatly on the extent at which decarbonisation policies are implemented globally.
DECARBONISATION: WHAT IT MEANS FOR GAS
As the world recovers from the Covid-19 pandemic, economic recovery will require global energy supply to grow, but its envi-ronmental impact will need to be abated. According to the IEA, “in 2018 natural gas use resulted in 50% fewer carbon dioxide emissions than coal per unit of electricity generated by the power sector, and 33% fewer carbon dioxide emissions on average per unit of heat used in the industry and buildings sectors, than coal.”
However, BNEF’s CEO, Jon Moore, said: “It is increasingly clear that the goals of the Paris Agreement cannot be met without a substantial scale-up of clean gas technologies, such as hydrogen.”
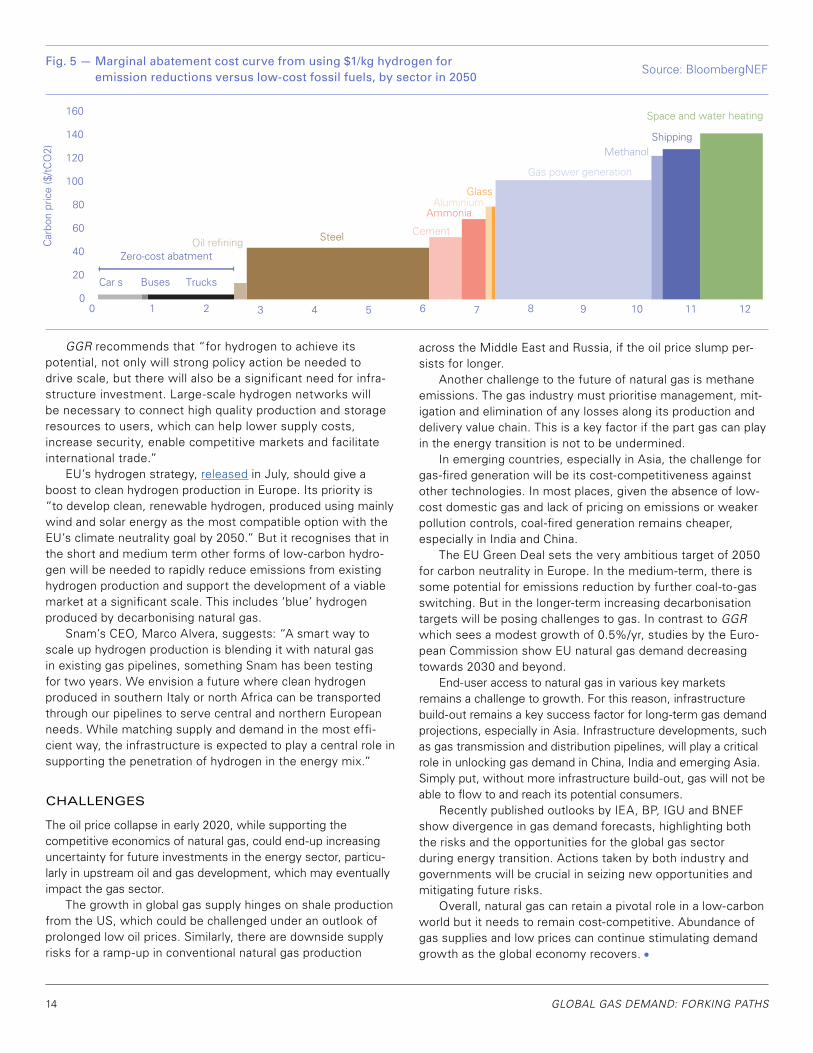
In its report Gas Technology and Innovation for a Sustain-able future, published in July, IGU shows that low-carbon “gas technologies could abate up to 12 gigatons, or 30%, of energy-related greenhouse gas emissions by 2040 (figure 5 ). These technologies include a spectrum of end use, distributed, and low-carbon gas production technologies, such as carbon capture use and storage, and hydrogen.”
Hydrogen presents a major opportunity to decarbonise gas, but it is not yet cost-competitive. IGU states that “a policy-driven scale-up could reduce delivered costs down from around $4/kg today to around $2/kg in 2030, and $1/kg in 2050, opening up possibilities in a variety of commercial applications,” especially in hard-to-abate sectors, where direct electrification with renewable power is difficult.
With strong policy support, including stronger carbon emission pricing at a global scale, by 2050 hydrogen has the potential to meet up to 15% of final energy consumption based on current policies. The marginal abatement costs from using $1/kg hydrogen for emission reductions versus low-cost fossil fuels are shown by sector in 2050 in figure 5.
and the long-term emission reduction policies, albeit at lower growth rates than pre-Covid-19.
In the longer-term, after a major year of final investment decisions (FID) on LNG supply projects in 2019, based on BNEF’s latest supply-demand balance forecast the global LNG market is not expected to need new supplies until after 2030 (figure 4).
Fig. 4 — Global LNG supply-demand outlook Source: BloombergNEF
bn m3
13 GLObAL GAS DEmAND: fORKING pATHS
Car s Buses
Zero-cost abatment
Trucks
Oil refining Steel Cement
AmmoniaAluminium
Glass
Methanol
Gas power generation
Shipping
Space and water heating
91 2 3 4 5 6 7 8 10 11 12
20
40
60
80
100
120
140
160
Car
bon
pric
e ($
/tC
O2)
00
GGR recommends that “for hydrogen to achieve its potential, not only will strong policy action be needed to drive scale, but there will also be a significant need for infra-structure investment. Large-scale hydrogen networks will be necessary to connect high quality production and storage resources to users, which can help lower supply costs, increase security, enable competitive markets and facilitate international trade.”
EU’s hydrogen strategy, released in July, should give a boost to clean hydrogen production in Europe. Its priority is “to develop clean, renewable hydrogen, produced using mainly wind and solar energy as the most compatible option with the EU’s climate neutrality goal by 2050.” But it recognises that in the short and medium term other forms of low-carbon hydro-gen will be needed to rapidly reduce emissions from existing hydrogen production and support the development of a viable market at a significant scale. This includes ‘blue’ hydrogen produced by decarbonising natural gas.
Snam’s CEO, Marco Alvera, suggests: “A smart way to scale up hydrogen production is blending it with natural gas in existing gas pipelines, something Snam has been testing for two years. We envision a future where clean hydrogen produced in southern Italy or north Africa can be transported through our pipelines to serve central and northern European needs. While matching supply and demand in the most effi-cient way, the infrastructure is expected to play a central role in supporting the penetration of hydrogen in the energy mix.”
CHALLENGES
The oil price collapse in early 2020, while supporting the competitive economics of natural gas, could end-up increasing uncertainty for future investments in the energy sector, particu-larly in upstream oil and gas development, which may eventually impact the gas sector.
The growth in global gas supply hinges on shale production from the US, which could be challenged under an outlook of prolonged low oil prices. Similarly, there are downside supply risks for a ramp-up in conventional natural gas production
across the Middle East and Russia, if the oil price slump per-sists for longer.
Another challenge to the future of natural gas is methane emissions. The gas industry must prioritise management, mit-igation and elimination of any losses along its production and delivery value chain. This is a key factor if the part gas can play in the energy transition is not to be undermined.
In emerging countries, especially in Asia, the challenge for gas-fired generation will be its cost-competitiveness against other technologies. In most places, given the absence of low-cost domestic gas and lack of pricing on emissions or weaker pollution controls, coal-fired generation remains cheaper, especially in India and China.
The EU Green Deal sets the very ambitious target of 2050 for carbon neutrality in Europe. In the medium-term, there is some potential for emissions reduction by further coal-to-gas switching. But in the longer-term increasing decarbonisation targets will be posing challenges to gas. In contrast to GGR which sees a modest growth of 0.5%/yr, studies by the Euro-pean Commission show EU natural gas demand decreasing towards 2030 and beyond.
End-user access to natural gas in various key markets remains a challenge to growth. For this reason, infrastructure build-out remains a key success factor for long-term gas demand projections, especially in Asia. Infrastructure developments, such as gas transmission and distribution pipelines, will play a critical role in unlocking gas demand in China, India and emerging Asia. Simply put, without more infrastructure build-out, gas will not be able to flow to and reach its potential consumers.
Recently published outlooks by IEA, BP, IGU and BNEF show divergence in gas demand forecasts, highlighting both the risks and the opportunities for the global gas sector during energy transition. Actions taken by both industry and governments will be crucial in seizing new opportunities and mitigating future risks.
Overall, natural gas can retain a pivotal role in a low-carbon world but it needs to remain cost-competitive. Abundance of gas supplies and low prices can continue stimulating demand growth as the global economy recovers.
Fig. 5 — Marginal abatement cost curve from using $1/kg hydrogen for emission reductions versus low-cost fossil fuels, by sector in 2050
Source: BloombergNEF
14 GLObAL GAS DEmAND: fORKING pATHS

We welcome industry experts from around the world to submit an abstract for the chance to be selected to speak at the global gas conference. For more details on how to submit visit www.wgc2021.org
HOST ASSOCIATION HOST PARTNER PRESENTED BY
Call for Papers [email protected]
Sponsorship [email protected]
General [email protected]
28th World Gas Conference21-25 June, 2021 Daegu, Korea
Submission Deadline: October 19, 2020

Stakes in a US liquefaction terminal and in an LNG-focused company are in the process of changing hands. Dominion Energy is selling a 25% operating interest in the Cove Point LNG terminal in Maryland to Berkshire Hathaway as part of a broader transaction involving the handover of most of its natural gas transmission and storage assets.
And separately, Blackstone Group is selling its stake of around 41% in Cheniere Energy Partners to Brookfield Asset Management’s infrastructure unit, as well as to its own Blackstone Infrastructure Partners unit.
These transactions – not to mention Brookfield’s acquisition of a 25% interest in Cove Point LNG in late 2019 – are noteworthy for the involvement of deep-pocketed companies that do not specialise in natural gas or liquefaction. Blackstone and Brookfield are both alternative asset management firms, while Berkshire Hathaway is a giant holding company.
In addition, the transactions illustrate that while proposed US LNG terminals are struggling to move forward and secure financing against a backdrop of global oversupply and low prices, investing in
existing facilities is still an appealing option. Indeed, these buyers – or other players – may pursue the acquisition of further LNG assets.
CHENIERE PARTNERSHIP STAKE
The transaction involving Blackstone’s stake in Cheniere Energy Partners was confirmed in an August 22 filing with the US Securi-ties and Exchange Commission (SEC). The deal involved a $34.25 per unit sale price, which puts its overall value at around $7bn, a source familiar with the transaction told NGW. The stake will be split between Blackstone and Brookfield on a roughly 50:50 basis, with each thus owning almost 21% in Cheniere Energy Partners upon the deal’s completion this month.
Cheniere Energy Partners is a limited partnership formed by LNG producer Cheniere Energy to build, own and operate the Sabine Pass LNG export terminal – the first to start up in the US over the past few years – in Louisiana. Blackstone agreed to invest around $1.5bn in the partnership in 2012 through its Blackstone Energy Partners private equity fund.
Deep-pocketed investors are seeking to benefit from buying into certain US LNG operations, whose long-term future is backed
by contracts and energy market sentiment.
US LNG ASSETS CHANGE HANDS
Anna Kachkova
The tanker Meridian Spirit moored at Cheniere Energy’s Sabine Pass LNG export terminal.
Source: Cheniere Energy
16 VOL 5, ISSUE 17 | 14 SEPTEMBER 202016

The transfer of half of this interest to Blackstone Infrastructure comes as Cheniere finishes building the sixth and final liquefaction train at Sabine Pass and prepares to move to a purely operational phase at the plant. According to the source, Blackstone Infrastruc-ture does not have a time horizon for selling a given asset and can own it over the long term – unlike Blackstone Energy, which typically has a shorter holding period.
Illustrating the potential attractiveness to investors, Cheniere has previously estimated that by the time Train 6 at Sabine Pass enters service – now scheduled for 2022 – the fixed fees paid by offtakers will amount to $3.3bn/yr.
In an August 24 note, financial services firm Morningstar com-mented that the transaction represented a success for Blackstone, given the size of the deal compared with its original investment in Cheniere. However, it did not rule out that Brookfield may buy out Blackstone Infrastructure’s stake in the future, or even acquire Cheniere Energy Partners outright.
“With virtually all future development activity expected to take place at the Cheniere Energy level, Cheniere Energy Partners has more or less served its purpose as a capital-raising vehicle, and we do not expect it to exist over the long run,” Morningstar said.
Morningstar energy strategist Stephen Ellis, who authored the note, clarified this for NGW. “When I say Cheniere Energy Partners will cease to exist, that means the current public equity ownership will eventually transfer to private hands, either entirely owned by Brook-field, another party, or as a private subsidiary of Cheniere Energy itself.”
Asked who else may be interested in stepping in at a future date, Ellis suggested Berkshire Hathaway. “As it stands now though, given its new ownership, I’d give Brookfield a slight edge,” he said.
Morningstar described Brookfield as “an experienced and long-term oriented infrastructure investor, which could be useful for further capital-raising efforts from the Cheniere entities”.
DOMINION STEPS BACK
The Dominion transaction, meanwhile, comes as the gas and utility company adjusts its business to better pursue its goal of net zero greenhouse gas (GHG) emissions by 2050.
When Dominion sold a 25% stake in Cove Point LNG to Brook-field last year for just over $2bn, it cited its intention to “establish a permanent capital structure for Cove Point”. The Berkshire Hathaway transaction, by contrast, comes as part of a broader shift away from fossil fuels and towards “state-regulated, sustainabili-ty-focused utilities”.
The operated interest in Cove Point is one of a package which also includes stakes in small-scale LNG ventures and is valued at $9.7bn in total, including $5.7bn worth of debt.
“Berkshire Hathaway’s purchase of gas transmission and storage assets includes one of the transmission lines Cove Point connects into, as well as other LNG assets, such as Dominion’s stake in the JAX LNG facility in Jacksonville, Flor-ida, and the Trussville LNG facility in Alabama,” Dominion told NGW. But it denied there were plans to sell its remaining 50% non-operated interest in Cove Point. “Natural gas is the energy source allowing us to more quickly expand our solar and wind portfolios and will remain an integral part of our energy mix for years to come,” it said. However, at this point “it makes sense for the day-to-day operations to be overseen by Berkshire Hathaway.”
Another Morningstar equity analyst, Charles Fishman, agreed that it did indeed make sense for Berkshire Hathaway to assume operatorship of Cove Point. This is because the broader handover of gas assets includes personnel, presumably including those with experience of operating the terminal.
However, Morningstar said previously that it believes cash flow from Cove Point to be more important to dividend security than any other asset Dominion owns, and this could factor into the company’s desire to retain a 50% interest in the facility. Morningstar describes Cove Point as a wide-moat asset – or one that has a long-term competitive advantage. “In the case of Cove Point it’s really because of the quality of the take-or-pay contract with the two counterparties,” Fishman told NGW. The counterparties in question are a joint venture between Japanese firms Sumitomo and Tokyo Gas, and a subsidiary of India’s Gail.
“The 20-year agreement with each of these creditworthy counterparties has a fixed fee that covers all operating and capital costs, including profit,” Morningstar said in a report on Dominion. “Natural gas is supplied by the counterparties. Thus, Dominion takes no commodity or volume risk.”
On top of the only risk for Dominion and its partners in Cove Point being operational, Fishman said he considers it unlikely that any other major LNG export terminal would be licensed on the US East Coast soon. This gives the facility a further competitive edge that may have boosted the facility’s attractiveness for the compa-nies buying into it.
Berkshire Hathaway declined to comment, while Brookfield did not respond to NGW ’s query. However, Fishman said Cove Point was certainly the kind of infrastructure project investment that would appeal to both firms. Indeed, given Brookfield’s upcoming acquisition of the Cheniere Partners stake, it appears that the current challenges faced by the LNG market have not deterred it from pursuing similar investments after buying into Cove Point last year.
“ With virtually all future development activity expected to take place at the Cheniere Energy level, Cheniere Energy Partners has more or less served its purpose as a capital-raising vehicle, and we do not expect it to exist over the long run.”
— MORNINGSTAR
17 uS LNG ASSETS cHANGE HANDS

Russia is seeking to expand the market for gas as a vehicle fuel, now considered a niche, to utilise more of its ample gas supply, lower fuel costs and reduce emissions. It wants to achieve this with a range of subsidies for vehicle owners, infrastructure devel-opers and automakers alike.
The challenge that has traditionally faced the industry is the lack of infrastructure deterring vehicle manufacturing and vice-versa. The government is hoping to sidestep this impasse by encouraging both sides of the market.
It decreed in June that the subsidies available for convert-ing vehicles to run on LNG or compressed natural gas (CNG) would double.
Under a decree signed by prime minister Mikhail Mishustin, the government now covers 60% of the cost instead of 30% pre-viously. A further 30% is borne by state-owned Gazprom, by far
the biggest player in Russia’s natural gas vehicle (NGV) market, leaving the owner responsible for just a tenth of the cost.
The hike in subsidies, available for small- to mid-sized businesses and private citizens, was included alongside a range of anti-crisis measures introduced in response to the coronavirus pandemic. It was proposed by the energy minis-try, with strong endorsement from Gazprom. Businesses and entrepreneurs will also be able to secure a 10% discount on a limited supply of gas as fuel for one year.
The government is looking to introduce supply-side subsi-dies as well. It published a decree on September 7 setting out rules for granting support for the construction of small-scale LNG production and refuelling infrastructure. The size of these subsidies will be determined once the energy ministry has held a tender to select investors.
Moscow has brought in subsidies to push forward its natural gas vehicle initiative but market development will depend on co-ordinated progress on all fronts.
RUSSIA JUMP-STARTS NGVs
Joseph murphy
18 VOL 5, ISSUE 17 | 14 SEPTEMBER 202018
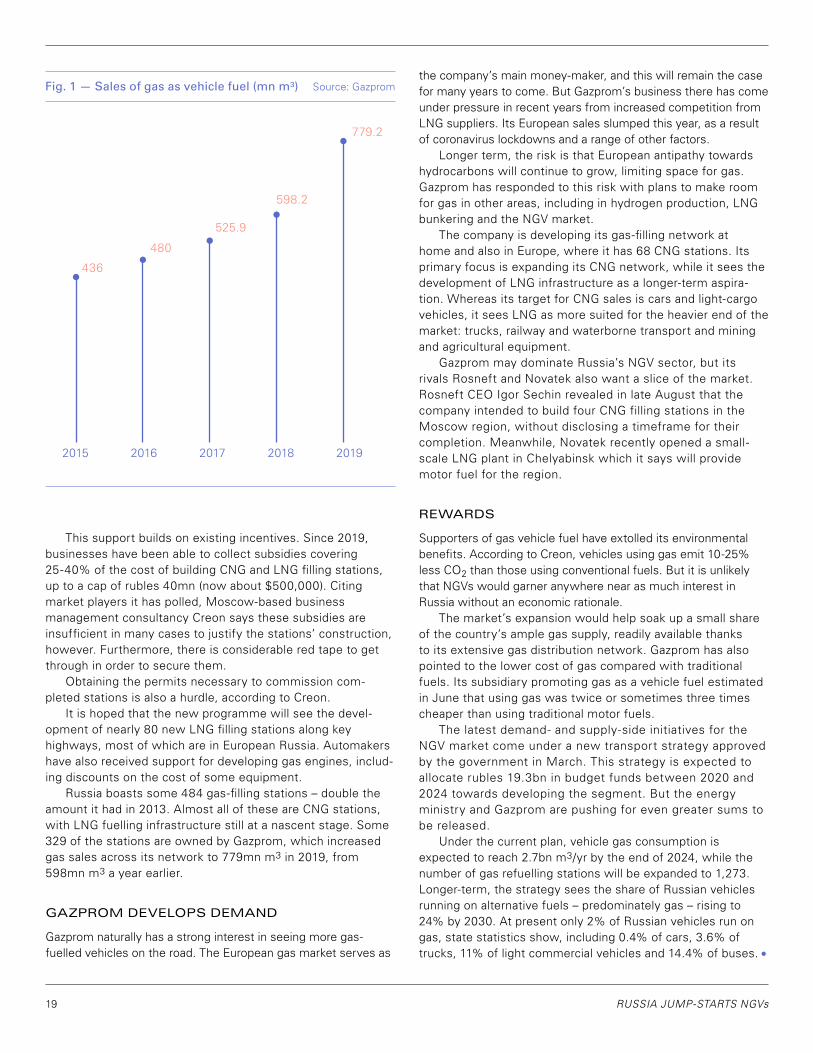
Fig. 1 — Sales of gas as vehicle fuel (mn m³) Source: Gazprom
This support builds on existing incentives. Since 2019, businesses have been able to collect subsidies covering 25-40% of the cost of building CNG and LNG filling stations, up to a cap of rubles 40mn (now about $500,000). Citing market players it has polled, Moscow-based business management consultancy Creon says these subsidies are insufficient in many cases to justify the stations’ construction, however. Furthermore, there is considerable red tape to get through in order to secure them.
Obtaining the permits necessary to commission com-pleted stations is also a hurdle, according to Creon.
It is hoped that the new programme will see the devel-opment of nearly 80 new LNG filling stations along key highways, most of which are in European Russia. Automakers have also received support for developing gas engines, includ-ing discounts on the cost of some equipment.
Russia boasts some 484 gas-filling stations – double the amount it had in 2013. Almost all of these are CNG stations, with LNG fuelling infrastructure still at a nascent stage. Some 329 of the stations are owned by Gazprom, which increased gas sales across its network to 779mn m3 in 2019, from 598mn m3 a year earlier.
GAZPROM DEVELOPS DEMAND
Gazprom naturally has a strong interest in seeing more gas-fuelled vehicles on the road. The European gas market serves as
the company’s main money-maker, and this will remain the case for many years to come. But Gazprom’s business there has come under pressure in recent years from increased competition from LNG suppliers. Its European sales slumped this year, as a result of coronavirus lockdowns and a range of other factors.
Longer term, the risk is that European antipathy towards hydrocarbons will continue to grow, limiting space for gas. Gazprom has responded to this risk with plans to make room for gas in other areas, including in hydrogen production, LNG bunkering and the NGV market.
The company is developing its gas-filling network at home and also in Europe, where it has 68 CNG stations. Its primary focus is expanding its CNG network, while it sees the development of LNG infrastructure as a longer-term aspira-tion. Whereas its target for CNG sales is cars and light-cargo vehicles, it sees LNG as more suited for the heavier end of the market: trucks, railway and waterborne transport and mining and agricultural equipment.
Gazprom may dominate Russia’s NGV sector, but its rivals Rosneft and Novatek also want a slice of the market. Rosneft CEO Igor Sechin revealed in late August that the company intended to build four CNG filling stations in the Moscow region, without disclosing a timeframe for their completion. Meanwhile, Novatek recently opened a small-scale LNG plant in Chelyabinsk which it says will provide motor fuel for the region.
REWARDS
Supporters of gas vehicle fuel have extolled its environmental benefits. According to Creon, vehicles using gas emit 10-25% less CO2 than those using conventional fuels. But it is unlikely that NGVs would garner anywhere near as much interest in Russia without an economic rationale.
The market’s expansion would help soak up a small share of the country’s ample gas supply, readily available thanks to its extensive gas distribution network. Gazprom has also pointed to the lower cost of gas compared with traditional fuels. Its subsidiary promoting gas as a vehicle fuel estimated in June that using gas was twice or sometimes three times cheaper than using traditional motor fuels.
The latest demand- and supply-side initiatives for the NGV market come under a new transport strategy approved by the government in March. This strategy is expected to allocate rubles 19.3bn in budget funds between 2020 and 2024 towards developing the segment. But the energy ministry and Gazprom are pushing for even greater sums to be released.
Under the current plan, vehicle gas consumption is expected to reach 2.7bn m3/yr by the end of 2024, while the number of gas refuelling stations will be expanded to 1,273. Longer-term, the strategy sees the share of Russian vehicles running on alternative fuels – predominately gas – rising to 24% by 2030. At present only 2% of Russian vehicles run on gas, state statistics show, including 0.4% of cars, 3.6% of trucks, 11% of light commercial vehicles and 14.4% of buses.
436
2015 2016 2017 2018 2019
480
525.9
598.2
779.2
19 RuSSIA Jump-STARTS NGvs

Renewable gas can not only reduce emissions, but it can also help integrate the energy and agricultural sectors, create rural jobs, develop a circular economy, diversify future energy supply and avoid stranded natural gas assets. And it can be used in sectors difficult to electrify such as heat and heavy transport.
‘Green’ gas depends heavily on government subsidies or carbon pricing, and feedstocks. Unlike biofuels, which can encourage the destruction of forests and agricultural land to grow the feedstock, biogas is produced mainly from agricul-tural and food waste, crops and landfill gas sites which would otherwise vent methane. It is about 65% methane so it needs refining into biomethane before being liquefied or injected into the grid. The allowable limits for impurities in renewable natural gas (RNG) vary by pipeline and are a point of contention within the industry.
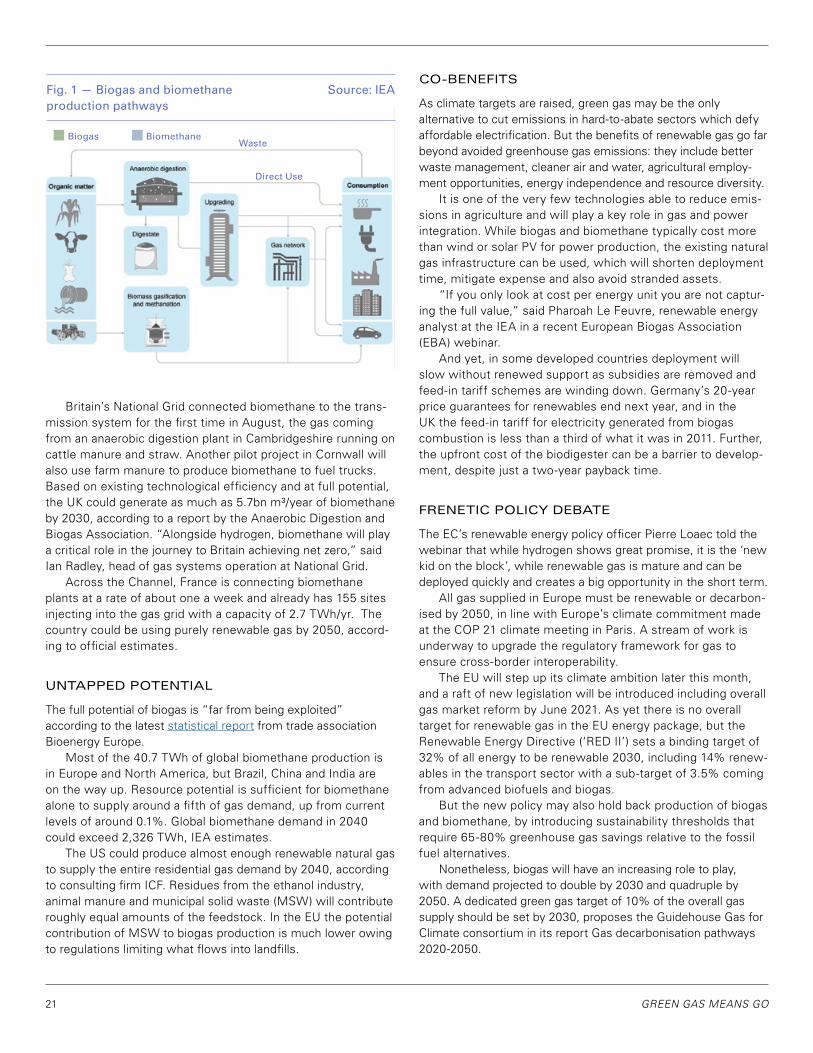
WHAT ARE BIOGAS AND BIOMETHANE?
In Europe, 72% of the feedstocks used for biogas production comes from agriculture, while in the US it mostly comes from landfill gas. Biogas can be used as a generation fuel, although it is not cost-competitive with natural gas, particularly after the downward price pressure caused by lower demand during the Covid-19 pandemic and growing supply from other renewables.
The growth prospects are better for biomethane. Biogas upgrading facilities and biomass gasification plants have increased around five-fold over the last decade and are likely to exceed 1,000 worldwide this year, according to the International Energy Agency (IEA). Around three fifths of plants inject biom-ethane into the gas distribution network, the other two-fifths being split equally between vehicle fuel and other end uses.
Biogas and biomethane represent a small proportion of total global natural gas demand, but could play an important role in the future energy mix
given appropriate policy measures.
GREEN GAS MEANS GO
caroline Gentry
20 VOL 5, ISSUE 17 | 14 SEPTEMBER 202020
Britain’s National Grid connected biomethane to the trans-mission system for the first time in August, the gas coming from an anaerobic digestion plant in Cambridgeshire running on cattle manure and straw. Another pilot project in Cornwall will also use farm manure to produce biomethane to fuel trucks. Based on existing technological efficiency and at full potential, the UK could generate as much as 5.7bn m³/year of biomethane by 2030, according to a report by the Anaerobic Digestion and Biogas Association. “Alongside hydrogen, biomethane will play a critical role in the journey to Britain achieving net zero,” said Ian Radley, head of gas systems operation at National Grid.
Across the Channel, France is connecting biomethane plants at a rate of about one a week and already has 155 sites injecting into the gas grid with a capacity of 2.7 TWh/yr. The country could be using purely renewable gas by 2050, accord-ing to official estimates.
UNTAPPED POTENTIAL
The full potential of biogas is “far from being exploited” according to the latest statistical report from trade association Bioenergy Europe.
Most of the 40.7 TWh of global biomethane production is in Europe and North America, but Brazil, China and India are on the way up. Resource potential is sufficient for biomethane alone to supply around a fifth of gas demand, up from current levels of around 0.1%. Global biomethane demand in 2040 could exceed 2,326 TWh, IEA estimates.
The US could produce almost enough renewable natural gas to supply the entire residential gas demand by 2040, according to consulting firm ICF. Residues from the ethanol industry, animal manure and municipal solid waste (MSW) will contribute roughly equal amounts of the feedstock. In the EU the potential contribution of MSW to biogas production is much lower owing to regulations limiting what flows into landfills.
CO-BENEFITS
As climate targets are raised, green gas may be the only alternative to cut emissions in hard-to-abate sectors which defy affordable electrification. But the benefits of renewable gas go far beyond avoided greenhouse gas emissions: they include better waste management, cleaner air and water, agricultural employ-ment opportunities, energy independence and resource diversity.
It is one of the very few technologies able to reduce emis-sions in agriculture and will play a key role in gas and power integration. While biogas and biomethane typically cost more than wind or solar PV for power production, the existing natural gas infrastructure can be used, which will shorten deployment time, mitigate expense and also avoid stranded assets.
“If you only look at cost per energy unit you are not captur-ing the full value,” said Pharoah Le Feuvre, renewable energy analyst at the IEA in a recent European Biogas Association (EBA) webinar.
And yet, in some developed countries deployment will slow without renewed support as subsidies are removed and feed-in tariff schemes are winding down. Germany’s 20-year price guarantees for renewables end next year, and in the UK the feed-in tariff for electricity generated from biogas combustion is less than a third of what it was in 2011. Further, the upfront cost of the biodigester can be a barrier to develop-ment, despite just a two-year payback time.
FRENETIC POLICY DEBATE
The EC’s renewable energy policy officer Pierre Loaec told the webinar that while hydrogen shows great promise, it is the ‘new kid on the block’, while renewable gas is mature and can be deployed quickly and creates a big opportunity in the short term.
All gas supplied in Europe must be renewable or decarbon-ised by 2050, in line with Europe’s climate commitment made at the COP 21 climate meeting in Paris. A stream of work is underway to upgrade the regulatory framework for gas to ensure cross-border interoperability.
The EU will step up its climate ambition later this month, and a raft of new legislation will be introduced including overall gas market reform by June 2021. As yet there is no overall target for renewable gas in the EU energy package, but the Renewable Energy Directive (‘RED II’) sets a binding target of 32% of all energy to be renewable 2030, including 14% renew-ables in the transport sector with a sub-target of 3.5% coming from advanced biofuels and biogas.
But the new policy may also hold back production of biogas and biomethane, by introducing sustainability thresholds that require 65-80% greenhouse gas savings relative to the fossil fuel alternatives.
Nonetheless, biogas will have an increasing role to play, with demand projected to double by 2030 and quadruple by 2050. A dedicated green gas target of 10% of the overall gas supply should be set by 2030, proposes the Guidehouse Gas for Climate consortium in its report Gas decarbonisation pathways 2020-2050.
WasteBiogas Biomethane
Direct Use
Fig. 1 — Biogas and biomethane production pathways
Source: IEA
21 GREEN GAS mEANS GO
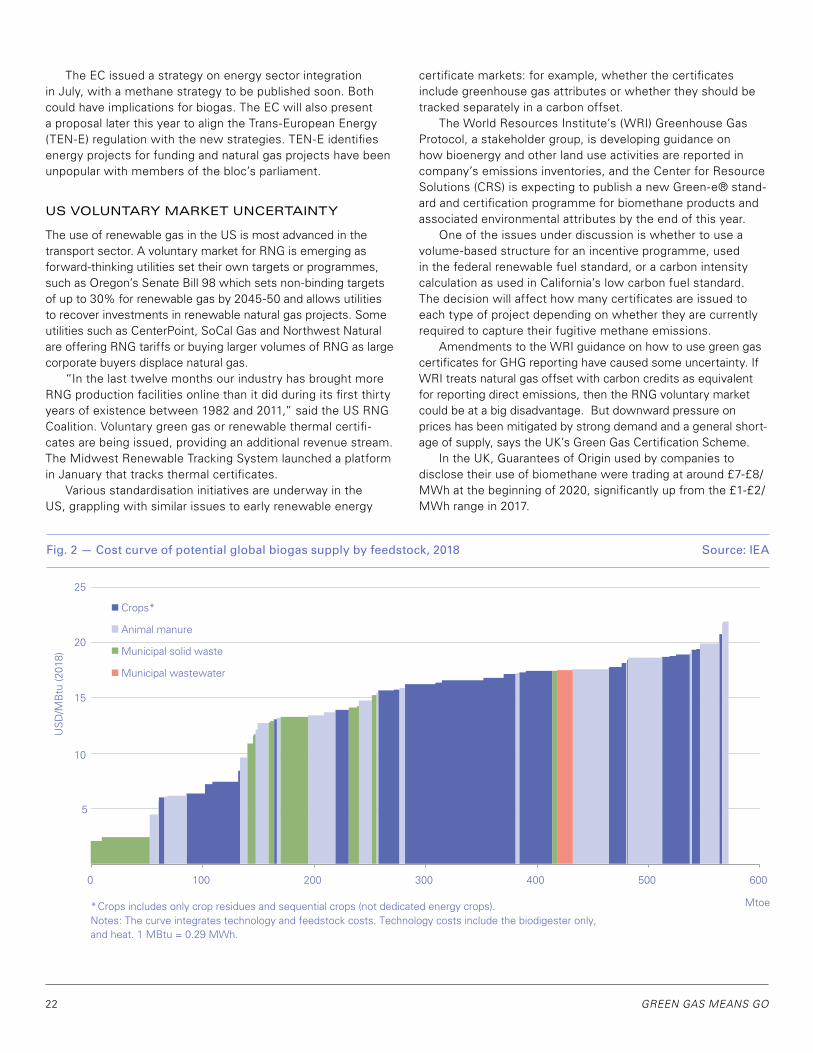
* Crops includes only crop residues and sequential crops (not dedicated energy crops). Notes: The curve integrates technology and feedstock costs. Technology costs include the biodigester only, and heat. 1 MBtu = 0.29 MWh.
5
10
15
20
25
0 100 200 300 400 500 600
US
D/M
Btu
(201
8)
Crops*
Animal manure
Municipal solid waste
Municipal wastewater
Mtoe
Fig. 2 — Cost curve of potential global biogas supply by feedstock, 2018 Source: IEA
The EC issued a strategy on energy sector integration in July, with a methane strategy to be published soon. Both could have implications for biogas. The EC will also present a proposal later this year to align the Trans-European Energy (TEN-E) regulation with the new strategies. TEN-E identifies energy projects for funding and natural gas projects have been unpopular with members of the bloc’s parliament.
US VOLUNTARY MARKET UNCERTAINTY
The use of renewable gas in the US is most advanced in the transport sector. A voluntary market for RNG is emerging as forward-thinking utilities set their own targets or programmes, such as Oregon’s Senate Bill 98 which sets non-binding targets of up to 30% for renewable gas by 2045-50 and allows utilities to recover investments in renewable natural gas projects. Some utilities such as CenterPoint, SoCal Gas and Northwest Natural are offering RNG tariffs or buying larger volumes of RNG as large corporate buyers displace natural gas.
“In the last twelve months our industry has brought more RNG production facilities online than it did during its first thirty years of existence between 1982 and 2011,” said the US RNG Coalition. Voluntary green gas or renewable thermal certifi-cates are being issued, providing an additional revenue stream. The Midwest Renewable Tracking System launched a platform in January that tracks thermal certificates.
Various standardisation initiatives are underway in the US, grappling with similar issues to early renewable energy
certificate markets: for example, whether the certificates include greenhouse gas attributes or whether they should be tracked separately in a carbon offset.
The World Resources Institute’s (WRI) Greenhouse Gas Protocol, a stakeholder group, is developing guidance on how bioenergy and other land use activities are reported in company’s emissions inventories, and the Center for Resource Solutions (CRS) is expecting to publish a new Green-e® stand-ard and certification programme for biomethane products and associated environmental attributes by the end of this year.
One of the issues under discussion is whether to use a volume-based structure for an incentive programme, used in the federal renewable fuel standard, or a carbon intensity calculation as used in California’s low carbon fuel standard. The decision will affect how many certificates are issued to each type of project depending on whether they are currently required to capture their fugitive methane emissions.
Amendments to the WRI guidance on how to use green gas certificates for GHG reporting have caused some uncertainty. If WRI treats natural gas offset with carbon credits as equivalent for reporting direct emissions, then the RNG voluntary market could be at a big disadvantage. But downward pressure on prices has been mitigated by strong demand and a general short-age of supply, says the UK’s Green Gas Certification Scheme.
In the UK, Guarantees of Origin used by companies to disclose their use of biomethane were trading at around £7-£8/MWh at the beginning of 2020, significantly up from the £1-£2/MWh range in 2017.
22 GREEN GAS mEANS GO

The Guarantee of Origin system is being rolled out for renewable gas for more countries in the EU to meet the requirements of RED II.
Biomethane can also be used in the EU Emissions Trading Scheme (ETS), but it requires individual member states to go though a process of recognising how the gas should be tracked via the grid and very few have put in place the neces-sary processes and guidelines.
GREEN TAILPIPES
The quest for zero emission tailpipes will predominantly be pur-sued with electric battery and fuel cell vehicles, but there is a role for biomethane in certain applications such as heavy industrial use.
Several European member states have already introduced support for biomethane in transport, and the EC has an open consultation on its Strategy for a Sustainable and Smart Mobil-ity, part of the Green Deal, which will close September 23. The strategy, which should be published by the end of 2020, could include a new CO2 standard for cars and trucks. The different responsibilities of the car makers and the fuel suppliers need to be clarified though.
In the US, the federal renewable fuel standard programme and California’s Low Carbon Fuel Standard (LCFS) have set targets to reduce the carbon intensity of the transportation sector which use certificates called Renewable Identification Numbers (RINs) and LCFS credits. Other countries including China and Brazil have also introduced support schemes for biomethane in transport.
Biogas production costs (fig. 2) vary widely from between $2/mn Btu to more than $20/mn Btu depending on the region and the type of feedstock. Landfill gas systems can provide biogas for less than $3/mn Btu (about $10/MWh).
ICF estimates that most of the RNG produced in its high resource potential scenario is available in the range of $7-$20/mn Btu, which results in a cost of GHG emission reductions between $55-$300/metric ton in 2040.
23 GREEN GAS mEANS GO

Investment in new gas infrastructure and cross-border capac-ity expansions are suffering from waning investor confidence and reduced market interest across Europe. Shortcomings or gaps are particularly evident in eastern Europe, but also in southern Europe as exemplified by the once EU-backed MidCat pipeline between France and Spain which has been shelved for good on economic grounds – to the annoyance of Spanish industrial users.
A lack of expansions and new build can be mitigated by further development of virtual interconnection points (VIPs). VIPs aim to maximise cross-border capacity and market efficiency by grouping two or more interconnection points into one bookable platform. So far 16 VIPs have been established in Europe to date.
Moreover, Ukraine – a contracting party to the EU-managed Energy Community – has established virtual reverse flows on its borders with Hungary and Poland and temporarily also with Slovakia.
Fresh data from the Ukrainian gas TSO (GTSOU) shows that 4.7bn m³ of gas were imported via virtual reverse flows in the period January to August 2020, which was 38% of total imports. A total of 2.3bn m³ have been imported from Hungary via virtual flows, 1.6bn m³ from Slovakia and 0.8bn m³ from Poland. Virtual reverse flows became available for the first time this year. Mean-while, total imports in the period stood at 12.5bn m³, up 30% year-on-year.
The virtual reverse flows have increasingly enabled shippers in Europe to take advantage of Ukraine’s 30bn m³ of storage
Eastern Europe shows that virtual interconnection points can be a useful tool to improve market efficiency and boost cross-border trade at low cost.
E EUROPE LIBERALISES
BORDER TRADE
Andreas Walstad
24 VOL 5, ISSUE 17 | 14 SEPTEMBER 202024

capacity. Gas storage facilities across EU countries are over 90% full on average thanks to the global supply glut and demand crash. The ability to put more gas into Ukrainian storage – which has further been boosted by attractive tariffs – means storage there is now around 85% full, according to transparency data published by Gas Infrastructure Europe (see box).
SLOVAKIAN BORDER ISSUES
However, the virtual reverse flow agreement on the Ukraini-an-Slovakian border is only temporary and follows a dispute after Slovakian TSO Eustream complained that the Ukraininan TSO had given too short notice with regards to maintenance work on a minor pipeline. On September 1, GTSOU started repair works on the 42.5mn m³/day Budince section of the Luping-4 gas pipeline which it plans to complete by September 21.
In the end it was agreed that during the repair works, import capacities will be available at the much larger 200mn m³/day Uzhgorod-Velke Kapusany interconnection point, also on the Ukrainian-Slovakian border. GTSOU said the virtual reverse flows more than offset the temporarily unavailable capacities at Budince.
It is worth noting that EU and Energy Community nations are not obliged to implement virtual flows on their borders. Current EU rules only apply to borders between EU countries.
“There are still issues on the Slovakian-Ukrainian border, however both sides are already doing more than they are obliged to under the current regulatory regime. Ukraine, as a contracting party to the Energy Community, is very eager to implement VIPs on its borders, including with EU countries,” the head of the gas unit at the Energy Community Predrag Grujicic told NGW.
Ukraine has the aspirations to become a regional gas hub, and there are reasons to be optimistic that it will succeed after having implemented a number of market reforms in recent years.
“Ukraine is a relatively advanced, big market with an inde-pendent transmission system operator. It has a lot of domestically produced gas and several European traders have entered the market. In the future, it could also import Black Sea gas from Romania. It has the potential to one day become a gas hub,” Grujicic said.
NETWORK CODES
The EU’s network code on capacity allocation mechanisms (CAM) required VIPs to be established on borders across the EU
no later than November 2018. Of the 16 or so VIPs established in the EU, 11 connect the German gas markets – Gaspool and NetConnect Germany – with neighbouring countries. There are also VIPs on the Spanish borders with France and Portugal; and between the FrenchBeLux and BeLux-Netherlands markets.
According to EU regulatory body Acer, many of the VIPs were established after the deadline, owing to uncertainties about how to handle existing contracts. About one-third of the VIPs apply virtual flows to both existing and future contracts. Acer said all the delays have made it difficult to evaluate the impact of VIPs so far.
“Due to the delayed implementation, it is too early to draw lessons on how VIPs impacted the EU gas markets and if they are effectively facilitating cross-zonal trading,” Acer said.
However, the example of Ukraine shows VIPs make it easier for shippers to access grids and that they can be instrumental in boosting market liquidity. In total, 72 traders booked gas transmission capacity from the EU to Ukraine in January-August, comprising 45 Ukrainian companies and 27 foreign companies.
MARKET TESTS
Increased market efficiency on the back of VIPs should also help mitigate the lack of investment in cross-border capacity. To this end, recent analysis carried out by Acer suggests there is little interest from market players in expanding gas networks in Europe.
For example, the economic test for expansion of the Uber-ackern 2-Uberackern Sudal cross-border interconnection point between Germany and Austria did not result in any bookings from market participants, according to Acer’s analysis. The same was the case for the Mosonmagyarovar interconnection on the Hungary-Austria border. A market test for new capacity between Hungary (Balassagyarmat), Slovakia (Velke Zlievce) and increased capacity at Austria’s Baumgarten also failed.
“The lack of sufficient conversion of non-binding demand expressions into actual capacity contracts may hint that no additional capacity is needed for market reasons and that network users in today’s gas market may have insufficient incentives to express their true interest,” said the Acer report. It also noted that contractual and physical congestion in today’s European gas mar-kets were at low levels. Moreover, market players may anticipate lower demand for gas owing to EU climate objectives. Acer said it was difficult to draw firm conclusions from the analysis.
But VIPs by definition can only work where there is at least some capacity to be aggregated and there are still some gaps in
“ The lack of sufficient conversion of non-binding demand expressions into actual capacity contracts may hint that no additional capacity is needed for market reasons and that network users in today’s gas market may have insufficient incentives to express their true interest.”
— EU ENERGY REGULATORY AGENCY ACER
25 E EuROpE LIbERALISES bORDER TRADE

the hardware, Acer notes in a separate report. It says progress seems to have slowed when it comes to building new intercon-nectors. Many EU-backed gas projects of common interest are not “shovel ready,” meaning that they often fulfil the criteria to receive EU grants and speedy regulatory approvals, but lag behind on quality project planning and non-subsidised finance.
For example, the planned 1.2bn m³/year Malta-Italy gas inter-connector – which would end Malta’s isolation from the European grid – has been delayed until at least 2025 owing to financing and environmental issues, Acer reported. Malta is now wholly reliant on LNG imports.
Expansion of transmission capacity on the border between Hungary and Slovakia also appears to have stalled. Plans for a new 5bn m³/year interconnector between Croatia and Slovenia and a 2bn m³/year interconnector between Slovenia and Hungary also look uncertain.
Meanwhile, the 3bn m³/year Interconnector Greece-Bulgaria has also been pushed back due to financing issues, but is nevertheless expected to be commissioned next year. Moreover, the EU-backed 2.4bn m³/year Poland-Lithuania interconnector is on schedule to be completed in December next year. These projects are sorely needed to further integrate the EU gas market in the area.
UKRAINE STORAGE GAINS ON VIP
Ukraine’s storage stocks have risen steadily since the agreement between the Slovak and Ukrainian transmission system opera-tors, allowing virtual reverse cross-border flow at Velke Kapusany since July.
Last year, there were 196.3 TWh in Ukrainian storage on September 6, meaning the facilities were 60.5% full, an increase on 2018. The motive for injection last summer was to provide a hedge if flows from Russia failed for any reason that winter – there was still no transit agreement with Ukraine.
This year the injection rate is higher thanks to the VIP at Velke Kapuszany coupled with the arrival of cheap gas looking for a home. As of September 6 there were 278.4 TWh in store, mean-ing the facilities were then 85.2% full. By contrast, last year the facility peaked at 228 TWh around November 2.
Between August 6 and September 6, injections rose by 36 TWh, compared with 26.7 TWh between July 6 and August 6, and just 21.1 TWh between June and July, before the VK VIP was created.
In aggregate then there are already 1,300 TWh at Europe’s (and Ukraine’s) disposal for this winter. And the final total will be even higher by the time the withdrawal season starts, which is normally late in October.
Ukraine’s total working gas capacity is 320.3 TWh but that has not been needed for decades, when it belonged to Russian gas monopoly Gazprom. Gazprom no longer uses storage there.
Europe’s gas storage facilities overall were 92.2% full Sep-tember 8, with 1,024 TWh injected out of a total possible 1,110 TWh. There are another two months or so of injection still remain-ing, although as the pressure in the facilities reaches maximum the injection rate slows down. Most of the storage, by volume, was in a handful of countries with the biggest capacity, if not the highest percentages: Germany, France, Italy and the Netherlands between them accounted for some 644 TWh or 58% of the total, as of that date.
Not all the excess LNG has ended up in European storage: power generation has used more gas in a number of countries this year than last, again owing to the low price relative to competing fuels. Its price advantage is increased by the carbon emissions price, which weighs more heavily on coal. The August heatwave in the UK also saw gas account for a big chunk of the generation mix for some weeks, until the Septem-ber winds came.
But demand generally has been lower, owing to lockdowns affecting industrial output and to the mild weather in Janu-ary-March. Europe’s biggest gas consuming country Germany, for example, took 4.6% less gas overall in the first half of the year than it did in the same period last year, according to analysis by German analysts Ageb.
– William powell
26 E EuROpE LIbERALISES bORDER TRADE
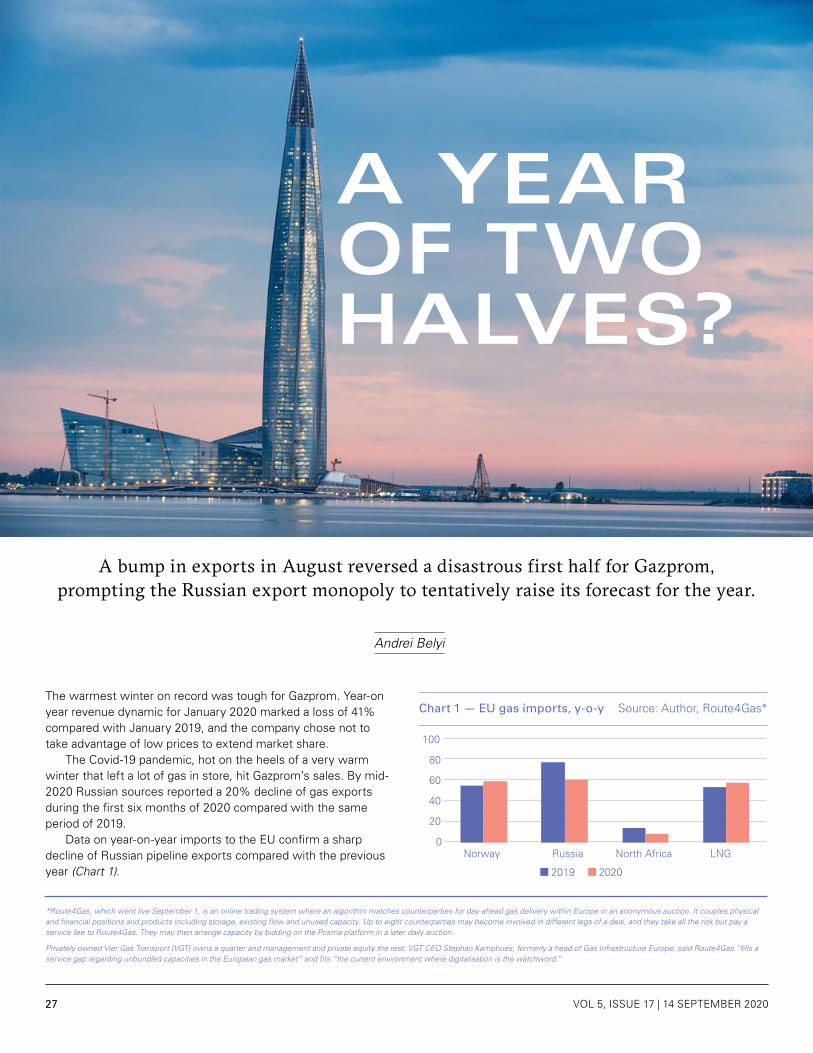
0
20
40
60
80
100
Norway Russia North Africa LNG
2019 2020
The warmest winter on record was tough for Gazprom. Year-on year revenue dynamic for January 2020 marked a loss of 41% compared with January 2019, and the company chose not to take advantage of low prices to extend market share.
The Covid-19 pandemic, hot on the heels of a very warm winter that left a lot of gas in store, hit Gazprom’s sales. By mid-2020 Russian sources reported a 20% decline of gas exports during the first six months of 2020 compared with the same period of 2019.
Data on year-on-year imports to the EU confirm a sharp decline of Russian pipeline exports compared with the previous year (chart 1).
A bump in exports in August reversed a disastrous first half for Gazprom, prompting the Russian export monopoly to tentatively raise its forecast for the year.
A YEAR OF TWO HALVES?
Andrei belyi
Chart 1 — EU gas imports, y-o-y Source: Author, Route4Gas*
*Route4Gas, which went live September 1, is an online trading system where an algorithm matches counterparties for day-ahead gas delivery within Europe in an anonymous auction. It couples physical and financial positions and products including storage, existing flow and unused capacity. up to eight counterparties may become involved in different legs of a deal, and they take all the risk but pay a service fee to Route4Gas. They may then arrange capacity by bidding on the prisma platform in a later daily auction.
privately owned vier Gas Transport (vGT) owns a quarter and management and private equity the rest. vGT cEO Stephan Kamphues, formerly a head of Gas Infrastructure Europe, said Route4Gas “fills a service gap regarding unbundled capacities in the European gas market” and fits “the current environment where digitalisation is the watchword.”
27 VOL 5, ISSUE 17 | 14 SEPTEMBER 202027

0%10%20%30%40%50%60%70%80%
Jan-
18
Mar-18
May
-18
Jul-1
8
Sep-18
Nov-18
Jan-19
Mar-19
May
-19
Jul-1
9
Sep-19
Nov-19
Jan-20
Mar-20
May
-20
Jul-2
0
0
1
2
3
01-Jan 01-Feb 01-Mar 01-Apr 01-May 01-Jun
Belarus-to-Poland
Ukraine-to-Poland
Ukraine-to-Slovakia
Ukraine-to-HungaryUkraine-to-Moldova
Despite a difficult start in terms of volume and price, Gaz-prom recently announced a revised exports forecast of 175bn m³. This small increase was based on the strong surge in August sales and suggests Gazprom hopes to take advantage of the continuous cancellations of LNG cargo shipments to Europe that has been a feature of the market since the Covid outbreak and pushed exports lower than last year. US exports fell by some 40% this summer which certainly tightened supplies to Europe as well. As a result, record-high LNG inflows in early 2020 faced a correction and LNG imports decreased (chart 2).
This downward trend in LNG supplies rather benefits piped gas imports. For instance, chart 1 also illustrates an increase of Norwegian natural gas volumes by some 6%. A decline of Russian flows in contrast to the Norwegian supplies growth is rather short term as it can be partly explained by maintenance work on Nord Stream during this summer. Hence, recovery of Nord stream deliv-eries and developments in LNG may give Gazprom a hypothetical opportunity to regain market, but under hypothesis of faster demand recovery and a colder fall and winter than in 2019.
While Gazprom’s bet on market expansion remains anyone’s guess, another Russian supplier, Novatek, has already taken advantage of the decline of US LNG inflows. Exports from Yamal rose by 5.9% year-on-year, and by 36% from Cryogas Vysotsk which started in April 2019.
The latter is in a particularly advantageous position on the Baltic coast and has significantly increased its presence in Lithuania’s Klaipeda LNG terminal. chart 3 shows that since the access rules at the Klaipeda terminal changed in March 2019, Klaipeda LNG utilisation rate has risen. By June 2020, Norway had supplied up to 70% of Klaipeda capacity, while US and Rus-sian suppliers competed almost neck-and-neck with 18% and 12% respectively. Cryogas-Vysotsk will most probably increase its share of the capacity at the terminal, which has been called – now seemingly ironically – Independence to mark Lithuania’s termination of dependence on Gazprom. It would however be correct to say that a dependence on Russian LNG does not have negative connotations for Lithuania, unlike Russian pipeline gas where Gazprom has an export monopoly.
Chart 2 — LNG Imports, y-o-y, GWh
Chart 3 — Capacity utilisation rate, Klaipeda Terminal, 2018-2020GWh
Chart 4 — Gas flows via Belarus and Ukraine (bn m3)
Source: Author, Route4Gas
Source: Author, Route4Gas
Source: Route4Gas
0
20000
40000
60000
80000
100000
120000
140000
160000
January February March April May June July
2019
2020
Apart from business risks, Gazprom faces political uncer-tainties mostly related to Nord Stream 2, completion of which has been already postponed from 2019 to the end of 2020, and its realisation remains under question mostly because of the US sanctions and a new wave of tensions in Russia-Germany political relations over the Navalnyi case.
One may rightly argue that with 55bn m³/yr of capacity, Nord Stream 2 is not a game changer for Gazprom’s positions in Europe: the task remains to regain market share amid low prices, while the company has already sufficient export capacity at its disposal in Ukraine and Belarus. chart 4 illustrates that six months flows via Belarus and Ukraine combined already reach 30bn m³, while the transit capacity – particularly via Ukraine – remains underutilised. The transit agreement with Ukraine concluded towards the very end of last year enabled increased gas flows via Uzhgorod (Ukraine-Slovakia). Data reveal Gazprom’s increasing reliance on Yamal-Europe pipeline (Belarus-to-Poland), which effectively bypassed Ukraine during the observed period. A slight decline in flows in May might be explained by technical delays caused by Gazprom’s renewal of Polish pipeline capacity by Gazprom.
28 A YEAR Of TWO HALvES?

Would Nord Stream 2 have an effect if completed? Probably yes. The table also reveals the impact of Turk Stream on Russian gas flows via Ukraine-Moldova which significantly decreased and then stopped in May. It might be worth remarking that relations
GAZPROM’S DIRE SECOND QUARTER
Gazprom’s net income nearly halved in the second quarter to rubles 153.5bn ($2.1bn) from 319.1bn a year earlier as coronavi-rus (Covid-19) lockdowns in Europe took their toll.
Revenues plunged 35% to rubles 1.16 trillion, and Gazprom swung to an operating loss of rubles 103bn, versus a rubles 322bn profit a year before. Core earnings (Ebitda) slumped to rubles 66.6bn ($1.3bn), versus $7.4bn a year earlier, with analysts at BCS Global Markets (BCS GM) describing this as the worst quarterly result in at least a dozen years.
Gazprom’s free cash flow was negative $1.8bn for the quarter, while its net debt crept up 9% to around $53bn, according to BCS GM. This led to its net debt to Ebitda ratio rising from 1.8 to 2.7.
Gazprom’s revenues from sales to Europe and other countries outside the former Soviet Union dropped 47% to rubles 756bn.
Sales volumes were down 16.7% at 98.2bn m3, while average prices were down 38% at rubles 9,475/’000 m3. Gazprom’s domestic business performed better, seeing only a 6% decline in revenues to rubles 488.7bn and only a 7% fall in volumes to 117.6bn m3.
Gazprom’s earnings were also affected by charges to reflect lower prices and a weaker ruble. But these charges were mostly booked in the first quarter, when Gazprom reported a $1.64bn loss. The table provides the data for the six months as a whole (Table 1).
– Joseph murphy
(Rmn) 2020 2019 % change
Total Sales (net tax, duties etc) 2,903,148 4,076,751 -28.79
Operating profit 189,985.0 780,878.0 -75.67
Pretax profit -16,806.0 1,125,278.0
Comprehensive income 64,658 713,358 -90.94
Gas Sales
(Bn m³) Europe, Turkey 98.2 117.9 -16.71
Rubles/'000 m³ (inc. duties, tax ) 9,475.0 15,331.0 -38.20
(Bn m³) FSU 14.9 19.1 -21.99
Rubles/'000m³ (inc. duties, tax) 9,803.5 10,637.10 -7.84
(Bn m³) Russia 117.6 126.4 -6.96
Rubles/'000 m³ (net VAT) 4,156.8 4,100.8 1.37
Table 1 - Key Gazprom earnings data (Jan-Jun) Source: Gazprom
with Belarus and Ukraine transcend gas transit business. Political developments in the two countries, Russia’s foreign policy choices and tensions between Moscow and the west may only add politi-cal uncertainties to the economic ones.
29 A YEAR Of TWO HALvES?

NATURAL GAS WORLD
EDITOR IN CHIEF
EDITOR
MANAGING DIRECTOR
ADVISORY BOARD
REGULAR CONTRIBUTORS
ASIA EDITOR AMERICAS EDITOR
EDITOR, LNG
CONDENSED
FEATURES EDITOR
William Powell
Joseph Murphy
H. Rick Gill
Rune Bjørnson; Thierry Bros; Jean-Arnold
Vinois; Jupiter Ramirez; Tatiana Mitrova
Dalga Khatinoglu, Ilham Shaban (Baku); Linas Jegelevicius (Vilnius); Omono Okonkwu (Lagos); Andrew Kemp; David
O’Byrne (Istanbul); Anna Kachkova; Dmitri Shlapentokh (South Bend); Jeremy Bowden (Exeter); Alex Forbes (Brighton); Tim Gosling (Prague), Andreas Walstad (London)
PUBLISHED UNDER LICENCE BY
Minoils Media Ltd.
1000 Cathedral Place 925 West Georgia Street Vancouver, B.C.
Canada V6C 3L2
Shardul Sharma Dale Lunan
Ross McCrackenCharles Ellinas
If you have any enquiries regarding advertising, events or past or future content, please contact:EDITORIAL
William Powell – [email protected]
EVENTS & ADVERTISING
Joao Salviano – [email protected]
PRODUCTION & LAYOUT
© Copyright 2019 – All rights reserved. Reproduction of the contents of this magazine in any form is prohibited unless with the written consent of the publisher. Subscription packages for Natural Gas World range from a private individual to any agreed number of readers within a company. Subscriptions include email notification of the latest issue, allowing it to be downloaded by as many individuals as the package covers. A package makes it easier to avoid copyright infringement as single-user licences do not cover the distribiution of the contents to third parties.
Blunt Strategic – [email protected]