Natural gas for ship propulsion in · PDF fileNatural gas for ship propulsion in Denmark...
131
Natural gas for ship propulsion in Denmark – Possibilities for using LNG and CNG on ferry and cargo routes Frank Stuer-Lauridsen and Jesper B. Nielsen LITEHAUZ Thomas Odgaard and Mikkel Birkeland IncentivePartners Claus Winter Graugaard and Lars Petter Blikom DNV Núria Muro-Suné, Morten Andersen and Frederik Øvlisen Rambøll Oil & Gas Environmental Project No. 1338 2010 Miljøprojekt
Transcript of Natural gas for ship propulsion in · PDF fileNatural gas for ship propulsion in Denmark...
Natural gas for ship propulsion in Denmark
– Possibilities for using LNG and CNG on ferry and cargo routes
Frank Stuer-Lauridsen and Jesper B. Nielsen LITEHAUZ Thomas Odgaard and Mikkel Birkeland IncentivePartners Claus Winter Graugaard and Lars Petter Blikom DNV Núria Muro-Suné, Morten Andersen and Frederik Øvlisen Rambøll Oil & Gas
Environmental Project No. 1338 2010 Miljøprojekt

The Danish Environmental Protection Agency will, when opportunity
offers, publish reports and contributions relating to environmental
research and development projects financed via the Danish EPA.
Please note that publication does not signify that the contents of the
reports necessarily reflect the views of the Danish EPA.
The reports are, however, published because the Danish EPA finds that
the studies represent a valuable contribution to the debate on
environmental policy in Denmark.
3
Table of Contents
PREFACE 7
SUMMARY AND CONCLUSIONS 9
SAMMENFATNING 13
1 INTRODUCTION 17
1.1 REDUCTION OF EMISSIONS TO AIR FROM SHIPS 17 1.2 WHAT IS NATURAL GAS AND HOW COULD IT BE USED IN
SHIPPING? 19 1.2.1 Transport of natural gas 19 1.2.2 Liquefaction plant for LNG 20 1.2.3 Description of CNG compression plant 21 1.2.4 Liquid compressed natural gas (LCNG) facility 21
1.3 ENERGY REQUIREMENTS FOR PROCESSING LNG & CNG 21 1.4 THE BIOGAS OPTION 22
2 EXPERIENCES WITH SHIPS 23
2.1 NATURAL GAS AS LNG OR CNG IN SHIPS 23 2.1.1 The space consideration 23
2.2 TECHNOLOGIES FOR SUPPLYING GAS PROPULSION 24 2.2.1 Engines suppliers 24 2.2.2 LNG propulsion in ships 24 2.2.3 LNG storage onboard 25 2.2.4 CNG propulsion technology in ships 25 2.2.5 CNG storage onboard 26 2.2.6 LNG bunkering configuration in Norway 26
2.3 DISTRIBUTION OF LNG 26 2.3.1 Current LNG infrastructure 26
2.3.1.1 LNG production plants 27 2.3.1.2 Downstream distribution of LNG 27 2.3.1.3 LNG import and export terminals in Europe 28 2.3.1.4 Transportation of LNG 28 2.3.1.5 Downstream distribution 28 2.3.1.6 LNG tanks on quay 28
2.3.2 Distribution of CNG 28 2.4 BIOGAS AS A CONTRIBUTING ALTERNATIVE 29 2.5 SUMMARY AND CONCLUSIONS 30
3 SUBSTITUTING WITH NATURAL GAS IN SHIPPING IN DENMARK 31
3.1 THE SETTING IN DENMARK – WHAT IS THE POTENTIAL? 31 3.1.1 Identifying large fuel consumers - ferry routes and major ports 31 3.1.2 Ferries calling Danish ports 33
3.1.2.1 Ferries with Danish registered company or flag 33 3.1.2.2 Ferries with foreign ownership or other flags 35
3.2 ESTIMATION OF POTENTIAL IN SHORT SEA SHIPPING 35 3.2.1 The number of ports in short sea shipping 35 3.2.2 The number of vessels 37
3.3 SCENARIOS FOR NATURAL GAS CONVERSION 38 3.3.1 Defining the scenarios 38 3.3.2 Scenario 1 – the “maximum” 39
4
3.3.3 Scenario 2 “many ferries – few cargo ports and ships” 39 3.3.4 Scenario 3 “few ferries – many cargo ports and ships” 40 3.3.5 Scenario 4 “Reduced scenario” 40
3.4 SUMMARY ON THE POTENTIAL FOR CONVERSION IN DENMARK 41
4 EMISSIONS TO AIR 43
4.1 REDUCTION OF EMISSIONS 43 4.2 THE POTENTIAL IN DENMARK 44 4.3 COMPARISON OF REDUCTIONS ACHIEVED IN SCENARIOS
1 AND 4 45 4.4 EMISSIONS OF GREENHOUSE GASSES 47 4.5 SUMMARY AND CONCLUSION ON EMISSIONS 47
5 SYNERGIES WITH LAND TRANSPORT 49
5.1 OVERVIEW 49 5.2 EXPERIENCE WITH NATURAL GAS IN LAND TRANSPORT 49
5.2.1 Natural gas as a fuel in Denmark 49 5.2.2 Natural gas as a fuel in Italy 50 5.2.3 Natural gas as a fuel in Germany 51 5.2.4 Natural gas as a fuel in Sweden 51
5.3 SECTOR’S VIEW ON NATURAL GAS AS FUEL 51 5.3.1 Hauling 51 5.3.2 Road person transport 52 5.3.3 Railways 53 5.3.4 Manufactures 53
5.4 SYNERGIES IN TRANSPORT USING NATURAL GAS AS FUEL 54 5.4.1 General synergetic effects 54 5.4.2 Specific synergetic effects 55
5.5 CONTRIBUTING PARTIES 55 5.6 SUMMARY OF SYNERGIES 56
6 OPERATIONAL CONSEQUENCES 57
6.1 EXPERIENCE USING NATURAL GAS FUELLED SHIPS IN DENMARK 57 6.1.1 CNG experiences 57 6.1.2 LNG experiences 58
6.2 REGULATOR AND LEGISLATION 58 6.3 VESSEL SAFETY 59 6.4 SUPPLY CHAIN 60
6.4.1 CNG supply chain 60 6.4.2 LNG supply chain 60
6.5 BUNKERING OPERATION 60 6.5.1 LNG bunkering facilities 61 6.5.2 Truck to ship 61 6.5.3 Ship to Ship 61
6.6 NATURAL GAS ENGINES 61 6.6.1 Using diesel engines 62 6.6.2 Dual fuel systems 62 6.6.3 Natural gas engines 62 6.6.4 Summary of experiences 63
7 LOGISTICAL CHALLENGES AND BARRIERS 65
7.1 EXPERIENCES 65 7.2 SECURITY OF SUPPLY OF NATURAL GAS COMPARED TO
CRUDE OIL 66 7.3 INFORMATION ON RISKS ASSOCIATED WITH LNG AND CNG 67
7.3.1 Risk assessment 68
5
7.3.1.1 Risks originating from the storage facility 68 7.3.1.2 Risks related to supply activities 68 7.3.1.3 Risks associated to fuelling activities 69 7.3.1.4 Risks associated to external impact on the storage facility 69 7.3.1.5 Risks related to collision involving a LNG/CNG fuelled vessels 69
7.3.2 Previous accidents – lessons learned 69 7.3.3 General risk reducing measures 69 7.3.4 Conclusions on Risk Assessment 70
7.4 BARRIERS TO THE USE OF NATURAL GAS 70 7.4.1 Technical challenges 71 7.4.2 Supply chain and bunkering 71 7.4.3 Political-administrative barriers 72 7.4.4 Economic barriers 73 7.4.5 Summary of barriers 73
8 ECONOMIC ANALYSIS 75
8.1 SUMMARY OF FINDINGS 75 8.2 BUSINESS CASE FOR NATURAL GAS 75
8.2.1 Investments in ports 77 8.2.2 Investments in ships 77 8.2.3 Expected fuel cost savings 78 8.2.4 Result of the business case 79 8.2.5 Sensitivity analysis of Scenario 4 80
9 CONCLUSIONS 83
10 REFERENCES 87
11 APPENDICES 91
11.1 APPENDIX 1: NATURAL GAS AND PROCESSING PLANTS 91 11.1.1 What is natural gas? 91
11.1.1.1 LNG supplied by ships 91 11.1.1.2 LNG produced from pipeline gas 91 11.1.1.3 CNG produced from pipeline gas 92 11.1.1.4 CNG supplied by ships 92
11.1.2 Description of a LNG liquefaction plant (Ramboll Oil and Gas) 92 11.1.2.1 LNG liquefaction plant supplied by LNG carriers 92 11.1.2.2 LNG liquefaction plant supplied by pipeline gas 93
11.1.3 Description of CNG compression plant (Ramboll Oil and Gas) 94 11.1.3.1 CNG compression plant supplied by pipeline 94 11.1.3.2 Liquid compressed natural gas facility (LCNG) 95
11.1.4 References 95 11.2 APPENDIX 2: BASIC GAS ENGINE AND DISTRIBUTION
INFORMATION 96 11.2.1 LNG propulsion in ships 96 11.2.2 LNG storage onboard 97 11.2.3 CNG propulsion technology in ships 98 11.2.4 CNG storage onboard 99 11.2.5 Bunkering configuration in Norway 99 11.2.6 Fuel cells on ships 99 11.2.7 Regulations 100 11.2.8 Distribution of LNG 100
11.2.8.1 Current LNG infrastructure 100 11.2.8.2 LNG production plants 101 11.2.8.3 Downstream distribution of LNG 101 11.2.8.4 LNG import and export terminals in Europe 102 11.2.8.5 Availability of LNG 103 11.2.8.6 Transportation of LNG 103 11.2.8.7 Downstream distribution 103 11.2.8.8 LNG tanks on quay 103
11.2.9 Distribution of CNG 104
6
11.2.10 References 104 11.3 APPENDIX 3: ECONOMICS OF LNG (DNV) 104
11.3.1 Economics of LNG distribution 104 11.3.2 References 107
11.4 APPENDIX 4: RISKS ASSOCIATED WITH CNG AND LNG 108 11.4.1 Individual risk and societal risk 108 11.4.2 Risk Acceptance Criteria (RAC) 109 11.4.3 ALARP 109 11.4.4 Risk assessment 109 11.4.5 Risks originating from the storage facility 110 11.4.6 Risks related to supply activities 111 11.4.7 Risks associated to fuelling activities 111 11.4.8 Risks associated to external impact on the storage facility 111 11.4.9 Risks related to collision involving a LNG/CNG fuelled vessels 111
11.5 APPENDIX 5: FUEL CONSUMPTION IN FERRIES AND SHORT SEA SHIPPING 112
11.5.1 Estimation of fuel consumption 113 11.5.2 Ferries calling Danish ports 114
11.5.2.1 Ferries 0-499GT 114 11.5.2.2 Ferries 500-9,999GT 114 11.5.2.3 Ferries above 10,000GT 115 11.5.2.4 Including ferries with foreign ownership or other flags 116 11.5.2.5 Summary on ferries 117
11.5.3 Estimation of potential in short sea shipping 117 11.5.3.1 The number of ports in short sea shipping 117 11.5.3.2 The number of vessels 121 11.5.3.3 Data for ferries 123 11.5.3.4 Short sea shipping data 125
11.5.4 References 127 11.6 APPENDIX 6: EMISSIONS TO AIR 128
11.6.1 Reductions achieved in Scenario 1 128 11.6.2 Reductions achieved in Scenario 2 129 11.6.3 Reductions achieved in Scenario 3 129 11.6.4 Reductions achieved in Scenario 4 130
7
Preface
The project “Natural gas as propulsion for the shipping sector in Denmark” was conducted for “Partnerskab for Renere Skibsfart” (a partnership between Danish Environmental Protection Agency (Danish Ministry of Environment) and Danish Shipowners’ Association) and DONG Energy. The project was contracted to LITEHAUZ ApS (LITEHAUZ) in association with Incentive Partners ApS (Incentive Partners), senior researcher Hans Otto Holmegaard Kristensen, Technical University of Denmark (DTU), Det Norske Veritas (DNV) and Ramboll Oil and Gas. In LITEHAUZ the team comprised Frank Stuer-Lauridsen and Jesper B. Nielsen. "Partnerskab for Renere Skibsfart" and DONG Energy would like to thank "Den Danske Maritime Fond" (The Danish Maritime Fund) for its financial contribution to the report. The project’s main task was to review logistical, technical and economic feasibility for using Liquefied Natural Gas (LNG) and Compressed Natural Gas (CNG) as fuel for ship propulsion and the supply of LNG or CNG to Danish ports from existing natural gas lines, trucks or by ship. During the study the project teams have been in contact with a number of the actors in the Danish shipping sector and other stakeholders in the maritime service sector. The willingness to provide information and share considerations regarding the fuel conversion issue is greatly appreciated and contributed to the quality of the report. Sections were delivered by various contributors: The major part of information on LNG and the Norwegian experiences was provided by DNV (Chapter 2 + Appendix 1 and 2). Ramboll Oil and Gas provided Chapters 5 and 6 under a separate contract with the Partnership and DONG Energy and contributed to sections in Chapter 1, 4 and 7. Incentive Partners was responsible for the economic analysis in Chapter 8. LITEHAUZ was the main editor and specifically responsible for Chapters 1, 2, 3, 4, 7 and 9.

8
9
Summary and conclusions
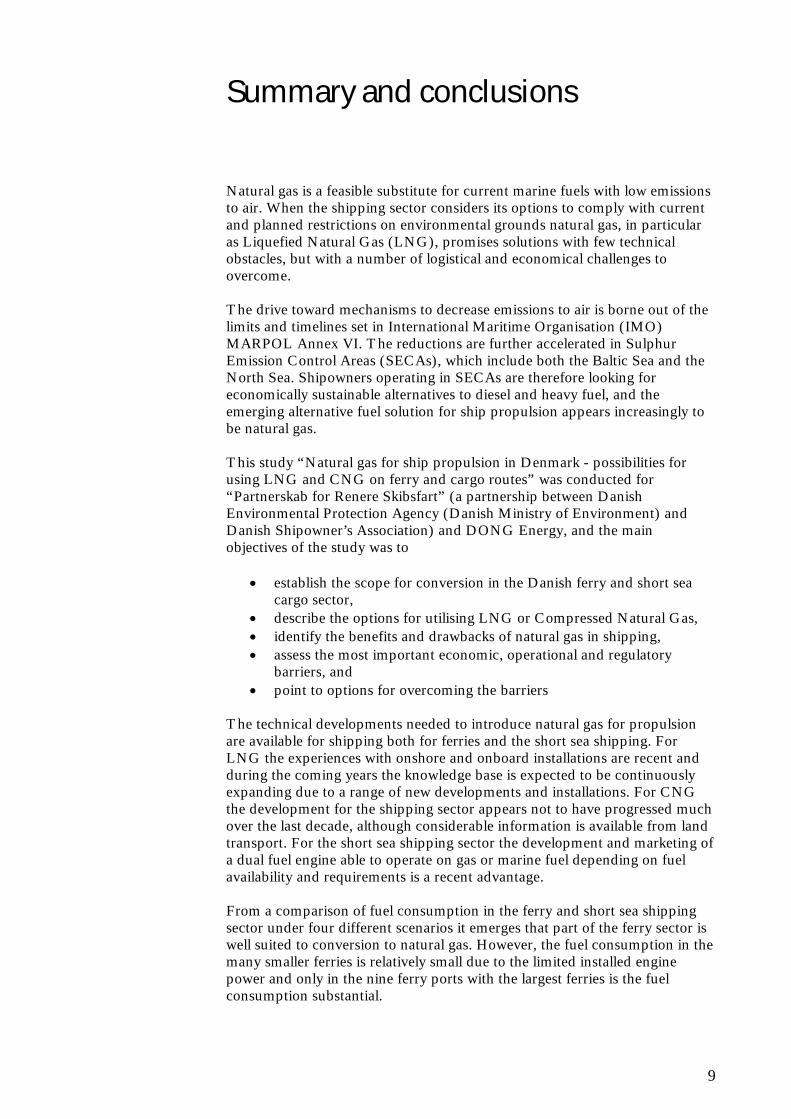
Natural gas is a feasible substitute for current marine fuels with low emissions to air. When the shipping sector considers its options to comply with current and planned restrictions on environmental grounds natural gas, in particular as Liquefied Natural Gas (LNG), promises solutions with few technical obstacles, but with a number of logistical and economical challenges to overcome. The drive toward mechanisms to decrease emissions to air is borne out of the limits and timelines set in International Maritime Organisation (IMO) MARPOL Annex VI. The reductions are further accelerated in Sulphur Emission Control Areas (SECAs), which include both the Baltic Sea and the North Sea. Shipowners operating in SECAs are therefore looking for economically sustainable alternatives to diesel and heavy fuel, and the emerging alternative fuel solution for ship propulsion appears increasingly to be natural gas. This study “Natural gas for ship propulsion in Denmark - possibilities for using LNG and CNG on ferry and cargo routes” was conducted for “Partnerskab for Renere Skibsfart” (a partnership between Danish Environmental Protection Agency (Danish Ministry of Environment) and Danish Shipowner’s Association) and DONG Energy, and the main objectives of the study was to
establish the scope for conversion in the Danish ferry and short sea cargo sector,
describe the options for utilising LNG or Compressed Natural Gas, identify the benefits and drawbacks of natural gas in shipping, assess the most important economic, operational and regulatory
barriers, and point to options for overcoming the barriers
The technical developments needed to introduce natural gas for propulsion are available for shipping both for ferries and the short sea shipping. For LNG the experiences with onshore and onboard installations are recent and during the coming years the knowledge base is expected to be continuously expanding due to a range of new developments and installations. For CNG the development for the shipping sector appears not to have progressed much over the last decade, although considerable information is available from land transport. For the short sea shipping sector the development and marketing of a dual fuel engine able to operate on gas or marine fuel depending on fuel availability and requirements is a recent advantage. From a comparison of fuel consumption in the ferry and short sea shipping sector under four different scenarios it emerges that part of the ferry sector is well suited to conversion to natural gas. However, the fuel consumption in the many smaller ferries is relatively small due to the limited installed engine power and only in the nine ferry ports with the largest ferries is the fuel consumption substantial.
10
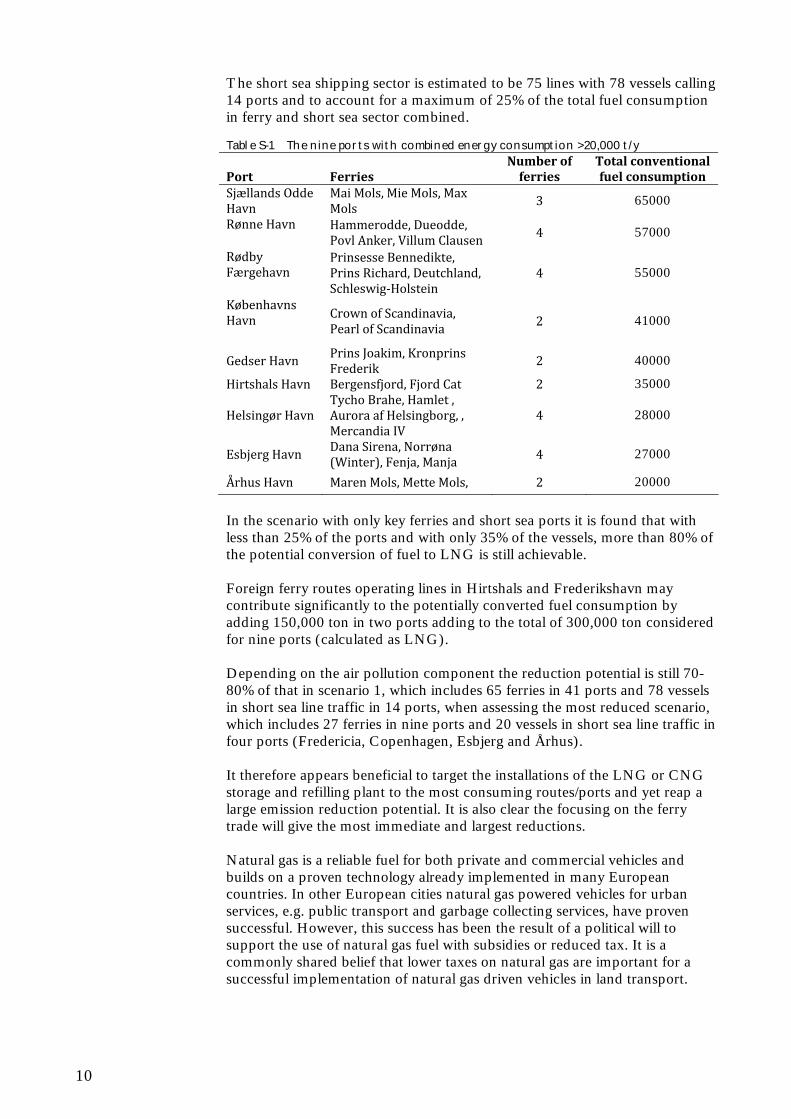
The short sea shipping sector is estimated to be 75 lines with 78 vessels calling 14 ports and to account for a maximum of 25% of the total fuel consumption in ferry and short sea sector combined. Table S-1 The nine ports with combined energy consumption >20,000 t/y
Port Ferries Number of ferries
Total conventional fuel consumption
Sjællands Odde Havn
Mai Mols, Mie Mols, Max Mols 3 65000
Rønne Havn
Hammerodde, Dueodde, Povl Anker, Villum Clausen 4 57000
Rødby Færgehavn
Prinsesse Bennedikte, Prins Richard, Deutchland, Schleswig‐Holstein
4 55000
Københavns Havn
Crown of Scandinavia, Pearl of Scandinavia 2 41000
Gedser Havn Prins Joakim, Kronprins Frederik 2 40000
Hirtshals Havn Bergensfjord, Fjord Cat 2 35000
Helsingør Havn Tycho Brahe, Hamlet , Aurora af Helsingborg, , Mercandia IV
4 28000
Esbjerg Havn Dana Sirena, Norrøna (Winter), Fenja, Manja 4 27000
Århus Havn Maren Mols, Mette Mols, 2 20000
In the scenario with only key ferries and short sea ports it is found that with less than 25% of the ports and with only 35% of the vessels, more than 80% of the potential conversion of fuel to LNG is still achievable. Foreign ferry routes operating lines in Hirtshals and Frederikshavn may contribute significantly to the potentially converted fuel consumption by adding 150,000 ton in two ports adding to the total of 300,000 ton considered for nine ports (calculated as LNG). Depending on the air pollution component the reduction potential is still 70-80% of that in scenario 1, which includes 65 ferries in 41 ports and 78 vessels in short sea line traffic in 14 ports, when assessing the most reduced scenario, which includes 27 ferries in nine ports and 20 vessels in short sea line traffic in four ports (Fredericia, Copenhagen, Esbjerg and Århus). It therefore appears beneficial to target the installations of the LNG or CNG storage and refilling plant to the most consuming routes/ports and yet reap a large emission reduction potential. It is also clear the focusing on the ferry trade will give the most immediate and largest reductions. Natural gas is a reliable fuel for both private and commercial vehicles and builds on a proven technology already implemented in many European countries. In other European cities natural gas powered vehicles for urban services, e.g. public transport and garbage collecting services, have proven successful. However, this success has been the result of a political will to support the use of natural gas fuel with subsidies or reduced tax. It is a commonly shared belief that lower taxes on natural gas are important for a successful implementation of natural gas driven vehicles in land transport.
11
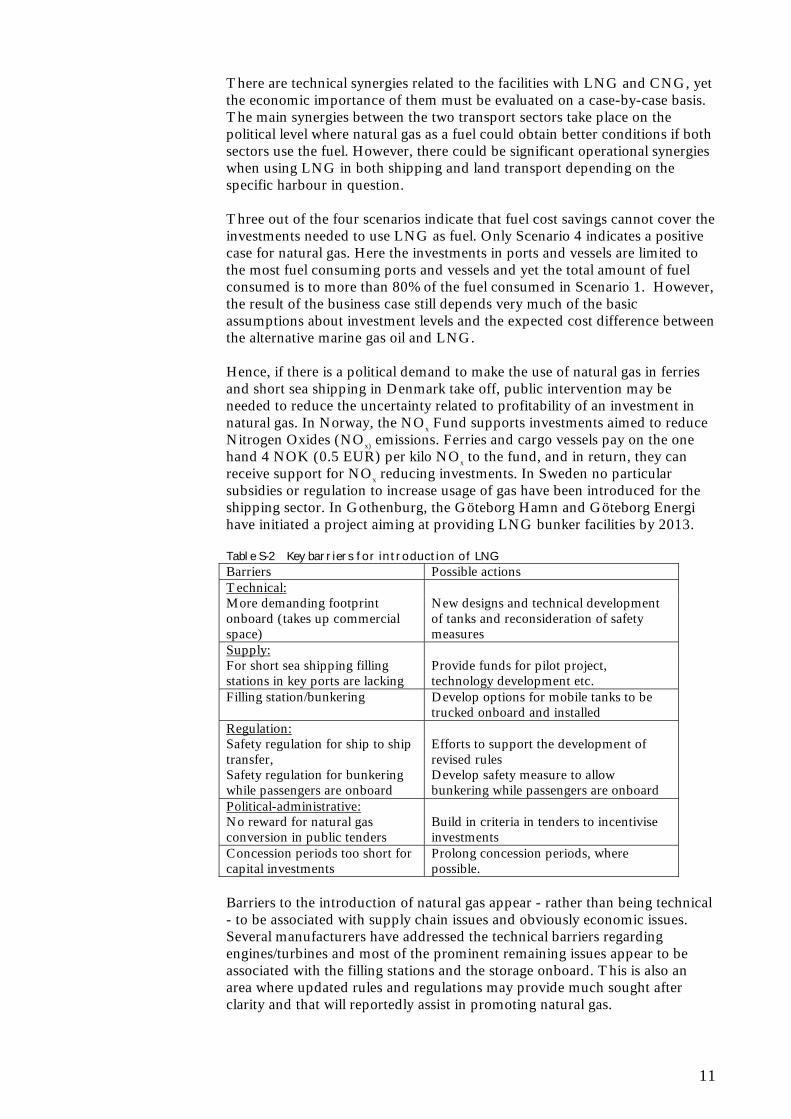
There are technical synergies related to the facilities with LNG and CNG, yet the economic importance of them must be evaluated on a case-by-case basis. The main synergies between the two transport sectors take place on the political level where natural gas as a fuel could obtain better conditions if both sectors use the fuel. However, there could be significant operational synergies when using LNG in both shipping and land transport depending on the specific harbour in question. Three out of the four scenarios indicate that fuel cost savings cannot cover the investments needed to use LNG as fuel. Only Scenario 4 indicates a positive case for natural gas. Here the investments in ports and vessels are limited to the most fuel consuming ports and vessels and yet the total amount of fuel consumed is to more than 80% of the fuel consumed in Scenario 1. However, the result of the business case still depends very much of the basic assumptions about investment levels and the expected cost difference between the alternative marine gas oil and LNG. Hence, if there is a political demand to make the use of natural gas in ferries and short sea shipping in Denmark take off, public intervention may be needed to reduce the uncertainty related to profitability of an investment in natural gas. In Norway, the NOx Fund supports investments aimed to reduce Nitrogen Oxides (NOx) emissions. Ferries and cargo vessels pay on the one hand 4 NOK (0.5 EUR) per kilo NOx to the fund, and in return, they can receive support for NOx reducing investments. In Sweden no particular subsidies or regulation to increase usage of gas have been introduced for the shipping sector. In Gothenburg, the Göteborg Hamn and Göteborg Energi have initiated a project aiming at providing LNG bunker facilities by 2013. Table S-2 Key barriers for introduction of LNG Barriers Possible actions Technical: More demanding footprint onboard (takes up commercial space)
New designs and technical development of tanks and reconsideration of safety measures
Supply: For short sea shipping filling stations in key ports are lacking
Provide funds for pilot project, technology development etc.
Filling station/bunkering Develop options for mobile tanks to be trucked onboard and installed
Regulation: Safety regulation for ship to ship transfer,
Efforts to support the development of revised rules
Safety regulation for bunkering while passengers are onboard
Develop safety measure to allow bunkering while passengers are onboard
Political-administrative: No reward for natural gas conversion in public tenders
Build in criteria in tenders to incentivise investments
Concession periods too short for capital investments
Prolong concession periods, where possible.
Barriers to the introduction of natural gas appear - rather than being technical - to be associated with supply chain issues and obviously economic issues. Several manufacturers have addressed the technical barriers regarding engines/turbines and most of the prominent remaining issues appear to be associated with the filling stations and the storage onboard. This is also an area where updated rules and regulations may provide much sought after clarity and that will reportedly assist in promoting natural gas.
12
In comparing CNG and LNG it is often mentioned that CNG has more safety issues to be dealt with, but taking into account the widespread use of CNG globally in land-based traffic, it does appear that the hesitation to apply CNG in shipping is more related to a lack of maturity of the CNG technology for this particular purpose than actual insurmountable technical safety issues. It is, however, also clear from the present study that a short-term effort to introduce the wider use of natural gas for propulsion in Danish ferry and short sea shipping cannot be based alone on CNG. In important ports in several of the countries around Denmark (Norway, Sweden, Germany and Poland) LNG installations already exist, are under construction or in an advance stage of planning and design to supply the larger vessels and consumers. To summarise, the following key findings are related to the use of natural gas as fuel for ships in Denmark: Natural gas as propulsion fuel in ships:
Advantages: Provide solution to present air emission challenges Barriers: Capital investments large Synergies: Developments in Norway and Baltic Sea area Economy: Positive case for operation for large consumers Future: Develop bunkering options for short sea shipping
LNG:
Propulsion technology in ships is mature and proven Distribution network not yet developed for use in ships Safety concerns are demanding but manageable Can enter existing bunkering value chain
CNG:
Well developed for land based transport, not yet for shipping Distribution network for natural gas exists in Denmark Safety concerns are demanding but manageable No seaborne CNG value chains in operation
An immediate focus on the ferry sector in Denmark will reap benefits on a relatively short time scale. For the short sea shipping sector away to promote the conversion to natural gas is to support the development of storage and bunkering facilities in main ports. Given the general expectations in the shipping community LNG will presumably be the de facto choice at least for the 5-10 years ahead and the demand for facilities and bunkers will be for LNG.
13
Sammenfatning
Naturgas er et alternativt brændstof til de nuværende brændsler i skibsfarten med lave udledninger til luftmiljøet. Skibsfarten overvejer, for at imødekomme nuværende og planlagte regler på miljøområdet, at anvende naturgas og især Liquefied Natural Gas (LNG), som giver løsninger med få tekniske forhindringer, og med en række logistiske og økonomiske udfordringer som kan overvindes. Tidshorisont og retningslinjer for reduktionskravene er en del af den Internationale Maritime Organisations konvention MARPOL Annex VI om luftforurening fra skibsfarten. Mere vidtgående restriktioner og en kortere tidshorisont indføres i Sulphur Emission Control Areas (SECAs), som inkluderer både Østersøen og Nordsøen. Rederier, som opererer i SECA områder, er derfor på udkig efter bæredygtige økonomiske alternativer til konventionelle marine brændsler. På nuværende tidspunkt ser det ud til, at en fremtrædende alternativ løsning er naturgas. Denne undersøgelse, “Naturgas til skibsfarten i Danmark - muligheder for brug af LNG og CNG på færge- og fragtruter”, er udarbejdet for “Partnerskab for Renere Skibsfart” (Miljøministeriet og Rederiforeningen) og DONG Energy og hovedformålet med projektet er:
at kortlægge potentialet for konvertering til naturgas i den danske færge- og nærskibsfart,
beskrive mulighederne for at udnytte LNG eller Komprimeret Natur Gas (CNG),
identificere fordele og ulemper ved naturgas i skibsfarten, vurdere de vigtigste økonomiske, operationelle og lovgivningsmæssige
barrierer, og pege på muligheder for at overvinde de barrierer,
De grundlæggende tekniske landvindinger, der skal til for at indføre naturgas til fremdrift i den maritime sektor, er allerede opnået for både færge- og nærskibsfart. Vidensgrundlaget for LNG-installationer ombord på skibe er forholdsvis nye og det forventes at de bliver udbygget i de kommende år på grund af en række nye udviklinger og installationer i vore nabolande. Vidensgrundlaget for CNG-installationer i den maritime sektor er forholdsvis begrænset og har ikke haft samme udviklingkurve som LNG de seneste ti år, selvom der er betydelig information tilgængelig fra landtransporten. Specielt for nærskibsfarten er udviklingen og markedsføringen af Dual-Fuel motortypen meget interessant, da den kan drives på gas eller konventionelt brændstof som tilgængeligt eller krævet på det givne tidspunkt. En sammenligning af brændstofforbrug i færge- og nærskibstrafikken for fire forskellige scenarier i dette projekt viser, at en del af færgetrafikken er velegnet til hurtig overgang til naturgasdrift. Brændstofforbruget i de mange mindre færger er relativt lille på grund af den begrænsede maskinkraft og kun i de ni færgehavnene med de største færger er brændstofforbruget af betydelig karakter.
14
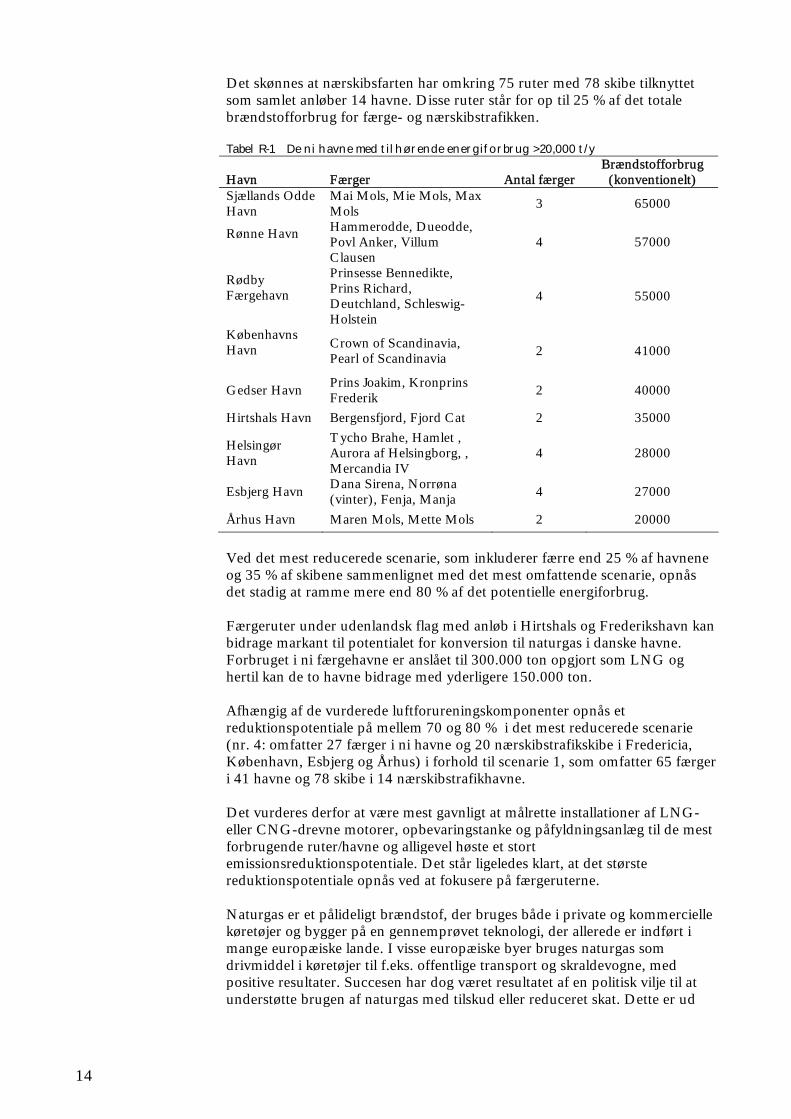
Det skønnes at nærskibsfarten har omkring 75 ruter med 78 skibe tilknyttet som samlet anløber 14 havne. Disse ruter står for op til 25 % af det totale brændstofforbrug for færge- og nærskibstrafikken. Tabel R-1 De ni havne med tilhørende energiforbrug >20,000 t/y
Havn Færger Antal færger Brændstofforbrug (konventionelt)
Sjællands Odde Havn
Mai Mols, Mie Mols, Max Mols
3 65000
Rønne Havn
Hammerodde, Dueodde, Povl Anker, Villum Clausen
4 57000
Rødby Færgehavn
Prinsesse Bennedikte, Prins Richard, Deutchland, Schleswig-Holstein
4 55000
Københavns Havn
Crown of Scandinavia, Pearl of Scandinavia 2 41000
Gedser Havn Prins Joakim, Kronprins Frederik 2 40000
Hirtshals Havn Bergensfjord, Fjord Cat 2 35000
Helsingør Havn
Tycho Brahe, Hamlet , Aurora af Helsingborg, , Mercandia IV
4 28000
Esbjerg Havn Dana Sirena, Norrøna (vinter), Fenja, Manja 4 27000
Århus Havn Maren Mols, Mette Mols 2 20000
Ved det mest reducerede scenarie, som inkluderer færre end 25 % af havnene og 35 % af skibene sammenlignet med det mest omfattende scenarie, opnås det stadig at ramme mere end 80 % af det potentielle energiforbrug. Færgeruter under udenlandsk flag med anløb i Hirtshals og Frederikshavn kan bidrage markant til potentialet for konversion til naturgas i danske havne. Forbruget i ni færgehavne er anslået til 300.000 ton opgjort som LNG og hertil kan de to havne bidrage med yderligere 150.000 ton. Afhængig af de vurderede luftforureningskomponenter opnås et reduktionspotentiale på mellem 70 og 80 % i det mest reducerede scenarie (nr. 4: omfatter 27 færger i ni havne og 20 nærskibstrafikskibe i Fredericia, København, Esbjerg og Århus) i forhold til scenarie 1, som omfatter 65 færger i 41 havne og 78 skibe i 14 nærskibstrafikhavne. Det vurderes derfor at være mest gavnligt at målrette installationer af LNG- eller CNG-drevne motorer, opbevaringstanke og påfyldningsanlæg til de mest forbrugende ruter/havne og alligevel høste et stort emissionsreduktionspotentiale. Det står ligeledes klart, at det største reduktionspotentiale opnås ved at fokusere på færgeruterne. Naturgas er et pålideligt brændstof, der bruges både i private og kommercielle køretøjer og bygger på en gennemprøvet teknologi, der allerede er indført i mange europæiske lande. I visse europæiske byer bruges naturgas som drivmiddel i køretøjer til f.eks. offentlige transport og skraldevogne, med positive resultater. Succesen har dog været resultatet af en politisk vilje til at understøtte brugen af naturgas med tilskud eller reduceret skat. Dette er ud
15
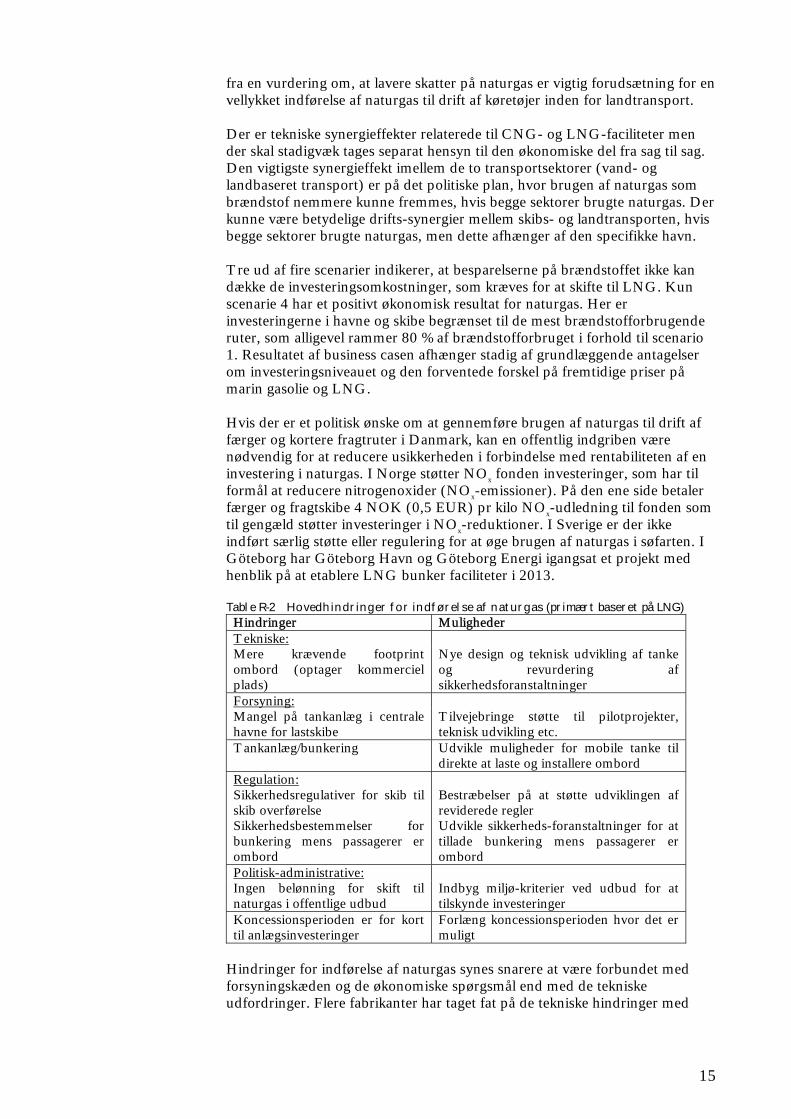
fra en vurdering om, at lavere skatter på naturgas er vigtig forudsætning for en vellykket indførelse af naturgas til drift af køretøjer inden for landtransport. Der er tekniske synergieffekter relaterede til CNG- og LNG-faciliteter men der skal stadigvæk tages separat hensyn til den økonomiske del fra sag til sag. Den vigtigste synergieffekt imellem de to transportsektorer (vand- og landbaseret transport) er på det politiske plan, hvor brugen af naturgas som brændstof nemmere kunne fremmes, hvis begge sektorer brugte naturgas. Der kunne være betydelige drifts-synergier mellem skibs- og landtransporten, hvis begge sektorer brugte naturgas, men dette afhænger af den specifikke havn. Tre ud af fire scenarier indikerer, at besparelserne på brændstoffet ikke kan dække de investeringsomkostninger, som kræves for at skifte til LNG. Kun scenarie 4 har et positivt økonomisk resultat for naturgas. Her er investeringerne i havne og skibe begrænset til de mest brændstofforbrugende ruter, som alligevel rammer 80 % af brændstofforbruget i forhold til scenario 1. Resultatet af business casen afhænger stadig af grundlæggende antagelser om investeringsniveauet og den forventede forskel på fremtidige priser på marin gasolie og LNG. Hvis der er et politisk ønske om at gennemføre brugen af naturgas til drift af færger og kortere fragtruter i Danmark, kan en offentlig indgriben være nødvendig for at reducere usikkerheden i forbindelse med rentabiliteten af en investering i naturgas. I Norge støtter NOx fonden investeringer, som har til formål at reducere nitrogenoxider (NOx-emissioner). På den ene side betaler færger og fragtskibe 4 NOK (0,5 EUR) pr kilo NOx-udledning til fonden som til gengæld støtter investeringer i NOx-reduktioner. I Sverige er der ikke indført særlig støtte eller regulering for at øge brugen af naturgas i søfarten. I Göteborg har Göteborg Havn og Göteborg Energi igangsat et projekt med henblik på at etablere LNG bunker faciliteter i 2013. Table R-2 Hovedhindringer for indførelse af naturgas (primært baseret på LNG) Hindringer Muligheder Tekniske: Mere krævende footprint ombord (optager kommerciel plads)
Nye design og teknisk udvikling af tanke og revurdering af sikkerhedsforanstaltninger
Forsyning: Mangel på tankanlæg i centrale havne for lastskibe
Tilvejebringe støtte til pilotprojekter, teknisk udvikling etc.
Tankanlæg/bunkering Udvikle muligheder for mobile tanke til direkte at laste og installere ombord
Regulation: Sikkerhedsregulativer for skib til skib overførelse
Bestræbelser på at støtte udviklingen af reviderede regler
Sikkerhedsbestemmelser for bunkering mens passagerer er ombord
Udvikle sikkerheds-foranstaltninger for at tillade bunkering mens passagerer er ombord
Politisk-administrative: Ingen belønning for skift til naturgas i offentlige udbud
Indbyg miljø-kriterier ved udbud for at tilskynde investeringer
Koncessionsperioden er for kort til anlægsinvesteringer
Forlæng koncessionsperioden hvor det er muligt
Hindringer for indførelse af naturgas synes snarere at være forbundet med forsyningskæden og de økonomiske spørgsmål end med de tekniske udfordringer. Flere fabrikanter har taget fat på de tekniske hindringer med
16
hensyn til motorer/turbiner, og de fleste af de udestående tekniske spørgsmål synes mere at være forbundet med tankfaciliteter, påfyldning og opbevaring ombord. Dette er ligeledes områder, hvor klarhed omkring lovgivning og regulativer kan medvirke til at fremme brugen af naturgas. Ved sammenligning af brug af CNG og LNG i skibsfart nævnes det ofte, at der er flere uløste sikkerhedsforhold ved CNG. Under hensynstagen til den globale brug af CNG i den landbaserede trafik, synes det snarere at være CNG teknologien mangel på modenhed i forhold til skibsindustrien og ikke de faktiske tekniske sikkerhedsspørgsmål, som er barrieren. Det står imidlertid også klart med denne undersøgelse, at en indsats på kort sigt for at støtte en mere udbredt anvendelse af naturgas i danske færger og nærskibstrafik ikke kan baseres på CNG. I flere af vore nabolande (Norge, Sverige, Tyskland og Polen) er der LNG anlæg, som enten allerede er i drift, under opførelse eller i fremskredet stadie af planlægning og som i dag eller om få år kan levere naturgas til større skibe og andre forbrugere. Nedenstående er en opsummering af de vigtigste resultater vedrørende anvendelse af naturgas i skibsfarten i Danmark: Naturgas, generelt:
Fordele: Giver en løsning på nuværende udfordringer for luftemissioner
Barrierer: startbehovet for kapital er stort Synergi: Udviklingen i Norge og Østersø-området Økonomi: Positiv i tilfældet af operation for store forbrugere Fremtiden: Udvikle bunkermuligheder for nærskibstrafik
LNG:
Fremdrift teknologi til skibe er moden og veludviklet Distributionsnetværk er endnu ikke udviklet til brug for skibe Sikkerhedsforhold er krævende, men håndterbare Kan bruges i eksisterende bunkering-værdikæde
CNG:
Veludviklet for landbaserede transport, endnu ikke for skibsfart Distributionsnetværk for naturgas forefindes i Danmark Sikkerhedsforhold er krævende, men håndterbare Der er ingen maritime CNG værdikæder i drift
Der vil kunne høstes fordele på den korte tidshorisont, hvis der omgående bliver fokuseret på færgesektoren i Danmark. For at fremme konverteringen til naturgasdrift for nærskibsfarten bør der gives støtte til udviklingen af lagertanke og bunkringsfaciliteter i de væsentligste havne. I betragtning af de generelle forventninger i skibsindustrien vil LNG de facto formentlig blive valget i mindst 5-10 år frem,og efterspørgslen efter faciliteter og bunkers vil være for LNG.
17
1 Introduction
1.1 Reduction of emissions to air from ships
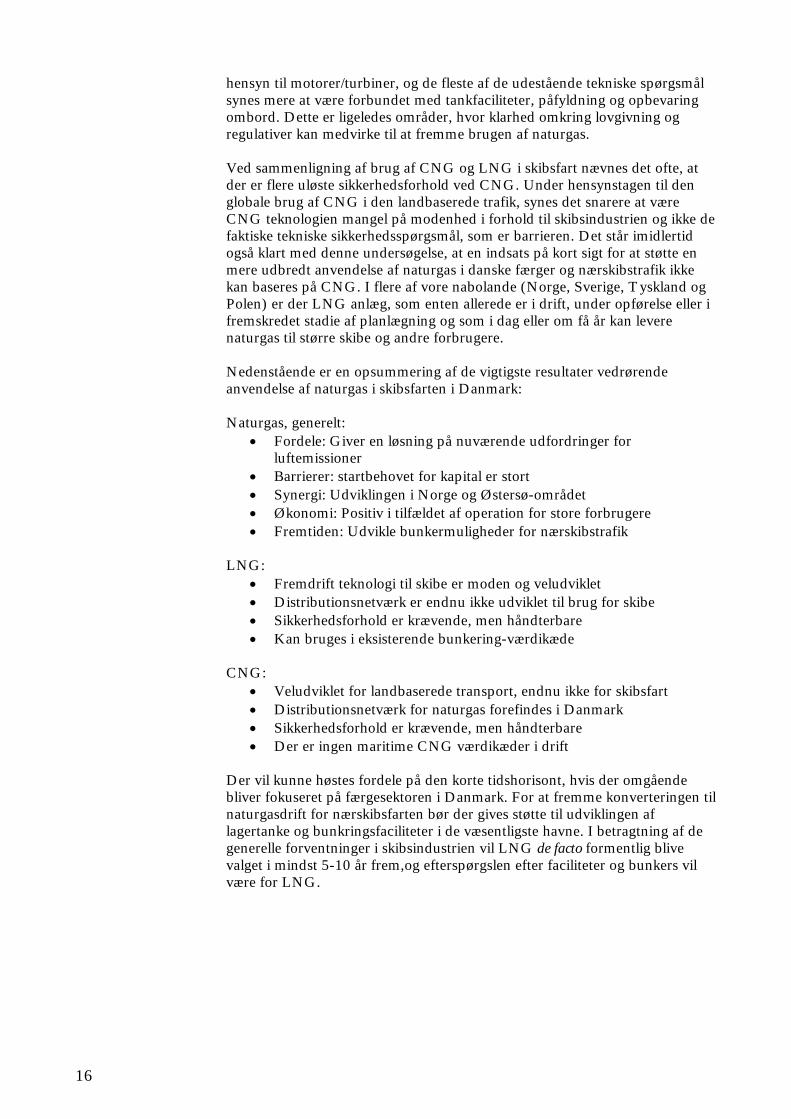
The MARPOL Convention (MARPOL 73/78)1 is the main international convention covering prevention of pollution of the marine environment by ships from routine operations or accidental causes and includes six technical annexes. Annex VI is a regulation for preventing of air pollution from ships and in August 2008 an amendment was adopted. This amendment requires significant reductions in sulphur oxide and nitrogen oxides from burning of fossil fuel for ships globally. In certain designated SECAs stricter requirements must be met and Danish territorial waters are part of the SECAs in the Baltic Sea and the North Sea. The global reductions on sulphur will enter into force with a gradual reduction from 2010 to a full effect in 2020, but earlier in SECAs (shown below). The restrictions are:
1.0wt. % sulphur from July 1st 2010 0.1wt. % sulphur from January 1st 2015
Figure 1-1 Map of existing and planned Emission Control Areas (ECAs) Progressive reductions in NOx emissions from marine engines have also been agreed, with the most stringent controls on so-called "Tier III" engines, i.e.
1 The MARPOL Convention is the main international convention covering prevention of pollution of the marine environment by ships from operational or accidental causes. It is a combination of two treaties adopted in 1973 and 1978 respectively and updated by amendments of its annexes. Annex VI covers emissions to air.
18
those installed on ships constructed on or after January 1st 2016. These will apply for ships operating in the emission control areas (abbreviated ECAs when covering not only sulphur). SECAs are also planned for the coasts of Canada and the USA. To fulfil the requirements regarding sulphur a cleaner fuel or treatment of the exhaust gasses are required. It is possible to use a heavy fuel oil (HFO) with lower sulphur oxide contents or diesel oil as the main fuel in the ship, but the global refinery industry is currently not configured to supply diesel oil in the amounts required and at comparable costs if all ships abandon HFO2. Removing sulphur from HFO at the refinery is a costly operation and the cost increase will have an effect on the freight rates. Since fuel of gasoil quality may be needed from 2015, shipowners operating in the ECAs are looking for economically sustainable alternatives to diesel and heavy fuel. Although technologies for assisting propulsion exist in the form of e.g. hydrogen fuel cells, kites or solar cells these are all far from realistic alternatives as the sole means of energy for propulsion of a merchant ship or ferry. The emerging alternative fuel solution for ship propulsion appears increasingly to be natural gas. The sulphur oxide content in natural gas is negligible and emissions of sulphur oxides and Particulate Matters (PMs) from engines run solely on gas are virtually nonexistent (although a contribution will be present and dependent on the pilot fuel used for ignition and the lube oil). Thus, the use of natural gas will also eliminate the nee of exhaust treatment systems or treatment to reduce the sulphur content in the fuel oil at the refinery. Natural gas is transported in the form of LNG in special LNG carriers (at -161 Celcius) or transported as a gas in pipelines and compressed for storage and use as CNG. Thus, converting current use of HFO, diesel or gasoil in the shipping industry to operate on natural gas requires a string of supply chain facilities and services in addition to the investments needed directly on the vessels. The added cost for pollution abatement or for alternative fuels to the shipping industry can be seen as a potential obstacle for the established European strategy of shifting cargo from road to ship, which is reflected in the European Commission’s support to projects under the labels of ”European maritime transport space without barriers” and ”Motorways of the Sea”. The present study evaluates the possibilities of establishing shore based LNG or CNG facilities: supplying facilities, storing and fuelling the ships with LNG/CNG in the Danish area, and estimates the reduction in air emission from conversions to LNG/CNG. The costs are assessed for several scenarios for the conversion in the Danish ferry and short sea shipping sector. The Chapters 2—8 deal with the following:
Chapter 2 addresses issues related to the use of natural gas for propulsion in ships;
2 MAGALOG report (p. 1)
19
The number of ports and vessels relevant in Denmark and the expected fuel consumption is addressed in Chapter 3;
Chapter 4 assesses the reduction in emissions to air achieved under the scenarios developed in Chapter 3;
Chapter 5 explores the synergies with the land transport sector; Chapter 6 investigates the overall ship operation, when using natural
gas; In the final technical Chapter 7 the barriers related to introduction of
natural gas in ship propulsion are assessed; The economic analysis is found in Chapter 8, where the scenarios of
Chapter 3 are assessed. The conclusions are found in Chapter 9 and in the appendices a range of technical information and background data is provided. The remaining part of Chapter 1 will introduce some basic information on natural gas, LNG and CNG occurring upstream of the use on ships.
1.2 What is natural gas and how could it be used in shipping?
Natural gas is a fossil fuel found in sub terrain reservoirs and produced in special gas fields or in a parallel stream when also producing oil. The chemical composition of natural gas varies slightly with respect to the proportions of the lower alkanes (methane, ethane, propane, butane) and also with respect to nitrogen. The composition of both LNG and CNG will vary depending on the source of the gas, but must meet certain technical specifications, and the use in ship’s engines is governed by a number of standards and guidelines. Using engines operating on gas are not new in shipping. In particular, the use of “boil off”, i.e. the hydrocarbon vapours generated when transporting LNG, is standard in LNG carriers and in much smaller engines CNG has been used in canal boats and other small vessels (see Section 2 and Appendix 1). When considering how to utilise natural gas for propulsion of ships the distribution and storage are issues of concern and a short introduction to the topic as addressed in this report is given below and further detailed in appendix 1. 1.2.1 Transport of natural gas
Liquefied natural gas LNG is transported by large LNG carriers from different parts of the World to a number of terminals in Europe to supply LNG to the storage and distribution facilities in the consumer countries and regions. LNG may also be produced by liquefaction of pipeline gas from the gas transmission net or directly from offshore pipelines. Compressed natural gas CNG is typically produced locally at the storage facility or filling station by high-pressure compression of gas imported from the gas transmission net.
20
The transportation of CNG from offshore gas resources by vessels is under development but no projects are yet in operation3. 1.2.2 Liquefaction plant for LNG
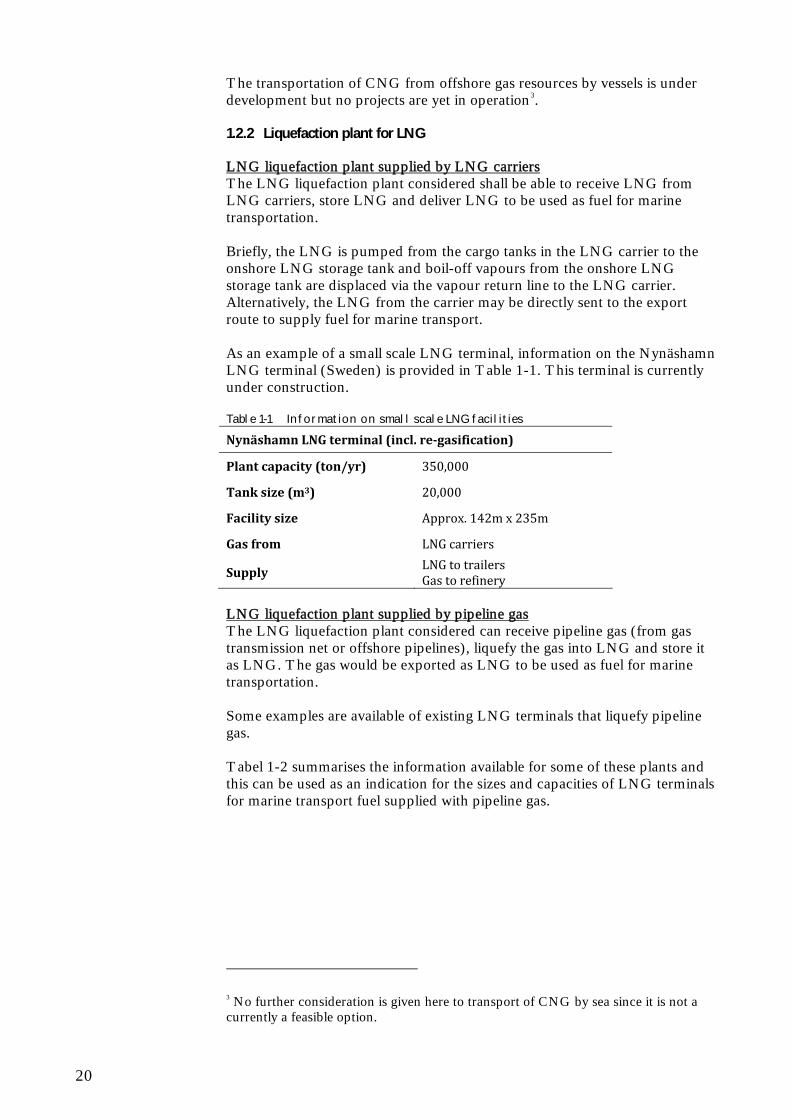
LNG liquefaction plant supplied by LNG carriers The LNG liquefaction plant considered shall be able to receive LNG from LNG carriers, store LNG and deliver LNG to be used as fuel for marine transportation. Briefly, the LNG is pumped from the cargo tanks in the LNG carrier to the onshore LNG storage tank and boil-off vapours from the onshore LNG storage tank are displaced via the vapour return line to the LNG carrier. Alternatively, the LNG from the carrier may be directly sent to the export route to supply fuel for marine transport. As an example of a small scale LNG terminal, information on the Nynäshamn LNG terminal (Sweden) is provided in Table 1-1. This terminal is currently under construction. Table 1-1 Information on small scale LNG facilities
Nynäshamn LNG terminal (incl. regasification)
Plant capacity (ton/yr) 350,000
Tank size (m3) 20,000
Facility size Approx. 142m x 235m
Gas from LNG carriers
Supply LNG to trailers Gas to refinery
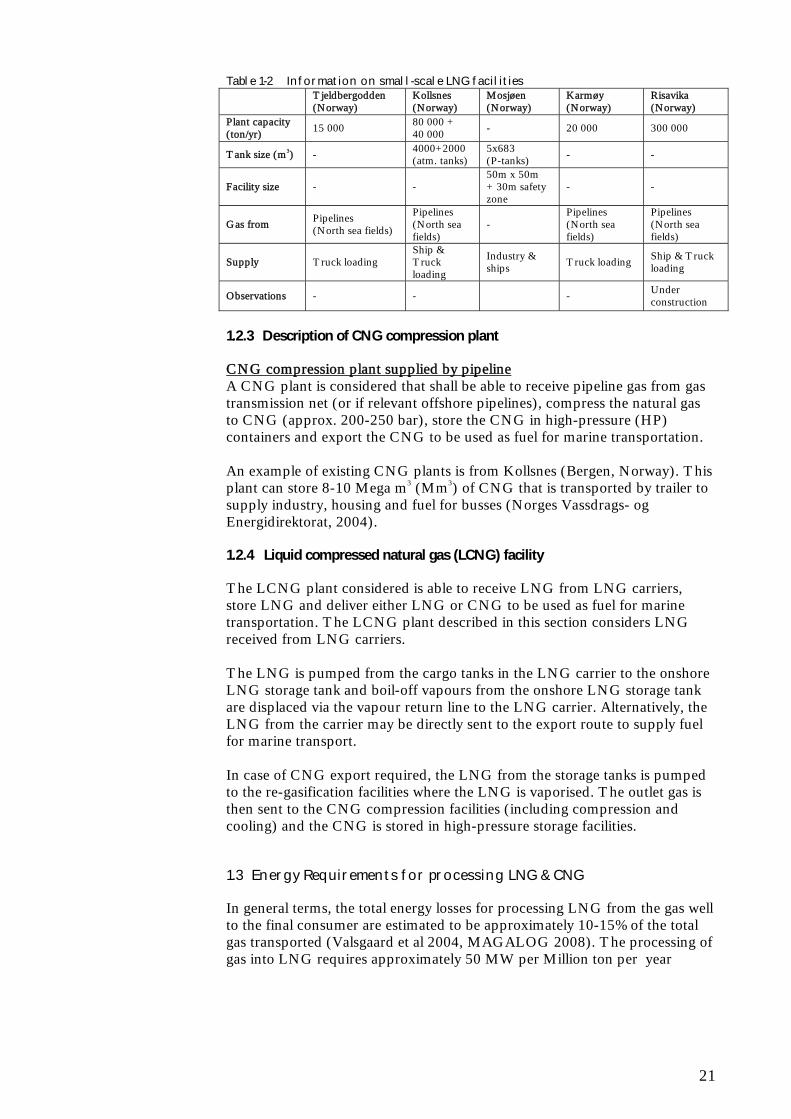
LNG liquefaction plant supplied by pipeline gas The LNG liquefaction plant considered can receive pipeline gas (from gas transmission net or offshore pipelines), liquefy the gas into LNG and store it as LNG. The gas would be exported as LNG to be used as fuel for marine transportation. Some examples are available of existing LNG terminals that liquefy pipeline gas. Tabel 1-2 summarises the information available for some of these plants and this can be used as an indication for the sizes and capacities of LNG terminals for marine transport fuel supplied with pipeline gas.
3 No further consideration is given here to transport of CNG by sea since it is not a currently a feasible option.
21
Table 1-2 Information on small-scale LNG facilities
Tjeldbergodden (Norway)
Kollsnes (Norway)
Mosjøen (Norway)
Karmøy (Norway)
Risavika (Norway)
Plant capacity (ton/yr)
15 000 80 000 + 40 000
- 20 000 300 000
Tank size (m3) - 4000+2000 (atm. tanks)
5x683 (P-tanks)
- -
Facility size - - 50m x 50m + 30m safety zone
- -
Gas from Pipelines (North sea fields)
Pipelines (North sea fields)
- Pipelines (North sea fields)
Pipelines (North sea fields)
Supply Truck loading Ship & Truck loading
Industry & ships Truck loading Ship & Truck
loading
Observations - - - Under construction
1.2.3 Description of CNG compression plant
CNG compression plant supplied by pipeline A CNG plant is considered that shall be able to receive pipeline gas from gas transmission net (or if relevant offshore pipelines), compress the natural gas to CNG (approx. 200-250 bar), store the CNG in high-pressure (HP) containers and export the CNG to be used as fuel for marine transportation. An example of existing CNG plants is from Kollsnes (Bergen, Norway). This plant can store 8-10 Mega m3 (Mm3) of CNG that is transported by trailer to supply industry, housing and fuel for busses (Norges Vassdrags- og Energidirektorat, 2004). 1.2.4 Liquid compressed natural gas (LCNG) facility
The LCNG plant considered is able to receive LNG from LNG carriers, store LNG and deliver either LNG or CNG to be used as fuel for marine transportation. The LCNG plant described in this section considers LNG received from LNG carriers. The LNG is pumped from the cargo tanks in the LNG carrier to the onshore LNG storage tank and boil-off vapours from the onshore LNG storage tank are displaced via the vapour return line to the LNG carrier. Alternatively, the LNG from the carrier may be directly sent to the export route to supply fuel for marine transport. In case of CNG export required, the LNG from the storage tanks is pumped to the re-gasification facilities where the LNG is vaporised. The outlet gas is then sent to the CNG compression facilities (including compression and cooling) and the CNG is stored in high-pressure storage facilities.
1.3 Energy Requirements for processing LNG & CNG
In general terms, the total energy losses for processing LNG from the gas well to the final consumer are estimated to be approximately 10-15% of the total gas transported (Valsgaard et al 2004, MAGALOG 2008). The processing of gas into LNG requires approximately 50 MW per Million ton per year
22
(Mtpy)4 of LNG produced. These numbers are based on base load LNG liquefaction plants. In case of liquefaction of LNG from pipeline gas, a small scale LNG plant is considered and the energy requirements may vary from 0.7 to 0.9 kWh/kg of gas (Lemmers 2009, Mustang 2008), which is equivalent to 80 - 100 MW per Mtpy of gas and depends on the composition of the gas to be liquefied. In the case of CNG, the total energy losses from gas well to the consumer are estimated to be approximately 5-8% of the total gas transported5 (Valsgaard et al 2004), when considering CNG maritime transportation. When considering the processing of pipeline gas into CNG, the energy required is approximately 6 MW per Mtpy of CNG.
1.4 The biogas option
To use biogas as a substitute for fossil fuel including natural gas is part of Danish national policy. Whether biogas is transported as LNG or in the Danish natural gas network, it needs to be treated for carbon dioxide and impurities. The raw biogas, which is directly extracted from a fermentation tank comprises approx. 65% methane, 35% CO2 and trace impurities. The liquefaction process producing LNG will also provide the necessary purification, whereas to enter the natural gas network a purification process is needed to achieve an acceptable quality. A problem is that the suppliers of biogas occur in a less dense network. The technical challenges to use biogas in the natural gas network are not insurmountable, but because the benefits of scale are not readily achievable the cost of treating the biogas locally is still uneconomical (see Section 2 for details).
4 Million ton per year 5 According to Asger Myken, DONG, this is a conservative estimate; the power consumption for CNG production for use in cars is 2-3%.
23
2 Experiences with ships
2.1 Natural gas as LNG or CNG in ships
Conventional ship engines have the potential of converting to a lean gas engine or dual fuel engine design. The main issue is the supply of the LNG or CNG to the vessel, the space onboard for tanks and the operation radius of the vessel. According to MAGALOG6 report there are two time-bound factors, which have an effect on implementation of the lean gas driven engines:
Introduction of LNG-fuelled ships is more likely to happen by building new ships equipped for this, than by converting existing ships from conventional fuel to LNG. Ships usually have economic lifes of 30 years or more, and it should therefore take at least 30-40 years to fully convert an established shipping segment. However one might see a more rapid switch to cleaner technologies within the ECA’s, by transfer of more polluting ships to operation in outside waters.
Some shipping segments will be better suited than others to
introducing LNG early (long term contracts and fixed routes). An important reason for this is that the development of cost effective supply systems for LNG bunkering needs to be undertaken in steps over a length of time, focusing first on certain segments and ports.
As mentioned earlier this study is concerned with ferries and short sea shipping and the challenges and options in these sectors in Denmark. Very little actual experience is available with natural gas in shipping except on LNG rather than CNG and most data will be from LNG vessels and facilities. 2.1.1 The space consideration
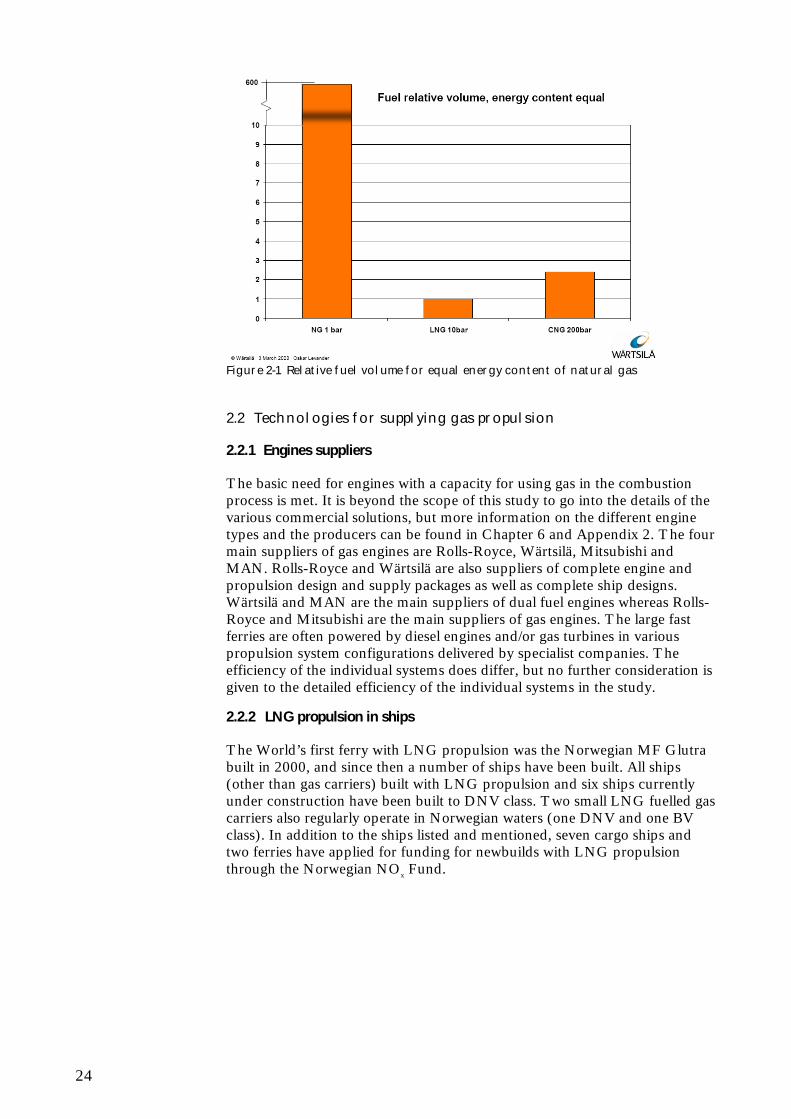
Natural gas at atmospheric pressure and room temperature has a very low energy density, and hence a large volume. In ships the space available for fuel tanks is generally limited, so as high as possible energy density for the fuel is preferable. Cooling the gas to the point of liquefaction and applying a moderate pressure increases the energy density 600 times, which, however, is still only about half the energy density of oil. Compressing the gas to 200 bar CNG instead of cooling it also significantly increases the energy density compared to uncompressed natural gas. LNG is however the most volume-effective of the two options. In short, LNG requires approximately 2 times the fuel volume of oil, and CNG (at 200 bar) requires 5 times the volume of oil. In addition, the added insulation and sub optimal tank shape of LNG and CNG further increases the tank requirement for a given ship and sailing range.
6 MAGALOG (2008) report (p. 3)
24
Figure 2-1 Relative fuel volume for equal energy content of natural gas
2.2 Technologies for supplying gas propulsion
2.2.1 Engines suppliers
The basic need for engines with a capacity for using gas in the combustion process is met. It is beyond the scope of this study to go into the details of the various commercial solutions, but more information on the different engine types and the producers can be found in Chapter 6 and Appendix 2. The four main suppliers of gas engines are Rolls-Royce, Wärtsilä, Mitsubishi and MAN. Rolls-Royce and Wärtsilä are also suppliers of complete engine and propulsion design and supply packages as well as complete ship designs. Wärtsilä and MAN are the main suppliers of dual fuel engines whereas Rolls-Royce and Mitsubishi are the main suppliers of gas engines. The large fast ferries are often powered by diesel engines and/or gas turbines in various propulsion system configurations delivered by specialist companies. The efficiency of the individual systems does differ, but no further consideration is given to the detailed efficiency of the individual systems in the study. 2.2.2 LNG propulsion in ships
The World’s first ferry with LNG propulsion was the Norwegian MF Glutra built in 2000, and since then a number of ships have been built. All ships (other than gas carriers) built with LNG propulsion and six ships currently under construction have been built to DNV class. Two small LNG fuelled gas carriers also regularly operate in Norwegian waters (one DNV and one BV class). In addition to the ships listed and mentioned, seven cargo ships and two ferries have applied for funding for newbuilds with LNG propulsion through the Norwegian NOx Fund.
25
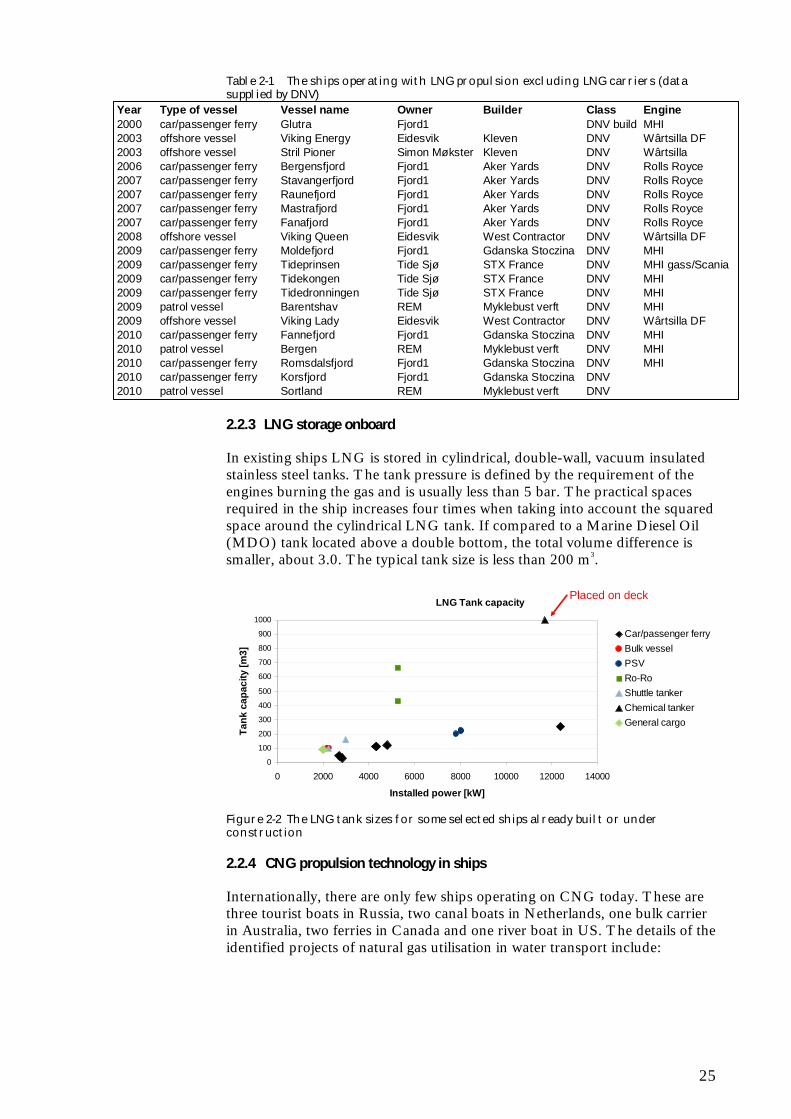
Table 2-1 The ships operating with LNG propulsion excluding LNG carriers (data supplied by DNV)
2.2.3 LNG storage onboard
In existing ships LNG is stored in cylindrical, double-wall, vacuum insulated stainless steel tanks. The tank pressure is defined by the requirement of the engines burning the gas and is usually less than 5 bar. The practical spaces required in the ship increases four times when taking into account the squared space around the cylindrical LNG tank. If compared to a Marine Diesel Oil (MDO) tank located above a double bottom, the total volume difference is smaller, about 3.0. The typical tank size is less than 200 m3.
LNG Tank capacity
0
100
200
300
400
500
600
700
800
900
1000
0 2000 4000 6000 8000 10000 12000 14000
Installed power [kW]
Ta
nk
ca
pa
cit
y [
m3
]
Car/passenger ferry
Bulk vessel
PSV
Ro-Ro
Shuttle tanker
Chemical tanker
General cargo
Placed on deckLNG Tank capacity
0
100
200
300
400
500
600
700
800
900
1000
0 2000 4000 6000 8000 10000 12000 14000
Installed power [kW]
Ta
nk
ca
pa
cit
y [
m3
]
Car/passenger ferry
Bulk vessel
PSV
Ro-Ro
Shuttle tanker
Chemical tanker
General cargo
Placed on deck
Figure 2-2 The LNG tank sizes for some selected ships already built or under construction
2.2.4 CNG propulsion technology in ships
Internationally, there are only few ships operating on CNG today. These are three tourist boats in Russia, two canal boats in Netherlands, one bulk carrier in Australia, two ferries in Canada and one river boat in US. The details of the identified projects of natural gas utilisation in water transport include:
Year Type of vessel Vessel name Owner Builder Class Engine2000 car/passenger ferry Glutra Fjord1 DNV build MHI2003 offshore vessel Viking Energy Eidesvik Kleven DNV Wârtsilla DF2003 offshore vessel Stril Pioner Simon Møkster Kleven DNV Wârtsilla 2006 car/passenger ferry Bergensfjord Fjord1 Aker Yards DNV Rolls Royce2007 car/passenger ferry Stavangerfjord Fjord1 Aker Yards DNV Rolls Royce2007 car/passenger ferry Raunefjord Fjord1 Aker Yards DNV Rolls Royce2007 car/passenger ferry Mastrafjord Fjord1 Aker Yards DNV Rolls Royce2007 car/passenger ferry Fanafjord Fjord1 Aker Yards DNV Rolls Royce2008 offshore vessel Viking Queen Eidesvik West Contractor DNV Wârtsilla DF2009 car/passenger ferry Moldefjord Fjord1 Gdanska Stoczina DNV MHI 2009 car/passenger ferry Tideprinsen Tide Sjø STX France DNV MHI gass/Scania2009 car/passenger ferry Tidekongen Tide Sjø STX France DNV MHI 2009 car/passenger ferry Tidedronningen Tide Sjø STX France DNV MHI 2009 patrol vessel Barentshav REM Myklebust verft DNV MHI2009 offshore vessel Viking Lady Eidesvik West Contractor DNV Wârtsilla DF2010 car/passenger ferry Fannefjord Fjord1 Gdanska Stoczina DNV MHI 2010 patrol vessel Bergen REM Myklebust verft DNV MHI2010 car/passenger ferry Romsdalsfjord Fjord1 Gdanska Stoczina DNV MHI 2010 car/passenger ferry Korsfjord Fjord1 Gdanska Stoczina DNV2010 patrol vessel Sortland REM Myklebust verft DNV
26
Accolade II – cargo ship Adelaide, Australia 1982 CNG Klatawa – ferry Vancouver, Canada 1985 CNG (26 cars, 146
passengers) Kulleet – ferry Vancouver, Canada 1988 CNG (26 cars, 146
passengers) Heineken – pleasure boat Amsterdam, NL 1992 CNG Mondriaan, Escher, Amsterdam, NL 1994 CNG Corneille – pleasure
boats Tourist ship St. Petersburg, Russia 1994 CNG Elisabeth River I - ferry Norfolk, Virginia, USA 1995 CNG (149
passengers) Tourist ship Moscow 1999 CNG Rembrandt, Van Gogh, Amsterdam, NL 2000 CNG Jeroen Krabbé –
pleasure boats 2.2.5 CNG storage onboard
The Canadian ferries are refuelled twice a day using about 3-4 minutes each time. The on-shore compressor station store the gas at 250 bar, filling the on board storage to about 160 bar (Einaar & Haavik, 2000). Compared with LNG, an equal energy content of CNG requires almost 2.5 times more volume, thus requiring some 5 times the storage space of MDO. 2.2.6 LNG bunkering configuration in Norway
For the Norwegian gas fuelled car and passenger ferry Glutra, the two LNG tanks onboard are 32 m3
each. Refuelling takes place every 4-5 days and takes one hour for a truckload of 40 m3 of LNG. Having this storage capacity onboard, storage at the ferry berth was not necessary. The refuelling takes place when the ferry is docked for the night and no passengers are onboard (Einaar & Haavik, 2000). For the Norwegian gas fuelled passenger ferries Tidekongen, Tidedronningen and Tideprinsessen operating from Oslo, the LNG tank onboard is 29 m3. The ships are fuelled approximately once a week from a dedicated truck with typically 50 m3 capacity.
2.3 Distribution of LNG
This section addresses LNG onshore infrastructure available in Norway and Europe today and what is needed for supply as fuel for a fleet of short sea vessels in the near future. Over the past four decades LNG trade has grown to become a large and flexible market. The expected growth in natural gas demand can either be met by expansion of small-scale liquefaction capacity or by imports from the international LNG spot market. 2.3.1 Current LNG infrastructure
LNG as a bunker fuel is already introduced in Norway, but presently not available for ship bunkering in Denmark. In Norway, LNG is transported either by small scale LNG carriers or by truck from regional LNG production
27
and/or storage terminals to local storage terminals or bunkering stations. LNG has also been supplied from large LNG carriers to coastal LNG carriers. 2.3.1.1 LNG production plants There are five LNG production plants in Norway. A list of the suppliers, production plants and their capacity is given in Table 2-2. Table 2-2 LNG production in Norway
Supplier Production Plant Start‐up (year)
Capacity (tonnes/year)
Gasnor Kollsnes 2003 (Kollsnes I) and 2007 (Kollsnes II)
120000
Gasnor Karmøy (Snurrevarden) 2003 20000 Lyse Risavika 2010 300000 Statoil Melkøya 2007 4100000 Statoil Tjeldbergodden 1997 15000
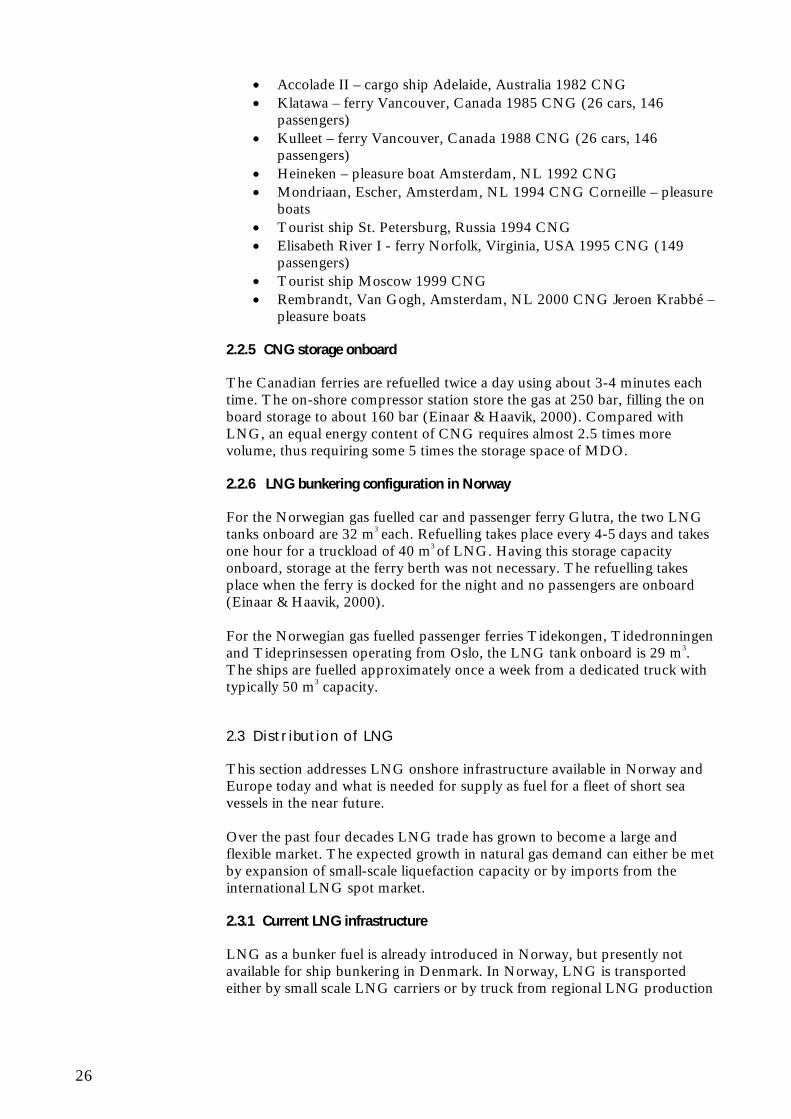
It is noted that Statoil’s plant at Melkøya is primarily dedicated to export on long term contracts to Spain and the US. 2.3.1.2 Downstream distribution of LNG From LNG production plants and potential large import terminals, LNG may be further distributed to smaller terminals and/or fuel bunkering stations. Today LNG is distributed by ship, semi-trailers or a combination of the two. LNG is also supplied from large LNG carriers to coastal LNG carriers.
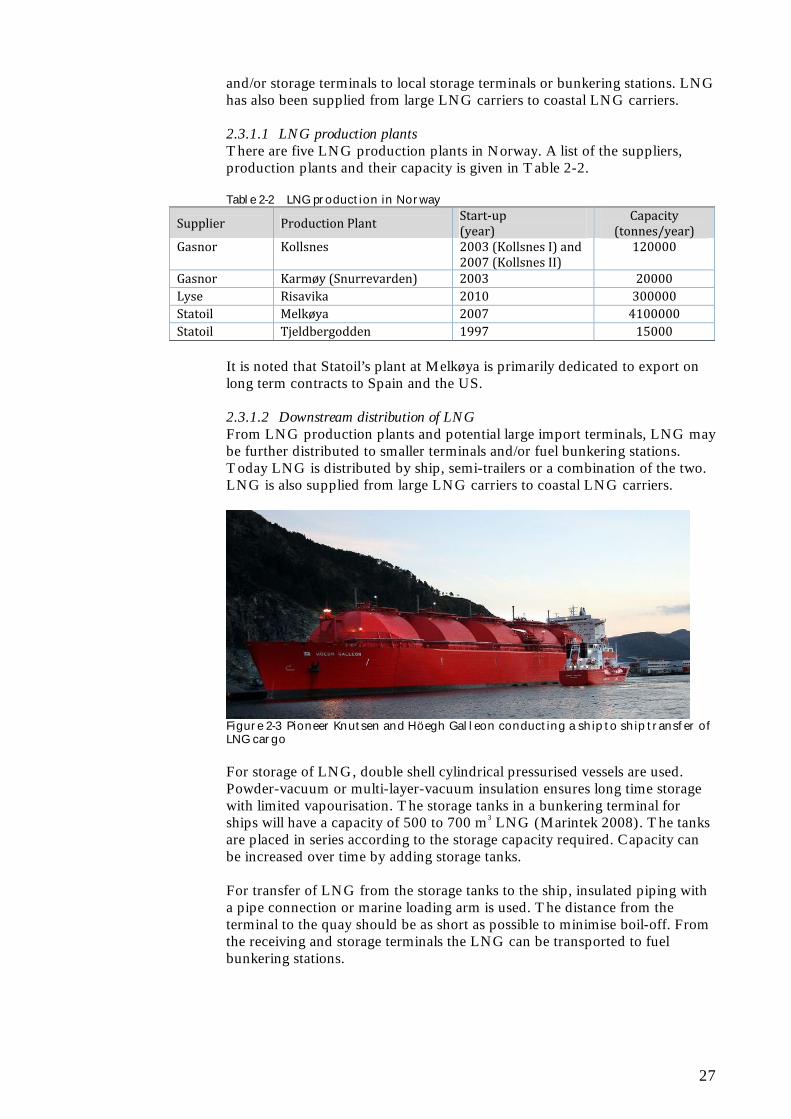
Figure 2-3 Pioneer Knutsen and Höegh Galleon conducting a ship to ship transfer of LNG cargo For storage of LNG, double shell cylindrical pressurised vessels are used. Powder-vacuum or multi-layer-vacuum insulation ensures long time storage with limited vapourisation. The storage tanks in a bunkering terminal for ships will have a capacity of 500 to 700 m3 LNG (Marintek 2008). The tanks are placed in series according to the storage capacity required. Capacity can be increased over time by adding storage tanks. For transfer of LNG from the storage tanks to the ship, insulated piping with a pipe connection or marine loading arm is used. The distance from the terminal to the quay should be as short as possible to minimise boil-off. From the receiving and storage terminals the LNG can be transported to fuel bunkering stations.
28
Figure 2-4 LNG receiving and storage terminal (Source: MARINTEK) 2.3.1.3 LNG import and export terminals in Europe There are a number of LNG import terminals in Europe and terminals under construction. 2.3.1.4 Transportation of LNG Future transportation of LNG from production sites or from larger carriers may be expected by the same type of small LNG carriers serving a range of terminals and bunkering stations along the Norwegian coast today. Construction time for these ships allows market needs to be met in due time for demand growth. 2.3.1.5 Downstream distribution Distribution of LNG as fuel is considered most realistic through the distribution system that is already established for ship bunkering. The bunkering stations offer various qualities of hydrocarbon fuels, and many of them should be able to establish the necessary equipment safety procedures to also offer LNG without extensive investment needs. 2.3.1.6 LNG tanks on quay The stationary tanks are served by either trucks or small LNG carriers. The instalment of a new LNG terminal in Sarpsborg (Norway) was budgeted to 85 mNOK (10.8 mEUR) for 5 x 700 m3 LNG tanks. This facility is served by the small LNG carrier Pioneer Knutsen from the LNG plants in Kollsnes and Karmøy (Gasnor 2009). 2.3.2 Distribution of CNG
The distribution of CNG is more available in countries with developed gas distribution grid for daily use in households. This is generally the case for the European continent and UK. Arranging CNG bunkering stations for ships should therefore be considerably easier to achieve than LNG bunkering, and less costly. Also one escapes the energy-demanding process of LNG liquefaction. The gas is typically transported at approximately 70 bar in the main grid, and reduced to 4-5 bar near the end users. For marine use the gas would have to be compressed to 200-250 bar at the bunkering station.
29
2.4 Biogas as a contributing alternative
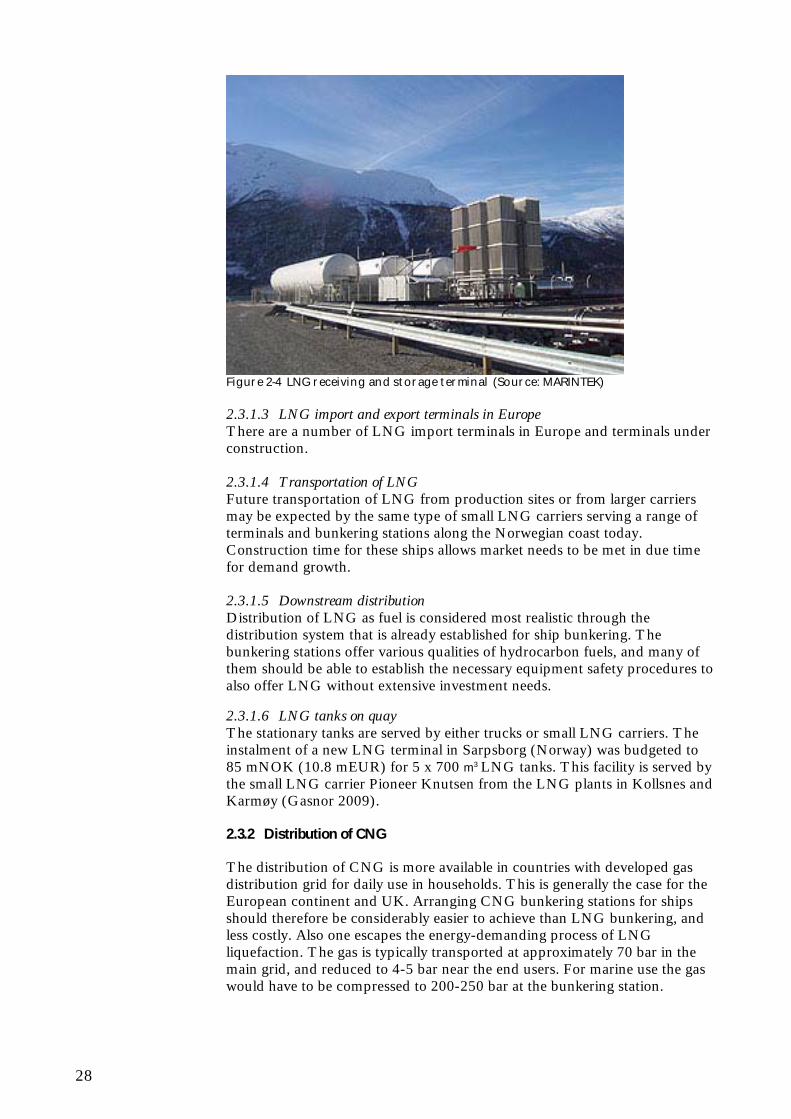
Biogas production is a proven technology, which still has great development potential. To produce biogas a biological decomposition process occurs in which anaerobic microorganisms break down organic material. Degradation takes place in a fermentation tank, a reactor from which the gas is collected and any substrate and debris removed. Biogas can be used in as many different ways as natural gas. Figure 2-4 shows the options available for the use of this versatile source of energy. At present, biogas is mostly employed in combined heat and power plants, but it could also be used in cooling facilities or as a substitution for natural gas as a fuel. It could also be injected into the gas grid, but will in that case require upgrade to match the quality of natural gas7.
Figure 2-5 Biogas treatment procedure In Denmark, biogas is today utilised locally at cogeneration plants and the advantage is that no investments in further treatment are needed. The treatments to upgrade biogas include de-sulphurisation, CO2 separation and possibly addition of propane gas. The CO2 must to be stripped from the biogas before entering the Danish natural gas net to establish the high calorific value the North Sea natural gas has. Propane can also be added to obtain the sales quality before entering the gas grid. The extra cost of treating biogas to an extent that matches the North Sea natural gas is 1.09 Danish kroner (0.15 EUR) per cubic meter bio-methane. One advantage of injecting biogas to the grid is that a surplus of biogas during the summer can be utilised: biogas is produced in an even volume during a year but the need of the energy changes from summer to winter, and any biogas plants have to cool off the biogas instead of using it during the summer time, which gives a lower efficiency of the biogas8. Regarding climate issues, the special advantage of using biogas is obviously that the emission of green house gasses is reduced. However, the use of manure for biogas rather than distributing it on fields will also reduce the nutrient load on the Danish lakes and streams.
7 From Deutsche Energie-Agentur GmbH (dena) 8 Knud Boesgaard Sørensen, Energinet.dk: Ingeniøren (Biogas kan gøre naturgasnettet stuerent)
30
It is the strategy of the Danish government with its “Grøn Vækst-plan” that half of the Danish manure shall be used as biogas in 2020. The biogas will replace almost 10% of the daily natural gas consumption9. Already in 2011 it is expected that the first biogas would enter the Danish Natural gas net. The main tasks of “Grøn Vækst-plan” concerning biogas are as follows:
A pool of 85 million Dkr (11.4 mEUR) per year the first three years from 2010 to 2012. Construction subsidy of up to 20% when building of a biogas plant.
A pool of 15 million Dkr (2 mEUR) per year to ecological biogas plant. Construction subsidy of op to 20%.
Amendment of the Planning Act, municipalities must involve localisation of biogas plants in the planning.
Equal subsidy for distribution of biogas to the cogeneration plant and the natural gas net.
Subsidies for planting energy crops from 2010 to 2012. When the plan is fully integrated it is expected that the Danish biogas production will be of approx. 19 PetaJoule (PJ) in 2020. However, most of the biogas production is expected to be utilised in local plants and only a fraction of the biogas will be upgraded to the Danish gas grid. Nevertheless, for “use” in the shipping sector the biogas could be traded commercially through a certificate system, known from green electricity10.
2.5 Summary and conclusions
The technical developments needed to introduce natural gas for propulsion is available for shipping both for ferries and the short sea shipping. For LNG the experiences with onshore and onboard installations are recent and during the coming years the knowledge base will be continuously expanding due to new developments. For CNG the development for the shipping sector appears not to have progressed much over the last decade, although considerable information is available from land transport. The use of upgraded biogas in gas driven engines is not problematic technically, but may not be feasible unless biogas is injected and distributed with the natural gas grid and supplied with the natural gas bunkering facility.
9 Source: Energinet.dk, Forsyningssikkerhedsplan (p. 57) 10 Source: Ingeniøren 11. January 2010: “Danmark er klar til at sende biogas ud I naturgasnettet”
31
3 Substituting with natural gas in shipping in Denmark
3.1 The setting in Denmark – what is the potential?
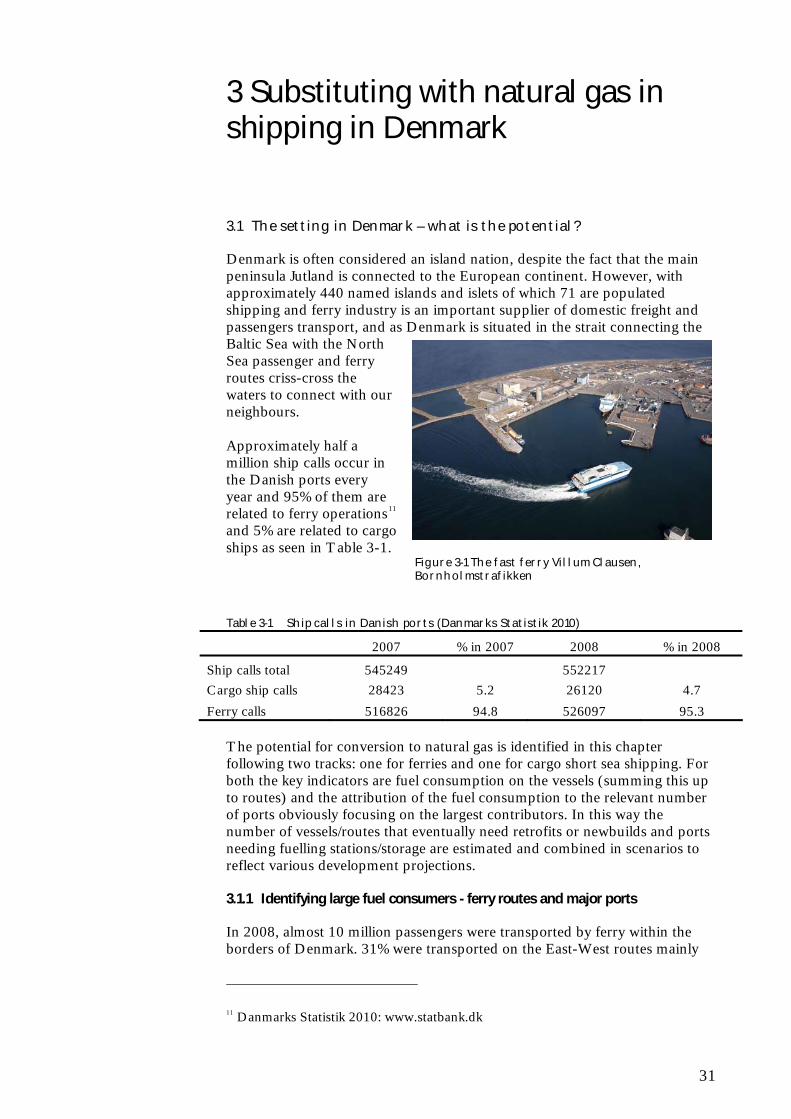
Denmark is often considered an island nation, despite the fact that the main peninsula Jutland is connected to the European continent. However, with approximately 440 named islands and islets of which 71 are populated shipping and ferry industry is an important supplier of domestic freight and passengers transport, and as Denmark is situated in the strait connecting the Baltic Sea with the North Sea passenger and ferry routes criss-cross the waters to connect with our neighbours. Approximately half a million ship calls occur in the Danish ports every year and 95% of them are related to ferry operations11 and 5% are related to cargo ships as seen in Table 3-1.
Figure 3-1 The fast ferry Villum Clausen, Bornholmstrafikken
Table 3-1 Ship calls in Danish ports (Danmarks Statistik 2010)
2007 % in 2007 2008 % in 2008
Ship calls total 545249 552217
Cargo ship calls 28423 5.2 26120 4.7
Ferry calls 516826 94.8 526097 95.3 The potential for conversion to natural gas is identified in this chapter following two tracks: one for ferries and one for cargo short sea shipping. For both the key indicators are fuel consumption on the vessels (summing this up to routes) and the attribution of the fuel consumption to the relevant number of ports obviously focusing on the largest contributors. In this way the number of vessels/routes that eventually need retrofits or newbuilds and ports needing fuelling stations/storage are estimated and combined in scenarios to reflect various development projections. 3.1.1 Identifying large fuel consumers - ferry routes and major ports
In 2008, almost 10 million passengers were transported by ferry within the borders of Denmark. 31% were transported on the East-West routes mainly
11 Danmarks Statistik 2010: www.statbank.dk
32
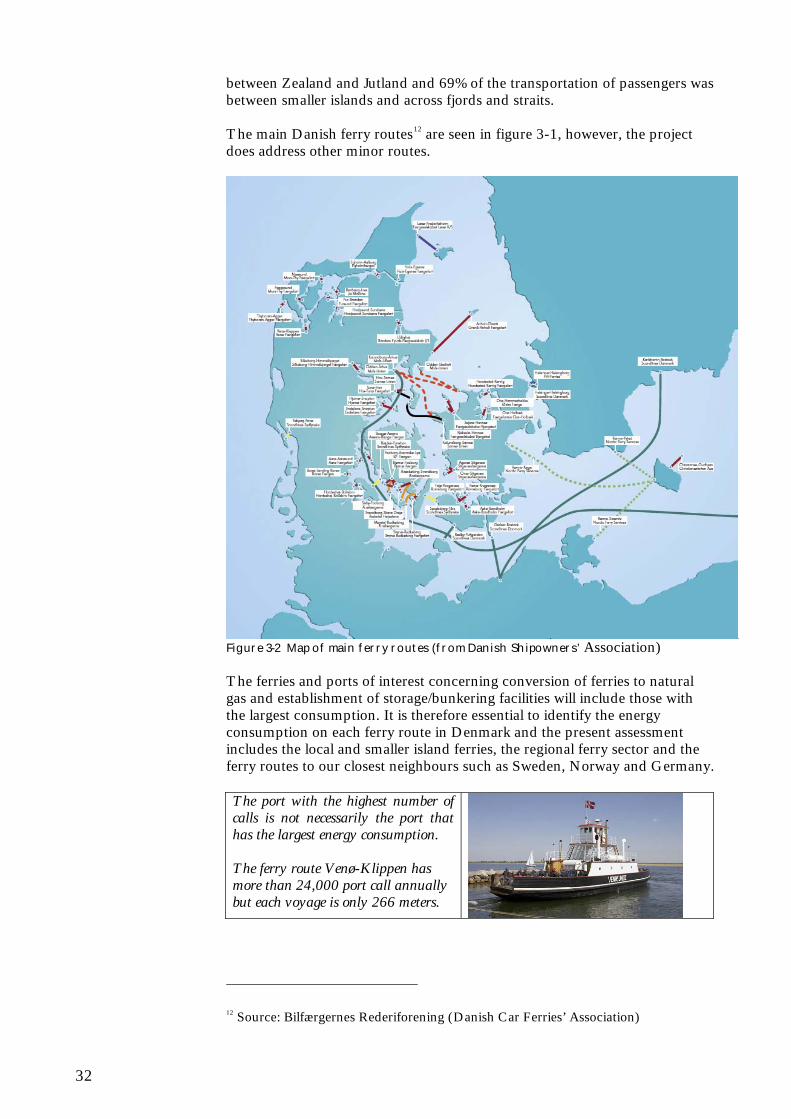
between Zealand and Jutland and 69% of the transportation of passengers was between smaller islands and across fjords and straits. The main Danish ferry routes12 are seen in figure 3-1, however, the project does address other minor routes.
Figure 3-2 Map of main ferry routes (from Danish Shipowners’ Association) The ferries and ports of interest concerning conversion of ferries to natural gas and establishment of storage/bunkering facilities will include those with the largest consumption. It is therefore essential to identify the energy consumption on each ferry route in Denmark and the present assessment includes the local and smaller island ferries, the regional ferry sector and the ferry routes to our closest neighbours such as Sweden, Norway and Germany.
12 Source: Bilfærgernes Rederiforening (Danish Car Ferries’ Association)
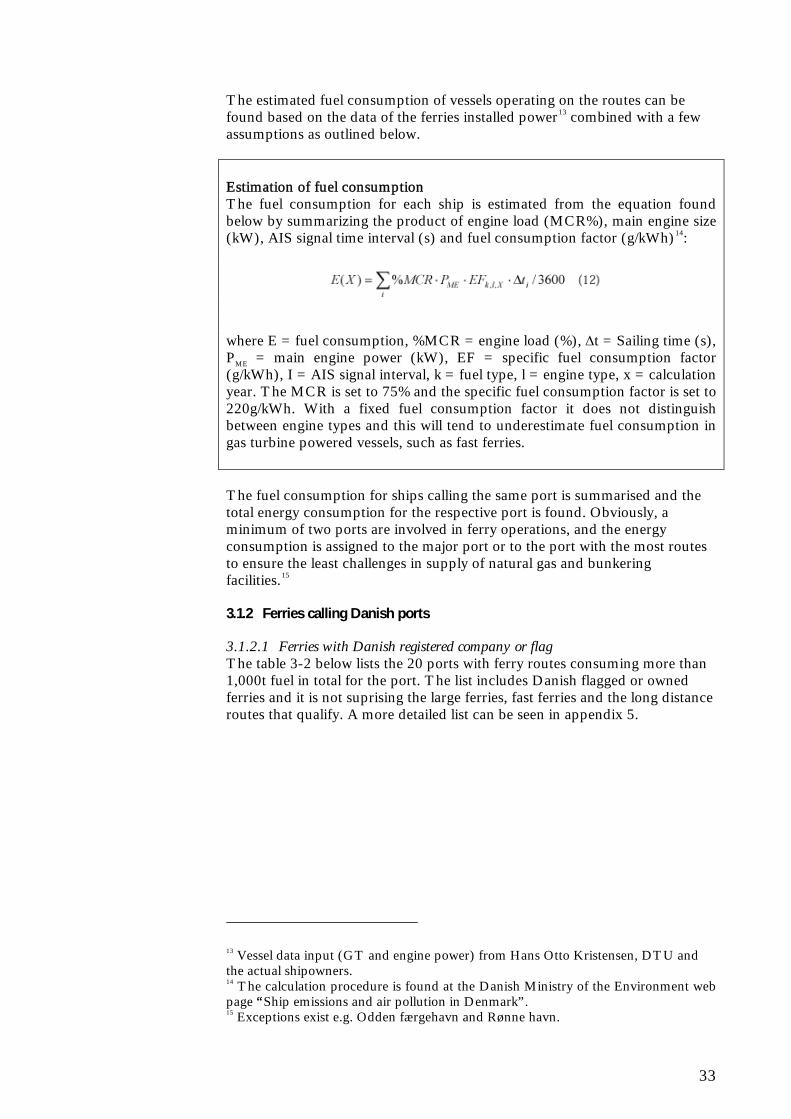
The port with the highest number of calls is not necessarily the port that has the largest energy consumption. The ferry route Venø-Klippen has more than 24,000 port call annually but each voyage is only 266 meters.
33
The estimated fuel consumption of vessels operating on the routes can be found based on the data of the ferries installed power13 combined with a few assumptions as outlined below. Estimation of fuel consumption The fuel consumption for each ship is estimated from the equation found below by summarizing the product of engine load (MCR%), main engine size (kW), AIS signal time interval (s) and fuel consumption factor (g/kWh)14:
where E = fuel consumption, %MCR = engine load (%), t = Sailing time (s), PME = main engine power (kW), EF = specific fuel consumption factor (g/kWh), I = AIS signal interval, k = fuel type, l = engine type, x = calculation year. The MCR is set to 75% and the specific fuel consumption factor is set to 220g/kWh. With a fixed fuel consumption factor it does not distinguish between engine types and this will tend to underestimate fuel consumption in gas turbine powered vessels, such as fast ferries. The fuel consumption for ships calling the same port is summarised and the total energy consumption for the respective port is found. Obviously, a minimum of two ports are involved in ferry operations, and the energy consumption is assigned to the major port or to the port with the most routes to ensure the least challenges in supply of natural gas and bunkering facilities.15 3.1.2 Ferries calling Danish ports
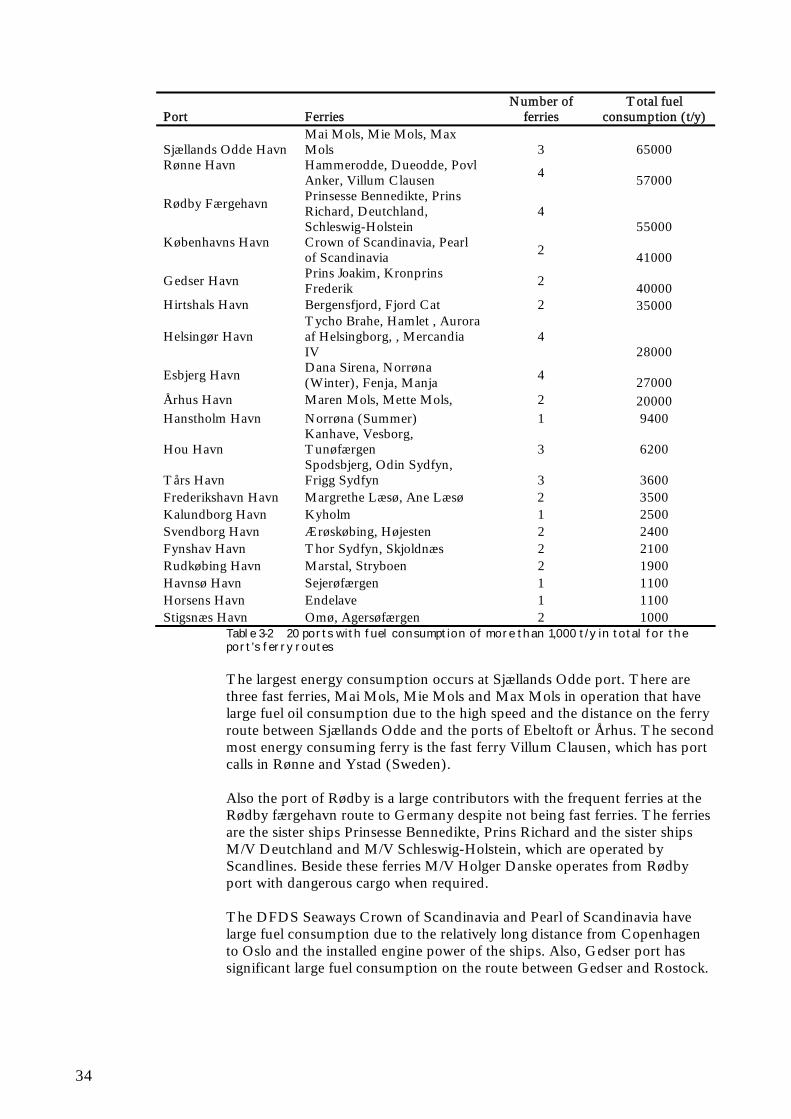
3.1.2.1 Ferries with Danish registered company or flag The table 3-2 below lists the 20 ports with ferry routes consuming more than 1,000t fuel in total for the port. The list includes Danish flagged or owned ferries and it is not suprising the large ferries, fast ferries and the long distance routes that qualify. A more detailed list can be seen in appendix 5.
13 Vessel data input (GT and engine power) from Hans Otto Kristensen, DTU and the actual shipowners. 14 The calculation procedure is found at the Danish Ministry of the Environment web page “Ship emissions and air pollution in Denmark”. 15 Exceptions exist e.g. Odden færgehavn and Rønne havn.
34
Port Ferries Number of
ferries Total fuel
consumption (t/y)
Sjællands Odde Havn Mai Mols, Mie Mols, Max Mols 3 65000
Rønne Havn
Hammerodde, Dueodde, Povl Anker, Villum Clausen 4 57000
Rødby Færgehavn
Prinsesse Bennedikte, Prins Richard, Deutchland, Schleswig-Holstein
4 55000
Københavns Havn
Crown of Scandinavia, Pearl of Scandinavia 2 41000
Gedser Havn Prins Joakim, Kronprins Frederik 2 40000
Hirtshals Havn Bergensfjord, Fjord Cat 2 35000
Helsingør Havn Tycho Brahe, Hamlet , Aurora af Helsingborg, , Mercandia IV
4 28000
Esbjerg Havn Dana Sirena, Norrøna (Winter), Fenja, Manja
4 27000 Århus Havn Maren Mols, Mette Mols, 2 20000 Hanstholm Havn Norrøna (Summer) 1 9400
Hou Havn Kanhave, Vesborg, Tunøfærgen 3 6200
Tårs Havn Spodsbjerg, Odin Sydfyn, Frigg Sydfyn 3 3600
Frederikshavn Havn Margrethe Læsø, Ane Læsø 2 3500 Kalundborg Havn Kyholm 1 2500 Svendborg Havn Ærøskøbing, Højesten 2 2400 Fynshav Havn Thor Sydfyn, Skjoldnæs 2 2100 Rudkøbing Havn Marstal, Stryboen 2 1900 Havnsø Havn Sejerøfærgen 1 1100 Horsens Havn Endelave 1 1100 Stigsnæs Havn Omø, Agersøfærgen 2 1000
Table 3-2 20 ports with fuel consumption of more than 1,000 t/y in total for the port’s ferry routes The largest energy consumption occurs at Sjællands Odde port. There are three fast ferries, Mai Mols, Mie Mols and Max Mols in operation that have large fuel oil consumption due to the high speed and the distance on the ferry route between Sjællands Odde and the ports of Ebeltoft or Århus. The second most energy consuming ferry is the fast ferry Villum Clausen, which has port calls in Rønne and Ystad (Sweden). Also the port of Rødby is a large contributors with the frequent ferries at the Rødby færgehavn route to Germany despite not being fast ferries. The ferries are the sister ships Prinsesse Bennedikte, Prins Richard and the sister ships M/V Deutchland and M/V Schleswig-Holstein, which are operated by Scandlines. Beside these ferries M/V Holger Danske operates from Rødby port with dangerous cargo when required. The DFDS Seaways Crown of Scandinavia and Pearl of Scandinavia have large fuel consumption due to the relatively long distance from Copenhagen to Oslo and the installed engine power of the ships. Also, Gedser port has significant large fuel consumption on the route between Gedser and Rostock.
35
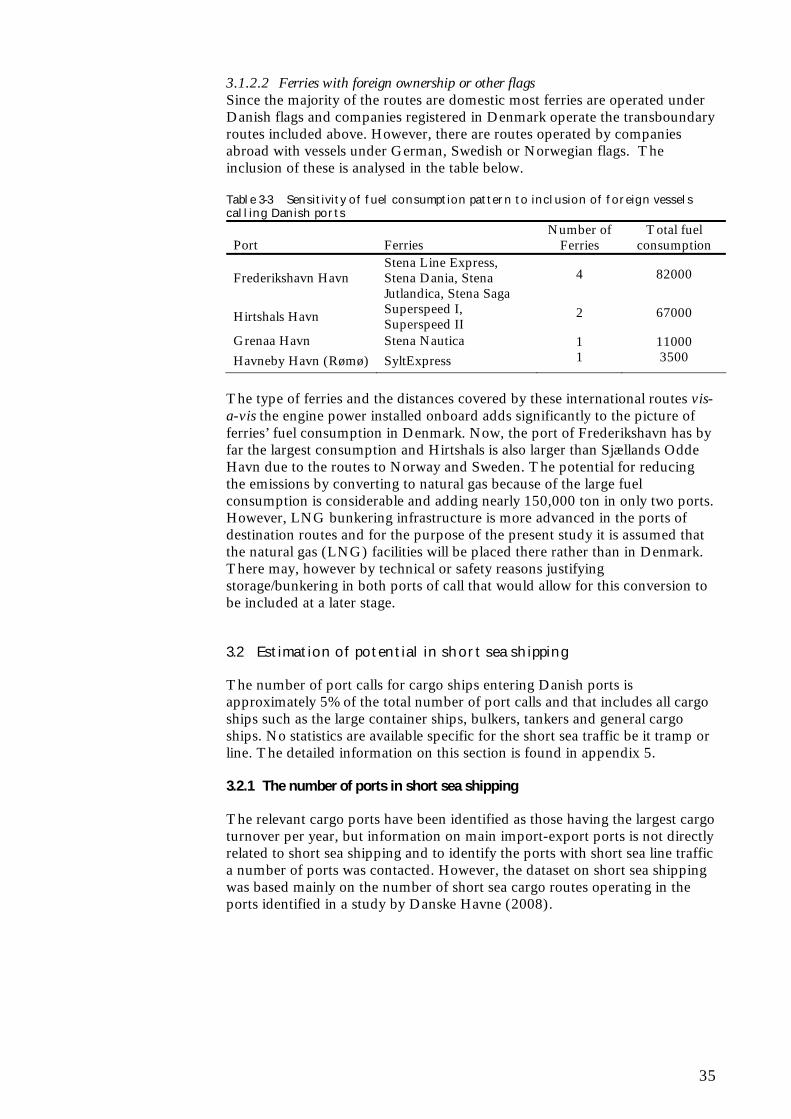
3.1.2.2 Ferries with foreign ownership or other flags Since the majority of the routes are domestic most ferries are operated under Danish flags and companies registered in Denmark operate the transboundary routes included above. However, there are routes operated by companies abroad with vessels under German, Swedish or Norwegian flags. The inclusion of these is analysed in the table below. Table 3-3 Sensitivity of fuel consumption pattern to inclusion of foreign vessels calling Danish ports
Port Ferries Number of
Ferries Total fuel
consumption
Frederikshavn Havn Stena Line Express, Stena Dania, Stena Jutlandica, Stena Saga
4 82000
Hirtshals Havn Superspeed I, Superspeed II
2 67000
Grenaa Havn Stena Nautica 1 11000 Havneby Havn (Rømø) SyltExpress 1 3500
The type of ferries and the distances covered by these international routes vis- a-vis the engine power installed onboard adds significantly to the picture of ferries’ fuel consumption in Denmark. Now, the port of Frederikshavn has by far the largest consumption and Hirtshals is also larger than Sjællands Odde Havn due to the routes to Norway and Sweden. The potential for reducing the emissions by converting to natural gas because of the large fuel consumption is considerable and adding nearly 150,000 ton in only two ports. However, LNG bunkering infrastructure is more advanced in the ports of destination routes and for the purpose of the present study it is assumed that the natural gas (LNG) facilities will be placed there rather than in Denmark. There may, however by technical or safety reasons justifying storage/bunkering in both ports of call that would allow for this conversion to be included at a later stage.
3.2 Estimation of potential in short sea shipping
The number of port calls for cargo ships entering Danish ports is approximately 5% of the total number of port calls and that includes all cargo ships such as the large container ships, bulkers, tankers and general cargo ships. No statistics are available specific for the short sea traffic be it tramp or line. The detailed information on this section is found in appendix 5. 3.2.1 The number of ports in short sea shipping
The relevant cargo ports have been identified as those having the largest cargo turnover per year, but information on main import-export ports is not directly related to short sea shipping and to identify the ports with short sea line traffic a number of ports was contacted. However, the dataset on short sea shipping was based mainly on the number of short sea cargo routes operating in the ports identified in a study by Danske Havne (2008).
36
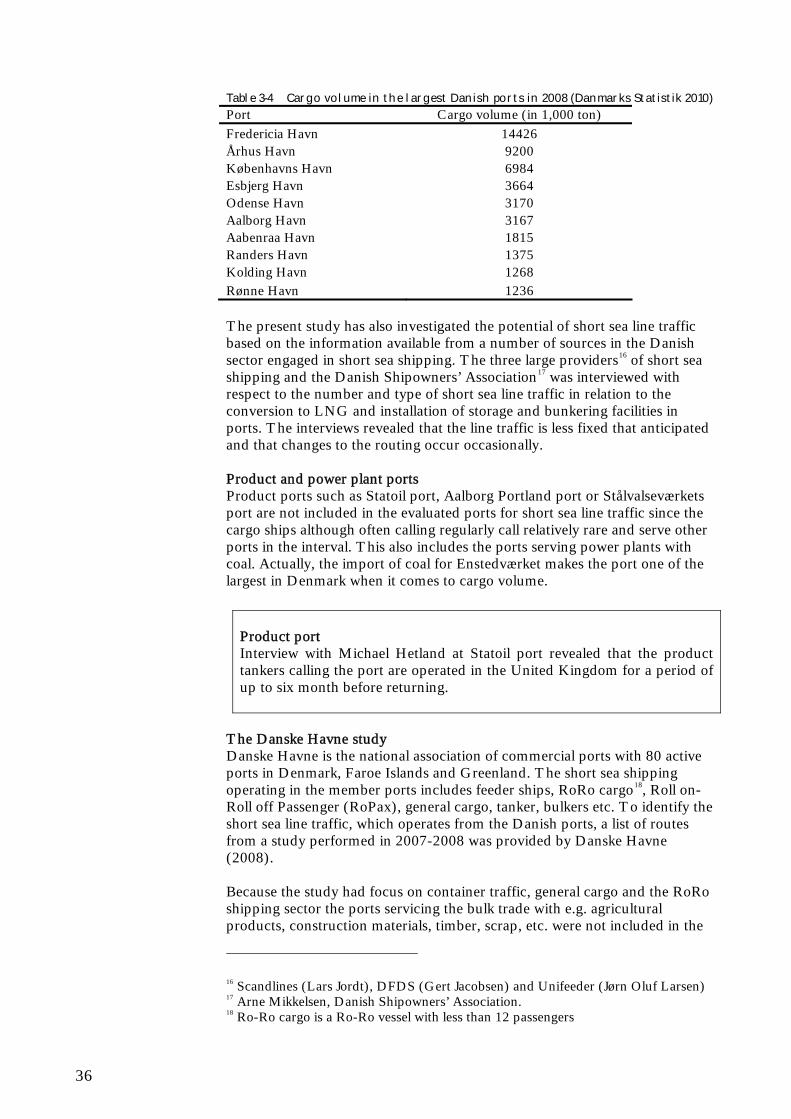
Table 3-4 Cargo volume in the largest Danish ports in 2008 (Danmarks Statistik 2010)
Port Cargo volume (in 1,000 ton) Fredericia Havn 14426 Århus Havn 9200 Københavns Havn 6984 Esbjerg Havn 3664 Odense Havn 3170 Aalborg Havn 3167 Aabenraa Havn 1815 Randers Havn 1375 Kolding Havn 1268 Rønne Havn 1236 The present study has also investigated the potential of short sea line traffic based on the information available from a number of sources in the Danish sector engaged in short sea shipping. The three large providers16 of short sea shipping and the Danish Shipowners’ Association17 was interviewed with respect to the number and type of short sea line traffic in relation to the conversion to LNG and installation of storage and bunkering facilities in ports. The interviews revealed that the line traffic is less fixed that anticipated and that changes to the routing occur occasionally. Product and power plant ports Product ports such as Statoil port, Aalborg Portland port or Stålvalseværkets port are not included in the evaluated ports for short sea line traffic since the cargo ships although often calling regularly call relatively rare and serve other ports in the interval. This also includes the ports serving power plants with coal. Actually, the import of coal for Enstedværket makes the port one of the largest in Denmark when it comes to cargo volume.
The Danske Havne study Danske Havne is the national association of commercial ports with 80 active ports in Denmark, Faroe Islands and Greenland. The short sea shipping operating in the member ports includes feeder ships, RoRo cargo18, Roll on-Roll off Passenger (RoPax), general cargo, tanker, bulkers etc. To identify the short sea line traffic, which operates from the Danish ports, a list of routes from a study performed in 2007-2008 was provided by Danske Havne (2008). Because the study had focus on container traffic, general cargo and the RoRo shipping sector the ports servicing the bulk trade with e.g. agricultural products, construction materials, timber, scrap, etc. were not included in the
16 Scandlines (Lars Jordt), DFDS (Gert Jacobsen) and Unifeeder (Jørn Oluf Larsen) 17 Arne Mikkelsen, Danish Shipowners’ Association. 18 Ro-Ro cargo is a Ro-Ro vessel with less than 12 passengers
Product port Interview with Michael Hetland at Statoil port revealed that the product tankers calling the port are operated in the United Kingdom for a period of up to six month before returning.
37
Danske Havne study. This would concern the ports in e.g. Randers, Vejle, Horsens, Aabenraa, Odense, and several more, but the presence of line traffic or the actual volumes involved are not known. To accommodate this uncertainty we have added three undisclosed ports to the 11 ports identified in Dansk Havne’s study bringing the total number of ports to 14 involved in short sea line shipping19. In addition to the three unnamed ports, the main short sea shipping ports (in alphabetical order) are:
CMP/Copenhagen Esbjerg Fredericia/Associated Danish Port (ADP) Frederikshavn Grenå Hanstholm Hirtshals Hundested Kolding Aarhus Aalborg
The largest of these are Fredericia, Aarhus, Copenhagen and Esbjerg.
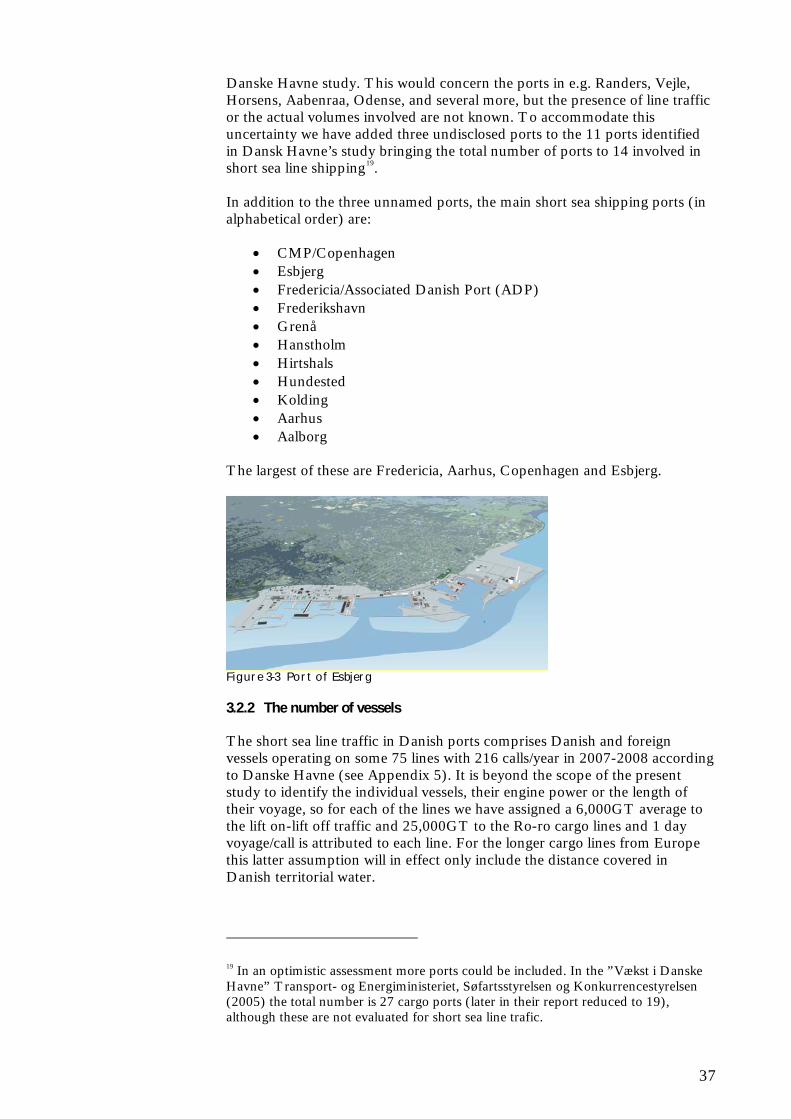
Figure 3-3 Port of Esbjerg 3.2.2 The number of vessels
The short sea line traffic in Danish ports comprises Danish and foreign vessels operating on some 75 lines with 216 calls/year in 2007-2008 according to Danske Havne (see Appendix 5). It is beyond the scope of the present study to identify the individual vessels, their engine power or the length of their voyage, so for each of the lines we have assigned a 6,000GT average to the lift on-lift off traffic and 25,000GT to the Ro-ro cargo lines and 1 day voyage/call is attributed to each line. For the longer cargo lines from Europe this latter assumption will in effect only include the distance covered in Danish territorial water.
19 In an optimistic assessment more ports could be included. In the ”Vækst i Danske Havne” Transport- og Energiministeriet, Søfartsstyrelsen og Konkurrencestyrelsen (2005) the total number is 27 cargo ports (later in their report reduced to 19), although these are not evaluated for short sea line trafic.
38
Since the data are from the height of the shipping boom we have reduced the fuel consumption with 25% to reflect the present cooler market conditions. The fuel consumption in the short sea shipping is therefore estimated on the basis of crude assumptions and must be taken as indicative. The number of vessels calling Danish ports in short sea line traffic on the 75 lines has been set to 78 vessels. Some of the lines have relatively rare calls (< one per month) and obviously operate on other voyages where natural gas may not be accessible. A more conservative estimate may leave these out, but the number could also be set higher considering the bulk trade was not included in the Danske Havne study or considering a future situation where the availability of natural gas for bunkering is more widespread in SECAs and a number of vessels operate in these waters with dual fuel engines.20 In the following the “maximum” number of vessels considered is maintained at 78.
3.3 Scenarios for natural gas conversion
To identify the ports in Denmark that have the potential for installing a LNG or CNG refilling system four scenarios have been identified. The consumption of energy on ships, which is estimated for the ferries and the vessels engaged in short sea shipping calling at least one Danish port. This in turn defines the three basic needs in terms of infrastructure:
Ships - the installations needed on ships (be it new ships or existing with retrofits)
Port - the installations needed in ports or other bunkering infrastructure
Infrastructure - the gas processing, storage and distribution network For the ships the number of Danish ferries and number of vessels in short sea shipping is estimated. For the ports the number of ports are estimated within the ferry sector and the short sea shipping sector. The final bullit is considered elsewhere in the report (section 5 and 6), and for the purpose of estimating the energy consumption and eventually pollution reduction scenarios it is anticipated that natural gas is distributed to the bunkering facilities and ships at par with existing fuel distribution. 3.3.1 Defining the scenarios
Four scenarios have been defined. The first scenario is a “maximum” long-term scenario where all ferries and greater portion of short sea shipping is expected to use natural gas for propulsion. The following scenarios define more realistic scenarios with fewer vessels and fewer port installations thereby also potentially moving into a shorter and more feasible time frame. To link the fuel or energy consumption for ferries to a specific port where an installation could be located the mainland or main island port is chosen
20 We have added a contribution to the potential LNG consumption by including approx. 15,000 t/y estimated from the 31 lesser vessels operating the tramp trade and registered with the members of Rederiforening af 1898 and Rederiforening for Mindre Skibe (based on data from H.O. Kristensen, DTU)
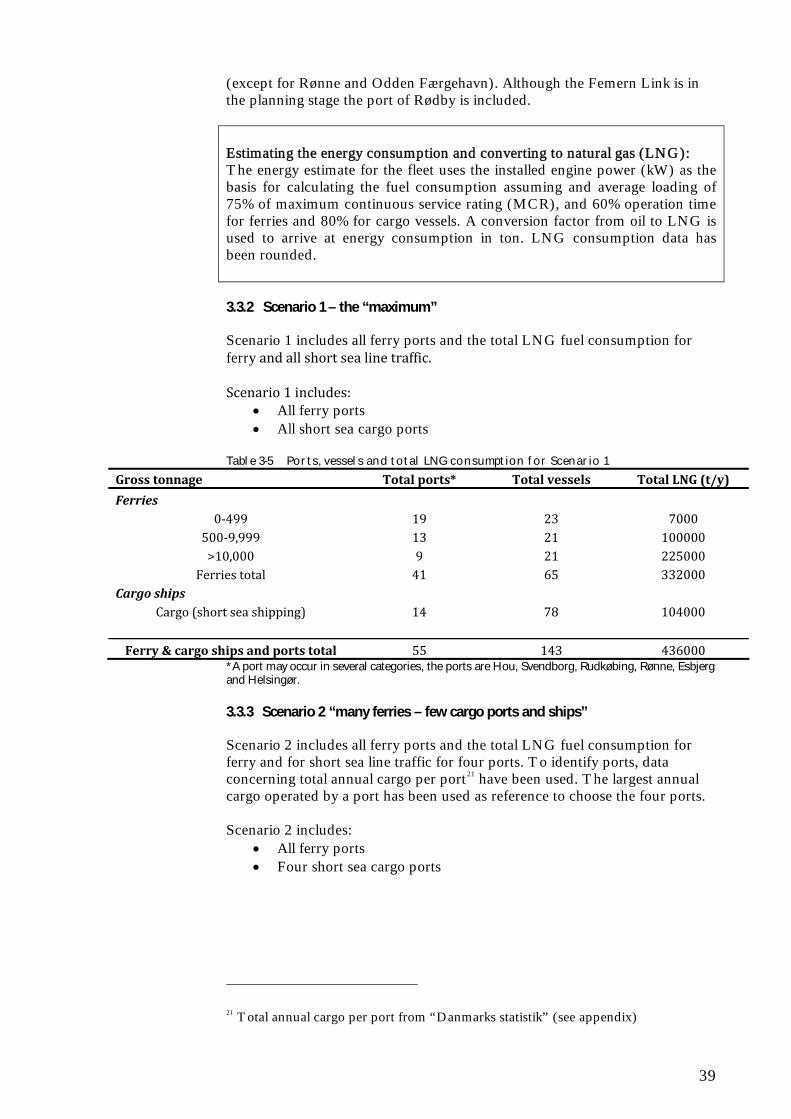
39
(except for Rønne and Odden Færgehavn). Although the Femern Link is in the planning stage the port of Rødby is included. Estimating the energy consumption and converting to natural gas (LNG): The energy estimate for the fleet uses the installed engine power (kW) as the basis for calculating the fuel consumption assuming and average loading of 75% of maximum continuous service rating (MCR), and 60% operation time for ferries and 80% for cargo vessels. A conversion factor from oil to LNG is used to arrive at energy consumption in ton. LNG consumption data has been rounded. 3.3.2 Scenario 1 – the “maximum”
Scenario 1 includes all ferry ports and the total LNG fuel consumption for ferry and all short sea line traffic. Scenario 1 includes:
All ferry ports All short sea cargo ports
Table 3-5 Ports, vessels and total LNG consumption for Scenario 1
Gross tonnage Total ports* Total vessels Total LNG (t/y)
Ferries 0‐499 19 23 7000
500‐9,999 13 21 100000 >10,000 9 21 225000
Ferries total 41 65 332000 Cargo ships
Cargo (short sea shipping) 14 78 104000
Ferry & cargo ships and ports total 55 143 436000 *A port may occur in several categories, the ports are Hou, Svendborg, Rudkøbing, Rønne, Esbjerg and Helsingør.
3.3.3 Scenario 2 “many ferries – few cargo ports and ships”
Scenario 2 includes all ferry ports and the total LNG fuel consumption for ferry and for short sea line traffic for four ports. To identify ports, data concerning total annual cargo per port21 have been used. The largest annual cargo operated by a port has been used as reference to choose the four ports. Scenario 2 includes:
All ferry ports Four short sea cargo ports
21 Total annual cargo per port from “Danmarks statistik” (see appendix)
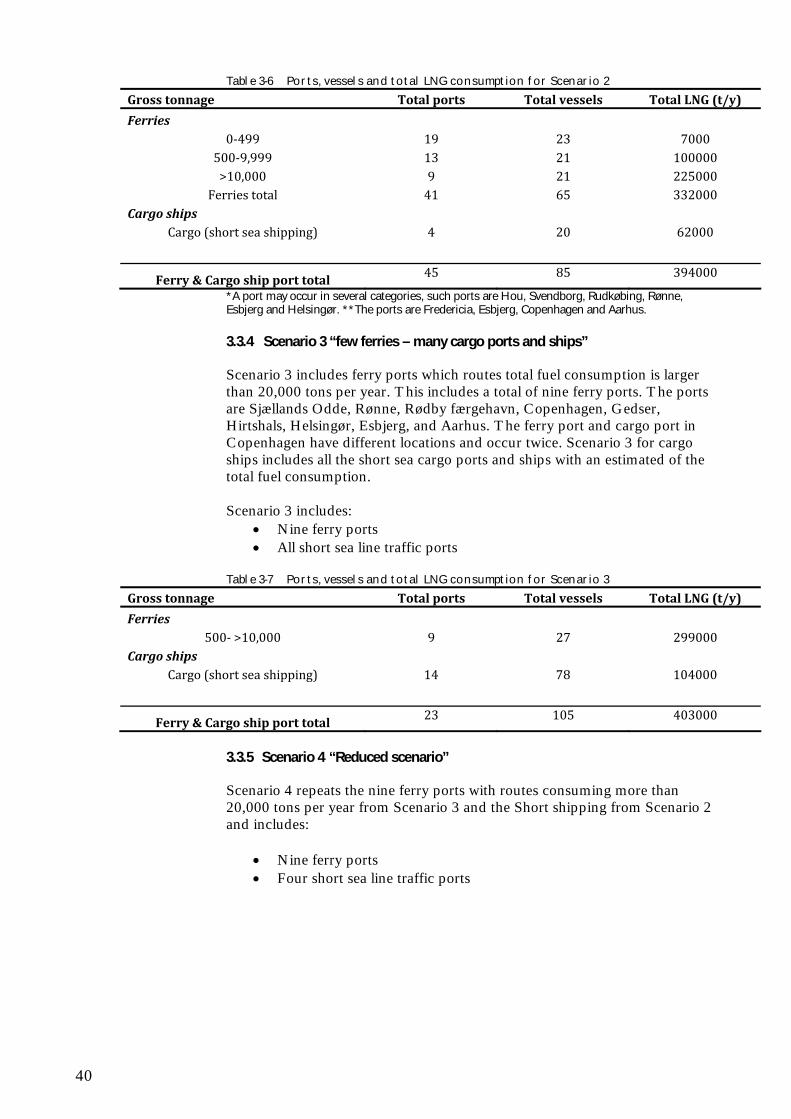
40
Table 3-6 Ports, vessels and total LNG consumption for Scenario 2
Gross tonnage Total ports Total vessels Total LNG (t/y)
Ferries 0‐499 19 23 7000
500‐9,999 13 21 100000 >10,000 9 21 225000
Ferries total 41 65 332000 Cargo ships
Cargo (short sea shipping) 4 20 62000
Ferry & Cargo ship port total 45 85 394000
*A port may occur in several categories, such ports are Hou, Svendborg, Rudkøbing, Rønne, Esbjerg and Helsingør. **The ports are Fredericia, Esbjerg, Copenhagen and Aarhus.
3.3.4 Scenario 3 “few ferries – many cargo ports and ships”
Scenario 3 includes ferry ports which routes total fuel consumption is larger than 20,000 tons per year. This includes a total of nine ferry ports. The ports are Sjællands Odde, Rønne, Rødby færgehavn, Copenhagen, Gedser, Hirtshals, Helsingør, Esbjerg, and Aarhus. The ferry port and cargo port in Copenhagen have different locations and occur twice. Scenario 3 for cargo ships includes all the short sea cargo ports and ships with an estimated of the total fuel consumption. Scenario 3 includes:
Nine ferry ports All short sea line traffic ports
Table 3-7 Ports, vessels and total LNG consumption for Scenario 3
Gross tonnage Total ports Total vessels Total LNG (t/y)
Ferries 500‐ >10,000 9 27 299000
Cargo ships Cargo (short sea shipping) 14 78 104000
Ferry & Cargo ship port total 23 105 403000
3.3.5 Scenario 4 “Reduced scenario”
Scenario 4 repeats the nine ferry ports with routes consuming more than 20,000 tons per year from Scenario 3 and the Short shipping from Scenario 2 and includes:
Nine ferry ports Four short sea line traffic ports
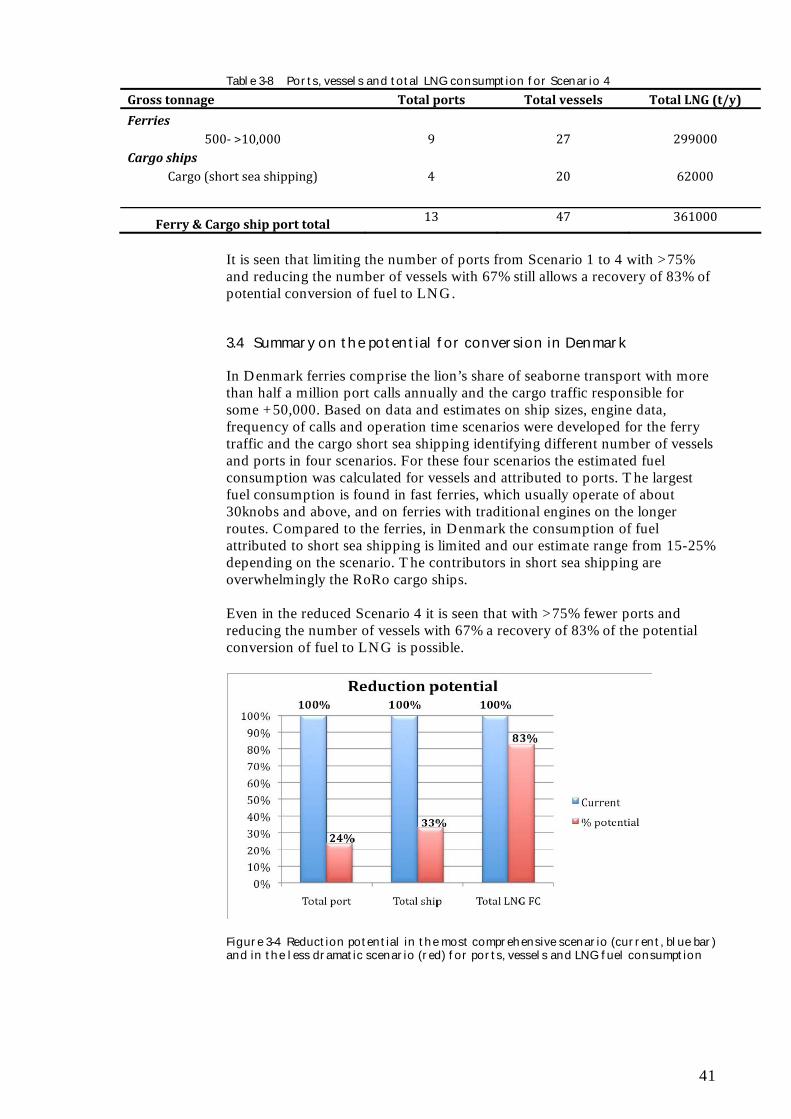
41
Table 3-8 Ports, vessels and total LNG consumption for Scenario 4
Gross tonnage Total ports Total vessels Total LNG (t/y)
Ferries 500‐ >10,000 9 27 299000
Cargo ships Cargo (short sea shipping) 4 20 62000
Ferry & Cargo ship port total 13 47 361000
It is seen that limiting the number of ports from Scenario 1 to 4 with >75% and reducing the number of vessels with 67% still allows a recovery of 83% of potential conversion of fuel to LNG.
3.4 Summary on the potential for conversion in Denmark
In Denmark ferries comprise the lion’s share of seaborne transport with more than half a million port calls annually and the cargo traffic responsible for some +50,000. Based on data and estimates on ship sizes, engine data, frequency of calls and operation time scenarios were developed for the ferry traffic and the cargo short sea shipping identifying different number of vessels and ports in four scenarios. For these four scenarios the estimated fuel consumption was calculated for vessels and attributed to ports. The largest fuel consumption is found in fast ferries, which usually operate of about 30knobs and above, and on ferries with traditional engines on the longer routes. Compared to the ferries, in Denmark the consumption of fuel attributed to short sea shipping is limited and our estimate range from 15-25% depending on the scenario. The contributors in short sea shipping are overwhelmingly the RoRo cargo ships. Even in the reduced Scenario 4 it is seen that with >75% fewer ports and reducing the number of vessels with 67% a recovery of 83% of the potential conversion of fuel to LNG is possible.
Figure 3-4 Reduction potential in the most comprehensive scenario (current, blue bar) and in the less dramatic scenario (red) for ports, vessels and LNG fuel consumption

42
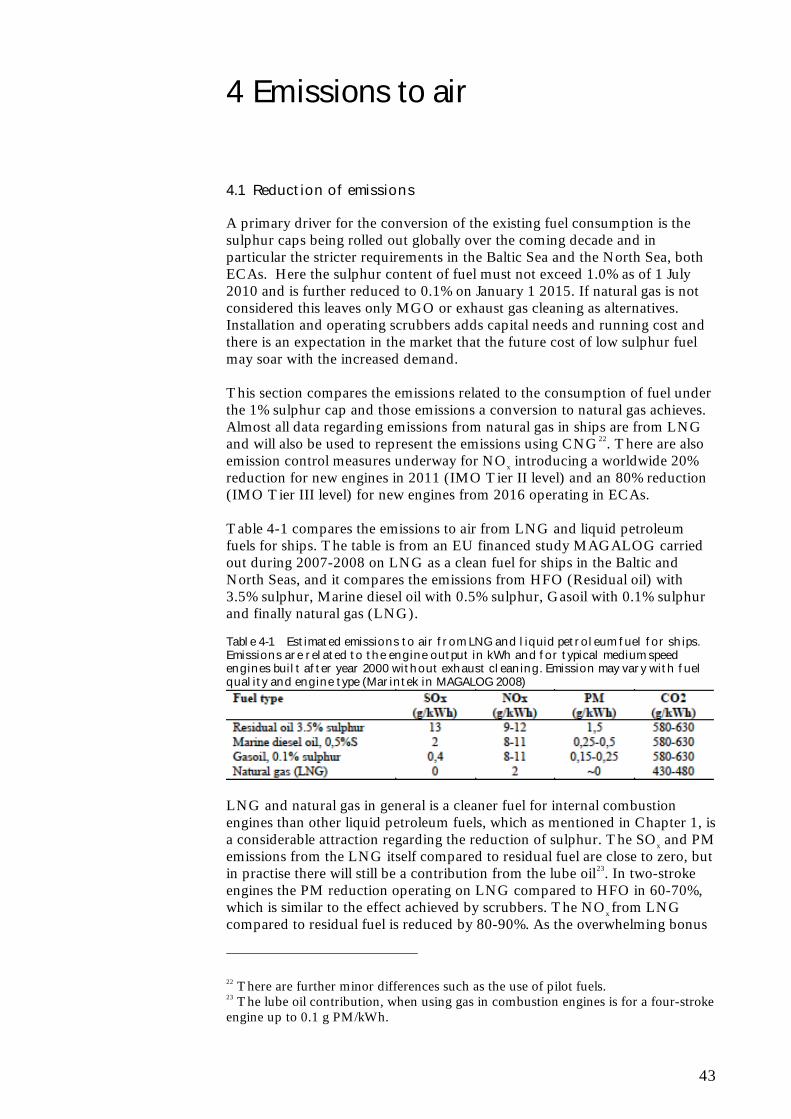
43
4 Emissions to air
4.1 Reduction of emissions
A primary driver for the conversion of the existing fuel consumption is the sulphur caps being rolled out globally over the coming decade and in particular the stricter requirements in the Baltic Sea and the North Sea, both ECAs. Here the sulphur content of fuel must not exceed 1.0% as of 1 July 2010 and is further reduced to 0.1% on January 1 2015. If natural gas is not considered this leaves only MGO or exhaust gas cleaning as alternatives. Installation and operating scrubbers adds capital needs and running cost and there is an expectation in the market that the future cost of low sulphur fuel may soar with the increased demand. This section compares the emissions related to the consumption of fuel under the 1% sulphur cap and those emissions a conversion to natural gas achieves. Almost all data regarding emissions from natural gas in ships are from LNG and will also be used to represent the emissions using CNG22. There are also emission control measures underway for NOx introducing a worldwide 20% reduction for new engines in 2011 (IMO Tier II level) and an 80% reduction (IMO Tier III level) for new engines from 2016 operating in ECAs. Table 4-1 compares the emissions to air from LNG and liquid petroleum fuels for ships. The table is from an EU financed study MAGALOG carried out during 2007-2008 on LNG as a clean fuel for ships in the Baltic and North Seas, and it compares the emissions from HFO (Residual oil) with 3.5% sulphur, Marine diesel oil with 0.5% sulphur, Gasoil with 0.1% sulphur and finally natural gas (LNG). Table 4-1 Estimated emissions to air from LNG and liquid petroleum fuel for ships. Emissions are related to the engine output in kWh and for typical medium speed engines built after year 2000 without exhaust cleaning. Emission may vary with fuel quality and engine type (Marintek in MAGALOG 2008)
LNG and natural gas in general is a cleaner fuel for internal combustion engines than other liquid petroleum fuels, which as mentioned in Chapter 1, is a considerable attraction regarding the reduction of sulphur. The SOx and PM emissions from the LNG itself compared to residual fuel are close to zero, but in practise there will still be a contribution from the lube oil23. In two-stroke engines the PM reduction operating on LNG compared to HFO in 60-70%, which is similar to the effect achieved by scrubbers. The NOx from LNG compared to residual fuel is reduced by 80-90%. As the overwhelming bonus
22 There are further minor differences such as the use of pilot fuels. 23 The lube oil contribution, when using gas in combustion engines is for a four-stroke engine up to 0.1 g PM/kWh.
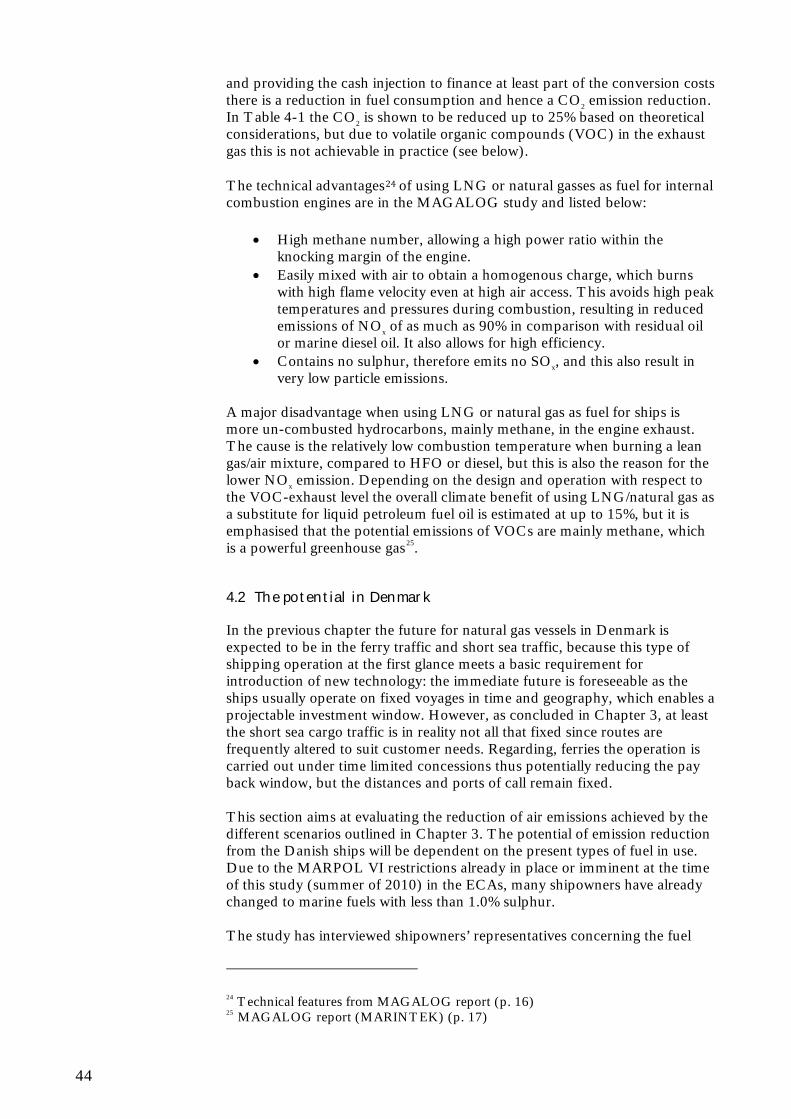
44
and providing the cash injection to finance at least part of the conversion costs there is a reduction in fuel consumption and hence a CO2 emission reduction. In Table 4-1 the CO2 is shown to be reduced up to 25% based on theoretical considerations, but due to volatile organic compounds (VOC) in the exhaust gas this is not achievable in practice (see below). The technical advantages24 of using LNG or natural gasses as fuel for internal combustion engines are in the MAGALOG study and listed below:
High methane number, allowing a high power ratio within the knocking margin of the engine.
Easily mixed with air to obtain a homogenous charge, which burns with high flame velocity even at high air access. This avoids high peak temperatures and pressures during combustion, resulting in reduced emissions of NOx of as much as 90% in comparison with residual oil or marine diesel oil. It also allows for high efficiency.
Contains no sulphur, therefore emits no SOx, and this also result in very low particle emissions.
A major disadvantage when using LNG or natural gas as fuel for ships is more un-combusted hydrocarbons, mainly methane, in the engine exhaust. The cause is the relatively low combustion temperature when burning a lean gas/air mixture, compared to HFO or diesel, but this is also the reason for the lower NOx emission. Depending on the design and operation with respect to the VOC-exhaust level the overall climate benefit of using LNG/natural gas as a substitute for liquid petroleum fuel oil is estimated at up to 15%, but it is emphasised that the potential emissions of VOCs are mainly methane, which is a powerful greenhouse gas25.
4.2 The potential in Denmark
In the previous chapter the future for natural gas vessels in Denmark is expected to be in the ferry traffic and short sea traffic, because this type of shipping operation at the first glance meets a basic requirement for introduction of new technology: the immediate future is foreseeable as the ships usually operate on fixed voyages in time and geography, which enables a projectable investment window. However, as concluded in Chapter 3, at least the short sea cargo traffic is in reality not all that fixed since routes are frequently altered to suit customer needs. Regarding, ferries the operation is carried out under time limited concessions thus potentially reducing the pay back window, but the distances and ports of call remain fixed. This section aims at evaluating the reduction of air emissions achieved by the different scenarios outlined in Chapter 3. The potential of emission reduction from the Danish ships will be dependent on the present types of fuel in use. Due to the MARPOL VI restrictions already in place or imminent at the time of this study (summer of 2010) in the ECAs, many shipowners have already changed to marine fuels with less than 1.0% sulphur. The study has interviewed shipowners’ representatives concerning the fuel
24 Technical features from MAGALOG report (p. 16) 25 MAGALOG report (MARINTEK) (p. 17)
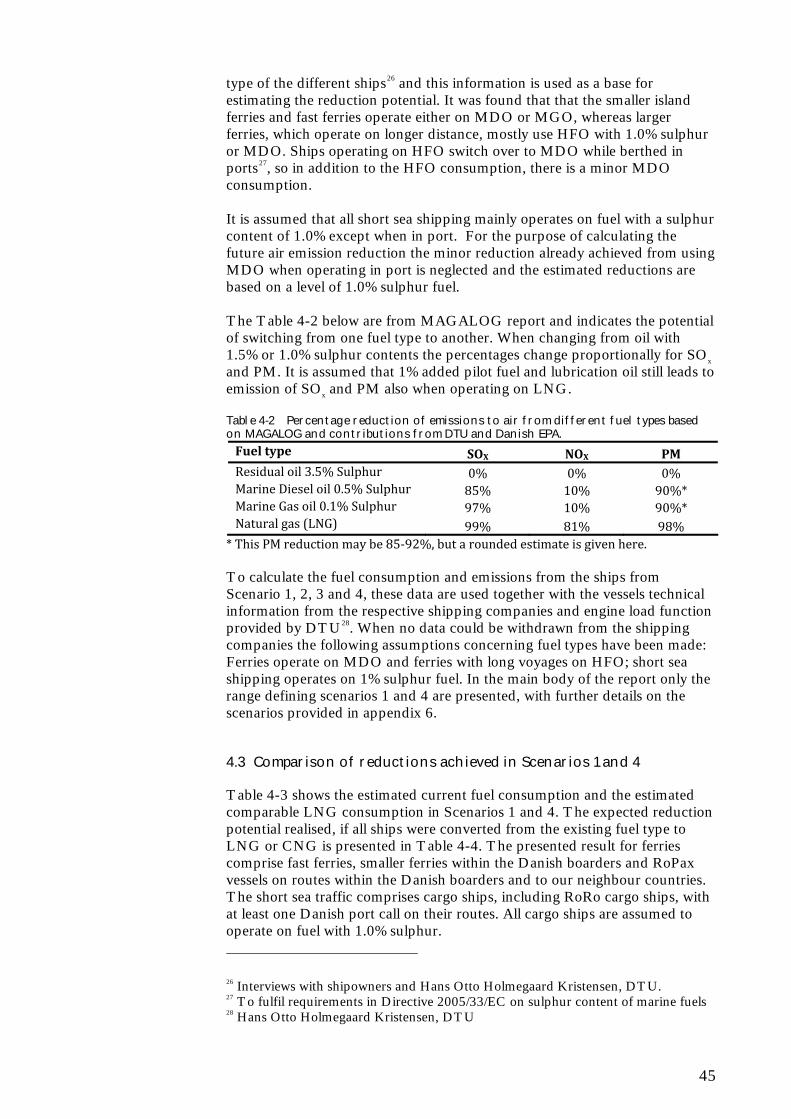
45
type of the different ships26 and this information is used as a base for estimating the reduction potential. It was found that that the smaller island ferries and fast ferries operate either on MDO or MGO, whereas larger ferries, which operate on longer distance, mostly use HFO with 1.0% sulphur or MDO. Ships operating on HFO switch over to MDO while berthed in ports27, so in addition to the HFO consumption, there is a minor MDO consumption. It is assumed that all short sea shipping mainly operates on fuel with a sulphur content of 1.0% except when in port. For the purpose of calculating the future air emission reduction the minor reduction already achieved from using MDO when operating in port is neglected and the estimated reductions are based on a level of 1.0% sulphur fuel. The Table 4-2 below are from MAGALOG report and indicates the potential of switching from one fuel type to another. When changing from oil with 1.5% or 1.0% sulphur contents the percentages change proportionally for SOx and PM. It is assumed that 1% added pilot fuel and lubrication oil still leads to emission of SOx and PM also when operating on LNG. Table 4-2 Percentage reduction of emissions to air from different fuel types based on MAGALOG and contributions from DTU and Danish EPA.
Fuel type SOX NOX PM Residual oil 3.5% Sulphur 0% 0% 0% Marine Diesel oil 0.5% Sulphur 85% 10% 90%* Marine Gas oil 0.1% Sulphur 97% 10% 90%* Natural gas (LNG) 99% 81% 98%
* This PM reduction may be 85‐92%, but a rounded estimate is given here.
To calculate the fuel consumption and emissions from the ships from Scenario 1, 2, 3 and 4, these data are used together with the vessels technical information from the respective shipping companies and engine load function provided by DTU28. When no data could be withdrawn from the shipping companies the following assumptions concerning fuel types have been made: Ferries operate on MDO and ferries with long voyages on HFO; short sea shipping operates on 1% sulphur fuel. In the main body of the report only the range defining scenarios 1 and 4 are presented, with further details on the scenarios provided in appendix 6.
4.3 Comparison of reductions achieved in Scenarios 1 and 4
Table 4-3 shows the estimated current fuel consumption and the estimated comparable LNG consumption in Scenarios 1 and 4. The expected reduction potential realised, if all ships were converted from the existing fuel type to LNG or CNG is presented in Table 4-4. The presented result for ferries comprise fast ferries, smaller ferries within the Danish boarders and RoPax vessels on routes within the Danish boarders and to our neighbour countries. The short sea traffic comprises cargo ships, including RoRo cargo ships, with at least one Danish port call on their routes. All cargo ships are assumed to operate on fuel with 1.0% sulphur.
26 Interviews with shipowners and Hans Otto Holmegaard Kristensen, DTU. 27 To fulfil requirements in Directive 2005/33/EC on sulphur content of marine fuels 28 Hans Otto Holmegaard Kristensen, DTU
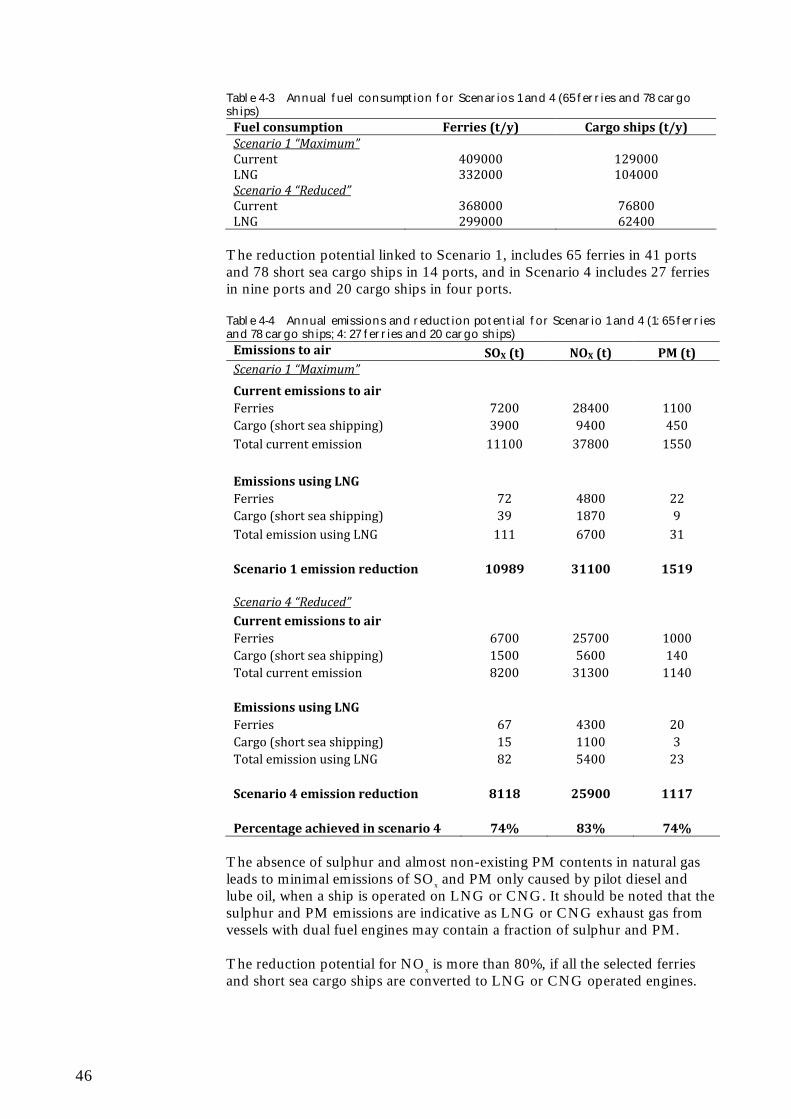
46
Table 4-3 Annual fuel consumption for Scenarios 1 and 4 (65 ferries and 78 cargo ships) Fuel consumption Ferries (t/y) Cargo ships (t/y) Scenario 1 “Maximum” Current 409000 129000 LNG 332000 104000 Scenario 4 “Reduced” Current 368000 76800 LNG 299000 62400
The reduction potential linked to Scenario 1, includes 65 ferries in 41 ports and 78 short sea cargo ships in 14 ports, and in Scenario 4 includes 27 ferries in nine ports and 20 cargo ships in four ports. Table 4-4 Annual emissions and reduction potential for Scenario 1 and 4 (1: 65 ferries and 78 cargo ships; 4: 27 ferries and 20 cargo ships) Emissions to air SOX (t) NOX (t) PM (t) Scenario 1 “Maximum” Current emissions to air Ferries 7200 28400 1100 Cargo (short sea shipping) 3900 9400 450 Total current emission 11100 37800 1550 Emissions using LNG Ferries 72 4800 22 Cargo (short sea shipping) 39 1870 9 Total emission using LNG 111 6700 31 Scenario 1 emission reduction 10989 31100 1519 Scenario 4 “Reduced” Current emissions to air Ferries 6700 25700 1000 Cargo (short sea shipping) 1500 5600 140 Total current emission 8200 31300 1140 Emissions using LNG Ferries 67 4300 20 Cargo (short sea shipping) 15 1100 3 Total emission using LNG 82 5400 23 Scenario 4 emission reduction 8118 25900 1117 Percentage achieved in scenario 4 74% 83% 74%
The absence of sulphur and almost non-existing PM contents in natural gas leads to minimal emissions of SOx and PM only caused by pilot diesel and lube oil, when a ship is operated on LNG or CNG. It should be noted that the sulphur and PM emissions are indicative as LNG or CNG exhaust gas from vessels with dual fuel engines may contain a fraction of sulphur and PM. The reduction potential for NOx is more than 80%, if all the selected ferries and short sea cargo ships are converted to LNG or CNG operated engines.
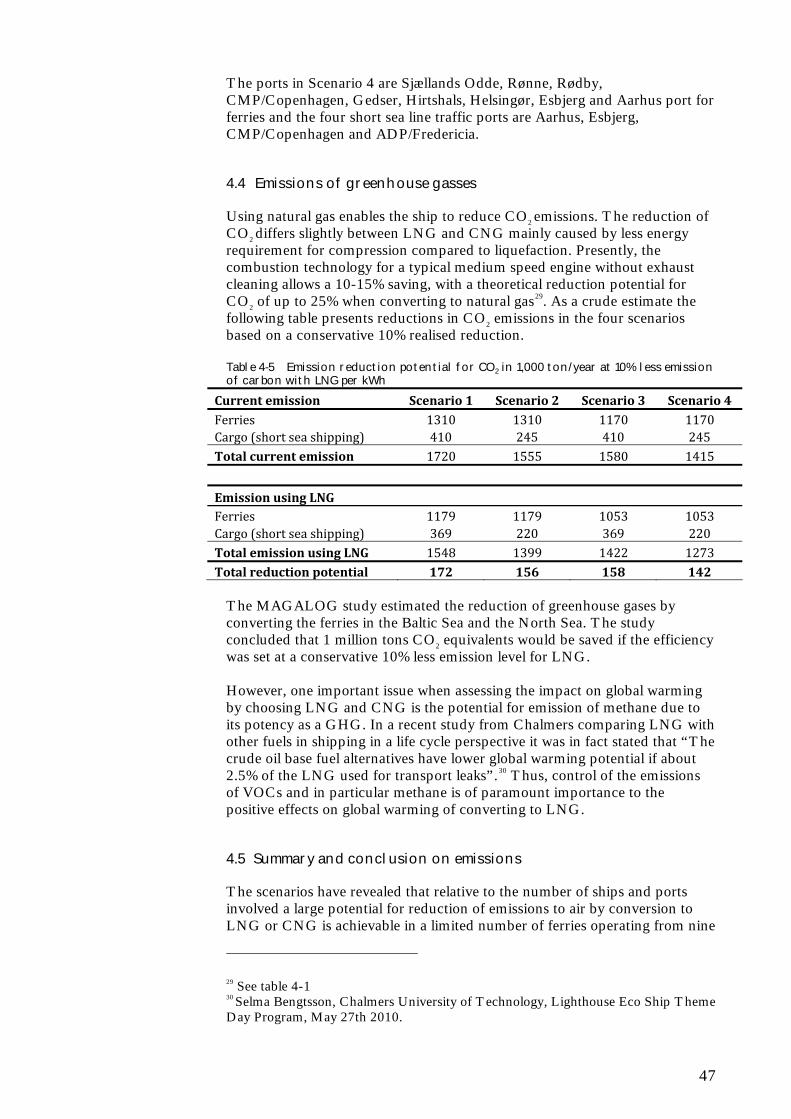
47
The ports in Scenario 4 are Sjællands Odde, Rønne, Rødby, CMP/Copenhagen, Gedser, Hirtshals, Helsingør, Esbjerg and Aarhus port for ferries and the four short sea line traffic ports are Aarhus, Esbjerg, CMP/Copenhagen and ADP/Fredericia.
4.4 Emissions of greenhouse gasses
Using natural gas enables the ship to reduce CO2 emissions. The reduction of CO2 differs slightly between LNG and CNG mainly caused by less energy requirement for compression compared to liquefaction. Presently, the combustion technology for a typical medium speed engine without exhaust cleaning allows a 10-15% saving, with a theoretical reduction potential for CO2 of up to 25% when converting to natural gas29. As a crude estimate the following table presents reductions in CO2 emissions in the four scenarios based on a conservative 10% realised reduction. Table 4-5 Emission reduction potential for CO2 in 1,000 ton/year at 10% less emission of carbon with LNG per kWh
Current emission Scenario 1 Scenario 2 Scenario 3 Scenario 4 Ferries 1310 1310 1170 1170 Cargo (short sea shipping) 410 245 410 245 Total current emission 1720 1555 1580 1415
Emission using LNG Ferries 1179 1179 1053 1053 Cargo (short sea shipping) 369 220 369 220 Total emission using LNG 1548 1399 1422 1273 Total reduction potential 172 156 158 142
The MAGALOG study estimated the reduction of greenhouse gases by converting the ferries in the Baltic Sea and the North Sea. The study concluded that 1 million tons CO2 equivalents would be saved if the efficiency was set at a conservative 10% less emission level for LNG. However, one important issue when assessing the impact on global warming by choosing LNG and CNG is the potential for emission of methane due to its potency as a GHG. In a recent study from Chalmers comparing LNG with other fuels in shipping in a life cycle perspective it was in fact stated that “The crude oil base fuel alternatives have lower global warming potential if about 2.5% of the LNG used for transport leaks”.30 Thus, control of the emissions of VOCs and in particular methane is of paramount importance to the positive effects on global warming of converting to LNG.
4.5 Summary and conclusion on emissions
The scenarios have revealed that relative to the number of ships and ports involved a large potential for reduction of emissions to air by conversion to LNG or CNG is achievable in a limited number of ferries operating from nine
29 See table 4-1 30 Selma Bengtsson, Chalmers University of Technology, Lighthouse Eco Ship Theme Day Program, May 27th 2010.
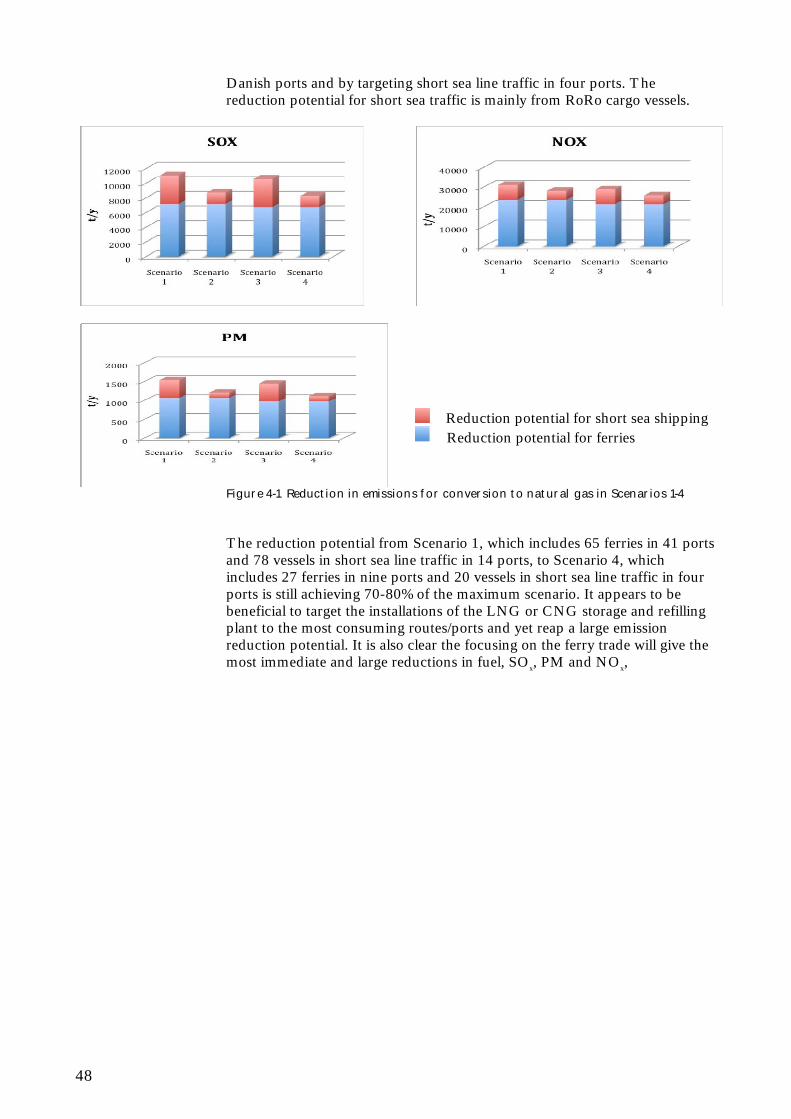
48
Danish ports and by targeting short sea line traffic in four ports. The reduction potential for short sea traffic is mainly from RoRo cargo vessels.
Reduction potential for short sea shipping Reduction potential for ferries
Figure 4-1 Reduction in emissions for conversion to natural gas in Scenarios 1-4 The reduction potential from Scenario 1, which includes 65 ferries in 41 ports and 78 vessels in short sea line traffic in 14 ports, to Scenario 4, which includes 27 ferries in nine ports and 20 vessels in short sea line traffic in four ports is still achieving 70-80% of the maximum scenario. It appears to be beneficial to target the installations of the LNG or CNG storage and refilling plant to the most consuming routes/ports and yet reap a large emission reduction potential. It is also clear the focusing on the ferry trade will give the most immediate and large reductions in fuel, SOx, PM and NOx,
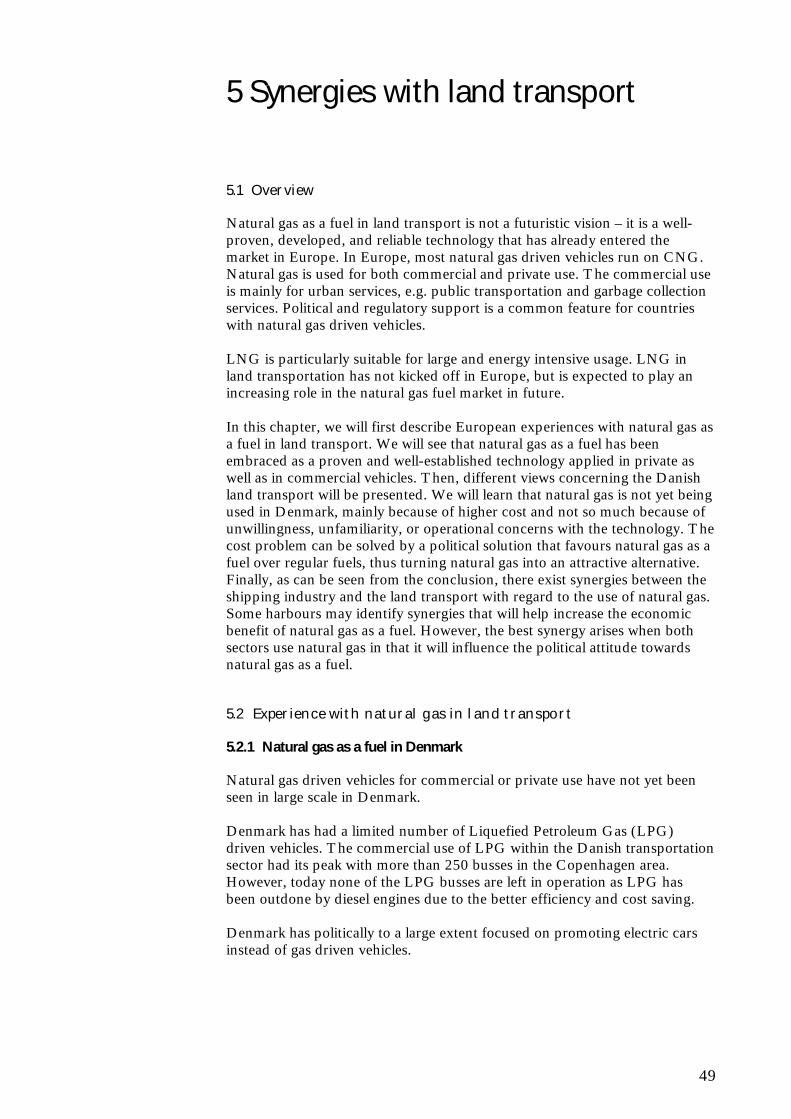
49
5 Synergies with land transport
5.1 Overview
Natural gas as a fuel in land transport is not a futuristic vision – it is a well-proven, developed, and reliable technology that has already entered the market in Europe. In Europe, most natural gas driven vehicles run on CNG. Natural gas is used for both commercial and private use. The commercial use is mainly for urban services, e.g. public transportation and garbage collection services. Political and regulatory support is a common feature for countries with natural gas driven vehicles. LNG is particularly suitable for large and energy intensive usage. LNG in land transportation has not kicked off in Europe, but is expected to play an increasing role in the natural gas fuel market in future. In this chapter, we will first describe European experiences with natural gas as a fuel in land transport. We will see that natural gas as a fuel has been embraced as a proven and well-established technology applied in private as well as in commercial vehicles. Then, different views concerning the Danish land transport will be presented. We will learn that natural gas is not yet being used in Denmark, mainly because of higher cost and not so much because of unwillingness, unfamiliarity, or operational concerns with the technology. The cost problem can be solved by a political solution that favours natural gas as a fuel over regular fuels, thus turning natural gas into an attractive alternative. Finally, as can be seen from the conclusion, there exist synergies between the shipping industry and the land transport with regard to the use of natural gas. Some harbours may identify synergies that will help increase the economic benefit of natural gas as a fuel. However, the best synergy arises when both sectors use natural gas in that it will influence the political attitude towards natural gas as a fuel.
5.2 Experience with natural gas in land transport 5.2.1 Natural gas as a fuel in Denmark
Natural gas driven vehicles for commercial or private use have not yet been seen in large scale in Denmark. Denmark has had a limited number of Liquefied Petroleum Gas (LPG) driven vehicles. The commercial use of LPG within the Danish transportation sector had its peak with more than 250 busses in the Copenhagen area. However, today none of the LPG busses are left in operation as LPG has been outdone by diesel engines due to the better efficiency and cost saving. Denmark has politically to a large extent focused on promoting electric cars instead of gas driven vehicles.
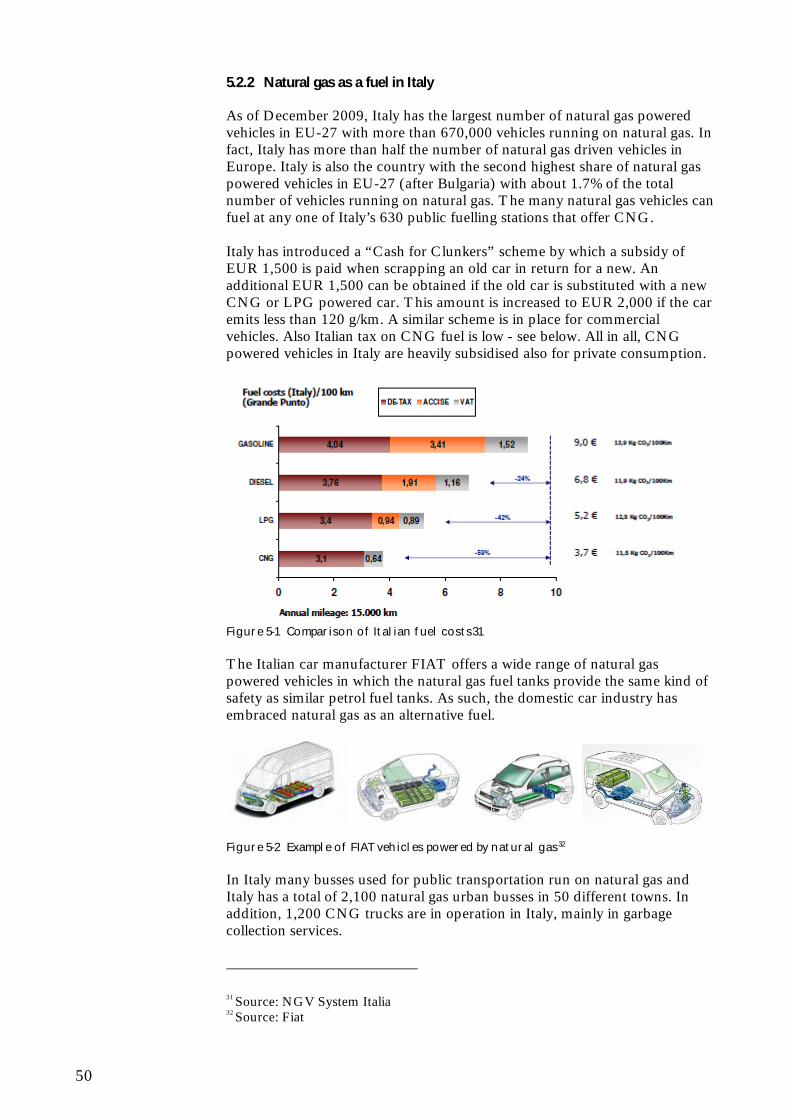
50
5.2.2 Natural gas as a fuel in Italy
As of December 2009, Italy has the largest number of natural gas powered vehicles in EU-27 with more than 670,000 vehicles running on natural gas. In fact, Italy has more than half the number of natural gas driven vehicles in Europe. Italy is also the country with the second highest share of natural gas powered vehicles in EU-27 (after Bulgaria) with about 1.7% of the total number of vehicles running on natural gas. The many natural gas vehicles can fuel at any one of Italy’s 630 public fuelling stations that offer CNG. Italy has introduced a “Cash for Clunkers” scheme by which a subsidy of EUR 1,500 is paid when scrapping an old car in return for a new. An additional EUR 1,500 can be obtained if the old car is substituted with a new CNG or LPG powered car. This amount is increased to EUR 2,000 if the car emits less than 120 g/km. A similar scheme is in place for commercial vehicles. Also Italian tax on CNG fuel is low - see below. All in all, CNG powered vehicles in Italy are heavily subsidised also for private consumption.
Figure 5-1 Comparison of Italian fuel costs31 The Italian car manufacturer FIAT offers a wide range of natural gas powered vehicles in which the natural gas fuel tanks provide the same kind of safety as similar petrol fuel tanks. As such, the domestic car industry has embraced natural gas as an alternative fuel.
Figure 5-2 Example of FIAT vehicles powered by natural gas32 In Italy many busses used for public transportation run on natural gas and Italy has a total of 2,100 natural gas urban busses in 50 different towns. In addition, 1,200 CNG trucks are in operation in Italy, mainly in garbage collection services. 31 Source: NGV System Italia 32 Source: Fiat
51
5.2.3 Natural gas as a fuel in Germany
In the course of few years, the number of natural gas powered vehicles in Germany has grown to 85,000. The development was sparked off by a rapid development of a fuelling station network with more than 800 fuel stations providing CNG. The growing number has also been a success due to the fact that the German authorities has promised to keep natural gas fuel at reduced tax up to 2018, thereby guaranteeing an economically beneficial alternative to traditional fuels. In addition hereto, also the local authorities have advocated for the promotion of natural gas fuelled vehicles, e.g. taxis and school busses. Germany has around 1,300 busses and 450 heavy duty trucks running on CNG, all operating in urban services. The German car manufacturing industry has responded to the increasing demand of natural gas fuelled vehicles by offering a variety of models with CNG-driven engines for both the passenger car segment and for light duty commercial vehicles. 5.2.4 Natural gas as a fuel in Sweden
With around 23,000 vehicles in Sweden being fuelled by natural gas, Sweden is among the countries with the most natural gas powered vehicles in Europe. However, the number of vehicles corresponds to only 0.5% of all vehicles in Sweden. Sweden’s development in this respect is remarkable, since the only natural gas transmission grid is located in the south-western part of Sweden stretching from Malmö to the northern part of Gothenburg. Consequently, trucks are used to distribute CNG to gas stations throughout the rest of Sweden to ensure the availability of natural gas. The Swedish development is to a large extent due to governmental support to local bio-gas facilities, combined with other incentives for those operating and owning a natural gas driven vehicle (e.g. free parking in many cities). There are today 850 busses and 400 heavy duty trucks on natural gas in Sweden. The public bus transportation system in Malmö and Helsingborg is operated by CNG driven busses.
5.3 Sector’s view on natural gas as fuel
The commercial land transport sector can broadly be divided into three categories i) hauling (trucks) ii) road person transport (busses) and iii) railways. Relevant market participants have been interviewed on the subject as outlined in Section 5.5. Below, a summary of each sector’s view and position on natural gas as a fuel is reflected. 5.3.1 Hauling
Availability of fuel is vital for any transport carrier or long haul company. A large distribution network of natural gas in all of Europe is therefore necessary in order to make it attractive for transport carrier companies to use natural gas powered trucks instead of diesel powered trucks. However, the infrastructure is not yet in place, so it will take some time before the natural gas powered trucks will have a dominant position.
52
However, there has recently been much activity in the area. For instance, Volvo Trucks have since 2007 developed natural gas driven trucks, ready for commercial release in 2011. The trucks are dual-fuel, such that they also can run on diesel, engaging the concern described above regarding the not fully developed natural gas network. The Transport Department of the Danish Chamber of Commerce (Dansk Erhverv), which is the professional association of transport carriers in Denmark, is generally positive towards natural gas as a fuel and sees it as a possible future fuel for their business. However, they stress that the competitiveness of Danish companies must not be negatively affected. 5.3.2 Road person transport
There are basically two types of bus transportation, public transport and chartered coaches. Companies operating charted coaches share the same inherent interest as the road cargo transport, namely that the infrastructure is in such a state that their busses can be fuelled whenever needed, regardless of where in Europe they find themselves. This is a major reason why coaches will not switch to natural gas – the infrastructure throughout Europe must be in place to support a system of natural gas driven busses. Public transportation is characterised by operating routes within limited geographic areas and gas facilities can thus easily be built on a city-by-city basis. As part of the contract negotiations between the transport authorities (i.e. the municipalities) and the companies that operate the bus routes, specific fuel requirements can be incorporated as part of the contract. Any additional costs in relation to the operation of natural gas busses should be carried by the transport authorities. Some bus operators have participated in tenders proposing to use natural gas as fuel, but have lost these tenders due to the extra cost. As the transport operators have included the extra cost of natural gas powered operations in their tenders, the decision lies with the transport authorities rather than with the operators. In general the operators consider CNG busses a mature technology and are interested in alternatives to the traditional fuels. Some Danish operators have gained experience from CNG powered operations in other countries, including Sweden. The operating cost of natural gas driven busses is higher than diesel powered busses. Examples of open tender procedures with options for both natural gas and diesel powered bus operations have resulted in a 10-20% higher price on natural gas operations (this price difference cannot be generalised into a systematic price difference). The transport authorities consider CNG busses operationally reliable and have expressed no reservations towards natural gas as a fuel. Transport operators and authorities share the belief that the tax structure on natural gas as fuel is essential in order to promote natural gas driven public bus transport.
53
5.3.3 Railways
There is little experience with natural gas in relation to railways. The International Union of Railways (UIC) has funded a project in which railway energy saving technologies are being analyzed. The study33 they have performed on natural gas is rated “interesting” and has a mid-term time horizon. Thus, the technology is not yet perceived fully developed, contrary to the technology for vehicles and ships. In the study, Deutsche Bahn indicates four necessary success criteria for a wide-spread introduction for natural gas propulsion:
Availability of natural gas engines in higher power range for locomotives as well as for under-floor integration
Further development of gas engine technology to improve efficiency at low load
Reduction of higher costs of gas technology compared to diesel technology
Development of supply infrastructure Low price for natural gas and long-term calculability (taxation)
In Denmark, security issues regarding the railway tunnel between Zealand and Sprogø pose particular concern with regard to trains with natural gas propulsion. Hence, natural gas in relation to railways is not yet under consideration and remains currently on an exploratory stage. 5.3.4 Manufactures
Various models of both natural gas driven busses and trucks are already available. However, the price of a natural gas driven bus is relatively high. For instance, the list price of a city bus like the MAN Lions City A21 (low floor) is approximately DKK 1,800,000 (242,000 EUR) for the diesel version as opposed to DKK 2,100,000 (282,000 EUR) for the gas version equipped with the in Denmark required light weight tanks. Diesel and gas engines have very similar levels of particles; the main benefit of gas busses is therefore the reduction in CO2 emissions. The main obstacle for a serious introduction of natural gas as a fuel is the Danish taxes.. Also the current Danish regulation on axle weight does not allow for gas (and hybrid) busses. Danish regulations differ from other European countries, but the regulations are expected to be changed soon in connection with the impending introduction of hybrid busses.
33 The conclusions of the study can be found here: http://www.railway-energy.org/
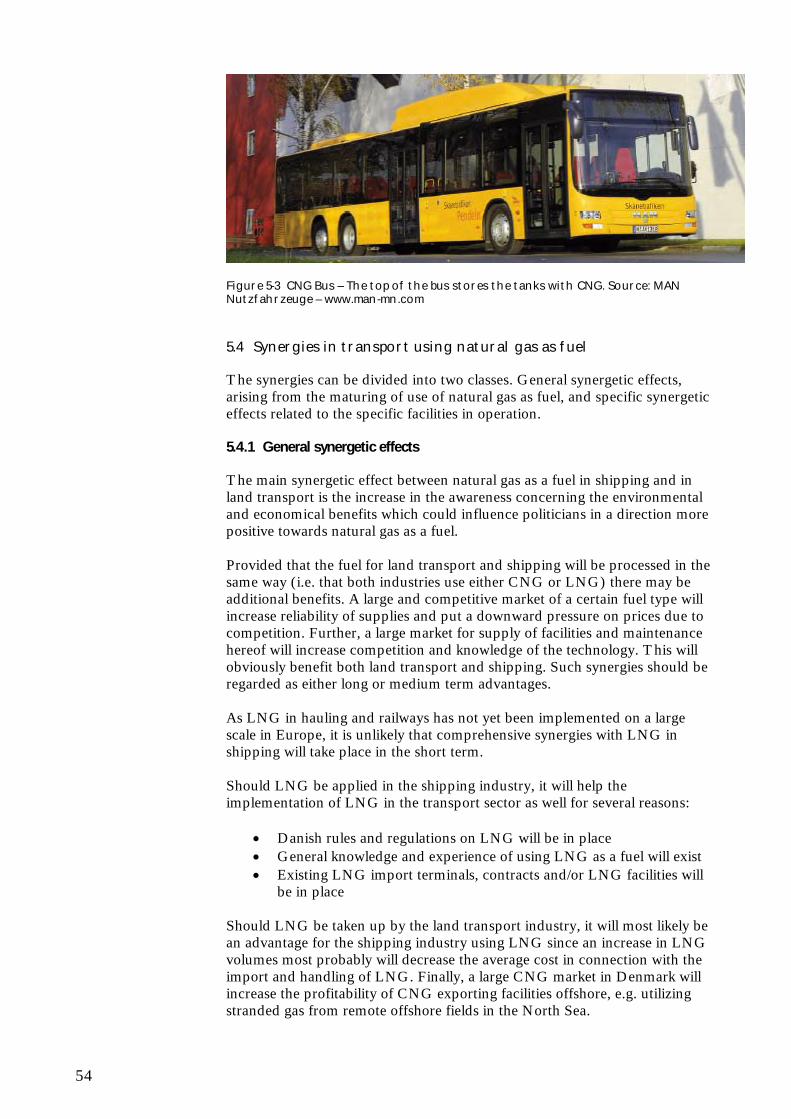
54
Figure 5-3 CNG Bus – The top of the bus stores the tanks with CNG. Source: MAN Nutzfahrzeuge – www.man-mn.com
5.4 Synergies in transport using natural gas as fuel
The synergies can be divided into two classes. General synergetic effects, arising from the maturing of use of natural gas as fuel, and specific synergetic effects related to the specific facilities in operation. 5.4.1 General synergetic effects
The main synergetic effect between natural gas as a fuel in shipping and in land transport is the increase in the awareness concerning the environmental and economical benefits which could influence politicians in a direction more positive towards natural gas as a fuel. Provided that the fuel for land transport and shipping will be processed in the same way (i.e. that both industries use either CNG or LNG) there may be additional benefits. A large and competitive market of a certain fuel type will increase reliability of supplies and put a downward pressure on prices due to competition. Further, a large market for supply of facilities and maintenance hereof will increase competition and knowledge of the technology. This will obviously benefit both land transport and shipping. Such synergies should be regarded as either long or medium term advantages. As LNG in hauling and railways has not yet been implemented on a large scale in Europe, it is unlikely that comprehensive synergies with LNG in shipping will take place in the short term. Should LNG be applied in the shipping industry, it will help the implementation of LNG in the transport sector as well for several reasons:
Danish rules and regulations on LNG will be in place General knowledge and experience of using LNG as a fuel will exist Existing LNG import terminals, contracts and/or LNG facilities will
be in place Should LNG be taken up by the land transport industry, it will most likely be an advantage for the shipping industry using LNG since an increase in LNG volumes most probably will decrease the average cost in connection with the import and handling of LNG. Finally, a large CNG market in Denmark will increase the profitability of CNG exporting facilities offshore, e.g. utilizing stranded gas from remote offshore fields in the North Sea.
55
5.4.2 Specific synergetic effects
When establishing a CNG or LNG facility, all possible synergetic effects should be sought. Often with these facilities, the economics of scale are such that the average unit price decreases significantly as the volume handled increases. Thus, facilities running at a high capacity will generally have lower per-unit cost. The sharing of an LNG or CNG facility between land and sea transport is therefore favourable. However, the economic net benefits of a shared facility will depend on a number of conditions and must be evaluated on a case-by-case basis. For instance, harbours with no access to the natural gas distribution network will find cooperation with a LNG facility more attractive than harbours connected to the existing distribution system. Since CNG can easily be installed locally, it will not necessarily be advantageous to have one CNG facility supplying both land transport and marine. However, in certain areas where harbour and land transport terminals are located close to each other, operational synergetic benefits may be present. Special attention is drawn to LCNG-facilities, which receives LNG and processes it to CNG. As such, a LNG receiving facility can support CNG fuelling stations in the surroundings, since LNG can be transported to these facilities by truck. Moreover, such a facility can support the use of both CNG and LNG in land transport, as recently seen with the opening of a combined LNG and CNG road station in Abrera, Spain. A promising example of a project seeking to exploit the synergetic effects of a LNG facility is found at Molslinien, which is considering changing to LNG use on their high speed ferries and are working with the bus company Abildskou Busses to share their planned LNG project, such that Abildskou can use the LNG facility at the harbour to fuel a natural gas driven coach. Although technical synergies can be identified, the economic viability behind them should always be carefully addressed. As natural gas as propulsion has not matured in all sectors yet, many synergetic effects remain on the speculative state today.
5.5 Contributing parties
Conclusions throughout this chapter are based on Ramboll’s existing knowledge in combination with interviews of and information from the following market participants: Movia Transport authority
Arriva Transport operator (Denmark and Sweden) City Trafik Transport operator DSB Railway operator
MAN Nutzfahrzeuge Producer of trucks and busses equipped with hybrid, natural gas, or regular diesel engines
Volvo Truck Producer of trucks and busses, natural gas/dual-fuel and regular diesel engines
Danish Chamber of Commerce
Transport Department. Professional association of transport carriers
Danske Busvognmænd Professional association of bus carriers. Abildskou Busser Bus operator
56
In addition, information and data from Natural Gas Vehicle Association Europe (NGVA Europe) has been applied http://www.ngvaeurope.eu/. Further, input from discussions at the workshop “Morgendagens Brændstoffer”, organised by Cleaner Shipping Partnership and the Transport Innovation Network on 31 May 2010, has been included.
5.6 Summary of synergies
Natural gas is a reliable fuel for both private and commercial vehicles and builds on a proven technology already implemented in many European countries. In other European cities natural gas powered vehicles for urban services, e.g. public transport and garbage collecting services, have proven successful. However, this success has been the result of a political will to support the use of natural gas fuel with subsidies or reduced tax. It is a commonly shared belief that lower taxes on natural gas are important for a successful implementation of natural gas driven vehicles in land transport. There are technical synergies related to the facilities with LNG and CNG, yet the economic importance of them must be evaluated on a case-by-case basis. The main synergies between the two transport sectors take place on the political level where natural gas as a fuel could obtain better conditions if both sectors use the fuel. However, there could be significant operational synergies when using LNG in both shipping and land transport depending on the specific harbour in question.
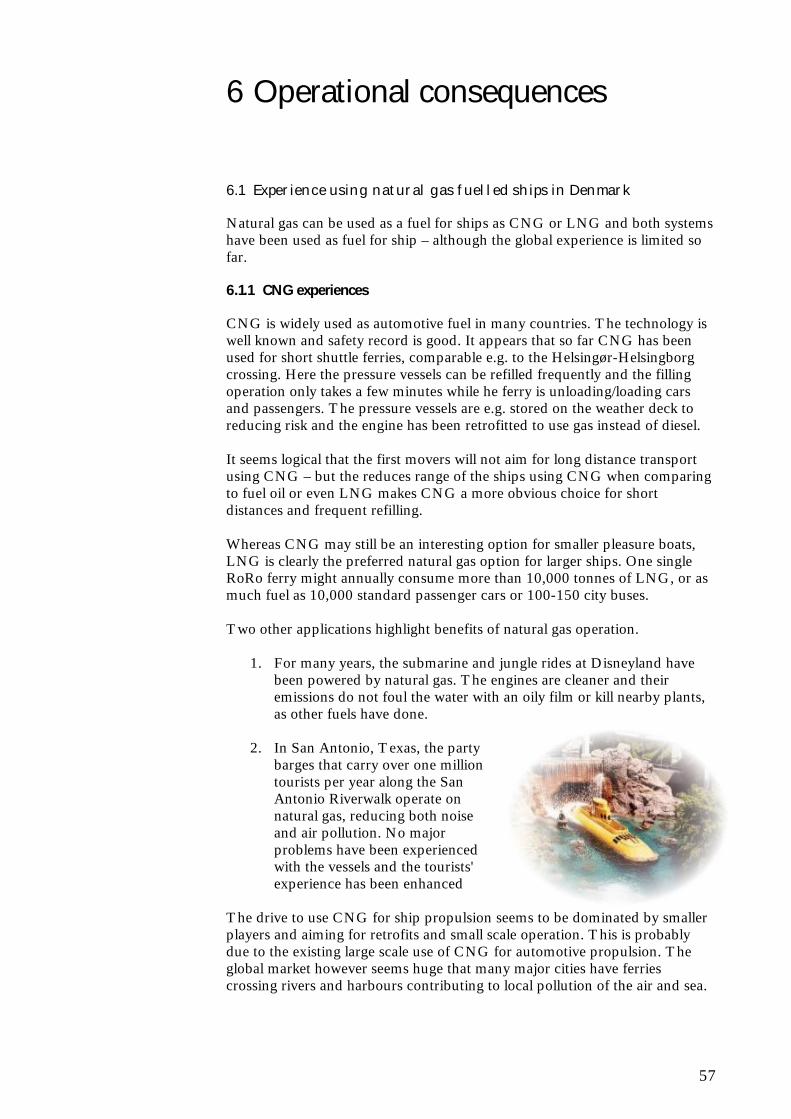
57
6 Operational consequences
6.1 Experience using natural gas fuelled ships in Denmark
Natural gas can be used as a fuel for ships as CNG or LNG and both systems have been used as fuel for ship – although the global experience is limited so far. 6.1.1 CNG experiences
CNG is widely used as automotive fuel in many countries. The technology is well known and safety record is good. It appears that so far CNG has been used for short shuttle ferries, comparable e.g. to the Helsingør-Helsingborg crossing. Here the pressure vessels can be refilled frequently and the filling operation only takes a few minutes while he ferry is unloading/loading cars and passengers. The pressure vessels are e.g. stored on the weather deck to reducing risk and the engine has been retrofitted to use gas instead of diesel. It seems logical that the first movers will not aim for long distance transport using CNG – but the reduces range of the ships using CNG when comparing to fuel oil or even LNG makes CNG a more obvious choice for short distances and frequent refilling. Whereas CNG may still be an interesting option for smaller pleasure boats, LNG is clearly the preferred natural gas option for larger ships. One single RoRo ferry might annually consume more than 10,000 tonnes of LNG, or as much fuel as 10,000 standard passenger cars or 100-150 city buses. Two other applications highlight benefits of natural gas operation.
1. For many years, the submarine and jungle rides at Disneyland have been powered by natural gas. The engines are cleaner and their emissions do not foul the water with an oily film or kill nearby plants, as other fuels have done.
2. In San Antonio, Texas, the party barges that carry over one million tourists per year along the San Antonio Riverwalk operate on natural gas, reducing both noise and air pollution. No major problems have been experienced with the vessels and the tourists' experience has been enhanced
The drive to use CNG for ship propulsion seems to be dominated by smaller players and aiming for retrofits and small scale operation. This is probably due to the existing large scale use of CNG for automotive propulsion. The global market however seems huge that many major cities have ferries crossing rivers and harbours contributing to local pollution of the air and sea.
58
6.1.2 LNG experiences
LNG carriers have used the boil off gas as fuel since the first ship was put into operation in 1964. Numerous LNG carriers have long and good experiences with natural gas as fuel for the propulsion machinery, mainly steam turbines. Only one country has been identified as currently using LNG as bunker fuel: Norway. Norway has a total of eight ports where LNG bunkering takes place and approximately 20 ships have been identified. However, many more countries seem eager to use LNG (and CNG) as alternative ships fuel. A demonstration project is expected to start operation of a LNG fuelled riverboat at the Yangtze River this year.
6.2 Regulator and legislation
In Denmark, the Maritime Authority (Søfartssyrelsen) has the responsibility for the shipping industry and framework conditions, the ship and its crew. In other words, the Danish Maritime Authority is responsible for the following:
The construction, equipment and operation of Danish ships (including safety, prevention of terrorism, safety of navigation, manning, occupational health and environmental protection) as well as port state control of foreign ships calling at Danish ports;
Ship registration; The training, education, employment, health and social conditions of
seafarers; Shipping policy, maritime law as well as national and international
industrial policy. Harbours are regulated by the Ministry of Transportation (Transportministeriet) c.f. “Lov om havne”. The construction of a LNG or CNG bunkering facilities will be governed by the relevant legislation (love og bekendtgørelser) e.g. Trykbeholderdirektivet (PED), ATEX, gasreglementet etc. and Dansih, European and international norms and standard e.g. ISO 28460 LNG – ship to shore interface”, ISO 1532 “Installation and equipment for liquefied natural gas - ship to shore interface”, In Norway, the introduction of LNG powered ships has lead to an adaptation of the regulations set by the Norwegian Maritime Directorate (MD) in 2000. The main requirements for gas-fuelled ships are summarised below:
Generally by design reduce the risk of explosion; limiting area of gas in place, small engine rooms.
Redundancy of fuel storage, power generation, transmission and propellers.
Separation of engines in at least two engine rooms, separation of fuel supply.
Double piping of all gas pipes inside the ship. If a fire or explosion should occur, the result should not harm the ship
or endanger passenger’s life. And the ship should still be able to manoeuvre and get safely to port.
59
Detection of gas leakage in all areas where gas in place. Alarms of 20% Lower Explosion Limit (LEL), automatic shut down at 60% LEL based on voting 2 out of 3.
The International Code for the Construction and Equipment of Ships Carrying Liquefied Gases in Bulk (IGC) will not be suitable related safety for other kind of ships than gas freighters. Some of the classification societies, however, have worked out requirements for the use of gas as fuel in ships based on this code. For instance, the Norwegian classification society, DNV, Rules for Classification of ships, has launched the rule proposal “Gas Fuelled Engine Installation” (DNV 1994). This means that in near future there will be classification rules to which you can design a gas-fuelled ship. IMO has initiated work on developing provisions for gas-fuelled ships, following a Norwegian proposal. Draft Interim Guidelines covering gas-fuelled ships are in a process of continued work and review by the Subcommittee on Bulk Liquids and Gases (BLG). Intent of issuing such interim guidelines in 2009 has been expressed. The IMO (www.imo.org), part of the United Nations system, provides the main organisational framework for addressing issues of air emissions from global shipping. The main legal framework for the purpose is the MARPOL (international convention for the prevention of pollution from ships), including its six annexes, which address different kinds of pollution from ships. Annex VI of MARPOL concerns air emissions, and a revision has recently been adopted (October 2008) by IMO’s Maritime Environment Protection Committee, which comprise representatives of some 100 national governments. Though making no specific references to LNG, the changes can have important implications for the use of LNG in ships by setting requirements that can be met with LNG. The MARPOL Annex VI revisions are designed to bring significant reductions in emissions from ships of sulphur oxides, nitrogen oxides and particulates, taking effect in steps between 2010 and 2020.
6.3 Vessel safety
In its liquid form LNG is neither explosive, corrosive, nor toxic and CNG cannot “exist” in open air conditions. Natural gas is on the other hand both flammable and explosive and three factors should be observed:
1. LNG and CNG is cold when released (CNG due to large Joule Thompson cooling) and can thus have a higher density than air
2. Natural gas will only ignite at a temperature above 600°C 3. Natural gas will only ignite when mixed with air in the ration between
1:20-3:20 (5%-15%) While the first factor increases risk for gas being trapped, the two other factors shows that natural gas is actually not that easy to ignite and that good design can overcome many risk factors. Indeed, existing CNG installation often uses CNG storage in open areas e.g. on the weather deck, since this reduces risk of ever having a flammable mixture of gas and air. This approach may, however, only be practical for smaller storage volumes e.g. for ferries, pleasure cruise
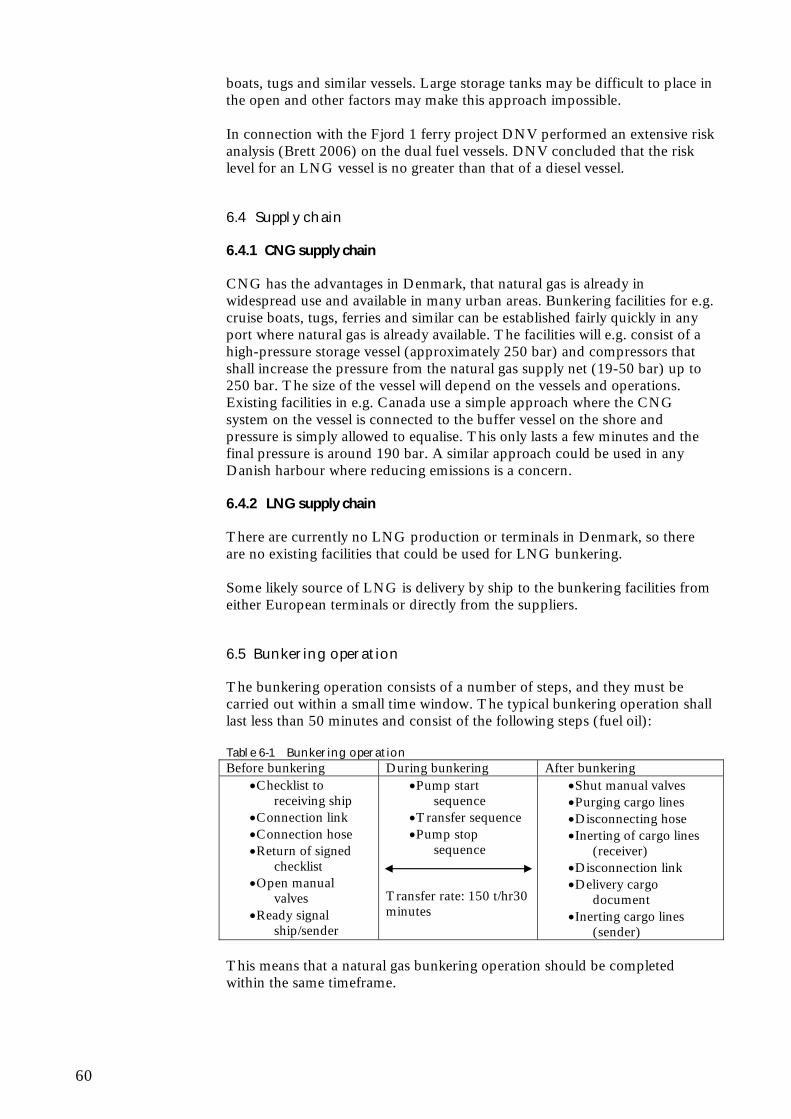
60
boats, tugs and similar vessels. Large storage tanks may be difficult to place in the open and other factors may make this approach impossible. In connection with the Fjord 1 ferry project DNV performed an extensive risk analysis (Brett 2006) on the dual fuel vessels. DNV concluded that the risk level for an LNG vessel is no greater than that of a diesel vessel.
6.4 Supply chain 6.4.1 CNG supply chain
CNG has the advantages in Denmark, that natural gas is already in widespread use and available in many urban areas. Bunkering facilities for e.g. cruise boats, tugs, ferries and similar can be established fairly quickly in any port where natural gas is already available. The facilities will e.g. consist of a high-pressure storage vessel (approximately 250 bar) and compressors that shall increase the pressure from the natural gas supply net (19-50 bar) up to 250 bar. The size of the vessel will depend on the vessels and operations. Existing facilities in e.g. Canada use a simple approach where the CNG system on the vessel is connected to the buffer vessel on the shore and pressure is simply allowed to equalise. This only lasts a few minutes and the final pressure is around 190 bar. A similar approach could be used in any Danish harbour where reducing emissions is a concern. 6.4.2 LNG supply chain
There are currently no LNG production or terminals in Denmark, so there are no existing facilities that could be used for LNG bunkering. Some likely source of LNG is delivery by ship to the bunkering facilities from either European terminals or directly from the suppliers.
6.5 Bunkering operation
The bunkering operation consists of a number of steps, and they must be carried out within a small time window. The typical bunkering operation shall last less than 50 minutes and consist of the following steps (fuel oil): Table 6-1 Bunkering operation Before bunkering During bunkering After bunkering
Checklist to receiving ship
Connection link Connection hose Return of signed
checklist Open manual
valves Ready signal
ship/sender
Pump start sequence
Transfer sequence Pump stop
sequence Transfer rate: 150 t/hr30 minutes
Shut manual valves Purging cargo lines Disconnecting hose Inerting of cargo lines
(receiver) Disconnection link Delivery cargo
document Inerting cargo lines
(sender) This means that a natural gas bunkering operation should be completed within the same timeframe.
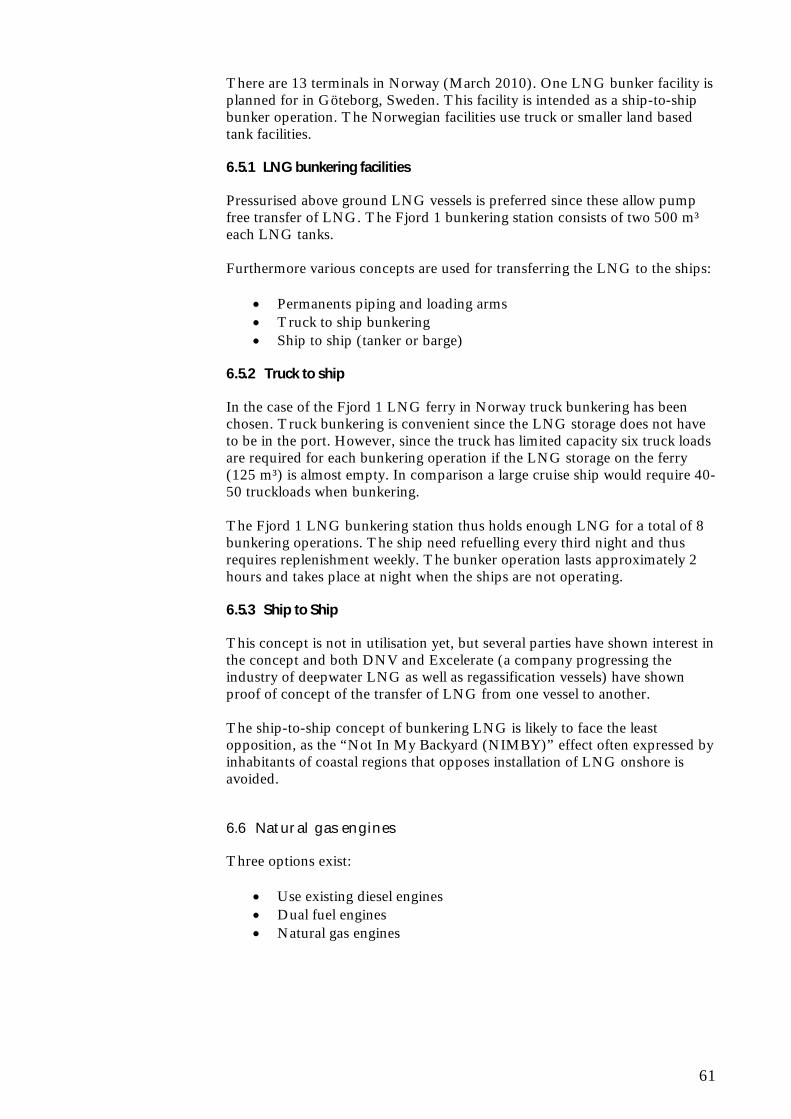
61
There are 13 terminals in Norway (March 2010). One LNG bunker facility is planned for in Göteborg, Sweden. This facility is intended as a ship-to-ship bunker operation. The Norwegian facilities use truck or smaller land based tank facilities. 6.5.1 LNG bunkering facilities
Pressurised above ground LNG vessels is preferred since these allow pump free transfer of LNG. The Fjord 1 bunkering station consists of two 500 m³ each LNG tanks. Furthermore various concepts are used for transferring the LNG to the ships:
Permanents piping and loading arms Truck to ship bunkering Ship to ship (tanker or barge)
6.5.2 Truck to ship
In the case of the Fjord 1 LNG ferry in Norway truck bunkering has been chosen. Truck bunkering is convenient since the LNG storage does not have to be in the port. However, since the truck has limited capacity six truck loads are required for each bunkering operation if the LNG storage on the ferry (125 m³) is almost empty. In comparison a large cruise ship would require 40-50 truckloads when bunkering. The Fjord 1 LNG bunkering station thus holds enough LNG for a total of 8 bunkering operations. The ship need refuelling every third night and thus requires replenishment weekly. The bunker operation lasts approximately 2 hours and takes place at night when the ships are not operating. 6.5.3 Ship to Ship
This concept is not in utilisation yet, but several parties have shown interest in the concept and both DNV and Excelerate (a company progressing the industry of deepwater LNG as well as regassification vessels) have shown proof of concept of the transfer of LNG from one vessel to another. The ship-to-ship concept of bunkering LNG is likely to face the least opposition, as the “Not In My Backyard (NIMBY)” effect often expressed by inhabitants of coastal regions that opposes installation of LNG onshore is avoided.
6.6 Natural gas engines
Three options exist:
Use existing diesel engines Dual fuel engines Natural gas engines
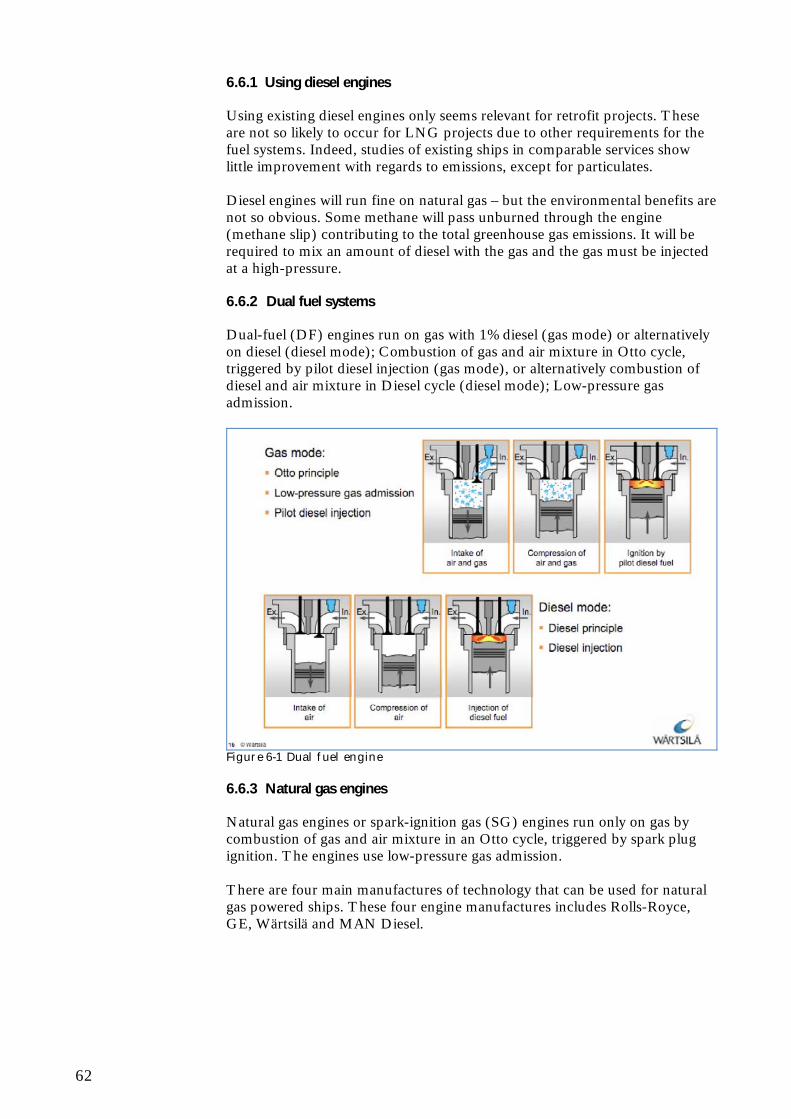
62
6.6.1 Using diesel engines
Using existing diesel engines only seems relevant for retrofit projects. These are not so likely to occur for LNG projects due to other requirements for the fuel systems. Indeed, studies of existing ships in comparable services show little improvement with regards to emissions, except for particulates. Diesel engines will run fine on natural gas – but the environmental benefits are not so obvious. Some methane will pass unburned through the engine (methane slip) contributing to the total greenhouse gas emissions. It will be required to mix an amount of diesel with the gas and the gas must be injected at a high-pressure. 6.6.2 Dual fuel systems
Dual-fuel (DF) engines run on gas with 1% diesel (gas mode) or alternatively on diesel (diesel mode); Combustion of gas and air mixture in Otto cycle, triggered by pilot diesel injection (gas mode), or alternatively combustion of diesel and air mixture in Diesel cycle (diesel mode); Low-pressure gas admission.
Figure 6-1 Dual fuel engine 6.6.3 Natural gas engines
Natural gas engines or spark-ignition gas (SG) engines run only on gas by combustion of gas and air mixture in an Otto cycle, triggered by spark plug ignition. The engines use low-pressure gas admission. There are four main manufactures of technology that can be used for natural gas powered ships. These four engine manufactures includes Rolls-Royce, GE, Wärtsilä and MAN Diesel.
63
6.6.4 Summary of experiences
Using LNG and CNG for bunkering operations is not common in a global perspective – but the practice seems on the edge of catching on. Currently two issues seem to block further developments:
1. First movers dilemma 2. International regulation
Both CNG and LNG should be considered for Danish harbors, but the two storage principles seem to favor different segments of shipping. CNG seems suited for a quick launch targeting smaller operations in Danish waters, e.g. minor ferries, tugs, cruise boats (e.g. excursion boats) and similar, where natural gas is readily available from the grid. LNG would also be suited for the operations that CNG seems suited for, but LNG would in addition be suited for larger ships with a further action range. However, this requires that the ships are either suited for dual fuel or that bunkering is also possible in destination ports. The technology is well known and experience using natural gas as ships fuel and CNG or LNG as storage also have reference projects.

64
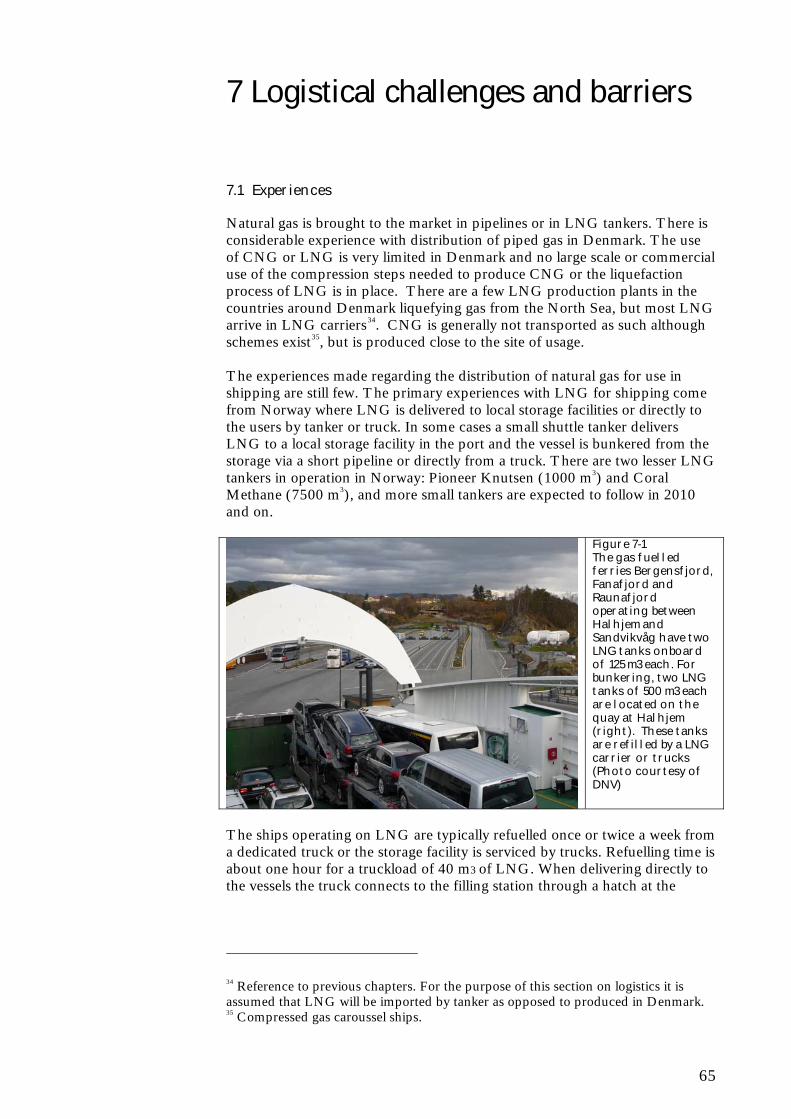
65
7 Logistical challenges and barriers
7.1 Experiences
Natural gas is brought to the market in pipelines or in LNG tankers. There is considerable experience with distribution of piped gas in Denmark. The use of CNG or LNG is very limited in Denmark and no large scale or commercial use of the compression steps needed to produce CNG or the liquefaction process of LNG is in place. There are a few LNG production plants in the countries around Denmark liquefying gas from the North Sea, but most LNG arrive in LNG carriers34. CNG is generally not transported as such although schemes exist35, but is produced close to the site of usage. The experiences made regarding the distribution of natural gas for use in shipping are still few. The primary experiences with LNG for shipping come from Norway where LNG is delivered to local storage facilities or directly to the users by tanker or truck. In some cases a small shuttle tanker delivers LNG to a local storage facility in the port and the vessel is bunkered from the storage via a short pipeline or directly from a truck. There are two lesser LNG tankers in operation in Norway: Pioneer Knutsen (1000 m3) and Coral Methane (7500 m3), and more small tankers are expected to follow in 2010 and on.
Figure 7-1 The gas fuelled ferries Bergensfjord, Fanafjord and Raunafjord operating between Halhjem and Sandvikvåg have two LNG tanks onboard of 125 m3 each. For bunkering, two LNG tanks of 500 m3 each are located on the quay at Halhjem (right). These tanks are refilled by a LNG carrier or trucks (Photo courtesy of DNV)
The ships operating on LNG are typically refuelled once or twice a week from a dedicated truck or the storage facility is serviced by trucks. Refuelling time is about one hour for a truckload of 40 m3 of LNG. When delivering directly to the vessels the truck connects to the filling station through a hatch at the
34 Reference to previous chapters. For the purpose of this section on logistics it is assumed that LNG will be imported by tanker as opposed to produced in Denmark. 35 Compressed gas caroussel ships.
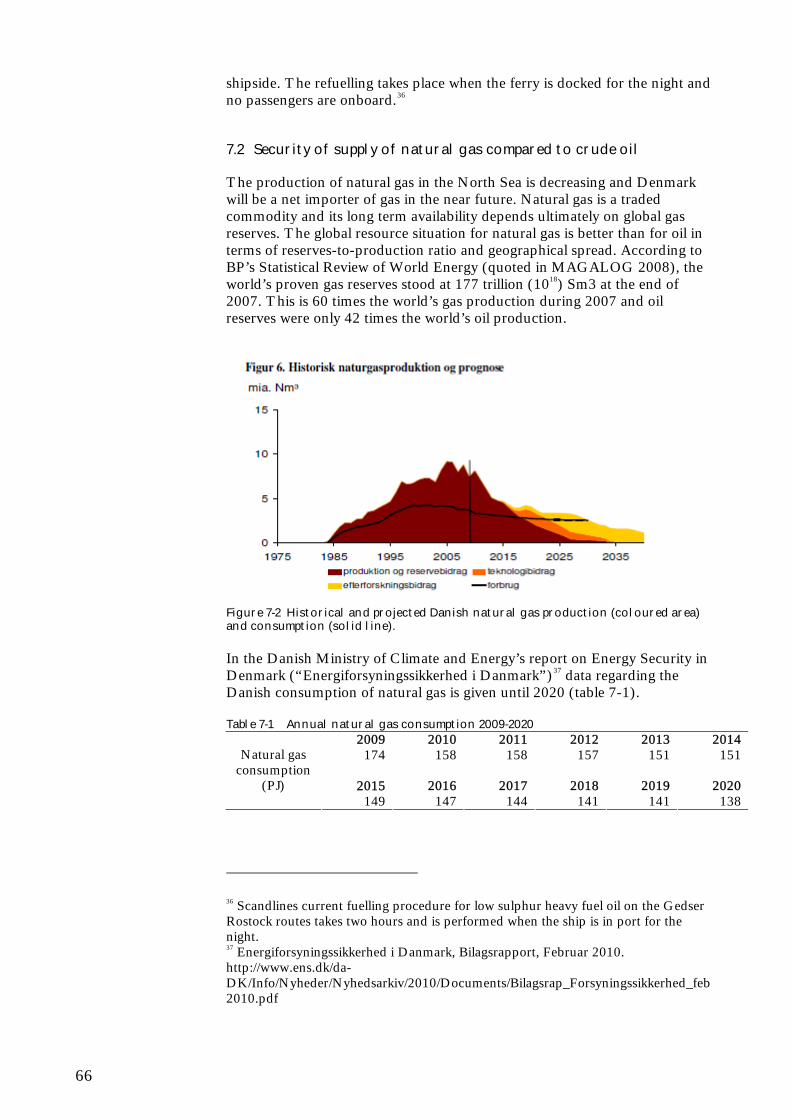
66
shipside. The refuelling takes place when the ferry is docked for the night and no passengers are onboard.36
7.2 Security of supply of natural gas compared to crude oil
The production of natural gas in the North Sea is decreasing and Denmark will be a net importer of gas in the near future. Natural gas is a traded commodity and its long term availability depends ultimately on global gas reserves. The global resource situation for natural gas is better than for oil in terms of reserves-to-production ratio and geographical spread. According to BP’s Statistical Review of World Energy (quoted in MAGALOG 2008), the world’s proven gas reserves stood at 177 trillion (1018) Sm3 at the end of 2007. This is 60 times the world’s gas production during 2007 and oil reserves were only 42 times the world’s oil production.
Figure 7-2 Historical and projected Danish natural gas production (coloured area) and consumption (solid line). In the Danish Ministry of Climate and Energy’s report on Energy Security in Denmark (“Energiforsyningssikkerhed i Danmark”)37 data regarding the Danish consumption of natural gas is given until 2020 (table 7-1). Table 7-1 Annual natural gas consumption 2009-2020
2009 2010 2011 2012 2013 2014174 158 158 157 151 151
2015 2016 2017 2018 2019 2020
Natural gas consumption
(PJ) 149 147 144 141 141 138
36 Scandlines current fuelling procedure for low sulphur heavy fuel oil on the Gedser Rostock routes takes two hours and is performed when the ship is in port for the night. 37 Energiforsyningssikkerhed i Danmark, Bilagsrapport, Februar 2010. http://www.ens.dk/da-DK/Info/Nyheder/Nyhedsarkiv/2010/Documents/Bilagsrap_Forsyningssikkerhed_feb2010.pdf
67
The use of natural gas as a fuel in shipping would comprise a significant part of the total consumption of natural gas in Denmark. The roughly 400.000 t natural gas (equal to 22 PJ) consumed annually by shipping in our scenarios would correspond to approximately 15% of the annual total natural gas consumption in Denmark. However, this would only apply in the hypothetical situation where Denmark chooses to produce LNG or CNG bunker fuel from piped natural gas. Contracts on supply via the Nordstream pipeline and other sources are already in effect and the security of supply of natural gas to Danish consumers appears not to be challenged by adding ships fuel consumption. Also, the import of LNG to Europe is more than 55 billion cubic meters annually corresponding to 40 million tonnes LNG and the Danish consumption in shipping would amount to approx. 1%.
7.3 Information on risks associated with LNG and CNG
This section applies a general approach to the evaluation of the risks associated with LNG/CNG installations and the specific issues related to the use of natural gas for maritime vessels (based on the Ramboll Oil and Gas memo in Appendix 4). Natural gas activities will always have the potential of causing accidents as the gas is flammable under certain conditions. The (technical) objective definition of a risk is: Risk = severity of impact x frequency of event occurring An individual’s perception of risk is a subjective interpretation and will depend on various social elements, the level of information/knowledge, previous experience, necessity of the application, external inputs, etc. which is not covered here. However, it is generally accepted that risk aversion increases exponentially with the scale of potential accidents. Since accidents with natural gas on rare occasions may have large scale effects an information campaign may be warranted. Risk is considered in terms of individual risk and societal risk.
The individual risk (IR) is the likelihood of fatal incidents that a specific person will experience within a given time period (normally per year).
The societal risk is the collective risk that a given installation imposes on persons/groups and surroundings expressed as the frequency of fatalities compared with the scale of the incident subject to the risk aversion concept.
Whenever an activity has associated risks the decision-maker is to compare these risks with the benefit of the activity through the use of risk acceptance criteria, e.g. cost-benefit analyses or industry common practice levels for individual risk and societal risk, and demonstrate that the risk is as low as reasonably practicable (ALARP). The ALARP principle is often closely related to cost-benefit analyses and favours that inexpensive risk reducing measures (“low hanging fruits”) are implemented even though the risk acceptance criteria is already met.
68
7.3.1 Risk assessment
From a risk perspective LNG and CNG as well as the respective installations required are of similar nature. The installations considered at Danish harbours may be categorised as simpler installations as they are not to be production plants. Natural gas is a fuel and a combustible substance. To ensure safe and reliable operation, particular measures are taken in the design, construction, installation, commissioning and operation of LNG/CNG facilities. In high concentrations (and liquid state for LNG) natural gas is not explosive and cannot burn. For natural gas to burn, it must first mix with air in the proper proportions (the flammable range is 5% to 15%) and then be ignited. If the mixture is within the flammable range, there is risk of ignition, which would create fire, explosion and thermal radiation hazards. The design, construction, installation, commissioning and operation of LNG/CNG facilities are all subject to risk assessments according to the regulation. Various topics are to be considered in these assessments, hereunder:
Risks originating from the storage facility (LNG vs. CNG) Risks related to supply (ship vs. pipeline) Risks associated to fuelling activities Risks associated to external impact on the storage facility Risks related to collision involving LNG/CNG fuelled vessels
The appendix includes a description of the consequences for fire, explosion, software and procedural risks, which are inherent generic risks in the following. 7.3.1.1 Risks originating from the storage facility The main consequences related to health and safety risks at natural gas installations are fire and explosion38. Fires will be of similar nature (jet fire or flash fire) as the composition of LNG and CNG is identical and the magnitude of a fire related more to the size of the storage facility. The chemical explosions are similar for LNG and CNG. The physical explosions are different from a technical point of view (compressed gas expansion vs. rapid phase transition) but the resulting expansion pressure is expected to be of similar nature. The utility systems of both LNG and CNG are similar to those of other natural gas installations and are not considered to impose extraordinary risks. 7.3.1.2 Risks related to supply activities The main risks related to supply are:
38 Environmental risks are not covered here.
69
Rupture of pressurised systems (CNG pipeline from gas distribution
net, pumping from LNG supply vessel, releases at flanges etc.) due to the same causes as mentioned above
Ship collision (LNG option) due to increased ship traffic. For the risk associated to the increased ship traffic it is not considered to be significant as the supply of LNG will be rare compared to the overall ship traffic in the respective harbours. 7.3.1.3 Risks associated to fuelling activities The risks associated to the fuelling activities are of similar nature as the description for storage facilities. Although the risk is considered to be slightly higher than that of conventional vessels due to the potential ignition in case of rupture it is not assessed to have a significant impact on the overall risk picture. The number of fuelling operations may have an impact if either LNG or CNG operated vessels require significantly larger number of operations. However, in practice this is not considered to be a determining issue in the selection process between the two options. 7.3.1.4 Risks associated to external impact on the storage facility The risks caused by external impact do not differ from other natural gas installations and is as such not assessed to cause significant risks. 7.3.1.5 Risks related to collision involving a LNG/CNG fuelled vessels It is not expected that the consequences of ship collision will impact the overall risk picture as it is assumed that the LNG/CNG fuelled vessels can be designed in such a way that the LNG/CNG tank is not damaged during collision. This is considered a technological design issue. 7.3.2 Previous accidents – lessons learned
There are only few accidents with LNG/CNG on record of which some are only of minor relevance today as they date back 30-70 years, hence the technological development make them obsolete. The accidents on record are not of comparable installations as they have been on production plants. During the research it has not been possible to identify advantages of the LNG or CNG option based on accident records. 7.3.3 General risk reducing measures
The implementation of LNG/CNG facilities will be subject to various general risk reducing measures as appropriate:
Design according to norms and standards, hereunder dimensioning including safety factors in design, predefined fabrication requirements and tests as well as procedures for installation and maintenance;
Quality management systems in the supply chain, including inspections and audits in the respective phases of development, implementation and operation;
70
Procedures for operation and maintenance; Inspection programmes; Emergency shut-down systems for sectioning of the installation; Fire and gas detection systems; Special programmes for shut-down, maintenance and replacement of
installation parts; Safety instructions and work permits; Collision barriers, fencing and access control.
7.3.4 Conclusions on Risk Assessment
The risk pictures of the LNG and CNG options do not provide argumentation for either option having safety related advantages. The technology to be applied is well known and the operational experience from other countries indicates that safety standards can be met. It is assessed that the required installations can be implemented in accordance with the regulatory requirements and common practice for safety levels. Detailed risk assessments and ALARP demonstration are of course required during concept maturation in order to provide for the necessary demonstration of safety. Depending on the decided size of the installations, subject to the technological requirements, considerations regarding the regulatory framework are recommended in order to evaluate the relationship to the Danish statutory order on risk (“Risikobekendtgørelsen”) and related regulation. To the operators and investors it is assumed to be important to clarify the requirements for safety management systems, risk assessments and quantitative risk analysis due to the administrative activities and resources needed.
7.4 Barriers to the use of natural gas
When introducing a “new” technology in society the obstacles may be many. In the case of natural gas the technology is not entirely new and experiences are available from the use of both CNG and LNG in the transport sector, albeit the usage for propulsion in the shipping sector is still under development. It appears that the development of technology and demonstration projects on CNG in shipping has been slow since the mid 1990’s. In contrast, LNG has gained considerable momentum in shipping during the last decade. It should be mentioned that the Danish Maritime Authority is currently heading an international effort seeking to further promote the use of LNG in shipping by conducting a feasibility study on LNG infrastructure for short sea shipping39. The following sections address some of the barriers identified:
Technical Supply chain and bunkering
39 Invitation from Danish Maritime Authority to initiate an application under the EU strategy for the Baltic Seas region for funds to “Conduct a feasibility study on LNG infrastructure for short sea shipping” dated 29 april 2010.
71
Political/administrative Economic
Obviously, most barriers may be removed by spending enough money and may be said to be of economic nature, but here only the barriers related to cost proportions are mentioned, Economic issues related to the conversion to natural gas on the wider scale are dealt with briefly here and are elaborated on in the following chapter. 7.4.1 Technical challenges
There are technical challenges associated with installations designed to operate a ship on natural gas, particularly on existing vessels, and since this is still a new, albeit expanding area, the extent of experience is still limited in the industry. However, considering the information provided on the technical issues here there are no “show stopping” technical barriers to the use of natural gas for propulsion in shipping. When it comes to the choice of LNG or CNG, the former is the choice of nearly all the shipowners engaged in the conversion to natural gas. This is a consequence of the advancement of the LNG technology over the last decade partly spurred by the Norwegian incentives and the investments generated by the NOx tax in Norway. Most of the experiences with CNG propulsed vessels are from conversions between ten and twenty years ago now and almost exclusively on very small vessels. Natural gas cannot utilise existing fuel tanks and both LNG and CNG have more demanding footprint onboard for storage tanks. This is a significant barrier encountered in particular with CNG as the spacial requirement is twice that of LNG for the same energy content. Both systems require significant structural enhancement to accommodate the tanks when refitting vessels. 7.4.2 Supply chain and bunkering
There are a number of possible ways to supply the Danish market with LNG. It is possible to construct a liquefaction plant with gas feed via pipeline or LNG can be imported by LNG carrier directly from Middle East suppliers, but in both cases a main Danish terminal is needed and LNG will need to be further distributed to local storage at consumers or via bunkering companies. Since this will require smaller LNG supply vessels or large LNG trucks it appears that these may equally well load LNG from existing facilities in Europe and supply the Danish market without a costly Danish hub. The experiences in Norway, where LNG for use as fuel is liquefied in small scale plants show that the price is about 3 times the natural gas spot price. The supply of natural gas in the form of LNG is therefore anticipated as an import to Denmark from LNG terminals or other suitable suppliers in Europe, presumably by shuttle tankers that may supply storage tanks in existing bunkering facilities, local storage facilities with the consumer or allow direct bunkering. Regarding CNG it is usually created by a stepwise compression from the network natural gas locally directly to a filling station or trucked over shorter
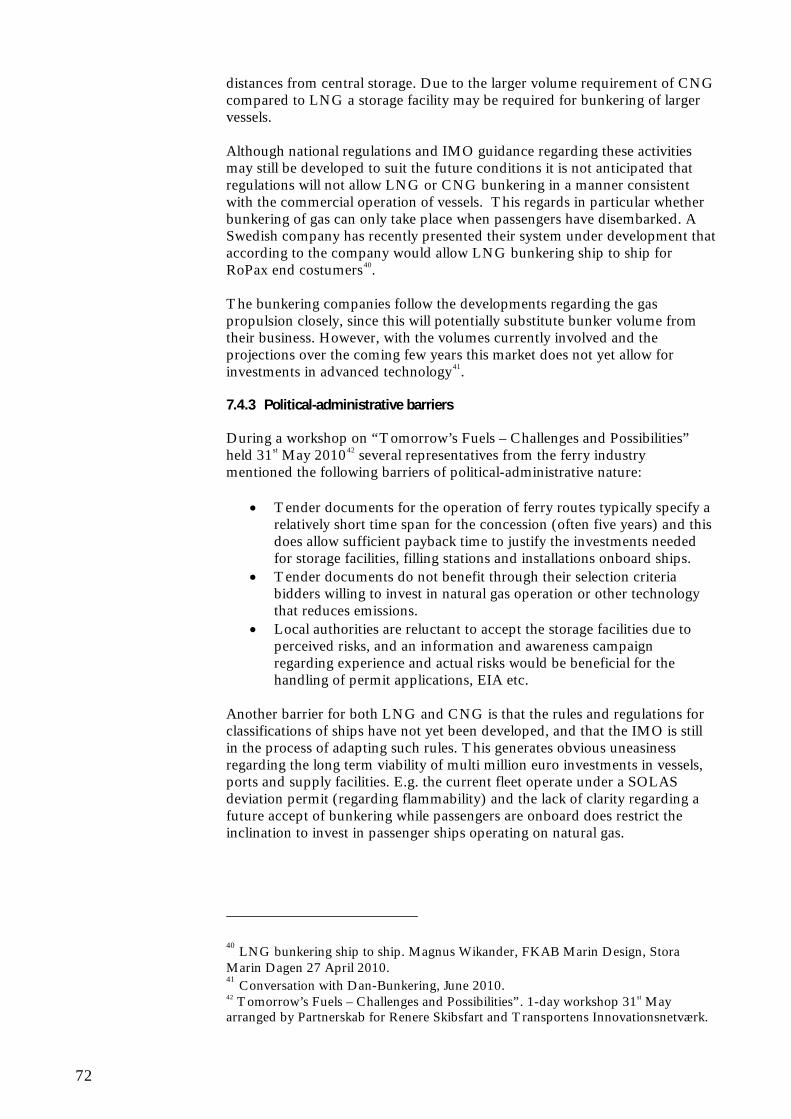
72
distances from central storage. Due to the larger volume requirement of CNG compared to LNG a storage facility may be required for bunkering of larger vessels. Although national regulations and IMO guidance regarding these activities may still be developed to suit the future conditions it is not anticipated that regulations will not allow LNG or CNG bunkering in a manner consistent with the commercial operation of vessels. This regards in particular whether bunkering of gas can only take place when passengers have disembarked. A Swedish company has recently presented their system under development that according to the company would allow LNG bunkering ship to ship for RoPax end costumers40. The bunkering companies follow the developments regarding the gas propulsion closely, since this will potentially substitute bunker volume from their business. However, with the volumes currently involved and the projections over the coming few years this market does not yet allow for investments in advanced technology41. 7.4.3 Political-administrative barriers
During a workshop on “Tomorrow’s Fuels – Challenges and Possibilities” held 31st May 201042 several representatives from the ferry industry mentioned the following barriers of political-administrative nature:
Tender documents for the operation of ferry routes typically specify a relatively short time span for the concession (often five years) and this does allow sufficient payback time to justify the investments needed for storage facilities, filling stations and installations onboard ships.
Tender documents do not benefit through their selection criteria bidders willing to invest in natural gas operation or other technology that reduces emissions.
Local authorities are reluctant to accept the storage facilities due to perceived risks, and an information and awareness campaign regarding experience and actual risks would be beneficial for the handling of permit applications, EIA etc.
Another barrier for both LNG and CNG is that the rules and regulations for classifications of ships have not yet been developed, and that the IMO is still in the process of adapting such rules. This generates obvious uneasiness regarding the long term viability of multi million euro investments in vessels, ports and supply facilities. E.g. the current fleet operate under a SOLAS deviation permit (regarding flammability) and the lack of clarity regarding a future accept of bunkering while passengers are onboard does restrict the inclination to invest in passenger ships operating on natural gas.
40 LNG bunkering ship to ship. Magnus Wikander, FKAB Marin Design, Stora Marin Dagen 27 April 2010. 41 Conversation with Dan-Bunkering, June 2010. 42 Tomorrow’s Fuels – Challenges and Possibilities”. 1-day workshop 31st May arranged by Partnerskab for Renere Skibsfart and Transportens Innovationsnetværk.
73
7.4.4 Economic barriers
Although a topic of the following chapter a brief mentioning of the costs as a barrier is worth considering when the overall picture of converting to gas is painted. From experience achieved through the NOx-fund the typical additional investment cost of choosing LNG over traditional oil fuels is estimated to be less than 20%. The cost for newbuilds is lower than costs for retrofitting existing vessels. The LNG tanks with required gas systems have so far cost typically 10-15 mNOK (1.2-1.9 mEUR) and the gas engines have been 5-10 mNOK (0.6-1.2 mEUR) more expensive than corresponding diesel engines. In addition, some hull reinforcement etc is expected. These costs are however representative for the “pioneer work” till now, and should be expected to drop in the future as volume picks up and the technology proves to be capable. Barriers to the introduction of natural gas appear to be less technical than they are associated with supply chain issues and obviously economic issues. A key issue is also that the LNG cannot be stored in the existing fuel tanks, but new storage tanks must be installed onboard and they often will take up “commercial” space. E.g. in a design for a container vessel approx. 3% of the TEU capacity was blocked by the LNG tanks43. The introduction of LNG in shipping has already taken place in Norway and many technical and logistical challenges have been addressed. Although, the potential for CNG is also considerable the technology for larger vessels is less mature. 7.4.5 Summary of barriers
Several manufacturers have addressed the technical barriers regarding engines/turbines and most of the prominent remaining issues appear to be associated with the filling stations and the storage onboard. This is also an area where updated rules and regulations may provide much sought after clarity and that will reportedly assist in promoting natural gas.
43 Gas as Ship Fuel, Presentation by Dr. Gerd Würsig, Stora Marin Dagen 27 April 2010.
74
Table 7-2 Key barriers for introduction of natural gas (LNG) Barriers Possible actions Technical: More demanding footprint onboard (takes up commercial space)
New designs and technical development of tanks and reconsideration of safety measures
Supply: For short sea shipping filling stations in key ports are lacking
Provide funds for pilot project, technology development etc.
Filling station/bunkering Develop options for mobile tanks to be trucked onboard and installed
Regulation: Safety regulation for Ship to ship transfer
Efforts to support the development of revised rules
Safety regulation for bunkering while passengers are onboard
Develop safety measure to allow bunkering while passengers are onboard
Political-administrative: No reward for natural gas conversion in public tenders
Build in criteria in tenders to incentivise investments
Concession periods too short for capital investments
Prolong concession periods, where possible.
75
8 Economic analysis
8.1 Summary of findings
The economic analysis of natural gas in ferries and short sea shipping indicates that there may be a positive case for LNG terminals in selected ports and in the most fuel consuming ferries and cargo ships. For these, we expect the savings in fuel cost to cover the investments in terminals and ships. However, this result is quit sensitive to the assumptions made. For each of the four scenarios a first, rough estimation is made of the total investment needs in order to use natural gas as fuel, and compare this to the fuel savings foreseen. Although there are uncertainty to the results that stems from the assumptions made, two conclusions can be drawn from this analysis. First, focus should be on investments in the most fuel consuming ports and ships. The case for natural gas gets increasingly more positive as the number of ports and ships are reduced. In the three broadest scenarios, the investments in gas equipment cannot be recovered by the savings in fuel consumption. This is only the case in Scenario 4, the most limited scenario. Secondly, the result in Scenario 4 is quite sensitive to the assumptions made about the cost of the initial investments and to the expected future spread between gas and oil prices. If the investment in retrofitting existing ships and the extra cost of equipping new ships with gas engines is 20% higher than assumed in the base case, the investment cost cannot be covered by the fuel cost savings. Also, a reduced spread between gas and oil prices can change the conclusion. If the spread in prices between MGO and LNG is reduced from the present level to the level expected in the forecasts by the Danish Energy Agency, the economic analysis indicates that it is most profitable to stick to diesel. Hence, if the there is a political interest in increasing use of natural gas in ferries and short sea shipping in Denmark, public intervention may be needed. Inspiration for public intervention can be obtained from Norway, whereas direct public intervention to support LNG has focused on market demand issues in Sweden. In Norway, the NOx Fund supports investments aimed to reduce NOx emissions. Such a mechanism can ensure financing of LNG investment.
8.2 Business case for natural gas
Investments on ships, ports and infrastructure are needed in order to use CNG or LNG as a fuel on Danish ferries and short sea shipping vessels. These investments may turn up profitable as significant fuel savings can be foreseen – at least if the present difference in oil and gas prices is maintained. The aim of the business case presented in this chapter is to gain insight into whether the investments can be expected to be covered by the fuel cost
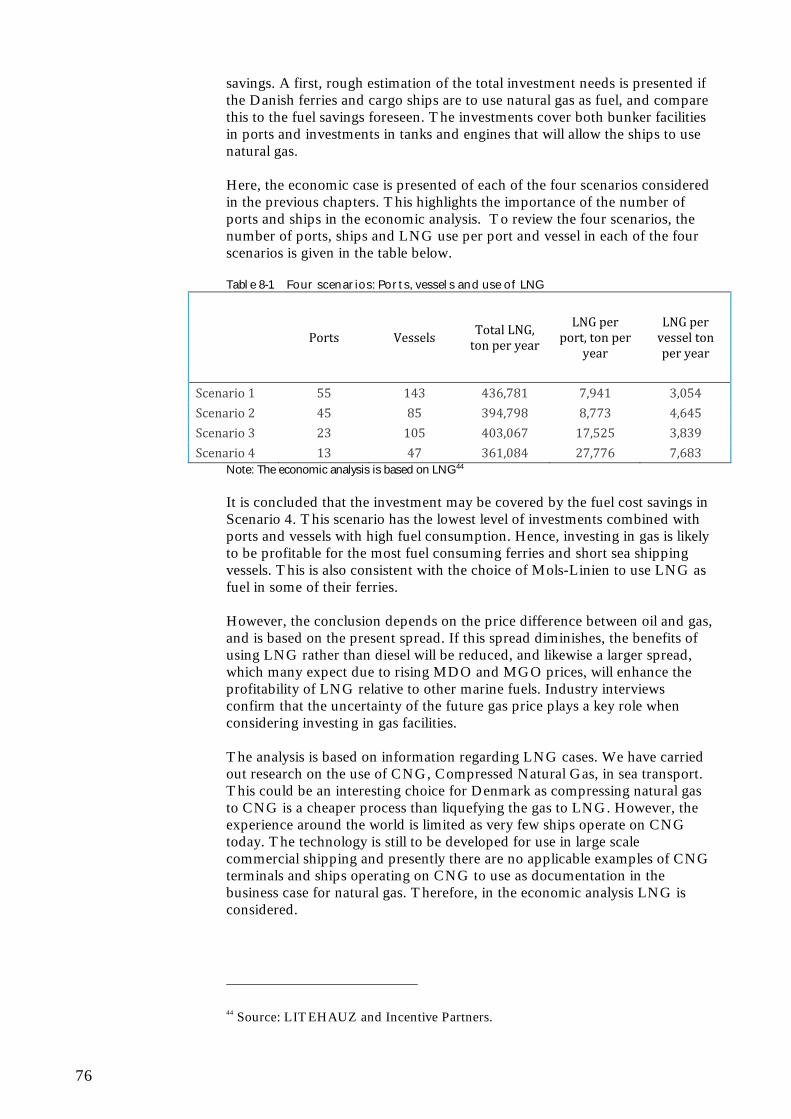
76
savings. A first, rough estimation of the total investment needs is presented if the Danish ferries and cargo ships are to use natural gas as fuel, and compare this to the fuel savings foreseen. The investments cover both bunker facilities in ports and investments in tanks and engines that will allow the ships to use natural gas. Here, the economic case is presented of each of the four scenarios considered in the previous chapters. This highlights the importance of the number of ports and ships in the economic analysis. To review the four scenarios, the number of ports, ships and LNG use per port and vessel in each of the four scenarios is given in the table below. Table 8-1 Four scenarios: Ports, vessels and use of LNG
Ports Vessels Total LNG, ton per year
LNG per port, ton per
year
LNG per vessel ton per year
Scenario 1 55 143 436,781 7,941 3,054
Scenario 2 45 85 394,798 8,773 4,645
Scenario 3 23 105 403,067 17,525 3,839
Scenario 4 13 47 361,084 27,776 7,683 Note: The economic analysis is based on LNG44 It is concluded that the investment may be covered by the fuel cost savings in Scenario 4. This scenario has the lowest level of investments combined with ports and vessels with high fuel consumption. Hence, investing in gas is likely to be profitable for the most fuel consuming ferries and short sea shipping vessels. This is also consistent with the choice of Mols-Linien to use LNG as fuel in some of their ferries. However, the conclusion depends on the price difference between oil and gas, and is based on the present spread. If this spread diminishes, the benefits of using LNG rather than diesel will be reduced, and likewise a larger spread, which many expect due to rising MDO and MGO prices, will enhance the profitability of LNG relative to other marine fuels. Industry interviews confirm that the uncertainty of the future gas price plays a key role when considering investing in gas facilities. The analysis is based on information regarding LNG cases. We have carried out research on the use of CNG, Compressed Natural Gas, in sea transport. This could be an interesting choice for Denmark as compressing natural gas to CNG is a cheaper process than liquefying the gas to LNG. However, the experience around the world is limited as very few ships operate on CNG today. The technology is still to be developed for use in large scale commercial shipping and presently there are no applicable examples of CNG terminals and ships operating on CNG to use as documentation in the business case for natural gas. Therefore, in the economic analysis LNG is considered.
44 Source: LITEHAUZ and Incentive Partners.
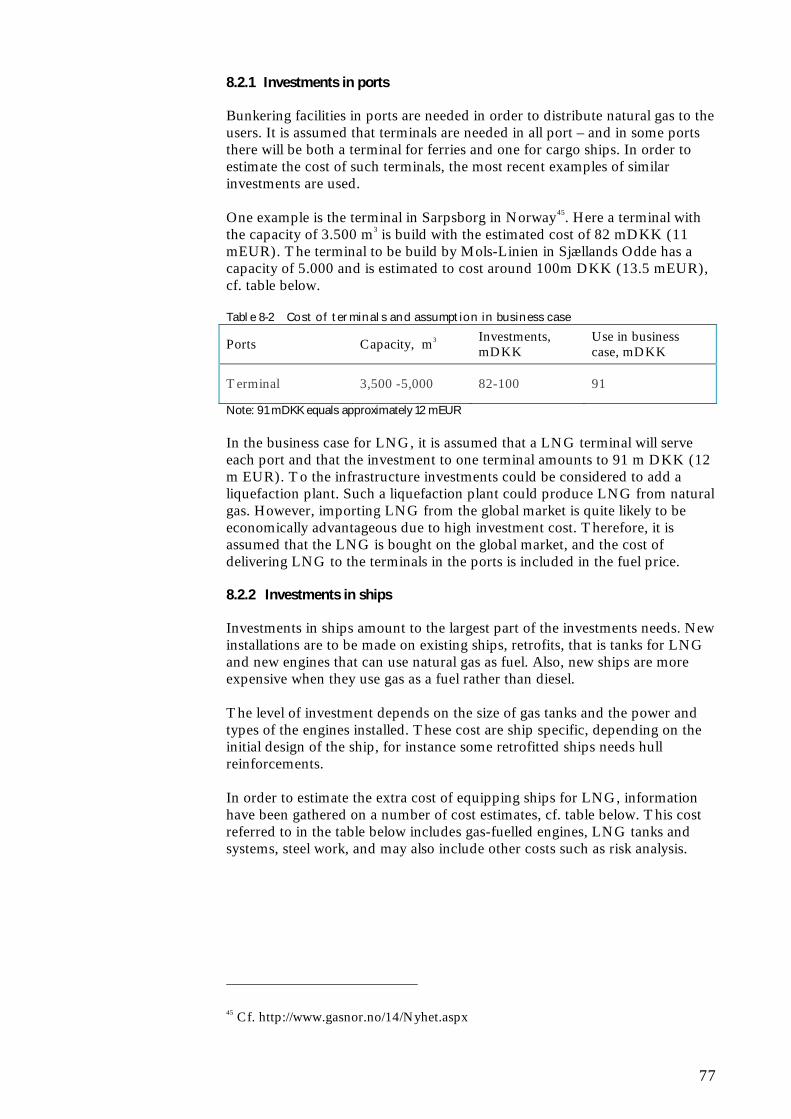
77
8.2.1 Investments in ports
Bunkering facilities in ports are needed in order to distribute natural gas to the users. It is assumed that terminals are needed in all port – and in some ports there will be both a terminal for ferries and one for cargo ships. In order to estimate the cost of such terminals, the most recent examples of similar investments are used. One example is the terminal in Sarpsborg in Norway45. Here a terminal with the capacity of 3.500 m3 is build with the estimated cost of 82 mDKK (11 mEUR). The terminal to be build by Mols-Linien in Sjællands Odde has a capacity of 5.000 and is estimated to cost around 100m DKK (13.5 mEUR), cf. table below. Table 8-2 Cost of terminals and assumption in business case
Ports Capacity, m3 Investments, mDKK
Use in business case, mDKK
Terminal 3,500 -5,000 82-100 91
Note: 91 mDKK equals approximately 12 mEUR In the business case for LNG, it is assumed that a LNG terminal will serve each port and that the investment to one terminal amounts to 91 m DKK (12 m EUR). To the infrastructure investments could be considered to add a liquefaction plant. Such a liquefaction plant could produce LNG from natural gas. However, importing LNG from the global market is quite likely to be economically advantageous due to high investment cost. Therefore, it is assumed that the LNG is bought on the global market, and the cost of delivering LNG to the terminals in the ports is included in the fuel price. 8.2.2 Investments in ships
Investments in ships amount to the largest part of the investments needs. New installations are to be made on existing ships, retrofits, that is tanks for LNG and new engines that can use natural gas as fuel. Also, new ships are more expensive when they use gas as a fuel rather than diesel. The level of investment depends on the size of gas tanks and the power and types of the engines installed. These cost are ship specific, depending on the initial design of the ship, for instance some retrofitted ships needs hull reinforcements. In order to estimate the extra cost of equipping ships for LNG, information have been gathered on a number of cost estimates, cf. table below. This cost referred to in the table below includes gas-fuelled engines, LNG tanks and systems, steel work, and may also include other costs such as risk analysis.
45 Cf. http://www.gasnor.no/14/Nyhet.aspx
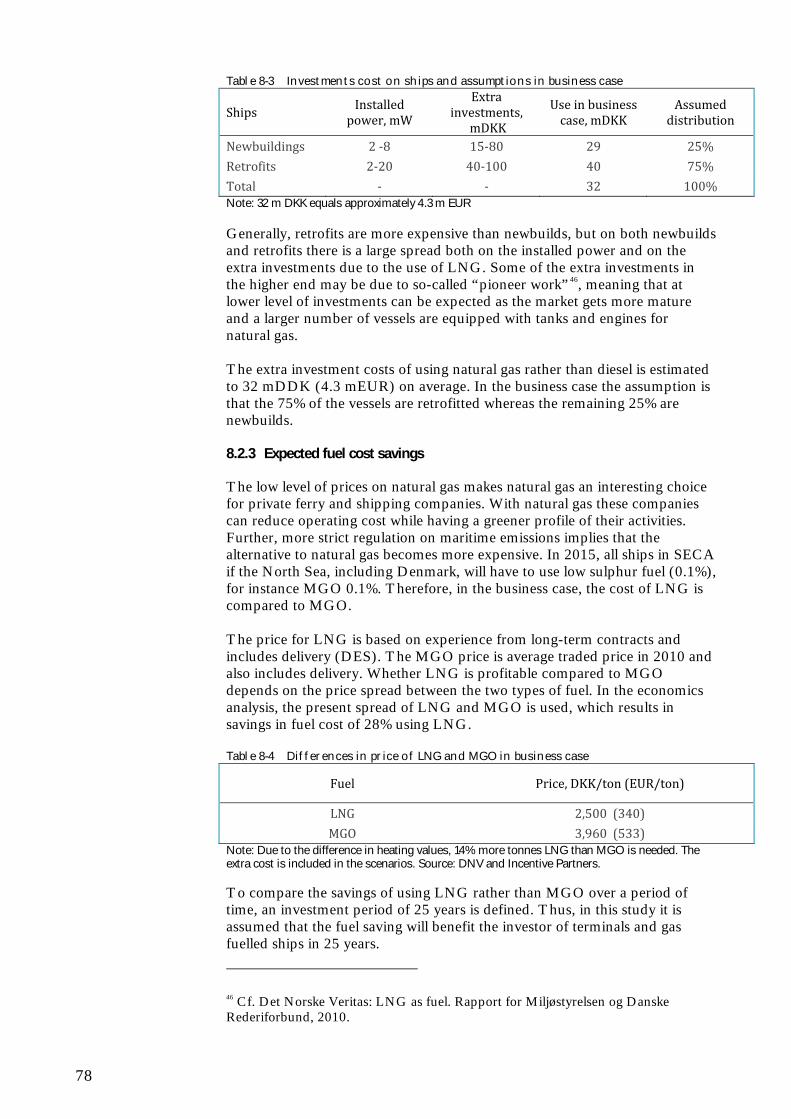
78
Table 8-3 Investments cost on ships and assumptions in business case
Ships Installed power, mW
Extra investments, mDKK
Use in business case, mDKK
Assumed distribution
Newbuildings 2 ‐8 15‐80 29 25%
Retrofits 2‐20 40‐100 40 75%
Total ‐ ‐ 32 100% Note: 32 m DKK equals approximately 4.3 m EUR Generally, retrofits are more expensive than newbuilds, but on both newbuilds and retrofits there is a large spread both on the installed power and on the extra investments due to the use of LNG. Some of the extra investments in the higher end may be due to so-called “pioneer work”46, meaning that at lower level of investments can be expected as the market gets more mature and a larger number of vessels are equipped with tanks and engines for natural gas. The extra investment costs of using natural gas rather than diesel is estimated to 32 mDDK (4.3 mEUR) on average. In the business case the assumption is that the 75% of the vessels are retrofitted whereas the remaining 25% are newbuilds. 8.2.3 Expected fuel cost savings
The low level of prices on natural gas makes natural gas an interesting choice for private ferry and shipping companies. With natural gas these companies can reduce operating cost while having a greener profile of their activities. Further, more strict regulation on maritime emissions implies that the alternative to natural gas becomes more expensive. In 2015, all ships in SECA if the North Sea, including Denmark, will have to use low sulphur fuel (0.1%), for instance MGO 0.1%. Therefore, in the business case, the cost of LNG is compared to MGO. The price for LNG is based on experience from long-term contracts and includes delivery (DES). The MGO price is average traded price in 2010 and also includes delivery. Whether LNG is profitable compared to MGO depends on the price spread between the two types of fuel. In the economics analysis, the present spread of LNG and MGO is used, which results in savings in fuel cost of 28% using LNG. Table 8-4 Differences in price of LNG and MGO in business case
Fuel Price, DKK/ton (EUR/ton)
LNG 2,500 (340)
MGO 3,960 (533) Note: Due to the difference in heating values, 14% more tonnes LNG than MGO is needed. The extra cost is included in the scenarios. Source: DNV and Incentive Partners. To compare the savings of using LNG rather than MGO over a period of time, an investment period of 25 years is defined. Thus, in this study it is assumed that the fuel saving will benefit the investor of terminals and gas fuelled ships in 25 years.
46 Cf. Det Norske Veritas: LNG as fuel. Rapport for Miljøstyrelsen og Danske Rederiforbund, 2010.
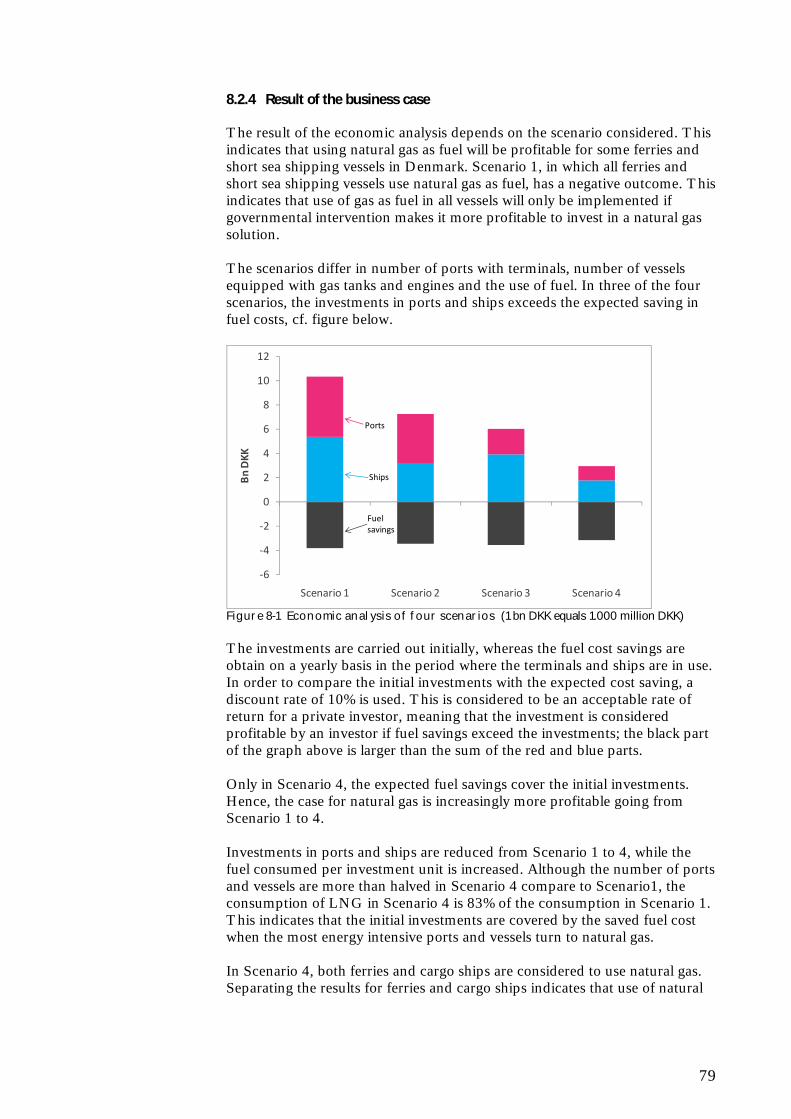
79
8.2.4 Result of the business case
The result of the economic analysis depends on the scenario considered. This indicates that using natural gas as fuel will be profitable for some ferries and short sea shipping vessels in Denmark. Scenario 1, in which all ferries and short sea shipping vessels use natural gas as fuel, has a negative outcome. This indicates that use of gas as fuel in all vessels will only be implemented if governmental intervention makes it more profitable to invest in a natural gas solution. The scenarios differ in number of ports with terminals, number of vessels equipped with gas tanks and engines and the use of fuel. In three of the four scenarios, the investments in ports and ships exceeds the expected saving in fuel costs, cf. figure below.
‐6
‐4
‐2
0
2
4
6
8
10
12
Scenario 1 Scenario 2 Scenario 3 Scenario 4
Bn DKK
Ships
Ports
Fuel savings
Figure 8-1 Economic analysis of four scenarios (1 bn DKK equals 1.000 million DKK) The investments are carried out initially, whereas the fuel cost savings are obtain on a yearly basis in the period where the terminals and ships are in use. In order to compare the initial investments with the expected cost saving, a discount rate of 10% is used. This is considered to be an acceptable rate of return for a private investor, meaning that the investment is considered profitable by an investor if fuel savings exceed the investments; the black part of the graph above is larger than the sum of the red and blue parts. Only in Scenario 4, the expected fuel savings cover the initial investments. Hence, the case for natural gas is increasingly more profitable going from Scenario 1 to 4. Investments in ports and ships are reduced from Scenario 1 to 4, while the fuel consumed per investment unit is increased. Although the number of ports and vessels are more than halved in Scenario 4 compare to Scenario1, the consumption of LNG in Scenario 4 is 83% of the consumption in Scenario 1. This indicates that the initial investments are covered by the saved fuel cost when the most energy intensive ports and vessels turn to natural gas. In Scenario 4, both ferries and cargo ships are considered to use natural gas. Separating the results for ferries and cargo ships indicates that use of natural
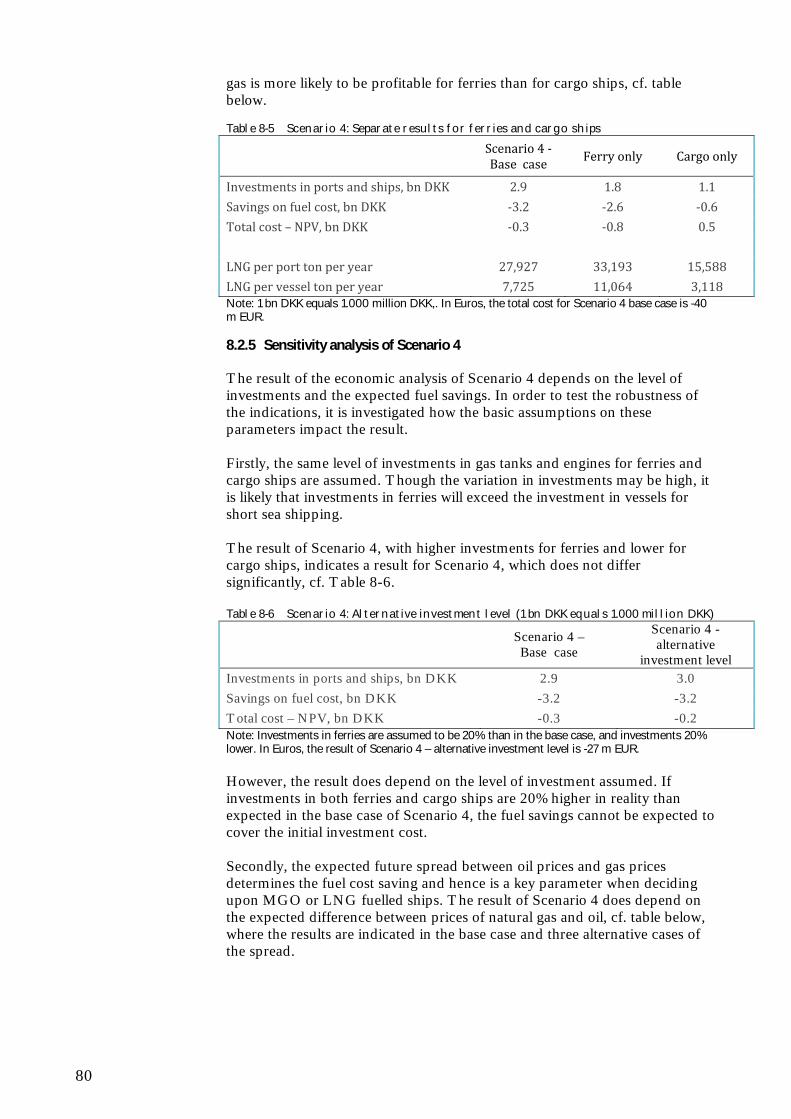
80
gas is more likely to be profitable for ferries than for cargo ships, cf. table below. Table 8-5 Scenario 4: Separate results for ferries and cargo ships
Scenario 4 ‐ Base case
Ferry only Cargo only
Investments in ports and ships, bn DKK 2.9 1.8 1.1
Savings on fuel cost, bn DKK ‐3.2 ‐2.6 ‐0.6
Total cost – NPV, bn DKK ‐0.3 ‐0.8 0.5
LNG per port ton per year 27,927 33,193 15,588
LNG per vessel ton per year 7,725 11,064 3,118 Note: 1 bn DKK equals 1.000 million DKK,. In Euros, the total cost for Scenario 4 base case is -40 m EUR. 8.2.5 Sensitivity analysis of Scenario 4
The result of the economic analysis of Scenario 4 depends on the level of investments and the expected fuel savings. In order to test the robustness of the indications, it is investigated how the basic assumptions on these parameters impact the result. Firstly, the same level of investments in gas tanks and engines for ferries and cargo ships are assumed. Though the variation in investments may be high, it is likely that investments in ferries will exceed the investment in vessels for short sea shipping. The result of Scenario 4, with higher investments for ferries and lower for cargo ships, indicates a result for Scenario 4, which does not differ significantly, cf. Table 8-6. Table 8-6 Scenario 4: Alternative investment level (1 bn DKK equals 1.000 million DKK)
Scenario 4 – Base case
Scenario 4 - alternative
investment level Investments in ports and ships, bn DKK 2.9 3.0
Savings on fuel cost, bn DKK -3.2 -3.2
Total cost – NPV, bn DKK -0.3 -0.2 Note: Investments in ferries are assumed to be 20% than in the base case, and investments 20% lower. In Euros, the result of Scenario 4 – alternative investment level is -27 m EUR. However, the result does depend on the level of investment assumed. If investments in both ferries and cargo ships are 20% higher in reality than expected in the base case of Scenario 4, the fuel savings cannot be expected to cover the initial investment cost. Secondly, the expected future spread between oil prices and gas prices determines the fuel cost saving and hence is a key parameter when deciding upon MGO or LNG fuelled ships. The result of Scenario 4 does depend on the expected difference between prices of natural gas and oil, cf. table below, where the results are indicated in the base case and three alternative cases of the spread.
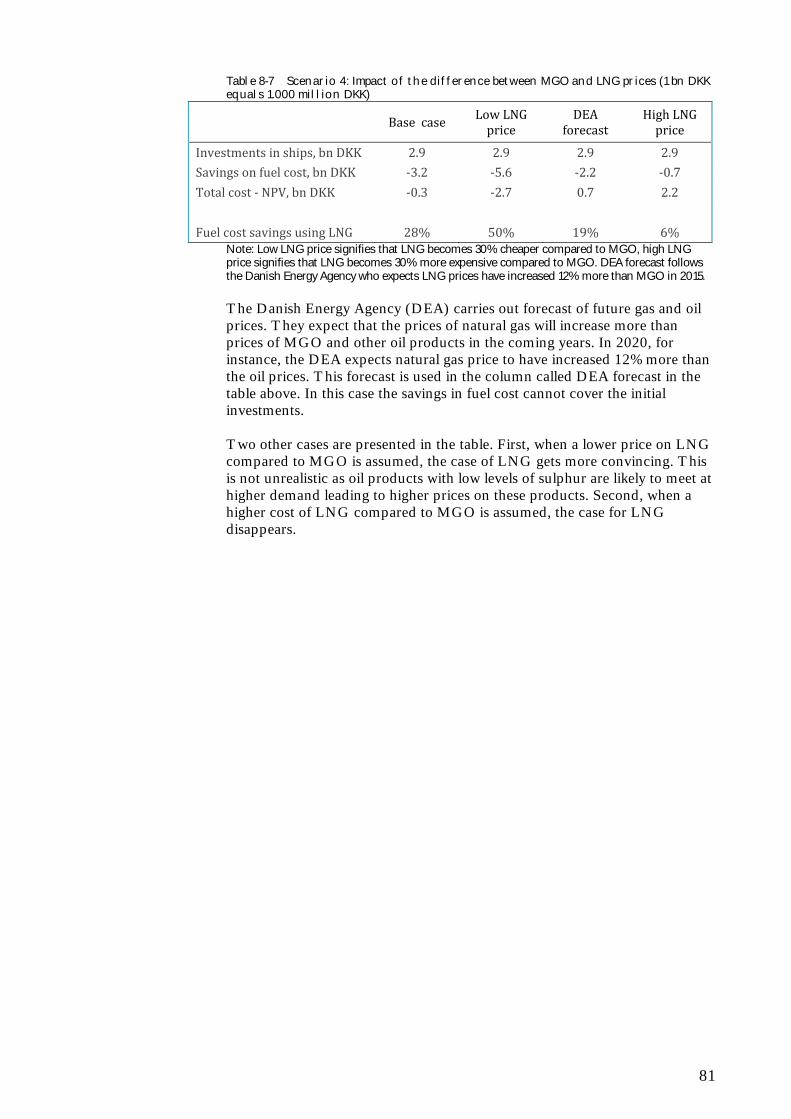
81
Table 8-7 Scenario 4: Impact of the difference between MGO and LNG prices (1 bn DKK equals 1.000 million DKK)
Base case
Low LNG price
DEA forecast
High LNG price
Investments in ships, bn DKK 2.9 2.9 2.9 2.9
Savings on fuel cost, bn DKK ‐3.2 ‐5.6 ‐2.2 ‐0.7
Total cost ‐ NPV, bn DKK ‐0.3 ‐2.7 0.7 2.2
Fuel cost savings using LNG 28% 50% 19% 6% Note: Low LNG price signifies that LNG becomes 30% cheaper compared to MGO, high LNG price signifies that LNG becomes 30% more expensive compared to MGO. DEA forecast follows the Danish Energy Agency who expects LNG prices have increased 12% more than MGO in 2015. The Danish Energy Agency (DEA) carries out forecast of future gas and oil prices. They expect that the prices of natural gas will increase more than prices of MGO and other oil products in the coming years. In 2020, for instance, the DEA expects natural gas price to have increased 12% more than the oil prices. This forecast is used in the column called DEA forecast in the table above. In this case the savings in fuel cost cannot cover the initial investments. Two other cases are presented in the table. First, when a lower price on LNG compared to MGO is assumed, the case of LNG gets more convincing. This is not unrealistic as oil products with low levels of sulphur are likely to meet at higher demand leading to higher prices on these products. Second, when a higher cost of LNG compared to MGO is assumed, the case for LNG disappears.

82
83
9 Conclusions
The technical developments needed to introduce natural gas for propulsion is available for shipping both for ferries and the short sea shipping. For Liquefied Natural Gas (LNG) the experiences with onshore and onboard installations are recent and during the coming years the knowledge base will be continuously expanding due to new developments. For Compressed Natural Gas (CNG) the development for the shipping sector appears not to have progressed much over the last decade, although considerable information is available from land transport. Potential for conversion to natural gas From a comparison of fuel consumption in the Danish ferry and short sea shipping sector under four different scenarios it emerges that part of the ferry sector is well suited to conversion to natural gas. However, the fuel consumption in the many smaller ferries is relatively small due to the limited installed engine power and only in the nine ferry ports with the largest ferries is the fuel consumption substantial (>20,000 t/y). The short sea shipping sector is estimated to be 75 lines with 78 vessels calling 14 ports and to account for a maximum of 25% of the total fuel consumption in ferry and short sea sector combined. Foreign ferry routes operating lines in Hirtshals and Frederikshavn may contribute significantly to the converted fuel consumption adding 150,000 ton in two ports adding to the total of 300,000 ton considered for nine ports (calculated as LNG). However, LNG bunkering infrastructure is more advanced in the ports of destination and if allowed by technical conditions it is assumed for the purpose of the study that the natural gas (LNG) facilities will be placed there rather than in Denmark. Given the potential significance of the contribution, the options for including these ports should not be ignored when considering a strategy for the use of natural gas in shipping in Denmark. Emissions to air Depending on the air pollution component the reduction potential is still 70-80% of that in scenario 1, which includes 65 ferries in 41 ports and 78 vessels in short sea line traffic in 14 ports, when assessing the most reduced scenario (no 4), which includes 27 ferries in nine ports and 20 vessels in short sea line traffic in four ports (Fredericia, Copenhagen, Esbjerg and Århus). The total annual reductions amount to approx. 8,100 t SOx 1100 t PM and 26,000 t NOx with the short sea shipping accounting for 15-20% of the reduction in the most feasible scenario 4. It will therefore be beneficial to target the installations of the LNG or CNG storage and filling stations to a few ports with a high consumption profile and yet reap a large emission reduction potential. It may be added that a 10% reduction in the emissions of carbon dioxide can be foreseen, but the actual impact on climate change is sensitive to the potential release of unburned hydrocarbons, which will primarily be in the form of methane, a potent greenhouse gas.
84
Synergies with other transport sector In a number of European countries natural gas powered vehicles for urban services, e.g. public transport and garbage collecting services, have proven successful. However, this success has been the result of a political will to support the use of natural gas fuel with subsidies or reduced tax. It is a commonly shared belief in the land transport sector hat lower taxes on natural gas are important for a successful implementation of natural gas driven vehicles. There are technical synergies related to the facilities with LNG or CNG, yet the economic importance must be evaluated on a case-by-case basis. The main synergies between the two transport sectors take place on the political level where natural gas as a fuel could obtain better conditions if both sectors used the fuel. However, there could be significant operational synergies when using LNG or CNG in both shipping and land transport depending on the specific harbour in question. Economy Three of the four assessed scenarios indicate that fuel cost savings cannot alone cover the investments needed to use LNG as fuel. Only the most reduced scenario (no. 4 targeting nine ferry ports and four cargo ports) indicates a positive case for natural gas. However, the result of the business case still depends very much on the basic assumptions about investment levels and the expected cost difference between the alternative (marine gas oil) and LNG. Insufficient information is available to allow for a specific analysis of CNG. It is, however, estimated that the primary difference is the logistical part where a tanker transports LNG to storage and user, whereas CNG will be distributed as natural gas in the grid and compressed on-site. Hence, if there is a political demand to make the use of natural gas in ferries and short sea shipping in Denmark take off, public intervention may be needed to reduce the uncertainty related to long term profitability of an investment in natural gas installations. Barriers and possible actions Barriers to the introduction of natural gas appear to be less technical than being associated with supply chain issues and economic issues. The introduction of LNG in shipping is already a fact in Norway and many technical and logistical challenges have been addressed. Although the potential for CNG is also considerable, the technology to be used in the shipping sector is less mature. It is often mentioned as a key issue that CNG has more safety issues to be dealt with primarily caused by the high-pressure storage and filling facilities. Taking into account the widespread use of CNG globally in land-based traffic, it does appear that the hesitation to apply CNG in shipping is more related to a lack of maturity of the CNG technology for this particular purpose than actual insurmountable technical safety issues. Having said that it is also clear from the present review that any short-term effort to initiate the wider use of natural gas for propulsion in Danish ferry and short sea shipping cannot be based on CNG. In important ports in several of the countries around Denmark (Norway, Sweden and Germany) LNG installations already
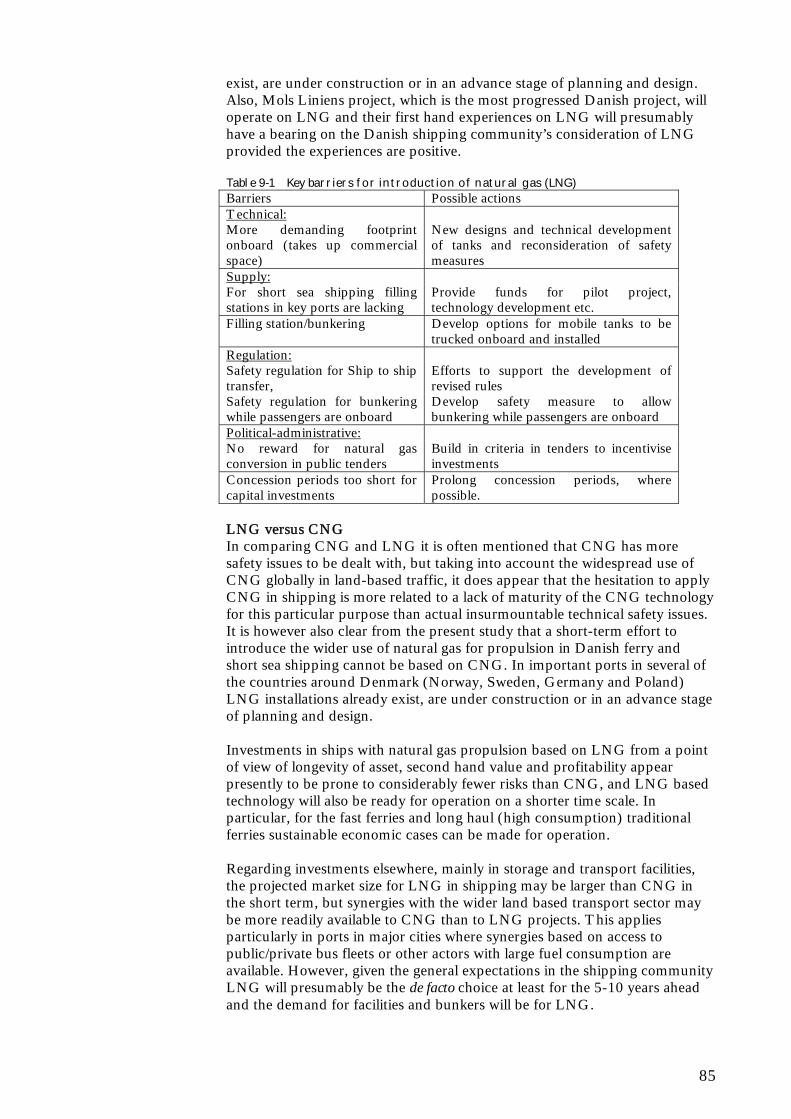
85
exist, are under construction or in an advance stage of planning and design. Also, Mols Liniens project, which is the most progressed Danish project, will operate on LNG and their first hand experiences on LNG will presumably have a bearing on the Danish shipping community’s consideration of LNG provided the experiences are positive. Table 9-1 Key barriers for introduction of natural gas (LNG) Barriers Possible actions Technical: More demanding footprint onboard (takes up commercial space)
New designs and technical development of tanks and reconsideration of safety measures
Supply: For short sea shipping filling stations in key ports are lacking
Provide funds for pilot project, technology development etc.
Filling station/bunkering Develop options for mobile tanks to be trucked onboard and installed
Regulation: Safety regulation for Ship to ship transfer,
Efforts to support the development of revised rules
Safety regulation for bunkering while passengers are onboard
Develop safety measure to allow bunkering while passengers are onboard
Political-administrative: No reward for natural gas conversion in public tenders
Build in criteria in tenders to incentivise investments
Concession periods too short for capital investments
Prolong concession periods, where possible.
LNG versus CNG In comparing CNG and LNG it is often mentioned that CNG has more safety issues to be dealt with, but taking into account the widespread use of CNG globally in land-based traffic, it does appear that the hesitation to apply CNG in shipping is more related to a lack of maturity of the CNG technology for this particular purpose than actual insurmountable technical safety issues. It is however also clear from the present study that a short-term effort to introduce the wider use of natural gas for propulsion in Danish ferry and short sea shipping cannot be based on CNG. In important ports in several of the countries around Denmark (Norway, Sweden, Germany and Poland) LNG installations already exist, are under construction or in an advance stage of planning and design. Investments in ships with natural gas propulsion based on LNG from a point of view of longevity of asset, second hand value and profitability appear presently to be prone to considerably fewer risks than CNG, and LNG based technology will also be ready for operation on a shorter time scale. In particular, for the fast ferries and long haul (high consumption) traditional ferries sustainable economic cases can be made for operation. Regarding investments elsewhere, mainly in storage and transport facilities, the projected market size for LNG in shipping may be larger than CNG in the short term, but synergies with the wider land based transport sector may be more readily available to CNG than to LNG projects. This applies particularly in ports in major cities where synergies based on access to public/private bus fleets or other actors with large fuel consumption are available. However, given the general expectations in the shipping community LNG will presumably be the de facto choice at least for the 5-10 years ahead and the demand for facilities and bunkers will be for LNG.
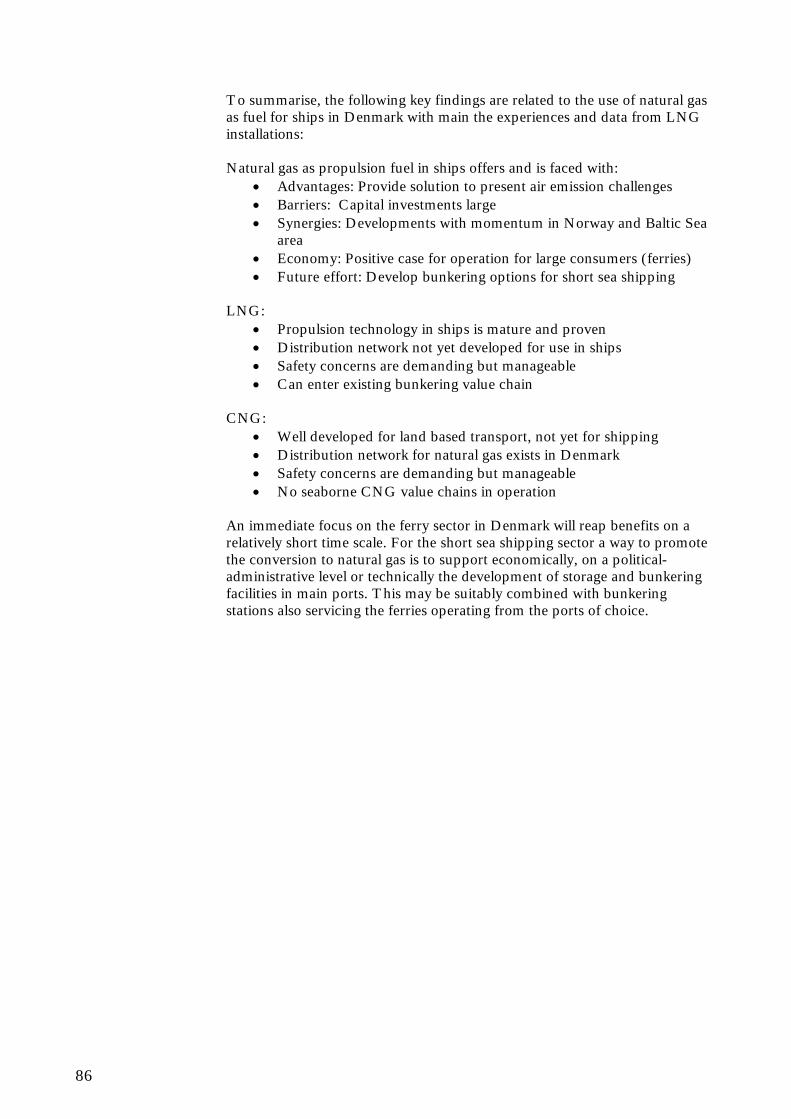
86
To summarise, the following key findings are related to the use of natural gas as fuel for ships in Denmark with main the experiences and data from LNG installations: Natural gas as propulsion fuel in ships offers and is faced with:
Advantages: Provide solution to present air emission challenges Barriers: Capital investments large Synergies: Developments with momentum in Norway and Baltic Sea
area Economy: Positive case for operation for large consumers (ferries) Future effort: Develop bunkering options for short sea shipping
LNG:
Propulsion technology in ships is mature and proven Distribution network not yet developed for use in ships Safety concerns are demanding but manageable Can enter existing bunkering value chain
CNG:
Well developed for land based transport, not yet for shipping Distribution network for natural gas exists in Denmark Safety concerns are demanding but manageable No seaborne CNG value chains in operation
An immediate focus on the ferry sector in Denmark will reap benefits on a relatively short time scale. For the short sea shipping sector a way to promote the conversion to natural gas is to support economically, on a political-administrative level or technically the development of storage and bunkering facilities in main ports. This may be suitably combined with bunkering stations also servicing the ferries operating from the ports of choice.
87
10 References
Associated Danish Ports A/S, Ole H. Jørgensen, May 2010 Bengtsson, S (2010) Lighthouse Eco Ship Theme Day Program, Chalmers University of Technology Bilfærgernes Rederiforening (Danish Car Ferries’ Association) Boesgaard Sørensen, K (2009) Biogas kan gøre naturgasnettet stuerent, Energinet.dk: Ingeniøren BP (2009) Statistical Review of World Energy, June 2009 Brett, BC (2006) Potential markets for LNG-fuelled marine vessels in the United States, S.B. Ocean Engineering, MIT 2006 Campbell, JM (2004) Gas conditioning and processing, vol. II, 8th ed., John M Cleaner Shipping Partnership and the Transport Innovation Network, Workshop Morgendagens Brændstoffer Dan-Bunkering (2010) Interview, June 2010 Danish Ministry of the Environment, Website “Ship emissions and air pollution in Denmark” http://www.mst.dk/Publikationer/Publications/2009/10/978-87-92548-77-1.htm Danish Ministry of the Environment, Risikobekendtgørelsen Danish Shipowners’ Associateion, Arne Mikkelsen Danmarks Statistik (2010) Shipping statistics and port calls, www.statbank.dk Danske Havne (2008) Undersøgelse af nærskibstrafik i danske havne; Received from Jakob Svane, May 2010 Deutsche Energie-Agentur GmbH (dena) DFDS, Gert Jacobsen, May 2010 Det norske Veritas Clasification AS Certification notes No .2.11 Certification of gas burning internal combustion engine installations (May 1994) Rule proposal “Gas Fuelled Engine Installation”
DNV (2010) LNG as Fuel. Study for Miljøstyrelsen and Dansk Rederiforbund. Report for LITEHAUZ ApS; Background document to this study
88
EMSA/ECSA meeting on the possible use of lng as alternative fuel for short sea shipping – 24th november 2009 discussion paper”.
Einaar & Haavik (2000) The Norwegian LNG Ferry. http://www.sintef.no/upload/MARINTEK/PDF-filer/Publications/The%20Norwegian%20LNG%20Ferry_PME.pdf Energinet.dk, Forsyningssikkerhedsplan (p. 57) Environment and Quality CMP, Lennart Hall, May 2010 European Community Shipowners’ Associations (ECSA) (2010) Analysis of the Consequences of Low Sulphur Fuel Requirements. FINAL – 29 January 2010 Esvagt, Steffen Rudbech Nielsen, May 2010 Gasnor (2009) http://www.gasnor.no/14/Nyhet.aspx Ingeniøren (2010) Danmark er klar til at sende biogas ud i naturgasnettet Lemmers SPB (2009) Designing the LNG terminal of the future, Hydrocarbon Processing, September 2009 MAGALOG (2008) Maritime Gas Fuel Logistics. Developing LNG as a clean fuel for ships in the Baltic and North Seas. Report from the MAGALOG project, December 2008 MAN Nutzfahrzeuge – www.man-mn.com MARINTEK (2008) The overall aspects of an LNG supply chain with starting point at Kollsnes and alternative sources MARPOL Convention (MARPOL 72/78) Annex VI Ministry of Climate and Energy (2010) Energiforsyningssikkerhed i Danmark, Bilagsrapport, February 2010 Morgan, J (2009) LNG - Roaring ahead. Where will it end? SPE Distinguished Lecturer Series, Copenhagen, 11-02-2009. Mustang (2008) LNG Smart® Liquefaction Technologies, International Gas Union Research Conference, October 2008 Natural Gas Vehicle Association Europe (NGVA Europe) www.ngvaeurope.eu/ Norges Vassdrags- og Energidirektorat (2004) Partnerskab for Renere Skibsfart and Transportens Innovationsværk (2010) Workshop “Tomorrow’s Fuels – Challenges and Possibilities” Regeringen (2009) Grøn Vækst-plan. Scandlines, Lars Jordt, May 2010
89
The International Union of Railways (UIC) www. railway-energy.org/ Transport- og Energiministeriet, Søfartsstyrelsen og Konkurrencestyrelsen (2005) ”Vækst i Danske Havne” Unifeeder, Jørn Oluf Larsen, May 2010 Valsgaard et al. (2004) The Development of a Compressed Natural Gas Carrier. The 9th International Symposium on Practical Design of Ships and Other Floating Structures”, PRADS 2004. Wikander, M (2010) Presentation “LNG bunkering ship to ship”, FKAB Marin Design, Stora Marin Dagen Würsig G (2010) “Gas as Ship Fuel”, Stora Marin Dagen, April 2010

90
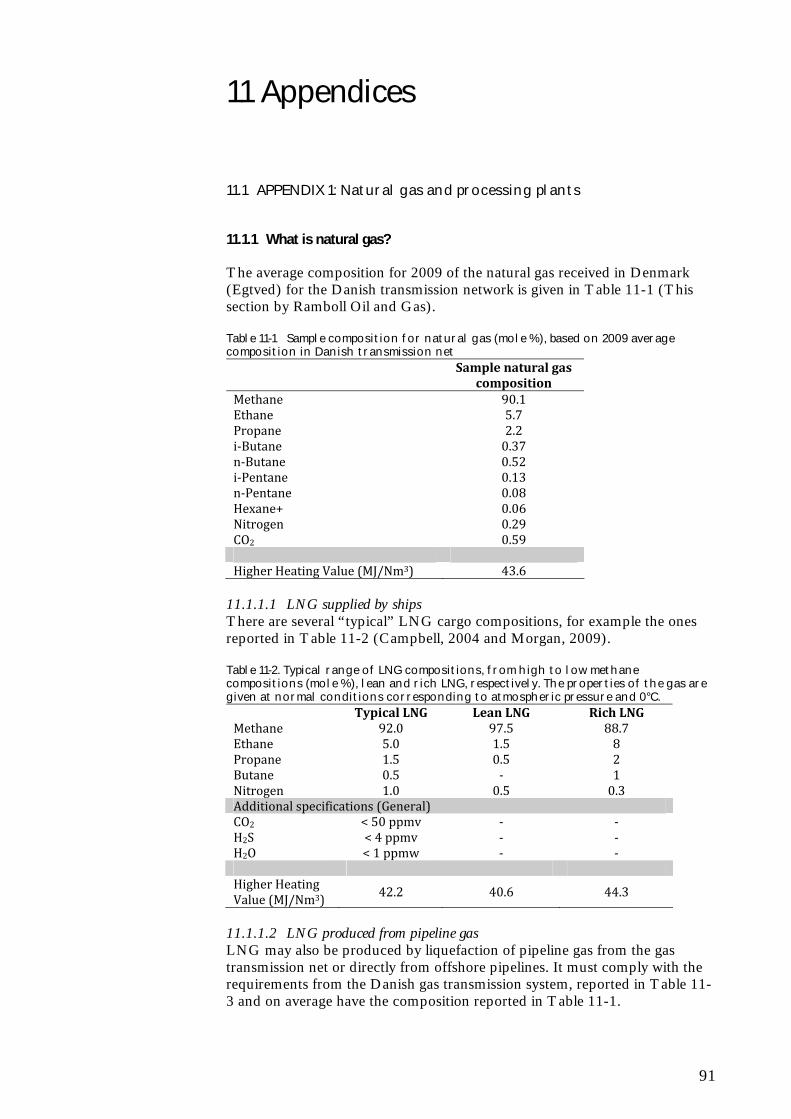
91
11 Appendices
11.1 APPENDIX 1: Natural gas and processing plants
11.1.1 What is natural gas?
The average composition for 2009 of the natural gas received in Denmark (Egtved) for the Danish transmission network is given in Table 11-1 (This section by Ramboll Oil and Gas). Table 11-1 Sample composition for natural gas (mole %), based on 2009 average composition in Danish transmission net
Sample natural gas
composition Methane 90.1 Ethane 5.7 Propane 2.2 i‐Butane 0.37 n‐Butane 0.52 i‐Pentane 0.13 n‐Pentane 0.08 Hexane+ 0.06 Nitrogen 0.29 CO2 0.59 Higher Heating Value (MJ/Nm3) 43.6
11.1.1.1 LNG supplied by ships There are several “typical” LNG cargo compositions, for example the ones reported in Table 11-2 (Campbell, 2004 and Morgan, 2009). Table 11-2. Typical range of LNG compositions, from high to low methane compositions (mole %), lean and rich LNG, respectively. The properties of the gas are given at normal conditions corresponding to atmospheric pressure and 0°C.
Typical LNG Lean LNG Rich LNG Methane 92.0 97.5 88.7 Ethane 5.0 1.5 8 Propane 1.5 0.5 2 Butane 0.5 ‐ 1 Nitrogen 1.0 0.5 0.3 Additional specifications (General) CO2 < 50 ppmv ‐ ‐ H2S < 4 ppmv ‐ ‐ H2O < 1 ppmw ‐ ‐ Higher Heating Value (MJ/Nm3) 42.2 40.6 44.3
11.1.1.2 LNG produced from pipeline gas LNG may also be produced by liquefaction of pipeline gas from the gas transmission net or directly from offshore pipelines. It must comply with the requirements from the Danish gas transmission system, reported in Table 11-3 and on average have the composition reported in Table 11-1.
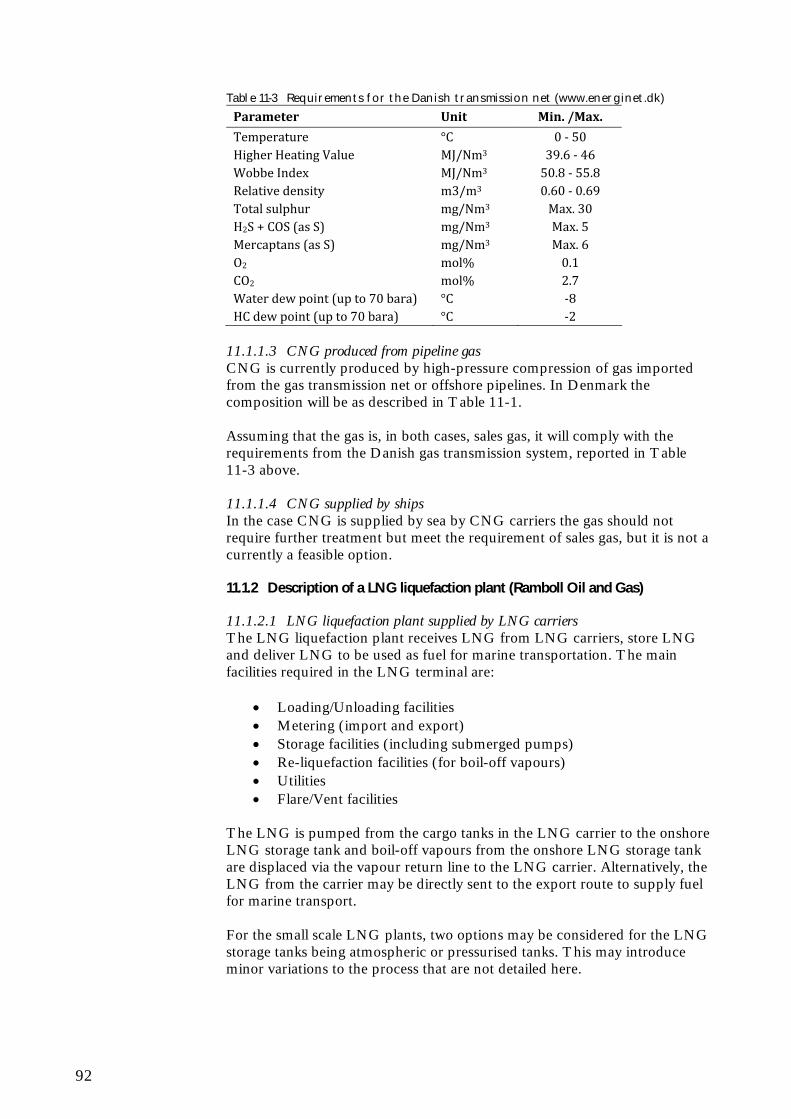
92
Table 11-3 Requirements for the Danish transmission net (www.energinet.dk)
Parameter Unit Min. /Max.
Temperature °C 0 ‐ 50 Higher Heating Value MJ/Nm3 39.6 ‐ 46 Wobbe Index MJ/Nm3 50.8 ‐ 55.8 Relative density m3/m3 0.60 ‐ 0.69 Total sulphur mg/Nm3 Max. 30 H2S + COS (as S) mg/Nm3 Max. 5 Mercaptans (as S) mg/Nm3 Max. 6 O2 mol% 0.1 CO2 mol% 2.7 Water dew point (up to 70 bara) °C ‐8 HC dew point (up to 70 bara) °C ‐2
11.1.1.3 CNG produced from pipeline gas CNG is currently produced by high-pressure compression of gas imported from the gas transmission net or offshore pipelines. In Denmark the composition will be as described in Table 11-1. Assuming that the gas is, in both cases, sales gas, it will comply with the requirements from the Danish gas transmission system, reported in Table 11-3 above. 11.1.1.4 CNG supplied by ships In the case CNG is supplied by sea by CNG carriers the gas should not require further treatment but meet the requirement of sales gas, but it is not a currently a feasible option. 11.1.2 Description of a LNG liquefaction plant (Ramboll Oil and Gas)
11.1.2.1 LNG liquefaction plant supplied by LNG carriers The LNG liquefaction plant receives LNG from LNG carriers, store LNG and deliver LNG to be used as fuel for marine transportation. The main facilities required in the LNG terminal are:
Loading/Unloading facilities Metering (import and export) Storage facilities (including submerged pumps) Re-liquefaction facilities (for boil-off vapours) Utilities Flare/Vent facilities
The LNG is pumped from the cargo tanks in the LNG carrier to the onshore LNG storage tank and boil-off vapours from the onshore LNG storage tank are displaced via the vapour return line to the LNG carrier. Alternatively, the LNG from the carrier may be directly sent to the export route to supply fuel for marine transport. For the small scale LNG plants, two options may be considered for the LNG storage tanks being atmospheric or pressurised tanks. This may introduce minor variations to the process that are not detailed here.
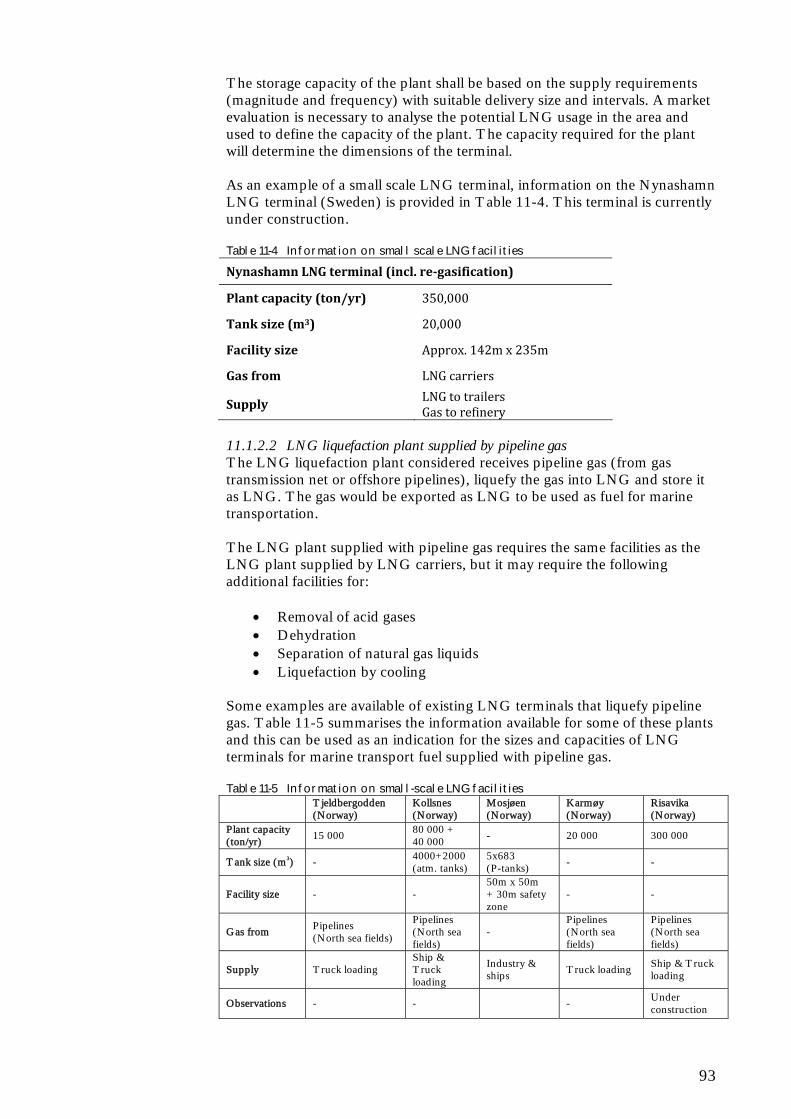
93
The storage capacity of the plant shall be based on the supply requirements (magnitude and frequency) with suitable delivery size and intervals. A market evaluation is necessary to analyse the potential LNG usage in the area and used to define the capacity of the plant. The capacity required for the plant will determine the dimensions of the terminal. As an example of a small scale LNG terminal, information on the Nynashamn LNG terminal (Sweden) is provided in Table 11-4. This terminal is currently under construction. Table 11-4 Information on small scale LNG facilities
Nynashamn LNG terminal (incl. regasification)
Plant capacity (ton/yr) 350,000
Tank size (m3) 20,000
Facility size Approx. 142m x 235m
Gas from LNG carriers
Supply LNG to trailers Gas to refinery
11.1.2.2 LNG liquefaction plant supplied by pipeline gas The LNG liquefaction plant considered receives pipeline gas (from gas transmission net or offshore pipelines), liquefy the gas into LNG and store it as LNG. The gas would be exported as LNG to be used as fuel for marine transportation. The LNG plant supplied with pipeline gas requires the same facilities as the LNG plant supplied by LNG carriers, but it may require the following additional facilities for:
Removal of acid gases Dehydration Separation of natural gas liquids Liquefaction by cooling
Some examples are available of existing LNG terminals that liquefy pipeline gas. Table 11-5 summarises the information available for some of these plants and this can be used as an indication for the sizes and capacities of LNG terminals for marine transport fuel supplied with pipeline gas. Table 11-5 Information on small-scale LNG facilities
Tjeldbergodden (Norway)
Kollsnes (Norway)
Mosjøen (Norway)
Karmøy (Norway)
Risavika (Norway)
Plant capacity (ton/yr)
15 000 80 000 + 40 000
- 20 000 300 000
Tank size (m3) - 4000+2000 (atm. tanks)
5x683 (P-tanks)
- -
Facility size - - 50m x 50m + 30m safety zone
- -
Gas from Pipelines (North sea fields)
Pipelines (North sea fields)
- Pipelines (North sea fields)
Pipelines (North sea fields)
Supply Truck loading Ship & Truck loading
Industry & ships Truck loading Ship & Truck
loading
Observations - - - Under construction
94
In general terms, the total energy losses for processing LNG from the gas well to the final consumer are estimated to be approximately 10-15% of the total gas transported (Valsgaard et al 2004, MAGALOG 2008). The processing of gas into LNG requires approximately 50 MW per Mtpy47 of LNG produced. These numbers are based on base load LNG liquefaction plants. In case of liquefaction of LNG from pipeline gas, a small scale LNG plant is considered and the energy requirements may vary from 0.7 to 0.9 kWh/kg of gas (Lemmers 2009, Mustang 2008), which is equivalent to 80 - 100 MW per Mtpy of gas and depends on the composition of the gas to be liquefied. 11.1.3 Description of CNG compression plant (Ramboll Oil and Gas)
11.1.3.1 CNG compression plant supplied by pipeline An CNG plant is considered that shall be able to receive pipeline gas from gas transmission net (or if relevant offshore pipelines), compress the natural gas to CNG (approx. 200-250 bar), store the CNG in HP containers and export the CNG to be used as fuel for marine transportation. The main facilities required in the CNG compression plant are:
Metering Compression and cooling facilities HP storage facilities Utilities Flare/vent facilities
Moreover, quay facilities will be required if CNG is to be supplied to/from ships. The natural gas from the pipeline enters the terminal through the metering system and is routed to the compressor. In the compressor, the pressure of the gas is increased to the required CNG pressure (approx. 200-250 bar) and the compressed gas is then cooled to ambient temperature in the compressor after-cooler. The CNG at ambient temperature is sent to the HP containers for storage and export. An example of existing CNG plants is from Kollsnes (Bergen, Norway). This plant can store 8-10 Mm3 of CNG that is transported by trailer to supply industry, housing and fuel for busses (Norges Vassdrags- og Energidirektorat, 2004). In the case of CNG, the total energy losses from gas well to the consumer are estimated to be approximately 5-8% of the total gas transported48 (Valsgaard et al 2004), when considering CNG maritime transportation. When considering the processing of pipeline gas into CNG, the energy required is approximately 6 MW per Mtpy of CNG.
47 Million ton per year 48 According to Asger Myken, DONG, this is a conservative estimate, The power consumption for CNG production for use in cars is 2-3%.
95
11.1.3.2 Liquid compressed natural gas facility (LCNG) The LCNG plant considered is able to receive LNG from LNG carriers, store LNG and deliver either LNG or CNG to be used as fuel for marine transportation. The LCNG plant described in this section considers LNG received from LNG carriers. The differences involving a plant receiving LNG from pipeline have been described above and can also be applied here. The main facilities required in the LCNG terminal are:
Loading/unloading facilities Metering (import/export) LNG storage facilities (including submerged pumps) Re-liquefaction facilities (for boil-off vapours) Re-gasification facilities (vapourisers) Compression and cooling facilities HP storage facilities Utilities Flare/vent facilities
The LNG is pumped from the cargo tanks in the LNG carrier to the onshore LNG storage tank and boil-off vapours from the onshore LNG storage tank are displaced via the vapour return line to the LNG carrier. Alternatively, the LNG from the carrier may be directly sent to the export route to supply fuel for marine transport. In case of CNG export required, the LNG from the storage tanks is pumped to the re-gasification facilities where the LNG is vaporised. The outlet gas is then sent to the CNG compression facilities (including compression and cooling) and the CNG is stored in HP storage facilities. 11.1.4 References
Campbell, JM (2004) Gas conditioning and processing, vol. II, 8th ed., John M Egtved Environment and Quality CMP, Lennart Hall Lemmers SPB (2009) Designing the LNG terminal of the future, Hydrocarbon Processing, September 2009 MARINTEK (2008) The overall aspects of an LNG supply chain with starting point at Kollsnes and alternative sources Morgan, J (2009) LNG - Roaring ahead. Where will it end? SPE Distinguished Lecturer Series, Copenhagen, 11-02-2009. Mustang (2008) LNG Smart® Liquefaction Technologies, International Gas Union Research Conference, October 2008 Norges Vassdrags- og Energidirektorat, 2004
96
Valsgaard et al. (2004) The Development of a Compressed Natural Gas Carrier. The 9th International Symposium on Practical Design of Ships and Other Floating Structures”, PRADS 2004
11.2 APPENDIX 2: Basic gas engine and distribution information
This section is mainly contributed by DNV and provides details regarding the applications regarding ships. Natural gas can be contained in different states with different attributes as shown in the figure below. Natural gas at atmospheric pressure and room temperature has a very low energy density, and hence a large volume. In ships the space available for fuel tanks is generally limited, so as high as possible energy density for the fuel is preferable. Cooling the gas to the point of liquefaction and applying a moderate pressure increases the energy density 600 times. Still this is only about half the energy density of oil. Compressing the gas to 200 bar instead of cooling it also significantly increases the energy density. This is what is called Compressed Natural Gas (CNG). LNG is however the most volume-effective of the two options. In short, LNG requires approximately 2 times the fuel volume of oil, and CNG (at 200 bar) requires 5 times the volume of oil. In addition the added insulation and sub optimal tank shape of LNG and CNG further increases the tank requirement for a given ship and sailing range. One very significant implication of choosing CNG as fuel is that these tanks must be placed on deck due to safety precautions of the high pressure. 11.2.1 LNG propulsion in ships
The four main suppliers of gas engines are Rolls-Royce, Wärtsilä, Mitsubishi and MAN. Rolls-Royce and Wärtsilä are also suppliers of complete engine and propulsion design and supply packages as well as complete ship designs. Wärtsilä and MAN are the main suppliers of dual fuel engines whereas Rolls-Royce and Mitsubishi are the main suppliers of gas engines. In the table presented below the engine maker is also specified for each existing LNG fuelled ship. The world’s first ferry with LNG propulsion was to DNV class. MF Glutra was built in 2000, and since then many ships have been built (see table below). So far, all ships (other than gas carriers) built with LNG propulsion have been built to DNV class. A complete list of ships currently in DNV class is shown below. An additional 6 ships to DNV class are currently under construction and two small LNG fuelled gas carriers are regularly operating in Norwegian waters (one DNV and one BV class).
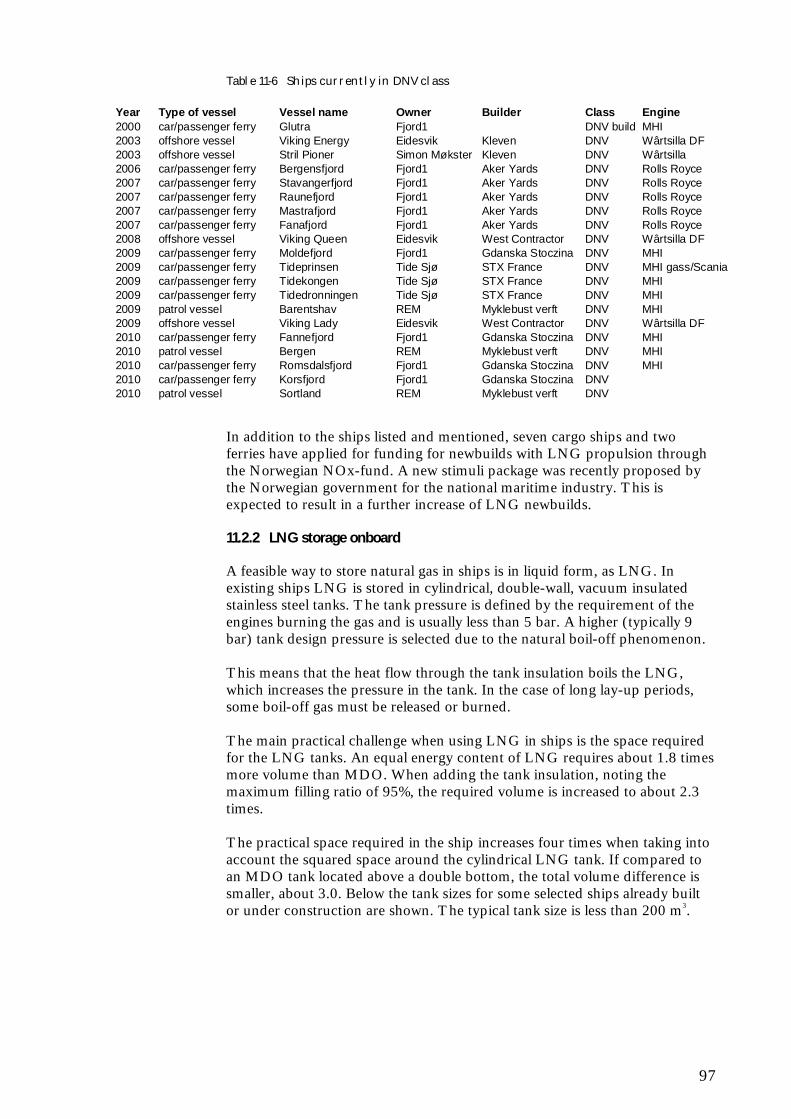
97
Table 11-6 Ships currently in DNV class
In addition to the ships listed and mentioned, seven cargo ships and two ferries have applied for funding for newbuilds with LNG propulsion through the Norwegian NOx-fund. A new stimuli package was recently proposed by the Norwegian government for the national maritime industry. This is expected to result in a further increase of LNG newbuilds. 11.2.2 LNG storage onboard
A feasible way to store natural gas in ships is in liquid form, as LNG. In existing ships LNG is stored in cylindrical, double-wall, vacuum insulated stainless steel tanks. The tank pressure is defined by the requirement of the engines burning the gas and is usually less than 5 bar. A higher (typically 9 bar) tank design pressure is selected due to the natural boil-off phenomenon. This means that the heat flow through the tank insulation boils the LNG, which increases the pressure in the tank. In the case of long lay-up periods, some boil-off gas must be released or burned. The main practical challenge when using LNG in ships is the space required for the LNG tanks. An equal energy content of LNG requires about 1.8 times more volume than MDO. When adding the tank insulation, noting the maximum filling ratio of 95%, the required volume is increased to about 2.3 times. The practical space required in the ship increases four times when taking into account the squared space around the cylindrical LNG tank. If compared to an MDO tank located above a double bottom, the total volume difference is smaller, about 3.0. Below the tank sizes for some selected ships already built or under construction are shown. The typical tank size is less than 200 m3.
Year Type of vessel Vessel name Owner Builder Class Engine2000 car/passenger ferry Glutra Fjord1 DNV build MHI2003 offshore vessel Viking Energy Eidesvik Kleven DNV Wârtsilla DF2003 offshore vessel Stril Pioner Simon Møkster Kleven DNV Wârtsilla 2006 car/passenger ferry Bergensfjord Fjord1 Aker Yards DNV Rolls Royce2007 car/passenger ferry Stavangerfjord Fjord1 Aker Yards DNV Rolls Royce2007 car/passenger ferry Raunefjord Fjord1 Aker Yards DNV Rolls Royce2007 car/passenger ferry Mastrafjord Fjord1 Aker Yards DNV Rolls Royce2007 car/passenger ferry Fanafjord Fjord1 Aker Yards DNV Rolls Royce2008 offshore vessel Viking Queen Eidesvik West Contractor DNV Wârtsilla DF2009 car/passenger ferry Moldefjord Fjord1 Gdanska Stoczina DNV MHI 2009 car/passenger ferry Tideprinsen Tide Sjø STX France DNV MHI gass/Scania2009 car/passenger ferry Tidekongen Tide Sjø STX France DNV MHI 2009 car/passenger ferry Tidedronningen Tide Sjø STX France DNV MHI 2009 patrol vessel Barentshav REM Myklebust verft DNV MHI2009 offshore vessel Viking Lady Eidesvik West Contractor DNV Wârtsilla DF2010 car/passenger ferry Fannefjord Fjord1 Gdanska Stoczina DNV MHI 2010 patrol vessel Bergen REM Myklebust verft DNV MHI2010 car/passenger ferry Romsdalsfjord Fjord1 Gdanska Stoczina DNV MHI 2010 car/passenger ferry Korsfjord Fjord1 Gdanska Stoczina DNV2010 patrol vessel Sortland REM Myklebust verft DNV
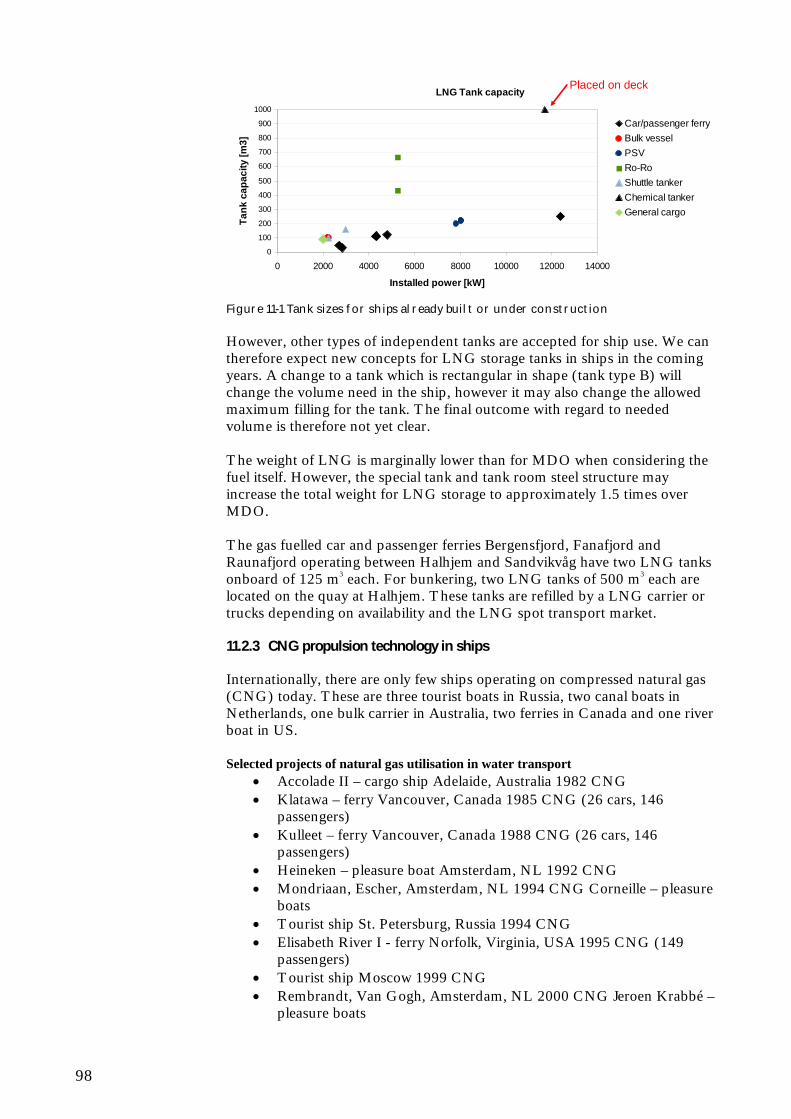
98
LNG Tank capacity
0
100
200
300
400
500
600
700
800
900
1000
0 2000 4000 6000 8000 10000 12000 14000
Installed power [kW]
Ta
nk
ca
pa
cit
y [
m3
]
Car/passenger ferry
Bulk vessel
PSV
Ro-Ro
Shuttle tanker
Chemical tanker
General cargo
Placed on deckLNG Tank capacity
0
100
200
300
400
500
600
700
800
900
1000
0 2000 4000 6000 8000 10000 12000 14000
Installed power [kW]
Ta
nk
ca
pa
cit
y [
m3
]
Car/passenger ferry
Bulk vessel
PSV
Ro-Ro
Shuttle tanker
Chemical tanker
General cargo
Placed on deck
Figure 11-1 Tank sizes for ships already built or under construction However, other types of independent tanks are accepted for ship use. We can therefore expect new concepts for LNG storage tanks in ships in the coming years. A change to a tank which is rectangular in shape (tank type B) will change the volume need in the ship, however it may also change the allowed maximum filling for the tank. The final outcome with regard to needed volume is therefore not yet clear. The weight of LNG is marginally lower than for MDO when considering the fuel itself. However, the special tank and tank room steel structure may increase the total weight for LNG storage to approximately 1.5 times over MDO. The gas fuelled car and passenger ferries Bergensfjord, Fanafjord and Raunafjord operating between Halhjem and Sandvikvåg have two LNG tanks onboard of 125 m3 each. For bunkering, two LNG tanks of 500 m3 each are located on the quay at Halhjem. These tanks are refilled by a LNG carrier or trucks depending on availability and the LNG spot transport market. 11.2.3 CNG propulsion technology in ships
Internationally, there are only few ships operating on compressed natural gas (CNG) today. These are three tourist boats in Russia, two canal boats in Netherlands, one bulk carrier in Australia, two ferries in Canada and one river boat in US. Selected projects of natural gas utilisation in water transport
Accolade II – cargo ship Adelaide, Australia 1982 CNG Klatawa – ferry Vancouver, Canada 1985 CNG (26 cars, 146
passengers) Kulleet – ferry Vancouver, Canada 1988 CNG (26 cars, 146
passengers) Heineken – pleasure boat Amsterdam, NL 1992 CNG Mondriaan, Escher, Amsterdam, NL 1994 CNG Corneille – pleasure
boats Tourist ship St. Petersburg, Russia 1994 CNG Elisabeth River I - ferry Norfolk, Virginia, USA 1995 CNG (149
passengers) Tourist ship Moscow 1999 CNG Rembrandt, Van Gogh, Amsterdam, NL 2000 CNG Jeroen Krabbé –
pleasure boats
99
11.2.4 CNG storage onboard
The Canadian ferries are refuelled twice a day using about 3-4 minutes each time. The on-shore compressor station store the gas at 250 bar, filling the on board storage to about 160 bar (Sintef 2008). Compared with LNG, an equal energy content of CNG requires almost 2.5 times more volume, thus requiring at least 5 times the storage space of MDO. 11.2.5 Bunkering configuration in Norway
For the Norwegian gas fuelled car and passenger ferry Glutra, the two LNG tanks onboard are 32 m3
each. Refuelling takes place every 4-5 days. Having this storage capacity onboard, storage at the ferry berth was not necessary. This cut down on investment costs and provided some freedom regarding where to put the ferry in service. The refuelling takes place when the ferry is docked for the night and no passengers are onboard. Refuelling time is about one hour for a truckload of 40 m3 of LNG. The truck connects to the filling station through a hatch at the shipside (Sintef 2008). For the Norwegian gas fuelled passenger ferries Tidekongen, Tidedronningen and Tideprinsessen operating from Oslo, the LNG tank onboard is 29 m3. The ships are fuelled approximately once a week from a dedicated truck with typically 50 m3 capacity. 11.2.6 Fuel cells on ships
A fuel cell converts the chemically stored energy in a fuel directly to electricity through a reaction with oxygen in the air. The process taking place is very similar to an ordinary battery, but with the important distinction that a fuel cell does not need to be recharged. It operates as long as it is supplied with a suitable fuel, for instance hydrogen, natural gas, LPG, methanol or biogas. Fuel cells have two major advantages over conventional power generators; they are clean and efficient. Water is the only “waste product” from a fuel cell run on hydrogen. If a carbon containing fuel is used, such as natural gas or methanol, the exhaust include CO2, however reduced by up to 50% compared to a diesel engine run on marine gas oil. FellowSHIP is a joint industry R&D project to develop maritime fuel cell power packs based on leading Norwegian maritime industry in synergy with state-of-art fuel cell technology. Besides DNV, the project includes equipment supplier Wärtsilä Norway, shipowner Eidesvik, ship design office Vik-Sandvik and MTU Onsite Energy of Germany as fuel cell vendor. The power packs will be of 330 kW based on molten carbonate fuel cell technology. Fuel cells of this power size have never before been installed in merchant vessels, and the project is innovative on a world scale. FellowSHIP phase I was initiated in 2003 and included a feasibility study, developments of concepts and initial design studies. Phase II (2007-2010) will finalise development of the “marinified” fuel cell power package integrated with new electro-, power electronics- and control system technology. The project will include testing and verification of the new power pack onshore. Final qualification tests onboard an offshore supply vessel are conducted for the stringent requirements of marine and offshore power industries. The ship used will be the Viking Lady, sister vessel to the Viking Queen. The power package will be run on LNG as fuel. In addition, the project will include extensive amount of
100
work in connection with integration of the power package in the ship, and safety and reliability studies together with approval and rule developments. The project receives support from Norwegian Research Council and Innovation Norway. 11.2.7 Regulations
Some relevant regulations, standards and procedures are listed in the table below. Table 11-7 Relevant regulations, standards an d procedures Relevant regulations, standards and procedures Comments Publisher DNV’s rules for Gas Fuelled Engine Installations
Applies to the receiving ship using LNG as fuel
DNV
IGC Code Applies to the LNG carrier/bunker ship
IMO
International Code of Safety for Gas-fuelled Ships (IGF) Code
Based on DNV’s rules for Gas Fuelled Engine Installations
IMO
Ship to ship transfer guide (Liquefied Gas) Applies to transfering of LNG between ships
ICS, OCIMF, SIGTTO
Local land based rules/regulations E.g Green bunkering (Göteborg)
MARPOL Annex VI: Prevention of air pollution by ships (SOx Emission Control Areas, SECA)
Both the Baltic Sea and the North Sea are SECA. Highly likely that this will be extended to apply to other emissions such as NOx and PM in the future.
IMO
EU Directive 2003/55/EC on LNG EU
11.2.8 Distribution of LNG
This section looks into LNG onshore infrastructure, what is available in Norway and Europe today and what is needed and realistic with regards to development of a LNG distribution network for supply as fuel for a fleet of short sea vessels in the near future. Over the past four decades LNG trade has grown to become a large and flexible market with good access to spot cargos. Thus, the availability of LNG is not going to be a limiting factor for a potential growth in the distribution and consumption of natural gas along the Norwegian coast. It is rather a matter of establishing price mechanisms encouraging the necessary development in infrastructure and logistics. Currently, lower prices are normally achieved by undertaking longer term contracts based on regular delivery intervals. The current low spot price of LNG allows for robust margins for the participants in the supply chain. The expected growth in natural gas demand can either be met by expansion of small scale liquefaction capacity in Norway or by imports from the international LNG spot market. The following chapters identify the LNG distribution infrastructure in Norway today and give some alternative solutions to achieve easy availability of LNG fuel for short sea transport vessels. 11.2.8.1 Current LNG infrastructure LNG as a bunker fuel is already introduced in Norway. LNG is transported either by small scale LNG carriers or by truck from regional LNG production
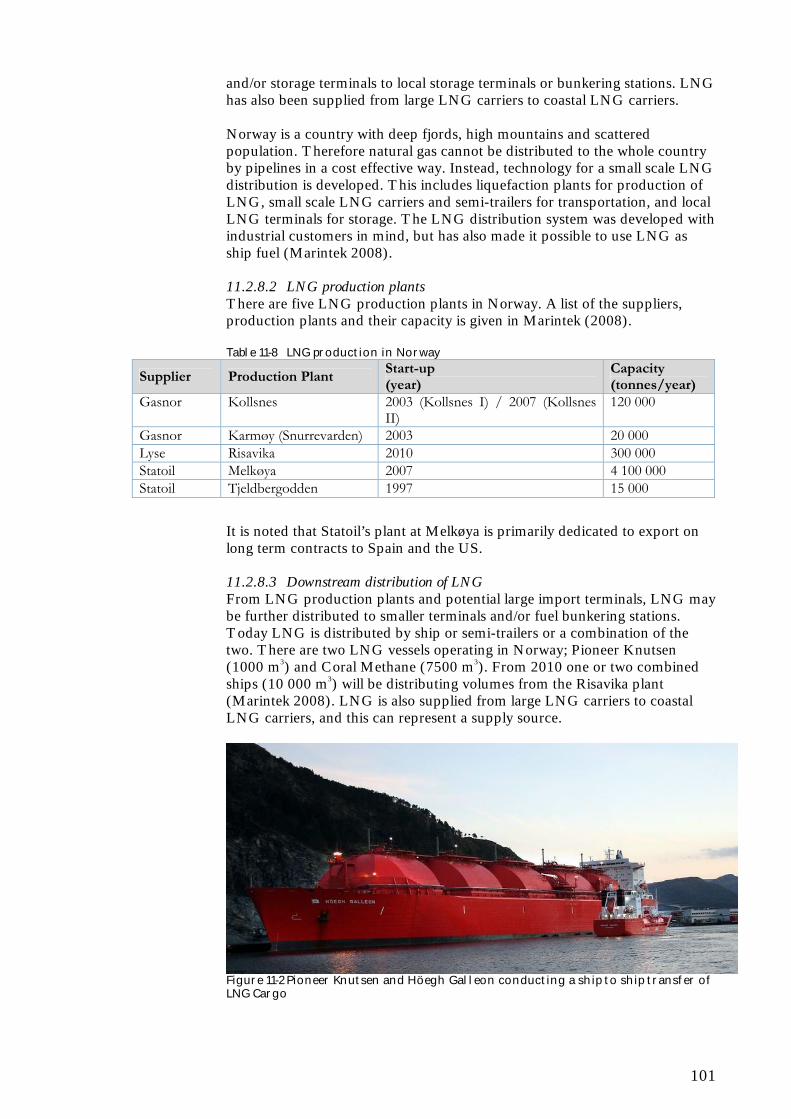
101
and/or storage terminals to local storage terminals or bunkering stations. LNG has also been supplied from large LNG carriers to coastal LNG carriers. Norway is a country with deep fjords, high mountains and scattered population. Therefore natural gas cannot be distributed to the whole country by pipelines in a cost effective way. Instead, technology for a small scale LNG distribution is developed. This includes liquefaction plants for production of LNG, small scale LNG carriers and semi-trailers for transportation, and local LNG terminals for storage. The LNG distribution system was developed with industrial customers in mind, but has also made it possible to use LNG as ship fuel (Marintek 2008). 11.2.8.2 LNG production plants There are five LNG production plants in Norway. A list of the suppliers, production plants and their capacity is given in Marintek (2008). Table 11-8 LNG production in Norway
Supplier Production Plant Start-up (year)
Capacity (tonnes/year)
Gasnor Kollsnes 2003 (Kollsnes I) / 2007 (Kollsnes II)
120 000
Gasnor Karmøy (Snurrevarden) 2003 20 000 Lyse Risavika 2010 300 000 Statoil Melkøya 2007 4 100 000 Statoil Tjeldbergodden 1997 15 000
It is noted that Statoil’s plant at Melkøya is primarily dedicated to export on long term contracts to Spain and the US. 11.2.8.3 Downstream distribution of LNG From LNG production plants and potential large import terminals, LNG may be further distributed to smaller terminals and/or fuel bunkering stations. Today LNG is distributed by ship or semi-trailers or a combination of the two. There are two LNG vessels operating in Norway; Pioneer Knutsen (1000 m3) and Coral Methane (7500 m3). From 2010 one or two combined ships (10 000 m3) will be distributing volumes from the Risavika plant (Marintek 2008). LNG is also supplied from large LNG carriers to coastal LNG carriers, and this can represent a supply source.
Figure 11-2 Pioneer Knutsen and Höegh Galleon conducting a ship to ship transfer of LNG Cargo
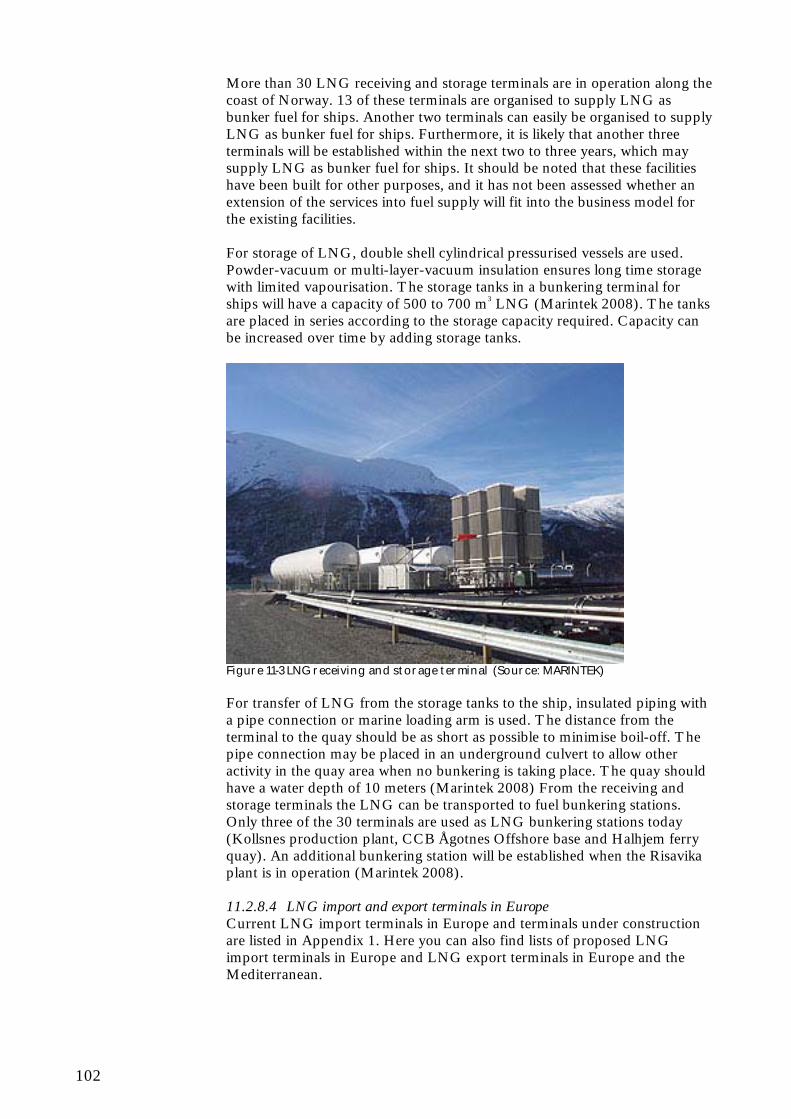
102
More than 30 LNG receiving and storage terminals are in operation along the coast of Norway. 13 of these terminals are organised to supply LNG as bunker fuel for ships. Another two terminals can easily be organised to supply LNG as bunker fuel for ships. Furthermore, it is likely that another three terminals will be established within the next two to three years, which may supply LNG as bunker fuel for ships. It should be noted that these facilities have been built for other purposes, and it has not been assessed whether an extension of the services into fuel supply will fit into the business model for the existing facilities. For storage of LNG, double shell cylindrical pressurised vessels are used. Powder-vacuum or multi-layer-vacuum insulation ensures long time storage with limited vapourisation. The storage tanks in a bunkering terminal for ships will have a capacity of 500 to 700 m3 LNG (Marintek 2008). The tanks are placed in series according to the storage capacity required. Capacity can be increased over time by adding storage tanks.
Figure 11-3 LNG receiving and storage terminal (Source: MARINTEK) For transfer of LNG from the storage tanks to the ship, insulated piping with a pipe connection or marine loading arm is used. The distance from the terminal to the quay should be as short as possible to minimise boil-off. The pipe connection may be placed in an underground culvert to allow other activity in the quay area when no bunkering is taking place. The quay should have a water depth of 10 meters (Marintek 2008) From the receiving and storage terminals the LNG can be transported to fuel bunkering stations. Only three of the 30 terminals are used as LNG bunkering stations today (Kollsnes production plant, CCB Ågotnes Offshore base and Halhjem ferry quay). An additional bunkering station will be established when the Risavika plant is in operation (Marintek 2008). 11.2.8.4 LNG import and export terminals in Europe Current LNG import terminals in Europe and terminals under construction are listed in Appendix 1. Here you can also find lists of proposed LNG import terminals in Europe and LNG export terminals in Europe and the Mediterranean.
103
11.2.8.5 Availability of LNG Over the past four decades LNG trade has grown to become a large and flexible market with good access to spot cargos. This means that the availability of LNG is not going to be a limiting factor for a potential growth in the distribution and consumption of natural gas along the Norwegian coast line. It is rather a matter of establishing price mechanisms encouraging the necessary development in infrastructure and logistics. In essence, a standard size cargo of LNG can be bought at any point in time; it is a matter of price. Lower prices are normally achieved by undertaking longer term contracts based on regular delivery intervals. The current low spot price of LNG allows for robust margins for the participants in the supply chain. The expected growth in natural gas demand can either be met by expansion of small scale liquefaction capacity in Norway or by imports from the international LNG spot market. 11.2.8.6 Transportation of LNG It is logical to expect that future transportation of LNG from production sites or from larger carriers will be done by the same type of small LNG carriers serving a range of terminals and bunkering stations along the coast today. Construction time for these ships is such that it can be expected that shipowners will be able to react to the market needs in due time for demand growth. In high demand periods, smaller distribution vessels can load their cargos directly off larger LNG carriers, reducing the need for overcapacity of production and storage in the Norwegian terminals. 11.2.8.7 Downstream distribution Based on both safety acceptance levels and logistical issues, it is unlikely that any large number of ships can bunker directly from the LNG production sites or any potential import terminal. Further, the distribution infrastructure that has been established so far appears to be dedicated to certain consumers. Most of the terminals are dedicated to supply natural gas to nearby industry, or to ferries. These are not built with sufficient capacity and do not have the quay infrastructure necessary to offer LNG as bunkers for merchant vessels. Distribution of LNG as fuel is considered most realistic through the distribution system that is already established for ship bunkering. The coast line is scattered with bunker stations operated by Statoil, Shell, and the other oil and gas companies. These bunkering stations offer various qualities of hydrocarbon fuels, and many of them should be able to establish the necessary equipment to also offer LNG without extensive investment needs. They have the quay capacities, the safety zones, and the operational procedures in place for this type of operations, hence they should be much better suited locations than various ferry quays and harbours not previously used for this purpose. From a safety perspective, bunker stations already have risk acceptance levels and safety zones in place, and it is not expected that LNG operations will have a large impact on these parameters. 11.2.8.8 LNG tanks on quay As mentioned earlier, ships currently operating on LNG in Norway are either served by dedicated trucks or stationary LNG tanks on the quay. The stationary tanks are in turn served by either trucks or small LNG carriers. The tanks on the quay serving three sister ferries with 12 MW power installed each
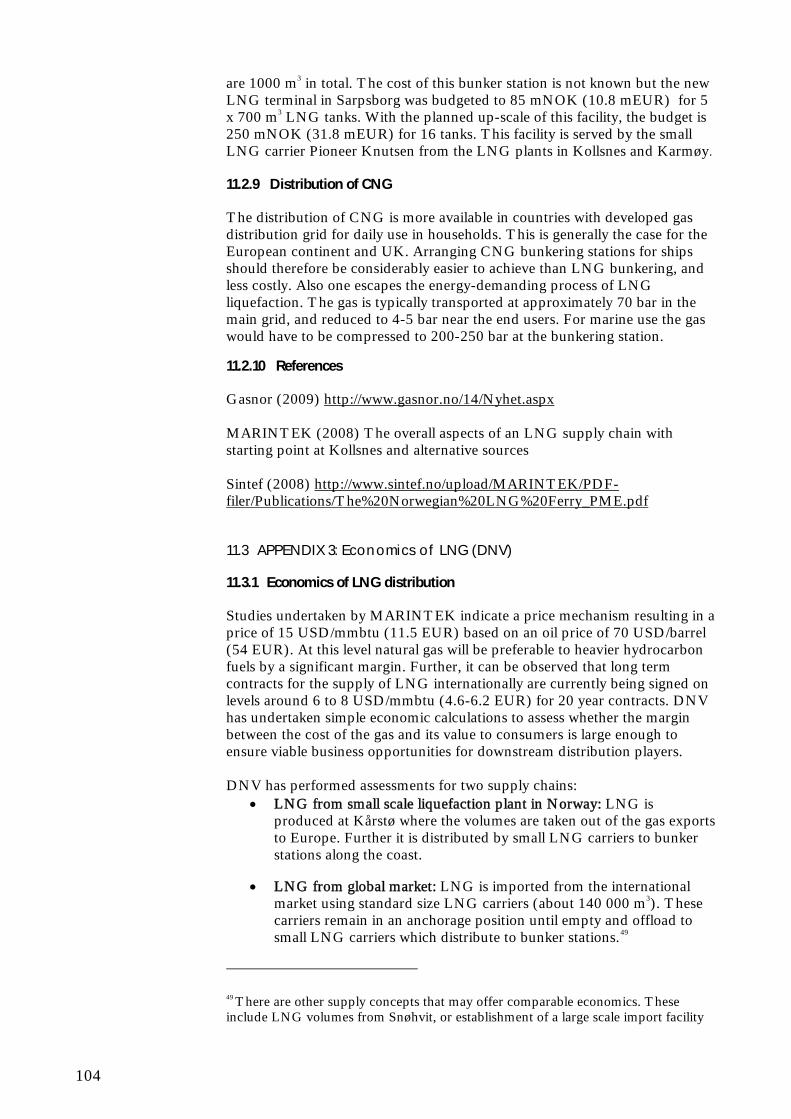
104
are 1000 m3 in total. The cost of this bunker station is not known but the new LNG terminal in Sarpsborg was budgeted to 85 mNOK (10.8 mEUR) for 5 x 700 m3 LNG tanks. With the planned up-scale of this facility, the budget is 250 mNOK (31.8 mEUR) for 16 tanks. This facility is served by the small LNG carrier Pioneer Knutsen from the LNG plants in Kollsnes and Karmøy.
11.2.9 Distribution of CNG
The distribution of CNG is more available in countries with developed gas distribution grid for daily use in households. This is generally the case for the European continent and UK. Arranging CNG bunkering stations for ships should therefore be considerably easier to achieve than LNG bunkering, and less costly. Also one escapes the energy-demanding process of LNG liquefaction. The gas is typically transported at approximately 70 bar in the main grid, and reduced to 4-5 bar near the end users. For marine use the gas would have to be compressed to 200-250 bar at the bunkering station. 11.2.10 References
Gasnor (2009) http://www.gasnor.no/14/Nyhet.aspx MARINTEK (2008) The overall aspects of an LNG supply chain with starting point at Kollsnes and alternative sources Sintef (2008) http://www.sintef.no/upload/MARINTEK/PDF-filer/Publications/The%20Norwegian%20LNG%20Ferry_PME.pdf
11.3 APPENDIX 3: Economics of LNG (DNV)
11.3.1 Economics of LNG distribution
Studies undertaken by MARINTEK indicate a price mechanism resulting in a price of 15 USD/mmbtu (11.5 EUR) based on an oil price of 70 USD/barrel (54 EUR). At this level natural gas will be preferable to heavier hydrocarbon fuels by a significant margin. Further, it can be observed that long term contracts for the supply of LNG internationally are currently being signed on levels around 6 to 8 USD/mmbtu (4.6-6.2 EUR) for 20 year contracts. DNV has undertaken simple economic calculations to assess whether the margin between the cost of the gas and its value to consumers is large enough to ensure viable business opportunities for downstream distribution players. DNV has performed assessments for two supply chains:
LNG from small scale liquefaction plant in Norway: LNG is produced at Kårstø where the volumes are taken out of the gas exports to Europe. Further it is distributed by small LNG carriers to bunker stations along the coast.
LNG from global market: LNG is imported from the international market using standard size LNG carriers (about 140 000 m3). These carriers remain in an anchorage position until empty and offload to small LNG carriers which distribute to bunker stations.49
49 There are other supply concepts that may offer comparable economics. These include LNG volumes from Snøhvit, or establishment of a large scale import facility
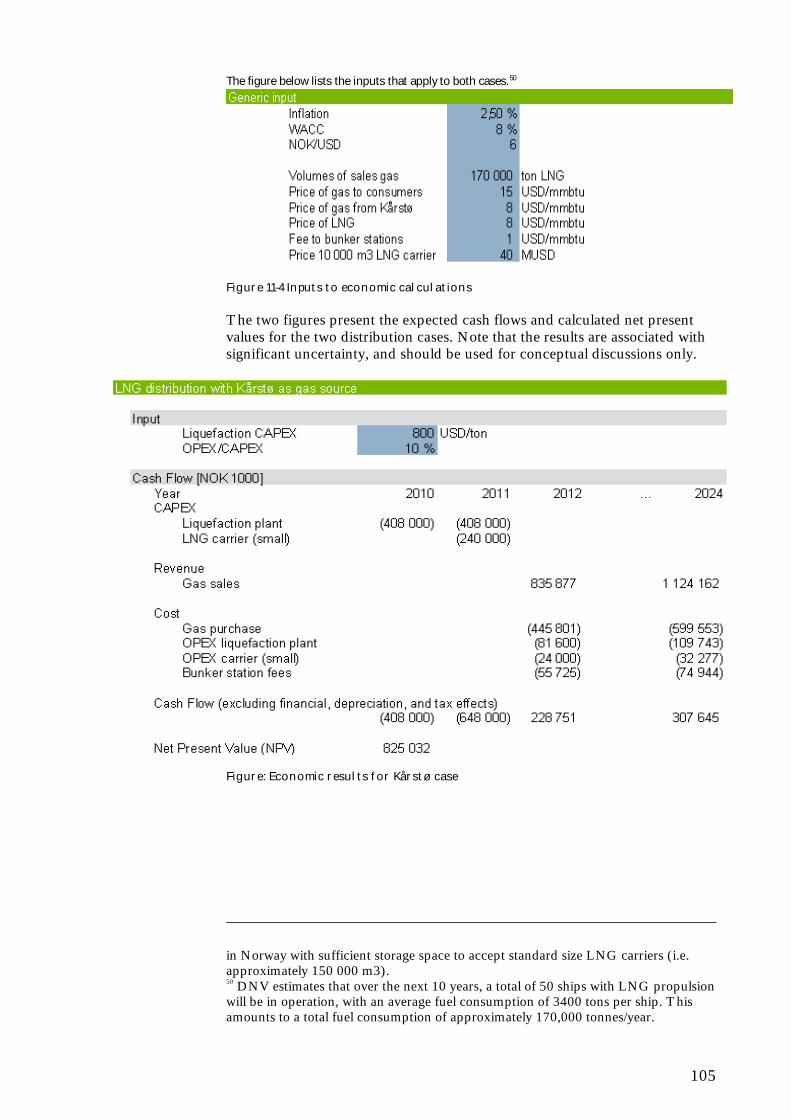
105
The figure below lists the inputs that apply to both cases.50
Figure 11-4 Inputs to economic calculations The two figures present the expected cash flows and calculated net present values for the two distribution cases. Note that the results are associated with significant uncertainty, and should be used for conceptual discussions only.
Figure: Economic results for Kårstø case
in Norway with sufficient storage space to accept standard size LNG carriers (i.e. approximately 150 000 m3). 50 DNV estimates that over the next 10 years, a total of 50 ships with LNG propulsion will be in operation, with an average fuel consumption of 3400 tons per ship. This amounts to a total fuel consumption of approximately 170,000 tonnes/year.
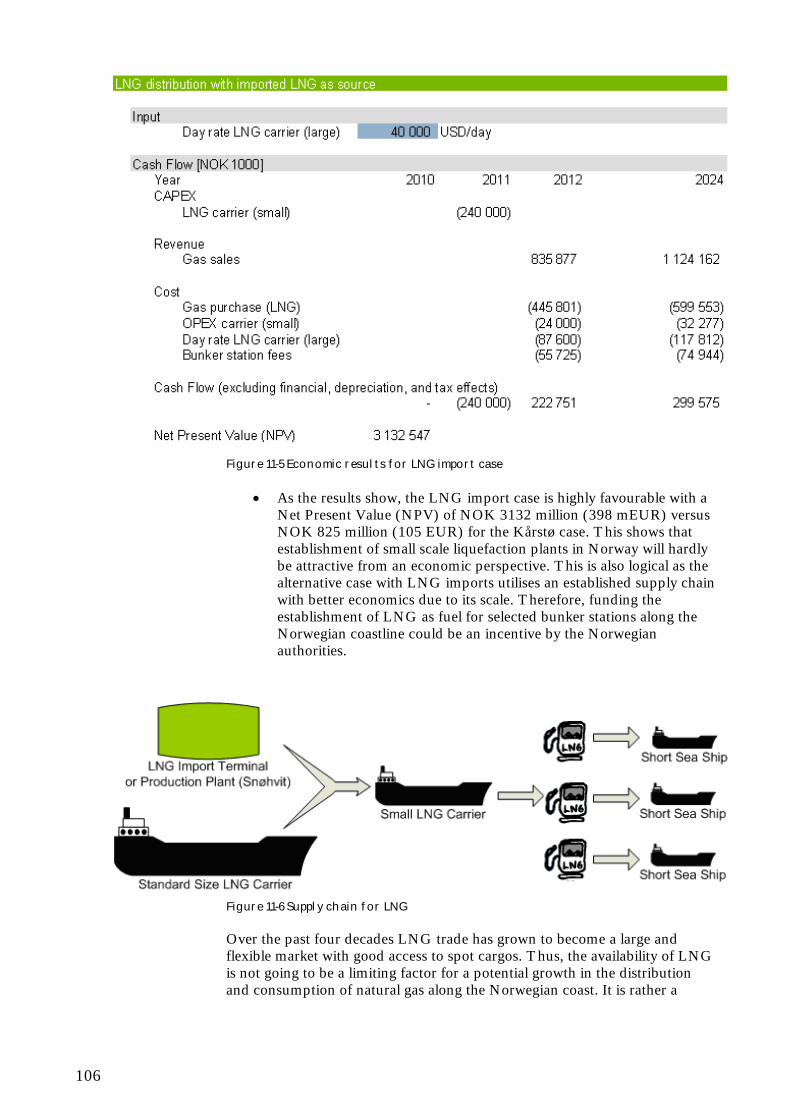
106
Figure 11-5 Economic results for LNG import case
As the results show, the LNG import case is highly favourable with a Net Present Value (NPV) of NOK 3132 million (398 mEUR) versus NOK 825 million (105 EUR) for the Kårstø case. This shows that establishment of small scale liquefaction plants in Norway will hardly be attractive from an economic perspective. This is also logical as the alternative case with LNG imports utilises an established supply chain with better economics due to its scale. Therefore, funding the establishment of LNG as fuel for selected bunker stations along the Norwegian coastline could be an incentive by the Norwegian authorities.
Figure 11-6 Supply chain for LNG Over the past four decades LNG trade has grown to become a large and flexible market with good access to spot cargos. Thus, the availability of LNG is not going to be a limiting factor for a potential growth in the distribution and consumption of natural gas along the Norwegian coast. It is rather a
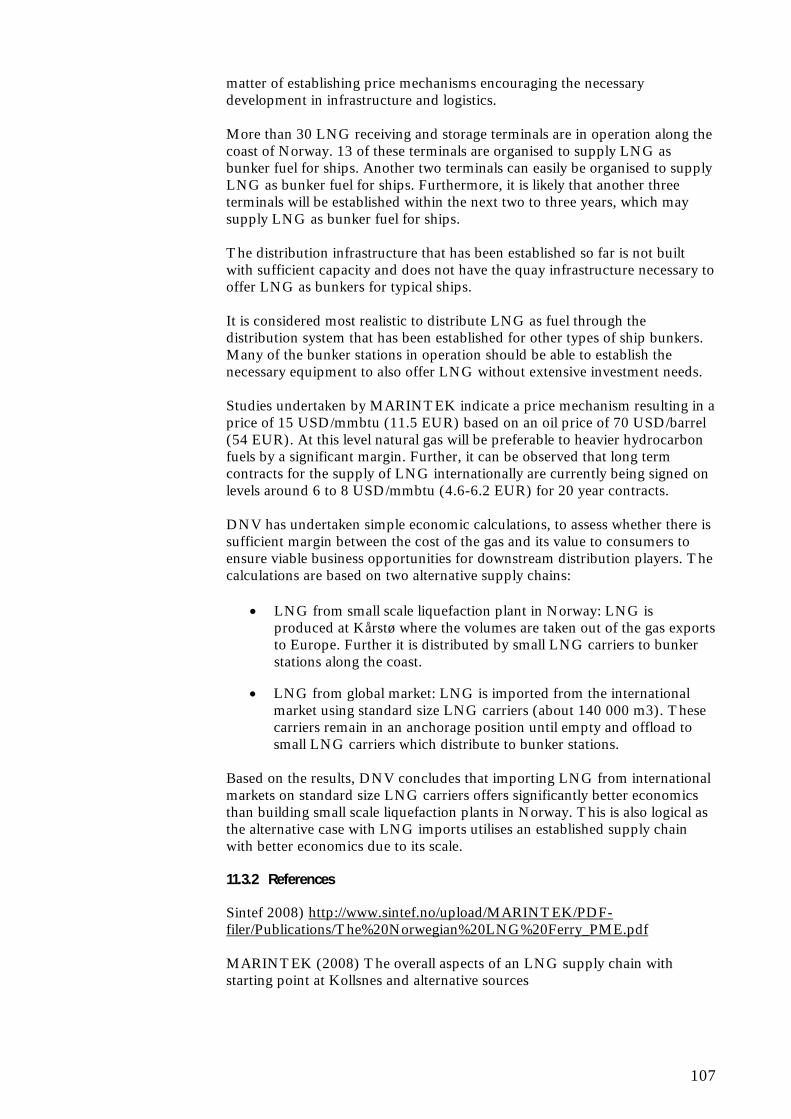
107
matter of establishing price mechanisms encouraging the necessary development in infrastructure and logistics. More than 30 LNG receiving and storage terminals are in operation along the coast of Norway. 13 of these terminals are organised to supply LNG as bunker fuel for ships. Another two terminals can easily be organised to supply LNG as bunker fuel for ships. Furthermore, it is likely that another three terminals will be established within the next two to three years, which may supply LNG as bunker fuel for ships. The distribution infrastructure that has been established so far is not built with sufficient capacity and does not have the quay infrastructure necessary to offer LNG as bunkers for typical ships. It is considered most realistic to distribute LNG as fuel through the distribution system that has been established for other types of ship bunkers. Many of the bunker stations in operation should be able to establish the necessary equipment to also offer LNG without extensive investment needs. Studies undertaken by MARINTEK indicate a price mechanism resulting in a price of 15 USD/mmbtu (11.5 EUR) based on an oil price of 70 USD/barrel (54 EUR). At this level natural gas will be preferable to heavier hydrocarbon fuels by a significant margin. Further, it can be observed that long term contracts for the supply of LNG internationally are currently being signed on levels around 6 to 8 USD/mmbtu (4.6-6.2 EUR) for 20 year contracts. DNV has undertaken simple economic calculations, to assess whether there is sufficient margin between the cost of the gas and its value to consumers to ensure viable business opportunities for downstream distribution players. The calculations are based on two alternative supply chains:
LNG from small scale liquefaction plant in Norway: LNG is produced at Kårstø where the volumes are taken out of the gas exports to Europe. Further it is distributed by small LNG carriers to bunker stations along the coast.
LNG from global market: LNG is imported from the international market using standard size LNG carriers (about 140 000 m3). These carriers remain in an anchorage position until empty and offload to small LNG carriers which distribute to bunker stations.
Based on the results, DNV concludes that importing LNG from international markets on standard size LNG carriers offers significantly better economics than building small scale liquefaction plants in Norway. This is also logical as the alternative case with LNG imports utilises an established supply chain with better economics due to its scale. 11.3.2 References
Sintef 2008) http://www.sintef.no/upload/MARINTEK/PDF-filer/Publications/The%20Norwegian%20LNG%20Ferry_PME.pdf MARINTEK (2008) The overall aspects of an LNG supply chain with starting point at Kollsnes and alternative sources
108
11.4 APPENDIX 4: Risks associated with CNG and LNG
This document provides risk and safety related input to the study evaluating the use of natural gas for maritime vessels in Denmark and was developed by Ramboll Oil and Gas. Two options are considered:
1. Liquefied Natural Gas (LNG) 2. Compressed Natural Gas (CNG)
The memo address the main risk and safety aspects related to the options, however, detailed risk assessments are not performed at this stage. The memo applies a general approach to the evaluation of the risks associated with LNG/CNG installations and the context specific issues related to the use of natural gas for maritime vessels. Natural gas activities will always have the potential of causing accidents as the gas is flammable under certain conditions. In order to enable assessment of the associated risks the international generally accepted categorisation of risk is a combination of the severity of the consequences and the likelihood of occurrence. The (technical) objective definition is thus: Risk = severity of impact x frequency of event occurring The combination of severity and likelihood is not necessarily a linear product but depends on the severity and likelihood classification. The individual’s perception of risk provides for various subjective interpretations of a given installation/event which depends on various social elements, the level of information/knowledge, previous experience, necessity of the application, external inputs, etc. This is not covered in this memo. However, it is generally accepted that risk aversion increases exponentially with the scale of potential accidents. 11.4.1 Individual risk and societal risk
Risk is therefore considered in terms of individual risk and societal risk. Various methods exist to estimate the level of these risks and the risks can be expressed in different ways (potential loss of life, risk to specific groups, risk on-site staff, risk to neighbours, etc.). The individual risk (IR) is the likelihood of fatal incidents that a specific person will experience within a given time period (normally per year). The IR depends on exposure to hazards, where the person is located, time spend on the location, protection in terms of cover, etc. The IR will thus differ for maintenance staff, neighbours, persons occasionally passing the installation, etc. and it provides for a measure of the risk to the most exposed person. The societal risk is the collective risk that a given installation imposes on persons/groups and surroundings. This can be expressed as the frequency of fatalities compared with the scale of the incident subject to the risk aversion concept.
109
11.4.2 Risk Acceptance Criteria (RAC)
Whenever an activity has associated risks the decision-maker is to compare these risks with the benefit of the activity. There are several ways of defining the criteria for risk acceptance, e.g. cost-benefit analyses (CBA) or industry common practice levels for IR and societal risk. The health and safety risks the RAC can be either quantitative or qualitative and provides for a minimum level of safety (or maximum level of risk) that must be achieved. In most case a differentiation between on-site risk and risk to third party is incorporated into the acceptance criteria through the risk aversion concept. The decision-maker of course always has the zero-alternative opportunity if the risk is not considered acceptable. 11.4.3 ALARP
Alongside demonstrating that the risk acceptance criteria are achievable it is also necessary to demonstrated that the risk is ALARP. This means that measures to reduce the risk shall be assessed in order to evaluate if implementation is necessary. The ALARP principle is often closely related to cost-benefit analyses and favours that inexpensive risk reducing measures (“low hanging fruits”) are implemented even though the risk acceptance criteria is already met. In addition, the ALARP principle also addresses the issue of major accidents with very low likelihood of occurrence. This follows from the definition above where the risk related to a major accident can be low due to a low frequency. Qualitative aspects of the ALARP principle combined with the acceptance criteria may thus require the implementation of additional risk reducing measures. The ALARP assessment is performed as part of the combined risk assessment documentation. 11.4.4 Risk assessment
From a risk perspective LNG and CNG as well as the respective installations required are of similar nature. The installations considered at Danish harbours may be categorised as simpler installations as they are not to be production plants. Natural gas is a fuel and a combustible substance. To ensure safe and reliable operation, particular measures are taken in the design, construction, installation, commissioning and operation of LNG/CNG facilities. In high concentrations (and liquid state for LNG) natural gas is not explosive and cannot burn. For natural gas to burn, it must first mix with air in the proper proportions (the flammable range is 5% to 15%) and then be ignited. If the mixture is within the flammable range, there is risk of ignition which would create fire, explosion and thermal radiation hazards.
110
The design, construction, installation, commissioning and operation of LNG/CNG facilities are all subject to risk assessments according to the regulation. Various topics are to be considered in these assessments, hereunder:
Risks originating from the storage facility (LNG vs. CNG) Risks related to supply (ship vs. pipeline) Risks associated to fuelling activities Risks associated to external impact on the storage facility Risks related to collision involving LNG/CNG fuelled vessels
The main consequences related to health and safety risks at natural gas installations are fire and explosion. Environmental risks are not covered in this memo. 11.4.5 Risks originating from the storage facility
The main risks related to natural gas facilities are:
Rupture of pressurised systems (tanks, pipes, compressors, releases at flanges etc.) due to causes such as:
o Installation and maintenance errors, hereunder design/fabrication errors and material failure
o Corrosion o Mechanical impact (dropped objects, collision, etc.)
Overpressure in system caused by heat radiation from external fires Construction and structural risks due to causes such as:
o Weather (e.g. erosion and frost) o Subsidence
Software related risks caused by software errors. Procedural risks caused my insufficient manuals/instructions or
human errors. Failure of utility systems such as power supply, earthing system, fuel
gas and emergency equipment. Fires will be of similar nature (jet fire or flash fire) as the composition of LNG and CNG is identical. If CNG is produced on-site based on supply from the gas distribution network the need for storage capacity is less which in turn may reduce the scale of a potential accident due to the smaller volume. Explosions can be either chemical explosions (burning gas is a chemical reaction requiring ignition) or physical explosions (i.e. fragmentation when differences in pressure is balancing out if a barrier between two systems is broken). The chemical explosions are similar for LNG and CNG. The physical explosions are different from a technical point of view (compressed gas expansion vs. rapid phase transition) but the resulting expansion pressure is expected to be of similar nature. Overpressure in a system caused by heat radiation is only considered an issue if there is a fire. The radiation from the sun is part of design specifications. Potential overpressure is controlled/reduced by pressure safety valves which are standard equipment.
111
Structural risks related to weather or subsidence is similar to that of any construction. For software risks the main credible issue is related to “failure on demand” of safety systems. This is a common issue for the development of software for safety systems. Failure of the F&G detection systems (software) is also a common element of the development of emergency shut-down systems. Procedural errors are similar to those of other installations and there is as such no difference between LNG and CNG. The utility systems of both LNG and CNG are similar to those of other natural gas installations and are not considered to impose extraordinary risks. 11.4.6 Risks related to supply activities
The main risks related to supply are:
Rupture of pressurised systems (CNG pipeline from gas distribution net, pumping from LNG supply vessel, releases at flanges etc.) due to the same causes as mentioned above.
Software related risks caused by software errors. Procedural risks caused my insufficient manuals/instructions or
human errors. Ship collision (LNG option) due to increased ship traffic.
The previous section includes a description of the consequences for fire, explosion, software and procedural risks. For the risk associated to the increased ship traffic it is not considered to be significant as the supply of LNG will be rare compared to the overall ship traffic in the respective harbours. 11.4.7 Risks associated to fuelling activities
The risks associated to the fuelling activities are of similar nature as the description in the previous section. Although the risk is considered to be slightly higher than that of conventional vessels due to the potential ignition in case of rupture it is not assessed to have a significant impact on the overall risk picture. The number of fuelling operations may have an impact if either LNG or CNG operated vessels require significantly larger number of operations. However, in practice this is not considered to be a determining issue in the selection process between the two options. 11.4.8 Risks associated to external impact on the storage facility
The risks caused by external impact do not differ from other natural gas installations and is as such not assessed to cause significant risks. 11.4.9 Risks related to collision involving a LNG/CNG fuelled vessels
It is not expected that the consequences of ship collision will impact the overall risk picture as it is assumed that the LNG/CNG fuelled vessels can be
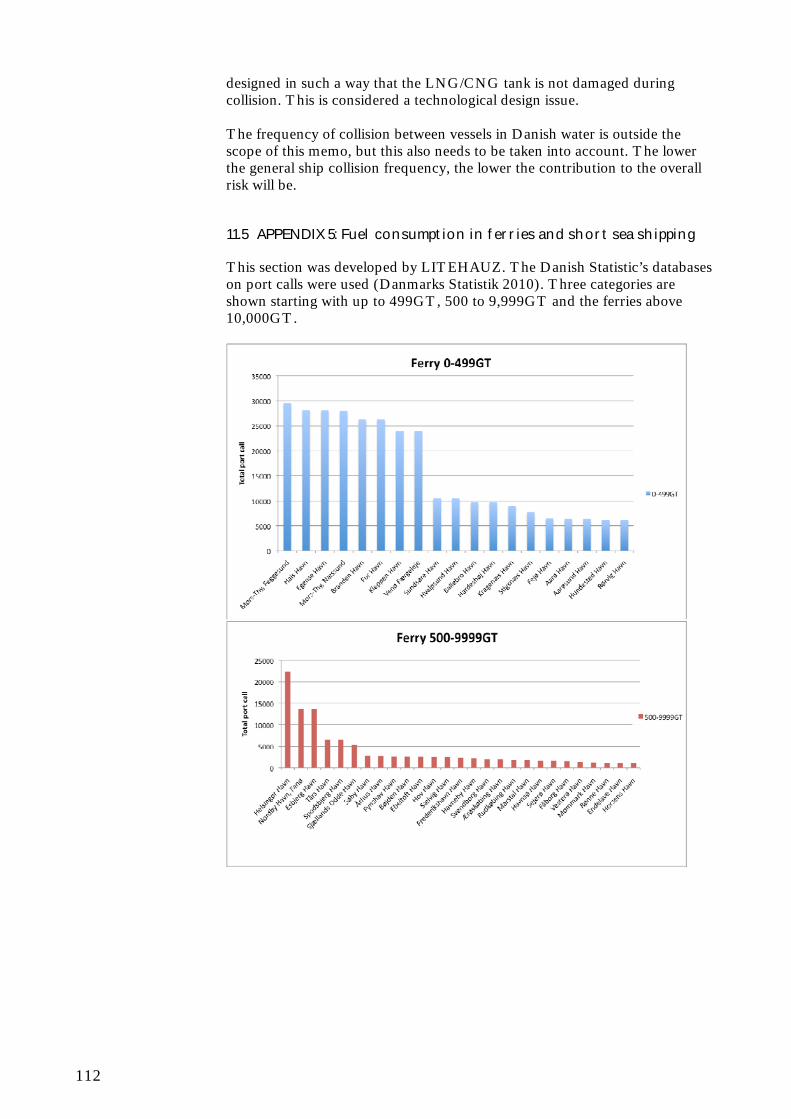
112
designed in such a way that the LNG/CNG tank is not damaged during collision. This is considered a technological design issue. The frequency of collision between vessels in Danish water is outside the scope of this memo, but this also needs to be taken into account. The lower the general ship collision frequency, the lower the contribution to the overall risk will be.
11.5 APPENDIX 5: Fuel consumption in ferries and short sea shipping
This section was developed by LITEHAUZ. The Danish Statistic’s databases on port calls were used (Danmarks Statistik 2010). Three categories are shown starting with up to 499GT, 500 to 9,999GT and the ferries above 10,000GT.

113
Figure 11-7 Ferry port calls 2008. Ferries between 0-499GT, 500-9,999GT and >10,000GT The smallest ferries operate short routes in sheltered waters and despite their frequent port call this may not entail any significant fuel consumption. The medium sized ferries in the (broad) range of 500 to 9,999GT are very typical and a large number of them are conventional regional ferries, but this category also includes a few fast ferries. The largest ferries with a total of >10,000GT include ferries operating high volume routes from Danish ports to our neighbouring countries and regional ferries on longer distance routes.
The estimated fuel consumption of vessels operating on the routes can be found based on the data of the ferries51 combined with a few assumptions as outlined below. The fuel consumption is allocated to the ports for subsequent consideration of storage needs. 11.5.1 Estimation of fuel consumption
The fuel consumption for each ship is estimated from the equation found below by summarizing the product of engine load (MCR%), main engine size (kW), AIS signal time interval (s) and fuel consumption factor (g/kWh)52:
where E = fuel consumption, %MCR = engine load (%), t = Sailing time (s), PME = main engine power (kW), EF = specific fuel consumption factor (g/kWh), I = AIS signal interval, k = fuel type, l = engine type, x = calculation
51 Vessel data input (GT and engine powerFuel consumption) from Hans Otto Kristensen, DTU ant the actual shipowners. 52 The calculation procedure is found at the Danish Ministry of the Environment web page “Ship emissions and air pollution in Denmark”.
The port with the highest number of calls is not necessarily the port that has the largest energy consumption. The ferry route Venø-Klippen has more than 24,000 port call annually but each voyage is only 266 meters.
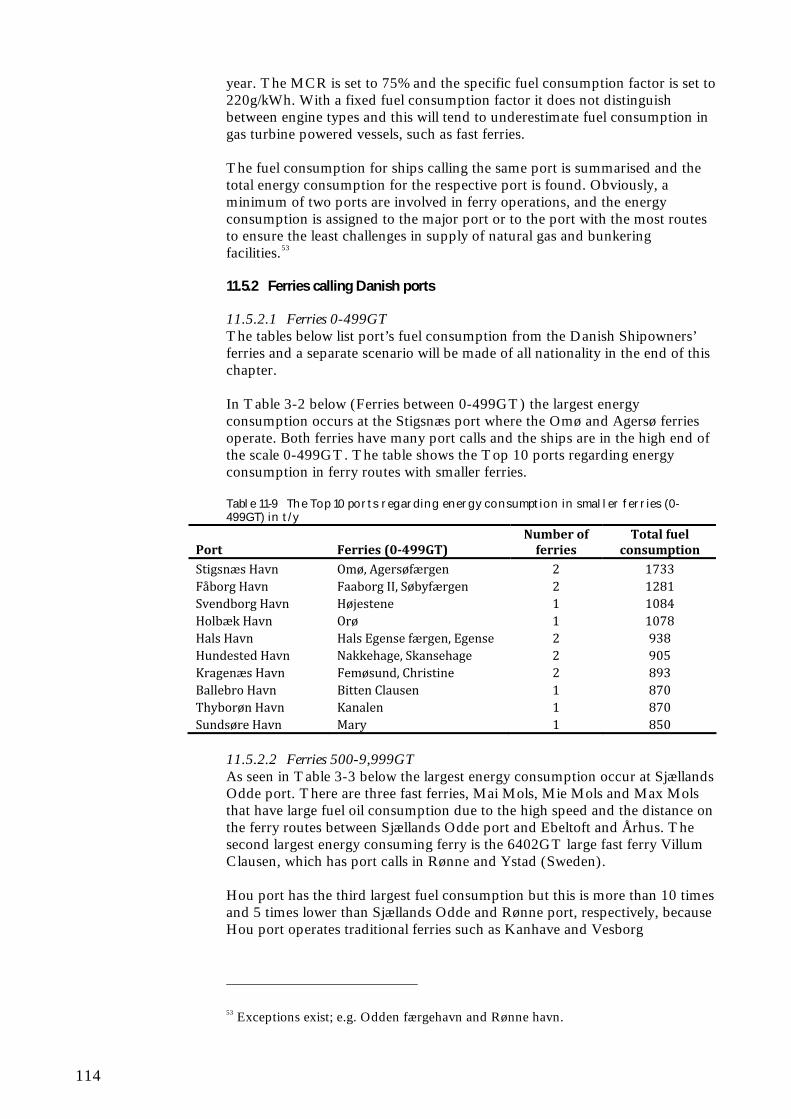
114
year. The MCR is set to 75% and the specific fuel consumption factor is set to 220g/kWh. With a fixed fuel consumption factor it does not distinguish between engine types and this will tend to underestimate fuel consumption in gas turbine powered vessels, such as fast ferries. The fuel consumption for ships calling the same port is summarised and the total energy consumption for the respective port is found. Obviously, a minimum of two ports are involved in ferry operations, and the energy consumption is assigned to the major port or to the port with the most routes to ensure the least challenges in supply of natural gas and bunkering facilities.53 11.5.2 Ferries calling Danish ports
11.5.2.1 Ferries 0-499GT The tables below list port’s fuel consumption from the Danish Shipowners’ ferries and a separate scenario will be made of all nationality in the end of this chapter. In Table 3-2 below (Ferries between 0-499GT) the largest energy consumption occurs at the Stigsnæs port where the Omø and Agersø ferries operate. Both ferries have many port calls and the ships are in the high end of the scale 0-499GT. The table shows the Top 10 ports regarding energy consumption in ferry routes with smaller ferries. Table 11-9 The Top 10 ports regarding energy consumption in smaller ferries (0-499GT) in t/y
Port Ferries (0499GT) Number of ferries
Total fuel consumption
Stigsnæs Havn Omø, Agersøfærgen 2 1733 Fåborg Havn Faaborg II, Søbyfærgen 2 1281 Svendborg Havn Højestene 1 1084 Holbæk Havn Orø 1 1078 Hals Havn Hals Egense færgen, Egense 2 938 Hundested Havn Nakkehage, Skansehage 2 905 Kragenæs Havn Femøsund, Christine 2 893 Ballebro Havn Bitten Clausen 1 870 Thyborøn Havn Kanalen 1 870 Sundsøre Havn Mary 1 850
11.5.2.2 Ferries 500-9,999GT As seen in Table 3-3 below the largest energy consumption occur at Sjællands Odde port. There are three fast ferries, Mai Mols, Mie Mols and Max Mols that have large fuel oil consumption due to the high speed and the distance on the ferry routes between Sjællands Odde port and Ebeltoft and Århus. The second largest energy consuming ferry is the 6402GT large fast ferry Villum Clausen, which has port calls in Rønne and Ystad (Sweden). Hou port has the third largest fuel consumption but this is more than 10 times and 5 times lower than Sjællands Odde and Rønne port, respectively, because Hou port operates traditional ferries such as Kanhave and Vesborg
53 Exceptions exist; e.g. Odden færgehavn and Rønne havn.
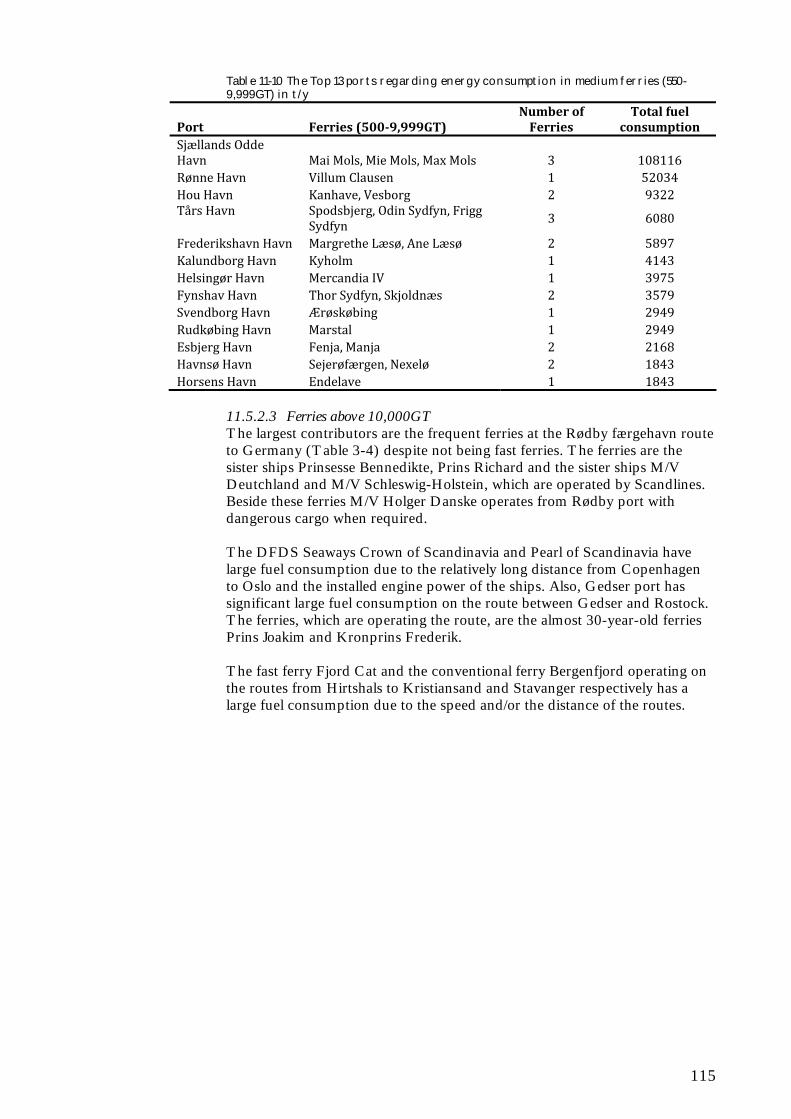
115
Table 11-10 The Top 13 ports regarding energy consumption in medium ferries (550-9,999GT) in t/y
Port Ferries (5009,999GT) Number of Ferries
Total fuel consumption
Sjællands Odde Havn Mai Mols, Mie Mols, Max Mols 3 108116 Rønne Havn Villum Clausen 1 52034 Hou Havn Kanhave, Vesborg 2 9322 Tårs Havn
Spodsbjerg, Odin Sydfyn, Frigg Sydfyn 3 6080
Frederikshavn Havn Margrethe Læsø, Ane Læsø 2 5897 Kalundborg Havn Kyholm 1 4143 Helsingør Havn Mercandia IV 1 3975 Fynshav Havn Thor Sydfyn, Skjoldnæs 2 3579 Svendborg Havn Ærøskøbing 1 2949 Rudkøbing Havn Marstal 1 2949 Esbjerg Havn Fenja, Manja 2 2168 Havnsø Havn Sejerøfærgen, Nexelø 2 1843 Horsens Havn Endelave 1 1843
11.5.2.3 Ferries above 10,000GT The largest contributors are the frequent ferries at the Rødby færgehavn route to Germany (Table 3-4) despite not being fast ferries. The ferries are the sister ships Prinsesse Bennedikte, Prins Richard and the sister ships M/V Deutchland and M/V Schleswig-Holstein, which are operated by Scandlines. Beside these ferries M/V Holger Danske operates from Rødby port with dangerous cargo when required. The DFDS Seaways Crown of Scandinavia and Pearl of Scandinavia have large fuel consumption due to the relatively long distance from Copenhagen to Oslo and the installed engine power of the ships. Also, Gedser port has significant large fuel consumption on the route between Gedser and Rostock. The ferries, which are operating the route, are the almost 30-year-old ferries Prins Joakim and Kronprins Frederik. The fast ferry Fjord Cat and the conventional ferry Bergenfjord operating on the routes from Hirtshals to Kristiansand and Stavanger respectively has a large fuel consumption due to the speed and/or the distance of the routes.
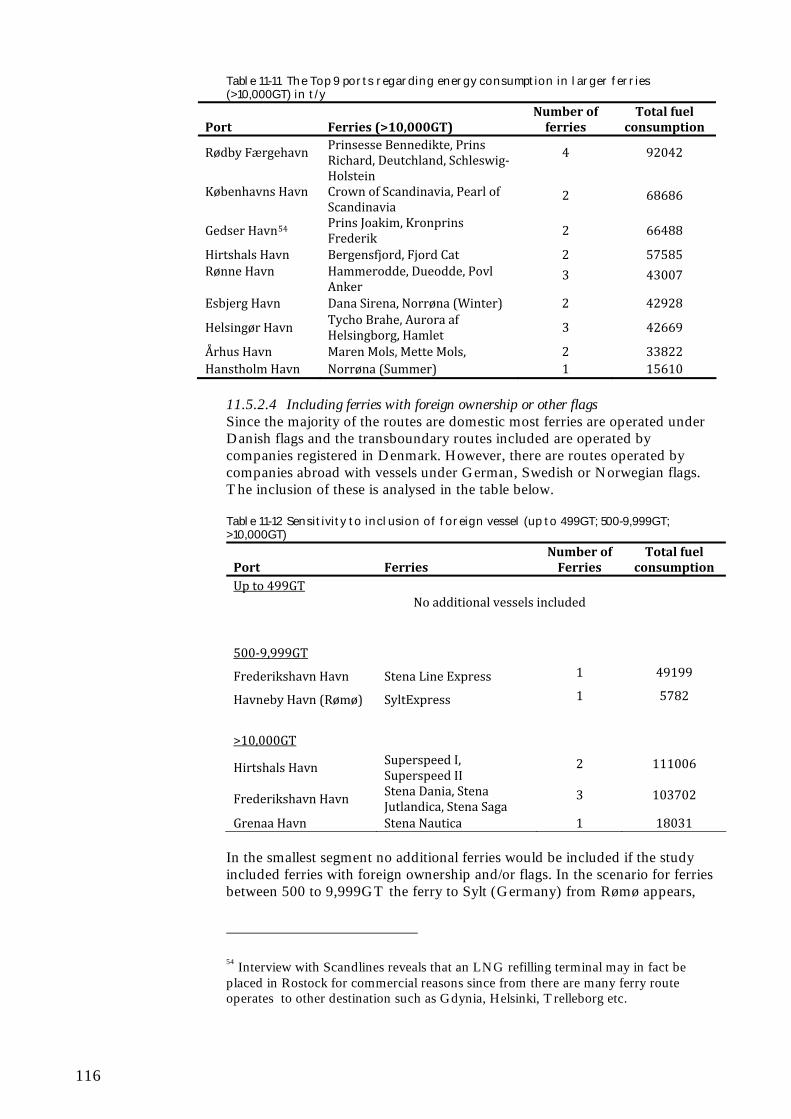
116
Table 11-11 The Top 9 ports regarding energy consumption in larger ferries (>10,000GT) in t/y
Port Ferries (>10,000GT) Number of ferries
Total fuel consumption
Rødby Færgehavn
Prinsesse Bennedikte, Prins Richard, Deutchland, Schleswig‐Holstein
4 92042
Københavns Havn
Crown of Scandinavia, Pearl of Scandinavia
2 68686
Gedser Havn54 Prins Joakim, Kronprins Frederik 2 66488
Hirtshals Havn Bergensfjord, Fjord Cat 2 57585 Rønne Havn
Hammerodde, Dueodde, Povl Anker
3 43007
Esbjerg Havn Dana Sirena, Norrøna (Winter) 2 42928
Helsingør Havn Tycho Brahe, Aurora af Helsingborg, Hamlet 3 42669
Århus Havn Maren Mols, Mette Mols, 2 33822 Hanstholm Havn Norrøna (Summer) 1 15610
11.5.2.4 Including ferries with foreign ownership or other flags Since the majority of the routes are domestic most ferries are operated under Danish flags and the transboundary routes included are operated by companies registered in Denmark. However, there are routes operated by companies abroad with vessels under German, Swedish or Norwegian flags. The inclusion of these is analysed in the table below. Table 11-12 Sensitivity to inclusion of foreign vessel (up to 499GT; 500-9,999GT; >10,000GT)
Port Ferries Number of Ferries
Total fuel consumption
Up to 499GT
No additional vessels included
500‐9,999GT
Frederikshavn Havn Stena Line Express 1 49199
Havneby Havn (Rømø) SyltExpress 1 5782
>10,000GT
Hirtshals Havn Superspeed I, Superspeed II
2 111006
Frederikshavn Havn Stena Dania, Stena Jutlandica, Stena Saga
3 103702
Grenaa Havn Stena Nautica 1 18031 In the smallest segment no additional ferries would be included if the study included ferries with foreign ownership and/or flags. In the scenario for ferries between 500 to 9,999GT the ferry to Sylt (Germany) from Rømø appears,
54 Interview with Scandlines reveals that an LNG refilling terminal may in fact be placed in Rostock for commercial reasons since from there are many ferry route operates to other destination such as Gdynia, Helsinki, Trelleborg etc.
117
but in particular the Stena Line route to Frederikshavn would contribute substantially to fuel consumption (see below note on Frederikshavn). The scenario for ferry routes above 10,000GT will see Hirtshals with the largest fuel consuming routes due to the relatively fast ferry operated and long routes to Larvik and Kristiansand (both Norway). Also, the Port of Grenå will join due to the Stena Line route to Sweden. The port of Frederikshavn has a great potential for reducing the emissions by natural gas because of the large fuel consumption as Frederikshavn are serviced by Stena Line’s fast-ferries, which have large fuel consumption and by the conventional large ferries serving long distances to the ports in Sweden. To achieve the largest reduction of emissions in the overall scale it is essential to not only focus on the Danish owned ferries but all nationalities ferries, which enter Danish ports. Despite the beneficial conditions at first glance both in the case of Hirtshals and Frederikshavn, LNG bunkering infrastructure is more advanced in Norway and plans are well progressed in Gothenburg port to establish an LNG storage and bunkering facility. If allowed by technical conditions it is therefore assumed that the LNG facilities will be placed in the ports of destination in these cases rather than in Denmark, and the in this study the potential contribution is not added to the scenarios, thus making them more conservative. 11.5.2.5 Summary on ferries The fuel consumption of the smaller ferries is relatively small due to the limited engine power. The port with the largest fuel consumption from small ferries only achieves about one tenth of the consumption of number nine on the list of the largest ferries’ ports. If key ferry ports are considered those with a fuel consumption of more than 10,000 t/y, still more than 80% of the total fuel consumption in the ferry sector in Denmark will be covered in only nine ports. 11.5.3 Estimation of potential in short sea shipping
The number of port calls for cargo ships entering Danish ports is approximately 5% of the total number of port calls (Table 3-1, Ship calls in Danish ports) and include all cargo ships such as the large container ships, bulkers, tankers and general cargo ships. No statistics are available specific for the short sea traffic be it tramp or line. 11.5.3.1 The number of ports in short sea shipping To identify which ports that have short sea line traffic a number of ports have been contacted for an interview and is described below. The relevant ports have been identified as those having the largest cargo turnover per year (as seen in the table below). However, this information on main import-export ports is not directly related to short sea shipping and the identification of the most important short sea shipping ports has therefore also taken into consideration the number of short sea cargo routes operating in the ports based on a study by Danske Havne (2008).
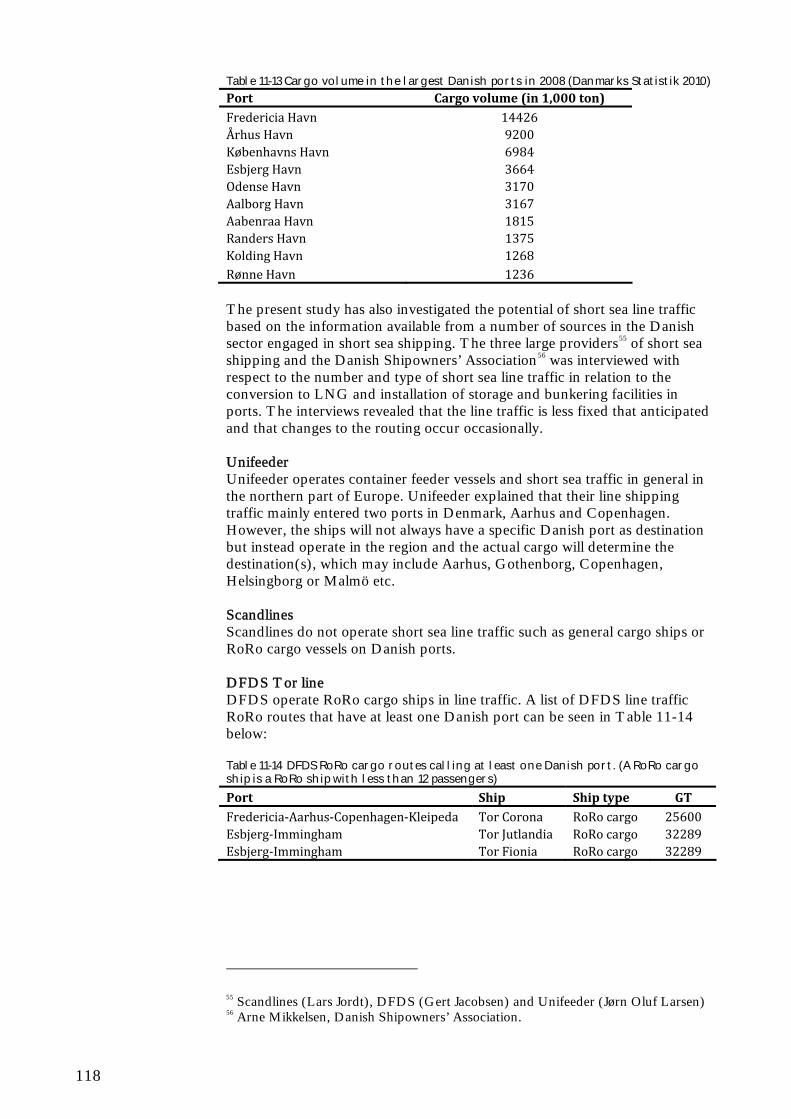
118
Table 11-13 Cargo volume in the largest Danish ports in 2008 (Danmarks Statistik 2010)
Port Cargo volume (in 1,000 ton) Fredericia Havn 14426 Århus Havn 9200 Københavns Havn 6984 Esbjerg Havn 3664 Odense Havn 3170 Aalborg Havn 3167 Aabenraa Havn 1815 Randers Havn 1375 Kolding Havn 1268 Rønne Havn 1236 The present study has also investigated the potential of short sea line traffic based on the information available from a number of sources in the Danish sector engaged in short sea shipping. The three large providers55 of short sea shipping and the Danish Shipowners’ Association56 was interviewed with respect to the number and type of short sea line traffic in relation to the conversion to LNG and installation of storage and bunkering facilities in ports. The interviews revealed that the line traffic is less fixed that anticipated and that changes to the routing occur occasionally. Unifeeder Unifeeder operates container feeder vessels and short sea traffic in general in the northern part of Europe. Unifeeder explained that their line shipping traffic mainly entered two ports in Denmark, Aarhus and Copenhagen. However, the ships will not always have a specific Danish port as destination but instead operate in the region and the actual cargo will determine the destination(s), which may include Aarhus, Gothenborg, Copenhagen, Helsingborg or Malmö etc. Scandlines Scandlines do not operate short sea line traffic such as general cargo ships or RoRo cargo vessels on Danish ports. DFDS Tor line DFDS operate RoRo cargo ships in line traffic. A list of DFDS line traffic RoRo routes that have at least one Danish port can be seen in Table 11-14 below: Table 11-14 DFDS RoRo cargo routes calling at least one Danish port. (A RoRo cargo ship is a RoRo ship with less than 12 passengers)
Port Ship Ship type GT Fredericia‐Aarhus‐Copenhagen‐Kleipeda Tor Corona RoRo cargo 25600 Esbjerg‐Immingham Tor Jutlandia RoRo cargo 32289 Esbjerg‐Immingham Tor Fionia RoRo cargo 32289
55 Scandlines (Lars Jordt), DFDS (Gert Jacobsen) and Unifeeder (Jørn Oluf Larsen) 56 Arne Mikkelsen, Danish Shipowners’ Association.
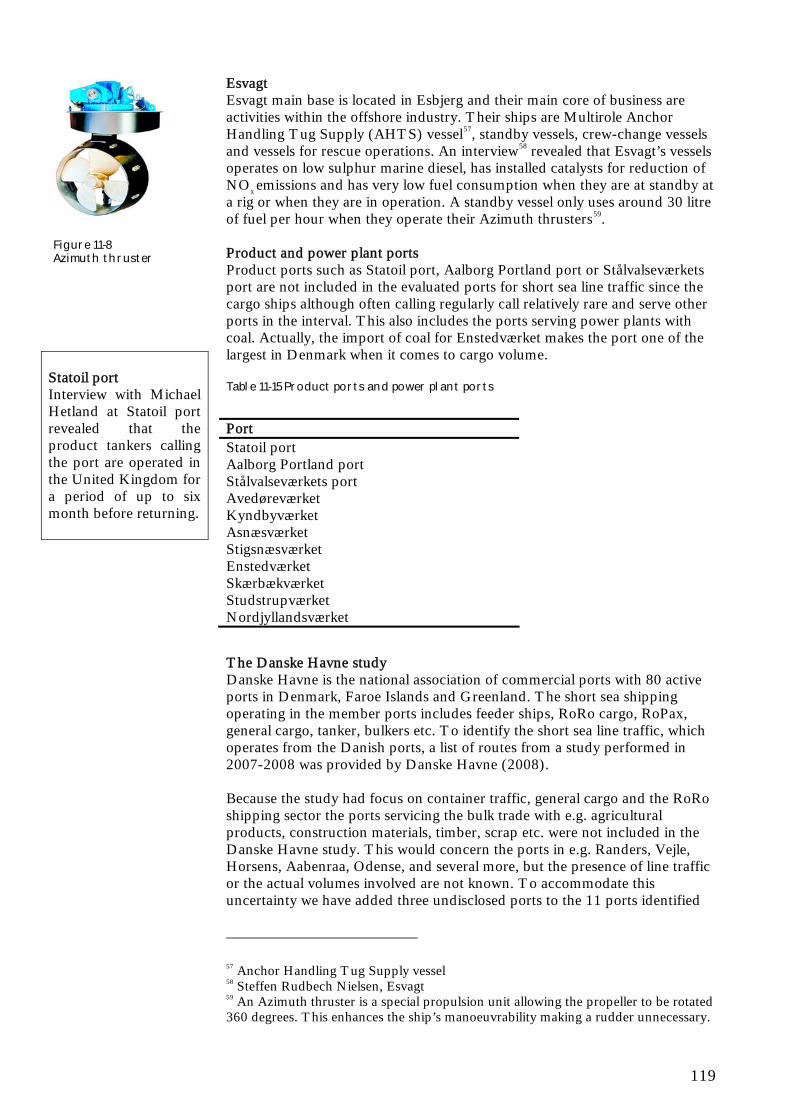
119
Esvagt Esvagt main base is located in Esbjerg and their main core of business are activities within the offshore industry. Their ships are Multirole Anchor Handling Tug Supply (AHTS) vessel57, standby vessels, crew-change vessels and vessels for rescue operations. An interview58 revealed that Esvagt’s vessels operates on low sulphur marine diesel, has installed catalysts for reduction of NOx emissions and has very low fuel consumption when they are at standby at a rig or when they are in operation. A standby vessel only uses around 30 litre of fuel per hour when they operate their Azimuth thrusters59. Product and power plant ports Product ports such as Statoil port, Aalborg Portland port or Stålvalseværkets port are not included in the evaluated ports for short sea line traffic since the cargo ships although often calling regularly call relatively rare and serve other ports in the interval. This also includes the ports serving power plants with coal. Actually, the import of coal for Enstedværket makes the port one of the largest in Denmark when it comes to cargo volume. Table 11-15 Product ports and power plant ports
The Danske Havne study Danske Havne is the national association of commercial ports with 80 active ports in Denmark, Faroe Islands and Greenland. The short sea shipping operating in the member ports includes feeder ships, RoRo cargo, RoPax, general cargo, tanker, bulkers etc. To identify the short sea line traffic, which operates from the Danish ports, a list of routes from a study performed in 2007-2008 was provided by Danske Havne (2008). Because the study had focus on container traffic, general cargo and the RoRo shipping sector the ports servicing the bulk trade with e.g. agricultural products, construction materials, timber, scrap etc. were not included in the Danske Havne study. This would concern the ports in e.g. Randers, Vejle, Horsens, Aabenraa, Odense, and several more, but the presence of line traffic or the actual volumes involved are not known. To accommodate this uncertainty we have added three undisclosed ports to the 11 ports identified
57 Anchor Handling Tug Supply vessel 58 Steffen Rudbech Nielsen, Esvagt 59 An Azimuth thruster is a special propulsion unit allowing the propeller to be rotated 360 degrees. This enhances the ship’s manoeuvrability making a rudder unnecessary.
Statoil port Interview with Michael Hetland at Statoil port revealed that the product tankers calling the port are operated in the United Kingdom for a period of up to six month before returning.
Port Statoil port Aalborg Portland port Stålvalseværkets port Avedøreværket Kyndbyværket Asnæsværket Stigsnæsværket Enstedværket Skærbækværket Studstrupværket Nordjyllandsværket
Figure 11-8 Azimuth thruster
120
in Dansk Havne’s study bringing the total number of ports to 14 involved in short sea line shipping60. In addition to the three unnamed ports, the main short sea shipping ports (in alphabetical order) are:
CMP/Copenhagen Esbjerg Fredericia/ADP Frederikshavn Grenå Hanstholm Hirtshals Hundested Kolding Aarhus Aalborg
The largest of these are Fredericia, Aarhus, Copenhagen and Esbjerg, and a short description is given below. Port of Fredericia: The Associated Danish Ports A/S (ADP) is a co-operation between the ports of Fredericia, Nyborg and Middelfart. The largest short sea line traffic ports of ADP is Fredericia and the shipping companies which enters the ports are Unifeeder on routes to Hamburg/Bremerhaven, CMA CGM on the routes to Hamburg - Fredericia - Halmstad - Copenhagen - Szczecin, MSC on the route to Antwerp – Fredericia – Aarhus – Copenhagen and DFDS Tor Line on the route Fredericia – Aarhus – Copenhagen - Klaipeda61. Port of Aarhus RoRo cargo ships with regular routes to Finland and Lithuania have port calls in Aarhus port together with cruise liners. General cargo ships carrying paper, windmills etc. call regularly at the port. Bulker traffic, which operates from Aarhus port, is carrying agriculture products, coal and concrete. The tanker traffic mainly carries mineral and vegetable oil. Port of Copenhagen Copenhagen Malmö port (CMP) is a co-operation between the ports of Copenhagen and Malmö. The main short sea line traffic entering CMP are Unifeeder62. Vessels that enter the port of Copenhagen are typically time charter from a half to a year. Port of Esbjerg The port of Esbjerg handles RoRo ships (both RoRo cargo and RoPax) and LoLo ships, fishing vessel and off-shore activities with regular port calls on
60 In an optimistic assessment more ports could be included. In the ”Vækst i Danske Havne” Transport- og Energiministeriet, Søfartsstyrelsen og Konkurrencestyrelsen (2005) the total number is 27 cargo ports (later reduced to 19), although these are not evaluated for short sea line traffic. 61 Ole H. Jørgensen, Associated Danish Ports A/S 62 Lennart Hall, Environment & Quality CMP
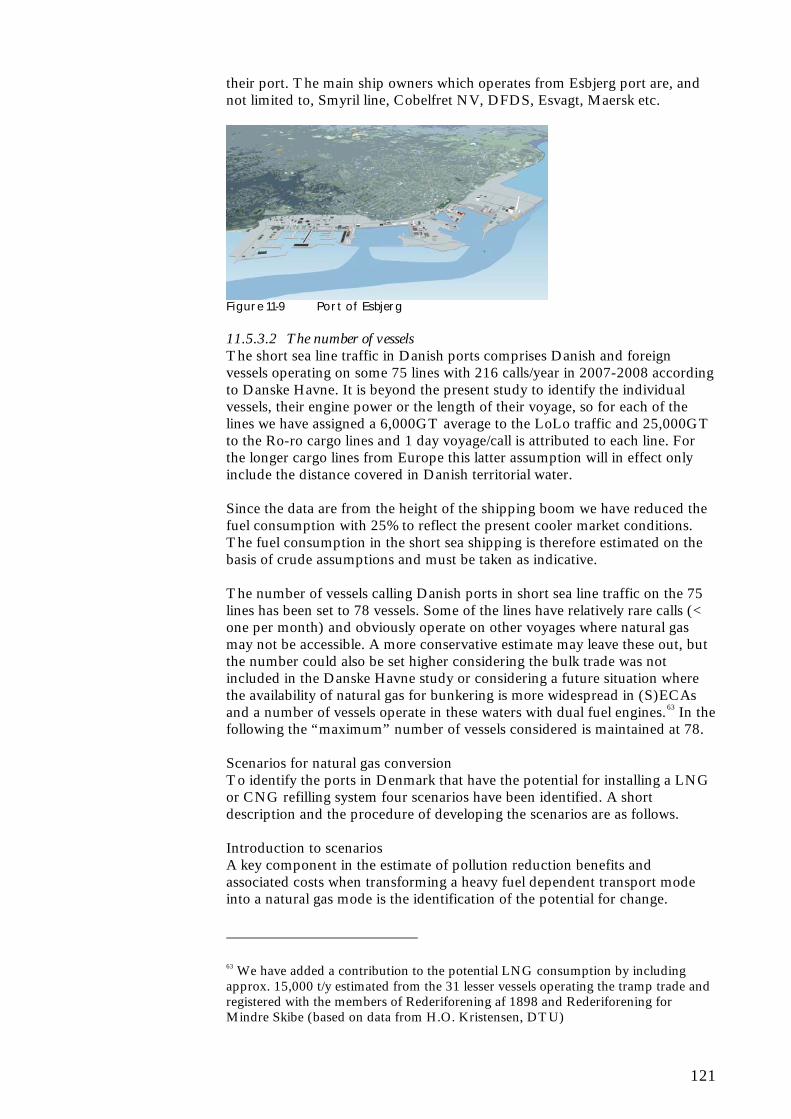
121
their port. The main ship owners which operates from Esbjerg port are, and not limited to, Smyril line, Cobelfret NV, DFDS, Esvagt, Maersk etc.
Figure 11-9 Port of Esbjerg 11.5.3.2 The number of vessels The short sea line traffic in Danish ports comprises Danish and foreign vessels operating on some 75 lines with 216 calls/year in 2007-2008 according to Danske Havne. It is beyond the present study to identify the individual vessels, their engine power or the length of their voyage, so for each of the lines we have assigned a 6,000GT average to the LoLo traffic and 25,000GT to the Ro-ro cargo lines and 1 day voyage/call is attributed to each line. For the longer cargo lines from Europe this latter assumption will in effect only include the distance covered in Danish territorial water. Since the data are from the height of the shipping boom we have reduced the fuel consumption with 25% to reflect the present cooler market conditions. The fuel consumption in the short sea shipping is therefore estimated on the basis of crude assumptions and must be taken as indicative. The number of vessels calling Danish ports in short sea line traffic on the 75 lines has been set to 78 vessels. Some of the lines have relatively rare calls (< one per month) and obviously operate on other voyages where natural gas may not be accessible. A more conservative estimate may leave these out, but the number could also be set higher considering the bulk trade was not included in the Danske Havne study or considering a future situation where the availability of natural gas for bunkering is more widespread in (S)ECAs and a number of vessels operate in these waters with dual fuel engines.63 In the following the “maximum” number of vessels considered is maintained at 78. Scenarios for natural gas conversion To identify the ports in Denmark that have the potential for installing a LNG or CNG refilling system four scenarios have been identified. A short description and the procedure of developing the scenarios are as follows. Introduction to scenarios A key component in the estimate of pollution reduction benefits and associated costs when transforming a heavy fuel dependent transport mode into a natural gas mode is the identification of the potential for change.
63 We have added a contribution to the potential LNG consumption by including approx. 15,000 t/y estimated from the 31 lesser vessels operating the tramp trade and registered with the members of Rederiforening af 1898 and Rederiforening for Mindre Skibe (based on data from H.O. Kristensen, DTU)
122
The basic driver is the consumption of energy on ships, which is estimated for the vessels engaged in short sea shipping calling at least one Danish port. Energy consumption of the fleet This in turn defines the three basic needs in terms of infrastructure: Ships - the installations needed on ships (be it new ships or existing with retrofits) Port - the installations needed in ports or other bunkering infrastructure Infrastructure - the LNG production, storage and distribution network For the ships the number of Danish ferries and number of vessels in short sea shipping is estimated. For the ports the number of ports are estimated within the ferry sector and the short sea shipping sector. The final bullit is considered elsewhere in the report, and for the purpose of estimating the energy consumption and eventually pollution reduction scenarios it is anticipated that natural gas is distributed to the bunkering facilities and ships at par with existing fuel distribution.
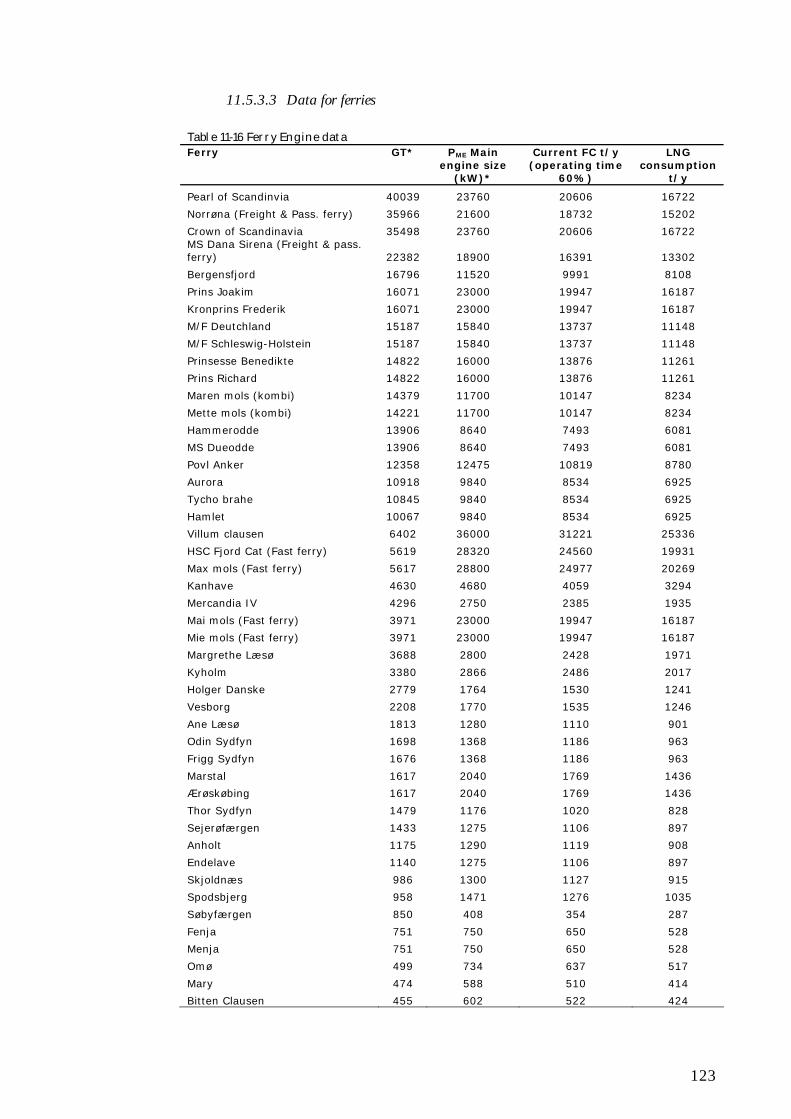
123
11.5.3.3 Data for ferries
Table 11-16 Ferry Engine data Ferry GT* PME Main
engine size (kW)*
Current FC t/y (operating time
60%)
LNG consumption
t/y
Pearl of Scandinvia 40039 23760 20606 16722
Norrøna (Freight & Pass. ferry) 35966 21600 18732 15202
Crown of Scandinavia 35498 23760 20606 16722 MS Dana Sirena (Freight & pass. ferry) 22382 18900 16391 13302
Bergensfjord 16796 11520 9991 8108
Prins Joakim 16071 23000 19947 16187
Kronprins Frederik 16071 23000 19947 16187
M/F Deutchland 15187 15840 13737 11148
M/F Schleswig-Holstein 15187 15840 13737 11148
Prinsesse Benedikte 14822 16000 13876 11261
Prins Richard 14822 16000 13876 11261
Maren mols (kombi) 14379 11700 10147 8234
Mette mols (kombi) 14221 11700 10147 8234
Hammerodde 13906 8640 7493 6081
MS Dueodde 13906 8640 7493 6081
Povl Anker 12358 12475 10819 8780
Aurora 10918 9840 8534 6925
Tycho brahe 10845 9840 8534 6925
Hamlet 10067 9840 8534 6925
Villum clausen 6402 36000 31221 25336
HSC Fjord Cat (Fast ferry) 5619 28320 24560 19931
Max mols (Fast ferry) 5617 28800 24977 20269
Kanhave 4630 4680 4059 3294
Mercandia IV 4296 2750 2385 1935
Mai mols (Fast ferry) 3971 23000 19947 16187
Mie mols (Fast ferry) 3971 23000 19947 16187
Margrethe Læsø 3688 2800 2428 1971
Kyholm 3380 2866 2486 2017
Holger Danske 2779 1764 1530 1241
Vesborg 2208 1770 1535 1246
Ane Læsø 1813 1280 1110 901
Odin Sydfyn 1698 1368 1186 963
Frigg Sydfyn 1676 1368 1186 963
Marstal 1617 2040 1769 1436
Ærøskøbing 1617 2040 1769 1436
Thor Sydfyn 1479 1176 1020 828
Sejerøfærgen 1433 1275 1106 897
Anholt 1175 1290 1119 908
Endelave 1140 1275 1106 897
Skjoldnæs 986 1300 1127 915
Spodsbjerg 958 1471 1276 1035
Søbyfærgen 850 408 354 287
Fenja 751 750 650 528
Menja 751 750 650 528
Omø 499 734 637 517
Mary 474 588 510 414
Bitten Clausen 455 602 522 424
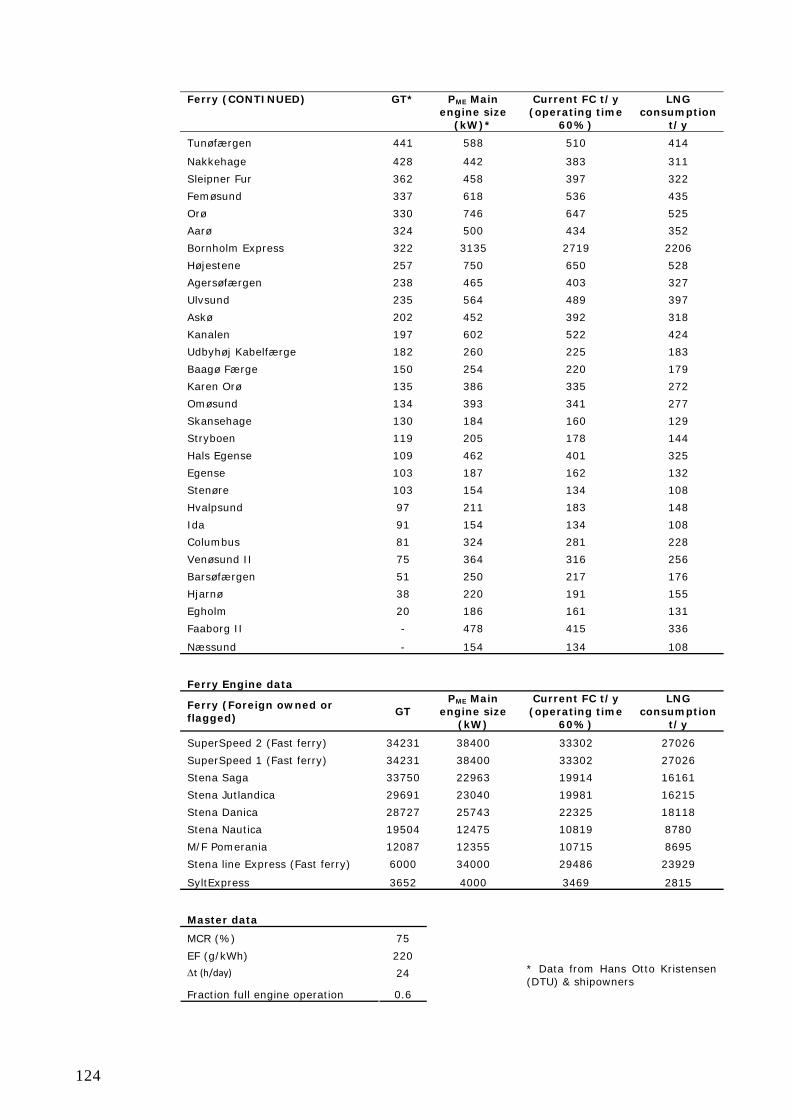
124
Ferry (CONTINUED) GT* PME Main
engine size (kW)*
Current FC t/y (operating time
60%)
LNG consumption
t/y
Tunøfærgen 441 588 510 414
Nakkehage 428 442 383 311
Sleipner Fur 362 458 397 322
Femøsund 337 618 536 435
Orø 330 746 647 525
Aarø 324 500 434 352
Bornholm Express 322 3135 2719 2206
Højestene 257 750 650 528
Agersøfærgen 238 465 403 327
Ulvsund 235 564 489 397
Askø 202 452 392 318
Kanalen 197 602 522 424
Udbyhøj Kabelfærge 182 260 225 183
Baagø Færge 150 254 220 179
Karen Orø 135 386 335 272
Omøsund 134 393 341 277
Skansehage 130 184 160 129
Stryboen 119 205 178 144
Hals Egense 109 462 401 325
Egense 103 187 162 132
Stenøre 103 154 134 108
Hvalpsund 97 211 183 148
Ida 91 154 134 108
Columbus 81 324 281 228
Venøsund II 75 364 316 256
Barsøfærgen 51 250 217 176
Hjarnø 38 220 191 155
Egholm 20 186 161 131
Faaborg II - 478 415 336
Næssund - 154 134 108
Ferry Engine data
Ferry (Foreign owned or flagged)
GT PME Main
engine size (kW)
Current FC t/y (operating time
60%)
LNG consumption
t/y
SuperSpeed 2 (Fast ferry) 34231 38400 33302 27026
SuperSpeed 1 (Fast ferry) 34231 38400 33302 27026
Stena Saga 33750 22963 19914 16161
Stena Jutlandica 29691 23040 19981 16215
Stena Danica 28727 25743 22325 18118
Stena Nautica 19504 12475 10819 8780
M/F Pomerania 12087 12355 10715 8695
Stena line Express (Fast ferry) 6000 34000 29486 23929
SyltExpress 3652 4000 3469 2815
Master data
MCR (%) 75
EF (g/kWh) 220
t(h/day) 24
Fraction full engine operation 0.6
* Data from Hans Otto Kristensen (DTU) & shipowners
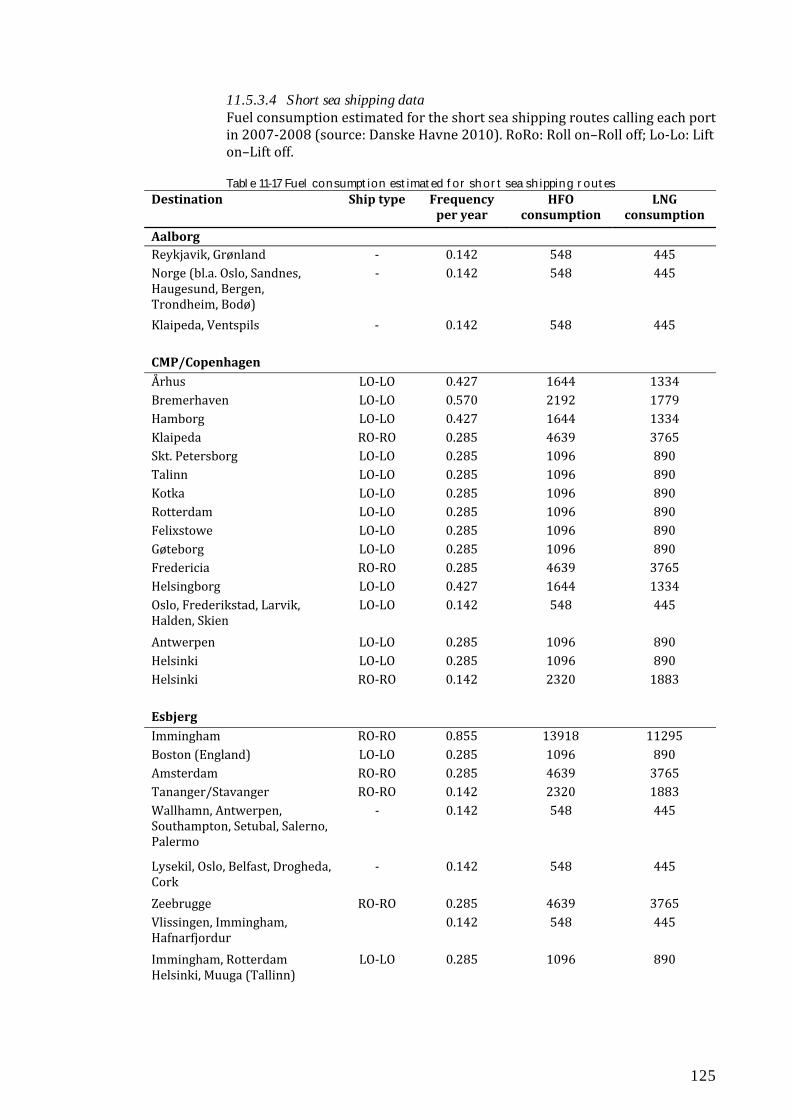
125
11.5.3.4 Short sea shipping data Fuel consumption estimated for the short sea shipping routes calling each port in 2007‐2008 (source: Danske Havne 2010). RoRo: Roll on–Roll off; Lo‐Lo: Lift on–Lift off. Table 11-17 Fuel consumption estimated for short sea shipping routes
Destination Ship type Frequency per year
HFO consumption
LNG consumption
Aalborg Reykjavik, Grønland ‐ 0.142 548 445 Norge (bl.a. Oslo, Sandnes, Haugesund, Bergen, Trondheim, Bodø)
‐ 0.142 548 445
Klaipeda, Ventspils ‐ 0.142 548 445 CMP/Copenhagen Århus LO‐LO 0.427 1644 1334 Bremerhaven LO‐LO 0.570 2192 1779 Hamborg LO‐LO 0.427 1644 1334 Klaipeda RO‐RO 0.285 4639 3765 Skt. Petersborg LO‐LO 0.285 1096 890 Talinn LO‐LO 0.285 1096 890 Kotka LO‐LO 0.285 1096 890 Rotterdam LO‐LO 0.285 1096 890 Felixstowe LO‐LO 0.285 1096 890 Gøteborg LO‐LO 0.285 1096 890 Fredericia RO‐RO 0.285 4639 3765 Helsingborg LO‐LO 0.427 1644 1334 Oslo, Frederikstad, Larvik, Halden, Skien
LO‐LO 0.142 548 445
Antwerpen LO‐LO 0.285 1096 890 Helsinki LO‐LO 0.285 1096 890 Helsinki RO‐RO 0.142 2320 1883 Esbjerg Immingham RO‐RO 0.855 13918 11295 Boston (England) LO‐LO 0.285 1096 890 Amsterdam RO‐RO 0.285 4639 3765 Tananger/Stavanger RO‐RO 0.142 2320 1883 Wallhamn, Antwerpen, Southampton, Setubal, Salerno, Palermo
‐ 0.142 548 445
Lysekil, Oslo, Belfast, Drogheda, Cork
‐ 0.142 548 445
Zeebrugge RO‐RO 0.285 4639 3765 Vlissingen, Immingham, Hafnarfjordur
0.142 548 445
Immingham, Rotterdam Helsinki, Muuga (Tallinn)
LO‐LO 0.285 1096 890
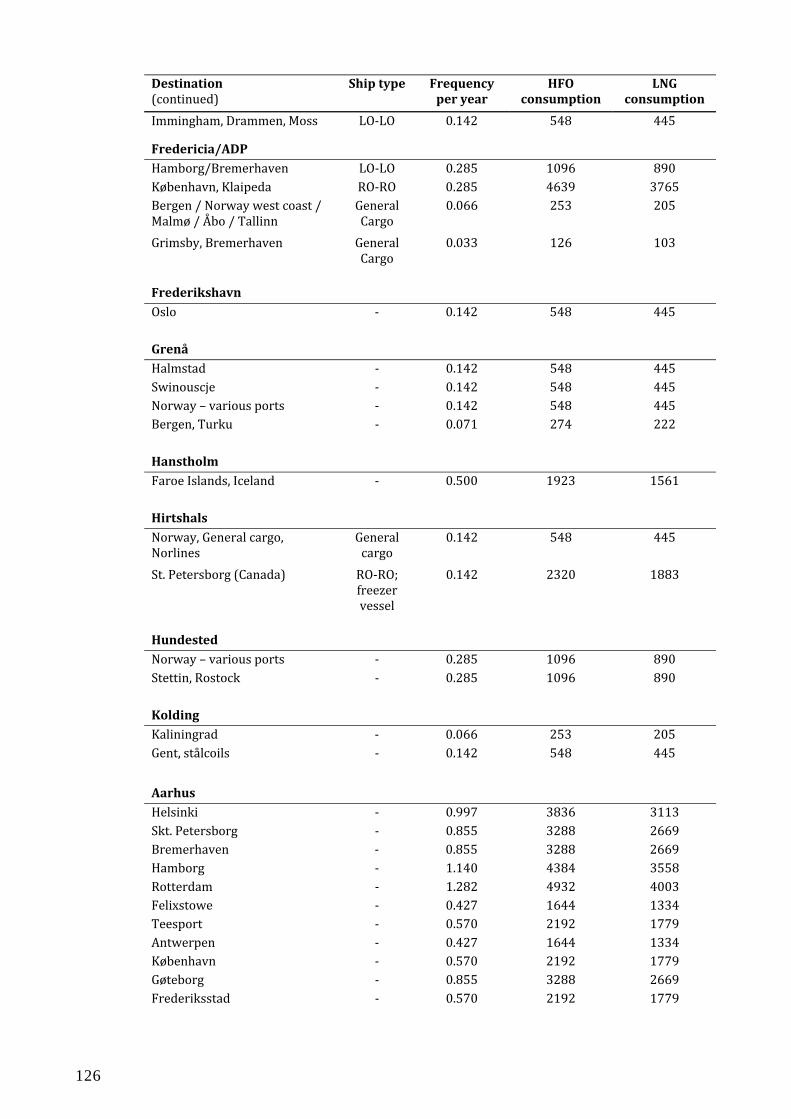
126
Destination (continued)
Ship type Frequency per year
HFO consumption
LNG consumption
Immingham, Drammen, Moss LO‐LO 0.142 548 445
Fredericia/ADP Hamborg/Bremerhaven LO‐LO 0.285 1096 890 København, Klaipeda RO‐RO 0.285 4639 3765 Bergen / Norway west coast / Malmø / Åbo / Tallinn
General Cargo
0.066 253 205
Grimsby, Bremerhaven General Cargo
0.033 126 103
Frederikshavn Oslo ‐ 0.142 548 445 Grenå Halmstad ‐ 0.142 548 445 Swinouscje ‐ 0.142 548 445 Norway – various ports ‐ 0.142 548 445 Bergen, Turku ‐ 0.071 274 222 Hanstholm Faroe Islands, Iceland ‐ 0.500 1923 1561 Hirtshals Norway, General cargo, Norlines
General cargo
0.142 548 445
St. Petersborg (Canada) RO‐RO; freezer vessel
0.142 2320 1883
Hundested Norway – various ports ‐ 0.285 1096 890 Stettin, Rostock ‐ 0.285 1096 890 Kolding Kaliningrad ‐ 0.066 253 205 Gent, stålcoils ‐ 0.142 548 445
Aarhus Helsinki ‐ 0.997 3836 3113 Skt. Petersborg ‐ 0.855 3288 2669 Bremerhaven ‐ 0.855 3288 2669 Hamborg ‐ 1.140 4384 3558 Rotterdam ‐ 1.282 4932 4003 Felixstowe ‐ 0.427 1644 1334 Teesport ‐ 0.570 2192 1779 Antwerpen ‐ 0.427 1644 1334 København ‐ 0.570 2192 1779 Gøteborg ‐ 0.855 3288 2669 Frederiksstad ‐ 0.570 2192 1779
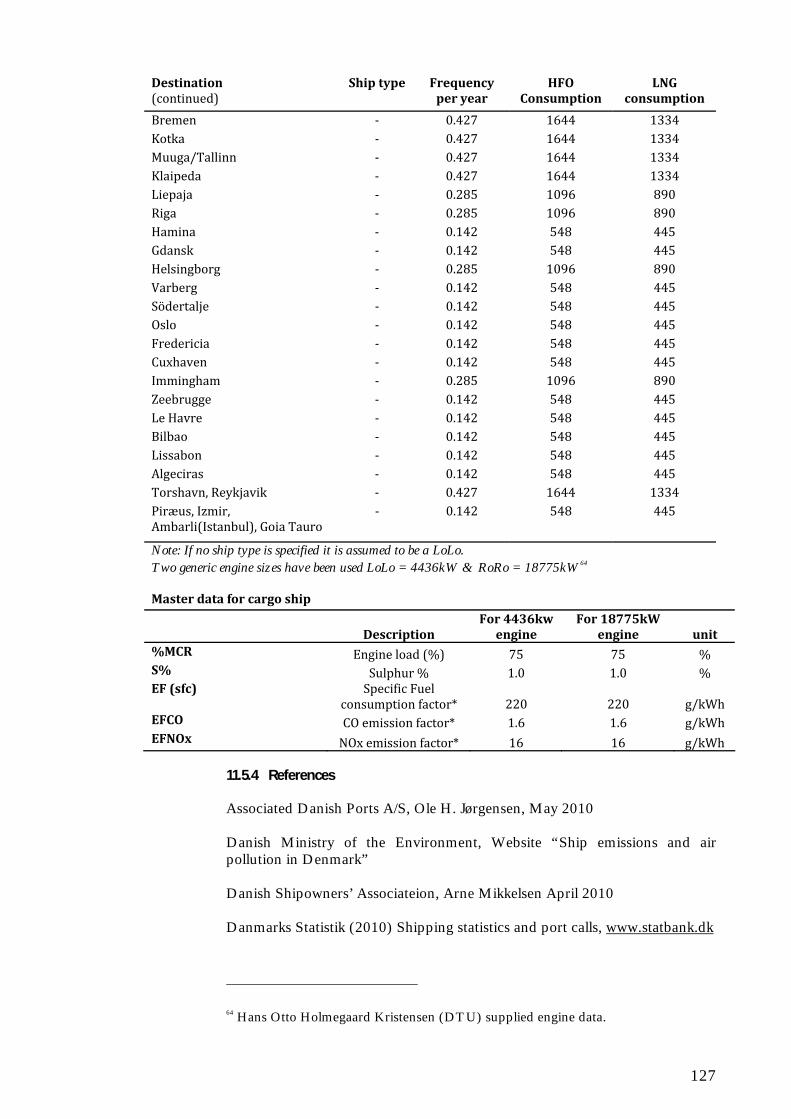
127
Destination (continued)
Ship type Frequency per year
HFO Consumption
LNG consumption
Bremen ‐ 0.427 1644 1334 Kotka ‐ 0.427 1644 1334 Muuga/Tallinn ‐ 0.427 1644 1334 Klaipeda ‐ 0.427 1644 1334 Liepaja ‐ 0.285 1096 890 Riga ‐ 0.285 1096 890 Hamina ‐ 0.142 548 445 Gdansk ‐ 0.142 548 445 Helsingborg ‐ 0.285 1096 890 Varberg ‐ 0.142 548 445 Södertalje ‐ 0.142 548 445 Oslo ‐ 0.142 548 445 Fredericia ‐ 0.142 548 445 Cuxhaven ‐ 0.142 548 445 Immingham ‐ 0.285 1096 890 Zeebrugge ‐ 0.142 548 445 Le Havre ‐ 0.142 548 445 Bilbao ‐ 0.142 548 445 Lissabon ‐ 0.142 548 445 Algeciras ‐ 0.142 548 445 Torshavn, Reykjavik ‐ 0.427 1644 1334 Piræus, Izmir, Ambarli(Istanbul), Goia Tauro
‐ 0.142 548 445
Note: If no ship type is specified it is assumed to be a LoLo. Two generic engine sizes have been used LoLo = 4436kW & RoRo = 18775kW64 Master data for cargo ship
Description For 4436kw engine
For 18775kW engine unit
%MCR Engine load (%) 75 75 % S% Sulphur % 1.0 1.0 % EF (sfc) Specific Fuel
consumption factor* 220 220 g/kWh EFCO CO emission factor* 1.6 1.6 g/kWh EFNOx NOx emission factor* 16 16 g/kWh
11.5.4 References
Associated Danish Ports A/S, Ole H. Jørgensen, May 2010 Danish Ministry of the Environment, Website “Ship emissions and air pollution in Denmark” Danish Shipowners’ Associateion, Arne Mikkelsen April 2010 Danmarks Statistik (2010) Shipping statistics and port calls, www.statbank.dk
64 Hans Otto Holmegaard Kristensen (DTU) supplied engine data.
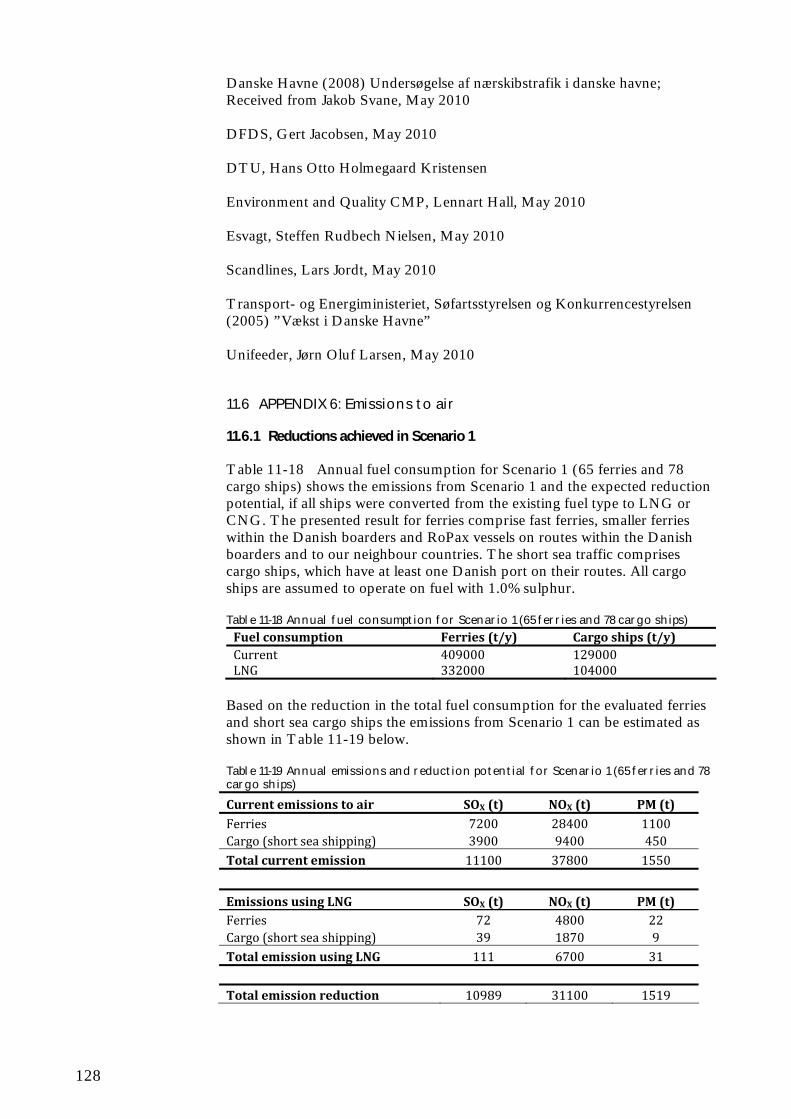
128
Danske Havne (2008) Undersøgelse af nærskibstrafik i danske havne; Received from Jakob Svane, May 2010 DFDS, Gert Jacobsen, May 2010 DTU, Hans Otto Holmegaard Kristensen Environment and Quality CMP, Lennart Hall, May 2010 Esvagt, Steffen Rudbech Nielsen, May 2010 Scandlines, Lars Jordt, May 2010 Transport- og Energiministeriet, Søfartsstyrelsen og Konkurrencestyrelsen (2005) ”Vækst i Danske Havne” Unifeeder, Jørn Oluf Larsen, May 2010
11.6 APPENDIX 6: Emissions to air
11.6.1 Reductions achieved in Scenario 1
Table 11-18 Annual fuel consumption for Scenario 1 (65 ferries and 78 cargo ships) shows the emissions from Scenario 1 and the expected reduction potential, if all ships were converted from the existing fuel type to LNG or CNG. The presented result for ferries comprise fast ferries, smaller ferries within the Danish boarders and RoPax vessels on routes within the Danish boarders and to our neighbour countries. The short sea traffic comprises cargo ships, which have at least one Danish port on their routes. All cargo ships are assumed to operate on fuel with 1.0% sulphur. Table 11-18 Annual fuel consumption for Scenario 1 (65 ferries and 78 cargo ships)
Fuel consumption Ferries (t/y) Cargo ships (t/y) Current 409000 129000 LNG 332000 104000
Based on the reduction in the total fuel consumption for the evaluated ferries and short sea cargo ships the emissions from Scenario 1 can be estimated as shown in Table 11-19 below. Table 11-19 Annual emissions and reduction potential for Scenario 1 (65 ferries and 78 cargo ships)
Current emissions to air SOX (t) NOX (t) PM (t) Ferries 7200 28400 1100 Cargo (short sea shipping) 3900 9400 450 Total current emission 11100 37800 1550
Emissions using LNG SOX (t) NOX (t) PM (t) Ferries 72 4800 22 Cargo (short sea shipping) 39 1870 9 Total emission using LNG 111 6700 31 Total emission reduction 10989 31100 1519
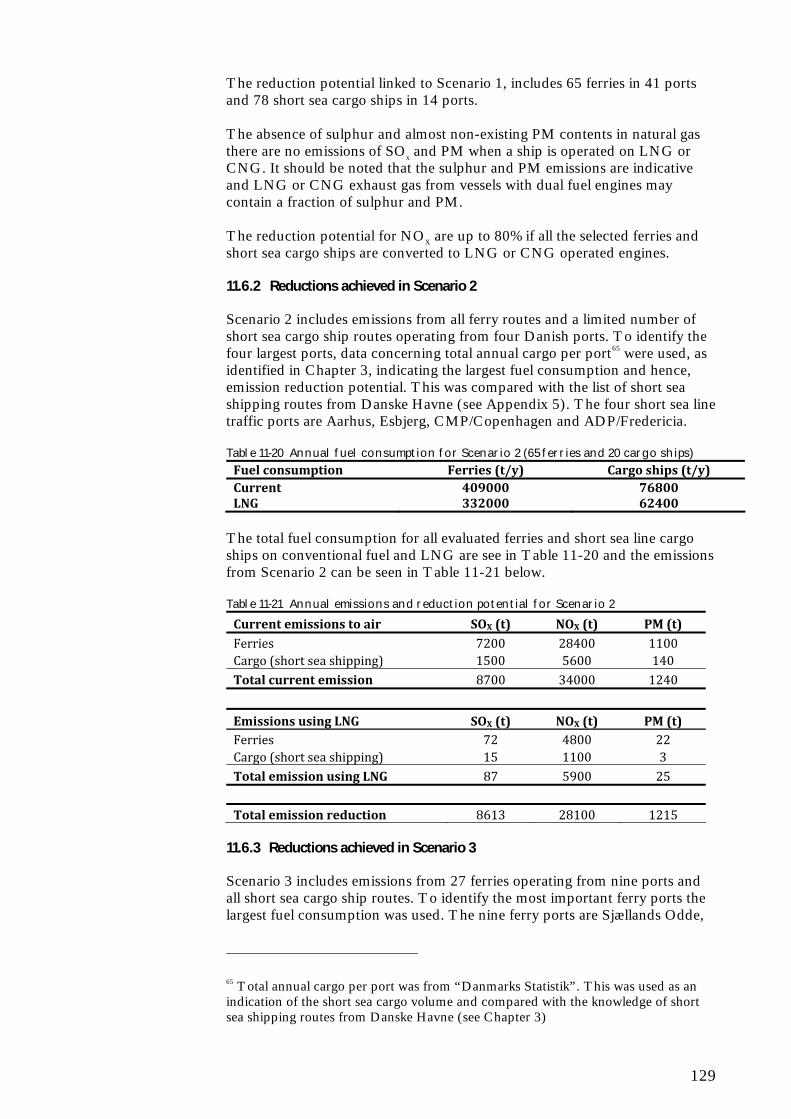
129
The reduction potential linked to Scenario 1, includes 65 ferries in 41 ports and 78 short sea cargo ships in 14 ports. The absence of sulphur and almost non-existing PM contents in natural gas there are no emissions of SOx and PM when a ship is operated on LNG or CNG. It should be noted that the sulphur and PM emissions are indicative and LNG or CNG exhaust gas from vessels with dual fuel engines may contain a fraction of sulphur and PM. The reduction potential for NOX are up to 80% if all the selected ferries and short sea cargo ships are converted to LNG or CNG operated engines. 11.6.2 Reductions achieved in Scenario 2
Scenario 2 includes emissions from all ferry routes and a limited number of short sea cargo ship routes operating from four Danish ports. To identify the four largest ports, data concerning total annual cargo per port65 were used, as identified in Chapter 3, indicating the largest fuel consumption and hence, emission reduction potential. This was compared with the list of short sea shipping routes from Danske Havne (see Appendix 5). The four short sea line traffic ports are Aarhus, Esbjerg, CMP/Copenhagen and ADP/Fredericia. Table 11-20 Annual fuel consumption for Scenario 2 (65 ferries and 20 cargo ships)
Fuel consumption Ferries (t/y) Cargo ships (t/y) Current 409000 76800 LNG 332000 62400
The total fuel consumption for all evaluated ferries and short sea line cargo ships on conventional fuel and LNG are see in Table 11-20 and the emissions from Scenario 2 can be seen in Table 11-21 below. Table 11-21 Annual emissions and reduction potential for Scenario 2
Current emissions to air SOX (t) NOX (t) PM (t) Ferries 7200 28400 1100 Cargo (short sea shipping) 1500 5600 140 Total current emission 8700 34000 1240
Emissions using LNG SOX (t) NOX (t) PM (t) Ferries 72 4800 22 Cargo (short sea shipping) 15 1100 3 Total emission using LNG 87 5900 25 Total emission reduction 8613 28100 1215
11.6.3 Reductions achieved in Scenario 3
Scenario 3 includes emissions from 27 ferries operating from nine ports and all short sea cargo ship routes. To identify the most important ferry ports the largest fuel consumption was used. The nine ferry ports are Sjællands Odde,
65 Total annual cargo per port was from “Danmarks Statistik”. This was used as an indication of the short sea cargo volume and compared with the knowledge of short sea shipping routes from Danske Havne (see Chapter 3)
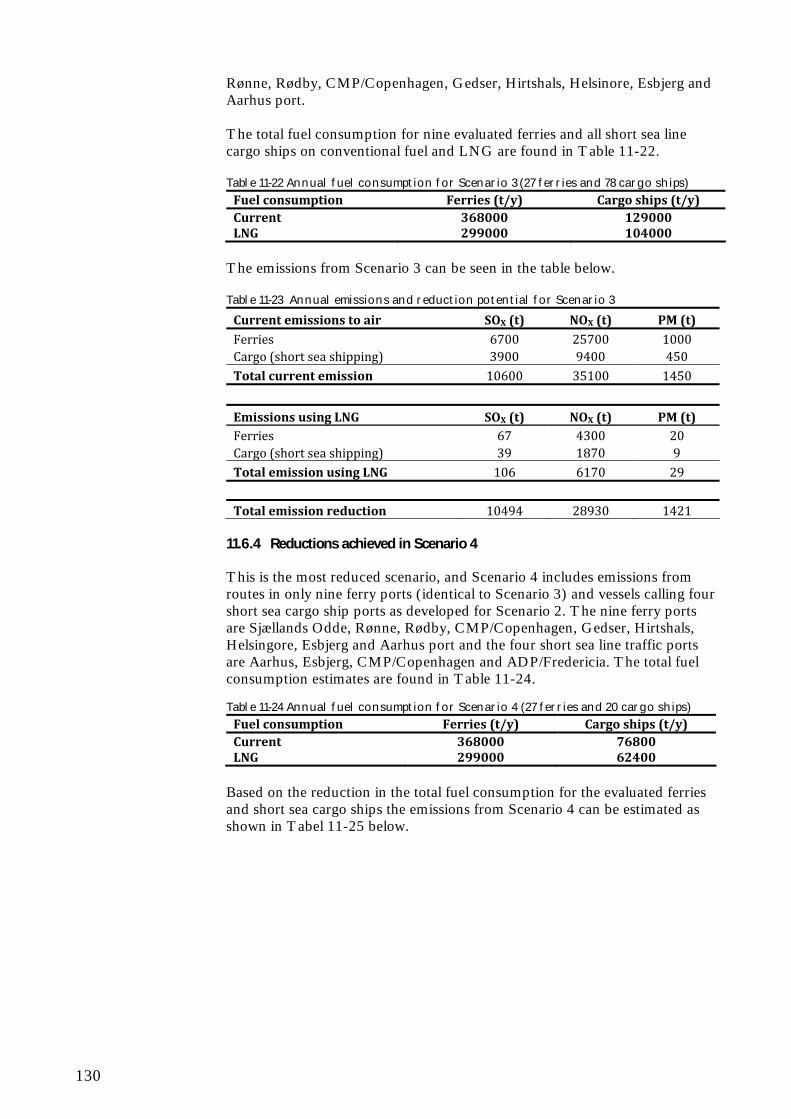
130
Rønne, Rødby, CMP/Copenhagen, Gedser, Hirtshals, Helsinore, Esbjerg and Aarhus port. The total fuel consumption for nine evaluated ferries and all short sea line cargo ships on conventional fuel and LNG are found in Table 11-22. Table 11-22 Annual fuel consumption for Scenario 3 (27 ferries and 78 cargo ships)
Fuel consumption Ferries (t/y) Cargo ships (t/y) Current 368000 129000 LNG 299000 104000
The emissions from Scenario 3 can be seen in the table below. Table 11-23 Annual emissions and reduction potential for Scenario 3
Current emissions to air SOX (t) NOX (t) PM (t) Ferries 6700 25700 1000 Cargo (short sea shipping) 3900 9400 450 Total current emission 10600 35100 1450
Emissions using LNG SOX (t) NOX (t) PM (t) Ferries 67 4300 20 Cargo (short sea shipping) 39 1870 9 Total emission using LNG 106 6170 29 Total emission reduction 10494 28930 1421
11.6.4 Reductions achieved in Scenario 4
This is the most reduced scenario, and Scenario 4 includes emissions from routes in only nine ferry ports (identical to Scenario 3) and vessels calling four short sea cargo ship ports as developed for Scenario 2. The nine ferry ports are Sjællands Odde, Rønne, Rødby, CMP/Copenhagen, Gedser, Hirtshals, Helsingore, Esbjerg and Aarhus port and the four short sea line traffic ports are Aarhus, Esbjerg, CMP/Copenhagen and ADP/Fredericia. The total fuel consumption estimates are found in Table 11-24. Table 11-24 Annual fuel consumption for Scenario 4 (27 ferries and 20 cargo ships)
Fuel consumption Ferries (t/y) Cargo ships (t/y) Current 368000 76800 LNG 299000 62400
Based on the reduction in the total fuel consumption for the evaluated ferries and short sea cargo ships the emissions from Scenario 4 can be estimated as shown in Tabel 11-25 below.
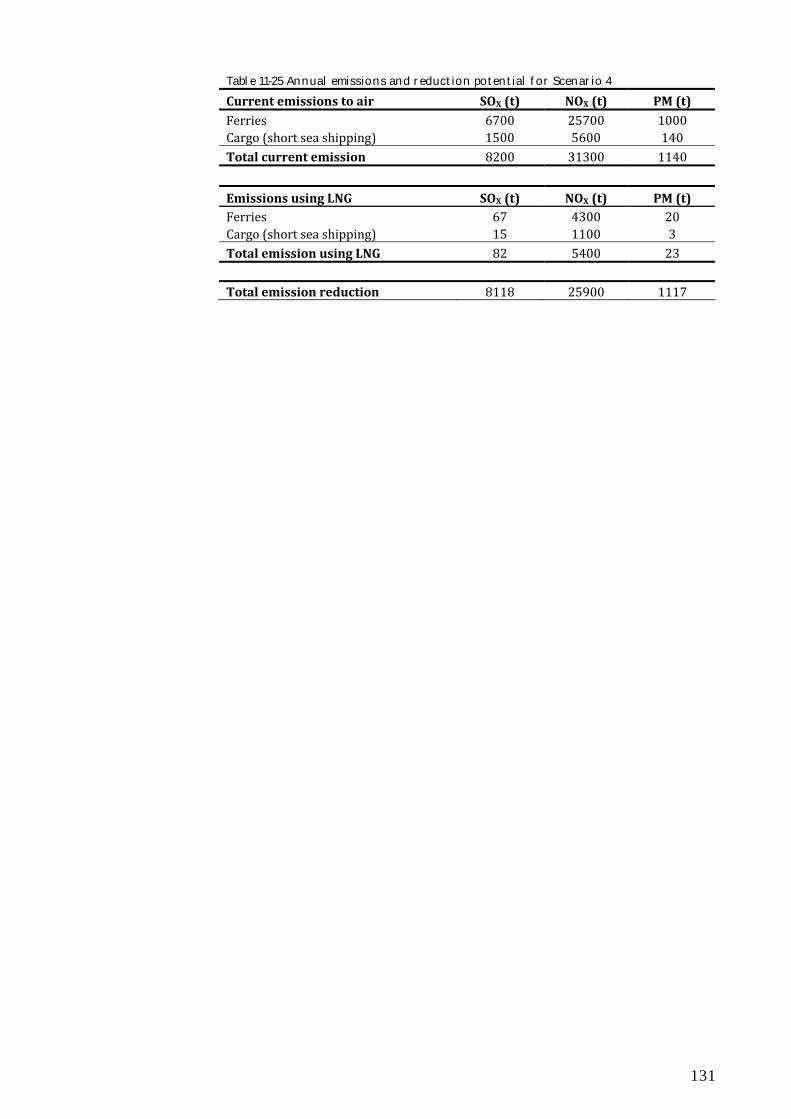
131
Table 11-25 Annual emissions and reduction potential for Scenario 4
Current emissions to air SOX (t) NOX (t) PM (t) Ferries 6700 25700 1000 Cargo (short sea shipping) 1500 5600 140 Total current emission 8200 31300 1140
Emissions using LNG SOX (t) NOX (t) PM (t) Ferries 67 4300 20 Cargo (short sea shipping) 15 1100 3 Total emission using LNG 82 5400 23 Total emission reduction 8118 25900 1117


![[PPT]SHIP PROPULSION · Web viewSHIP PROPULSION Ship (Marine) propulsion Mechanism used to move a ship across water (engine turning a propeller) Choice of a suitable powerplant depends](https://static.fdocuments.in/doc/165x107/5b314c4c7f8b9ab5728c1807/pptship-propulsion-web-viewship-propulsion-ship-marine-propulsion-mechanism.jpg)