Natural Fibers and Fiberglass: A Technical and Economic ...
100
Brigham Young University Brigham Young University BYU ScholarsArchive BYU ScholarsArchive Theses and Dissertations 2010-06-11 Natural Fibers and Fiberglass: A Technical and Economic Natural Fibers and Fiberglass: A Technical and Economic Comparison Comparison Justin Andrew Zsiros Brigham Young University - Provo Follow this and additional works at: https://scholarsarchive.byu.edu/etd Part of the Construction Engineering and Management Commons, Economics Commons, Engineering Science and Materials Commons, and the Manufacturing Commons BYU ScholarsArchive Citation BYU ScholarsArchive Citation Zsiros, Justin Andrew, "Natural Fibers and Fiberglass: A Technical and Economic Comparison" (2010). Theses and Dissertations. 2273. https://scholarsarchive.byu.edu/etd/2273 This Thesis is brought to you for free and open access by BYU ScholarsArchive. It has been accepted for inclusion in Theses and Dissertations by an authorized administrator of BYU ScholarsArchive. For more information, please contact [email protected], [email protected].
Transcript of Natural Fibers and Fiberglass: A Technical and Economic ...

Brigham Young University Brigham Young University
BYU ScholarsArchive BYU ScholarsArchive
Theses and Dissertations
2010-06-11
Natural Fibers and Fiberglass: A Technical and Economic Natural Fibers and Fiberglass: A Technical and Economic
Comparison Comparison
Justin Andrew Zsiros Brigham Young University - Provo
Follow this and additional works at: https://scholarsarchive.byu.edu/etd
Part of the Construction Engineering and Management Commons, Economics Commons, Engineering
Science and Materials Commons, and the Manufacturing Commons
BYU ScholarsArchive Citation BYU ScholarsArchive Citation Zsiros, Justin Andrew, "Natural Fibers and Fiberglass: A Technical and Economic Comparison" (2010). Theses and Dissertations. 2273. https://scholarsarchive.byu.edu/etd/2273
This Thesis is brought to you for free and open access by BYU ScholarsArchive. It has been accepted for inclusion in Theses and Dissertations by an authorized administrator of BYU ScholarsArchive. For more information, please contact [email protected], [email protected].

Natural Fibers and Fiberglass: A Technical and Economic Comparison
Justin A. Zsiros
A thesis submitted to the faculty of Brigham Young University
in partial fulfillment of the requirements for the degree of
Master of Science
A. Brent Strong, Chair Kent E. Kohkonen David T. Fullwood
School of Technology
Brigham Young University
August 2010
Copyright © 2010 Justin Zsiros
All Rights Reserved

ABSTRACT
Natural Fibers and Fiberglass: A Technical and Economic Comparison
Justin Zsiros
School of Technology
Master of Science
Natural fibers have received attention in recent years because of their minimal environmental impact, reasonably good properties, and low cost. There is a wide variety of natural fibers suitable for composite applications, the most common of which is flax. Flax has advantages in tensile strength, light weight, and low cost over other natural fibers. As with other natural and synthetic fibers, flax is used to reinforce both thermoset and thermoplastic matrices. When flax is used in thermoplastic matrices, polypropylene and polyethylene are the main resins used. Although at first glance flax may seem to be a cheaper alternative to fiberglass, this may not necessarily be as advantageous as one would hope. A full economic valuation should be based on raw material costs and full processing costs. Although flax fibers used in composites are generally a waste product from linen flax, they require additional processing which can significantly reduce flax’s economic advantage over glass. This paper attempts to place some measure of economic comparison coupled with property comparisons between natural (mainly flax) fibers and glass fibers. Our tests compare tensile, flexural, and drop impact properties, as well as heat sensitivity, and colorant acceptance. Keywords: Justin Zsiros, natural fiber, flax, composite, thermoplastic, fiberglass

Brigham Young University
SIGNATURE PAGE
of a thesis submitted by
Justin A. Zsiros The thesis of Justin A. Zsiros is acceptable in its final form including (1) its format, citations, and bibliographical style are consistent and acceptable and fulfill university and department style requirements; (2) its illustrative materials including figures, tables, and charts are in place; and (3) the final manuscript is satisfactory and ready for submission. ________________________ ________________________________________________ Date A. Brent Strong, Chair ________________________ ________________________________________________ Date Kent E. Kohkonen ________________________ ________________________________________________ Date David T. Fullwood ________________________ ________________________________________________ Date Ronald E. Terry, Graduate Coordinator ________________________ ________________________________________________ Date Alan R. Parkinson, Dean, Ira A. Fulton College of Engineering and Technology

TABLE OF CONTENTS
LIST OF TABLES ...................................................................................................................... vii
LIST OF FIGURES ................................................................................................................... viii 1 Introduction ......................................................................................................................... 1
1.1 Society’s Focus on Green Renewable Materials ...................................................... 2
1.2 Need for Examining Injection Molded Flax Fiber Composites and Comparing them to Fiberglass Composites ............................................................. 3
1.3 Proposal ......................................................................................................................... 4
1.4 Thesis Statement .......................................................................................................... 5
1.5 Acceptance Criteria ...................................................................................................... 5
1.6 Assumptions and Delimitations ................................................................................ 6
1.7 Definition of Terms ...................................................................................................... 6
2 Literature review................................................................................................................... 9
2.1 Introduction .................................................................................................................. 9
2.2 Composites.................................................................................................................. 10
2.3 Fiberglass and Owens Corning Studies .................................................................. 11
2.3.1 Tensile and Flexural Modulus .............................................................................. 11
2.3.2 Tensile and Flexural Strength ............................................................................... 14
2.3.3 Impact Toughness .................................................................................................. 17
2.3.4 Injection Molding and Impact Strength, Tensile and Flexural Strength and Modulus ........................................................................................... 18
2.3.5 Cost to Purchase and Energy Required to Produce Fiberglass ....................... 24
iv

2.4 Natural Fibers ............................................................................................................. 24
2.4.1 Structure of Natural Fibers ................................................................................... 26
2.4.2 Flax ........................................................................................................................... 34
2.4.3 Sisal .......................................................................................................................... 37
2.4.4 Jute ............................................................................................................................ 38
2.4.5 Processing of Natural Fibers................................................................................. 40
2.5 Natural Fibers in Composites: Applications and Markets .................................. 42
2.5.1 Applications ............................................................................................................ 42
2.5.2 North American ..................................................................................................... 43
2.5.3 Europe ...................................................................................................................... 44
2.6 Fiber Matrix Adhesion .................................................................................................. 46
2.7 Processing Effects ......................................................................................................... 49
2.8 Theoretical Modeling .................................................................................................... 50
3 Experimental Procedure ................................................................................................... 53
3.1 Resin ............................................................................................................................. 53
3.2 Flax Fibers ................................................................................................................... 53
3.3 Fiber Processing Steps ............................................................................................... 54
3.4 Laboratory Procedure ............................................................................................... 58
3.4.1 Sample Creation ..................................................................................................... 58
3.4.2 Temperature Sensitivity ........................................................................................ 59
3.4.3 Colorant Tests ........................................................................................................... 62
3.4.4 Mechanical Tests ...................................................................................................... 63
4 Results ................................................................................................................................. 67 v

vi
4.1 Impact Properties ....................................................................................................... 68
4.2 Tensile Properties ....................................................................................................... 71
4.3 Flexural Properties ..................................................................................................... 76
4.4 Economic Comparison .............................................................................................. 79
5 Chapter 5 ............................................................................................................................. 81
5.1 Suggested Future Testing ......................................................................................... 83

LIST OF TABLES
Table 1 ...................................................................................................................................23
Table 2 Fiber Properties .........................................................................................................33
Table 3 Impact Toughness Values Per Sample ......................................................................69
Table 4 Impact Toughness 95% Confidence Intervals ..........................................................70
Table 5 Tensile Stength 95% Confidence Intervals ...............................................................73
Table 6 Young's Modulus 95% Confidence Intervals ...........................................................76
Table 7 Economic Comparison ..............................................................................................80
vii

LIST OF FIGURES
Figure 1 Tensile Modulus ......................................................................................................12
Figure 2 Flexural Modulus.....................................................................................................13
Figure 3 Tensile Strength .......................................................................................................15
Figure 4 Flexural Strength .....................................................................................................16
Figure 5 Notched Charpy Impact ...........................................................................................18
Figure 6 Tensile Modulus ......................................................................................................19
Figure 7 Flexural Strength .....................................................................................................20
Figure 8 Tensile Strength .......................................................................................................20
Figure 9 Notched Izod ...........................................................................................................21
Figure 10 Unnotched Izod .....................................................................................................22
Figure 11 Ancient Native American Structure ......................................................................25
Figure 12 Plant Fiber Groups .................................................................................................26
Figure 13 Common Natural Fiber Plants ...............................................................................27
Figure 14 Bails of Sisal Fibers ...............................................................................................28
Figure 15 Flax Stem Cross-section ........................................................................................29
Figure 16 Composite Plant Cell Structure and Components .................................................30
Figure 17 Cellulose ................................................................................................................31
Figure 18 Possible Structure of Lignin ..................................................................................32
Figure 19 From top: Flax Seeds, Flax Fields, Flax Flower ...................................................36
Figure 20 Sampling of Flax Products ....................................................................................36
Figure 21 Sisal Plant ..............................................................................................................37
Figure 22 Grain silos from Jute .............................................................................................39
viii

ix
Figure 23 1/3 Scale Madras House made of Jute and Polyester ............................................39
Figure 24 Stages of Retting....................................................................................................41
Figure 25 Cellulose Filaments ...............................................................................................42
Figure 26 Flax Interior Car Panel ..........................................................................................45
Figure 27 Natural Fiber Mat Processed into an Interior Door Panel made of 50% Kenaf 50% Polypropylene ....................................................................................46
Figure 28 Close-up of Flax Fibers .........................................................................................53
Figure 29 Fiber Growth and Processing Steps .......................................................................54
Figure 30 Stages of Retting....................................................................................................55
Figure 31 Injection Molding Conditions ...............................................................................58
Figure 32 From right - neat resin in hand; flax fibers; hand mixed and injection molded sample; pelletized and injection molded sample ......................................59
Figure 33 Pelletized Resin with Flax .....................................................................................59
Figure 34 Lignin Removal from Cellulose Based Materials .................................................61
Figure 35 Samples with colorant 1% at left ...........................................................................62
Figure 36 Samples of Injection Molded Specimens with no Colorant ..................................62
Figure 37 Instron Testing Machine with 3 Point Flex Test Fixture .......................................63
Figure 38 Average Impact Toughness Values .......................................................................69
Figure 39 Tensile Stress vs. Strain .........................................................................................72
Figure 40 Average Tensile Strength ......................................................................................73
Figure 41 Average Young's Modulus ....................................................................................75
Figure 42 Flexural Stress vs. Strain .......................................................................................77
Figure 43 Average Flexural Modulus ....................................................................................78
Figure 44 Percent Change from Neat Resin .........................................................................82

1 INTRODUCTION
Many applications use plastic parts, but require more strength and stiffness than
plastic alone offers. Metal parts are often too expensive, far exceed the necessary
mechanical properties, or are too heavy. Therefore, composite parts are becoming
increasingly popular.
Composite materials are composed of two distinct parts: a resin/matrix and a
fiber. The first composite materials date back thousands of years to the time of the
Egyptians – using straw (i.e. large fibers) with mud (i.e. matrix) for brick building. In
recent history, man‐made fibers and resins have been created and used to make
composite parts. One large advantage of a composite material is the designer can select
from a wide array of resins and fibers. The combination of different resins and fibers
lead to almost countless distinct sets of properties. Therefore, the composite designer
can more precisely tailor the material for the application. Indeed, the design of the
material may be just as involved as the design of the product itself.
1

Fiberglass is the most well known and widely used man‐made fiber, and along
with polyester resin make up the largest portion of the composites market. Carbon
fiber and aramid fiber are two other man‐made fibers, and are used in higher‐end
applications such as advanced aircraft, bullet‐proof and heat resistant clothing, and
sports equipment. In addition, some less common fibers are UHMWPE (ultra high
molecular weight polyethylene), boron, and nylon.
However, recently natural fibers have gained attention, and have become
popular in products. Flax, sisal, hemp, and jute are a few of the most common of these
natural fibers. Many companies are now considering these natural fiber composites for
more products. However, despite some advantages of natural fibers it is uncertain
whether they can play a major role in modern composite materials.
1.1 Society’s Focus on Green Renewable Materials
The current global awareness of the earth’s environment appears to be reaching a
new level. Environmental considerations permeate many aspects of the political,
consumer, and industrial landscape. Politicians debate over the costs of environmental
decisions. Consumers consider the environmental impact of their purchasing power.
And, industrial companies design and market their products with an increasing
awareness and consideration for the entire product life cycle – manufacturing, usage,
and disposal or recycling. For example, the European Union has a law which places 2

end‐of‐life vehicle regulations for all cars and light trucks. This regulation states that
the current 25% waste (i.e. a quarter of all material in a car that goes to a landfill and
cannot be recycled) must be reduced to 5% by 2015 (Kanari, 2003)
To adapt to modern thought, manufacturers and engineers must design and
make products that are less harmful to the environment (i.e. produce less emissions,
require fewer finite/limited resources, and instead use more renewable resources). The
use of flax fibers has gained popularity because they address the need for renewable
materials while providing some improvements to mechanical properties. They are
lighter in weight than their direct competitor – fiberglass, and require less energy to
grow, harvest and process – the energy required to produce a glass fiber mat is 54.8
MJ/kg, while that required for a natural fiber mat is only 9.7 MJ/kg (including
cultivation, harvesting, and fiber processing) (Schlosser, 2004). Perhaps one of the most
important aspects is the economic one. The fibers are already widely grown and used
throughout various regions of the world, and are reasonably priced.
1.2 Need for Examining Injection Molded Flax Fiber Composites and Comparing them to Fiberglass Composites
There are already many studies on flax fiber composites, and how they compare
to glass fibers. While these studies provide useful information on mechanical and other
properties, they do not adequately address the economical aspects. The majority of
3

studies done up to this point use compression molding, film stacking, resin transfer
molding, vacuum injection, vacuum pressing, and other methods, but not injection
molding. Indeed, the majority of natural fiber composites are not injection molded –
e.g. in Germany 99% of natural fiber composites are compression molded (Karus, 2004).
However, there is a need to addresses injection molding of short fiber flax‐
thermoplastic composites. Flax fiber composites will likely be applicable where
strength and price tradeoffs are important considerations. Injection molding is of
particular interest because of its role in mass‐production consumer products. The end
goal of injection molded natural fiber reinforced composites is, therefore, to meet a
minimum standard of performance while reducing cost, and decreasing ecological
impact for high volume consumer products. Especially in a scenario where a product is
made of plastic, but requires more strength, yet does not justify the jump to fiberglass
flax fibers may be the answer.
1.3 Proposal
In order to provide relevant data on injection molded flax fiber composites two
areas need to be addressed: mechanical performance and economical costs. Mechanical
testing will provide important data about the performance of injection molded samples
– e.g. tensile, flexural and impact properties. Performance of fiberglass composites is
already well documented. This thesis will use results from testing and documented 4

results for fiberglass. In addition, data obtained from the flax fiber provider, and
current market data for fiberglass will be compared. Using results from economic and
mechanical performance data we can determine whether flax can compete with
fiberglass.
1.4 Thesis Statement
The purpose of this thesis is to identify whether flax is a potentially economical,
ecological, and performance substitute for glass fiber composites. It specifically
addresses linen flax fibers and common thermoplastic matrices (polyethylene and
polypropylene). If the renewable fibers are competitive with the incumbent glass fibers,
then potential applications range from automobile parts to small consumer products.
1.5 Acceptance Criteria
In order to establish if flax is a viable alternative to fiberglass it is necessary to
determine acceptance criteria. It is presumed that flax will fit the void between
fiberglass loaded resin and neat resin. When more strength than neat resin alone offers,
but the strength of fiberglass is too much, flax may be the answer. Therefore, if the fiber
loaded resin has statistically significant higher properties than the neat resin, it is
deemed acceptable. Therfore, the null hypothesis is that there is no significant
difference between neat resin and the fiber loaded resin. For acceptance of the
5

economic factors, flax will be acceptable if it is on a whole less expensive than the
fiberglass per unit of weight.
1.6 Assumptions and Delimitations
This research is limited to flax fiber in a heterogeneous mixture with
polypropylene and high‐density polyethylene (HDPE). It does not include long fibers,
mats, or cloths used with thermoset resins. Samples include injection molded
specimens, and do not address any other type of molding (such as the more common
compression molded composites). Also, no coupling agent was used to improve fiber‐
matrix bonding. It is assumed that samples of flax fibers were processed under the
exact same conditions, although flax was processed and compounded with resin by a
third party. Due to the changing prices of materials and processing technologies, the
economic comparison between flax and fiberglass is likely to change over time.
1.7 Definition of Terms
Bast – the stalk or stem part of the plant. Bast fibers are those fibers which come from
the stem part of the plant, e.g. flax, hemp, jute.
Lignin – a component in all plant structures. An organic phenolic based polymer whose
structure is unknown but thought to be highly aromatic. Lignin is the binding material
which joins cellulose molecules, crosslinking to them. If a plant structure is viewed as a
6

composite itself the lignin is viewed as the matrix, and the fibers are the cellulose
molecules.
Cellulose – the main fibrous material of a plant. Cellulose molecules are essentially
glucose molecules held together with hydrogen bonds.
Fiber and fiber bundle – there are many terms used to describe fibers and fiber bundles
which can be confusing: some call them macro/micro fibrils, others simply call them
fibers, and yet others call them technical or elementary fibers. However, according to
an article on nomenclature for plant fibers the term fiber should refer only to an
individual plant cell with high aspect ratio (Vincent, 2000). Therefore, “fibers” are not
visible to the naked eye. The term fiber bundle should be used to describe the fibers
visible to the naked eye. In addition, the term microfibril refers to microscopic
filaments present within the cell wall and are therefore even smaller than individual
fibers.
Retting – a process used to break down lignin in natural fibers using bacteria and
microorganisms in water or dew. During this process plant stalks are exposed to water
and allowed to partially break down.
Scutching – anciently a hand process of beating stalks and drawing them through hooks
to remove plant stalks, lignin (degraded from retting), and other unwanted materials
7

8
found in the plants. Now, the process is done using machines but the purpose is the
same.
Fibrulating – a process used to cut the soft natural fibers into segments, and further
isolate the soft fibers from the woody material of the plant. This process uses a type of
hammer‐mill and various sized screens to ensure the fibers are the correct length.
Compounding – the process of mixing soft flax fibers and neat resin in a heated
environment to ensure a uniform heterogeneous mixture (i.e. even dispersion of fibers).
Pelletizing – the process of extruding the compounded resin and fibers, cooling the
plastic, and then cutting the plastic to small pieces suitable for injection molding
(typically 3‐6mm in length).

2 LITERATURE REVIEW
2.1 Introduction
As the technology of producing synthetic products has improved over the last
hundred years, there has been a shift from natural products to synthetic products
because of the superior properties and reliability of the synthetic materials. Recently,
that shift has begun to turn around. The transformation is currently from synthetic
materials to natural materials that have the same properties (or, at least, acceptable)
compared to the synthetic materials. The push for this transformation is an increasing
acceptance of our responsibility to the environment. As such, the entire product life
cycle is taken into consideration – creation, use, and disposal. Design now considers the
total absolute cost (i.e. how much it costs to make, maintain, and dispose). Socially
responsible companies no longer consider only the cost of production, but also the cost
of recycling/disposing of the product as well as the costs in terms of carbon footprint in
manufacturing the product.
9

2.2 Composites
The definition of a composite is a material made of two or more distinct parts in
separate phases. Examples of different composite materials are: regular and steel
reinforced concrete, fiber reinforced plastics, ceramic mixtures, rubber reinforced
plastics, wood laminates, etc. (Strong, 2008). Most often the term composite refers to a
solid material made of a reinforcement fiber and a binding polymer matrix. Composites
today are commonly made of a polyester thermoset resin and glass fibers, or an epoxy
resin and carbon fibers. These are only two of the most common examples. However,
there is a large variety of resin and reinforcement combinations. Some examples of
matrices are: polyester, epoxy, polyimide, phenolic, and some thermoplastics such as
nylon, polyethylene, polypropylene, etc. The following are some examples of
reinforcement fibers: glass, carbon, aramid, UHMPE (ultra high molecular weight
polyethylene), boron, and natural fibers such as flax, wood, kenaf, jute, hemp, etc.
Matrices and reinforcement fibers can be grouped into customized combinations to
provide the most appropriate properties for a specific application.
The modern composites era began in 1908 with cellulose fiber reinforced
phenolics (Mohanty, 2005). However, cellulose fibers were soon overlooked as
fiberglass entered the market. It was around the 1940’s when composites with polyester
resin and fiberglass became commodities. Fiberglass has many mechanical property
10

advantages over natural fibers. Fiberglass is not subject to the growing cycle of plants,
and can be produced with a high degree of consistency in length and diameter. It is
also not susceptible to rotting or attack by microorganisms.
2.3 Fiberglass and Owens Corning Studies
Fiberglass is by far the most common reinforcement fiber – used in 95% of all fiber
reinforcement applications (Mohanty, 2005). As it is the fiber reinforcement of highest
use, it serves as the most appropriate comparison to flax fibers.
2.3.1 Tensile and Flexural Modulus
The first study focuses on the effects of fiber length and concentration on
stiffness – i.e. tensile and flexural modulus (Thomason, 1996). The series of samples,
indicated by A‐0.1, A‐0.8, A‐6, B‐ext, and B‐6 refer to the method of sample creation and
resin type (A or B), and the fiber length( 0.1mm, 0.8mm, 6mm, or extrusion length).
Samples in Series A were created by a wet deposition method and the layers were
stacked and compression molded. The resins are very similar (both polypropylene) the
series A resin has a melt index 5x greater than the resin in series B samples. Also, series
B samples were created in the same method, however the final sheets of material were
cut into pieces, extruded, pelletized, and compression molded. The purpose was to
simulate the processing and fiber length found during injection molding.
11

The testing showed a linear increase in tensile modulus as fiber content increased
from 0 to 40 percent, see Figure 1 (Thomason, 1996). Tensile modulus for the neat resin
was just over 1 GPa, 2.5 GPa at 10% fiber content, about 3.5 GPa at 20% content, 5 GPa
at 30% content, and 6 GPa at 40% content.
Figure 1 Tensile Modulus
12

Flexural modulus increased in roughly the same manner, see Figure 2
(Thomason, 1996). Flexural modulus for the neat resin was 1.5 GPa, 2.5 GPa at 10%
content, 3.5 GPa at 20% content, about 4.5 GPa at 30% content, and 6GPa at 40% content.
Figure 2 Flexural Modulus
Results for fiber length show that tensile and flexural moduli are insensitive to
fiber length over 0.5mm – i.e. a fiber length below 0.5mm decreases the moduli.
13

However, fiber length does affect fiber packing especially at higher lengths. Therefore,
packing problems may cause decreases in tensile and flexural moduli.
As mentioned previously, the above samples were prepared by compression
molding and simulated injection molding. This study showed that pre‐extruded
samples also increased tensile and flexural modulus with an increase in fiber content.
However, the linear relationship was not as steep as the earlier compression molded
samples (see series B‐ext in Figures 1 and 2).
It is interesting to note that this study also looked at the effect of matrix
properties. The study tested and compared two different grades of polypropylene (the
main difference was the molecular weight and melt index). The authors conclude that
the molecular weight and melt index of the matrix have little effect on tensile and
flexural moduli.
2.3.2 Tensile and Flexural Strength
The third article by Owens Corning Fiberglass addressed tensile and flexural
strength and strain related to fiber length and fiber concentration. The samples were
prepared in the same manner as noted in the earlier studies. Results show a marked
decrease in strain to failure as fiber content increased. However, fiber length appears to
have a more complicated effect on strain. There is no clear trend as to how fiber length
affects strain to failure. Tensile strength increased linearly as fiber concentration 14

increased up to 60 percent. Tensile strength with no fibers was about 32 MPa. This
increased to about 65 MPa at 40% concentration, and up to 95 MPa at 60%
concentration. However, pre‐extruded samples appeared to decrease tensile strength,
see series B‐ext in Figures 3 and 4 (Thomason, 1996).
Figure 3 Tensile Strength
15

Figure 4 Flexural Strength
Flexural strength also increased linearly with increasing concentration – up to a
point. At concentrations higher than 30 percent, the flexural strength reached a plateau
and then decreased. Flexural strength with no fibers was almost 50 MPa, and reached
as high as 130 MPa at 30% fiber concentration. Increasing fiber length also increased
tensile strength up until about 3‐6mm after which tensile strength leveled out.
16

This study also included pre‐extruded samples to simulate injection molding
fiber lengths (see B‐ext in Figures 3 and 4). The results for these samples show a
decrease in tensile strength and negligible increase in flexural strength as fiber content
increases. It is apparent that very short glass fiber lengths (0.2 to 0.4 mm) typical of
injection molding do not improve tensile or flexural strength, according to this Owens
Corning study.
2.3.3 Impact Toughness
The fourth article in this series addressed the effect of fiber length and
concentration on composite impact properties. Results show a linear increase in
notched Charpy impact toughness with an increase in fiber content.
Impact strength increased from roughly 2 kJ/m2 with no fibers, to a range of 25‐
45 kJ/m2 at 40% fiber concentration (depending on the fiber length). Increases in fiber
length caused an increase in Charpy impact up to a length of about 6 mm. After 6mm,
fiber length had a minimal effect on impact toughness. As fiber content increased, pre‐
extruded samples show a negligible increase in impact toughness for the notched
Charpy test, see series B‐ext in Figure 5 (Thomason, 1997).
.
17

Figure 5 Notched Charpy Impact
2.3.4 Injection Molding and Impact Strength, Tensile and Flexural Strength and Modulus
The fifth article in this series provided excellent insight. It focused on
mechanical properties of injection molded long (1‐25 mm) and short (< 1 mm) glass
fibers. This study created testing specimens using injection molding – different from
the previous studies which used compression molding, and simulated injection
molding through extrusion. In addition, this study used different suppliers of
fiberglass and polypropylene. Most important, a coupling agent was also added to
improve fiber matrix adhesion. In general, the long fiber samples performed better than
18

the shorter fibers, and the small diameter short‐fibers performed better than the large
diameter short‐fibers. Series are differentiated by fiber length and diameter: Diamond –
long fibers (1‐25mm long, 19 um dia.), Square – short fibers (<1mm long, 19 um dia.),
and Triangle – short fibers (<1mm long, 14 um dia.). Results show a linear increase in
tensile modulus corresponding to an increase in fiber content, see Figure 6(Thomason,
2002).
Figure 6 Tensile Modulus
Tensile and flexural strengths increased as fiber content rose, but the slope
gradually decreased, see Figures 7 and 8 (Thomason, 2002). In other words, each
increase in fiber content had a relatively lesser influence on tensile/flexural strength
19

than the previous one. The maximum strength was found at a fiber content level of 40‐
50%.
Figure 7 Flexural Strength
Figure 8 Tensile Strength
20

Impact tests showed a gradual increase in impact toughness as fiber content
increased, for both Charpy and Izod notched tests, see Figures 9 and 10 (Thomason,
2002). Unnotched impact strength was initially lowered by the short fibers, at 10%, and
then gradually increases although never regaining the same level of strength as the neat
resin.
Figure 9 Notched Izod
21

Figure 10 Unnotched Izod
Long fibers at 10% content also dropped the impact strength to below the neat resin’s
value. However for long fibers, at about 35%, the impact strength reached a maximum
(1.0 kJ/m) which was greater than the neat resin’s value (0.8 kJ/m). This is in contrast to
the short fibers which did not improve the impact strength at all.
22
It is not easy to simplify fiber‐concentration and fiber‐length effects on composite
properties. Critical values vary from one property to the next. For example, the article
just discussed notes the maximum stiffness is obtained with a fiber length of only 1mm.
However, to attain the maximum strength a fiber length of 7mm is required. And,
maximum notched impact toughness is attained at a fiber length of 16mm. In addition,
injection molding complicates this further by degrading fiber lengths while the screw
turns in the barrel.

The researchers comment that, in general, the amount of energy required to
initiate a crack through impact and propagate it is more than one order of magnitude
greater than the energy required simply to propagate an already existing crack/notch.
Fibers reduce the energy necessary to begin a crack. The authors add that while the
addition of fibers to a thermoplastic greatly reduces the force required to initiate a
crack, fibers also simultaneously impede crack propagation. In other words, adding
fibers increases the risk of starting a crack, but limits the crack continuing through the
plastic. This explains the difference we see in the two graphs above – notched impact
tests show greater performance when fibers are present, while un‐notched tests show a
reduction in performance.
The authors then compared their experimental results to the calculations of
theoretical values. Table 1 (from their study) shows how these values compare.
Table 1
23

2.3.5 Cost to Purchase and Energy Required to Produce Fiberglass
In addition to the mechanical properties of fiberglass composites, it is important
to consider the economic aspects. According to the market price offered by Composites
One, short strand fiberglass can be purchased at $1.20/pound ($2.65/kg) as of March,
2010 (Composites One, 2010). It is interesting to note that the energy required to
produce a glass fiber mat is 54.8 MJ/kg, while that required for a natural fiber mat is
only 9.7 MJ/kg (including cultivation, harvesting, and fiber processing) (Schlosser,
2004).
2.4 Natural Fibers
Natural fiber reinforcements have been used in composites since the beginning of
history. In fact, primitive composite reinforcements were limited to natural sources.
For example, Israelites in ancient Egypt used straw to reinforce mud bricks (Exodus
5:7). There is evidence that the native peoples of the Americas also used natural fiber
reinforcements to strengthen building structures, and create nets and bags (Goldberg,
2009). We have examples of primitive natural fiber products as far back as 10,000 B.C.
24

Figure 11 Ancient Native American Structure
Figure 11 shows an ancient Native American granary in the Canyonlands area of
southern Utah. There is some evidence that these peoples may have used natural fiber
reinforcements to strengthen their building structures.
Reinforcement fibers from natural plant sources have received much attention
over the last few years. In fact, plant fibers are composites themselves. Although
composed of many different materials, the cellulose fibers act as reinforcements, and the
lignin acts as the binder/matrix (this will be discussed in more detail later).
25

Figure 12 Plant Fiber Groups
Plant fibers are divided into categories that refer to the source of the fiber: bast
(i.e. stem), leaf, seed, etc. See Figure 12 . The most commonly used in composites are
bast fibers (which include flax, hemp, jute, and kenaf), leaf fibers (which include sisal,
abaca/banana, and palm), and seed fibers (which include cotton, coconut, and kapok).
2.4.1 Structure of Natural Fibers
Before specifically addressing flax fibers, it is helpful to review basic plant
structure and chemistry. We can then understand some advantages of, and challenges
facing natural fibers. Bast fibers come from the stem of the plant, while leaf and seed
26

fibers are found in their respective parts of the plant, see Figure 13 (Sources: (Ryj, 2007)
(B., 2005) (H20‐C, 2006)). Because types of fibers come from differing locations on the
plant we see a wide span of properties and chemical makeup.
Figure 13 Common Natural Fiber Plants
Leaf fibers are coarser than bast fibers and serve useful purposes such as material
for rope, and rough fabrics. Sisal is the most commonly used leaf fiber and its source is
the agave plant, see Figure 14 (Comvaser, 2008). Another common leaf fiber comes from
the banana plant and is called abaca. Its benefits are durability and resistance to
saltwater. (Brouwer, 2000).
27

Figure 14 Bails of Sisal Fibers
Bast fibers (such as flax) are made up of a woody core (called the xylem), the bast
fibers themselves, and an outer shell, see Figure 15 (McKenzie, 2006). The actual bast
fibers are found in between this woody core and the outer layer or epidermis. Figure 15
shows a more detailed cross‐sectional view with all the distinct components of a flax
fiber. The thin bast fiber layer (between the Phloem and Cortex/Epidermis) are the
actual flax fibers used in composites. To extract these soft bast fibers from the rest of
the structure requires several processes, and is quite time consuming. It involves
retting, breaking, and scutching (these are discussed later on in more detail).
28

EP – epidermis C – cortex BF – bast fibers P – phloem X – xylem (wood core) Pi – pith
Figure 15 Flax Stem Cross‐section
All natural fibers, including flax, are composed of a number of different
components: mostly cellulose (30‐90%), hemi‐cellulose (5‐20%), lignin (2‐40%) and
pectin (0.5‐10%) (Bismarck 2005, and Kozlowski, 2001). Figure 16 illustrates typical
plant structure and its components (LadyofHats, 2007). Fibers with higher cellulose
content are stronger and more durable (Goldberg, 2005).
29

Figure 16 Composite Plant Cell Structure and Components
Cellulose and lignin compose the main part of natural fibers and create a unique
composite material in and of themselves. The cellulose and hemi‐cellulose are natural
filaments with high strength and stiffness to weight ratios. These are surrounded in a
lignin and pectin matrix which binds the cellulose (and hemi‐cellulose) creating a stiff
cellular structure. Indeed, it is likely that this structure was specifically designed for
strength and stiffness (Brouwer, 2000).
Cellulose filaments are glucose molecules held together with hydrogen bonds.
The cellulose molecules are long filaments that provide structure to a plant cell wall
(Graham, 2006). See Figure 17 (Graham, 2006).
30

Figure 17 Cellulose
As a result of the many alcohol groups and hydrogen bonding in the cellulose
molecules they are hydrophilic. Because natural fibers are hydrophilic and man‐made
polymers (e.g. polypropylene, polyethylene, etc.) are hydrophobic there are significant
problems bonding the two together. There has been a lot of recent research focused on
solving this problem. It will not be addressed in this thesis – except to say that no
compatibilizers (substances used to improve the bonding between natural fibers and a
polymer matrix) were used. However, some important studies regarding
compatibilizers are discussed later on in this chapter.
31

Lignin – an important component in the structure of a natural fiber – is an
organic phenolic polymer. It binds to the cellulose filaments – cross linking with the
different molecules. A possible structure of lignin is shown in Figure 18 – a
standardized structure of lignin has not yet been developed, but it is thought to be
highly aromatic or unsaturated (718 Bot, 2008).
Figure 18 Possible Structure of Lignin
As seen in the Table 2, flax is the strongest of natural fibers, although Jute, Hemp,
Sisal, and Pineapple come close. Flax is also the stiffest, illustrated by a high Young’s
Modulus. However, because of geographic availability and other factors, many other
32

fibers have received significant attention. Following are some common uses of just
natural fibers. Flax is commonly used in linen and canvas fire hoses. Hemp products
include rope, twine, canvas, and carpets. Jute is used to make burlap sacks, twine, and
oakum. Kenaf is also used for sacks and twine. Coir is used in brushes, door mats,
ropes, and sacks (Goldberg, 2005).
Table 2 Fiber Properties
Type Fiber Tensile Strength (MPa)
Youngsʹs Modulus (GPa)
Density (g/cm3)
Diameter (μm)
Sources
Man Made Glass 2000‐3500 70 2.5 ‐
(Mohanty, 2000) (Strong, 2008)
Bast
Flax 345‐2000 12‐85 1.5 20 (Romhany, 2003) (Bismarck, 2005) (Kozlowski, 2001)
Hemp 550‐900 70 1.47 25 (Kozlowski, 2001) (Bismarck, 2005) (Bledzki, 1999)
Jute 393‐800 13‐30 1.3‐1.49 25 (Kozlowski, 2001) (Bismarck, 2005) (Bledzki, 1999)
Leaf Sisal 468‐700 9.4‐38 1.33‐1.45 50 (Kozlowski, 2001) (Bismarck, 2005) (Bledzki, 1999)
Pineapple 413‐1627 34.5‐82.5 ‐ 20 (Bismarck, 2005)
Seed Cotton 287‐800 5.5‐12.6 1.5‐1.6 12
(Kozlowski, 2001) (Bismarck, 2005) (Bledzki, 1999)
Coir 131‐220 4‐6 1.15‐1.46 100 (Kozlowski, 2001) (Bismarck, 2005) (Bledzki, 1999)
Brajeshwar Singh and Manorama Gupta have studied the application of sisal,
jute and coir in building products such as shutters, door panels, door frames, roofing
sheets, etc. (Singh, 2005). Other thermoset composite materials have been studied and
33

their properties characterized using polyester resin and wheat straw, pineapple,
banana, and hemp fibers.
Because each fiber grows in certain climates, areas where these fibers are grown
tend to be more likely to use them in composites. Jute is grown in India and
Bangladesh. Sisal is mainly found in tropical areas of Africa, the West Indies, and the
Far East with Brazil and Tanzania leading in production volume. Kenaf is grown in the
United States. Hemp is mainly grown in temperate zones, especially central Asia. Flax
is grown in Europe, Canada, Argentina, India, Russia and a wide variety of other
locations (Mohanty, 2005). In addition to flax, two main natural fibers in the spotlight
of composites are sisal and jute. Below is a brief overview of each of them.
2.4.2 Flax
The flax plant has a blue flower and is grown in North America (mainly
Saskatchewan, North and South Dakota, and Minnesota), Asia (China & Russia), and
Europe (France, Belgium, Spain, and The Netherlands). See Figure 19 for examples of
flax seed, oil, fields, and flower (Bodnaryk, 2003). Two main varieties of flax are used:
the seed type and the linen type. Seed flax is used to produce linseed, and flax seed oil,
as well as flax seeds for use as a food product. Linen flax is grown for its soft long
fibrous stem and spun into cloth. In addition, there are a wide variety of other uses of
flax (see Figure 20 ‐ clockwise from top left: paper products, environmentally friendly 34

linoleum flooring, yarns and fabrics, industrial fibers for home and garden, cosmetics
and hair care products, Omega‐3 enriched oils for health) (Bodnaryk, 2003). It has a long
history of use ‐ dating back thousands of years. Indeed, the ancient Roman writer Pliny
The Elder said, “What department is there to be found of active life in which flax is not
employed” (Bodnaryk, 2003). When used in composites, the most common form is the
textile or linen type (as opposed to the plant grown for its oil). It is widely available,
and already mass produced. It is cheaper, tougher, less dense and less abrasive than
glass fibers, and offers reasonable increases in strength (Romhany, 699).
35

36
Figure 19 From top: Flax Seeds, Flax Fields, Flax Flower
Figure 20 Sampling of Flax Products

2.4.3 Sisal
The sisal plant is native to Mexico and Central America, but it also grown in
other tropical climates around the world. See Figure 21 (B.P., 2005). Mayans and
Aztecs used it to create fabrics (Bismarck, 2005). Several million tons of sisal fibers are
produced each year in the world, with Tanzania and Brazil as two leading production
countries (Hartemink, 1995). Currently, sisal fibers are used for interior car panels such
as door panel inserts and trunk liners (Sherman, 2010).
Figure 21 Sisal Plant
In an article entitled Plastics and Composites from Lignophenols the
authors compare whether sisal can compete with man‐made fibers (Frollini, 2004).
They consider the density of sisal and carbon: 1/5gcm3 and 1.4g/cm3, tensile strength
290 MPa and 4000 MPa, and elongation at break of 1‐1.4 % for sisal and 1.6% for carbon.
37

Ten years ago, the price of sisal was about $0.36/kg (Li, 2000). Therefore, when
comparing the cost per unit of property we find that for every dollar spent on carbon
we receive 8.0 MPa in strength, and for every dollar we spend on Sisal we receive 805.5
MPa of strength. However interesting this figure is, we must be realistic and recognize
that although sisal has an excellent rate of return for the dollar spent, its maximum
amount of investment is limited and will only return up to 290 MPa of strength.
2.4.4 Jute
In India during the 1970s some research and experimentation was done using
local jute fibers in a polyester matrix. The goal of this work was to create low cost
housing in the form of jute‐polyester structures using local materials. The work was
done in Madras, India and in the article by A.G. Winfield the structure is called “The
Madras House” (see Figure 23). Because of so much of the population live in sub‐
standard homes or are homeless the goal was to create a cheap form of adequate
housing that would improve upon the current condition. Cost objective for these jute‐
polyester homes was $345‐450. Other structures were also constructed such as grain
silos and fishing boats, as seen in Figure 22 (Winfield, 1979).
38

39
Figure 22 Grain silos from Jute
Figure 23 1/3 Scale Madras House made of Jute and Polyester
As the author mentions, affordable and suitable housing is needed in not only
India but Asia, Africa and Central and South America. Natural fibers are suitable for
such applications because they meet a minimum standard of structural rigidity and

strength, are locally available and reasonably priced, and help sustain the local
economy. The work performed was successful in determining that jute‐polyester
materials were feasible, however full scale mass production requires further study.
Therefore, natural fibers can play a very significant role in certain circumstances.
2.4.5 Processing of Natural Fibers
In order to use plant fibers, the individual fibers must be separated from one
another, and any other material such as lignin, pectin, etc. be removed.
Retting begins the process of removing non‐fibrous material from plants. It is a
chemical process that can last for several weeks. It is carried out as either a dry or wet
process. The common method is to soak the flax in water to allow chemical
decomposition of the non‐fibrous material to take place. This step is especially focused
on breaking down lignin, which is done by microorganisms in the water.
Because the processing of natural fibers can be very involved (and account for
significant costs) there has been some research and developments in this area. Dodd
and Akin published an article entitled Recent Developments in Retting and
Measurements of Fiber Quality in Natural Fibers: Pros and Cons. The authors claim
that while growing conditions account from some variation of the fibers’ properties, the
majority is caused by processing conditions (Dodd, 2005). Too much retting can
40

weaken fibers, while too little can leave coarse fibers with contaminants. See Figure 24
for stages of retting (Joybilee, 2010).
Figure 24 Stages of Retting
Two different and commonly practiced methods of retting are with water and
dew. However, recent research has involved using dew and glyphosate, enzymes, and
other chemicals. The authors conclude that using glyphosate salts promises increased
uniformity and warrants more investigation. However, chemical retting although
promising is only now being researched and is not currently financially feasible for
mass production (Dodd, 2005).
After retting, the next step is to mechanically remove the degraded lignin, pectin,
and wood core. Figure 25 shows how lignin, pectin, and hemicellulose adhere to the
cellulose molecules (Graham, 2006).
41

Figure 25 Cellulose Filaments
This process involves breaking the wood core and scutching ‐ which removes all non‐
fibrous material (Goldberg, 2005). Scutching is a simple mechanical process that beats
the plant stalk – removing the shive (woody core) and separating it from the fibers.
2.5 Natural Fibers in Composites: Applications and Markets
2.5.1 Applications
Perhaps the most common application for flax fiber composites is the automotive
industry. Holbery and Houston have published an article that informs the reader of
current natural fiber composite trends in the automotive industry (Holbery, 2006). They
include data for fiber mats – not short fiber. Nonetheless, the information they provide
42

is useful in comparing resins (polyester, vinyl ester, epoxy, PP, PE, PS, and Nylon). The
article is of further use because it provides processing techniques for appropriate
applications. Some specifics are given, such as the upper temperature limit for flax
before degradation becomes significant. The maximum short time exposure is about
220° Celsius, while exposure for longer periods of time should not exceed 150° Celsius.
An article sponsored by Daimler Chrysler argues for the feasibility of natural
fiber composites in automotive applications (Schuh, 2000). The author overviews a
variety of plants: hemp, jute, flax, sisal, and coconut. The article mentions the
importance of compression molding, especially because of its application to the
automotive field. The article is helpful in providing a comparison between a variety of
fibers and matrices. It does not include any new tests, or experiments, but rather is an
overview of the current technology.
2.5.2 North American
The use of natural fibers in composites is increasing steadily. In 2000, Kline &
Company published a study entitled Opportunities for Natural Fibers in Plastics and
Composites (PR Newswire, 2000). Kline & Company provide global consulting services
for the chemical and materials industry. The study addresses the increasing demand
for products with natural fiber reinforcements. Demand in North America is forecasted
to grow by 30% per year for automotive parts and 60% per year for building products. 43

In addition to these two current markets new markets include railroad ties, flower pots,
furniture, and marine piers. Building products use mainly wood fiber for a filler to
increase the stiffness and the rate at which it can be extruded. Automotive applications
use long fibers such as flax, jute, hemp, kenaf and sisal. Preliminary estimates put the
North American demand for long natural fibers (i.e. those used in automotive
applications) at 100 million pounds. However, the greatest use of natural fiber
composites is in Europe.
2.5.3 Europe
The nova‐Institute GmbH (based in Fürth, Germany) has performed a survey of
material use in Germany and Austria every year since 1996 (Defosse, 2004). Michael
Karus, from the nova‐Institute, indicated that since 1996 natural fibers (flax, hemp, jute,
sisal, etc. – excluding wood and cotton) have grown by 22% per year. In 2002, German
and Austrian car makers used 38 million pounds of natural fibers.
Cars that contain natural fibers use about 5‐10 kg per vehicle. If every car made
in Europe contained that amount of natural fibers the yearly market would be 180‐360
million pounds. The nova‐Institute survey says that natural fiber consumption in
Europe is 50% flax. A spokesman for the European fiber trading company Wilhelm G.
Clasen, said that if flax remains the natural fiber of choice, demand will outstrip supply
by 2010. It is interesting to note that wood fiber reinforced thermosets are declining 44
substantially as they are replaced by exotic fiber (flax, hemp, jute, sisal, kenaf, etc.)
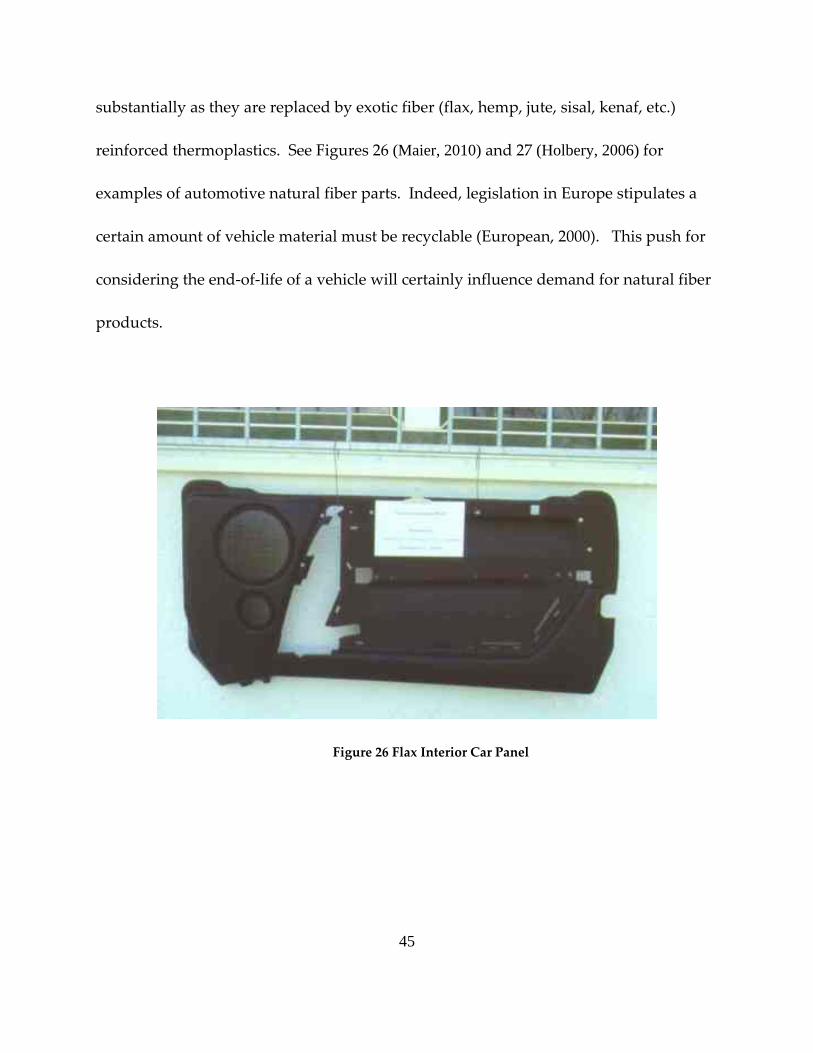
reinforced thermoplastics. See Figures 26 (Maier, 2010) and 27 (Holbery, 2006) for
examples of automotive natural fiber parts. Indeed, legislation in Europe stipulates a
certain amount of vehicle material must be recyclable (European, 2000). This push for
considering the end‐of‐life of a vehicle will certainly influence demand for natural fiber
products.
Figure 26 Flax Interior Car Panel
45

Figure 27 Natural Fiber Mat Processed into an Interior Door Panel made of 50% Kenaf 50% Polypropylene
2.6 Fiber Matrix Adhesion
Some research has been done to improve the fiber matrix adhesion. A variety of
treatments have been researched – some more with more successful results than others.
It is interesting to note that thermoset resins – specifically phenolic and epoxy – are
mentioned by Hepworth et al. to form a crosslink bond between the resin and the fiber
cell wall (Hepworth, 2000). This research is particularly helpful because it addressed
low cost methods of improving mechanical properties. The authors addressed
46

properties between retted fibers and decorticated fibers. Retting involves soaking the
fiber in water in order to facilitate fiber removal i.e. partial rotting. Decorticating
involves removal of the outer layer/bark. It was useful to see the effect of retting and
decorticating and isolate each effect. This study found that the density of the epoxy‐flax
composite decreases as fiber volume content increases‐ up to 50%, and that retting
improved fiber matrix. This study found gaps, and weak connection between the fiber
and matrix if the fiber was unretted. One finding that was notable: slow curing epoxy
gave the resin enough time to flow into the geometries of the flax fiber‐ providing better
adhesion. This applies to this thesis and future work in that flax‐resin pellets may have
better adhesion when a lower viscosity resin is used, and perhaps a longer cooling time.
There are several papers that mention the use of maleic anhydride as a fiber‐
matrix adhesion enhancer. To improve mechanical properties, maleic anhydride is
graphted into the matrix. A study by Manchado et al. tested a variety of polymer
combinations with 20% flax fiber content (Lopez Manchado, 2003). Mechanical
properties such as strength, impact toughness, elongation, and fiber matrix adhesion
were tested. This research used single fiber pullout tests to quantitatively test the fiber
matrix adhesion. The authors also provided detail on the crystallization process. The
study found that both elongation and tensile strength increased with the addition of
maleic anhydride especially when combined with both PP and EPDM (ethylene‐
47

propylene diene terpolymer) This article also found that the addition of PP and EPDM
grafted with maleic anhydride reduced the crystallization half time (i.e. increased
nucleation).
Li and Sain addressed the problem of poor fiber matrix compatibility (Li, 2003).
This results from the fact that fibers are hydrophilic and thermoplastic materials (such
as PP) are typically hydrophobic. The goal of this research was to create a high strength
PP natural fiber composite. The researchers were apparently cautious to maintain fiber
length, and avoid damaging it because it can greatly affect the mechanical strength. The
study found that bleached Kraft Pulp fiber was superior to Flax, hemp, and others.
They concluded that the impact strength with natural fibers was not as high as desired.
In another study, by Wang, et al. three different chemical pretreatments were
used to both increase the fiber matrix adhesion and reduce water absorption (Wang,
2003). Benzoylation, Silane and Peroxide treatments were applied to the fibers and
LLDPE, HDPE, LLDPE/HDPE composites were made. In general, the fiber treatment
increased the tensile strength. The article concluded that the improvement is likely due
to better fiber‐matrix adhesion. The study also addressed moisture absorption by the
fibers. The chemical pre‐treatment also lowered the moisture absorption compared to
the untreated fibers.
48

Gouanve, et al. have addressed fiber matrix adhesion with a cold He plasma
treatment (Gouanve, 2006). In order to improve fiber matrix adhesion, fibers were
treated with helium plasma. The treatment started with a reactor chamber with fibers
inside. Pressure was set to 10‐4 Pa and He is let into the chamber. Treatment continued
for 5 minutes. This study showed that the He treatment was successful. SEM
photographs showed a surprising smooth surface on He treated fibers. This treatment
actually improved the fiber‐matrix adhesion – despite the smoother surface. This study
showed that this treatment can improve fiber‐matrix adhesion. However, the
disadvantage of this treatment is the equipment requirements, and likely high cost.
Research showed that elongation increases with fibers – movement on a molecular basis
was analyzed. Mechanical spectroscopy data was gathered for a wide range of
temperatures. The researchers also found that flax fiber decreases the glass transition
temperature of the composite.
2.7 Processing Effects
Because this research is to be applied to a manufacturing process, it is important
to address manufacturing effects on the mechanical properties. The manufacturing
process used in this work will be injection molding. One study showed the effect of
flow and fiber direction in an injection molding process. Aurich and Mennig used a
mathematical model to predict the effect of fiber orientation ‐ Halpin‐Tsai (Aurich,
49

2001). In order to use the equations, the researchers acquired data combined from
cellulose, hemicellulose, and lignin of the flax fiber. The study used complex equations
to represent fiber orientation models. The thermoplastic polypropylene also
incorporated grafted maleic anhydride – shown to improve fiber matrix adhesion.
Aurich and Mennig found fibers burned at the front of the flow stream of plastic.
Tensile testing specimens were created parallel to the direction of flow and
perpendicular to it. Cross‐sectional cuts revealed different fiber orientations at different
depths in the part. This research is very useful because mechanical properties will
likely be affected by the fiber orientation. The researchers measured fiber angle, and
summarized them in frequency distributions. They did this at a variety of locations
(parallel to flow, perpendicular to flow) and at a variety of depths (0.02mm to 1.0mm).
One aspect which will not be addressed in this research is mathematical models. The
paper uses mathematical models to determine mechanical properties. The calculated
mechanical models deviated by as much as 22% from the actual tested properties. This
study found that despite their use of a common coupling agent, fibers still came loose
from the PP matrix.
2.8 Theoretical Modeling
There are theoretical models that attempt to predict strength and stiffness for
short fiber composites. Complex mathematical formulas model and predict composite
50

behavior. Andersons, Sparnins and Joffe used the Cox‐Krenchel model (Andersons,
2006). This model was somewhat useful in modulus predictions for random flax/PP
composites. This study evaluated how well models predict strength and stiffness for
flax fiber composites. Two separate models predicted stiffness and strength. While
stiffness predictions were somewhat reliable, strength predictions were still being
developed at the time of publication of the study. The subject of theoretical modeling is
complex and involved difficult mathematical equations. However, models are not well
developed, and often provide “engineering approximations.” Their research for flax/PP
showed an increase in elongation and strength with an increase in fiber volume from 10
to 30 %. However, in some cases the flax did not improve over the matrix alone. Their
study also addressed the “rule of mixtures model, and the orientational averaging
model, however these apply to fiber mat composites which is not the focus of this
thesis.
One research article used a unique matrix – starch. The authors, Romhany,
Gabor and Czigany illustrate how diverse the application of flax fibers can be.
(Romhany, 2003). Their tests used flax fiber (65 micrometer diameter) and
thermoplastic starch to create a composite material. They used a technique called the
acoustic emission (AE) technique to gather data. Flax fiber mats were used with a
biodegradeable starch matrix. They found that only up to 40% fiber content increased
51

52
the composite tensile strength. The problem they found with higher fiber content is
fiber‐matrix adhesion suffered. Fibers were not completely enclosed by matrix. AE
testing was apparently performed to detect any change in the failure mode. The tests
found that failure modes may change but only after a certain load. AE provided details
on what is occurring at a micro level as the specimen failed.
One last comment about consistency is important. A number of articles
mentioned a point about the nature of natural fibers – especially in comparison to
synthetic fibers. Natural fibers are not produced with the same precision that synthetic
fibers are. Data for natural materials can be a lot broader, and make it more difficult to
compare. Properties of natural fibers are affected by: what part of the plant (stem or
leaves) they come from, harvest period, weather, soil quality, climate, and
preconditioning. Therefore, although all these studies addressed natural fibers there is
a high probability of variation due to the nature of natural fibers.

3 EXPERIMENTAL PROCEDURE
3.1 Resin
Three different resins were used – two grades of PP (polypropylene) and one
grade of HDPE (high density polyethylene). Both resins are typical of high volume
consumer products. The resins: Dow 6D83K is a polypropylene random copolymer,
Basell Pro‐Fax 6301 is a polypropylene homopolymer, and BP Amoco T50‐1000 is an
HDPE copolymer.
3.2 Flax Fibers
The flax used in these tests is waste
flax of the linen variety from Latvia (see
Figure 28). Flax grown in North America
is typically of the flax seed grade for
extraction of the oil, which is not ideal for
53
composite materials.
Figure 28 Close‐up of Flax Fibers

3.3 Fiber Processing Steps
Figure 29 Fiber Growth and Processing Steps
See Figure 29 for steps involved in pellet creation and fiber processing
(Grandmont, 2010) (Quinn, 2010) (Maxsim, 2010) (Biomatnet, 2010) (Van Dommele, 2010)
(Kreta, 2010) (CSIRO, 2010). Flax fibers are grown in temperate climates in Europe, Asia,
54

and North America (1). Once mature, the plants are then retted. There are a couple of
different retting processes; the most common two being water and dew retting (2).
According to Randy Cowan of Biolin Research and Crop Fibers Canada, in dew retting
flax straw is extracted from the ground and laid on the ground in thin layers. Once the
bottom side has been retted the plants should be turned over to allow the other side to
ret. Dew retting can take anywhere from 2‐8 weeks. It depends upon the weather and
moisture conditions. See Figure 30 for examples of various stages of retting (Joybilee,
2010). The purpose of retting is to chemically break down the lignin and other organic
components.
Figure 30 Stages of Retting
After retting, the plants are bailed (3) and taken to be processed by machines.
The first step in the machine‐driven process is scutching (4). This process removes the
55

fibers from the woody part of the plant. It also removes the degraded lignin, pectic, and
hemicellulose. Once this completes, the fibers are 90‐95% decorticated (i.e. 90‐95% of
the non‐fibrous material is gone). At this point in the process, there are two types of
fibers – the longer ones which generally are the desirable kind (5a). They are used to
make, linen cloth, rope, and other flax products (6a). The second type of fiber is a
byproduct of shorter waste fibers (5b). These fibers are the ones used in composites.
These short waste flax fibers were shipped from a flax provider in Latvia. Once the flax
arrived in the United States it was processed through a unique and patented technique
which broke down the flax bundles (i.e. fibrillated it) using a hammer mill (6b). Flax
bundles are simply many single fibers stuck together with remnants of lignin. As
mentioned above, there is 5‐10% non‐fibrous material that still remained after
scutching. The fibrillating removed more of the lignin, and broke the fiber bundles.
The resulting fibers were individual (or elementary) short, soft flax fibers. The objective
of fibrillating is to separate fiber bundles into individual fibers so that these fibers can
be individually and completely wetted by the resin, thus providing maximum
fiber/resin interaction. Fibrillating also chops fibers into smaller lengths suitable for
injection molding.
56

The fibrillating process allowed fibers to be made into two fiber lengths: “short”
4mm(.157 in) and “long” 12mm(.472 in). The term ‘long’ is relative, i.e. long fibers
typically refer to those which are several inches long. However, it will be used in this
context to differentiate between the two sizes. 4 mm (.157 in) and 12 mm (.472 in). The
processed flax fibers were then compounded/mixed with neat resin, extruded and
pelletized (7).
The majority of pellets (8) were cut to dimensions ranging from 3 mm (.125
inches) to 6 mm (.25 inches). A maximum pellet size of 6 mm (.25 in) leads us to believe
that the 12 mm (.472 in) fibers would be reduced to a maximum of 6mm (.25 in).
However, the orientation (e.g. folding) of the fibers is unknown. It is possible that
during compounding fibers become bent or wrapped around each other – potentially
reducing their overall length. A length of 12 mm was chosen simply for experimental
purposes, because it was the longest fiber that could be easily processed.
Each resin was loaded with 20% flax fiber content by weight. There are,
therefore, three resins, and two fiber lengths for a total of six unique mixtures. When
available, neat resin was also used to provide a reference point. Tensile, flexural, and
dart impact samples were prepared using a Boy 50 ton injection molding machine.
57

3.4 Laboratory Procedure
3.4.1 Sample Creation
Tensile, flexural, and impact testing samples were made on a Boy 50 ton injection
molding machine. Samples adhere to the ASTM standard D 638 – 03 specifically the
sample type I (ASTM, 2004). The injection molding conditions are found in Figure 31 in
the injection molding diagram. The mold temperature began at room temperature (76.6
°F). Several warm up runs were made prior to sample creation.
Figure 31 Injection Molding Conditions
58

3.4.2 Temperature Sensitivity
There was an initial concern that the pelletizing, compounding, or molding
process had subjected the flax fibers to excessive heat (see Figures 32 and 33). Molded
specimens appear darker than one would suppose – considering the resin and fiber
colors. The resin is white, and the flax fibers are a very light brown (see Figure 33).
Figure 33 shows the resin color (far right), the flax fibers (second from right), hand
mixed flax‐resin injection molded sample (third from right), and a molded specimen
from the pellets (far left). Some testing was performed to verify these concerns. There
were two main concerns: the injection molding temperature may have been too high,
and/or the pelletizing and compounding temperatures may have been too high.
Figure 33 Pelletized Resin with Flax Figure 32 From right ‐ neat resin in hand; flax fibers; hand mixed and injection molded sample; pelletized and injection molded
59

To address the injection molding temperature typical heat sensitivity
temperatures for flax fiber composites were found. James Holbery and Dan Houston in
an article published in the Journal of Materials state the upper degradation limit for flax
fibers is 150 °C (270 °F) for long processing times, and up to 220 °C (396 °F) for shorter
durations (Holbery, 2006).
The total time the pellets are in the injection molding machine is no more than
three minutes (from the time they enter the barrel to the time they come out of the
mold). Injection molding was done within a range of 340 to 390 °F. Considering the
short time and the temperature at which the injection molding takes place it can be
reasonably concluded that the injection molding did not degrade or burn the fibers.
The next concern was whether the compounding or pelletizing was done at an
excessively high temperature. Into the neat resin was hand mixed a roughly 20% by
weight load of flax fibers. This mixture was then injection molded at the same
processing conditions noted above. Comparing the hand mixed sample (see Figure 33)
to the compounded and pelletized sample we see there is not significant color
difference. It can be reasonably concluded that the compounding and pelletizing
process did not expose the flax fibers to excessive temperatures, or degrade them.
It is apparent that there is a significant difference in color from the raw
ingredients to the molded parts. A reasonable explanation could be that there is some
60

remaining lignin (not broken down during retting, or not removed during scutching
and fibrillating). It is likely that some lignin still remains contained in the flax fibers
and during the injection molding processing is released from them and distributed
throughout the material. Lignin is a chemical found in many plants and trees, and is
responsible for newspaper yellowing over time. In the manufacture of white paper
most of the lignin is removed. Figure 34 illustrates the principle of removing lignin
from lignin containing fibers (The Institute For Green Science, 2010).
Figure 34 Lignin Removal from Cellulose Based Materials
The “treatment lakes” referred to in Figure 34 are used during the retting process
(as discussed previously). The presence of small amounts of lignin is unlikely to cause 61

any decrease in properties, however may be enough to affect the color. Therefore, the
mechanical properties of the fibers suffered no significant degradation due to heat.
3.4.3 Colorant Tests
In addition, tests were performed to see the effect of colorant. One percent and
three percent by weight white powder colorant (Brod‐head Garrett Company) were
used. Colorant was added to the resin, and mixed rigorously to disperse the colorant
evenly. The colorant pellet mix was then injection molded. As seen in the Figures 35
and 36, the flax fiber resin takes the colorant quite well.
62
Figure 35 Samples with colorant 1% at left 3% at right
Figure 36 Samples of Injection Molded Specimens with no Colorant

3.4.4 Mechanical Tests
All mechanical tests were performed at a room temperature of 76 °F. In both
tensile and flexural tests toe compensation (adjusting for specimen settling in grips after
initial forces are applied) ignored the first few data points. These data points were
ignored because they do not represent a property of the material, and are typically
representative of slack, alignment, or seating of the specimen. Statistical analyses were
performed to compare the two fiber lengths, and the fiber loaded resin to the neat resin.
Data is discussed later in the results chapter.
Figure 37 Instron Testing Machine with 3 Point Flex Test Fixture
Tensile tests were performed in accordance with ASTM Standard D 638 (ASTM,
2004). Key measurements are maximum tensile strength, load at break, and Young’s
63

Modulus. Tests were performed using a universal Instron testing machine (Figure 35) –
shown with the flexural testing fixture – and a two inch extensometer manufactured by
Instron. Ten specimens were loaded until failure. Due to material availability, only six
were used for the neat resin tests. The results were recorded and averaged. Confidence
intervals were calculated for the average values.
Flexural tests were performed according to ASTM Standard D 790, procedure B,
see Figure 37 (ASTM, 2004). Strain rate was .1 in/in/min (.1 mm/mm/min), or a
calculated machine crosshead rate of .526 in/min (13.35 mm/min). Tests were
performed using the same universal Instron testing machine noted above. Ten
specimens of each flax fiber resin and five specimens of each neat resin were loaded
until outer surface rupture or a maximum extension 1 inch (25 mm).
Impact testing was done following the guidelines of ASTM Standard D 5628
(ASTM, 2004). Due to testing machine considerations (e.g. samples were not clamped,
although ASTM D 5628 does not require it) and the main purpose of the test (i.e. relative
values instead of absolute) ASTM Standard D 5628 was adhered to as a guide, rather
than a strict procedure. Some changes to the testing process were made to adjust to our
needs, and circumstances. These changes were consistently and strictly followed with
each test, and will be discussed below. Therefore, the impact toughness values are
reliable as relative values. They are good for comparison between our resins, but
64

65
should not be taken out of the context of this specific test. In addition, ASTM D 5628
states the drop impact test should be only used for relative rankings. Machine used for
impact testing was an Instron Dart Impact Tester. Impact mass had a rounded tup with
diameter of 0.52 inches. Impact energy was a constant 2000 ft‐lb. ASTM 5628 indicates
two methods for finding the mean failure energy, one using a variable height and the
other using a variable mass. The testing did not follow these methods, but instead data
on the amount of energy absorbed was recorded. This method is sufficient for our
purpose of determining the effect of flax fiber in the resin. It also provides accurate
relative data to compare the neat resin to the flax fiber resin.

66

4 RESULTS
A statistical analysis of variance (ANOVA) was used to verify significance of the
results. A special type of ANOVA using regression and dummy variables was used.
An ANOVA analysis was done for each of the resins (Amoco HDPE, Basell PP, and
Dow PP). Two variations were used: a base case of no fibers, and a base case of 4mm
fibers. The 4mm fiber base case allowed a direct comparison between the 4 and 12mm
fibers. The neat resin base case clarified the effect of the fibers. Each ANOVA test
verified to be accurate. Verification was done by comparing the intercept coefficient
(from the ANOVA) to the actual total energy absorbed (averaged) during impact testing
(i.e. Figure 8). In addition, each ANOVA regression was tested for heteroscedasticity.
Using the residual plots, no evidence of heteroscedasticity was found. Finally, to
compare between resins, an ANOVA using all variables with a 4mm and Dow PP base
case was performed. The p‐values for the Basell coefficient will reveal how the Dow
and Basell resins compare.
67

Another important statistical parameter to consider is the R‐squared value. This
value conveys how much variation in the impact toughness (or tensile strength,
Young’s Modulus etc.) is explained by the fibers, plastic type, and fiber length. The
ANOVA regressions considering all variables have R‐square values of 0.91 (Impact
toughness), 0.79 (Tensile Strength) and 0.67 (Young’s Modulus). In other words, 91% of
the variation in the impact toughness is explained by the different plastics, the presence
(or not) of fibers, and supposedly fiber length. Similar values are 79% and 67 % for
Tensile Strength and Young’s Modulus respectively. However, it is interesting to note
that the Dow ANOVA only considered 4mm and 12mm fiber resins. This provided the
opportunity to compare the effect of fiber length. The R‐square value for this ANOVA
is 0.001, meaning only 0.1% of the variation in impact toughness was due to the
different fiber lengths. In other words, the different fiber lengths did not affect impact
toughness – as will be seen.
4.1 Impact Properties
The figure below displays all results for impact testing. Each tested specimen is
shown. Amoco HDPE was the only resin adversely affected by the addition of fibers.
We must note, that due to material limitations there is no Dow neat resin data to
compare against. As will be discussed below, it is reasonable to predict the Dow PP
would have exhibited a similar increase in impact strength comparable to the Basell 68

polypropylene. The bar graph and table (Figure 38 and Table 3) show relative impact
toughness values.
Figure 38 Average Impact Toughness Values
Table 3 Impact Toughness Values Per Sample
69

Table 4 contains 95% confidence intervals of impact toughness values. Low and
high are the extremes of the confidence interval. There is a 95% probability that the
average impact toughness value lies within this interval. As can be seen in the chart,
4mm and 12mm values are, in all cases, very similar. A p‐value acceptance level of 0.05
was used. A look at the p‐values for each ANOVA yielded the following results. There
is no significant difference between the 4mm and 12mm fiber results (because each p‐
value > 0.05). However, there is a significant difference between the neat resin and the
fiber‐loaded resin. This is evidenced by an extremely small p‐value (p‐values in the
chart are examples taken from the ANOVA).
Table 4 Impact Toughness 95% Confidence Intervals
In summary, it can reasonably be assumed that fiber lengths between 4 to 12mm
will equally affect impact toughness. It cannot be assumed, however, that fibers smaller
70

than 4mm and longer than 12mm will fall under the same conclusion. Further testing is
needed to consider fibers outside the 4 to 12mm range.
The effect of fibers on impact toughness can be seen; in the BP Amoco HDPE it
dropped by 75%; and in the Basell PP it increased by 55‐70%. An ANOVA shows that
there is no significant difference between the Basell PP and the Dow PP. It is interesting
to note that the Dow PP has significantly lower variation. Dow standard deviation is
0.02 whereas Basell is 0.07 – more than three times larger. This may be due to improved
interfacial adhesion between the fiber and the matrix, however the actual reason is
unknown, and as mentioned above the statistical analysis reveals no significant
difference between the impact values of the two PP resins. As stated previously, it is
reasonable to predict the Dow PP experienced improvements in impact toughness
similar to the Basell PP.
4.2 Tensile Properties
A graph of the stress strain curve from the tensile tests has been included (see
Figure 39. The line for each resin is an average stress strain curve over the ten
specimens. The stress‐strain graph is included here because it is the conventional graph
used to illustrate tensile properties.
71

Figure 39 Tensile Stress vs. Strain
Dow reports the tensile strength of its 6D83K Co‐Polymer PP to be 4100 psi (Dow,
2008). This value is used in calculations and for comparison, and will be called the Dow
Neat Resin. The bar chart (Figure 40) summarizes the average tensile strength of each
category. Table 5 contains the 95% c confidence intervals for the average tensile
strength of each category.
72
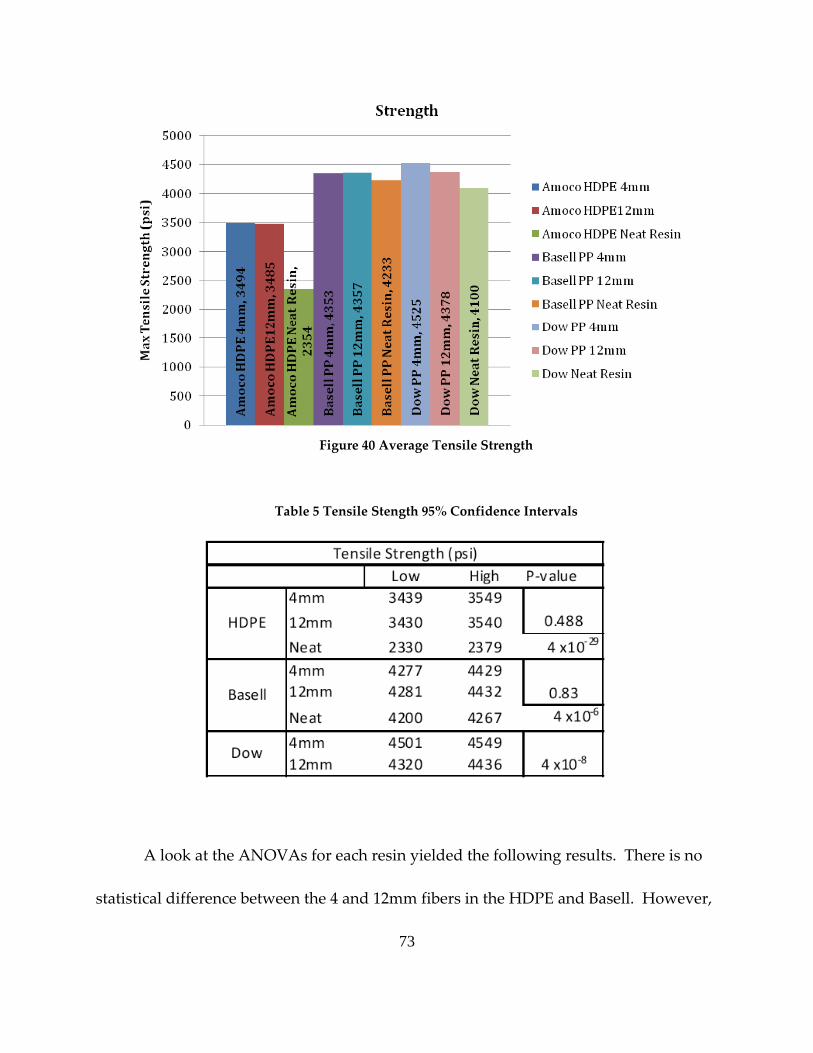
Figure 40 Average Tensile Strength
Table 5 Tensile Stength 95% Confidence Intervals
A look at the ANOVAs for each resin yielded the following results. There is no
statistical difference between the 4 and 12mm fibers in the HDPE and Basell. However,
73

in the Dow PP, the 12mm fibers actually decreased the tensile strength, relative to the
4mm fibers. A look at the p‐value confirmed that the difference was statistically
significant. In summary, the addition of 4mm fibers increased tensile strength in all
cases. BP Amoco increased by 48%, Basell increased by 3%, and Dow increased by 10%.
For reasons that will be discussed below, an ANOVA was not possible for the
flexural modulus. Young’s Modulus was calculated and analyzed in order to provide
information about stiffness. Young’s Modulus also provided an opportunity for
ANOVA, which will add to our confidence when making conclusions. The bar chart
below provides average Young’s Modulus values for comparison. ANOVA revealed no
significant difference between 4mm and 12mm Young’s Modulus values, except in the
case of Basell PP – and then only because we use a p‐value of 0.05 for our acceptance
level. If the p‐value is changed to 0.01 (a stricter test) the difference becomes
insignificant. Therefore although there is some statistical difference between the 4 and
12 mm Basell Young’s Modulus, it is minimal and under stricter guidelines (i.e. a 99 %
level) insignificant. In impact tests and tensile strength, the p‐values that have
illustrated significant differences have been much smaller and do withstand stricter p‐
values, which is why we have deemed this difference in Young’s Modulus unhelpful.
Therefore, the conclusion we make is that there is no difference in stiffness as a result of
fiber length. However, we also conclude that stiffness increases significantly with the
74

addition of fibers to the neat resin (see Figure 41). Stiffness increased by 100% in the
HDPE, and over 60% in the Basell PP. ANOVA shows no significant difference
between Basell and Dow stiffness values. Therefore, it is reasonable to conclude that
Dow PP also experienced an increase in stiffness of over 60%. Table 6 contains the 95%
confidence intervals for the Young’s Modulus values.
Figure 41 Average Youngʹs Modulus
75

Table 6 Youngʹs Modulus 95% Confidence Intervals
4.3 Flexural Properties
Flexural stress and strain were calculated manually using the formulas found in
ASTM standard D 790, and are included here as a reference.
Flexural stress:
σ = 3PL/2bd2 (4.1)
P=load at a given point on the deflection curve (lbs of Force)
L=support span (inches)
b=width of beam tested (inches)
d=depth of beam tested (inches)
76

Flexural Strain:
ε= 6Dd/L2 (4.2)
D=maximum deflection at the center of the beam (inches)
d=depth (inches)
L=support span (inches)
Figure 42 below is a stress vs. strain graph to illustrate the flexural properties of
each specimen.
Figure 42 Flexural Stress vs. Strain
77

Dow reports the flexural modulus of its 6D83K Co‐Polymer PP to be 155 ksi.
This value is used in calculations and for comparison, and will be called the Dow Neat
Resin. The following bar chart (Figure 43) summarizes the average flexural modulus of
each category.
Figure 43 Average Flexural Modulus
Flexural modulus calculations were unique relative to the tensile and impact
toughness values. It required manual calculations based on visual analysis of stress‐
strain graphs. Because of the incredibly labor intensive process to calculate flexural
modulus for all samples (a total of 70 graphs and several times more in manual
78

calculations), only average values were graphed and calculated (Figure 44). This
eliminated the possibility of performing an ANOVA. Statistical rules insist on a sample
size greater than thirty y in order to make conclusions about the difference between two
means. However, reasonable conclusions can be made about the effect of fibers on the
resin. This is especially true because we have a flexural modulus value for Dow neat
resin.
In summary, the addition of fibers increased the flexural modulus in all samples.
BP Amoco HDPE increased by 50%, Basell PP increased by approximately 50%, and
Dow PP increased by over 75%. The results from this test corroborate the results from
the tensile modulus tests concluding that flax fibers significantly increase the stiffness of
the material.
4.4 Economic Comparison
Flax from Latvia was obtained and received in the United States at a cost of $0.40‐
0.50/lb. The flax was a waste product from linen flax. Fibers were in bundles bound
together with some remaining lignin and therefore not suitable for injection molding.
Our processing removed the remaining lignin and broke the fiber bundles into
individual soft fibers. This additional processing increased the cost by a minimum of
$0.05‐0.10/lb of fiber. Therefore, overall cost for injection molding grade flax fibers was
roughly $0.55/pound. Table 7 compares flax and fiberglass raw material costs and cost 79

per unit of a property (e.g. tensile strength and flexural modulus). As we can see, while
fiberglass properties are superior to flax fiber cost of flax is equivalent or below. Use of
flax fiber should be considered on a product by product basis because of flax’s other
positive qualities: light weight, use of a waste product, renewable, and less energy
intensive to produce.
Table 7 Economic Comparison
Material Material Cost ($/lb)
Processing Cost ($/lb)
Total Cost ($/lb)
Tensile Strength (ksi)
Cost per psi of tensile strength ($/ksi)
Flexural Modulus (ksi)
Cost per ksi of flexural modulus ($/ksi)
Flax 0.50 0.05-0.15 ~0.60 3.5-4.5 0.15 150-290 0.003 E-glass (Composites One, 2010) (IDES, 2010)
1.20 NA 1.20 ~7.0 0.17 ~440 0.003
80

5 CHAPTER 5
As mentioned at the beginning, the purpose of this thesis is to determine if flax
fibers are an economical, ecological, and performance substitute for fiberglass. It is
determined acceptable if the flax loaded resin possesses higher properties (which are
statistically significant) than the neat resin. The null hypothesis is that there is no
significant difference between the fiber loaded and neat resins.
The above tests have provided insight into the properties of injection molded flax
reinforced thermoplastics. The following conclusions can be made:
• Decreased impact strength of HDPE (73%)
• Increased impact strength of PP (55‐70%)
• Increased tensile strength (Amoco HDPE: 48%, Dow PP: 10%, Basell PP: 3%)
• Increased flexural stiffness (Amoco HDPE: 50%, Dow PP: 75%, Basell PP: 50%)
• Increased tensile stiffness (Amoco HDPE: 100%, Dow PP: 65%, Basell PP: N/A)
• No significant difference between 4mm and 12mm fiber resins
• No significant difference between Basell and Dow PP
• Temperature sensitivity tests show flax can be injection molded (below 400 ºF
81

Figure 44 Percent Change from Neat Resin
Effects of flax fibers on the mechanical properties of the resin are summarized in
Figure 44 showing a percent increase or decrease relative to the neat resin.
Economic analysis of the flax processing was revealing. While the flax was
purchased as a waste product from Latvia and arrived in the United States at a
reasonable cost, it did require some post processing before compounding with the
matrix. The fibrillation – or breaking down of the fibers from bundles to individual soft
fibers – adds to the cost of producing the composite. While the properties of the flax do
generally improve the composite properties, the advantage may not necessarily meet
the needs of all consumer products. Therefore, the economic argument for adding flax
fibers is not applicable across the board. There is room for an economic argument if
82

higher stiffness, strength, and impact properties are desired, but do not require the
magnitude provided by fiberglass. In such cases, flax is cheaper and more
environmentally friendly.
5.1 Suggested Future Testing
This thesis studied samples and specimens with the sole purpose of testing. No
real world products were created. It is recommended that actual products that would
benefit from flax should be produced and tested. Such products would be high volume
consumer goods that require more strength than plastic alone, but do not require the
high strength of fiberglass. As has been shown, flax has the potential to fit into this
niche, and provide a cost reduction over fiberglass – and possibly even over the neat
resin depending on the cost per pound of resin.
It is important to comment on the use of a coupling agent. A coupling agent is a
chemical that is added to improve the adhesion between the fiber (hydrophilic) and the
resin/matrix (hydrophobic). The hydrophilic nature of any natural fiber and the
hydrophobic nature of man‐made polymers (such as polypropylene, polyethylene, etc)
pose some compatibility problems (like mixing water and oil). There has been a lot of
recent research focused on solving this problem. The research has shown that
significant improvements in mechanical properties are achieved when a coupling agent
is used. 83

84
Aside from adding a coupling agent, research has shown that various treatment
processes can also improve fiber‐matrix adhesion. Such processes include:
Benzoylation, Silane and Peroxide treatments (Wang, 2003), and cold He plasma
treatment (Gouanve, 2006), among others. However, there is significantly more
support for the use of a chemical coupling agent (e.g. maleic anhydride) over a
treatment process.
The resins used in this thesis did not contain any coupling agents nor undergo
any treatment processes to improve fiber‐matrix adhesion. A study by Manchado et al.
addressed several different coupling agents including maleic anhydride. Their studies
used a PP matrix, with 20% volume fraction of flax fibers and 8% volume maleic
anhydride grafted polypropylene. Their results showed significant increases in tensile
strength (increased by 26%), tensile modulus (increased by 7%), flexural modulus
(increased by 20%), and impact strength (increased by 13%). Therefore, it is expected
that maleic anhydride will improve the properties of the resins in this thesis by similar
magnitudes. With the growing emphasis and research on all natural fiber composites:
the future of thermoplastic flax fiber composites is promising.

REFERENCES
718 Bot. Lignin structure. http://en.wikipedia.org/wiki/File:LigninStructure.png (2010).
Andersons, J., E. Sparnins, and R. Joffe. Stiffness and strength of flax fiber/polymer matrix composites. Polymer Composites 27, no. 2 (2006). : 221‐229.
ASTM International. Annual Book of ASTM Standards. 2004 ed. West Conshohocken PA: ASTM International, 2004.
Aurich, T. and G. Mennig. Flow‐induced fiber orientation in injection molded flax fiber reinforced polypropylene. Polymer Composites 22, no. 5 (2001). : 680‐689.
B., P. Sisal plant. http://en.wikipedia.org/wiki/File:Plantsisal.jpg (2010).
Biomatnet. Dew retting. http://www.biomatnet.org/secure/images/f9074_1.gif (2010).
Bismarck, A., S. Mishra, and T. Lampke. Plant fibers as reinforcement for green composites. In Natural fibers, biopolymers, and biocomposites, ed. Amar K. Mohanty, Manjusry Misra, and Lawrence T. Drzal, 37CRC Press, 2005.
Bledzki, A. K. and J. Gassan. Composites reinforced with cellulose based fibres. Progress in Polymer Science, 24, no. 2 (5, 1999). : 221‐274.
Bodnaryk, L. and S. Pearson. Flax world class recipes. Natural fibers, biopolymers, and biocomposites. Ed. A. K. Mohanty, M. Misra, and L. T. Drzal. Canada: Saskatchewan Flax Development Commission, 2003.
Brouwer, W. D. Natural fibre composites: Where can flax compete with glass? SAMPE Journal 36, no. 6, (2000). : 18.
Composites One. 2010. Price quote on short chopped fiberglass. Verbal price quote from Composites One.
Comvaser. Pacas de sisal. http://en.wikipedia.org/wiki/File:Pacas_de_sisal.jpg (2010).
85

CSIRO. Hammermill mineral processing. http://www.cmis.csiro.au/cfd/gf_movies/GF_MineralProcessing/GF_MineralProcessing_Crushers/GF_ MineralProcessing_HammerMill_files/LargeSwingHammerMill_thumb.jpg (2010).
Defosse, M. Natural fibersʹ growing needs. Modern Plastics 81, no. 3 (03, 2004). : 57.
Dodd, R. B. and D. E. Akin. Recent developments in retting and measurement of fiber quality in natural fibers: Pros and cons. In Natural fibers, biopolymers, and biocomposites, ed. Amar K. Mohanty, Manjusry Misra, and Lawrence T. Drzal, 141CRC Press, 2005.
DOW 6D83K polypropylene resin. http://www.matweb.com/search/datasheet.aspx?matguid=f1516d0eba884b5d940279d6983c7450&ckck=1 (accessed September 20, 2008).
European Parliament. 2000. Directive 2000/53/EC of the european parliament and of the council of 18 september 2000 on end‐of life vehicles. Official Journal L 269 ed. Vol. 21/10/2000.
Frollini, E., J. M. F. Paiva, W. G. Trindade, T. I. A. Razera, and S. B. Tita. Plastics and composites from lignophenols. In Natural fibers, plastics, and composites, ed. Frederick T. Wallenberger and Norman Weston, 193. Boston: Kluwer Academic Publishers, 2004.
Goldberg, J. B. Fiber. In Encyclopedia Americana, 147. Danbury Conn.: Grolier, 2005.
Gouanve, F., M. Meyer, J. Grenet, S. Marais, F. Poncin‐Epaillard, and J. ‐M Saiter. Unsaturated polyester resin (UPR) reinforced with flax fibers, untreated and cold he plasma‐treated: Thermal, mechanical and DMA studies. Composite Interfaces 13, no. 4‐6, (2006). : 355‐364.
Graham, L. E. Plant biology. 2nd ed. Upper Saddle River N.J.: Pearson/Prentice Hall, 2006.
Grandmont, J.P. Grand‐rend. http://commons.wikimedia.org/wiki/File:Grand‐Reng_JPG01.jpg (2010).
H20‐C. Cotton plant. http://en.wikipedia.org/wiki/File:CottonPlant.JPG (2010).
86

Hartemink, A. E. and J. F. Wienk. Sisal production and soil fertility decline in tanzania. Outlook on Agriculture 24, no. 91, (1995).
Hepworth, D. G., D. M. Bruce, J. F. V. Vincent, and G. Jeronimidis. Manufacture and mechanical testing of thermosetting natural fibre composites. Journal of Materials Science 35, no. 2, (2000). : 293‐298.
Holbery, J. and D. Houston. Natural‐fiber‐reinforced polymer composites in automotive applications. JOM 58, no. 11 (2006). : 80‐86.
IDES. PP copolymer with 20% fiberglass: Adell RP14, hostacom BJ61A, hostacom SB224‐2 and accutech CP0435G20CV. http://prospector.ides.com/DataView.aspx?E=7971~75802~2309~2321&CK=1070074. (2010).
Joybilee Farm. Dew retting flax. http://joybilee‐farm.blogspot.com/2009/10/dew‐retting‐flax.html (2010).
Kanari, N., J. L. Pineau, and S. Shallari. End‐of‐life vehicle recycling in the European union. Journal of Materials 55, no. 8 (2003).
Karus, M., S. Ortmann, and D. Vogt. Use of natural fiber composites in the German autmotive production 1996 till 2003. (2004).
Kozlowski, R. and M. Wladyka‐Przybylak. Uses of natural fiber reinforced plastics. In Natural fibers, plastics and composites, 249. Boston: Kluwer Academic Publishers, 2001.
Kreta. Vlasvezels. http://commons.wikimedia.org/wiki/File:Vlasvezels_(1).JPG (2010)
LadyofHats. Plant Cell Wall Diagram. http://en.wikipedia.org/wiki/File:Plant_cell_wall_diagram.svg (2010)
Li, J. Z., Q. Wu, and H. S. Jr. MacNabb. Chemical coupling in wood fiber and polymer composites: A review of coupling agents and treatments. Wood Fiber Science 32, (2000). : 88‐104.
Li, H. and M. Sain. High stiffness natural fiber‐reinforced hybrid polypropylene composites. Polymer ‐ Plastics Technology and Engineering 42, no. 5, (2003). : 853‐862.
87

Lopez Manchado, M. A., M. Arroyo, J. Biagiotti, and J. M. Kenny. Enhancement of mechanical properties and interfacial adhesion of PP/EPDM/Flax fiber composites using maleic anhydride as a compatibilizer. Journal of Applied Polymer Science 90, no. 8, (2003). : 2170‐2178.
Maier, J. Flachsprodukt. http://inaro.de/France/F_index.htm (2010).
Maksim. Vlas. http://commons.wikimedia.org/wiki/File:Vlas.jpg (2010).
McKenzie, R. Flax stem cross section. http://en.wikipedia.org/wiki/File:Labeledstemforposter_copy.jpg (2010).
Mohanty, A. K., M. Misra, L. T. Drzal, S. E. Selke, B. R. Harte, and G. Hinrichsen. Natural fibers, biopolymers, and biocomposites: An introduction. In Natural fibers, biopolymers, and biocomposites, ed. A. K. Mohanty, M. Misra, and Lawrence T. Drzal, 1. Boca Raton, Florida: CRC Press, 2005.
Mohanty, A. K., M. Misra, and G. Hinrichsen. Biofibres, biodegradable polymers and biocomposites: An overview. Macromolecular Materials and Engineering 276/277, (2000). : 1.
PR Newswire. North american demand for natural fibers in plastic composites forecast to grow 15% to 50% annually; significant markets emerging in building products, automotive parts, railroad ties, flower pots, furniture, and marine piers. (2000)
PR Newswire. North american demand for natural fibers in plastic composites forecast to grow over 50% annually; significant markets emerging in building products and automotive parts. (2000)
Quinn, S. http://homepage.ntlworld.com/sean_quinn/cdun/knock.jpg (2010).
Romhany, G., J. Karger‐Kocsis, and T. Czigany. Tensile fracture and failure behavior of thermoplastic starch with unidirectional and cross‐ply flax fiber reinforcements. Macromolecular Materials and Engineering 288, no. 92003). : 699‐707.
Ryj. Hanfstengel. http://en.wikipedia.org/wiki/File:Hanfstengel.jpg (2010).
Schloesser, T. P. Natural fiber reinforced automotive parts. In Natural fibers, plastics and composites, 275. Boston: Kluwer Academic Publishers, 2004.
88

Schuh, T. G. 2000. Renewable materials for automotive applications (accessed November 6, (2007).
Sherman, Lilli Manolis. 2010. Natural fibers: The new fashion in automotive plastics. : March 30, 2010.
Singh, B. and M. Gupta. Natural fiber composites for building applications. In Natural fibers, biopolymers, and biocomposites, ed. A. K. Mohanty, M. Misra, and L. T. Drzal. Boca Raton: CRC Press, 2005.
Strong, A. B.. Fundamentals of composites manufacturing. Dearborn, Michigan: Society Of Manufacturing Engineers, 2008.
The Institute for Green Science. Mitigation of pulp and paper effluent color and mill smells. http://www.chem.cmu.edu/groups/collins/res/dyes.html (2010).
Thomason, J. L. The influence of fibre length and concentration on the properties of glass fibre reinforced polypropylene: 5. injection moulded long and short fibre PP. Composites Part A: Applied Science and Manufacturing 33, no. 12 (2002). : 1641‐1652.
Thomason, J. L. and M. A. Vlug. Influence of fibre length and concentration on the properties of glass fibre‐reinforced polypropylene: 4. impact properties. Composites ‐ Part A: Applied Science and Manufacturing 28, no. 3 (1997). : 277‐288.
Thomason, J. L., & Vlug, M. A. Influence of fibre length and concentration on the properties of glass fibre‐reinforced polypropylene: 1. tensile and flexural modulus. Composites ‐ Part A: Applied Science and Manufacturing 27, no. 61996). : 477‐484.
Thomason, J. L., M. A. Vlug, G. Schipper, and H. G. L. T. Krikort. Influence of fibre length and concentration on the properties of glass fibre‐reinforced polypropylene: Part 3. strength and strain at failure. Composites ‐ Part A: Applied Science and Manufacturing 27, no. 111996). : 1075‐1084.
Van Dommele Engineering. Scutching. http://www.vandommele.be/htmlENG/scutching.html (2010).
Vincent, J. A unified nomenclature for plant fibers for industrial use. Applied Composite Materials 7 (2000): 269‐271.
89

90
Wang, B., S. Panigrahi, W. Crerar, and L. Tabil. APPLICATION OF PRE‐TREATED FLAX FIBERS IN COMPOSITES. Montreal, Quebec, July 6 ‐ 9, 2003. http://www.engr.usask.ca/societies/csae/PapersCSAE2003/CSAE03‐357.pdf (accessed Nove,ber 6, 2007).
Winfield, A. G. Jute reinforced polyester projects for UNIDO/Government of india. Plastics and Rubber International 4, no. 1 (January/February, 1979). : 23.