
National Sheep Conference 2014 - Teagasc
56
Animal & Grassland Research and Innovation Programme National Sheep Conference 2014
Transcript of National Sheep Conference 2014 - Teagasc

Animal &Grassland Researchand InnovationProgramme
National Sheep Conference 2014


National Sheep Conference 2014
Sheep TechnologyAdoption Programme Approved (STAP)
Hodson Bay Hotel, AthloneTuesday 4th February 2014,
&
Mount Errigal Hotel, Ballyraine,Letterkenny, Co. Donegal
Wednesday 5th February 2014

2014 Teagasc National Sheep Conference
Venues: Hodson Bay Hotel, Athlone Date: Tuesday 4th February 2014
Conference Outline
15.00 – 15.10 Conference Opening Prof Gerry Boyle, Director of Teagasc
Session I Flock Health
Chairman Fergal Morris, MVB, MSD Animal Health
15.10 – 15.35 An update on Schmallenberg virus in sheep in Ireland Damien Barrett RVL, DAFM
15.35 – 16.00 Developing a worm control strategy for your farm
Tom Coll, Teagasc.
16.00 – 16.40 Common health issues around lambing time
Prof. Neil Sargison, Royal Dick, Veterinary School, Edinburgh
16.40 – 17.30 Break – Tea/Coffee, Sandwiches & finger food served
17.30 – 18.00 Address by Mr. Simon Coveney, TD, Minister for Agriculture, Food and the Marine
Session II Genetics & Ewe Lifetime Performance
Chairman Prof. Michael Diskin, Teagasc
17.30 – 18.10 Future Prospects for Genetic Improvement in Sheep: A New Zealand Perspective Dr. John McEwan, Agresearch, NZ
18.10 – 18.35 Irish Sheep Breeding – the next five years -
Dr. Noirín McHugh, Teagasc
18.35 – 19.00 Effects of rearing regime of replacements on the lifetime performance of ewes differing in prolificacy
Dr. Tim Keady, Teagasc
19.00 – 19.10 Close Conference
Michael Gottstein, Teagasc
Organising Committee: Michael Diskin, Philip Creighton, Frank Hynes & Michael Gottstein

2014 Teagasc National Sheep Conference
Venue: Mount Errigal Hotel, Ballyraine, Letterkenny, Co. Donegal Date: Wednesday 5th February 2014
Conference Outline
15.00 – 15.10 Conference Opening Dr. Tom Kelly, Director of Knowledge Transfer, Teagasc
Session I Flock Health
Chairman Fergal Morris, MVB, MSD Animal Health
15.10 – 15.35 An update on Schmallenberg virus in sheep in Ireland Damien Barrett RVL, DAFM
15.35 – 16.00 Developing a worm control strategy for your farm
Tom Coll, Teagasc.
16.00 – 16.40 Common health issues around lambing time
Prof. Neil Sargison, Royal Dick, Veterinary School, Edinburgh
16.40 – 17.30 Break – Tea/Coffee, Sandwiches & finger food served
Session II Genetics & Ewe Lifetime Performance
Chairman Prof. Michael Diskin, Teagasc
17.30 – 18.10 Future Prospects for Genetic Improvement in Sheep: A New Zealand Perspective Dr. John McEwan, Agresearch, NZ
18.10 – 18.35 Irish Sheep Breeding – the next five years -
Dr. Noirín McHugh, Teagasc
18.35 – 19.00 Effects of rearing regime of replacements on the lifetime performance of ewes differing in prolificacy
Dr. Tim Keady, Teagasc
19.00 – 19.10 Close Conference
Michael Gottstein, Teagasc
Organising Committee: Michael Diskin, Philip Creighton, Frank Hynes & Michael Gottstein


Foreword
Sheep production is a significant contributor to the agricultural and national economy with an output valued at €209 million in 2012. The 33,000 flocks produce a high quality product, with about 80% of this exported. Significant employment is provided in both the primary production and processing sectors. Good lamb prices in recent years have resulted in a modest but welcome expansion in ewe numbers.
In the Teagasc 2012 National Farm Survey an average gross margin of €604/ha for lowland mid-season lambing flocks was achieved. However, the top one third of flocks generated a gross margin of €992/ha compared to €217 for the bottom one third of flocks. This indicates that there is significant scope to increase income by improving technical efficiency on many farms. This is also evident from the significant productivity and incomes gains achieved on the Teagasc BETTER Sheep Farms from modest improvements in a number of key technologies that drive productivity and profitability. I would strongly encourage sheep producers and Discussion Groups to visit the Teagasc BETTER farms. Active participation in such Discussion Groups has been shown to be a most effective way of getting new technology adopted on farms which subsequently translates into increased productivity and increased farm income.
Teagasc is strongly committed to its sheep research and advisory programmes. The expanded BETTER Sheep Farm Programme, the appointment of a Head of Sheep and the recent appointment of a third Specialist will accelerate the transfer of technologies from research to the industry. New Research programmes on finishing hill lambs, meat quality, genetic improvement, grassland science are all very important for the future of the Irish Sheep industry. We are ready now to embark on a new sheep breeding initiative at Athenry with the establishment of genetically elite Suffolk and Texel flocks drawing on the best genetics from Ireland, UK, and New Zealand. The increased collaboration between Teagasc, UCD, Department of Agriculture, Food and the Marine, Sheep Ireland as well as overseas collaborators will further benefit the sheep industry.
I welcome the presence of Mr Simon Coveney, TD, Minster for Agriculture, Food and the Marine at our conference in Athlone and publically acknowledge the support he has provided to Teagasc through difficult times. I assure him that Teagasc are committed to provide Irish farmers and the agri-industry with the technical knowledge so that Irish agriculture meets its potential. I thank all of the speakers who contributed both oral and written presentations and to you the attendance. The sponsorship of MSD Animal Health is greatly appreciated. This booklet collates and summarises a significant body of knowledge on technical issues in sheep production and should prove an invaluable reference to sheep producers. I would like to thank all the Teagasc Staff who assisted in with the organisation of the National Sheep Conference and especially the organising committee without whose efforts we would not be here today – they are; Michael Diskin, Frank Hynes, Phil Creighton, and Michael Gottstein. I acknowledge the help of local Teagasc staff particularly, Shane McHugh, Oliver Burke and Ben Wilkinson.

Table of Contents
Title Page
An update on Schmallenberg virus in sheep in IrelandD. Barrett, R. O’Neill, D. Sammin and Simon More 1 Developing a worm control strategy for your farmT. Coll, O. Keane, M. Sheehan, B. Good, T. De Waal and M. Doherty 7
Irish Sheep Breeding – the next five yearsN. McHugh and T. Pabiou 12
Effects of rearing regime of replacements on the lifetime performance of ewes differing in prolificacyT. Keady 18
Future of Sheep breeding: A New Zealand PerspectiveJ. McEwan 28
Common health issues around lambing time N. Sargison 36

1
National Sheep Conference 2014
An update on Schmallenberg virus infection in sheep in IrelandD. Barrett*, B. Bradshaw*, M. Kirby*, R. O’Neill*, D. Sammin*,M. Casey*, S. Moreª
*Dept of Agriculture, Food and the Marine (DAFM) Laboratories.ªCentre for Veterinary Epidemiology and Risk Analysis, University College Dublin (CVERA),
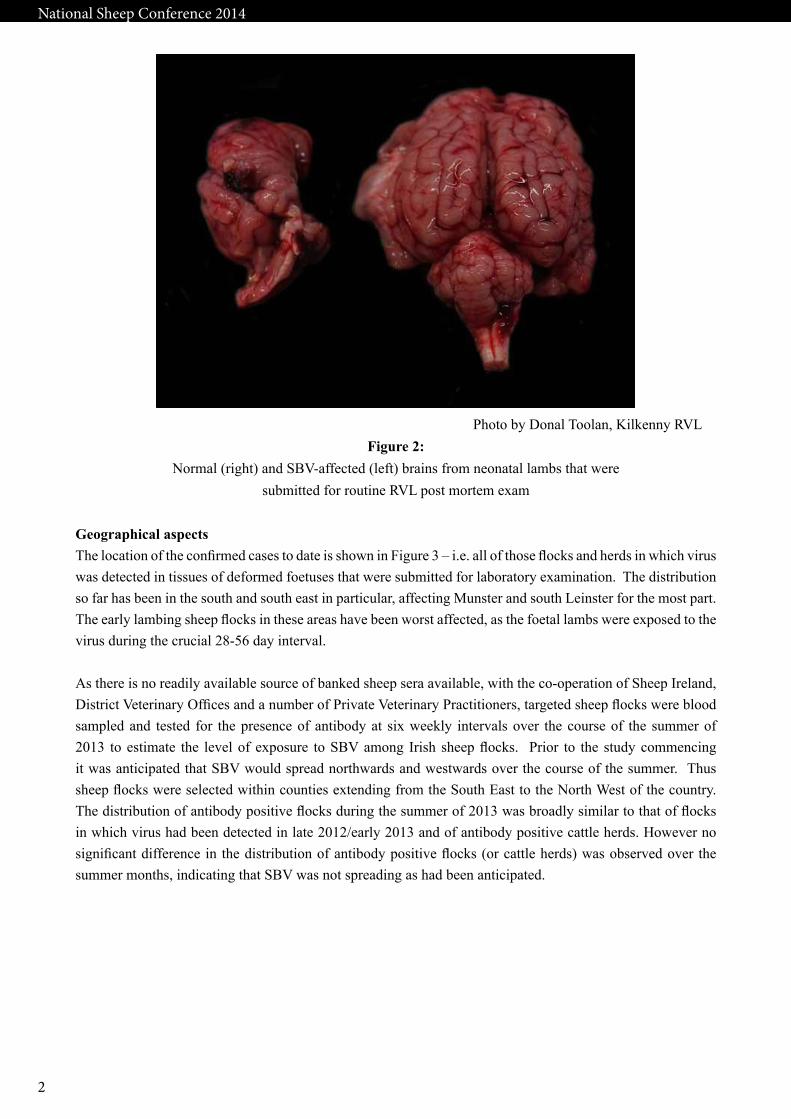
IntroductionSchmallenberg virus (SBV) was first identified by the Friedrich Loeffler Institute (FLI) near the German town of the same name in the summer of 2011, and emerged in the Netherlands at about the same time. By the end of October 2012, it had been detected in most of Western Europe. The first case of SBV-related disease was diagnosed in Ireland in October 2012, in an aborted bovine foetus in Cork. To date, the virus has been detected directly in 49 cattle holdings and 30 sheep holdings. However, as the condition is not notifiable it is likely many more cases were never taken to a laboratory for confirmation and therefore have gone undetected. In cattle SBV is associated with fever, milk drop, diarrhoea, as well as abortion and foetal abnormality. In sheep and goats, it is known to cause abortion and the birth of deformed lambs. The congenital deformities which occur include torticollis (twisted neck, maybe also ‘locked), arthrogryposis (limbs bent & locked), brachygnathia inferior (shortened lower jaws) and hydranencephaly (abnormalities with excess fluid in the brain) (Figures 1 and 2). The critical period for the development of congenital deformities is when infections occur between 28-56 days in sheep and 62-170 days in cattle.
Photo by Cosme Sanchez-Miguel, Cork Regional Veterinary Laboratory (RVL)
Figure 1:A classic case of SVB-related congenital deformity in a neonatal lamb – this individual shows arthrogryposis (fused joints), torticollis (twisted neck), and brachygnathia inferior (undershot jaw).
2
National Sheep Conference 2014
Photo by Donal Toolan, Kilkenny RVLFigure 2:
Normal (right) and SBV-affected (left) brains from neonatal lambs that were submitted for routine RVL post mortem exam
Geographical aspectsThe location of the confirmed cases to date is shown in Figure 3 – i.e. all of those flocks and herds in which virus was detected in tissues of deformed foetuses that were submitted for laboratory examination. The distribution so far has been in the south and south east in particular, affecting Munster and south Leinster for the most part. The early lambing sheep flocks in these areas have been worst affected, as the foetal lambs were exposed to the virus during the crucial 28-56 day interval.
As there is no readily available source of banked sheep sera available, with the co-operation of Sheep Ireland, District Veterinary Offices and a number of Private Veterinary Practitioners, targeted sheep flocks were blood sampled and tested for the presence of antibody at six weekly intervals over the course of the summer of 2013 to estimate the level of exposure to SBV among Irish sheep flocks. Prior to the study commencing it was anticipated that SBV would spread northwards and westwards over the course of the summer. Thus sheep flocks were selected within counties extending from the South East to the North West of the country. The distribution of antibody positive flocks during the summer of 2013 was broadly similar to that of flocks in which virus had been detected in late 2012/early 2013 and of antibody positive cattle herds. However no significant difference in the distribution of antibody positive flocks (or cattle herds) was observed over the summer months, indicating that SBV was not spreading as had been anticipated.

3
National Sheep Conference 2014
Figure 3 Map of Irish holdings that have had a confirmed diagnosis of SBV-related mortality (bovine cases in blue and ovine cases in green). Map produced by CVERA from data supplied by the DAFM National Disease Control Centre and Laboratories.

4
National Sheep Conference 2014
Figure 4 National SBV antibody survey of cattle sera sampled between November 2012 and January 2013, shown as percentage of antibody positive holdings by county. Map produced by CVERA from data supplied by the DAFM National Disease Control Centre and Laboratories.
A number of studies have been carried out on bovine blood samples submitted for Brucella testing toward the end of the end of 2012 and during 2013, and the geographical distribution of seroconversion is shown in Figure 4.

5
National Sheep Conference 2014
Table 1. Summary of counties with serological evidence of exposure to SBV infection in sheep in 2013 survey
Counties with Evidence of exposure in sheep
Counties with no evidence of exposure in sheep
Inconclusive
CarlowKilkennyWaterfordWexfordWicklow
DonegalGalwayKildareLongfordMayoOffalyRoscommonSligoWestmeath
Laois
As there was little or no evidence of further geographic spread of the virus in 2013, we then wondered if there was any evidence of SBV circulating in those flocks in the South and East of the country in which it had been detected earlier in the year. Therefore we then undertook a survey of 2013 born lambs in November of last year. If these animals were found to be positive then we could assume that that they were exposed to the virus in 2013. Details of the results are set out in Table 2; the only evidence of SBV exposure in lambs born during 2013 was in three of the flocks sampled in Co Wexford.
Table 2: Flock level results of 2013 lamb survey in flocks with confirmed cases of SBV.
County No of flocks tested No of flocks with evidence of exposure to SBV in 2013 lambs
Carlow 1 0Cork 2 0Kilkenny 6 0Wexford 5 3
Assessing the impact of SBV in Irish sheep flocksThis study set out to assess the impact of SBV on performance in Irish sheep flocks. Across the EU, SBV is considered to be a low impact disease for the sheep population, affecting between 4% and 6% of flocks overall (Anon, 2013). However, it is recognised by EFSA that this is likely to grossly underestimate the prevalence of disease in Europe. A recent study conducted in France among flocks where SBV had been confirmed by RT-qPCR found 85% of lambs were born healthy, with 13% born dead or dying shortly after birth and 2% were born with malformations and lived more than 12 hours. However, there was considerable variation between flocks (Dominguez et al., 2012). Anecdotal accounts from Ireland indicate that losses can be quite significant among certain flocks, especially early-lambing flocks in areas of high risk. The laboratory confirmed cases were predominantly in early-lambing flocks in the south-east. A number of the flocks with early- and late-lambing components reported the losses were effectively confined to the early-lambing part of the flocks. This probably reflects a higher likelihood of exposure to the virus during the stage of pregnancy when foetal damage occurs (28-56 days) coupled with synchronised breeding, such that a greater proportion of susceptible ewes were in that stage of pregnancy when exposure of the flock occurred.
To substantiate these anecdotal reports a survey of sheep flocks involved in Sheep technology Adoption Programme (STAP) discussion groups (control flocks) and flocks which had laboratory confirmed cases of SBV (case flocks) was carried out in 2013. A total of 334 responses were received, of which 267 were fully
6
National Sheep Conference 2014
completed and suitable for analysis. Preliminary analysis, comparing 2012 and 2013 weaning rates in case and control flocks showed a 3% reduction in case flocks in 2013 which is most probably attributable to SBV infection. A more detailed statistical analysis is still in progress.
Summary The number of cases of SBV infection confirmed by voluntary submission of suspect cases to RVLs is very likely an under-estimate of the prevalence of disease in 2013, as only a minority of cases are submitted for post mortem examination. We continue to solicit submissions of deformed newborn lambs and calves so that we can continue to monitor the prevalence and trends.
• There was little or no evidence of further spread of SBV infection during 2013 contrary to what was expected. It is not known why this was the case, but the late spring and hot, dry summer are likely to have reduced biting midge numbers and activity.
• The data from the 2013 lamb crop in what were considered endemically-infected areas indicate that a large proportion of the lambs were not exposed, are immunologically naïve to SBV, and will be highly susceptible if the virus were to circulate again within those areas.
• As there was a good correlation between the location of seropositive cattle herds and seropositive sheep flocks and given that cattle samples can be acquired on a more cost effective basis by opportunistic use of sampling for brucellosis, surveys in cattle can be used as a proxy to determine the extent of exposure of the sheep population.
• SBV is generally considered a relatively low impact disease. Data from our studies have found that this is the case overall but some flocks, particularly early lambing flocks have experienced significant losses as a result of SBV.
AcknowledgementsKate O’Keefe, Cork Blood Testing Laboratory, DAFM; Guy McGrath, Tracy Clegg and Daniel Collins, CVERA, UCD; DVO veterinary staff and private veterinary practitioners; Teagasc STAP advisory staff; Sheep Ireland and IFA
ReferencesAnon. (2012) Schmallenberg virus: analysis of the epidemiological data (November 2012) http://www.efsa.europa.eu/en/supporting/pub/360e.htm). Dominguez M., Calavas D., Jay M., Languile J., Fediaevsky A., Zientara S., Hendrikx P. and Touratier A. (2012) Preliminary Estimate of Schmallenberg virus infection impact in sheep flocks – France. Veterinary Record doi: 10.1136/vr.100883

7
National Sheep Conference 2014
Developing a worm control strategy for your farm
T. Colla, O. Keaneb, M. Sheehanc B. Goodd, T. De Waale and M. Dohertye
aTeagasc, Mohill, Co. Leitrim. bAnimal & Bioscience Department, Animal & Grassland Research & Innovation Centre, Teagasc, Grange, Dunsany, Co. Meath. cKilkenny RVL, Co. Kilkenny. dAnimal & Bioscience Department, Animal & Grassland Research & Innovation Centre, Teagasc, Athenry, Co.
Galway. eSchool of Veterinary Medicine, University College Dublin, Dublin 4.
IntroductionGrazing sheep are exposed to gastrointestinal nematodes (roundworms). Gastrointestinal infection in lambs causes a depression in appetite and increased protein loss from the gastrointestinal tract (GIT) which results in ill-thrift and occasional death. Even sub-clinical infection results in production losses, in the form of reduced growth rate and light under finished carcasses. Grazing sheep in Ireland are generally infected with a number of different roundworm species including Teladorsagia (brown stomach worm), Trichostrongylus species (black scour worm) Nematodirus species and Cooperia curticei (Table 1). Adult worms in the GIT of animals lay eggs which are passed out with the faeces. The eggs hatch, releasing larvae on pasture and are ingested by grazing animals. Larvae develop in the GIT into adult worms, thereby completing the life cycle. Each roundworm species has its own particular life cycle and different species predominate depending on the time of year, geographic location and local weather conditions. For example, Nematodirus species is often a major cause of parasitic gastroenteritis in young spring lambs. Later in the season other species such as Teladorsagia and Trichostrongylus predominate. In the case of Nematodirus species the larval stage of the parasite can cause disease and animals may have clinical signs of infection before eggs are found in faeces. For other roundworm species the level of infection in a group of lambs can be ascertained by counting the number of eggs per gram of faeces (faecal egg count or FEC).
Table 1. Results from survey of gastrointestinal parasites in lambs from 32 flocks in Sligo/Leitrim, summer 2012. Faecal samples were taken from lambs on each farm, pooled and cultured to recover nematode larvae.
Species of nematode No. farms tested No. positive farms % of farms
All roundworm species 32 32 100
Teladorsagia species 28 25 89
Trichostrongylus species 28 26 93
Cooperia curtecei 28 17 61
Worm control and anthelmintic resistanceFor over 50 years, the administration of broad spectrum anthelmintics has been an essential component in controlling the negative impact of gastrointestinal nematodes in sheep. Despite the many different anthelmintic products on the market, they belong to one of 5 major drug groups (Table 2). In recent years reports of “anthelmintic resistance” are increasing worldwide. Anthelmintic resistance is defined as the heritable ability of worms to survive a dose of anthelmintic that in the past would have killed them. In order to be fully effective, an anthelmintic treatment must kill at least 95% of the worms.

8
National Sheep Conference 2014
Table 2. Major anthelmintic drug classes
Class of anthelmintic Common name/ Group Notes
Benzimidazole (1-Bz) White
Levamisole (2-Lv) Yellow
Macrocyclic Lactone (3-ML) Clear
Monepantel (4 –AD) Orange Prescription only (ZOLVIX, Novartis Animal Health)
Derquantel (5-SI + 3-ML) Purple Prescription only (STARTECT, Zoetis)
Regular treatment with anthelmintics, in the absence of control strategies to delay the development of resistance, can give rise to anthelmintic resistance. Consequently, strategies which minimise the use of anthelmintics for the control of roundworm infection are required to preserve the efficacy of the drugs currently on the market. A number of factors are known to influence the rate at which anthelmintic resistance arises and spreads. These include inappropriate dosing (dosing too often or not administering the correct dose quantity), the proportion of worms not exposed to the anthelmintic and the movement of animals harbouring anthelmintic resistant worms. A recent study of Irish lowland sheep producers found that there was considerable departure from best practice in anthelmintic administration, which can accelerate the development of anthelmintic resistance (Patten et al., 2011). This indicates the need for technical efficiency improvement in worm control practices. A number of studies have examined the prevalence of resistance to the commonly used anthelmintics in Ireland. In 2012, evidence for resistance to the white drenches was found on almost 90% of farms tested and evidence for resistance to the yellow drenches was found on almost 40% of farms tested (Good et al., 2012). Resistance to the clear drenches was also suspected on approximately 10% of farms tested but this requires further confirmation (Good et al., 2012). In Northern Ireland, evidence was found for resistance to the white, yellow and clear drenches (McMahon et al., 2013). These studies indicate a significant level of anthelmintic resistance in Ireland and highlight the need for prudent worm control strategies.
Sheep Technology Adoption ProgrammeIt is important that farmers know the efficacy of anthelmintics on their farms so that they can develop an effective worm control strategy. In 2013, the Sheep Technology Adoption Programme (STAP) was launched by the Department of Agriculture Fisheries and the Marine (DAFM). As part of STAP, farmers can test the efficacy of their drenching programme (STAP Task 3 – Table 3). This involves testing for roundworms eggs both pre and post-drenching in order to determine the effectiveness of the drench used.
9
National Sheep Conference 2014
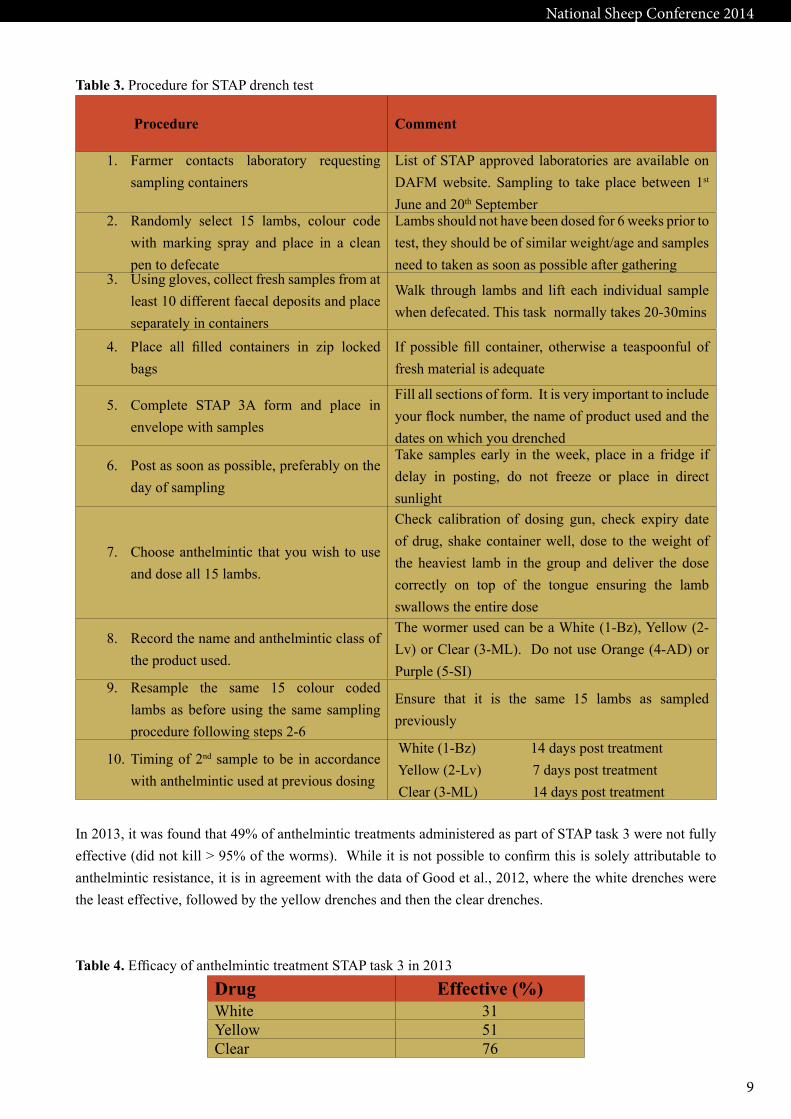
Table 3. Procedure for STAP drench test
Procedure Comment
1. Farmer contacts laboratory requesting sampling containers
List of STAP approved laboratories are available on DAFM website. Sampling to take place between 1st June and 20th September
2. Randomly select 15 lambs, colour code with marking spray and place in a clean pen to defecate
Lambs should not have been dosed for 6 weeks prior to test, they should be of similar weight/age and samples need to taken as soon as possible after gathering
3. Using gloves, collect fresh samples from at least 10 different faecal deposits and place separately in containers
Walk through lambs and lift each individual sample when defecated. This task normally takes 20-30mins
4. Place all filled containers in zip locked bags
If possible fill container, otherwise a teaspoonful of fresh material is adequate
5. Complete STAP 3A form and place in envelope with samples
Fill all sections of form. It is very important to include your flock number, the name of product used and the dates on which you drenched
6. Post as soon as possible, preferably on the day of sampling
Take samples early in the week, place in a fridge if delay in posting, do not freeze or place in direct sunlight
7. Choose anthelmintic that you wish to use and dose all 15 lambs.
Check calibration of dosing gun, check expiry date of drug, shake container well, dose to the weight of the heaviest lamb in the group and deliver the dose correctly on top of the tongue ensuring the lamb swallows the entire dose
8. Record the name and anthelmintic class of the product used.
The wormer used can be a White (1-Bz), Yellow (2-Lv) or Clear (3-ML). Do not use Orange (4-AD) or Purple (5-SI)
9. Resample the same 15 colour coded lambs as before using the same sampling procedure following steps 2-6
Ensure that it is the same 15 lambs as sampled previously
10. Timing of 2nd sample to be in accordance with anthelmintic used at previous dosing
White (1-Bz) 14 days post treatment Yellow (2-Lv) 7 days post treatment Clear (3-ML) 14 days post treatment
In 2013, it was found that 49% of anthelmintic treatments administered as part of STAP task 3 were not fully effective (did not kill > 95% of the worms). While it is not possible to confirm this is solely attributable to anthelmintic resistance, it is in agreement with the data of Good et al., 2012, where the white drenches were the least effective, followed by the yellow drenches and then the clear drenches.
Table 4. Efficacy of anthelmintic treatment STAP task 3 in 2013
Drug Effective (%)White 31Yellow 51Clear 76

10
National Sheep Conference 2014
It is important to note that an initial flock FEC of at least 200 eggs per gram is required for a valid result to be obtained. Thus, at least a six week interval from previous dosing is required to ensure sufficiently high initial faecal egg counts. A post dosing FEC that represents less than 95% reduction indicates that the dosing did not work effectively. Whether this can be more confidently attributed to anthelmintic resistance will largely depend on whether the drench test was done in accordance with the recommended guidelines (Table 3). Incorrect product use, through incorrect storage, inaccurate dosing technique, faulty dosing equipment or incorrectly estimating the dose rate will all impact on drug efficacy. The STAP drench test task can be repeated again that season or in the following year. If anthelmintic resistance is still suspected then a Faecal Egg Count Reduction Test should be carried out in consultation with a veterinary surgeon or agricultural advisor. A Faecal Egg Count Reduction Test is a more controlled and rigorous procedure than the drench test employed by STAP.
Dosing managementGood dosing management is essential to reduce the risk of resistance arising and to prevent ineffective dosing. Lambs should be weighed and dosed to the heaviest lamb in the group. The calibration of the dosing gun should be checked to ensure it is delivering the correct amount by using a graduated cylinder or 10ml syringe. The dose should be delivered over the back of the tongue and completely swallowed by the animal. All products should be vigorously shaken before use, especially white drenches. The products should be in date and not been subject to frost or exposed to direct sunlight. Too frequent dosing, e.g. every 4-6 weeks without the use of faecal egg counts to underpin dosing decisions or under-dosing lambs all contribute to the speed at which resistance arises within the nematode population of the flock.
Targeted treatment The use of anthelmintics only when they are necessary will help maintain their long-term efficacy. Dosing on a routine basis such as every 4-6 weeks leads to over-use and speeds up the development of anthelmintic resistance. Farmers should know what they are dosing for and what to dose with at different times of the year. Just because lambs are scouring does not necessarily mean they have a heavy worm burden. Equally, lambs that have heavy worm burdens may not scour, but growth rates may be reduced. Knowing which parasite is threatening your lambs enables you to better target treatment specifically at that parasite. The first dose for March born lambs should be for Nematodirus species. Farm history, weather conditions, lamb observation and the DAFM Nematodirus warning should all be used to predict when the first dose is required. A white (1-Bz) or yellow (2-Lv) drench should be the drug of choice at this stage as widespread anthelmintic resistance to these drugs has not been reported for Nematodirus species and the ML drugs do not offer residual activity against Nematodirus reinfection. From June onwards, other worms species are a threat and faecal egg counts should be used to determine when to dose. When dosing in mid-season, 10% of the flock can be left untreated. This increases the number of susceptible worms on the pasture, thereby creating a dilution effect and delaying the development of anthelmintic resistance (Abbott et al., 2012). Of the 5 broad spectrum anthelmintic groups now available in Ireland to control roundworms (Table 2), the two newest, ZOLVIX and STARTECT, are prescription only medicines. Ideally these drugs should not be used more than once a year in lambs (with the exception of them being used as a quarantine treatment) and only when worm populations on pasture and worm burdens are at their highest, normally after weaning. With the availability of these new drugs we have a chance to extend the life of the original groups, but only if we avoid the bad practices of the past which are responsible for the development of resistant worms.
BiosecurityWhen sheep are bought in they may be carrying resistant worms. In consultation with your veterinary practitioner, all bought in sheep should be treated with an abamectin and Derquantel combination product (i.e. 5-SI STARTECT) or with a moxidectin (3-ML) injection and a 4-AD monepantel drench (ie ZOLVIX) which will kill both scab mites and resistant worms. Each drug should be delivered separately; mixing of drenches

11
National Sheep Conference 2014
on farm should never be carried out. After dosing, sheep should be held in a yard for a minimum of 24 hours (preferably 48 hours) with free access to water and food so that any eggs that may have survived treatment will have been passed out. All faeces deposited while sheep are isolated should be carefully disposed of in a manner that ensures that sheep will not be exposed to it again (e.g.do not spread on pasture where sheep will subsequently graze). Sheep should subsequently be turned out to a field that has been grazed by the home flock and contains a parasite challenge, and should remain isolated from the home flock for 3 weeks. Anthelmintic resistance is a threat to the health and productivity of the Irish sheep industry and a prudent worm control strategy is required to mitigate this threat.
ReferencesAbbott, K. A., M. A. Taylor & L. A. Stubbings, (2012) Sustainable Control of Parasites in Sheep: A Technical Manual for Veterinary Surgeons and Advisors.Good, B., J. P. Hanrahan, D. T. de Waal, T. Patten, A. Kinsella & C. O. Lynch, (2012) Anthelmintic-resistant nematodes in Irish commercial sheep flocks- the state of play. Ir Vet J 65: 21.McMahon, C., D. J. Bartley, H. W. Edgar, S. E. Ellison, J. P. Barley, F. E. Malone, R. E. Hanna, G. P. Brennan & I. Fairweather, (2013) Anthelmintic resistance in Northern Ireland (I): prevalence of resistance in ovine gastrointestinal nematodes, as determined through faecal egg count reduction testing. Vet Parasitol 195: 122-130.Patten, T., B. Good, J. P. Hanrahan, G. Mulcahy & T. de Waal, (2011) Gastrointestinal nematode control practices on lowland sheep farms in Ireland with reference to selection for anthelmintic resistance. Ir Vet J 64: 4.

12
National Sheep Conference 2014
Irish Sheep Breeding – the next five years
N. McHugh1, and T. Pabiou2
1Teagasc, Animal & Grassland Research and Innovation Centre, Moorepark, Fermoy, Co. Cork2Sheep Ireland, Highfield House, Shinagh, Bandon, Co. Cork
Introduction
Animal genetics is a powerful tool that allows farmers to select superior animals to become the parents of the next generation. Genetics involves the passing on of favourable or unfavourable genes from one generation to the next. Therefore, genetics is permanent and cumulative and allows farmers to make long term genetic gains, something that feeding or management cannot compensate for. A ram that has a genetic predisposition to lameness will continuous cause problems irrespective of treatment and more worryingly this animal has the potential to pass these unfavourable genes onto his progeny and thus the problem may persist or indeed worsen. However, the reverse is also true. For example, an animal that displays high growth rates or good conformation due to superior genetics will allow the favourable gene to filter down through your flock. Animal breeding is an underutilised tool in the Irish sheep industry, the gains that can be achieved through genetic selection are clearly evident within the dairy and beef industry. However, with the establishment of Sheep Ireland, along with new research from Teagasc and continued industry support, rapid improvements in productivity gains for important traits can be achieved. The aim of this paper is to review the current sheep breeding in Ireland and to highlight future improvements.
Current State of Play
Sheep Ireland was established in 2008 to implement a dynamic genetic improvement breeding programme for the Irish sheep industry and to help increase flock productivity and profitability. The current genetic evaluations established by Sheep Ireland focuses on breeding profitable animals for commercial sheep production. The aim of the national breeding programme is to produce a low cost, easy-care sheep with good maternal characteristics, but yet will produce a quality lamb with high growth rates that will reach slaughter at a young age. Data on the traits of interest are recorded across a range of commercial and pedigree flocks and each trait is weighted based on its monetary value (€/lambs born) to farm profitability. A star rating is also assigned to each trait that allows farmers to easily visualise the ranking of animals within their breed (1 star = bottom 20%; 5 stars = top 20% of the breed).
New Breeding Objective
A comprehensive review of the Sheep Value breeding objective was undertaken in 2013 and after consultation with industry the decision was taken to split the Sheep Value Index into two overall indexes:
1. Terminal index - ranks animals based on their ability to produce live, fast growing terminal progeny with little lambing difficulty. This takes into account the progeny’s growth rate, carcass characteristics, days to slaughter and also lamb survival and lambing difficulty.

13
National Sheep Conference 2014
2. Replacement index - ranks animals on the expected maternal performance such as milk yield, lamb survival and the ease of lambing, however it also includes some terminal traits to account for the efficiency at which animal’s progeny are finished.
Table 1 provides a list of all the goal traits that are included in each index and the relative emphasis that is placed on each trait included in the index. Both indexes provide a measure of the genetic ability of the animal’s progeny to generate profit at farm level for a combination of traits.
Table1 Relative emphasis for each trait in the new Terminal and Replacement indexes.
Trait Terminal ReplacementDays to slaughter 40.30% 12.12%Carcase conformation 7.80% 2.35%Carcase fat 14.98% 4.55%
Maternal days to slaughter - 12.36%Maternal carcase conformation - 2.86%Maternal carcase fat - 5.49%Ewe mature weight - 15.93%Maternal Lamb survival - 16.34%Maternal Single Lambing difficulty - 0.22%Maternal Multiple Lambing difficulty - 0.13%Number of lambs born - 14.95%
Single Lambing difficulty 1.12% 0.37%Multiple Lambing difficulty 0.60% 0.21%Lamb survival 35.20% 12.12%
Genetic gains to date
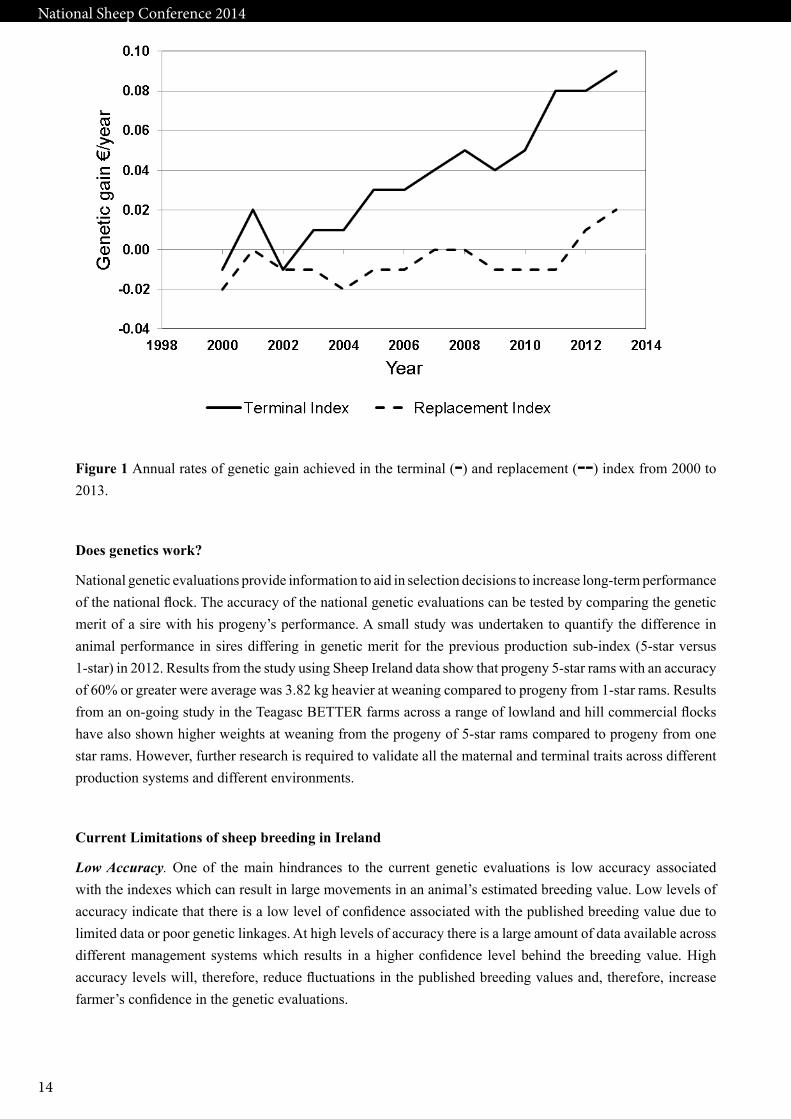
The rates of genetic gain are calculated annually for the terminal and replacement index to ensure that the genetic indexes are selecting genetically superior animals for the next generation. Figure 1 illustrates the annual rate of genetic gain across the terminal and replacement index achieved to date. The graph shows that although considerable genetic gain has been achieved in the terminal traits, by comparison, little genetic gain has been achieved to-date in the maternal traits represented in the replacement index. However, with the accumulation of large amounts of maternal data and continual improvement in the national genetic evaluations there is significant scope to accelerate genetic gain across both terminal and maternal traits.
14
National Sheep Conference 2014
Figure 1 Annual rates of genetic gain achieved in the terminal (-) and replacement (--) index from 2000 to 2013.
Does genetics work?
National genetic evaluations provide information to aid in selection decisions to increase long-term performance of the national flock. The accuracy of the national genetic evaluations can be tested by comparing the genetic merit of a sire with his progeny’s performance. A small study was undertaken to quantify the difference in animal performance in sires differing in genetic merit for the previous production sub-index (5-star versus 1-star) in 2012. Results from the study using Sheep Ireland data show that progeny 5-star rams with an accuracy of 60% or greater were average was 3.82 kg heavier at weaning compared to progeny from 1-star rams. Results from an on-going study in the Teagasc BETTER farms across a range of lowland and hill commercial flocks have also shown higher weights at weaning from the progeny of 5-star rams compared to progeny from one star rams. However, further research is required to validate all the maternal and terminal traits across different production systems and different environments.
Current Limitations of sheep breeding in Ireland
Low Accuracy. One of the main hindrances to the current genetic evaluations is low accuracy associated with the indexes which can result in large movements in an animal’s estimated breeding value. Low levels of accuracy indicate that there is a low level of confidence associated with the published breeding value due to limited data or poor genetic linkages. At high levels of accuracy there is a large amount of data available across different management systems which results in a higher confidence level behind the breeding value. High accuracy levels will, therefore, reduce fluctuations in the published breeding values and, therefore, increase farmer’s confidence in the genetic evaluations.
15
National Sheep Conference 2014
Missing traits. Access to large quantities of accurately recorded data is another obstacle to accurate genetic evaluations in Ireland. Traits such as health (lameness, mastitis, susceptibility to parasites and fly strike), meat quality, lamb vigour and feed intake are economically important but in order to include such traits within the genetic evaluations, tools must be developed to facilitate the accurate recording of the pertinent data at farm level.
Parentage information. Genetic evaluations rely on the availability of accurate phenotypic information but also on the collection of pedigree or parentage information for each animal. Without this information genetic evaluations are simply not possible. Another large hindrance for sheep genetic evaluations in Ireland is the availability of pedigree information on animals especially on the commercial ewe population. Currently, in order to collect parentage for lambs, commercial farms in Sheep Ireland are asked to operate on single sire mating basis. However, this is not a viable option for many commercial sheep farmers. An alternative method for the accumulation of parentage information involves the use of DNA information to retrospectively identify parents. The process involves the genotyping of all offspring and potential parents. The current cost of such technologies (~€30 per sample), prohibits its wide-scale use within the industry. However, as the cost of such technologies continues to fall rapidly genotyping of commercial animals may become a viable option in the near future.
Validation of the index: Although validation of the old production sub-index has been undertaken through data accumulated through Sheep Ireland and through the Teagasc BETTER farms, controlled experiments for animals divergent for genetic merit must also be undertaken. Such experiments would involve the segregation of groups of animals based on genetic merit (i.e. high and low). Animal performance and differences in profit would be compared to the expectation based on predicted genetic merit.
Future Improvements
Superior genetic evaluations: Constant re-evaluation and improvements in the genetic evaluations are required to ensure that genetics continues to deliver favourable results for the industry. As more commercial and pedigree data is accumulated, research will focus on the development of superior statistical models that reflect the underlying biology, and accounts for non-genetic effects (i.e. environmental or management factors) to ensure that the true genetic merit of an animal is reflected in their breeding values.
As more data becomes available to Sheep Ireland it is expected that the levels of accuracy for all traits will continue to increase, however there are a number of other methods that the levels of accuracy can be improved including:
• Improving genetic linkage - good genetic linkage allows for the relativity of breeding values produced between years or flocks to be established. Without genetic linkage year-to-year or flock-to-flock differences cannot be accurately accounted for in the genetic evaluations.
• Use of rams in the Central Progeny Test – the CPT plays a vital role in creating genetic linkages between flocks and breeds in the genetic evaluations. Information on the progeny managed in a commercial environment feeds back into the genetic evaluations and provides predictions of the genetic merit of the pedigree rams used and also his relatives, thereby, increasing accuracies.
• Use of predictor traits for difficult to measure traits – this is already used for carcass traits but could also be considered for a variety of other traits such as vigour scored at birth as a predictor of lamb
16
National Sheep Conference 2014
viability, weight bands used as predictors of birth weight and farmer scored traits as predictor of performance traits.
• Development of genomic selection (see below).
New economic values: In Ireland all traits included in the terminal and replacement index are of economic importance to Irish production systems and are optimally weighted within the indexes. Bio-economic models through the modelling of whole farm systems play an important role in identifying the pertinent inputs and outputs at farm level that have the largest impact on farm profitability. Such models have been developed for dairy and beef cattle in Ireland; however, to date no bio-economic model has been developed for the sheep sector. Research is on-going in Teagasc into the development of an Irish sheep bio-economic model to generate economic values and these will be implemented into the national sheep genetic evaluations in the near future.
Across breed comparison: The fundamental mechanism of genetic evaluation is the genetic comparison of animals based on their phenotypic records and ancestry. Genetic linkage is of critical importance to allow for an accurate comparison of animals in the genetic evaluations. Genetic and environmental (farm, year, sex, level of feeding) effects can be disentangled, and accuracy can reflect this. Across breed genetic evaluations facilitates comparisons of animals regardless of their breeds. To do so, the genetic evaluation, model must correct for breed differences. Research conducted to date has shown that the current data structure doesn’t yet allow for an accurate across breed genetic evaluation, especially for maternal traits. However, as more information becomes available on crossbred animals, the feasibility of producing accurate across breed breeding values will increase, thereby, allowing farmers to rank different breeds on the same index.
New traits: The feasibility of breeding for any trait is dictated by the availability of data, either for the trait itself or a genetically related trait. For a trait to be included in a breeding objective it must be: 1) important (economically, socially or environmentally), 2) under genetic control, and 3) measurable or genetically correlated with a heritable trait that can be measured. Future research will continue to focus on evaluating state-of-the-art technologies and statistical methodology to identify “easy to implement tools” to predict traits of economic importance in breeding goals. This research will involve close collaboration with Sheep Ireland, Teagasc and the BETTER Farm Programme. Examples of new traits include: meat quality traits, lamb vigour scored at birth, ewe fertility and ewe longevity and disease traits.
Validation of Irish genetics: Genetic indexes, like all new technologies, will have to be demonstrated to deliver results on commercial farms before there will be large scale industry buy-in. A new genetically elite flock is currently being established in Athenry to aid in evaluating the replacement index to ensure that animals deemed to be of high genetic merit for maternal traits are generating more profit at flock level. A further objective of this flock is to determine the suitability of New Zealand genetics for Irish grass based production systems. As part of this study a nucleus sheep flock, comprising of elite Suffolk and Texel females, representing the top genetic merit animals in the Irish and New Zealand genetic evaluations across a range of maternal traits will be evaluated. A third group of national average genetic merit Irish ewes will also be established to access the rates of genetic gain achievable under the current replacement index. This flock will access the biological and economic efficiency between the Irish and New Zealand genetically elite animals and monitor the relationship between the animal’s genetic merit and the phenotypic performance.

17
National Sheep Conference 2014
Genomic Selection: Genomic selection is the new breeding technology that uses genetic markers associated with genes to predict breeding values. This genetic marker information along with performance records allow for more accurate estimates of the genetic merit of the sheep. This allows young animals to achieve higher accuracy’s at a younger age before large amounts of information are collected on the animal, thereby, providing more accurate genetic evaluations for farmers. Studies in cattle suggest the rate of that genetic gain can be increased by 50% with an appropriate genomic selection breeding programme The expected response to selection from genomic selection may actually be greater in Irish sheep since the current accuracy levels are low, and therefore, the potential scope for improvement is considerable greater than incattle. To help prepare the Irish sheep industry for genomic selection DNA samples are currently being collected from rams with many progeny and high accuracy’s and stored in a biological bank. However, a prerequisite for a successful genomic selection programme is accurate genetic evaluations to exploit the technology. Therefore, most research in the short to medium term will focus on getting the basics right!
Conclusions
Genetic evaluations are a powerful tool for sheep farmers that enable them to make more informed breeding decisions and potentially increase productivity and profitability at farm level. To-date in sheep breeding it remains a relatively underutilised tool. However, with the continual improvement of the genetic evaluations rapid gains can be achieved over a comparatively a short period of time for the Irish sheep sector. The future holds significant new possibilities for accelerated genetic improvement of the sheep population. This will require significant buy-in from breed societies and commercial farms. A significant amount of additional recording will be required. However, the pay back for this will be more productive flocks, with higher lamb growth rate, requiring lower levels of assistance at lambing, reduced lamb mortality and healthier lambs and ewes. It is incumbent on all the stakeholders to grasp the emerging opportunities and deliver for the industry. This will improve the profitability and competiveness of the sheep industry.

18
National Sheep Conference 2014
Effects of rearing regime of replacements on the lifetime performance of ewes differing in prolificacy
T. KeadyAnimal and Grassland Research and Innovation Centre, Teagasc, Mellows Campus, Athenry, Co. Galway
IntroductionIreland, with exports accounting for 78% of its prime lamb production, is the largest net exporter of lamb in Europe and the fourth largest exporter of sheep meat world-wide. Lamb production in Ireland is grass-based and thus seasonal. Efficiency (as measured by weaning rate and stocking rate) at farm level has not improved in recent years even though lamb price at meat export plants has increased by 34% since decoupling in 2005. Currently, the mean stocking rate and weaning rate on Irish lowland sheep farms are 7.2 ewes/ha and 1.2 lambs/ewe respectively (National Farm Survey 2012). Lamb carcass production per ewe and ultimately per hectare, which are influenced by weaning rate (number of lambs weaned per ewe joined with rams) and stocking rate, are the major factors influencing profitability at farm level. The major factors affecting efficiency pre farm gate, based on research undertaken previously at Athenry, were identified as follows, in order of importance: litter size, grassland management, the feed value of silage offered to pregnant ewes, winter shearing of housed ewes, finishing male lambs entire, concentrate cost and choice of terminal sire breed (Keady and Hanrahan 2006).
Based on data from the National Farm Survey it is estimated that the mean replacement rate on lowland farms is 22% whilst the national weaning rate is only 1.2 lambs per ewe joined. Consequently, replacement costs are quite high particularly when expressed per kilogram of lamb carcass produced. Two ways of reducing replacement cost are, firstly, to increase longevity and thus the number of litters (lamb crops) produced, and, secondly, to increase litter size and thus the number of lambs weaned per ewe joined to the ram. The objective of this paper is to present information from an on-going study at Athenry designed to evaluate the effects of plane (level) of nutrition during the rearing phase and first pregnancy and ewe genotype on longevity and lamb output. The reasons for culling were recorded and are also examined.
Cost of replacementsThe costs associated with rearing ewe replacements are presented in Table 1. To undertake this costing exercise the following were assumed;1. The ewe lamb weighs 45 kg in early September and is valued at its carcass value. 2. Forage costs include grazed grass and silage requirements until joining the main flock in September of the
next year (approximately 18 months old as 2-tooth) prior to joining with rams. 3. A land charge (rental) is included in the forage costs which is equivalent to €20/replacement. 4. Veterinary costs include internal and external parasite control and vaccines for clostridial diseases.5. A housing cost is included as it is assumed that the replacement ewe lamb is over wintered indoors. 6. Sales of wool from the replacement and carcass value of the culls are included. Cull carcass value is based
on the mean annual ewe mortality on lowland farms of 5.2% (Hanrahan 2010) and a mean carcass weight of 30 kg.
Using the above assumptions the net cost associated with rearing a replacement to the point of joining with rams, and thus the ewe flock, as a 2-tooth is €126.40. As the mean national replacement rate is 22%, the replacement costs of the national sheep flock equates to €55.3 million annually, which is equivalent to €1.20/kg lamb carcass produced.

19
National Sheep Conference 2014
Table 1. Cost (€) associated with rearing a ewe replacement to joining the flock for mating at 18 monthsCost (€)
Costs: Ewe lamb 95Forage costs (grass and silage) 46.5Veterinary 4.4Shearing 2.5Housing 18Mortality 4Miscellaneous (incl. tagging) 2.4Total Cost 172.8
Sales: Wool 3.1Cull carcass value 43.3Total sales 46.4
Net cost of rearing a replacement ewe 126.4
Management of replacements to lamb at 2 years of ageThe replacement cost in any flock is influenced by the replacement rate and rearing expense. Rearing expense is influenced by the plane (level) of nutrition offered during the first winter and second grazing season. Plane of nutrition offered during the first pregnancy effects total costs up to the point of lambing. A study was initiated at Athenry in mid November involving a total of 284 ewe lambs of four different ewe genotypes, which differed in prolificacy. For the years 2006 to 2008, inclusive, approximately 95 ewe lambs entered the study annually and remained (remain) on the study until culled for normal husbandry/health reasons or they died. This study is ongoing as nearly 20% of the animals are still in the flock. The study may run until 2017, depending on the culling rate of the remaining animals. The four ewe genotypes were:
(a) Charmoise X Scottish Blackface (C x SBF) (b) Belclare X SBF (Bel x SBF)(c) Belclare (carrying a gene with a large effect on ovulation rate) x SBF (BelMG x SBF) (d) Belclare
The four ewe genotypes used in the present current were chosen because of their production potential, with the objective of representing a range in prolificacy that covers and exceeds that found at farm level. The four genotypes differed in body size, prolificacy (litter size), number of lambs reared and also in the performance of their progeny. As all ewes in the current study were mated to Suffolk sires, differences in lamb performance can be attributed to the ewe genotype. During their first winter the ewe lambs were managed at pasture in an extended grazing system and offered either a low (0.75 kg DM) or high (1.75 kg DM) daily herbage allowance with the intention of varying energy intake and thus growth rate. Further details of the extended grazing management and effects on replacement and pregnant ewe performance are presented by Keady and Hanrahan (2007).
From early April to 30 August half of the lambs from each winter treatment were divided equally to graze pasture, set stocked to ensure either a low or high herbage allowance. This was achieved by maintaining sward heights at 4 cm (low) and 6 cm (high), respectively. From 30 August until housing (mid December) the 2-tooth ewes (hoggets) were managed as one flock. At first joining the ewes were, on average 77 % of mature body weight. From housing until lambing half of the animals from each group were offered either medium (DMD = 69.3%) or high (DMD = 75.2%) feed-value grass silage and thus had different levels of nutrition during first pregnancy. Regardless of grass silage feed value 2-tooth ewes carrying singles, twins, triplets and quads (scan information) were supplemented with an average of 15, 21, 25 and 31 kg concentrate, respectively.
The ewes and their lambs pre weaning, and the lambs post weaning, were grazed in a rotational-grazing system

20
National Sheep Conference 2014
to target post-grazing sward heights, based on previous studies at Athenry. The target post grazing sward heights were as follows: 3.5–4, 4.5–5, 5.5–6, 6, 6, 6 and 6 cm for the months of March, April, May, June, July August and September respectively (Keady 2010). From the point of lambing at 2 years of age all ewes and their progeny were managed in the same system, regardless of previous treatment. Post lambing, ewes rearing singles or twins, and their progeny, received no concentrate at pasture. Ewes rearing triplets were offered 0.5 kg concentrate daily for 5 weeks post lambing whilst their lambs were offered up to 300 g concentrate daily until weaning. Post weaning, all lambs were managed as a single group at pasture without concentrate supplementation. Male lambs were left entire. Previous studies at Athenry showed that male lambs grew faster, were heavier at weaning (+ 1.8 kg) and thus were slaughtered at a younger age (16 days) (Hanrahan, 1999) relative to castrates. Lambs were drafted for slaughter every 3-4 weeks with the last draft being prior to mid-December.
The study enabled the effects of level of nutrition offered during the first winter, second grazing season and first pregnancy on ewe replacement body size and longevity, subsequent progeny output, reasons for culling and lifetime output to be determined. Furthermore, as there were four contrasting ewe genotypes used, the study also provides information on whether the effects of plane of nutrition offered at different stages during the rearing phase of a replacement depend on the prolificacy potential.
Effect of dietary treatment on performance until mating as 2-tooth ewesThe effect of treatment on live weight to pre-mating is presented in Figure 1. Altering the level of nutrition during the first winter resulted in a difference in live weight of 8.5 kg by late March. When the animals that had received the low level of nutrition during the winter were offered the high summer grass allowance they were 4.9 kg lighter pre joining than the animals which had received the high plane of nutrition during the winter. Consequently, compensatory growth during the grazing season by the animals offered the low plane of nutrition was inadequate to eliminate the effect of plane of nutrition during the previous winter.
Lambs that were on the high plane of nutrition during their first winter and subsequent summer were 8.5 kg heavier (61.7 kg) than those on the low level of nutrition (53.3 kg) throughout the rearing phase. By early September, animals that were on the high level of nutrition in winter and had been moved to the summer low level or those which have previously been on the low level in winter and moved to the summer high level of nutrition were of similar weight (56.7 kg) at joining. Consequently, the animals offered the high level of nutrition throughout the study were 16% heavier than those offered the low level of nutrition.
The plane of nutrition offered during the first winter and second summer had a big effect on linear body measurements, and thus on physical size. For example, at the point of joining, animals that had been offered the high level of nutrition during the winter and subsequent summer were 1.1 cm taller, 3.4 cm longer, 7.2 cm greater in girth and the circumference of the cannon bone was 0.4 cm larger than the animals that had been on the low plane of nutrition throughout the study. Consequently, the plane of nutrition during the year prior to joining increased the body frame size, weight and condition of the ewes pre-mating (Table 2).

21
National Sheep Conference 2014
30
35
40
45
50
55
60
65
Live
wei
ght (
kg)
HH HL LH LL
Figure 1. Effect of level of nutrition offered during the winter and second grazing season on body weight (kg) up to joining. [*First letter denotes winter nutrition (H, L), second letter denotes summer nutrition (H, L)]
Effect of level of nutrition on ewe reproductive performanceThe effects of plane of nutrition offered during the winter and summer of the rearing phase on ewe prolificacy are presented in Table 2. Whilst plane of nutrition impacted on body size (frame size, weight and condition score) at joining, plane of nutrition during the rearing phase did not affect litter size or weaning rate (number of lambs weaned per ewe joined to rams) of ewes lambing as 2 tooths or up to 5 years of age.
Table 2. Effect of plane of nutrition offered during the first winter and second grazing season on ewe and progeny performance
Winter nutritionHigh Low
Summer Nutrition High Low High LowFirst joining - weight (kg) 61.7 56.6 56.8 53.3
- condition score 3.8 3.5 3.5 3.3Performance as 2 year olds
Litter size 2.02 2.14 2.11 2.08Number weaned per ewe to ram 1.64 1.73 1.62 1.71
Mean performance to 5 years of ageLitter size 2.11 2.14 2.21 2.21Number weaned per ewe to ram 1.74 1.71 1.72 1.80
Plane of nutrition during the first winterThe two planes of nutrition offered during the first winter resulted in metabolisable energy intake equivalent to 73 and 142 % of maintenance requirements. The effects of plane of nutrition offered during the first winter on ewe and progeny performance as 2 year olds and up to 5 years of age are presented in Table 3. Increasing the plane of nutrition offered during the first winter increased lamb birth and weaning weights; improved lamb growth rate from birth to weaning for ewes lambed as 2-tooths and for total performance up to 5 years of age and reduced ewe barreness. Plane of nutrition offered during the first winter had no effect on the mortality of lambs born to ewes up to 5 years of age.

22
National Sheep Conference 2014
Plane of nutrition during the second grazing seasonAltering the plane of nutrition offered during the second grazing season by changing residual sward height resulted in a similar difference in ewe weight at joining with the rams as occurred due to altering the winter plane of nutrition. The effect of altering summer plane of nutrition on the performance of ewes (and their progeny) when lambed as 2-tooths, and up to 5 years, is presented in Table 3. Plane of nutrition offered during the second grazing season did not alter litter size, number of lambs weaned per ewe let to the ram, or lamb birth or weaning weights from ewes when lambed as 2-tooths or up to 5 years of age or ewe barreness.
Table 3. Effect of plane of nutrition offered during the first winter and second grazing season on ewe and progeny performance
Winter nutrition Summer nutritionHigh Low High Low
Performance as 2 year oldsLamb performance
- weight at birth (kg) 4.2 4.0 4.1 4.0- weaning weight (kg) 28.5 27.9 28.1 28.2- growth rate (g/d) - to 5 weeks 263 258 259 262
- to weaning 251 246 247 249Mean performance to 5 years of age
Lamb performance- weight at birth (kg) 4.3 4.2 4.3 4.3- weaning weight (kg) 31.0 30.5 30.7 30.9- growth rate (g/d) - to 5 weeks 278 278 280 282
- to weaning 274 270 271 273Total number of lambings to 5 years 2.93 2.79 2.88 2.84Number of lambs reared to 5 years 5.23 5.14 5.18 5.20Lamb mortality (%) 8.3 7.6 8.6 7.6Ewe barreness (%) 3.6 6.1 4.9 4.8
Effect of plane of nutrition during the first pregnancySilage feed value is influenced by its digestibility (DMD) and intake characteristics. The mean DMD of silages produced in Ireland for 2010, 2011 and 2013 was 68.7%, 70.3% and 67.3%, respectively. Level of nutrition during the first pregnancy in this study was altered by offering silages differing in DMD and thus feed value. The silage offered to the ewes on the low plane of nutrition had a DMD of 69.3% similar to the average grass silage produced in Ireland. The ewes received the high feed value silage were offered silage which had a DMD of 75.2%.
The effects of plane of nutrition offered during the first pregnancy on ewe and subsequent lamb performance when lambed as 2-tooths and on their performance up to 5 years of age are presented in Table 4. Increasing the plane of nutrition offered to pregnant ewes prior to lambing as 2-tooths increased lamb birth weight by 0.3 kg and weaning weight by 0.9 kg. The increased weaning weight was due to a combination of increased birth weight and growth rate (8 g/day) from birth to weaning. The low plane of nutrition resulted in higher ewe mortality (4.9%) and ewe barrenness (4.2%) relative to the ewes offered the high plane of nutrition (1.5 and 0.0 % respectively). Therefore, 98.5 and 90.9 % of 2-tooth ewes offered the high and low planes of nutrition during pregnancy weaned lambs. Consequently, increasing the plane of nutrition during the pregnancy of 2-tooth ewes increased the weight of weaned lamb by 9%. Whilst plane of nutrition offered during the first pregnancy affected the performance of ewes lambing as 2-tooths, and of their lambs, it did not impact on ewe performance from 3 to 5 years of age.

23
National Sheep Conference 2014
Table 4. Effect of plane of nutrition offered during the first pregnancy on ewe and progeny performanceFirst pregnancy nutrition
High LowPerformance as 2 year olds
Litter size 2.10 2.07Number weaned per ewe to ram 1.72 1.63Lamb performance
- weight at birth (kg) 4.23 3.95- weaning weight (kg) 28.6 27.7- growth rate (g/d) - to 5 weeks 266 255
- to weaning 252 244Mean performance to 5 years of age
Litter size 2.17 2.17Number weaned per ewe to ram 1.75 1.73Lamb performance
- weight at birth (kg) 4.3 4.2- weaning weight (kg) 30.8 30.7- growth rate (g/d) - to 5 weeks 280.4 280.2
- to weaning 272.2 272Total number of lambings to 5 years 2.9 2.8Number of lambs reared to 5 years 5.11 5.26Ewe barreness (%) 4.1 5.3
Effects of ewe genotype on animal performance The effects of genotype on ewe performance when lambing as 2-tooths and up to 5 years are presented in Table 5. The Charmoise x SBF ewes had a mean weaning rate (lambs weaned per ewe joined) of 1.12 lambs, which is similar to the national average of 1.2 lambs. At the other extreme the Belclare x SBF, Belclare and BelclareMG x SBF ewes achieved a weaning rate (regardless of dietary treatment) representative of the top 5%, 2.5% and <0.5%, respectively, of lowland ewe flocks nationally (Hanrahan, 2010).
The progeny from Belclare, Belclare x SBF and BelclareMG x SBF dams achieved daily live weight gains to weaning from grazed grass that were close to the target for the number of lambs reared per ewe. However, the progeny from the Charmoise x SBF performed poorly pre-weaning, their live weight gain being 33 g/day less than the mean of the progeny of the other breeds. Consequently, they were 3.7 kg lighter at weaning, but representative of the weaning weight achieved on many commercial farms.

24
National Sheep Conference 2014
Table 5. Effect of genotype on the performance of ewes lambing at 2 years and up to 5 years of age.Breed*
C x SBF Bel x SBF Belclare BelMG x SBF
Performance as 2 year oldsJoining - weight (kg) 48.2 56.6 65.3 57.2
- condition score 3.5 3.6 3.3 3.6Litter size 1.34 1.98 2.05 2.24Number weaned per ewe to ram 1.04 1.67 1.68 2.05Lamb performance
- weight at birth (kg) 3.7 4.2 4.3 3.9- weaning weight (kg) 25.1 28.3 30.0 28.5- growth rate to weaning (g/day) 216 249 264 254
Mean performance to 5 years of ageLitter size 1.45 2.10 2.25 2.56Number weaned per ewe to ram 1.12 1.71 1.78 2.06Lamb performance
- weight at birth (kg) 3.9 4.4 4.4 4.0- weaning weight (kg) 27.8 31.1 32.4 30.9- growth rate to weaning (g/day) 246 274 287 275
Total number of lambings to 5 years 2.6 2.7 3.3 3.9Number of lambs reared to 5 years 2.9 5.3 6.5 8.2
* C x SBF = Charmoise x Scottish Blackface; Bel x SBF =Belclare x SBF; BelMG x SBF = Belclare x SBF (BelMG = Belclare carrying major genes for ovulation)
Ewe genotype had a major effect on the number of lambs reared and, consequently, on the total weight of lamb weaned. For example, relative to the Charmoise x SBF, the Belclare x SBF, Belclare and BelclareMG x SBF genotypes increased the number of lambs weaned to 5 years by 83%, 221 and 283% respectively. Preliminary data indicate that the replacement rate for the Charmoise x SBF, Belclare x SBF, Belclare and BelclareMG x SBF genotypes were 23, 26, 26 and 23% respectively. The preliminary data from this study show that ewe prolificacy does have an impact on replacement rate but the effect is probably quite small given the fact that, to date, the replacement rate for the highly prolific BelclareMGx SBF ewes is identical to that for the Charmoise x SBF. Based on the information in Table 1 the replacement costs for ewes with similar prolificacy and productivity as the Charmoise x SBF, Belclare x SBF, Belclare and BelclareMG x SBF genotypes are equivalent to €0.83, €0.64, €0.56 and €0.48 per kilogram of lamb weaned during their lifetime. Another way to express the replacement cost is as per kilogram of lamb carcass produced. When expressing the cost per kilogram of lamb carcass it needs to be realised that the period of time for the lambs from the different ewe genotypes to achieve a given carcass weight differs, consequently, impacting on cost of production. The replacement costs for ewes with similar prolificacy and productivity as the Charmoise x SBF, Belclare x SBF, Belclare and BelclareMG x SBF genotypes are equivalent to €1.30, €0.96, €0.92 and €0.71 per kilogram of lamb carcass produced during their lifetime. Consequently, increasing weaning rate by 0.2 lambs per ewe joined with rams reduces replacement cost by the equivalent of 13 cents per kg lamb carcass. Even when fixed costs (land charge, building) are omitted replacement costs are still high equating to €0.86, €0.63, €0.61 and €0.47 per kg of lamb carcass produced during their lifetime for the Charmoise x SBF, Belclare x SBF, Belclare and Belclare x SBFMG genotypes respectively.
Effect of ewe age on ewe and subsequent lamb performanceThe effects of ewe age on prolificacy and lamb performance are presented in Table 6. As ewe age increased to 4 years prolificacy, number of lambs weaned and lamb performance, as determined by weaning weight, all increased and lamb mortality declined. Ewes that lambed as 5 year olds had the same lamb output as ewes

25
National Sheep Conference 2014
aged 4 years. Preliminary data (not presented) show that ewe prolificacy, or the performance of their lambs, did not decline when lambed as 6 year olds. Consequently, retaining older ewes in the flock (provided there are no reasons to cull) reduces replacement rate, and consequently, replacement cost, without any adverse effects on the weight of lamb weaned per ewe.
Table 6. Effect of ewe age on progeny performanceEwe age (years)
2 3 4 5Litter size 1.96 2.11 2.31 2.29Number weaned per ewe to ram 1.41 1.76 1.90 1.88Lamb performance
- weight at birth (kg) 3.8 4.1 4.4 4.8- weaning weight (kg) 27.7 30.9 32.3 32.1- growth rate (g/d) - to 5 weeks 253 279 296 294
- to weaning 247 276 286 279Total lamb mortality (%) 15.7 6.1 3.5 2.8
Reasons for cullingThe reason for culling, and the proportion of ewes culled is influenced by ewe age. The reasons for culling as influenced by ewe age are presented in Table 7. The percentage of ewes which died was similar for each ewe age group. Similarly, with the exception of the 3 year old ewes, the incidence of mastitis was similar regardless of age group. The proportion of ewes culled for mastitis was similar to the number of ewes which died. As ewes got older the percentage of ewes being culled for teeth (mouth), incidence of lameness and poor condition increased. The effects of ewe genotype and dietary treatment on culling will be assessed when all the ewes are culled which may take up to 3 more years.
Table 7. Age and reason at culling (% of ewes joined)
Age2 3 4 5 6 Average
No. joined 284 248 223 162 74Died 4.9 4.0 3.6 6.8 4.1 4.7Mastitis 6.0 1.6 6.3 4.3 5.4 4.7Condition 0 0.8 1.3 6.2 5.4Teeth 0 0.8 13.9 23.5 36.5Feet 0.7 0.8 0.4 3.1 4.0Other 1.8 1.2 0.4 1.2 0Other = Rupture or prolapse
Incidence of barrennessIncreasing the plane of nutrition offered during the first winter decreased the incidence of ewe barrenness by 41% (Table 3). In the current study ewes were not culled for barrenness. A total of 16% of the ewes in the study were barren at least once. On the basis of chance we would expect about 3% of ewes to be barren twice – the observed incidence was 3.5% and of the 10 such cases the second barren event was after a previous lambing that required major assistance in the case of 2 ewes. The evidence suggests that culling young ewes for barrenness increases replacement cost unnecessarily as the likelihood of being barren on a second occasion is low.
Effect of birth type and rearing type on lamb performanceBirth type influences lamb birth and weaning weights. However, the rearing type (i.e. number of lambs reared per ewe) also influences lamb performance. The effects of birth and rearing type on lamb weaning weight are

26
National Sheep Conference 2014
presented in Table 9. Rearing a twin born lamb as a single reduces the weight difference between single and twin born and reared lambs by 65% (3.9 kg). Triplet-born lambs reared as twins will be approximately 1 kg lighter than twin-born lambs reared as twins. Triplet-born and quad-born lambs which were reared as triplets using the management system employed in the current study were as heavy at weaning as twin-born lambs reared as twins. The data presented in Table 9 clearly illustrate the need to know the flock weaning rate when determining the target weaning weight of lambs for a given flock.
Table 8. Effect of birth type and rearing type on lamb performanceBirth type
Single Twin Triplet QuadRearing type 1 1 2 1 2 3 1 2 3Weaning weight (kg) 35.5 33.4 29.5 30.9 28.4 30.0 30.9 27.3 31.0
Conclusions
1. The results presented here are from an on-going study that is not due for completion until 2017.
2. Contrasting ewe genotypes and nutritional regimes were evaluated to determine if the effect of plane of nutrition during the rearing phase is influenced by ewe prolificacy.
3. Ewe replacements should be managed in their first winter to achieve a daily live weight gain of 40 to 50 g/day.
4. The plane of nutrition offered to replacements during their first winter has a lifetime impact on progeny weight at weaning – thus a high plane of nutrition during the first winter increases lamb weaning weight by 0.5 kg for all lambings up to 5 years of age.
5. Increasing the plane of nutrition offered during the first winter decreased the incidence of ewe barreness by 41%.
6. Plane of nutrition offered during the second summer to replacements had no effect on subsequent ewe prolificacy or the performance of their progeny.
7. Offering a high plane of nutrition during first pregnancy increased the weight of lambs weaned by 2-tooth ewes by 9% due to a combination of lower ewe mortality and barreness, and increased performance of progeny.
8. Ewe genotype, due to its impact on litter size and thus number of lambs reared, is the main factor influencing the cost of replacements.
9. Lambs born and reared as triplets with appropriate management were as heavy as lambs born and reared as twins.
10. Based on this study to date, and regardless of ewe genotype, replacements should be
a. Managed during their first winter to gain 40 to 50 g daily.
b. Managed during their second summer to gain approximately 90 g daily
c. Offered a high plane of nutrition during their first pregnancy.
11. Final recommendations from this study will not be available until 2017 by which time all ewes are expected to have been culled.
ReferencesHanrahan J.P. (2009). Genetic and non-genetic factors affecting lamb growth and carcass quality. End of Project Report: Sheep Series No 23, pp1-21Hanrahan J.P. (2010). Technical efficiency in the sheep industry – opportunities and potential. Journal of Irish Grassland Association 44: 65-80.Keady T.W.J. (2010). Finishing lambs from grazed pasture – The options and the facts. Journal of Irish Grassland Association 44: 81-92.Keady T.W.J. and Hanrahan J.P. (2006). Efficient sheep production in a subsidy free environment –research from Athenry. Journal of Irish Grassland Association 40: 15- 27.Keady T.W.J. and Hanrahan J.P. (2007). Extended grazing – its potential and limitations. Journal of Irish Grassland Association 41: 81-96.National farm Survey (2012). Sheep enterprise – mid season lamb. Rural Economy and Development, Teagasc, Athenry, Co Galway.

27
National Sheep Conference 2014

28
National Sheep Conference 201429/01/2014
1
FUTURE OF SHEEP BREEDING: A NEW ZEALAND PERSPECTIVE
IRISH NATIONAL SHEEP CONFERENCES: FEB 2014
JOHN MCEWAN, KEN DODDS, SHANNON CLARKE, BENOIT AUVRAY, MICHAEL LEE, TRICIA JOHNSON, SIN PHUA, RUDI BRAUNING, NATALIE
PICKERING
ANIMAL GENOMICS TEAMANIMAL PRODUCTIVITYINVERMAYNEW ZEALAND
Overview• Genomic selection
• Try to describe what has happened in NZ sheep breeding last 20 years and why
• Based on this history what I expect will be near future developments in NZ
• I cannot cover all aspects and some technical aspects may assume a lot of background: please interrupt if you need more description and ask
• Lessons for UK sheep industry? o There may be some but these are probably more obvious to the
audience than myselfo Happy to explore via questions
What is genomic selection?
• A broad church…..
• To some … includes selection for a mutation in selection index (scrapieor MyoMax …)o DNA sample, test, include DNA results in index
o Have to transparently account for non genotyped animals
– Infer genotype probabilities &/or create unknown class
o Actually better described as marker assisted selection
• Linkage disequilibrium … tendency variants physically close together inherited as a unit.
• Use dense markers: track inheritance many generations ago
• Assumptionso Much genetic variation derived from 10‐100 loci
o Effects additive
Genomic selection: linkage disequilibrium
• Linkage disequilibrium … tendency variants physically close together inherited as a unit.
• Use dense markers: track inheritance many generations ago
• Assumptionso Much genetic variation derived from 10‐100 loci
o Effects additive
Genomic selection: linkage disequilibrium
My next tractor’s going to be a hybrid
Genomic selection: mendelian sampling
• 2 full sibs may inherit quite different grandparental segments
• Based on inheritance each should share half their DNA
• However there is significant variation around this mean ~50% of the genetic variation in offspring is due to Mendelian sampling

29
National Sheep Conference 201429/01/2014
2
Genomic selection: mendelian sampling
• 2 full sibs may inherit quite different grandparental segments
• Based on inheritance each should share half their DNA
• However there is significant variation around this mean ~50% of the genetic variation in offspring is due to Mendelian sampling
mother father sib 1 sib 2mother 1father 0 1sib 1 0.5 0.5 1sib 2 0.5 0.5 0.5 1
Called GBLUP
• Pedigree relationship matrix replaced by genomic relationship
• Based on shared DNA variants from SNP chip genotyping
• Most commonly used
• Some problems with different scaleso Density of markerso Identity by descent vs by stateo Identifies problems traditional (phenotype only) evaluations
– Preferential feeding dams, wrong genetic groups
• Assumes infinite large number of loci, and infinitely small, additive effects….. Yeah right
• Can add marker assisted selection on top
• Active development: maths & understanding genome architecture
Called GBLUP
• Pedigree relationship matrix replaced by genomic relationship
• Based on shared DNA variants from SNP chip genotyping
• Most commonly used
• Some problems with different scaleso Density of markerso Identity by descent vs by stateo Identifies problems traditional evaluations
– Preferential feeding dams, wrong genetic groups
• Assumes infinite number of loci, infinitely small, additive effects….. Yeah right
• Can add marker assisted selection on top
• Active development: maths & understanding genome architectureIts life BLUP Jim but not as we know it
ANIMAL GENOMICS
~ 28 staff
~15 work on sheep
~12 Genomnz (separate)
Balance GHG, cattle, deer
MANAGE SIL
NZ sheep and deer improvement system
12 million records
343,000 new animals/year
Linked to genotype database 800K samples100K new samples year
Linked to sequence databases

30
National Sheep Conference 2014
29/01/2014
3
GENOMNZ
Commercial genotyping
Many species
SheepDeerCattleAlpacasGoatsHorsesAbaloneSalmon x2OystersMusselsKingFishPrawnsGroperAtlantic Cod….
BIOINFORMATICS
3x 48 core servers 512Gb RAM
102 processors in compute cluster
Storage 50TB fitted additional on order
26 statistics and bioinformatics staff
2 Computer /db staff
Productivity comparison
1990‐91 2006‐07Lambing Percentage (ewe) 101.6 117.9 (122% usual)Hogget lambs as % all lambs ‐ 3.5Average Lamb Wt (kg) 14.35 16.90 +17%Lamb sold Kg/Ewe 9.76 16.83 +72%Wool kg/head 5.28 5.60 +6%Average Steer Wt (kg) 297 320 +8%Milksolids per cow (kg) 260 325 +25%
Source M&WNZ
GENETIC PROGRESS: PERIOD & FLOCK TYPE year $ Terminal $ Dual
1990-94 0.37 0.251995-1998 0.34 0.291999-2003 0.61 0.592003-2006 0.83 0.92
SILCPT/ACE
Nimmo Bell : return on levy SIL 16.3CPT ACE 18.4
Potential existing technology ~$1.40/yr but we can do better…. ~$2.00/yr

31
National Sheep Conference 201429/01/2014
4
2007• ISGC sheep sequencing project (3x coverage) and SNP identification
2008/09• Developed Illumina Ovine 50K SNP chip
2010/11
• Developed Illumina Ovine 5K SNP chip: impute 50K• Parentage Plus 100 SNP Sequenom assay developed
2011/12
• Re‐Sequenced 75 + 100 sheep genomes (LOF, nsSNP)• 1000 animals Genotyping‐by‐sequencing
2012/13• Created a 700K high‐density SNP chip• Created 5K MooBaa Chip
OVERVIEW~3x
coverage(9.7 Gbp), 454 FLX
2007 SHEEP SEQUENCING PROJECT
SNP CHIP DEVELOPMENT
600,000 putative SNPs454
59,454 SNPs
RudigerBrauningAgResearch
Jan 2009
STEPS TO WHOLE GENOME SELECTION IN NZ
1. Sequence & ID SNPs (ISGC)2. Create SNP chip (ISGC)3. Collect DNA
• from measured animals (progeny tested sires)• Genotype
4. Create “SNP product”• Estimate coefficients• Validate
5. Use to estimate GBVs (genomic breeding values)• GBV =a*EBV +b*MBV
6. Develop low density chip• 2 stage selection• 5K chip and parentage plus• imputation
3X coverage 6 sheepDec 2007
Create and validate 60K SNP chipAug 2008
S50K SNP Product2010
ValidateOct 2009
Genotype first resourcesDec 2008
S50K SNP Product (all major traits)2012
5K SNP Product (all major traits)2012/13
PHENOTYPING STRATEGY: LINKED FLOCKS AND BREEDS
“Hub”Ovita PT, CPT & Ind
progeny testsProgeny 6500/yrSires 210/yr
Industry siresWormFEC, LS, Ewe Eff, Flystrike, FE Industry
flocks ~500‐1000 sires/yr
Industry sires standard S50K ~500 sires/yr
• commenced genotyping high accuracy dams well recorded for a wide variety of traits
TRAITS
Top traits :• A (SIL standard)
– NLB and twinning– Lamb survival (maternal + direct)– Weaning weight (maternal + direct)– Carcass– Wool weight
• B (Industry sires)– Adult live weight – Parasites– Meat yield – Dags/flystrike/breech score– FE – Longevity– Fibre diameter
• C (Hub)– Feed efficiency– GHG– Meat quality– pneumonia
16,027 unique animals genotyped with 50K chips
~4700 animals genotyped with 5k chips
~3000 50K, 3000 5K, 7600 Parentage Plus 2011/12 year

32
National Sheep Conference 201429/01/2014
5
ANIMALS GENOTYPED BY SEX AND YEARNP7 Genomic Selection Analysis
3,427,213 animals born between 1990 and 2010 from 230 SIL flocks
Figure 1. Principal Component plot for the QC samples
O Romney Coopworth Perendale TexelX Other
GENOMIC SELECTION – QUALITY CONTROL
• Controls• Duplicates• Call Rates• Gender• Parentage• Genome plots• Hardy‐Weinberg• Molecular v Pedigree F• Breed check/predict
GWS – Accuracy of Predictions
• Accuracyo a measure of how useful Molecular BVs (MBVs) will beo used to find weights for blending MBVs and EBVso uses corr(MBV, Phenotype)o estimated in validation animals
Training Set (T)Develop Prediction
Equation
Validation Set (V)Apply equation,Correlate result with Phenotype

33
National Sheep Conference 201429/01/2014
6
GWS – NZ SHEEP – TRAINING & VALIDATION
YearBorn
Comp‐osite
Romney Coopworth Perendale Texel
Past
VT
Vcm VR VP
Recent VC
• Validation:• n~200/breed or ~½ breed resource
T r a i n i n g
RESULTS ‐ ROMNEY
ACCURACY VS THEORETICAL VALUES GWS‐DATA FLOW
Animal
Pedigree, traits EBVs, accuracies
DNA sample, Genotypes MBVs, accuracies
Genetic params
SNP Coeffs
Blend GBV
• Was within flock and year• Now across breeds• Individual accuracies
SUMMARY
GS mBVs most traitsObjective trait =YComposites most traits>30% R+C+PTexels not yetSome traits ↓Δ breed boundariesSome breed/traits struggle Longevity, meat qual....
Accuracy Trait Index R C P T CompAll
NLB Y 0.52 0.43 0.33 0.15 0.40
WWT Y 0.47 0.51 0.28# 0.27 0.49
LW8 0.50 0.52 0.32 0.29 0.49
LW12 0.46 0.51 0.32 0.22 0.45
EWT Y 0.48 0.45 0.22 0.19 0.39
CWT Y 0.48 0.49 0.29# 0.26 0.46
WWTM Y 0.34 0.34 0.35 0.19 0.43
FEC1 Y 0.46 0.63 0.31 0.12 0.57
FEC2 Y 0.49 0.47 0.29# 0.16 0.45
AFEC Y 0.31 0.33 0.25 0.11 0.31
FW12 Y 0.50 0.60 0.35 0.15 0.46
LFW Y 0.29 0.31 0.25# 0.05 0.21
EFW Y 0.32 0.18# 0.31 0.02 0.32
FD 0.44 0.49 0.32 0.11 0.38
EMA 0.36 0.46 0.36 0.19 0.46
FAT 0.39 0.31 0.21# 0.16 0.34
FATY Y 0.46 0.37 0.25# 0.21 0.34
EMAC 0.39 0.44 0.39 0.16 0.37
SHLY Y 0.28 0.21# 0.24# 0.11 0.46
LNLY Y 0.33 0.24 0.18# 0.08 0.42
HQLY Y 0.28 0.27 0.19# 0.12 0.41
LEAN 0.21# 0.22# 0.23# 0.20 0.42
LEANY 0.30 0.24 0.22# 0.09 0.41
LDAG Y 0.41 0.55 0.03 0.42
ADAG Y 0.47 0.44 0.14 0.34
SUR Y 0.16 0.20 0.43 0.09 0.31
SURM Y 0.48 0.38 0.34 0.02 0.47
GGT21 Y 0.38 0.19
Expected Usage in Industry
Ovine Ovine SNP50K
• Sires and key ancestors are genotyped at 50K density
Selection Selection Stage 1
• Initial ram lamb screening is based on breeding values estimated from parental information (eBVs)
Selection Selection Stage 2
• 10‐30% of the highest ranking individuals are genotyped at 5K density
Imputation• 50K results are imputed from the 5K genotypes
Estimate Estimate mBVs
• mBVs are calculated from the 50K prediction equations
Blending• mBVs and eBVs are combined to create gBVs

34
National Sheep Conference 201429/01/2014
7
MAF
SNP Spacing
• developed to provide a lower cost and higher throughput format to encourage industry uptake.
•5998 SNPs selected• equally spaced, • Most Parentage panel SNPs (n~80)• N based on simulation for WGS
•5409 manifest SNPs• 5376 SNPs call rate > 98%• 5326 MAF > 0.1 New Zealand breeds• Genotype concordance 99.988%
•Imputation (5k to 50k)• Validation• impute with 86.3, 91.4 and 95.2% accuracy for
P, R, C no parent genotyped 50K chip• increased 89.2, 94.6 and 95.9% sire genotyped.
2012/13 5K Beta test – Extra SNPS
• 2012 3 extra SNPs added to 5K SNP & used Cattle LD chip—GDF8 – MyoMAX®— BCO2 – One yellow fat marker—GDF9 – Linked to increased fertility
0 1 2 % 0 % 1 % 2
MyoMAX 4655 1162 603 72.5 18.1 9.4
Yellow Fat 6366 52 2 99.1 0.81 0.03
GDF9 6352 66 2 98.9 1.03 0.03
Number of animals carrying 0,1 or 2 copies of extra SNPs on the MooBaa 5K SNP chip
2012/13 5K Beta test – Extra SNPS
• 2012 3 extra SNPs added to the 5K SNP & used Cattle LD—GDF8 – MyoMAX®— BCO2 – One yellow fat marker—GDF9 – Linked to increased fertility
0 1 2 % 0 % 1 % 2
MyoMAX 4655 1162 603 72.5 18.1 9.4
Yellow Fat 6366 52 2 99.1 0.81 0.03
GDF9 6352 66 2 98.9 1.03 0.03
Number of animals carrying 0,1 or 2 copies of extra SNPs on the MooBaa 5K SNP chip
Industry ImpactRomney
Trait 50Kchip 5Kchip eq progNLB 0.522 0.496 13WWT 0.47 0.447 6LW8 0.497 0.472 3LW12 0.462 0.439 2EWT 0.476 0.452 2CWT 0.476 0.452 3WWTM 0.341 0.324 4FEC1 0.457 0.434 6FEC2 0.485 0.461 5AFEC 0.308 0.293 1FW12 0.495 0.470 3LFW 0.289 0.275 2EFW 0.315 0.299 1
Trait 50Kchip 5Kchip eq progFD 0.435 0.413 3EMA 0.355 0.337 2FAT 0.394 0.374 2FATY 0.459 0.436 2EMAC 0.391 0.371 2SHLY 0.282 0.268 1LNLY 0.331 0.314 1HQLY 0.277 0.263 1LEAN 0.208 0.198 1LEANY 0.303 0.288 1LDAG 0.409 0.389 2ADAG 0.467 0.444 3SUR 0.163 0.155 10SURM 0.475 0.451 127GGT21 0.381 0.362 1
Scenario SD index ($) acc i/L ΔG ($) IncreaseCurrentA 2.43 0.33 0.78 1.89B 2.17 0.29 0.56 1.20C 2.16 0.29 0.67 1.45
SNP chipAs 4.05 0.55 0.78 3.15 67%Bs 3.39 0.46 0.56 1.88 56%Cs 3.39 0.46 0.67 2.27 57%
A As B Bs C Cs
Tissue Sampler
Barcode Number = EID Tag number
Applicator
mBV + eBV = gBV gBV Report sent to breeder for
selection decisions
From tissue sample to breeding values
Trait prediction equations
1
2
3
mBV= molecular breeding value; eBV= estimated (phenotypic) breeding value; gBV=genomic breeding value
DNAEar punch SNP chip

35
National Sheep Conference 201429/01/2014
8
Industry Impact
~26% NZ rams sold are from breeders beta testing 5K last year
This year ~32%~70 breeders and ~100 flocks~15% of ram lambs~10,000 with 5K
Genotyping sires as well now with 700K HD chip394 SIL registered flocks:165 flocks have 10 or more animals: 13,775 animals101 flocks have 30 or more animals: 12,673 animals
SUMMARY NZ• Genomic selection available
• Across closely related breeds and crosses
• Adding more traits (as phenotypes become available)
• Blend MBVs with existing EBVs (Harris and Johnson)
• Use 2 stage selection with low density 5K chip plus imputation
• Large scale beta test completed (>70 breeders)
• Developed ~100 parentage plus SNP panel (3500 prog 120 sires)
• Investigating GBS and full scale sequencing
Summary I
• To look to the future you first need to look to the past
• Major gains in productivity: much from genetics
• Key developments were:o 1990‐2005
– Across flock and breed animal model BLUP (SIL) 1999 ~90% industry– Sire referencing and AI (1988) ~70% industry– Central progeny testing (2002) ~70% industry– DNA parentage & preg scanning (scalability: 2002) ~30% industry
» Ram multiplier flocks– New breeds and composites and cross breeding in recorded flocks ~40%
industry (greatly expanded ~2002, 1st Lamb Supreme ~1990)
o Set the scene for next wave of genomics– Very difficult to see how genomic selection can be undertaken at a
national levelwithout this infrastructure– New Zealand, Australia, France, Ireland, ….. UK?
Summary II
• Initial wave of major gene testso LoinMax, Myomax, iScan, WormStar, Inverdale…..
• Now genomic selection with GBLUPo 22 traits but most benefit in sex linked traits measured late in life
and expensive/slaughter traitso Gains are significant 30‐70%o higher if generation interval reducedo Can add new traits (longevity, adult liveweight, disease, meat
quality) previously not included or poorly recordedo Currently ∆G ~50% of potential so possibility of ~3X increase
• Major genes “cream on cake” can be added and ~ nil costo Use existing genomic selection infrastructure
Summary III
• The future…. (my view next 5 years for NZ)o The greatest opportunity is to get cost of LD SNP chips or equivalent to
cost of parentage ~NZ$25 (adoption)
o The next is to review selection indices and BVs (direction)– GxE– New traits– Whole supply chain indices
o Alter generation length, industry structure (∆G, adoption)– JIVET, multiplier flocks– Data capture in plant and on commercial farm (EID, scales)– Meat quality, disease, ram contribution
o New integrated genetic/genomic evaluation (∆G, accuracy)….
o On the way past: recessive mutations, improved pedigrees, major gene introgression (infrastructure benefits)
• National system has lower costs but …..
New Zealand research supported by
Acknowledgements
• Animal genomics: Ken Dodds, Benoit Auvray, Michael Lee, Tricia Johnson, Julie Everett‐Hincks, Sin Phua, Rudi Brauning, SM Hickey, EA Young, Natalie Pickering and Shannon Clarke
• especially J Kijas, B Dalrymple, M Heaton, K Worley
• Many NZ ram breeders
• Funders see list below….

36
National Sheep Conference 201430/01/2014
1
Common health issues around lambing time.
Professor Neil SargisonUniversity of Edinburgh
Royal (Dick) School of Veterinary Studies
TEAGASC, Athlone and Letterkenny, 4th and 5th February 2013.
For your lambing ewe sheep flock producing finished or store lambs:
• What are the main determinants of profitability?– Subsidy management?– The number of lambs sold?– Lamb growth rates?– Cost of maintenance of the breeding flock?
– Other?
For your lambing ewe sheep flock producing finished or store lambs:
• What are the “key performance indicators”?– Subsidy income?– The lambing percentage?– Lamb liveweight gain?– Ewe body condition score?– Ewe mortality?– Lamb mortality?– Other?
Factors contributing to lamb growth.
Lamb nutritional management.Infectious diseases.Nutritional and disease management of pregnant ewes.
“Catastrophic” consequences for ewes of poor nutritional
management.• Grain overload.• Hypocalcaemia.• Vaginal prolapse.• Pregnancy toxaemia.• Listeriosis.• Mastitis.• (Kangaroo gait.)• (Hypomagnesaemia.)
Focus on prevention.
Management of individual cases.
• Rapid increases in the level of concentrate feeding– rumen fermentation rather than
digestion.– lactic acid production
• acidosis and endotoxic shock.– reduced rumen pH
• kills normal flora.– water drawn from circulation to
rumen• dehydration.
Grain overload.

37
National Sheep Conference 201430/01/2014
2
• Clinical signs– mild colic and tooth grinding.– staggering gait.– apparent blindness.– scour.– stupor. – collapse.– laminitis during recovery.
• Postmortem findings– partially digested grain in the ruminoreticulum.
– rumenitis.– low rumen pH in freshly dead animals.
– dehydration and congestion.
– fatty liver changes.
Hypocalcaemia.• Very common.• Occurs from 6 weeks before lambing.• Ewes respond to treatment.
Weakness and excitement – recumbency with the chin resting on the ground – dilated pupils and apparent blindness – constipation and slight bloat – coma and death in 24 hours.
Differential diagnosis – rhododendron poisoning.
Hypocalcaemia.• Ewes are unable to absorb
sufficient calcium from the diet for the requirements of pregnancy and colostrum accumulation in the udder.
• Dependence on skeletal reserves.
• Clinical disease when absorption and resorptionare insufficient– stressful husbandry, transport
or weather.– older ewes with depleted
skeletal reserves following previous pregnancies and lactations.
– cereal based diets low in calcium.
Vaginal prolapse.• An flock incidence of 1% is normal.
• Inflammation, swelling, trauma, infection and urinary retention lead to death.
Complications.• Evisceration through a vaginal tear
– fat ewes.• Lambing
– requires Caesarian or euthanasia.• Rectal prolapse.

38
National Sheep Conference 201430/01/2014
3
Risk factors.• Multiple foetuses.• Bulky feed.• Excessive body condition.• High fibre diets?• Rumen acidosis?• Lack of exercise?• Subclinical hypocalcaemia?• Steep slopes?• Short docked tails?
Pragmatic advice about prevention.
Importance of ewe nutritional management.
Management.• Plastic spoons?• Harnesses.• Surgery
– safety pins. X– mattress suture . X– purse‐string suture.
• Euthanasia.
Surgical management of vaginal prolapse.
• Provide satisfactory pain relief and prevent straining.
• Clean the prolapsed tissue.• Replace the prolapse carefully and
completely.• Suture the vulval lips to prevent
recurrence.• Control inflammation.• Removal of sutures.
Pregnancy toxaemia.• Common disease of undernourished, stressed ewes carrying
multiple foetuses.• Failure to adapt to increasing metabolic demands of late
pregnancy.
Depression, apparent blindness, salivation and fine muscle tremours.
Confirmation on the basis of elevated β‐OHB concentrations.
Thin ewes Fat ewes
Treatment of ovine pregnancy toxaemia is often uneconomic and
unsuccessful.• Raise circulatory and CSF
glucose concentrations– oral glycerol, glucose,
propylene glycol, or concentrated calf rehydration solutions.
– injections of B vitamins, corticosteroids or insulin.
• Induce parturition– 16 mg dexamethasone.– Caesarian section.
• Humane destruction.
The occurrence of pregnancy toxaemia usually indicates an urgent need to increase the energy nutrition of the rest of the flock.
• Increase concentrate feeding– risk of acidosis.
• Improve forage quality.
• Treacle.

39
National Sheep Conference 201430/01/2014
4
The occurrence of pregnancy toxaemia usually indicates an urgent need to increase the energy nutrition of the rest of the flock.
• Increase concentrate feeding– risk of acidosis.
• Improve forage quality.
• Treacle.
The poor treatment response in individual cases underpins
the need for preventive management – monitoring the nutrition of pregnant ewes.
.
Listeriosis.
• Common disease of silage fed ewes.
• Microabscessationof the brainstem.
• Listeria monocytogenes– Effects of air and pH.
– Effects of air and pH!
Kangaroo gait.• Seen in inadequately‐fed ewes suckling large twins or triplets.
• Most affected animals recover when their lambs are weaned.
• Cause unknown?
Difficulty placing forelimbs, move with shortened strides with pelvic limbs drawn under the body.
Differential diagnoses.– Thoracic spinal abscessation.– Bilateral forefoot lameness.– Elbow arthritis.

40
National Sheep Conference 201430/01/2014
5
Mastitis.
• Staphylococcus aureus.• Manheimia haemolytica.• (Escherichia coli.)
Acute mastitis.
• Caused by:– inadequate milk supply.– cold exposure?– orf?
Acute mastitis.
• Treatment– macrolide antibiotics and anti‐inflammatory drugs. – humane destruction.
Acute mastitis.
• Prevention– correct ewe nutrition to ensure adequate milk supply.– dry ewe mastitis tubes/macrolide antibiotic injections.
“Catastrophic” consequences for ewes of poor nutritional
management.
Focus on prevention..
“Catastrophic” consequences for ewes of poor nutritional
management.
Correct nutritional and disease management throughout the ewe’s production cycle..
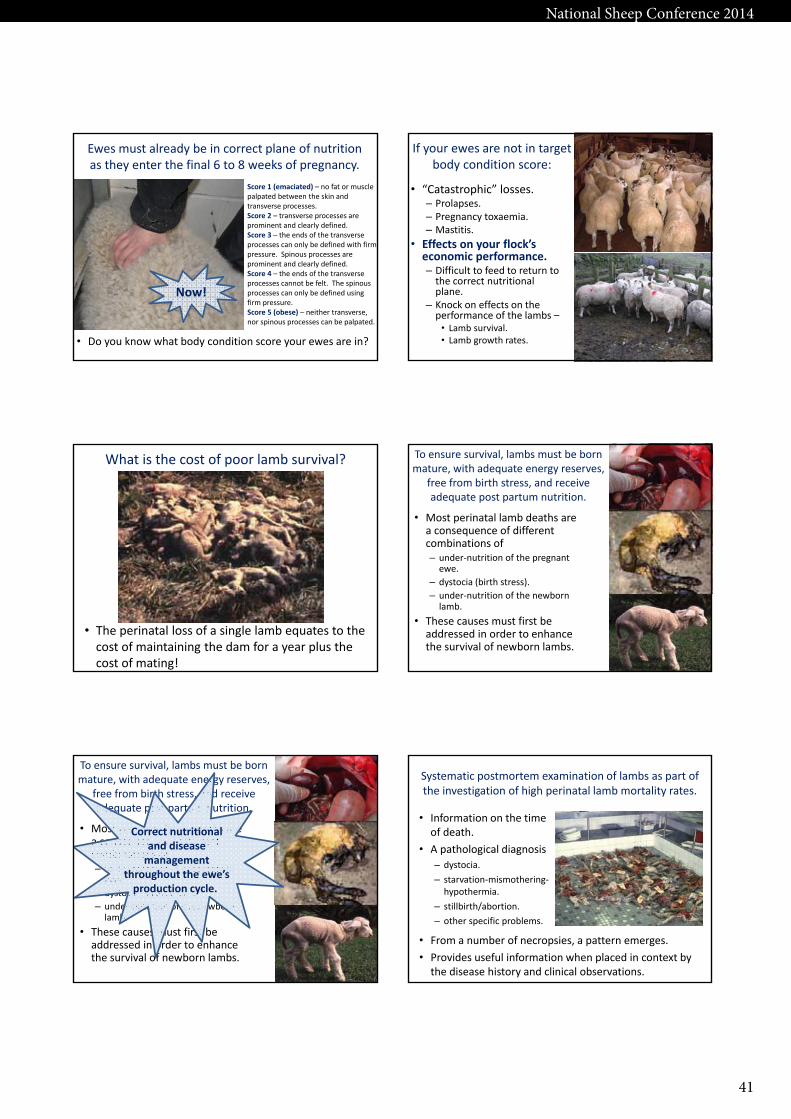
41
National Sheep Conference 201430/01/2014
6
Ewes must already be in correct plane of nutrition as they enter the final 6 to 8 weeks of pregnancy.
• Do you know what body condition score your ewes are in?
Now!.
Score 1 (emaciated) – no fat or muscle palpated between the skin and transverse processes.Score 2 – transverse processes are prominent and clearly defined.Score 3 – the ends of the transverse processes can only be defined with firm pressure. Spinous processes are prominent and clearly defined. Score 4 – the ends of the transverse processes cannot be felt. The spinousprocesses can only be defined using firm pressure.Score 5 (obese) – neither transverse, nor spinous processes can be palpated.
If your ewes are not in target body condition score:
• “Catastrophic” losses.– Prolapses.– Pregnancy toxaemia.– Mastitis.
• Effects on your flock’s economic performance.– Difficult to feed to return to the correct nutritional plane.
– Knock on effects on the performance of the lambs –
• Lamb survival.• Lamb growth rates.
What is the cost of poor lamb survival?
• The perinatal loss of a single lamb equates to the cost of maintaining the dam for a year plus the cost of mating!
• Most perinatal lamb deaths are a consequence of different combinations of – under‐nutrition of the pregnant ewe.
– dystocia (birth stress). – under‐nutrition of the newbornlamb.
• These causes must first be addressed in order to enhance the survival of newborn lambs.
To ensure survival, lambs must be born mature, with adequate energy reserves,
free from birth stress, and receive adequate post partum nutrition.
Correct nutritional and disease management
throughout the ewe’s production cycle..
Systematic postmortem examination of lambs as part of the investigation of high perinatal lamb mortality rates.
• Information on the time of death.
• A pathological diagnosis– dystocia.– starvation‐mismothering‐hypothermia.
– stillbirth/abortion.– other specific problems.
• From a number of necropsies, a pattern emerges.• Provides useful information when placed in context by the disease history and clinical observations.

42
National Sheep Conference 201430/01/2014
7
What are the constraints to lamb survival and
growth rates?• Long term nutritional management of the ewe throughout the production cycle.
• Disease management of the pregnant ewe.– What are the main infectious disease threats to your ewes?
– Do you have a health plan for their management?
Timely investigation of poor ewe body condition.
• Poor nutrition.• Tooth problems.• Respiratory disease.• Selenium deficiency.• Fasciolosis.
• Johnes disease.• Jaagsiekte (OPA).• Abscesses.• Maedi.• Tumours.• etc …….
Several animals affected within cohorts. Individual animals affected.
• Haemonchosis.• Lameness• Sheep scab.• Tick‐borne diseases.• etc….
Treat or cull?
Treat and/or control.
• Blood samples were collected on 10th March 2011 from twin and triplet bearing ewes in a flock of 300 Mule ewes due to start lambing on 1st April, to determine the adequacy of their nutrition.
• The ewes were scanned and keel marked, but only single bearing ewes were managed separately.
–monitoring of energy nutrition.
Singles
Twins and triplets
• The twin and triplet bearing ewes had been fed one loader bucket of clamp silage every second day, 0.6 kg /head/day of an 18% CP compound ration (in a single feed), and ad-lib high energy feed blocks.
If the ewes are in good BCS, metabolism of 100 g of bodyweight/day removes the need for 2MJ ME.
The ration ought to meet the ewe’s energy requirements, but is a bit low in protein.
BCS 1.5 – 2.5
≈ 0.5 kg compound ration!
How did this problem arise?
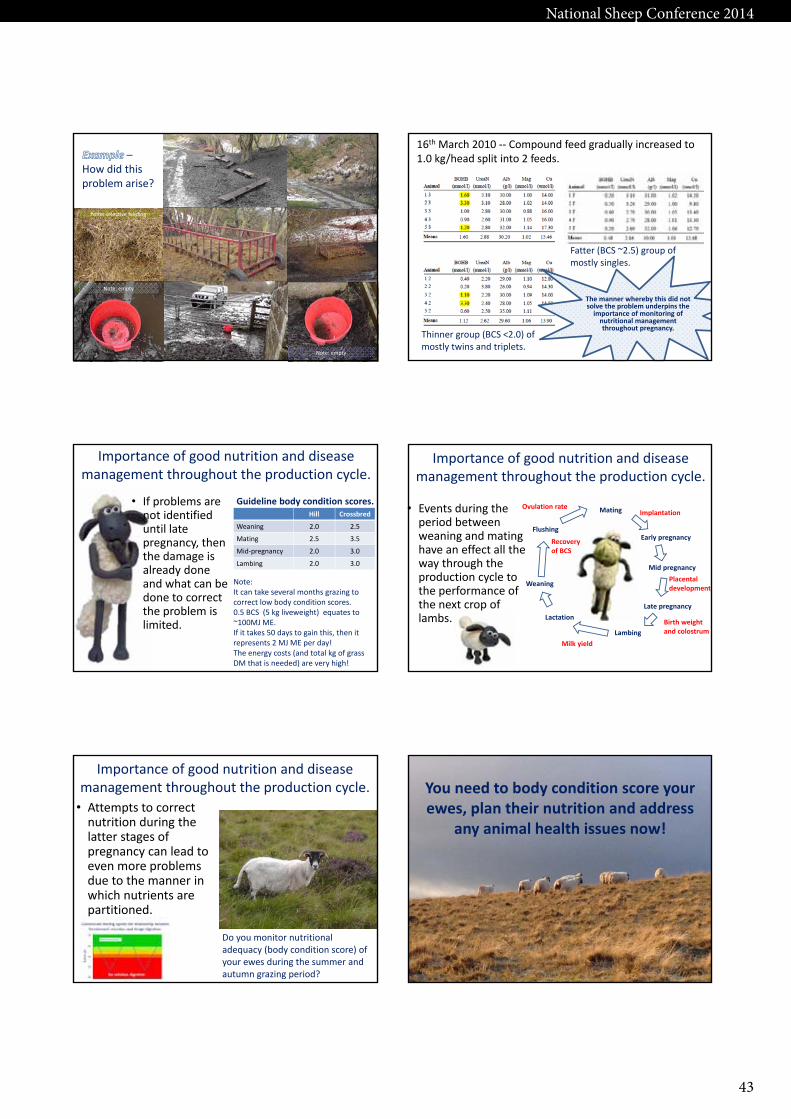
43
National Sheep Conference 201430/01/2014
8
–How did this problem arise?
Note: selective feeding
Note: empty
Note: empty
16th March 2010 ‐‐ Compound feed gradually increased to 1.0 kg/head split into 2 feeds.
Fatter (BCS ~2.5) group of mostly singles.
Thinner group (BCS <2.0) of mostly twins and triplets.
The manner whereby this did not solve the problem underpins the importance of monitoring of nutritional management throughout pregnancy.
Importance of good nutrition and disease management throughout the production cycle.
• If problems are not identified until late pregnancy, then the damage is already done and what can be done to correct the problem is limited.
Hill Crossbred
Weaning 2.0 2.5
Mating 2.5 3.5
Mid‐pregnancy 2.0 3.0
Lambing 2.0 3.0
Guideline body condition scores.
Note: It can take several months grazing to correct low body condition scores.0.5 BCS (5 kg liveweight) equates to ~100MJ ME. If it takes 50 days to gain this, then it represents 2 MJ ME per day!The energy costs (and total kg of grass DM that is needed) are very high!
Importance of good nutrition and disease management throughout the production cycle.
• Events during the period between weaning and mating have an effect all the way through the production cycle to the performance of the next crop of lambs.
Mating
Late pregnancy
Mid pregnancy
Early pregnancy
Lambing
Lactation
Weaning
Flushing
Implantation
Placental development
Birth weight and colostrum
Milk yield
Recovery of BCS
Ovulation rate
Importance of good nutrition and disease management throughout the production cycle.
• Attempts to correct nutrition during the latter stages of pregnancy can lead to even more problems due to the manner in which nutrients are partitioned.
Do you monitor nutritional adequacy (body condition score) of your ewes during the summer and autumn grazing period?
You need to body condition score your ewes, plan their nutrition and address
any animal health issues now!