NATIONAL POLL OF KYRGYZSTAN
56
NATIONAL POLL OF KYRGYZSTAN September 11 – September 26, 2021
Transcript of NATIONAL POLL OF KYRGYZSTAN
NATIONAL POLL OF
KYRGYZSTAN
September 11 – September 26, 2021
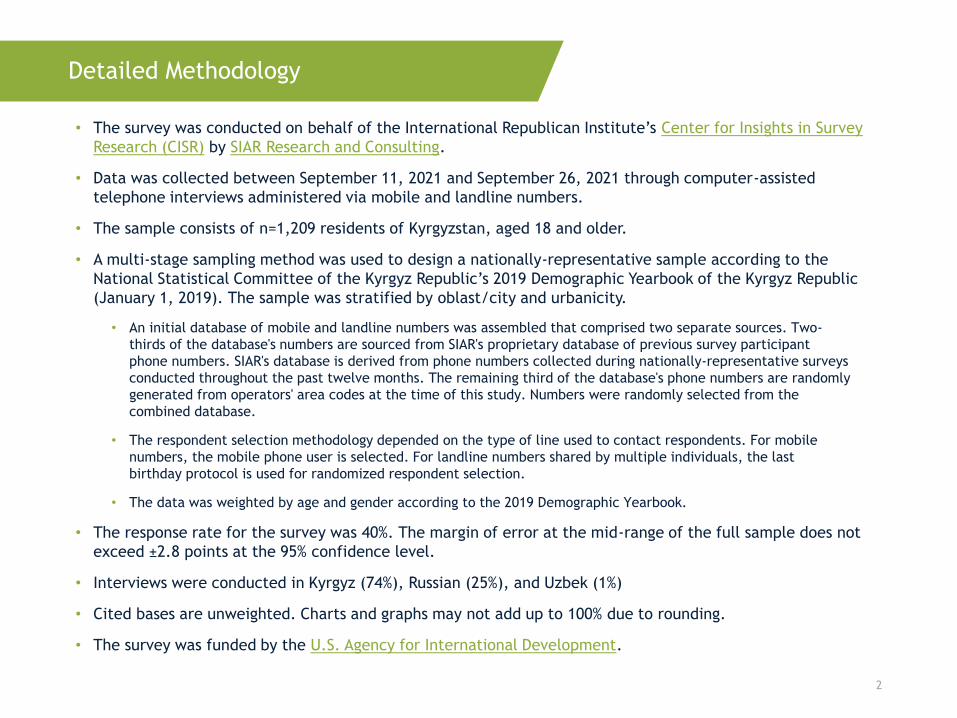
• The survey was conducted on behalf of the International Republican Institute’s Center for Insights in Survey
Research (CISR) by SIAR Research and Consulting.
• Data was collected between September 11, 2021 and September 26, 2021 through computer-assisted
telephone interviews administered via mobile and landline numbers.
• The sample consists of n=1,209 residents of Kyrgyzstan, aged 18 and older.
• A multi-stage sampling method was used to design a nationally-representative sample according to the
National Statistical Committee of the Kyrgyz Republic’s 2019 Demographic Yearbook of the Kyrgyz Republic
(January 1, 2019). The sample was stratified by oblast/city and urbanicity.
• An initial database of mobile and landline numbers was assembled that comprised two separate sources. Two-
thirds of the database's numbers are sourced from SIAR's proprietary database of previous survey participant
phone numbers. SIAR's database is derived from phone numbers collected during nationally-representative surveys
conducted throughout the past twelve months. The remaining third of the database's phone numbers are randomly
generated from operators' area codes at the time of this study. Numbers were randomly selected from the
combined database.
• The respondent selection methodology depended on the type of line used to contact respondents. For mobile
numbers, the mobile phone user is selected. For landline numbers shared by multiple individuals, the last
birthday protocol is used for randomized respondent selection.
• The data was weighted by age and gender according to the 2019 Demographic Yearbook.
• The response rate for the survey was 40%. The margin of error at the mid-range of the full sample does not
exceed ±2.8 points at the 95% confidence level.
• Interviews were conducted in Kyrgyz (74%), Russian (25%), and Uzbek (1%)
• Cited bases are unweighted. Charts and graphs may not add up to 100% due to rounding.
• The survey was funded by the U.S. Agency for International Development.
2
Detailed Methodology
3
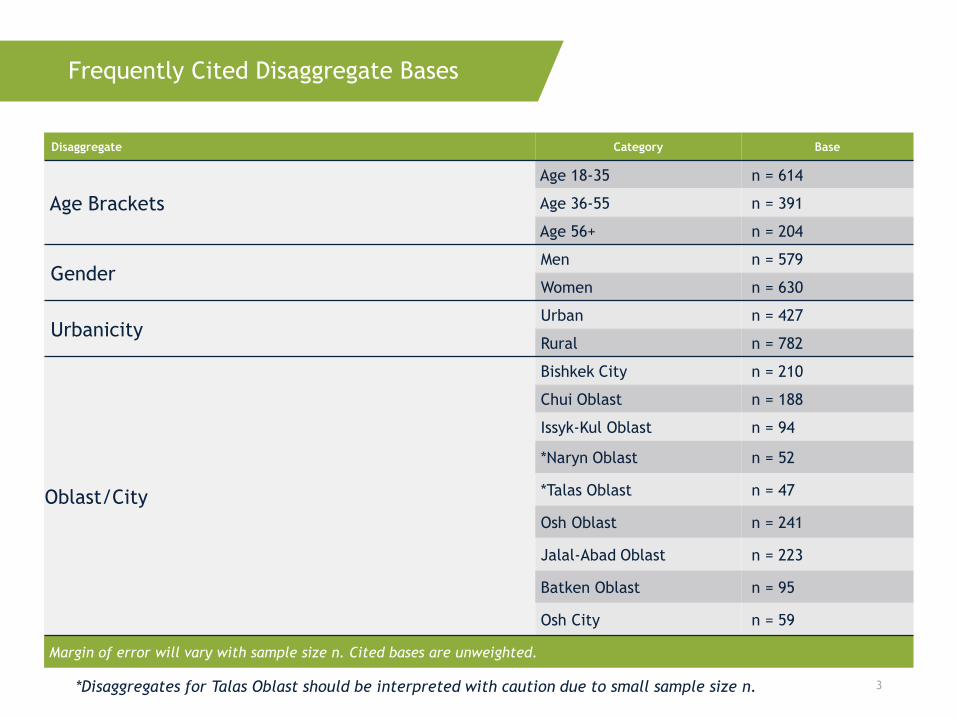
Frequently Cited Disaggregate Bases
*Disaggregates for Talas Oblast should be interpreted with caution due to small sample size n.
Disaggregate Category Base
Age Brackets
Age 18-35 n = 614
Age 36-55 n = 391
Age 56+ n = 204
GenderMen n = 579
Women n = 630
UrbanicityUrban n = 427
Rural n = 782
Oblast/City
Bishkek City n = 210
Chui Oblast n = 188
Issyk-Kul Oblast n = 94
*Naryn Oblast n = 52
*Talas Oblast n = 47
Osh Oblast n = 241
Jalal-Abad Oblast n = 223
Batken Oblast n = 95
Osh City n = 59
Margin of error will vary with sample size n. Cited bases are unweighted.
4
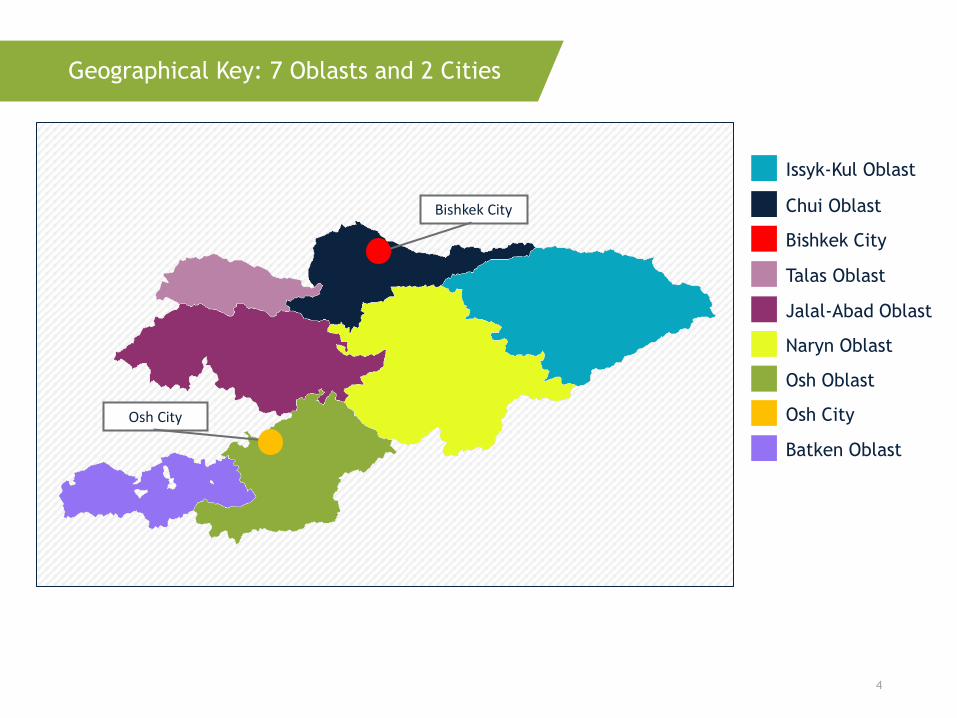
Geographical Key: 7 Oblasts and 2 Cities
Issyk-Kul Oblast
Jalal-Abad Oblast
Talas Oblast
Chui Oblast
Bishkek City
Naryn Oblast
Osh Oblast
Osh City
Batken Oblast
Bishkek City
Osh City
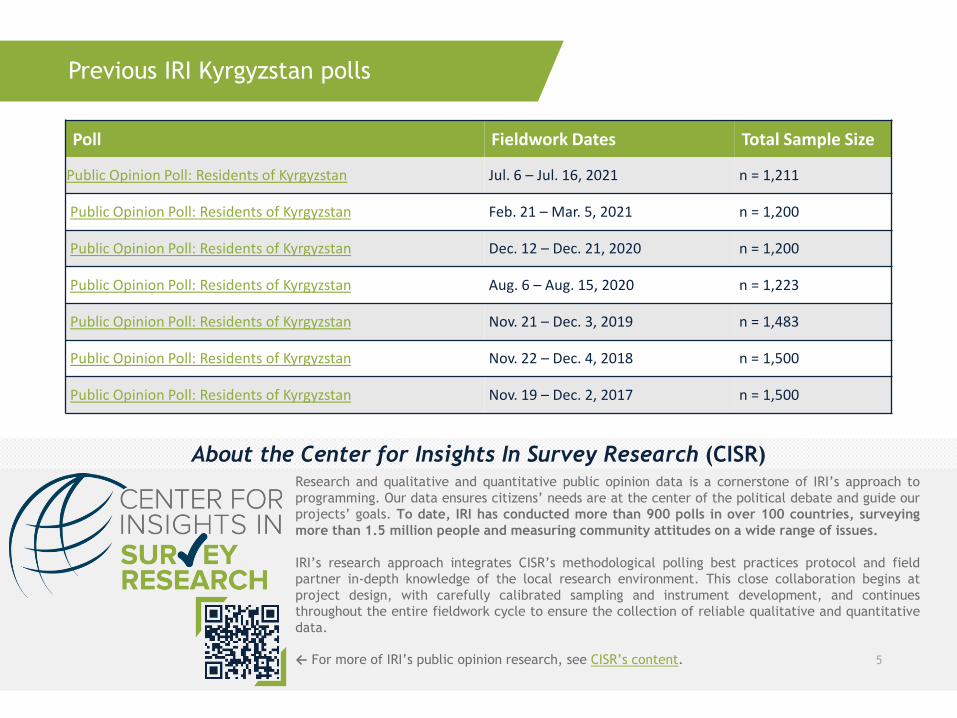
Previous IRI Kyrgyzstan polls
Research and qualitative and quantitative public opinion data is a cornerstone of IRI’s approach to
programming. Our data ensures citizens’ needs are at the center of the political debate and guide our
projects’ goals. To date, IRI has conducted more than 900 polls in over 100 countries, surveying
more than 1.5 million people and measuring community attitudes on a wide range of issues.
IRI’s research approach integrates CISR’s methodological polling best practices protocol and field
partner in-depth knowledge of the local research environment. This close collaboration begins at
project design, with carefully calibrated sampling and instrument development, and continues
throughout the entire fieldwork cycle to ensure the collection of reliable qualitative and quantitative
data.
← For more of IRI’s public opinion research, see CISR’s content. 5
About the Center for Insights In Survey Research (CISR)
Poll Fieldwork Dates Total Sample Size
Public Opinion Poll: Residents of Kyrgyzstan Jul. 6 – Jul. 16, 2021 n = 1,211
Public Opinion Poll: Residents of Kyrgyzstan Feb. 21 – Mar. 5, 2021 n = 1,200
Public Opinion Poll: Residents of Kyrgyzstan Dec. 12 – Dec. 21, 2020 n = 1,200
Public Opinion Poll: Residents of Kyrgyzstan Aug. 6 – Aug. 15, 2020 n = 1,223
Public Opinion Poll: Residents of Kyrgyzstan Nov. 21 – Dec. 3, 2019 n = 1,483
Public Opinion Poll: Residents of Kyrgyzstan Nov. 22 – Dec. 4, 2018 n = 1,500
Public Opinion Poll: Residents of Kyrgyzstan Nov. 19 – Dec. 2, 2017 n = 1,500
National Outlook
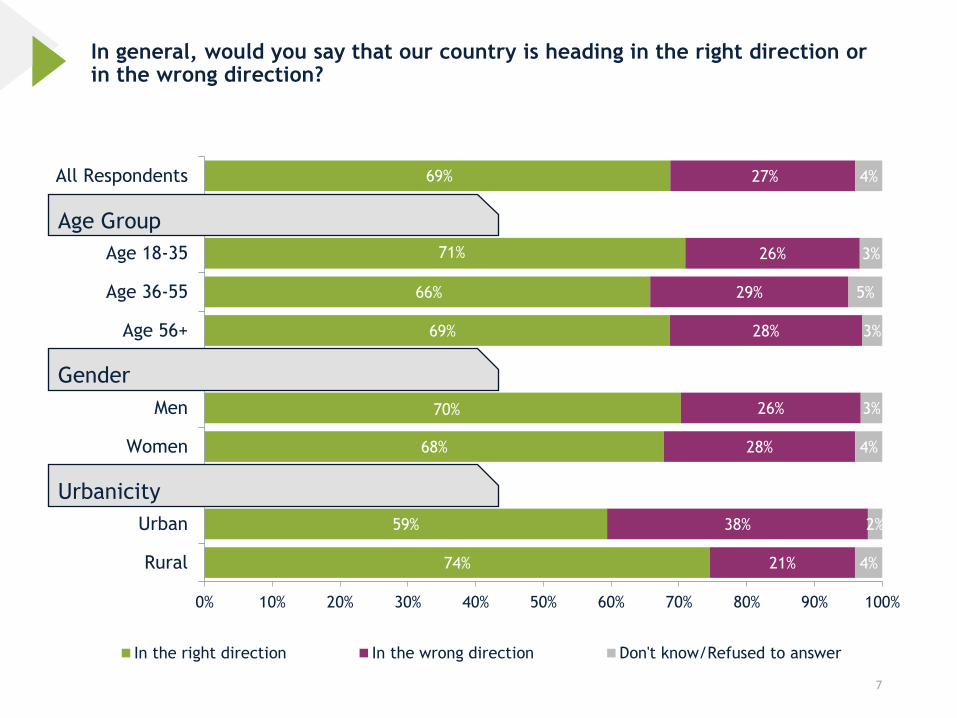
In general, would you say that our country is heading in the right direction or in the wrong direction?
7
69%
71%
66%
69%
70%
68%
59%
74%
27%
26%
29%
28%
26%
28%
38%
21%
4%
3%
5%
3%
3%
4%
2%
4%
0% 10% 20% 30% 40% 50% 60% 70% 80% 90% 100%
All Respondents
Age 18-35
Age 36-55
Age 56+
Men
Women
Urban
Rural
In the right direction In the wrong direction Don't know/Refused to answer
Gender
Age Group
Urbanicity
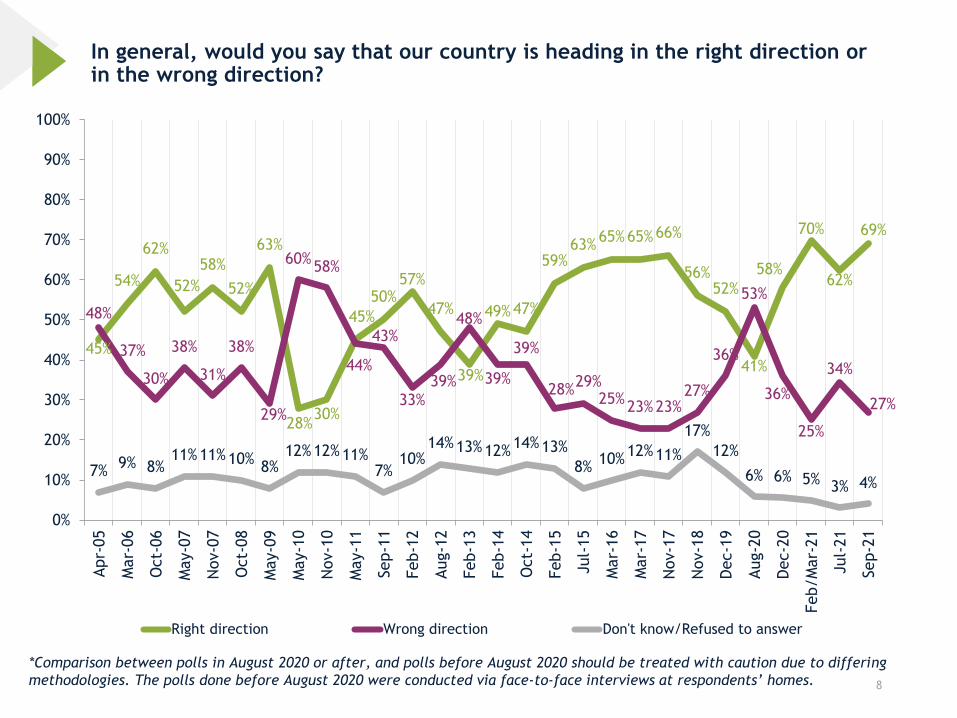
In general, would you say that our country is heading in the right direction or in the wrong direction?
8
45%
54%
62%
52%
58%
52%
63%
28%30%
45%
50%57%
47%
39%
49%47%
59%63%
65%65%66%
56%52%
41%
58%
70%
62%
69%
48%
37%
30%
38%
31%
38%
29%
60%58%
44%
43%
33%39%
48%
39%
39%
28%29%
25%23%23%
27%
36%
53%
36%
25%
34%
27%
7%9% 8%
11%11%10%8%
12%12%11%7%
10%14%13%12%
14%13%
8%10%
12%11%
17%
12%
6% 6% 5% 3% 4%
0%
10%
20%
30%
40%
50%
60%
70%
80%
90%
100%
Apr-
05
Mar-
06
Oct-
06
May-0
7
Nov-0
7
Oct-
08
May-0
9
May-1
0
Nov-1
0
May-1
1
Sep-1
1
Feb-1
2
Aug-1
2
Feb-1
3
Feb-1
4
Oct-
14
Feb-1
5
Jul-
15
Mar-
16
Mar-
17
Nov-1
7
Nov-1
8
Dec-1
9
Aug-2
0
Dec-2
0
Feb/M
ar-
21
Jul-
21
Sep-2
1
Right direction Wrong direction Don't know/Refused to answer
*Comparison between polls in August 2020 or after, and polls before August 2020 should be treated with caution due to differing
methodologies. The polls done before August 2020 were conducted via face-to-face interviews at respondents’ homes.
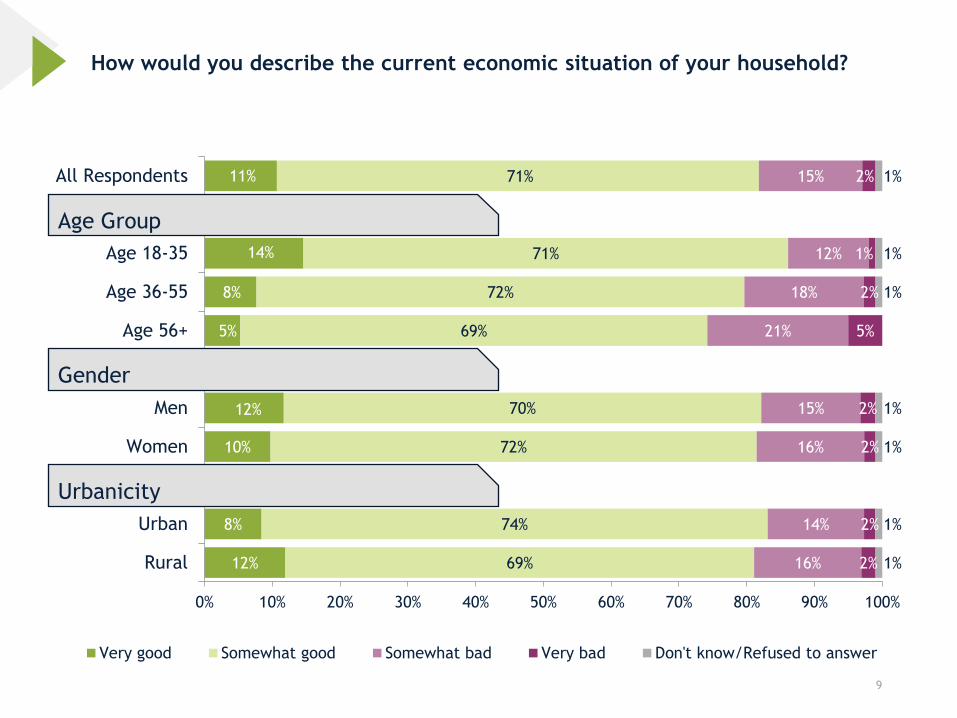
How would you describe the current economic situation of your household?
9
11%
14%
8%
5%
12%
10%
8%
12%
71%
71%
72%
69%
70%
72%
74%
69%
15%
12%
18%
21%
15%
16%
14%
16%
2%
1%
2%
5%
2%
2%
2%
2%
1%
1%
1%
1%
1%
1%
1%
0% 10% 20% 30% 40% 50% 60% 70% 80% 90% 100%
All Respondents
Age 18-35
Age 36-55
Age 56+
Men
Women
Urban
Rural
Very good Somewhat good Somewhat bad Very bad Don't know/Refused to answer
Gender
Age Group
Urbanicity
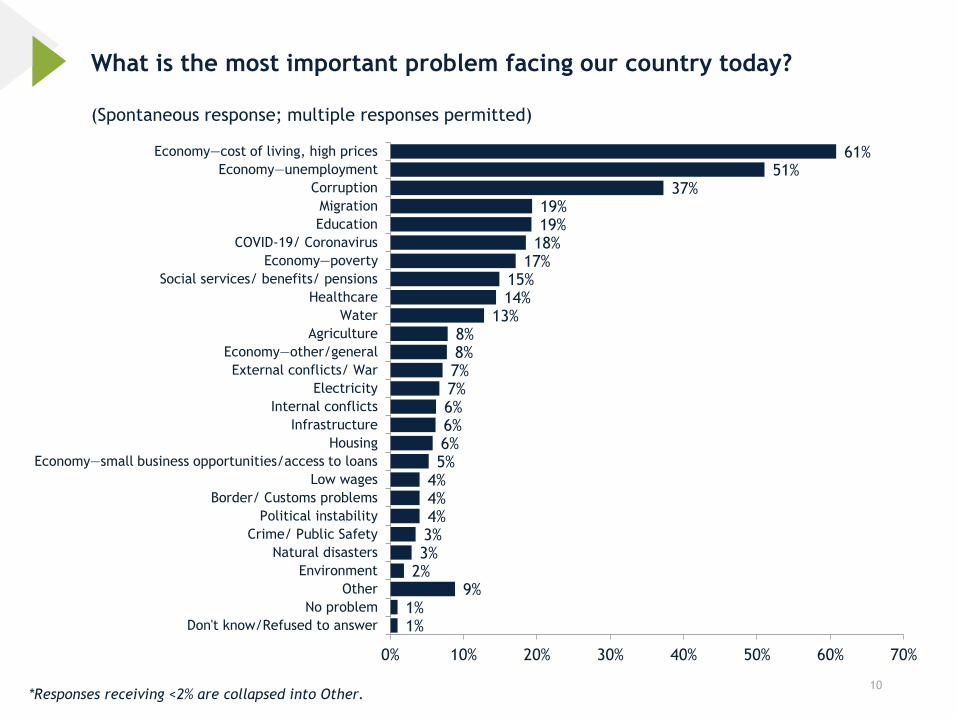
What is the most important problem facing our country today?
10
(Spontaneous response; multiple responses permitted)
61%51%
37%19%19%
18%17%
15%14%
13%8%8%7%7%6%6%6%5%
4%4%4%3%3%
2%9%
1%1%
0% 10% 20% 30% 40% 50% 60% 70%
Economy—cost of living, high prices
Economy—unemployment
Corruption
Migration
Education
COVID-19/ Coronavirus
Economy—poverty
Social services/ benefits/ pensions
Healthcare
Water
Agriculture
Economy—other/general
External conflicts/ War
Electricity
Internal conflicts
Infrastructure
Housing
Economy—small business opportunities/access to loans
Low wages
Border/ Customs problems
Political instability
Crime/ Public Safety
Natural disasters
Environment
Other
No problem
Don't know/Refused to answer
*Responses receiving <2% are collapsed into Other.
Democracy and Political Interest
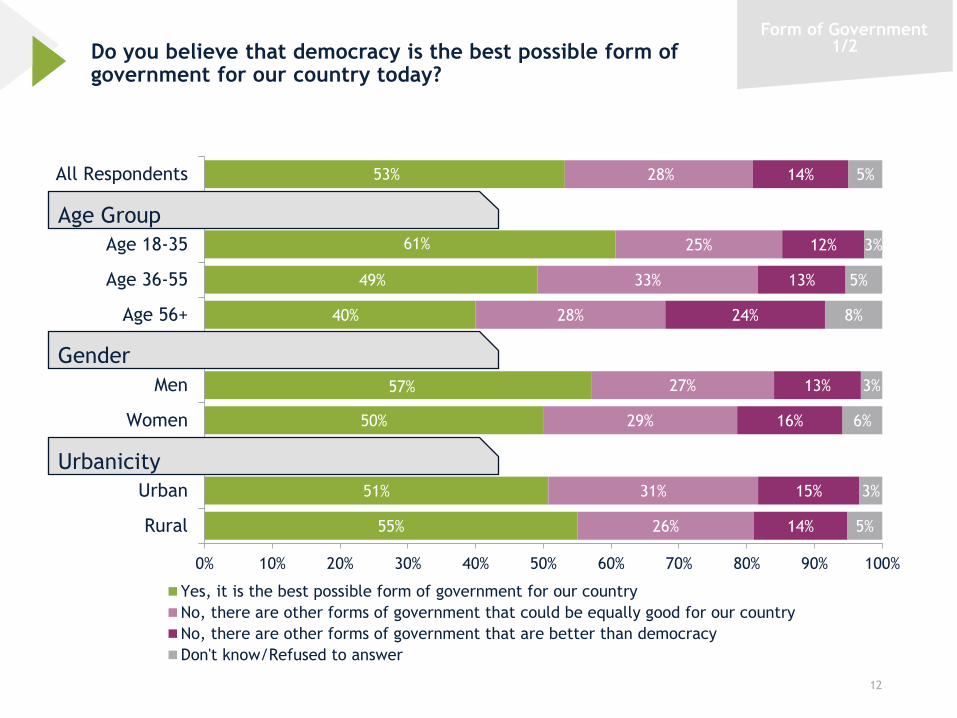
Do you believe that democracy is the best possible form of government for our country today?
12
53%
61%
49%
40%
57%
50%
51%
55%
28%
25%
33%
28%
27%
29%
31%
26%
14%
12%
13%
24%
13%
16%
15%
14%
5%
3%
5%
8%
3%
6%
3%
5%
0% 10% 20% 30% 40% 50% 60% 70% 80% 90% 100%
All Respondents
Age 18-35
Age 36-55
Age 56+
Men
Women
Urban
Rural
Yes, it is the best possible form of government for our country
No, there are other forms of government that could be equally good for our country
No, there are other forms of government that are better than democracy
Don't know/Refused to answer
Gender
Age Group
Urbanicity
Form of Government1/2
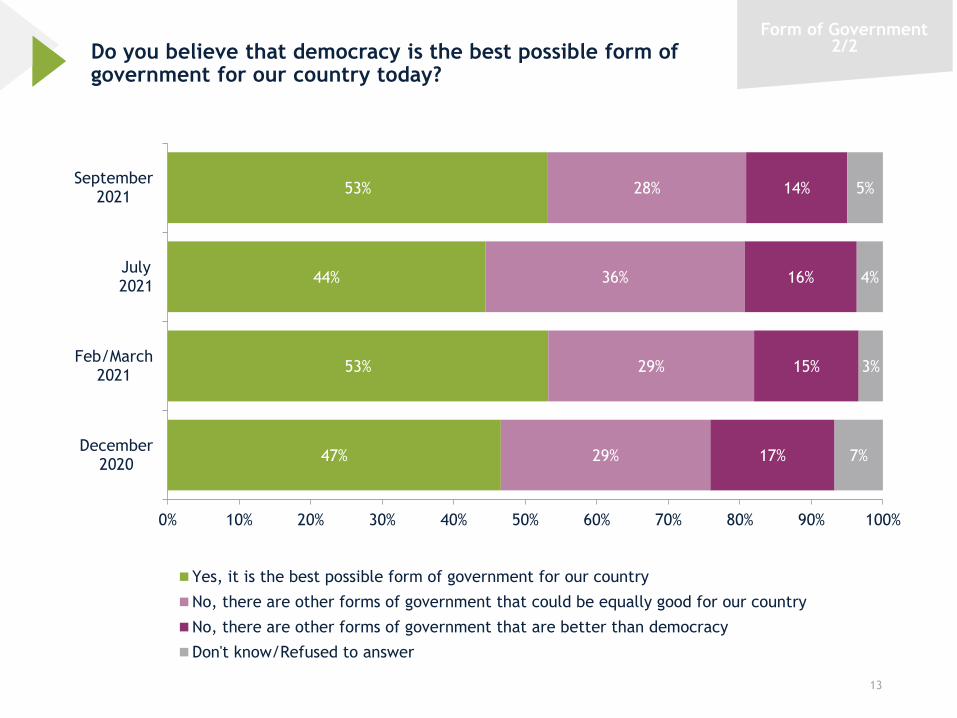
Do you believe that democracy is the best possible form of government for our country today?
13
53%
44%
53%
47%
28%
36%
29%
29%
14%
16%
15%
17%
5%
4%
3%
7%
0% 10% 20% 30% 40% 50% 60% 70% 80% 90% 100%
September2021
July2021
Feb/March2021
December2020
Yes, it is the best possible form of government for our country
No, there are other forms of government that could be equally good for our country
No, there are other forms of government that are better than democracy
Don't know/Refused to answer
Form of Government2/2
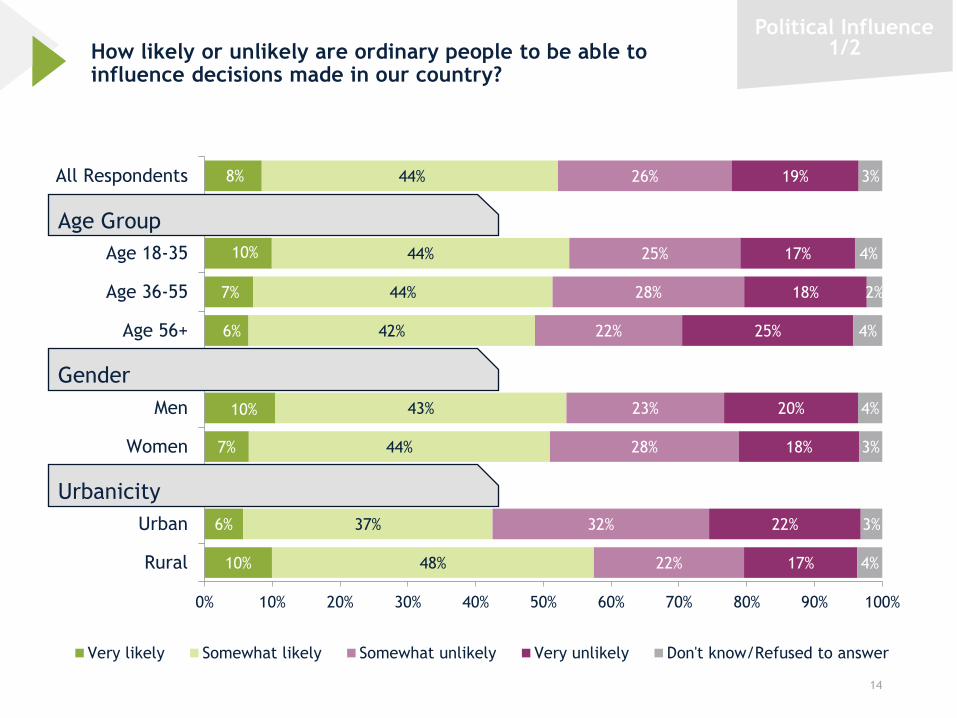
How likely or unlikely are ordinary people to be able to influence decisions made in our country?
14
8%
10%
7%
6%
10%
7%
6%
10%
44%
44%
44%
42%
43%
44%
37%
48%
26%
25%
28%
22%
23%
28%
32%
22%
19%
17%
18%
25%
20%
18%
22%
17%
3%
4%
2%
4%
4%
3%
3%
4%
0% 10% 20% 30% 40% 50% 60% 70% 80% 90% 100%
All Respondents
Age 18-35
Age 36-55
Age 56+
Men
Women
Urban
Rural
Very likely Somewhat likely Somewhat unlikely Very unlikely Don't know/Refused to answer
Gender
Age Group
Urbanicity
Political Influence1/2
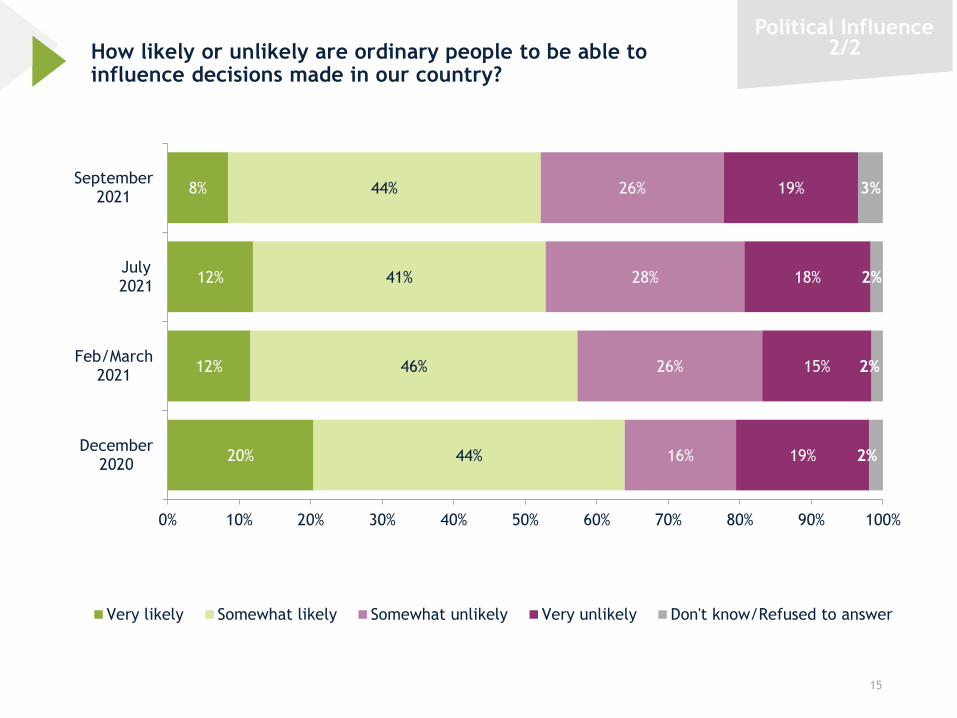
How likely or unlikely are ordinary people to be able to influence decisions made in our country?
15
8%
12%
12%
20%
44%
41%
46%
44%
26%
28%
26%
16%
19%
18%
15%
19%
3%
2%
2%
2%
0% 10% 20% 30% 40% 50% 60% 70% 80% 90% 100%
September2021
July2021
Feb/March2021
December2020
Very likely Somewhat likely Somewhat unlikely Very unlikely Don't know/Refused to answer
Political Influence2/2
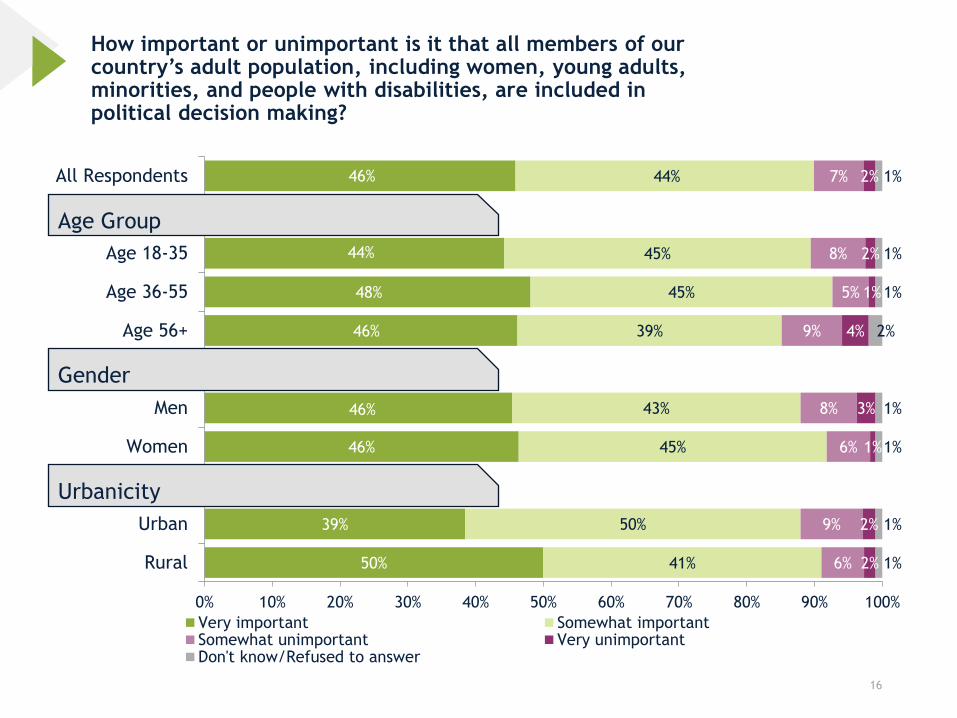
How important or unimportant is it that all members of our country’s adult population, including women, young adults, minorities, and people with disabilities, are included in political decision making?
16
46%
44%
48%
46%
46%
46%
39%
50%
44%
45%
45%
39%
43%
45%
50%
41%
7%
8%
5%
9%
8%
6%
9%
6%
2%
2%
1%
4%
3%
1%
2%
2%
1%
1%
1%
2%
1%
1%
1%
1%
0% 10% 20% 30% 40% 50% 60% 70% 80% 90% 100%
All Respondents
Age 18-35
Age 36-55
Age 56+
Men
Women
Urban
Rural
Very important Somewhat importantSomewhat unimportant Very unimportantDon't know/Refused to answer
Gender
Age Group
Urbanicity
Political Influence1/2
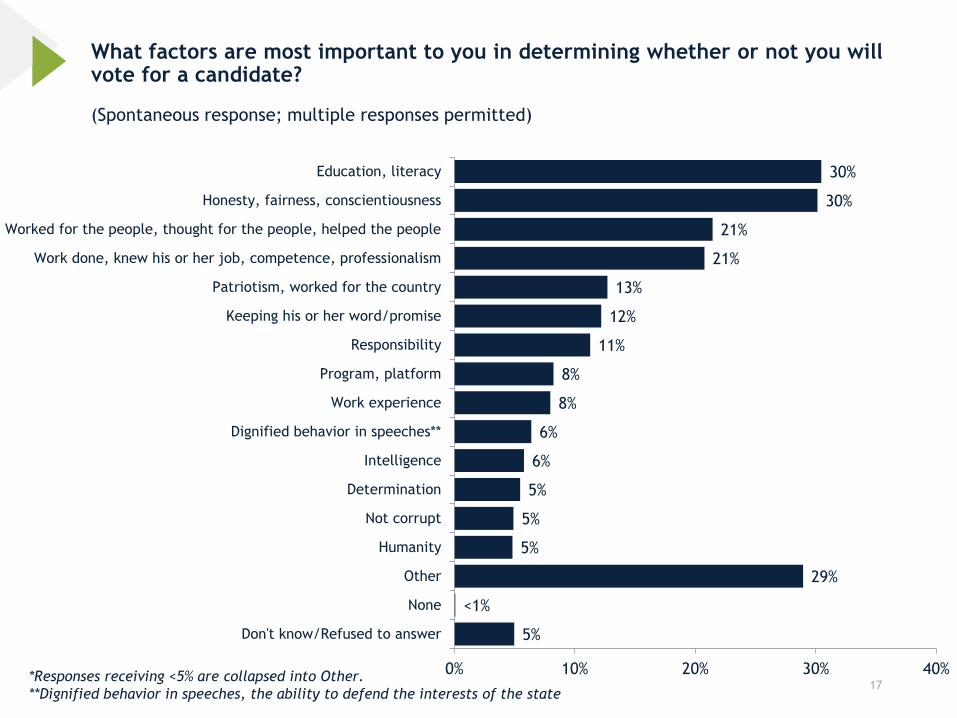
What factors are most important to you in determining whether or not you will vote for a candidate?
17
(Spontaneous response; multiple responses permitted)
30%
30%
21%
21%
13%
12%
11%
8%
8%
6%
6%
5%
5%
5%
29%
<1%
5%
0% 10% 20% 30% 40%
Education, literacy
Honesty, fairness, conscientiousness
Worked for the people, thought for the people, helped the people
Work done, knew his or her job, competence, professionalism
Patriotism, worked for the country
Keeping his or her word/promise
Responsibility
Program, platform
Work experience
Dignified behavior in speeches**
Intelligence
Determination
Not corrupt
Humanity
Other
None
Don't know/Refused to answer
*Responses receiving <5% are collapsed into Other.
**Dignified behavior in speeches, the ability to defend the interests of the state
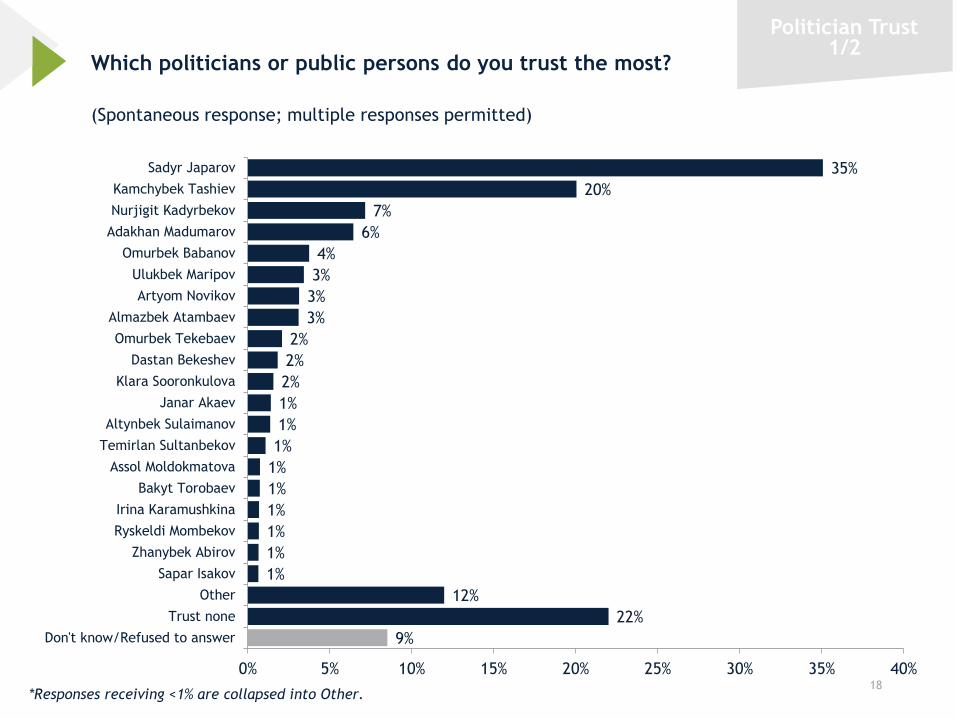
Which politicians or public persons do you trust the most?
18
(Spontaneous response; multiple responses permitted)
35%
20%
7%
6%
4%
3%
3%
3%
2%
2%
2%
1%
1%
1%
1%
1%
1%
1%
1%
1%
12%
22%
9%
0% 5% 10% 15% 20% 25% 30% 35% 40%
Sadyr Japarov
Kamchybek Tashiev
Nurjigit Kadyrbekov
Adakhan Madumarov
Omurbek Babanov
Ulukbek Maripov
Artyom Novikov
Almazbek Atambaev
Omurbek Tekebaev
Dastan Bekeshev
Klara Sooronkulova
Janar Akaev
Altynbek Sulaimanov
Temirlan Sultanbekov
Assol Moldokmatova
Bakyt Torobaev
Irina Karamushkina
Ryskeldi Mombekov
Zhanybek Abirov
Sapar Isakov
Other
Trust none
Don't know/Refused to answer
*Responses receiving <1% are collapsed into Other.
Politician Trust1/2
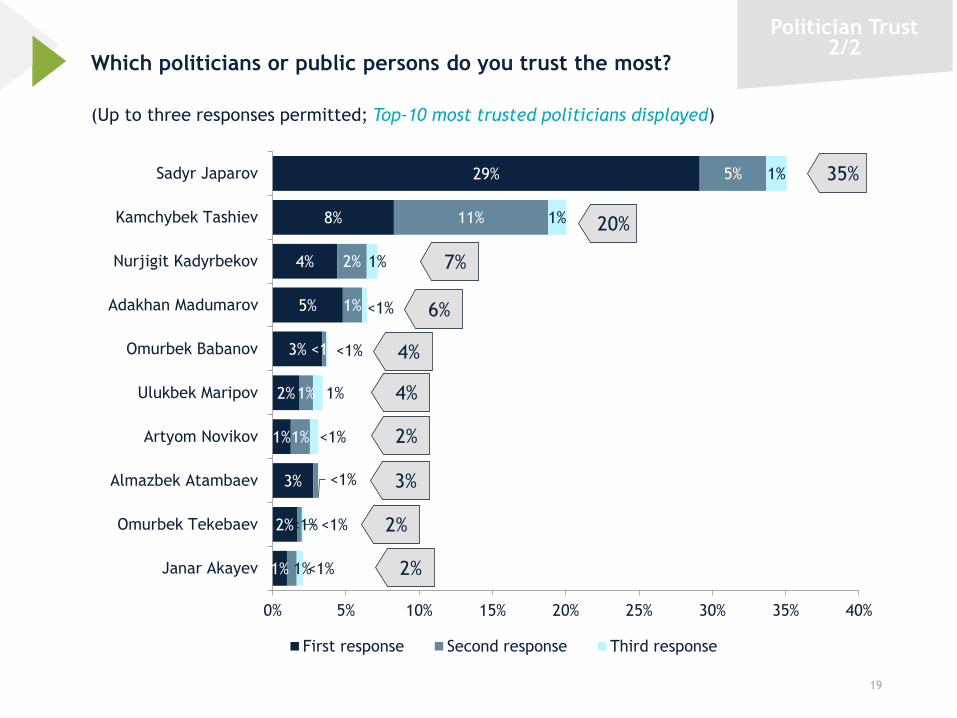
Which politicians or public persons do you trust the most?
19
(Up to three responses permitted; Top-10 most trusted politicians displayed)
29%
8%
4%
5%
3%
2%
1%
3%
2%
1%
5%
11%
2%
1%
<1%
1%
1%
<1%
1%
1%
1%
1%
<1%
<1%
1%
<1%
<1%
<1%
<1%
0% 5% 10% 15% 20% 25% 30% 35% 40%
Sadyr Japarov
Kamchybek Tashiev
Nurjigit Kadyrbekov
Adakhan Madumarov
Omurbek Babanov
Ulukbek Maripov
Artyom Novikov
Almazbek Atambaev
Omurbek Tekebaev
Janar Akayev
First response Second response Third response
35%
20%
7%
6%
4%
4%
2%
3%
2%
2%
Politician Trust2/2
Please name all the political parties you are familiar with in your region…
20
(Spontaneous response; multiple responses permitted)
39%30%
28%27%
25%25%
20%16%
15%13%
12%11%
7%6%
4%3%
3%2%2%2%2%2%1%1%1%
3%5%
4%
0% 5% 10% 15% 20% 25% 30% 35% 40% 45%
Ata Meken
Ata-Jurt
Respublika
SDPK
Mekenchil
Birimdik
Kyrgyzstan
Yiman Nuru
Butun Kyrgyzstan
Mekenim Kyrgyzstan
Zamandash
Bir-Bol
Onuguu-Progress
Reforma
Yntymak
Chon Kazat
EmgekMeken Yntymagy
Uluttar Birimdigi (People’s party)
Ak Bata
Bizdin El
Tabylga
Ak-Shumkar
Ar Namys
Ishenim
Other
None
Don't know/Refused to answer
Party Familiarity1/4
*Responses receiving <1% are collapsed into Other.
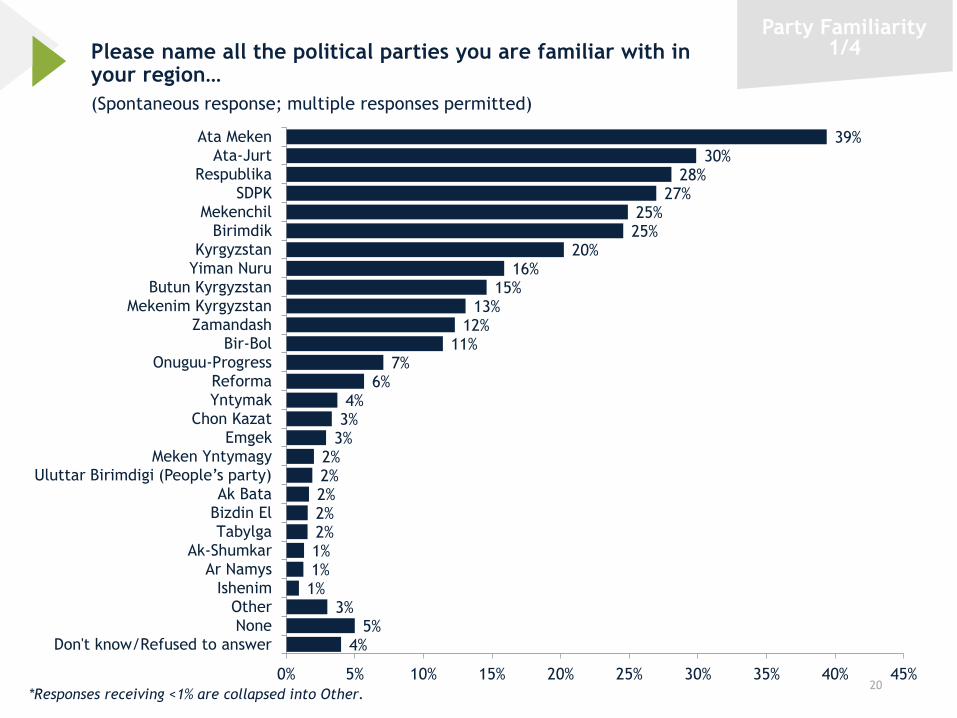
Please name all the political parties you are familiar with in your region…
21
(Spontaneous response; multiple responses permitted; Top-10 responses displayed)
39%
30%
28%
27%
25%
25%
20%
16%
15%
13%
0% 20% 40% 60% 80% 100%
Ata Meken
Ata-Jurt
Respublika
SDPK
Mekenchil
Birimdik
Kyrgyzstan
Yiman Nuru
Butun Kyrgyzstan
Mekenim Kyrgyzstan
53%
48%
44%
24%
21%
20%
19%
19%
19%
12%
0% 20% 40% 60% 80% 100%
Ata Meken
Respublika
SDPK
Zamandash
Birimdik
Kyrgyzstan
Yiman Nuru
Ata-Jurt
Reforma
Butun Kyrgyzstan
68%
41%
34%
31%
19%
18%
17%
17%
15%
12%
0% 20% 40% 60% 80% 100%
Mekenchil
Ata Meken
SDPK
Respublika
Ata-Jurt
Kyrgyzstan
Chon Kazat
Tabylga
Onuguu-Progress
Bir-Bol
42%
38%
37%
19%
16%
13%
13%
12%
8%
7%
0% 20% 40% 60% 80% 100%
Ata Meken
SDPK
Respublika
Kyrgyzstan
Ata-Jurt
Zamandash
Yiman Nuru
Mekenchil
Birimdik
Yntymak
All Respondents Bishkek City
Issyk-Kul OblastChui Oblast
Party Familiarity2/4
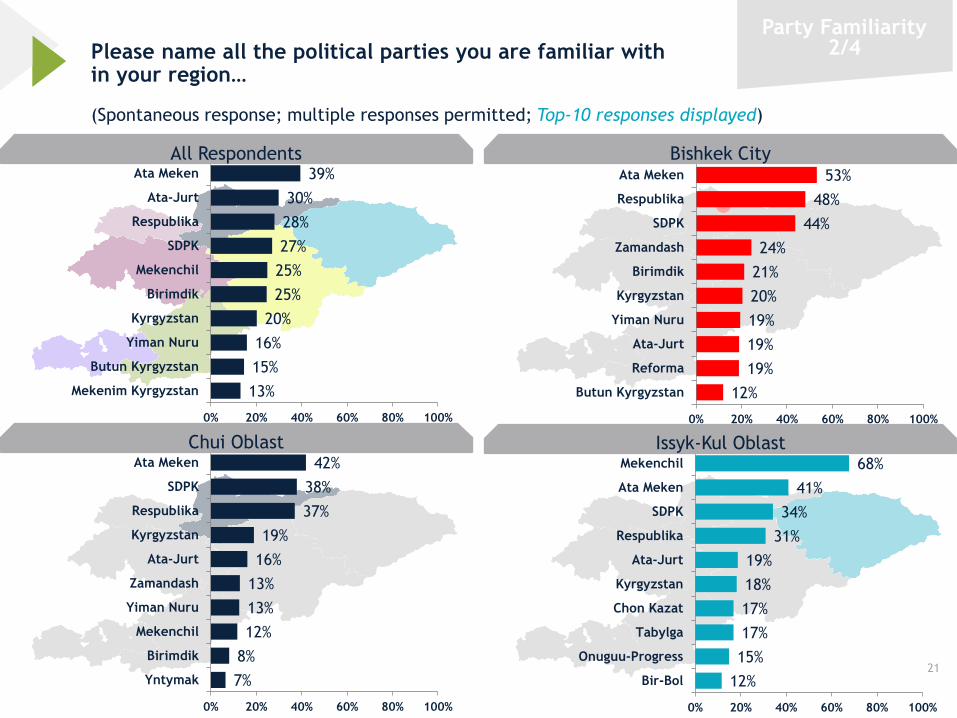
Please name all the political parties you are familiar with in your region…
(Spontaneous response; multiple responses permitted; Top-10 responses displayed)
39%
30%
28%
27%
25%
25%
20%
16%
15%
13%
0% 20% 40% 60% 80% 100%
Ata Meken
Ata-Jurt
Respublika
SDPK
Mekenchil
Birimdik
Kyrgyzstan
Yiman Nuru
Butun Kyrgyzstan
Mekenim Kyrgyzstan
All Respondents34%
29%
29%
27%
25%
16%
13%
12%
12%
8%
0% 20% 40% 60% 80% 100%
SDPK
Ata Meken
Respublika
Mekenchil
Kyrgyzstan
Birimdik
Ata-Jurt
Bir-Bol
Butun Kyrgyzstan
Zamandash
58%
53%
36%
24%
13%
13%
9%
8%
8%
8%
0% 20% 40% 60% 80% 100%
Respublika
Ata Meken
SDPK
Ata-Jurt
Onuguu-Progress
Mekenim Kyrgyzstan
Kyrgyzstan
Mekenchil
Yiman Nuru
Butun Kyrgyzstan
45%
38%
36%
32%
26%
23%
22%
21%
20%
18%
0% 20% 40% 60% 80% 100%
Ata-Jurt
Ata Meken
Mekenchil
Birimdik
Butun Kyrgyzstan
Yiman Nuru
Mekenim Kyrgyzstan
Kyrgyzstan
SDPK
Respublika
Jalal-Abad Oblast
Naryn Oblast
Talas Oblast
22
Party Familiarity3/4
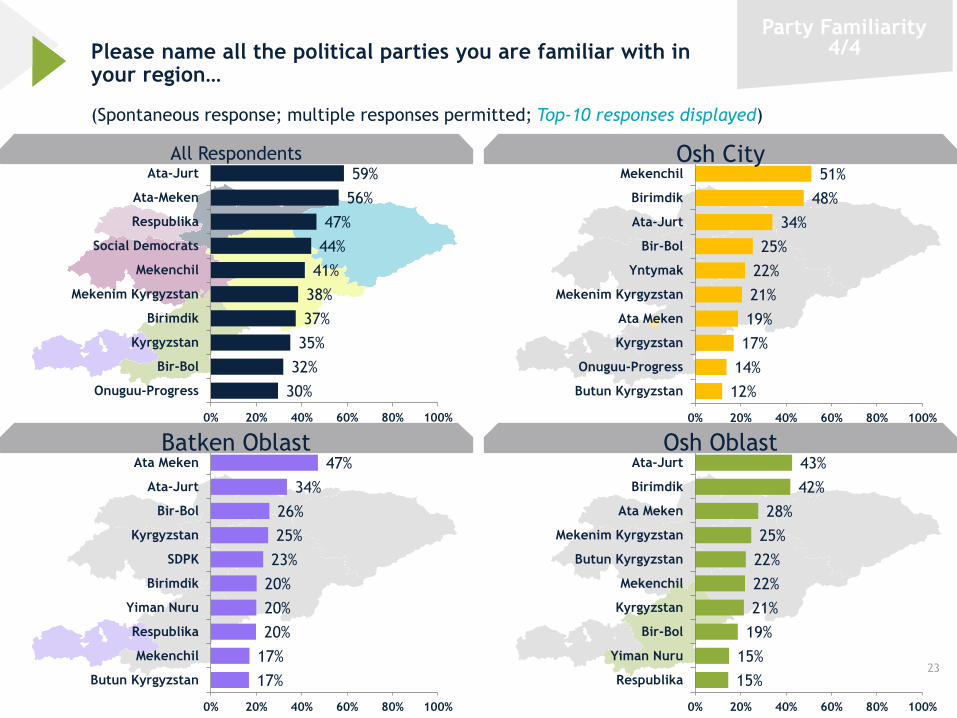
Please name all the political parties you are familiar with in your region…
(Spontaneous response; multiple responses permitted; Top-10 responses displayed)
59%
56%
47%
44%
41%
38%
37%
35%
32%
30%
0% 20% 40% 60% 80% 100%
Ata-Jurt
Ata-Meken
Respublika
Social Democrats
Mekenchil
Mekenim Kyrgyzstan
Birimdik
Kyrgyzstan
Bir-Bol
Onuguu-Progress
All Respondents51%
48%
34%
25%
22%
21%
19%
17%
14%
12%
0% 20% 40% 60% 80% 100%
Mekenchil
Birimdik
Ata-Jurt
Bir-Bol
Yntymak
Mekenim Kyrgyzstan
Ata Meken
Kyrgyzstan
Onuguu-Progress
Butun Kyrgyzstan
43%
42%
28%
25%
22%
22%
21%
19%
15%
15%
0% 20% 40% 60% 80% 100%
Ata-Jurt
Birimdik
Ata Meken
Mekenim Kyrgyzstan
Butun Kyrgyzstan
Mekenchil
Kyrgyzstan
Bir-Bol
Yiman Nuru
Respublika
47%
34%
26%
25%
23%
20%
20%
20%
17%
17%
0% 20% 40% 60% 80% 100%
Ata Meken
Ata-Jurt
Bir-Bol
Kyrgyzstan
SDPK
Birimdik
Yiman Nuru
Respublika
Mekenchil
Butun Kyrgyzstan
Batken Oblast
Osh City
Osh Oblast
23
Party Familiarity4/4
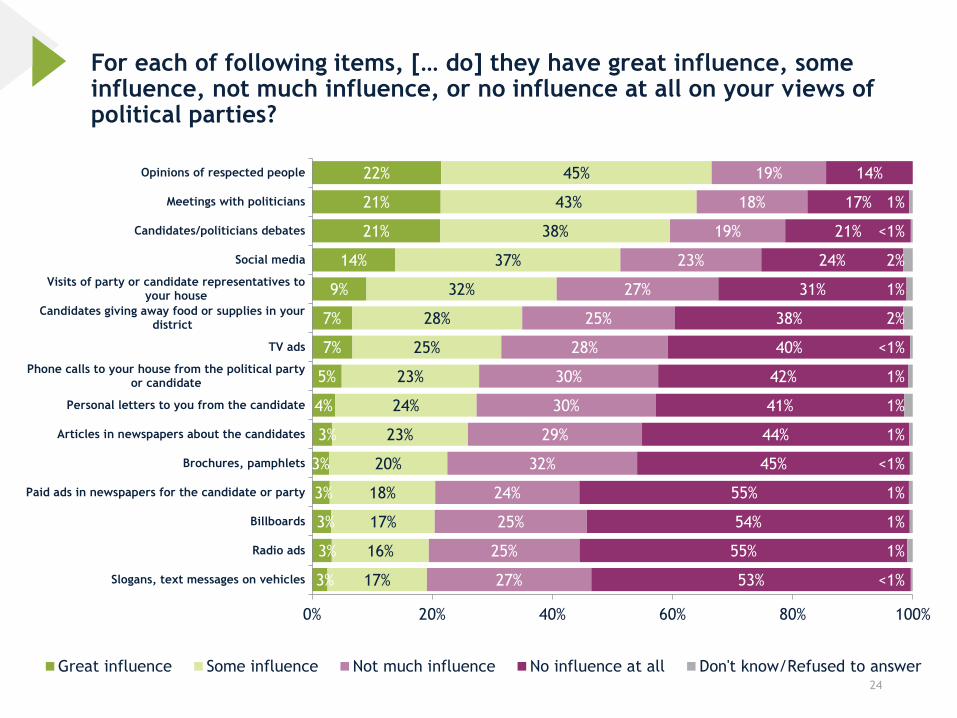
For each of following items, [… do] they have great influence, some influence, not much influence, or no influence at all on your views of political parties?
24
22%
21%
21%
14%
9%
7%
7%
5%
4%
3%
3%
3%
3%
3%
3%
45%
43%
38%
37%
32%
28%
25%
23%
24%
23%
20%
18%
17%
16%
17%
19%
18%
19%
23%
27%
25%
28%
30%
30%
29%
32%
24%
25%
25%
27%
14%
17%
21%
24%
31%
38%
40%
42%
41%
44%
45%
55%
54%
55%
53%
1%
<1%
2%
1%
2%
<1%
1%
1%
1%
<1%
1%
1%
1%
<1%
0% 20% 40% 60% 80% 100%
Opinions of respected people
Meetings with politicians
Candidates/politicians debates
Social media
Visits of party or candidate representatives toyour house
Candidates giving away food or supplies in yourdistrict
TV ads
Phone calls to your house from the political partyor candidate
Personal letters to you from the candidate
Articles in newspapers about the candidates
Brochures, pamphlets
Paid ads in newspapers for the candidate or party
Billboards
Radio ads
Slogans, text messages on vehicles
Great influence Some influence Not much influence No influence at all Don't know/Refused to answer
Electoral Confidence and Integrity
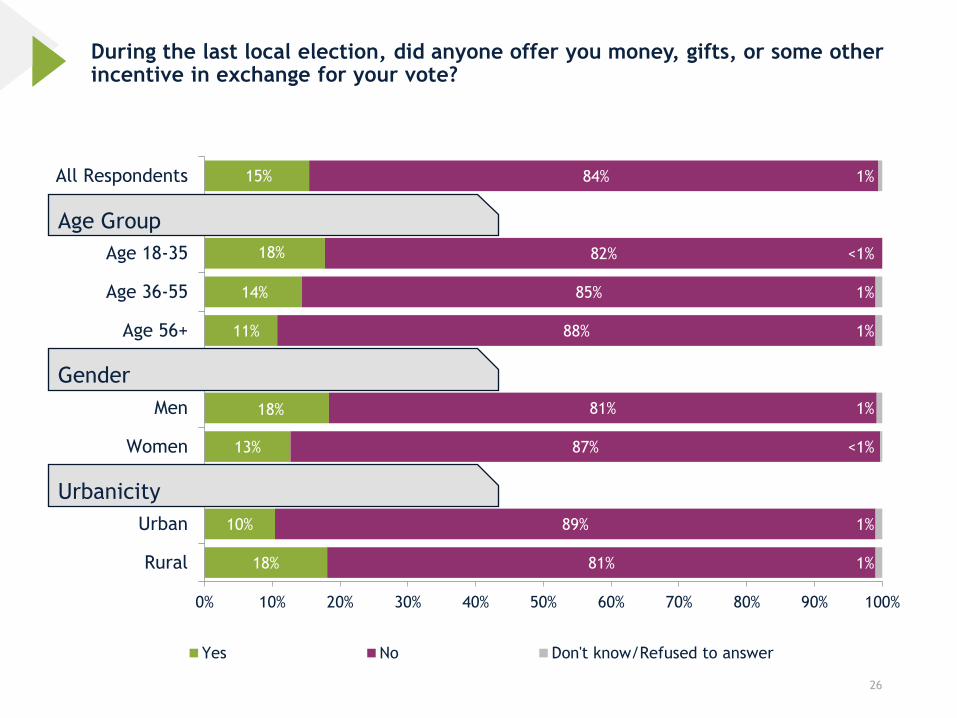
During the last local election, did anyone offer you money, gifts, or some other incentive in exchange for your vote?
26
15%
18%
14%
11%
18%
13%
10%
18%
84%
82%
85%
88%
81%
87%
89%
81%
1%
<1%
1%
1%
1%
<1%
1%
1%
0% 10% 20% 30% 40% 50% 60% 70% 80% 90% 100%
All Respondents
Age 18-35
Age 36-55
Age 56+
Men
Women
Urban
Rural
Yes No Don't know/Refused to answer
Gender
Age Group
Urbanicity
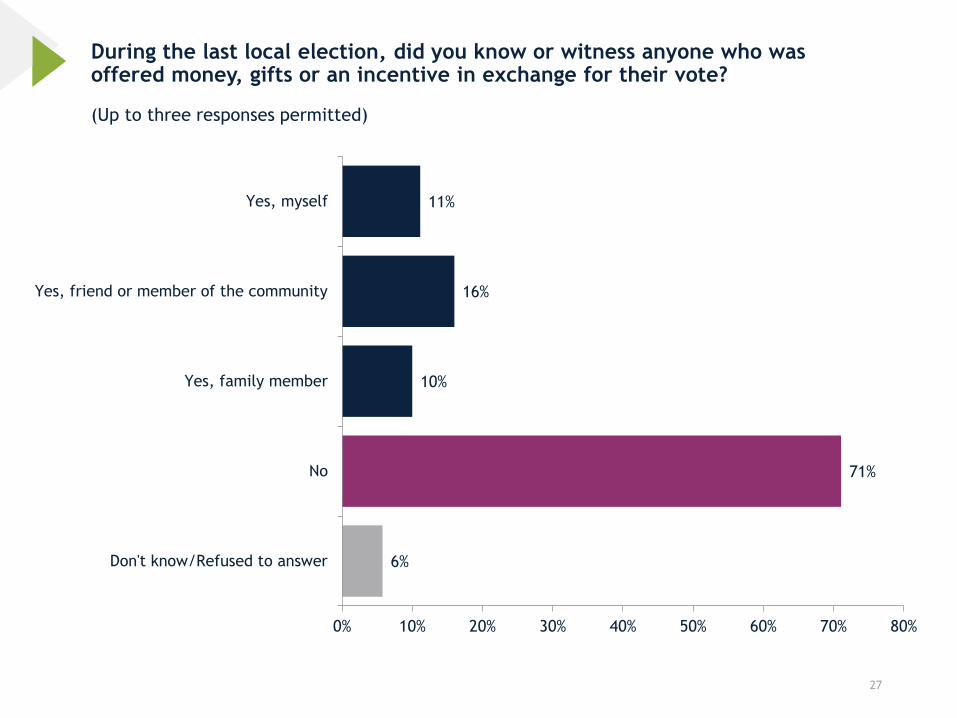
During the last local election, did you know or witness anyone who was offered money, gifts or an incentive in exchange for their vote?
27
11%
16%
10%
71%
6%
0% 10% 20% 30% 40% 50% 60% 70% 80%
Yes, myself
Yes, friend or member of the community
Yes, family member
No
Don't know/Refused to answer
(Up to three responses permitted)
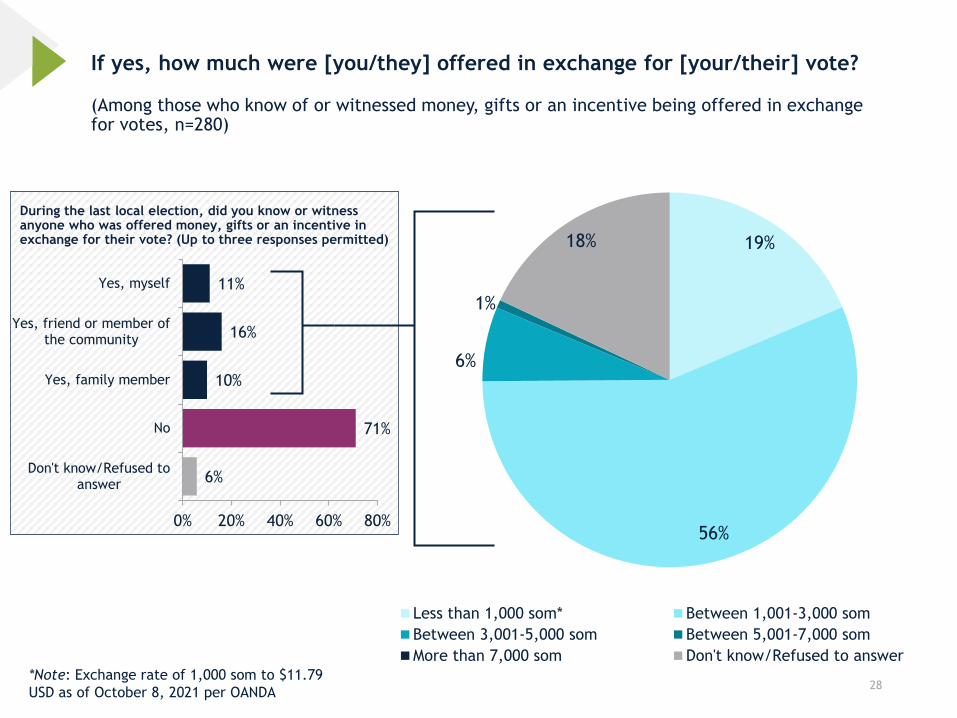
If yes, how much were [you/they] offered in exchange for [your/their] vote?
28
11%
16%
10%
71%
6%
0% 20% 40% 60% 80%
Yes, myself
Yes, friend or member ofthe community
Yes, family member
No
Don't know/Refused toanswer
(Among those who know of or witnessed money, gifts or an incentive being offered in exchange for votes, n=280)
During the last local election, did you know or witness anyone who was offered money, gifts or an incentive in exchange for their vote? (Up to three responses permitted) 19%
56%
6%
1%
18%
Less than 1,000 som* Between 1,001-3,000 som
Between 3,001-5,000 som Between 5,001-7,000 som
More than 7,000 som Don't know/Refused to answer
*Note: Exchange rate of 1,000 som to $11.79
USD as of October 8, 2021 per OANDA
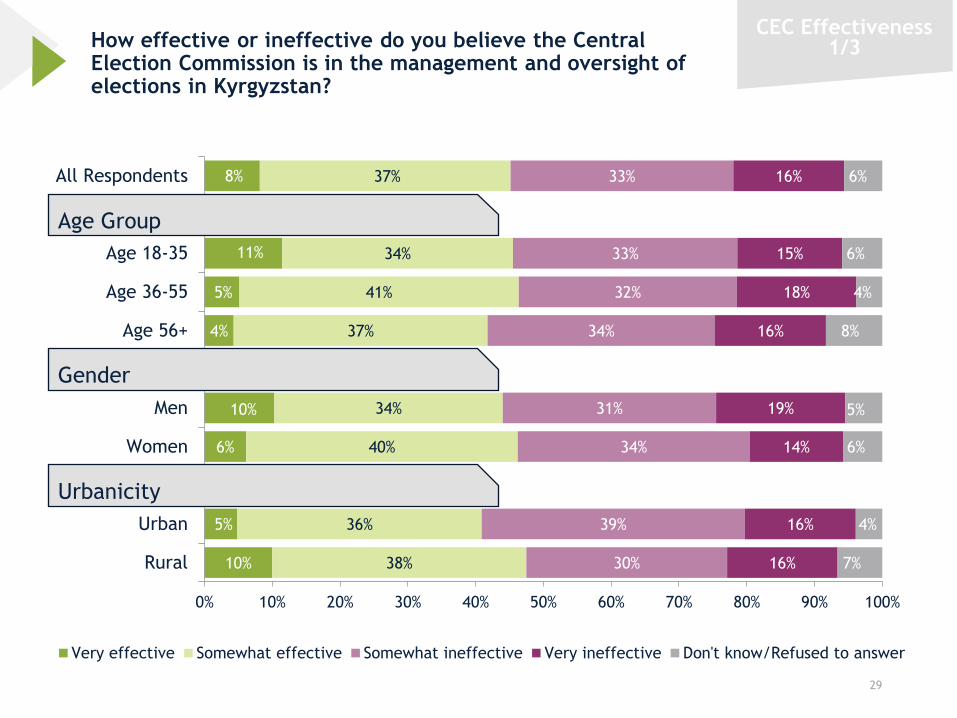
How effective or ineffective do you believe the Central Election Commission is in the management and oversight of elections in Kyrgyzstan?
29
8%
11%
5%
4%
10%
6%
5%
10%
37%
34%
41%
37%
34%
40%
36%
38%
33%
33%
32%
34%
31%
34%
39%
30%
16%
15%
18%
16%
19%
14%
16%
16%
6%
6%
4%
8%
5%
6%
4%
7%
0% 10% 20% 30% 40% 50% 60% 70% 80% 90% 100%
All Respondents
Age 18-35
Age 36-55
Age 56+
Men
Women
Urban
Rural
Very effective Somewhat effective Somewhat ineffective Very ineffective Don't know/Refused to answer
Gender
Age Group
Urbanicity
CEC Effectiveness1/3
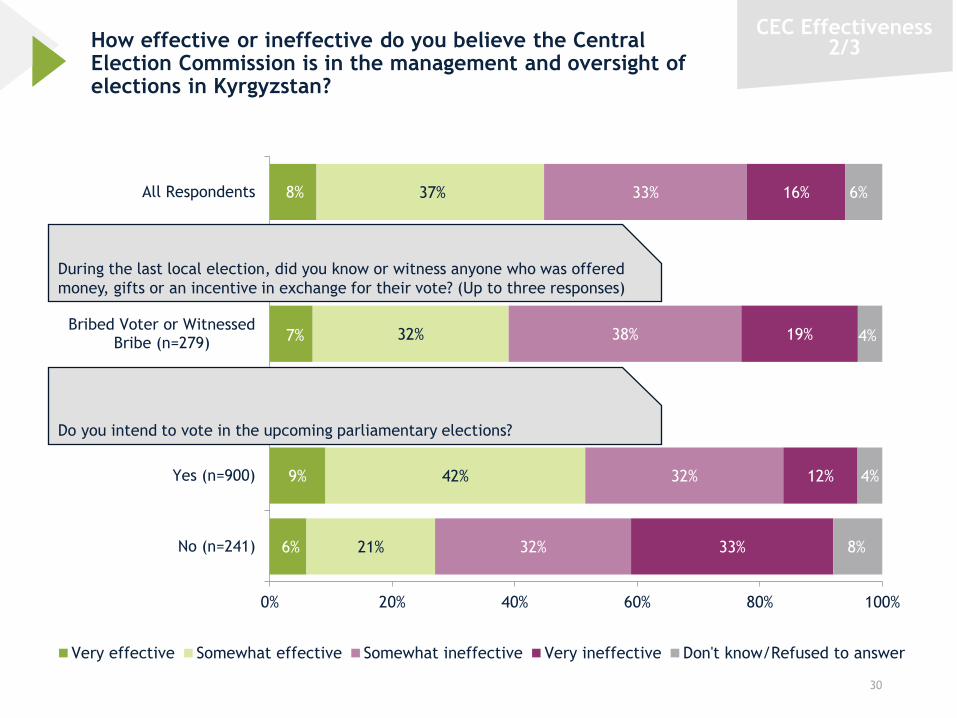
How effective or ineffective do you believe the Central Election Commission is in the management and oversight of elections in Kyrgyzstan?
30
8%
7%
9%
6%
37%
32%
42%
21%
33%
38%
32%
32%
16%
19%
12%
33%
6%
4%
4%
8%
0% 20% 40% 60% 80% 100%
All Respondents
Bribed Voter or WitnessedBribe (n=279)
Yes (n=900)
No (n=241)
Very effective Somewhat effective Somewhat ineffective Very ineffective Don't know/Refused to answer
During the last local election, did you know or witness anyone who was offered
money, gifts or an incentive in exchange for their vote? (Up to three responses)
CEC Effectiveness2/3
Do you intend to vote in the upcoming parliamentary elections?
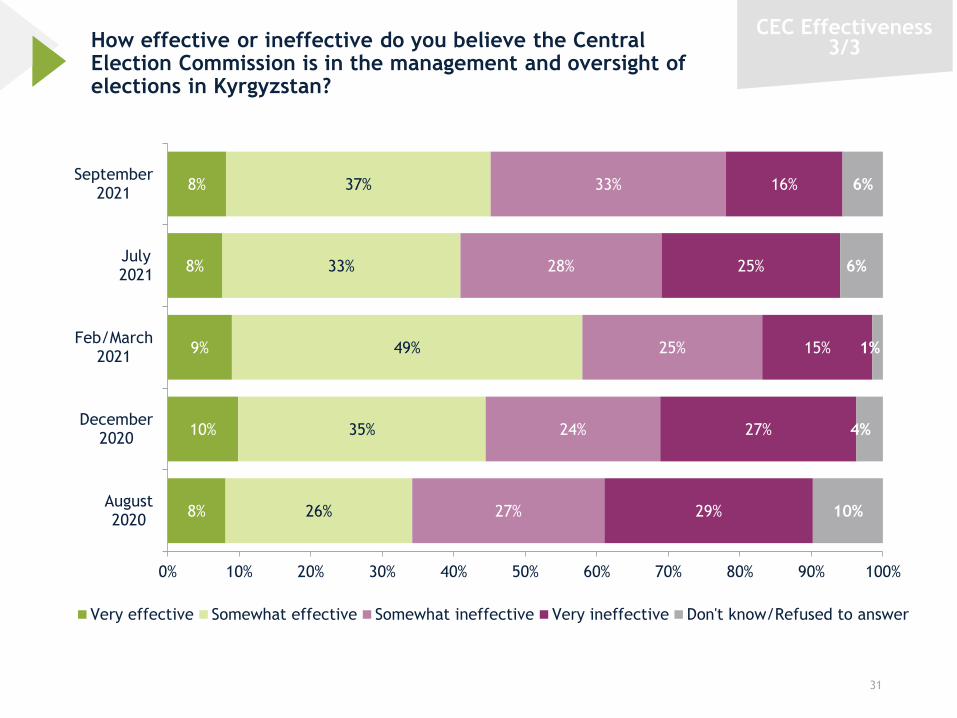
How effective or ineffective do you believe the Central Election Commission is in the management and oversight of elections in Kyrgyzstan?
31
CEC Effectiveness3/3
8%
8%
9%
10%
8%
37%
33%
49%
35%
26%
33%
28%
25%
24%
27%
16%
25%
15%
27%
29%
6%
6%
1%
4%
10%
0% 10% 20% 30% 40% 50% 60% 70% 80% 90% 100%
September2021
July2021
Feb/March2021
December2020
August2020
Very effective Somewhat effective Somewhat ineffective Very ineffective Don't know/Refused to answer
Upcoming Elections
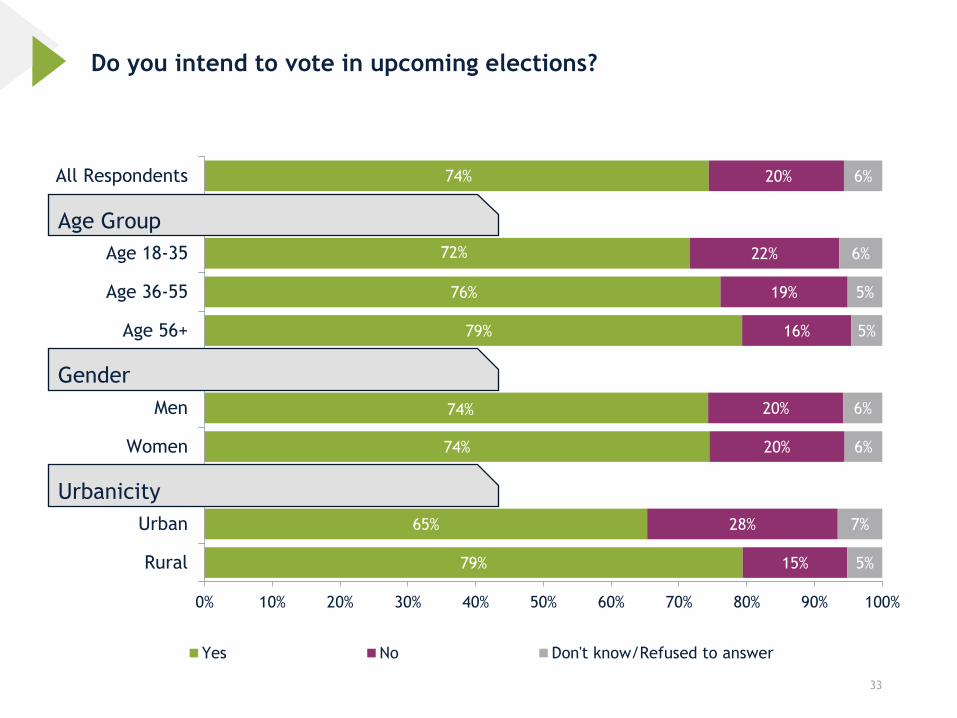
Do you intend to vote in upcoming elections?
33
74%
72%
76%
79%
74%
74%
65%
79%
20%
22%
19%
16%
20%
20%
28%
15%
6%
6%
5%
5%
6%
6%
7%
5%
0% 10% 20% 30% 40% 50% 60% 70% 80% 90% 100%
All Respondents
Age 18-35
Age 36-55
Age 56+
Men
Women
Urban
Rural
Yes No Don't know/Refused to answer
Gender
Age Group
Urbanicity
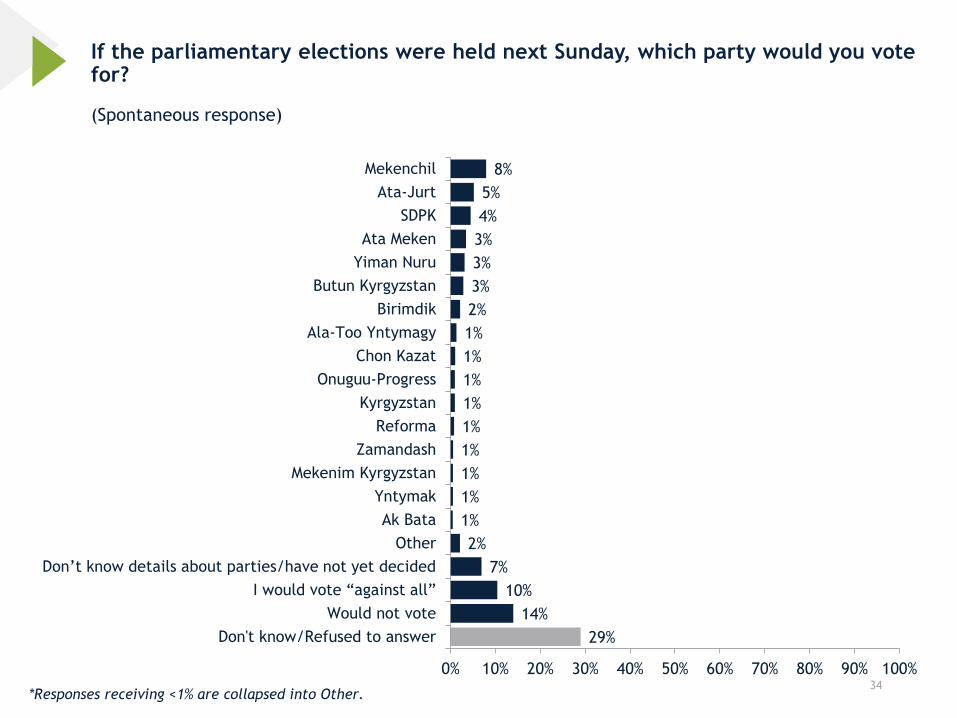
If the parliamentary elections were held next Sunday, which party would you vote for?
34
(Spontaneous response)
8%
5%
4%
3%
3%
3%
2%
1%
1%
1%
1%
1%
1%
1%
1%
1%
2%
7%
10%
14%
29%
0% 10% 20% 30% 40% 50% 60% 70% 80% 90% 100%
Mekenchil
Ata-Jurt
SDPK
Ata Meken
Yiman Nuru
Butun Kyrgyzstan
Birimdik
Ala-Too Yntymagy
Chon Kazat
Onuguu-Progress
Kyrgyzstan
Reforma
Zamandash
Mekenim Kyrgyzstan
Yntymak
Ak Bata
Other
Don’t know details about parties/have not yet decided
I would vote “against all”
Would not vote
Don't know/Refused to answer
*Responses receiving <1% are collapsed into Other.
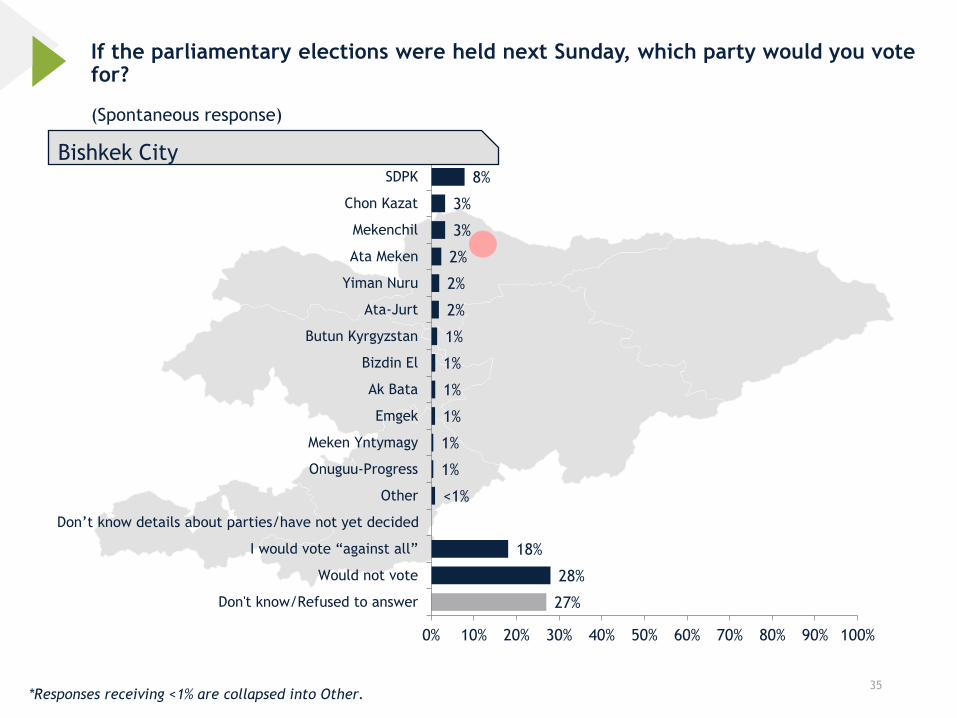
If the parliamentary elections were held next Sunday, which party would you vote for?
35
(Spontaneous response)
8%
3%
3%
2%
2%
2%
1%
1%
1%
1%
1%
1%
<1%
18%
28%
27%
0% 10% 20% 30% 40% 50% 60% 70% 80% 90% 100%
SDPK
Chon Kazat
Mekenchil
Ata Meken
Yiman Nuru
Ata-Jurt
Butun Kyrgyzstan
Bizdin El
Ak Bata
Emgek
Meken Yntymagy
Onuguu-Progress
Other
Don’t know details about parties/have not yet decided
I would vote “against all”
Would not vote
Don't know/Refused to answer
Bishkek City
*Responses receiving <1% are collapsed into Other.
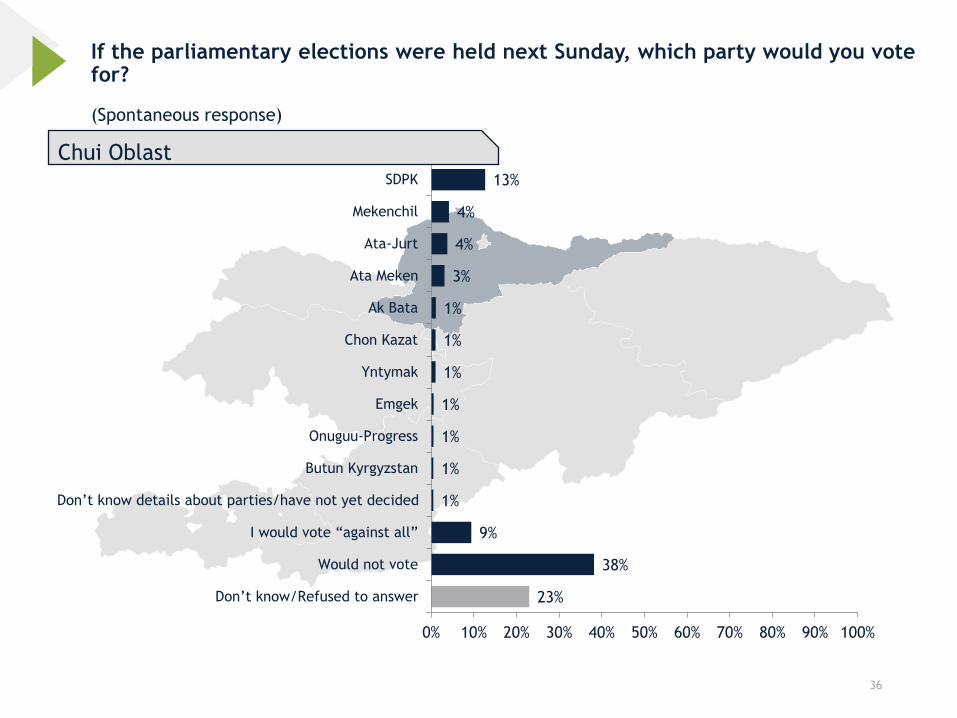
If the parliamentary elections were held next Sunday, which party would you vote for?
36
(Spontaneous response)
13%
4%
4%
3%
1%
1%
1%
1%
1%
1%
1%
9%
38%
23%
0% 10% 20% 30% 40% 50% 60% 70% 80% 90% 100%
SDPK
Mekenchil
Ata-Jurt
Ata Meken
Ak Bata
Chon Kazat
Yntymak
Emgek
Onuguu-Progress
Butun Kyrgyzstan
Don’t know details about parties/have not yet decided
I would vote “against all”
Would not vote
Don’t know/Refused to answer
Chui Oblast
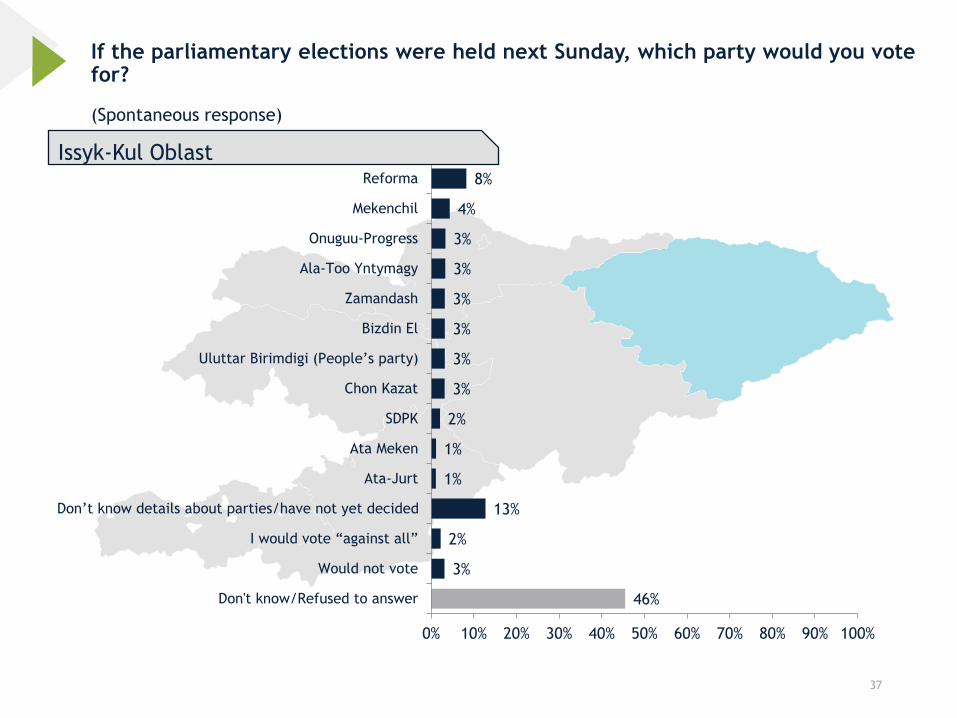
If the parliamentary elections were held next Sunday, which party would you vote for?
37
(Spontaneous response)
8%
4%
3%
3%
3%
3%
3%
3%
2%
1%
1%
13%
2%
3%
46%
0% 10% 20% 30% 40% 50% 60% 70% 80% 90% 100%
Reforma
Mekenchil
Onuguu-Progress
Ala-Too Yntymagy
Zamandash
Bizdin El
Uluttar Birimdigi (People’s party)
Chon Kazat
SDPK
Ata Meken
Ata-Jurt
Don’t know details about parties/have not yet decided
I would vote “against all”
Would not vote
Don't know/Refused to answer
Issyk-Kul Oblast
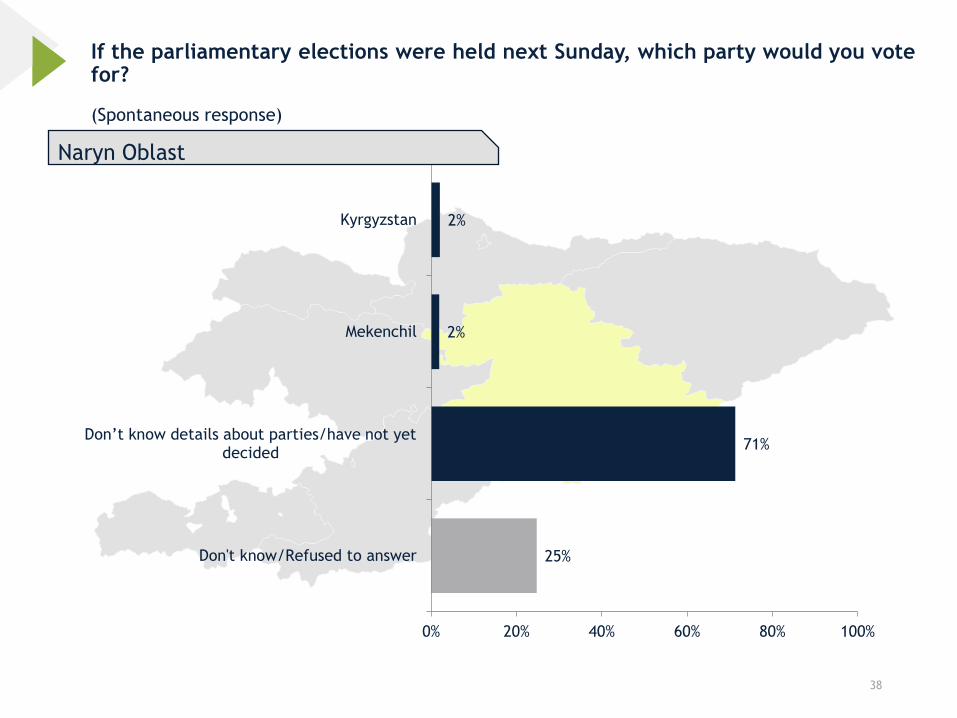
If the parliamentary elections were held next Sunday, which party would you vote for?
38
(Spontaneous response)
2%
2%
71%
25%
0% 20% 40% 60% 80% 100%
Kyrgyzstan
Mekenchil
Don’t know details about parties/have not yet decided
Don't know/Refused to answer
Naryn Oblast
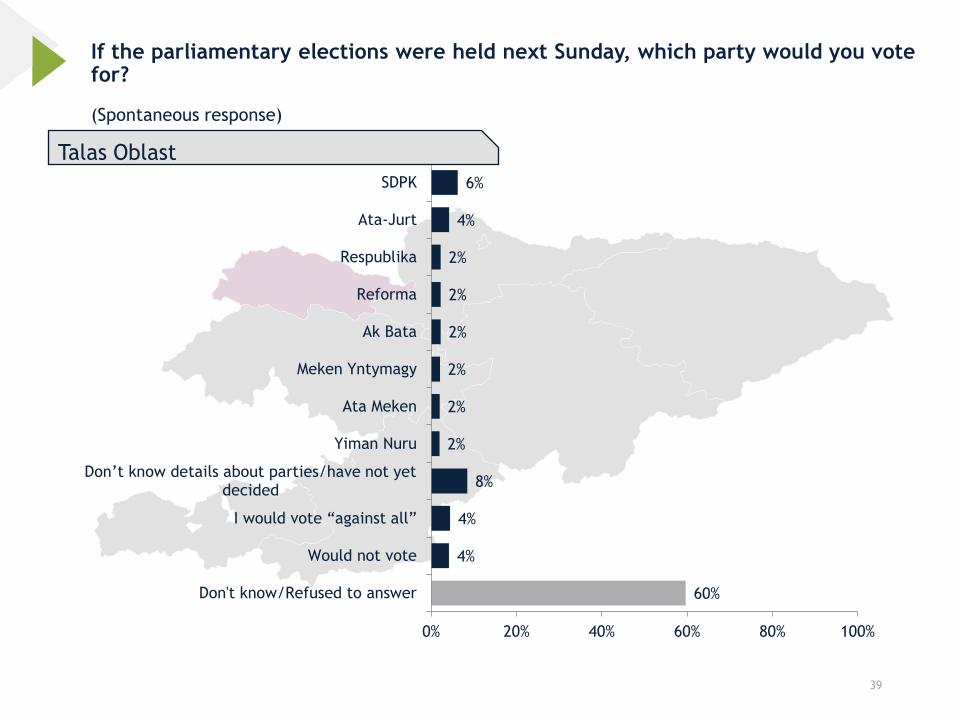
If the parliamentary elections were held next Sunday, which party would you vote for?
39
(Spontaneous response)
6%
4%
2%
2%
2%
2%
2%
2%
8%
4%
4%
60%
0% 20% 40% 60% 80% 100%
SDPK
Ata-Jurt
Respublika
Reforma
Ak Bata
Meken Yntymagy
Ata Meken
Yiman Nuru
Don’t know details about parties/have not yet decided
I would vote “against all”
Would not vote
Don't know/Refused to answer
Talas Oblast
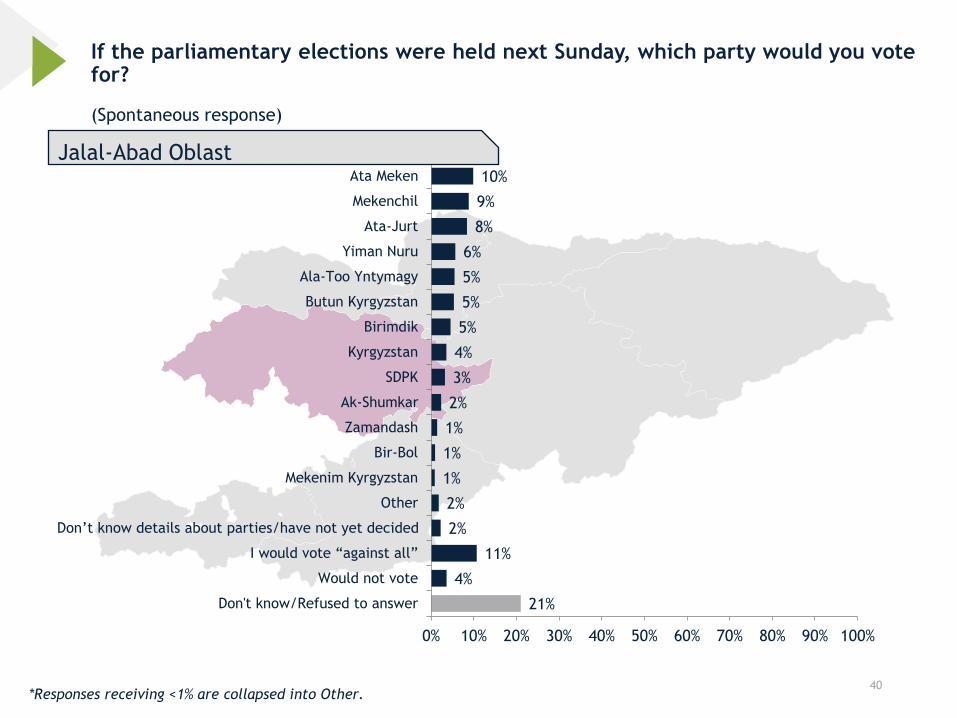
If the parliamentary elections were held next Sunday, which party would you vote for?
40
(Spontaneous response)
10%
9%
8%
6%
5%
5%
5%
4%
3%
2%
1%
1%
1%
2%
2%
11%
4%
21%
0% 10% 20% 30% 40% 50% 60% 70% 80% 90% 100%
Ata Meken
Mekenchil
Ata-Jurt
Yiman Nuru
Ala-Too Yntymagy
Butun Kyrgyzstan
Birimdik
Kyrgyzstan
SDPK
Ak-Shumkar
Zamandash
Bir-Bol
Mekenim Kyrgyzstan
Other
Don’t know details about parties/have not yet decided
I would vote “against all”
Would not vote
Don't know/Refused to answer
Jalal-Abad Oblast
*Responses receiving <1% are collapsed into Other.
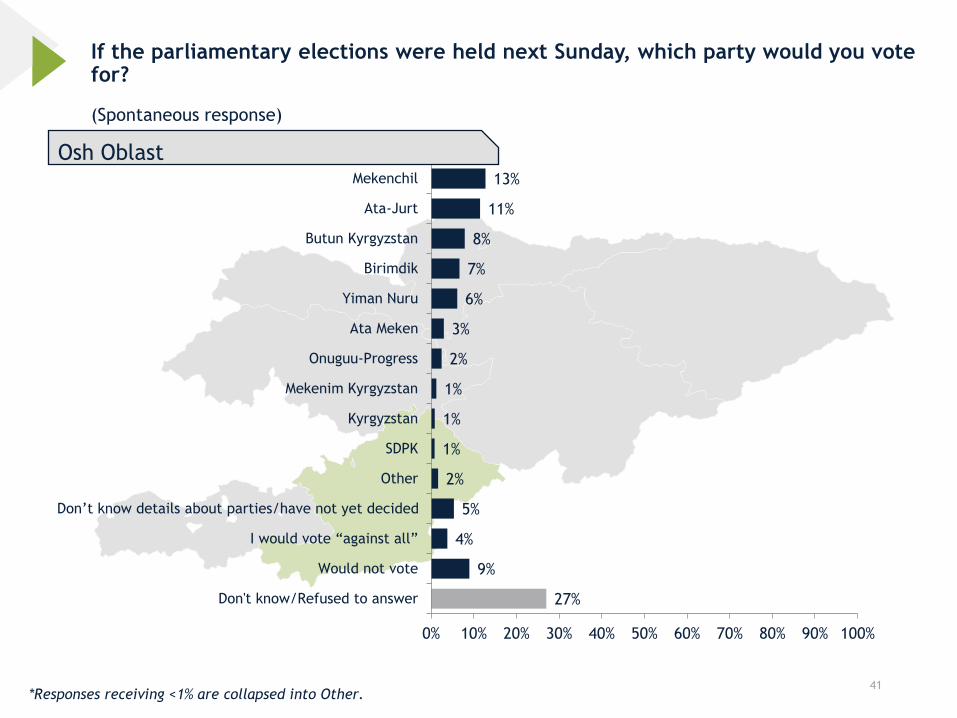
If the parliamentary elections were held next Sunday, which party would you vote for?
41
(Spontaneous response)
13%
11%
8%
7%
6%
3%
2%
1%
1%
1%
2%
5%
4%
9%
27%
0% 10% 20% 30% 40% 50% 60% 70% 80% 90% 100%
Mekenchil
Ata-Jurt
Butun Kyrgyzstan
Birimdik
Yiman Nuru
Ata Meken
Onuguu-Progress
Mekenim Kyrgyzstan
Kyrgyzstan
SDPK
Other
Don’t know details about parties/have not yet decided
I would vote “against all”
Would not vote
Don't know/Refused to answer
Osh Oblast
*Responses receiving <1% are collapsed into Other.
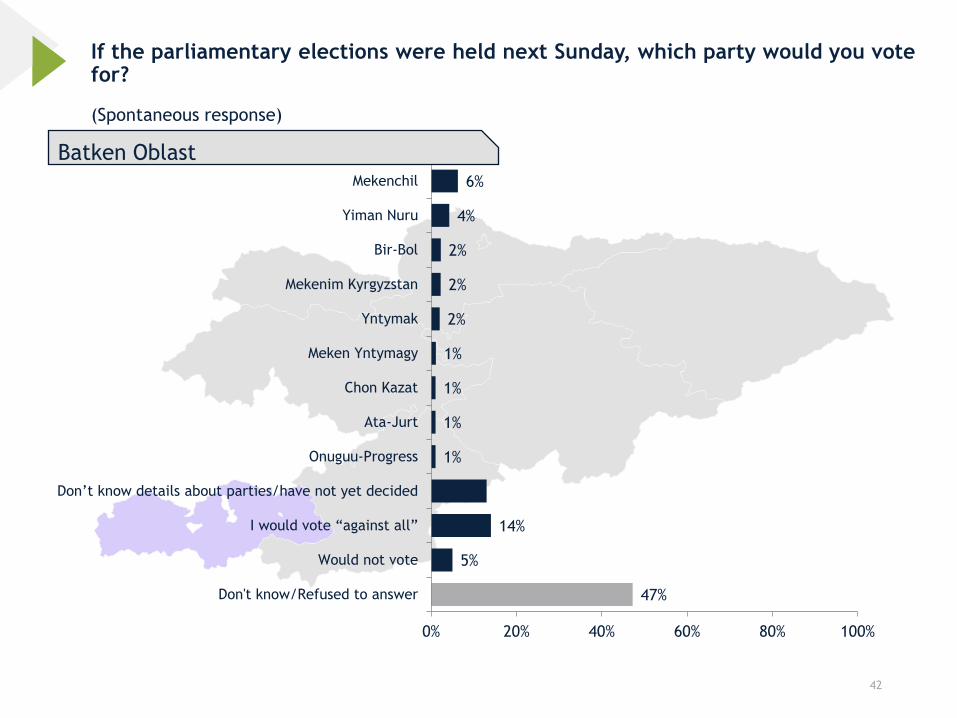
If the parliamentary elections were held next Sunday, which party would you vote for?
42
(Spontaneous response)
6%
4%
2%
2%
2%
1%
1%
1%
1%
14%
5%
47%
0% 20% 40% 60% 80% 100%
Mekenchil
Yiman Nuru
Bir-Bol
Mekenim Kyrgyzstan
Yntymak
Meken Yntymagy
Chon Kazat
Ata-Jurt
Onuguu-Progress
Don’t know details about parties/have not yet decided
I would vote “against all”
Would not vote
Don't know/Refused to answer
Batken Oblast
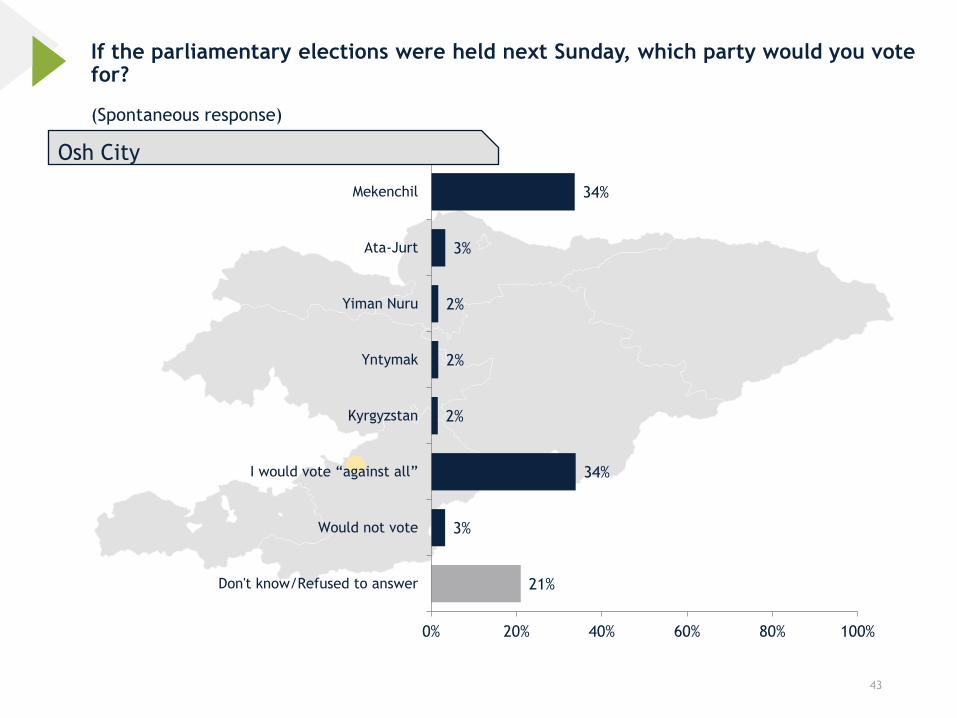
If the parliamentary elections were held next Sunday, which party would you vote for?
43
(Spontaneous response)
34%
3%
2%
2%
2%
34%
3%
21%
0% 20% 40% 60% 80% 100%
Mekenchil
Ata-Jurt
Yiman Nuru
Yntymak
Kyrgyzstan
I would vote “against all”
Would not vote
Don't know/Refused to answer
Osh City

Coronavirus
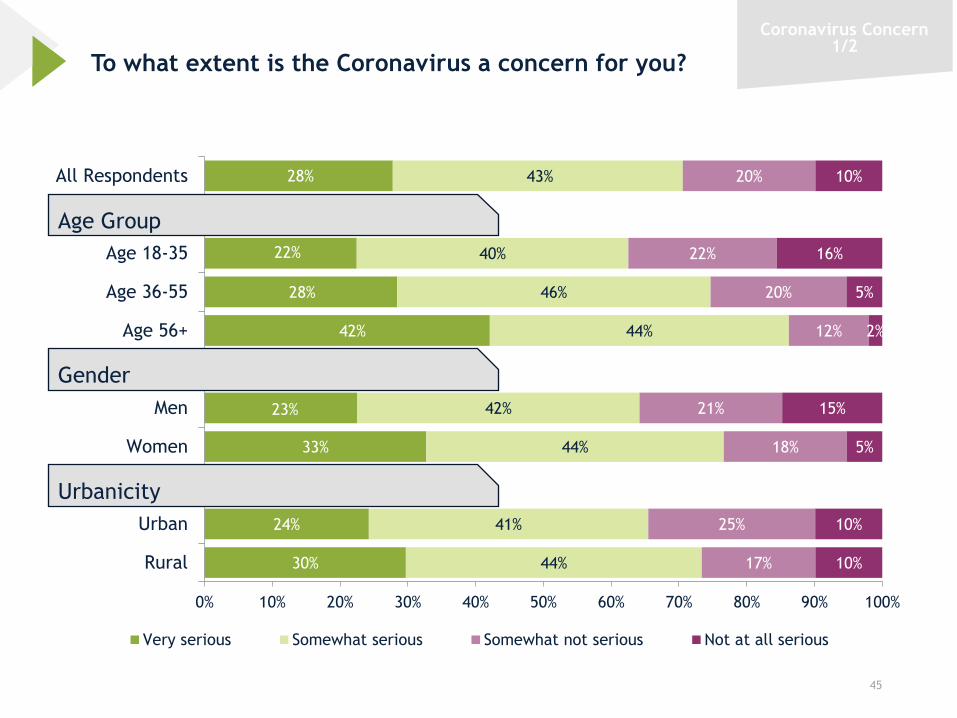
To what extent is the Coronavirus a concern for you?
45
28%
22%
28%
42%
23%
33%
24%
30%
43%
40%
46%
44%
42%
44%
41%
44%
20%
22%
20%
12%
21%
18%
25%
17%
10%
16%
5%
2%
15%
5%
10%
10%
0% 10% 20% 30% 40% 50% 60% 70% 80% 90% 100%
All Respondents
Age 18-35
Age 36-55
Age 56+
Men
Women
Urban
Rural
Very serious Somewhat serious Somewhat not serious Not at all serious
Gender
Age Group
Urbanicity
Coronavirus Concern1/2
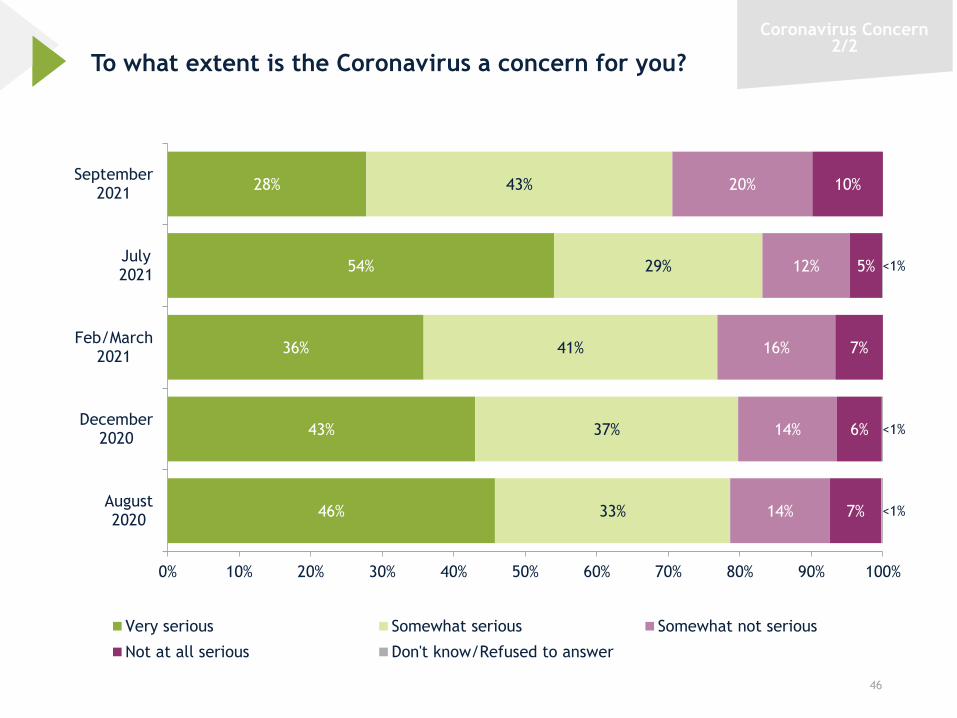
To what extent is the Coronavirus a concern for you?
46
Coronavirus Concern2/2
28%
54%
36%
43%
46%
43%
29%
41%
37%
33%
20%
12%
16%
14%
14%
10%
5%
7%
6%
7%
<1%
<1%
<1%
0% 10% 20% 30% 40% 50% 60% 70% 80% 90% 100%
September2021
July2021
Feb/March2021
December2020
August2020
Very serious Somewhat serious Somewhat not serious
Not at all serious Don't know/Refused to answer
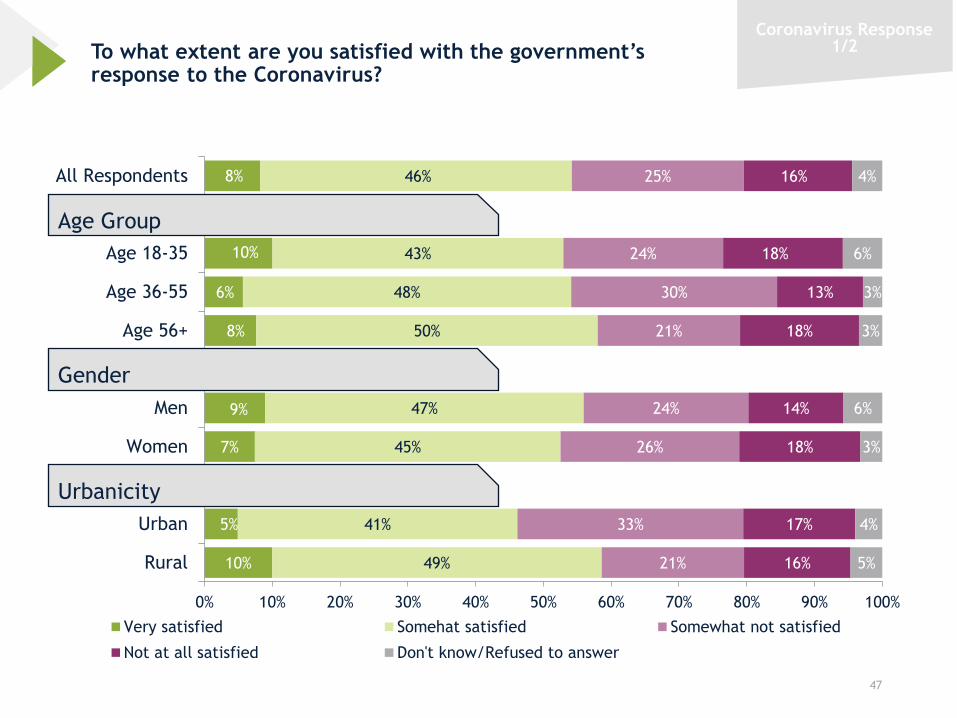
To what extent are you satisfied with the government’s response to the Coronavirus?
47
8%
10%
6%
8%
9%
7%
5%
10%
46%
43%
48%
50%
47%
45%
41%
49%
25%
24%
30%
21%
24%
26%
33%
21%
16%
18%
13%
18%
14%
18%
17%
16%
4%
6%
3%
3%
6%
3%
4%
5%
0% 10% 20% 30% 40% 50% 60% 70% 80% 90% 100%
All Respondents
Age 18-35
Age 36-55
Age 56+
Men
Women
Urban
Rural
Very satisfied Somehat satisfied Somewhat not satisfied
Not at all satisfied Don't know/Refused to answer
Gender
Age Group
Urbanicity
Coronavirus Response1/2
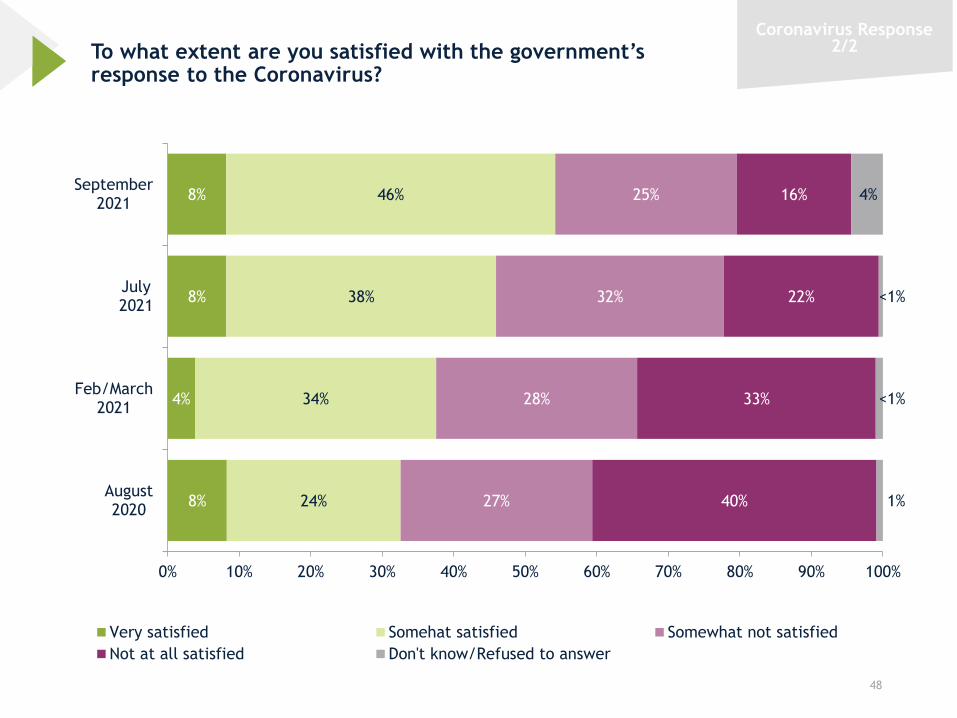
To what extent are you satisfied with the government’s response to the Coronavirus?
48
Coronavirus Response2/2
8%
8%
4%
8%
46%
38%
34%
24%
25%
32%
28%
27%
16%
22%
33%
40%
4%
<1%
<1%
1%
0% 10% 20% 30% 40% 50% 60% 70% 80% 90% 100%
September2021
July2021
Feb/March2021
August2020
Very satisfied Somehat satisfied Somewhat not satisfied
Not at all satisfied Don't know/Refused to answer
Foreign Relations
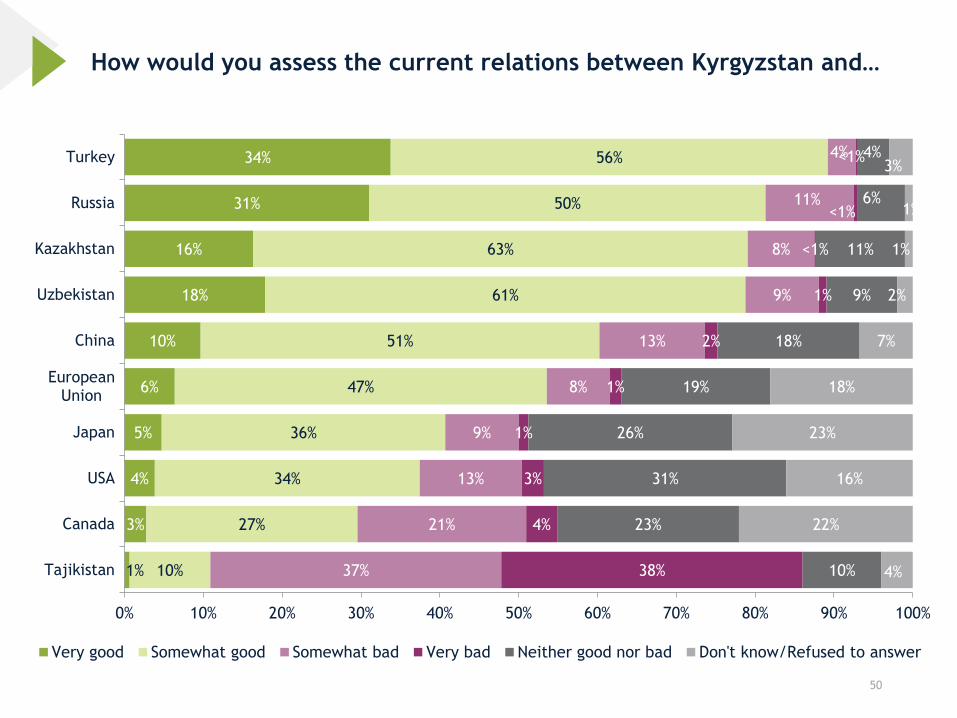
How would you assess the current relations between Kyrgyzstan and…
50
34%
31%
16%
18%
10%
6%
5%
4%
3%
1%
56%
50%
63%
61%
51%
47%
36%
34%
27%
10%
4%
11%
8%
9%
13%
8%
9%
13%
21%
37%
<1%
<1%
<1%
1%
2%
1%
1%
3%
4%
38%
4%
6%
11%
9%
18%
19%
26%
31%
23%
10%
3%
1%
1%
2%
7%
18%
23%
16%
22%
4%
0% 10% 20% 30% 40% 50% 60% 70% 80% 90% 100%
Turkey
Russia
Kazakhstan
Uzbekistan
China
EuropeanUnion
Japan
USA
Canada
Tajikistan
Very good Somewhat good Somewhat bad Very bad Neither good nor bad Don't know/Refused to answer
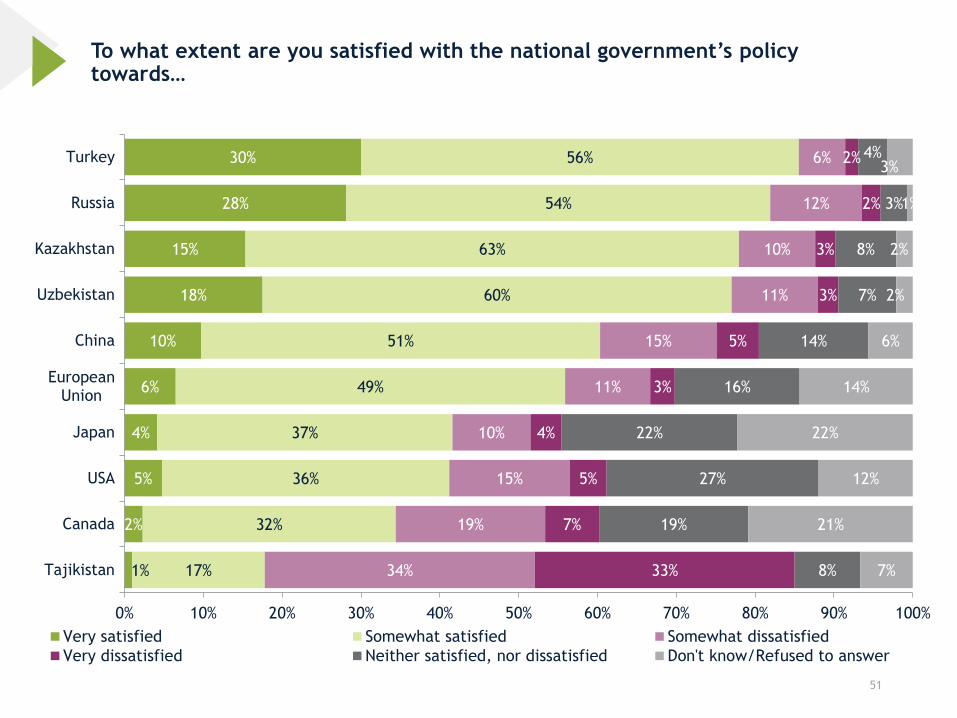
To what extent are you satisfied with the national government’s policy towards…
51
30%
28%
15%
18%
10%
6%
4%
5%
2%
1%
56%
54%
63%
60%
51%
49%
37%
36%
32%
17%
6%
12%
10%
11%
15%
11%
10%
15%
19%
34%
2%
2%
3%
3%
5%
3%
4%
5%
7%
33%
4%
3%
8%
7%
14%
16%
22%
27%
19%
8%
3%
1%
2%
2%
6%
14%
22%
12%
21%
7%
0% 10% 20% 30% 40% 50% 60% 70% 80% 90% 100%
Turkey
Russia
Kazakhstan
Uzbekistan
China
EuropeanUnion
Japan
USA
Canada
Tajikistan
Very satisfied Somewhat satisfied Somewhat dissatisfied
Very dissatisfied Neither satisfied, nor dissatisfied Don't know/Refused to answer
This Photo by Unknown author is licensed under CC BY-SA-NC.
Demographics
53
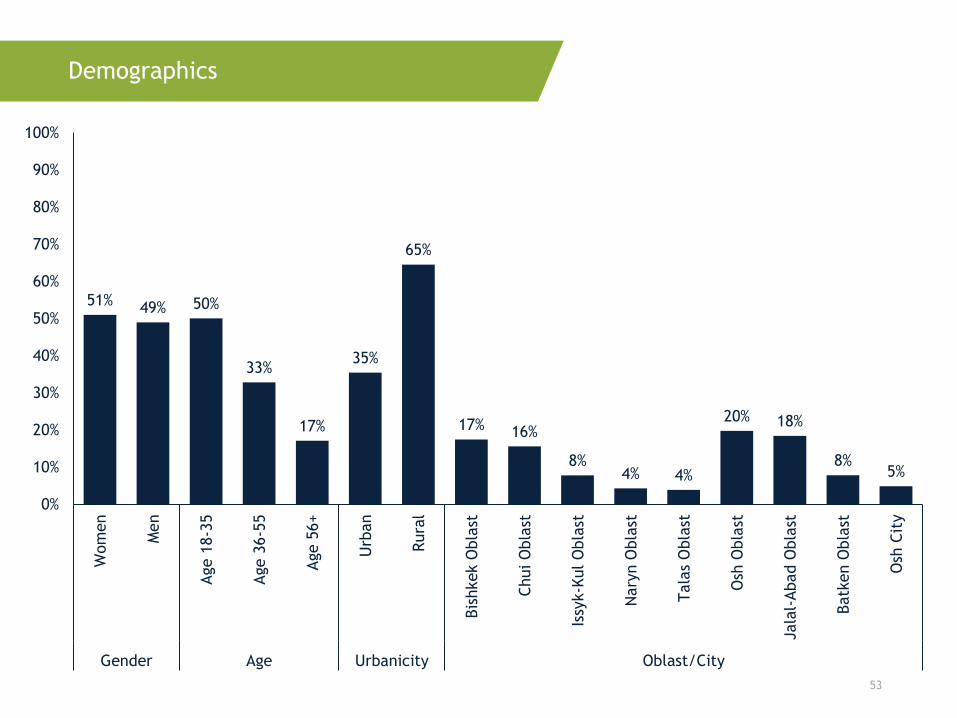
Demographics
51% 49% 50%
33%
17%
35%
65%
17% 16%
8%4% 4%
20% 18%
8%5%
0%
10%
20%
30%
40%
50%
60%
70%
80%
90%
100%
Wom
en
Men
Age 1
8-3
5
Age 3
6-5
5
Age 5
6+
Urb
an
Rura
l
Bis
hkek O
bla
st
Chui O
bla
st
Issy
k-K
ul O
bla
st
Nary
n O
bla
st
Tala
s O
bla
st
Osh
Obla
st
Jala
l-Abad O
bla
st
Batk
en O
bla
st
Osh
Cit
y
Gender Age Urbanicity Oblast/City
54
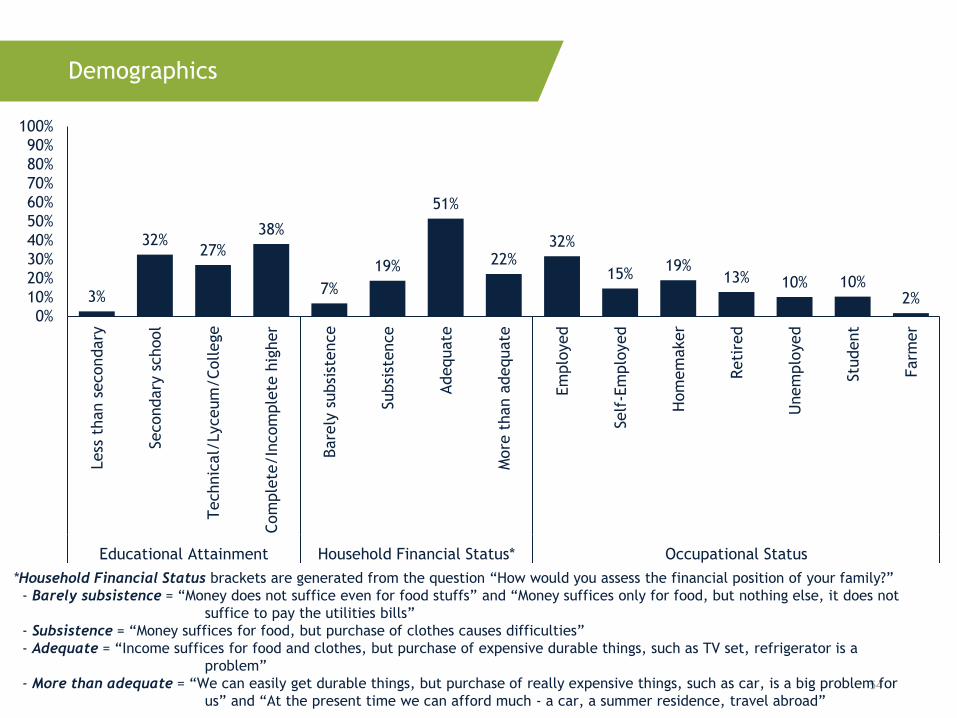
Demographics
3%
32%27%
38%
7%
19%
51%
22%32%
15%19%
13% 10% 10%2%
0%
10%
20%
30%
40%
50%
60%
70%
80%
90%
100%
Less
than s
econdary
Secondary
school
Technic
al/
Lyceum
/College
Com
ple
te/In
com
ple
te h
igher
Bare
ly s
ubsi
stence
Subsi
stence
Adequate
More
than a
dequate
Em
plo
yed
Self
-Em
plo
yed
Hom
em
aker
Reti
red
Unem
plo
yed
Stu
dent
Farm
er
Educational Attainment Household Financial Status* Occupational Status
*Household Financial Status brackets are generated from the question “How would you assess the financial position of your family?”
- Barely subsistence = “Money does not suffice even for food stuffs” and “Money suffices only for food, but nothing else, it does not
suffice to pay the utilities bills”
- Subsistence = “Money suffices for food, but purchase of clothes causes difficulties”
- Adequate = “Income suffices for food and clothes, but purchase of expensive durable things, such as TV set, refrigerator is a
problem”
- More than adequate = “We can easily get durable things, but purchase of really expensive things, such as car, is a big problem for
us” and “At the present time we can afford much - a car, a summer residence, travel abroad”
55
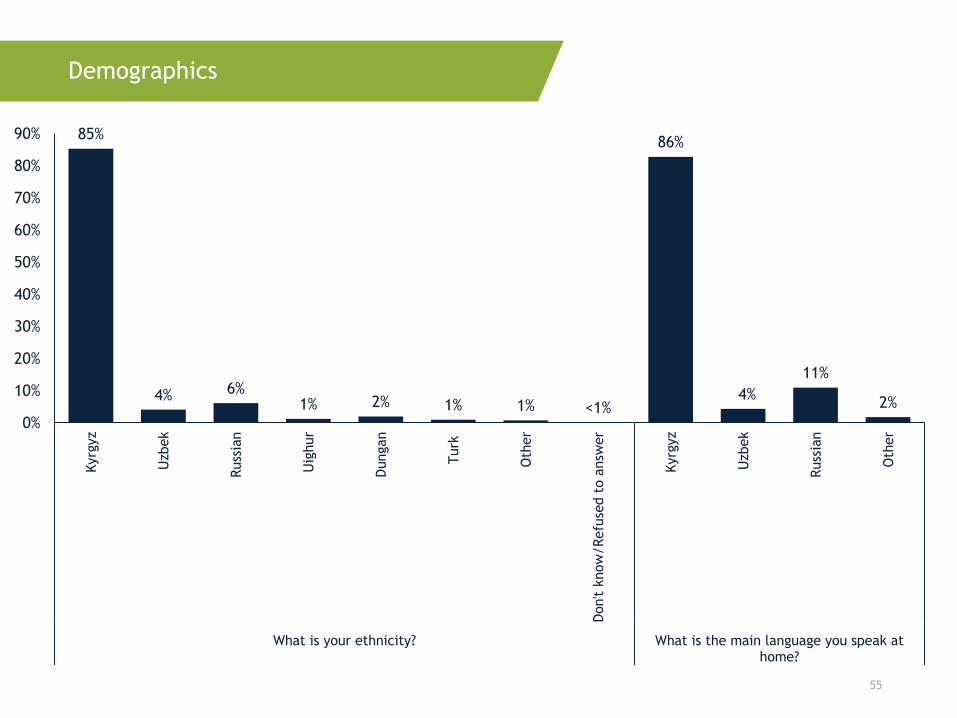
Demographics
85%
4% 6%1% 2% 1% 1% <1%
86%
4%
11%
2%
0%
10%
20%
30%
40%
50%
60%
70%
80%
90%
Kyrg
yz
Uzb
ek
Russ
ian
Uig
hur
Dungan
Turk
Oth
er
Don't k
now
/Refu
sed t
o a
nsw
er
Kyrg
yz
Uzb
ek
Russ
ian
Oth
er
What is your ethnicity? What is the main language you speak athome?
Pollster logo here; Height=1.67”;Hyperlink to website
Center for Insights in Survey Research
202.408.9450 | [email protected]
www.IRI.org | @IRI_Polls
Pollster logo here; Height=1.67”;Hyperlink to website