National Homeland Security Research Center
41
Overview of US EPA Homeland Security Research Program Stormwater Modeling Studies EPA Office of Research and Development Homeland Security Research Program Anne Mikelonis, Ph.D., P.E. Environmental Engineer Katherine Ratliff, Ph.D. Physical Scientist ACWA Modeling Webinar April 28 th , 2020 1
Transcript of National Homeland Security Research Center

Overview of US EPA Homeland Security Research Program Stormwater Modeling Studies
EPA Office of Research and Development
Homeland Security Research Program
Anne Mikelonis, Ph.D., P.E.Environmental Engineer
Katherine Ratliff, Ph.D.Physical Scientist
ACWA Modeling WebinarApril 28th, 2020
1

Office of the Administrator
Regions 1 –10
response
Land and Emergency Management
guidance, response support
Air & Radiation
guidance, response support
(rad)
Research & Development
Chemical Safety and Pollution
Prevention
anti-microbials
Water
drinking water, wastewater
Homeland Security
coordination
EPA’s Homeland Security Enterprise (simplified)
2
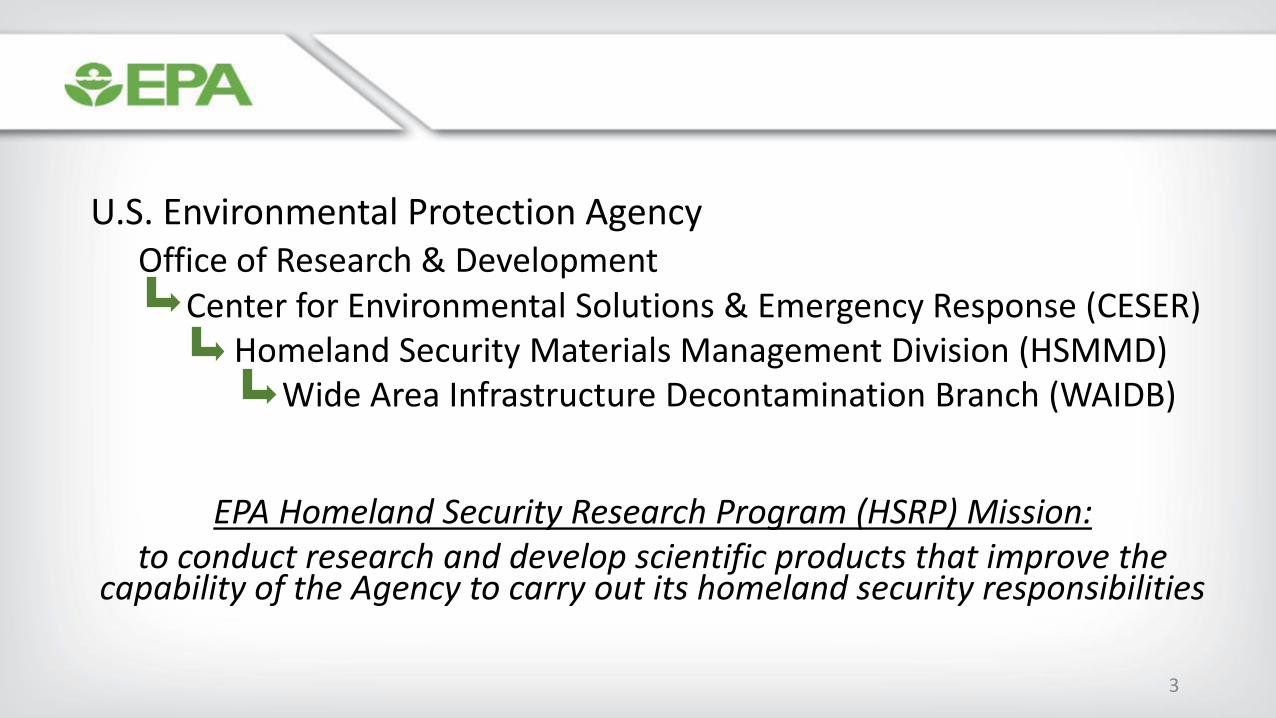
U.S. Environmental Protection AgencyOffice of Research & Development
Center for Environmental Solutions & Emergency Response (CESER)Homeland Security Materials Management Division (HSMMD)
Wide Area Infrastructure Decontamination Branch (WAIDB)
EPA Homeland Security Research Program (HSRP) Mission:to conduct research and develop scientific products that improve the
capability of the Agency to carry out its homeland security responsibilities
3
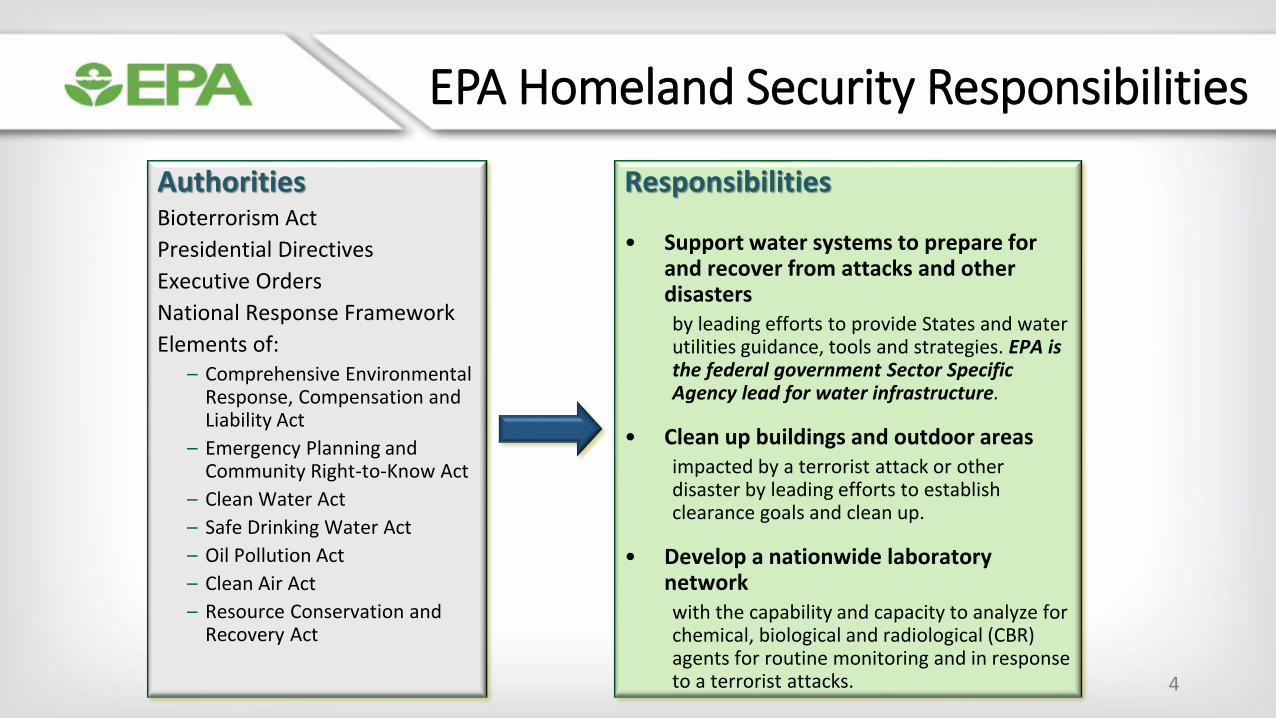
EPA Homeland Security Responsibilities
AuthoritiesBioterrorism Act
Presidential Directives
Executive Orders
National Response Framework
Elements of:– Comprehensive Environmental
Response, Compensation and Liability Act
– Emergency Planning and Community Right-to-Know Act
– Clean Water Act
– Safe Drinking Water Act
– Oil Pollution Act
– Clean Air Act
– Resource Conservation and Recovery Act
Responsibilities
• Support water systems to prepare for and recover from attacks and other disasters by leading efforts to provide States and water utilities guidance, tools and strategies. EPA is the federal government Sector Specific Agency lead for water infrastructure.
• Clean up buildings and outdoor areasimpacted by a terrorist attack or other disaster by leading efforts to establish clearance goals and clean up.
• Develop a nationwide laboratory networkwith the capability and capacity to analyze for chemical, biological and radiological (CBR) agents for routine monitoring and in response to a terrorist attacks. 4

Fate & Transport Modeling
▪Goal: to better understand impacts of wet weather and human intervention (e.g., power washing) on fate & transport of particulate contaminants (e.g., spores, radionuclides) in urban areas
▪ Challenges:– Contamination can be hard to detect
– Dynamic systems (rain, wind, human and vehicle traffic)
– Incidents may take years to remediate
Sanial et al.,
2017 PNAS
Fukushima Dai-ichi
Nuclear Power Plant
137Cs
Amerithrax
incident
response
https://media.npr.org/assets/img/2011/02/15/anthrax-haz-mat_wide-d15256c9a2b55ef63fd426ccbd3decec9e5c3dad-s700-c85.jpg
5
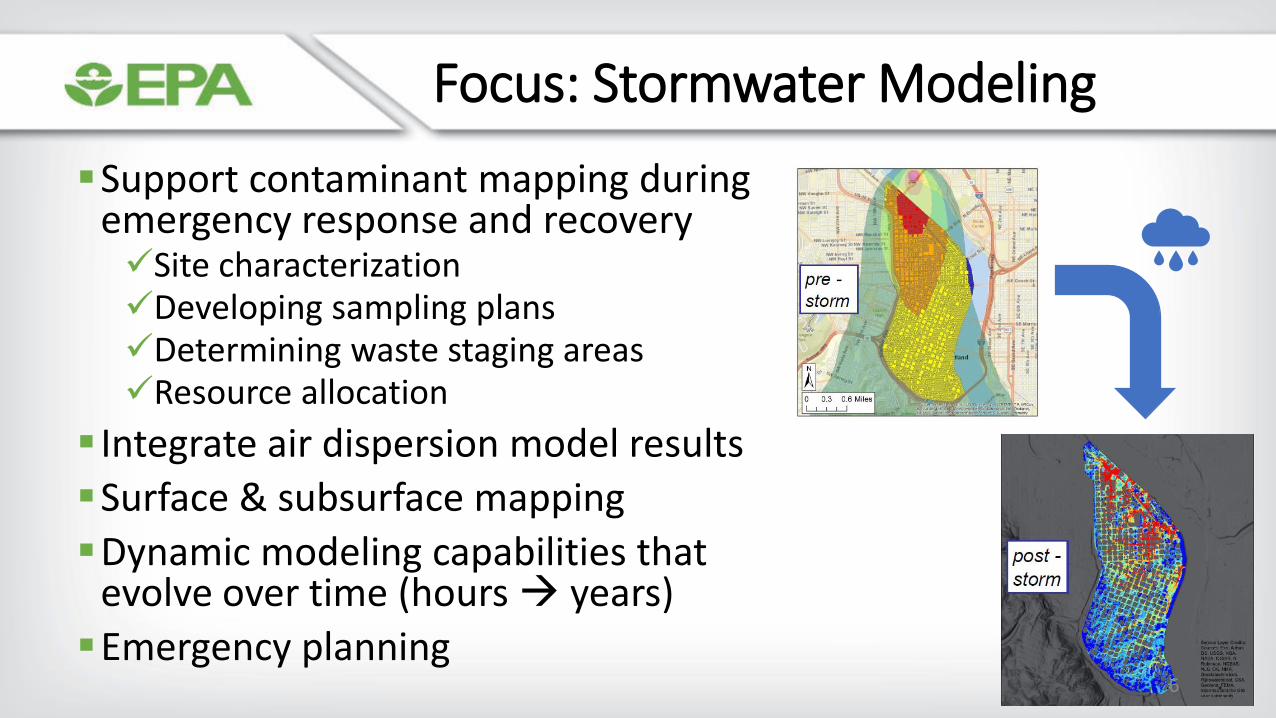
Focus: Stormwater Modeling
▪Support contaminant mapping during emergency response and recovery✓Site characterization✓Developing sampling plans✓Determining waste staging areas✓Resource allocation
▪ Integrate air dispersion model results
▪Surface & subsurface mapping
▪Dynamic modeling capabilities that evolve over time (hours → years)
▪Emergency planning6

Adapting SWMM for HSRP Needs
▪US EPA SWMM5 engine selected after comprehensive model survey (EPA Report: EPA/600/R-18/282)
▪Need additional functionality for pollutant tracking and control
– Open Water Analytics SWMM5 API & PySWMM Python wrapper
– pyswmm.readthedocs.org
SWMM5 Graphical User Interface
https://github.com/OpenWaterAnalytics
7
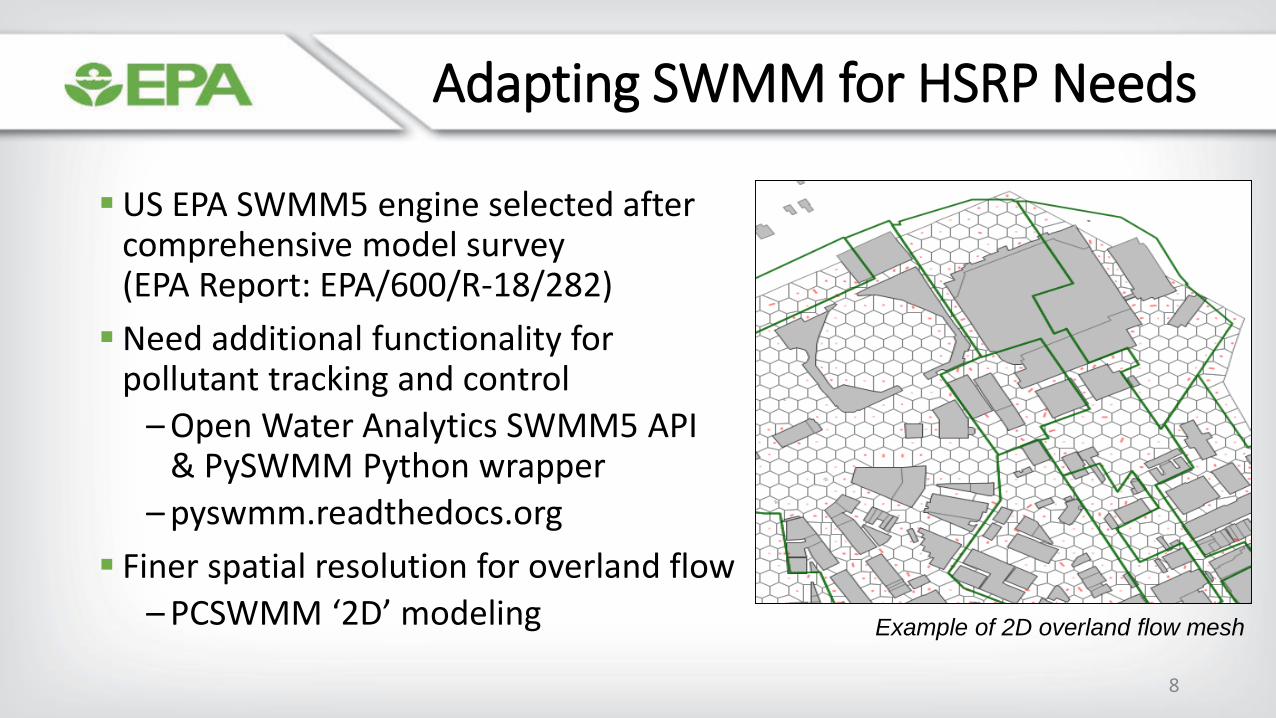
Adapting SWMM for HSRP Needs
▪US EPA SWMM5 engine selected after comprehensive model survey (EPA Report: EPA/600/R-18/282)
▪Need additional functionality for pollutant tracking and control
– Open Water Analytics SWMM5 API & PySWMM Python wrapper
– pyswmm.readthedocs.org
▪ Finer spatial resolution for overland flow
– PCSWMM ‘2D’ modeling Example of 2D overland flow mesh
8

Case Study: Portland Asbestos Fire
9
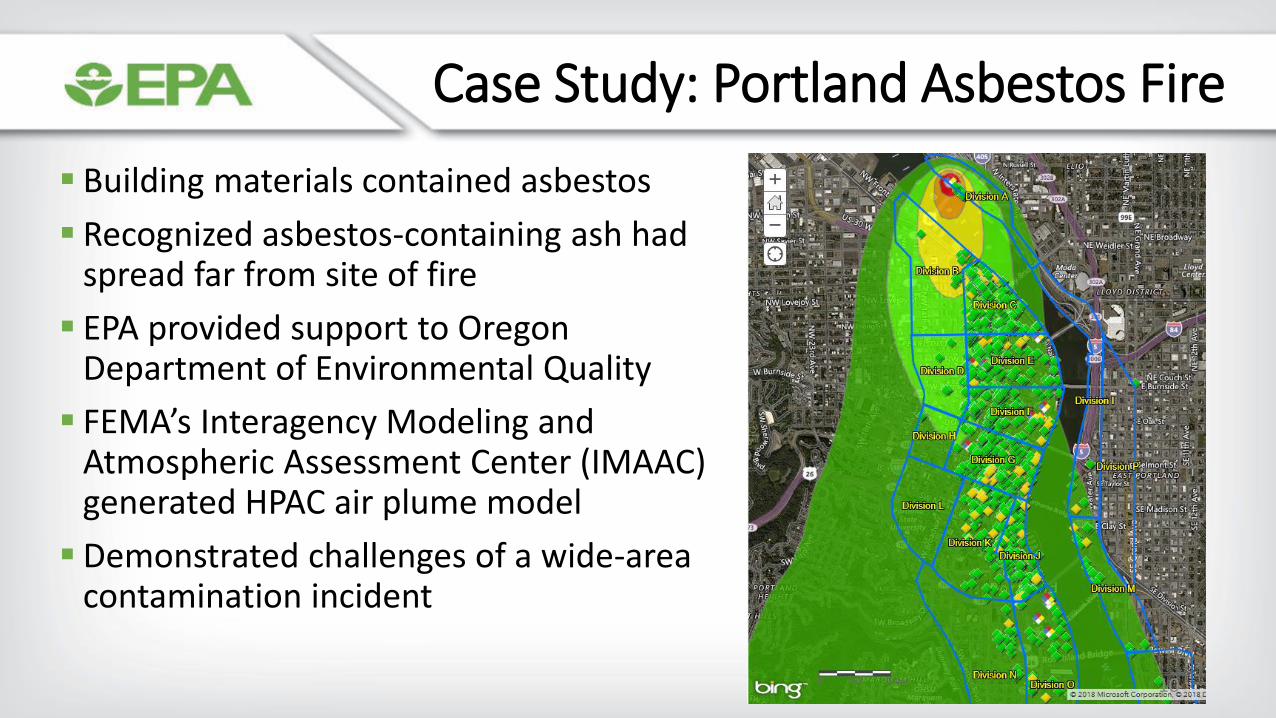
Case Study: Portland Asbestos Fire
▪ Building materials contained asbestos
▪ Recognized asbestos-containing ash had spread far from site of fire
▪ EPA provided support to Oregon Department of Environmental Quality
▪ FEMA’s Interagency Modeling and Atmospheric Assessment Center (IMAAC) generated HPAC air plume model
▪ Demonstrated challenges of a wide-area contamination incident
10

Developing Overland Flow Model
▪Define model boundary
▪Cell shape/resolution
▪GIS data needed:✓land use/land cover
✓building footprints
✓roads
✓critical infrastructure
▪Digital elevation model
▪Washoff equations and parameterization
112D model cell elevations
Sources: Esri, HERE, Garmin, USGS, Intermap, INCREMENT P,
NRCan, Esri Japan, METI, Esri China (Hong Kong), Esri Korea,Esri (Thailand), NGCC, © OpenStreetMap contributors, and theGIS User Community
Land Use
No Data
Water
Impervious surface
Soil and barren
Trees and forest
Grass and herbaceous
Agriculture
Woody wetlands
Emergent wetlands
EnviroAtlas meter-
scale land use data
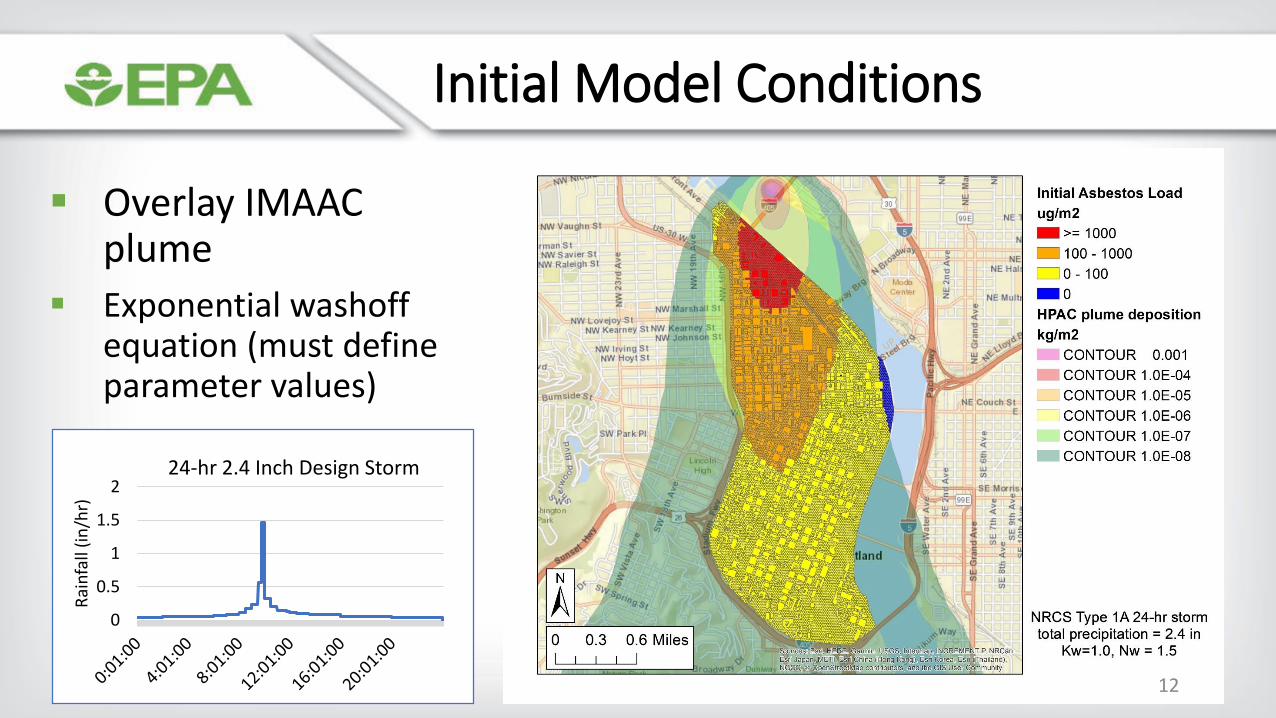
Initial Model Conditions
12
▪ Overlay IMAAC plume
▪ Exponential washoff equation (must define parameter values)
0
0.5
1
1.5
2
Rai
nfa
ll (i
n/h
r)
24-hr 2.4 Inch Design Storm

Surface Contamination
13
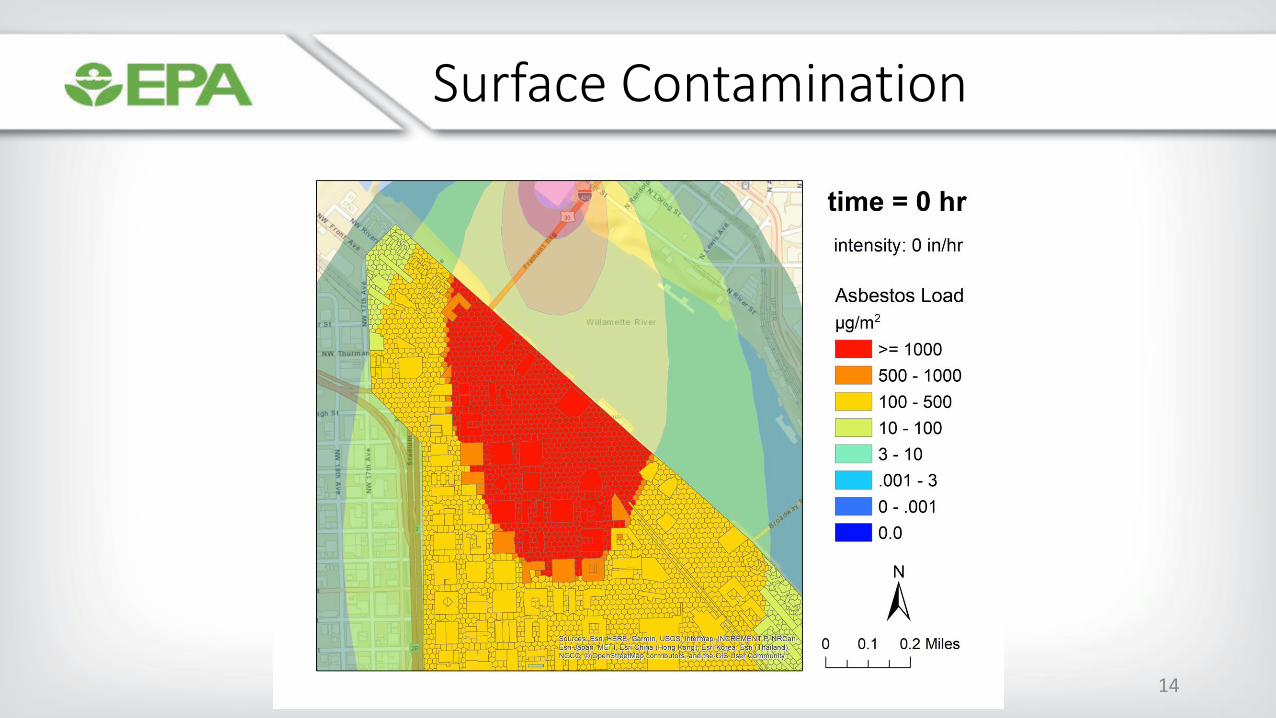
Surface Contamination
14

Overland Flow Contamination
15

Planning for Response & Recovery
16
▪ Combine contamination maps with additional data for planning and prioritization✓Population data

17
▪ Combine contamination maps with additional data for planning and prioritization✓Population data
✓Critical facilities
▪ Dynamic, flexible support that can evolve over time
▪ Model different clean up scenarios and strategies
Planning for Response & Recovery
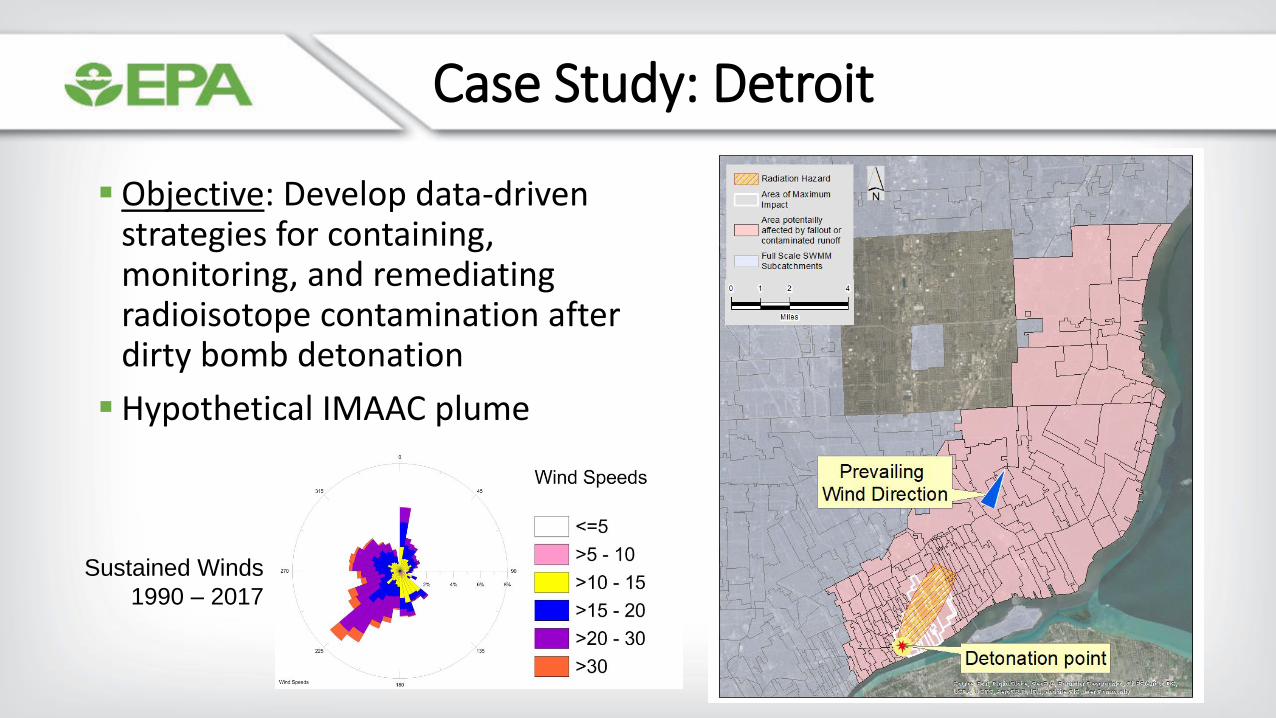
Case Study: Detroit
▪Objective: Develop data-driven strategies for containing, monitoring, and remediating radioisotope contamination after dirty bomb detonation
▪Hypothetical IMAAC plume
18
Sustained Winds
1990 – 2017

19
Building the 2D Model
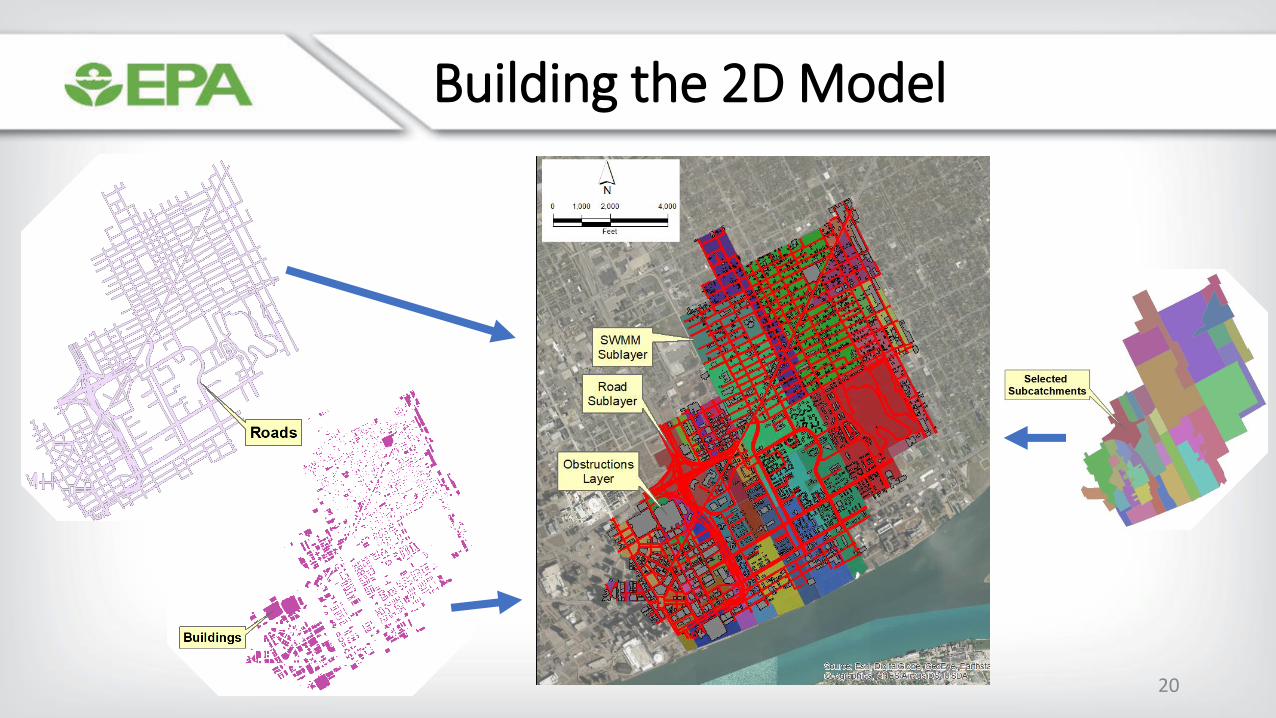
Building the 2D Model
20
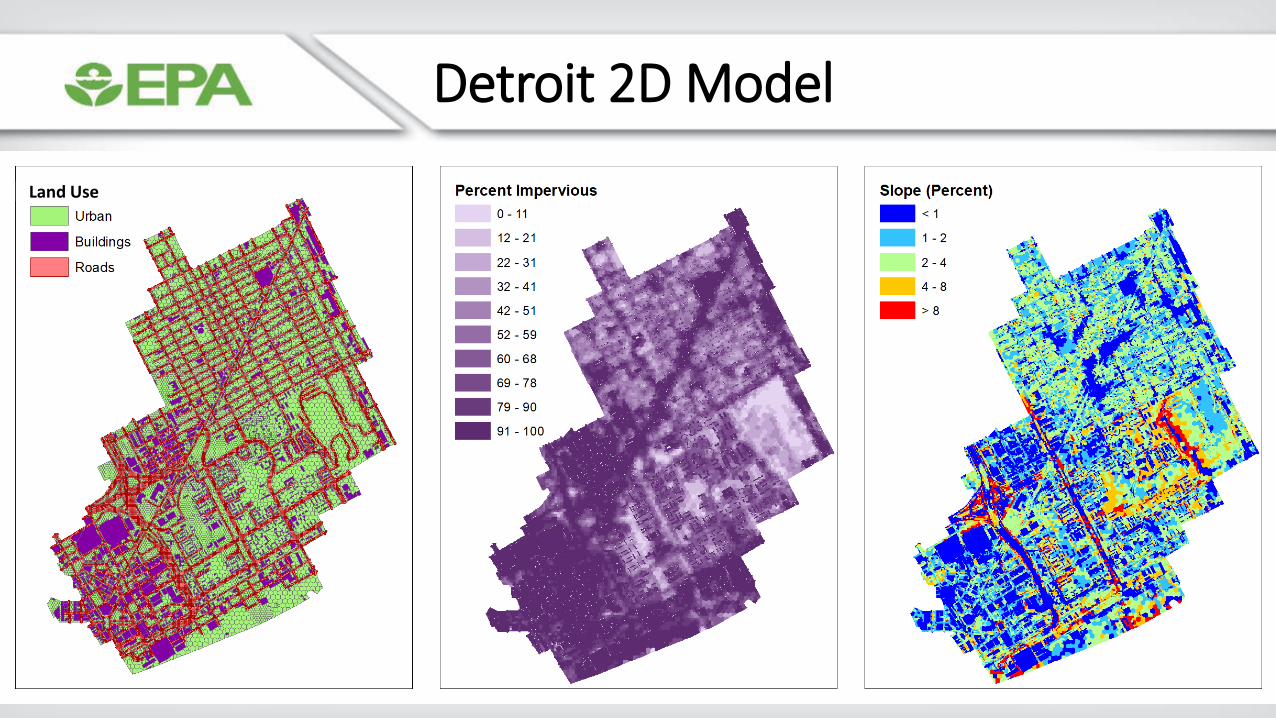
Detroit 2D Model
21
Land Use

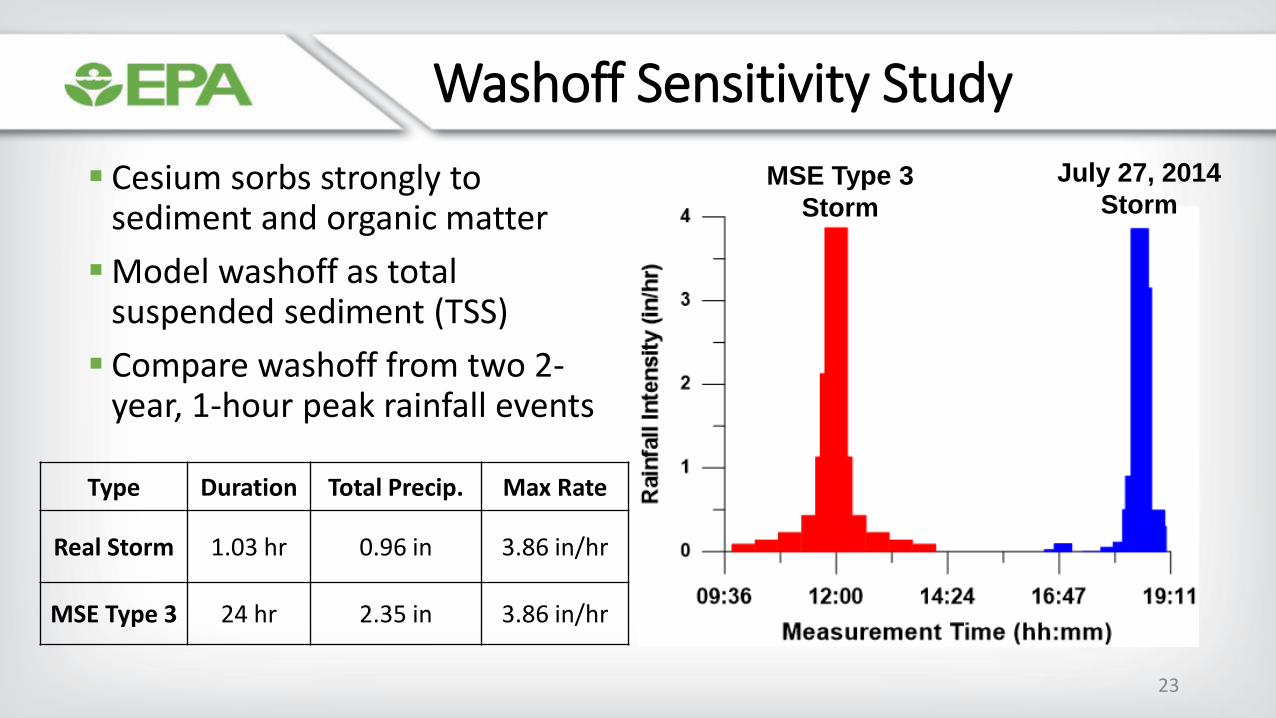
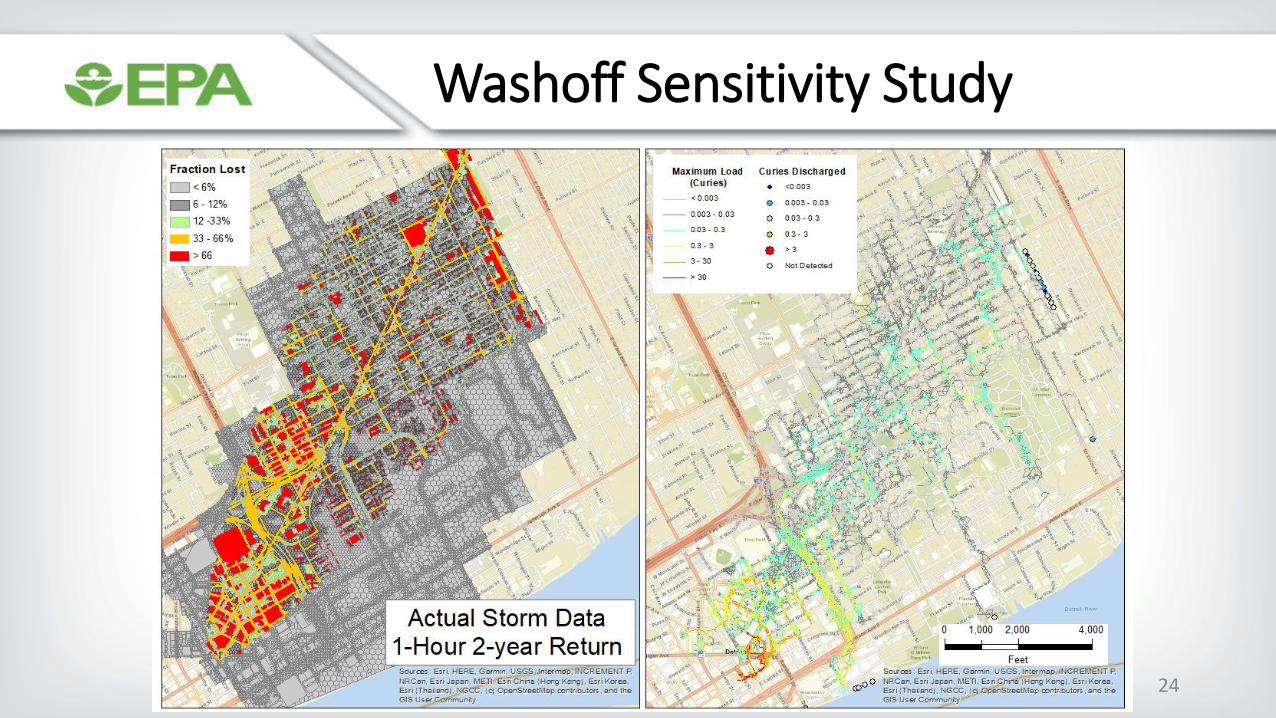
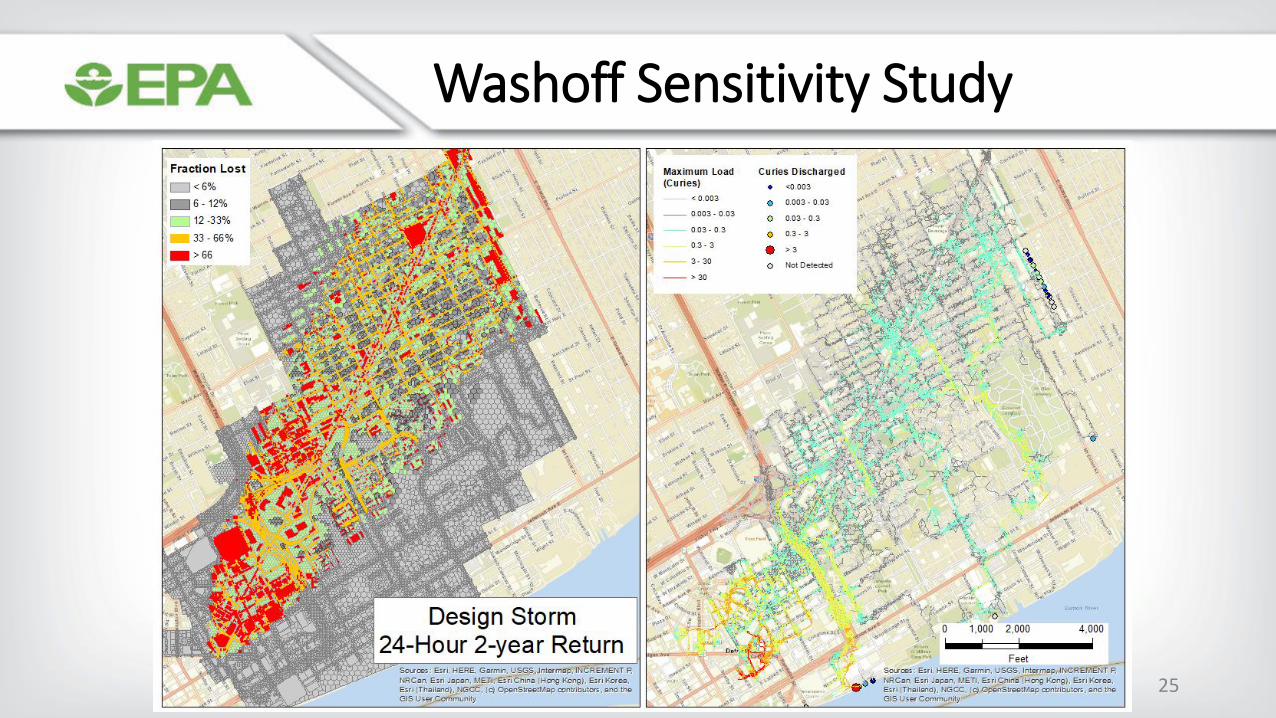
Washoff Sensitivity Study
▪ Cesium sorbs strongly to sediment and organic matter
▪Model washoff as total suspended sediment (TSS)
22
ParameterLand Use Types
Building Road Urban
Kw 2.45 0.56 0.13
Nw 1.25 1.23 1.20
w = washoff load (mass/hr)mB = remaining buildup (kg)q = runoff rate (in/hr)Kw = washoff coefficient (in-1)Nw = washoff exponent
Washoff Sensitivity Study
▪ Cesium sorbs strongly to sediment and organic matter
▪Model washoff as total suspended sediment (TSS)
▪ Compare washoff from two 2-year, 1-hour peak rainfall events
23
MSE Type 3
Storm
July 27, 2014
Storm
Type Duration Total Precip. Max Rate
Real Storm 1.03 hr 0.96 in 3.86 in/hr
MSE Type 3 24 hr 2.35 in 3.86 in/hr
24
Washoff Sensitivity Study
25
Washoff Sensitivity Study

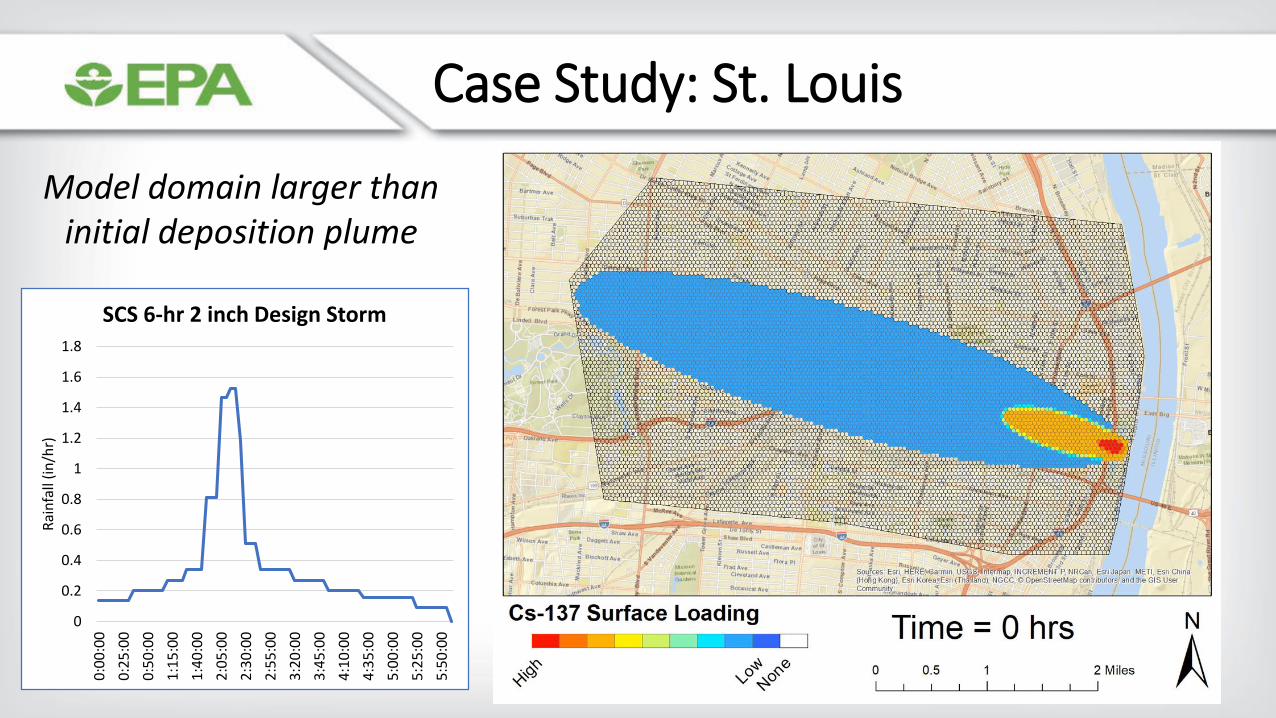
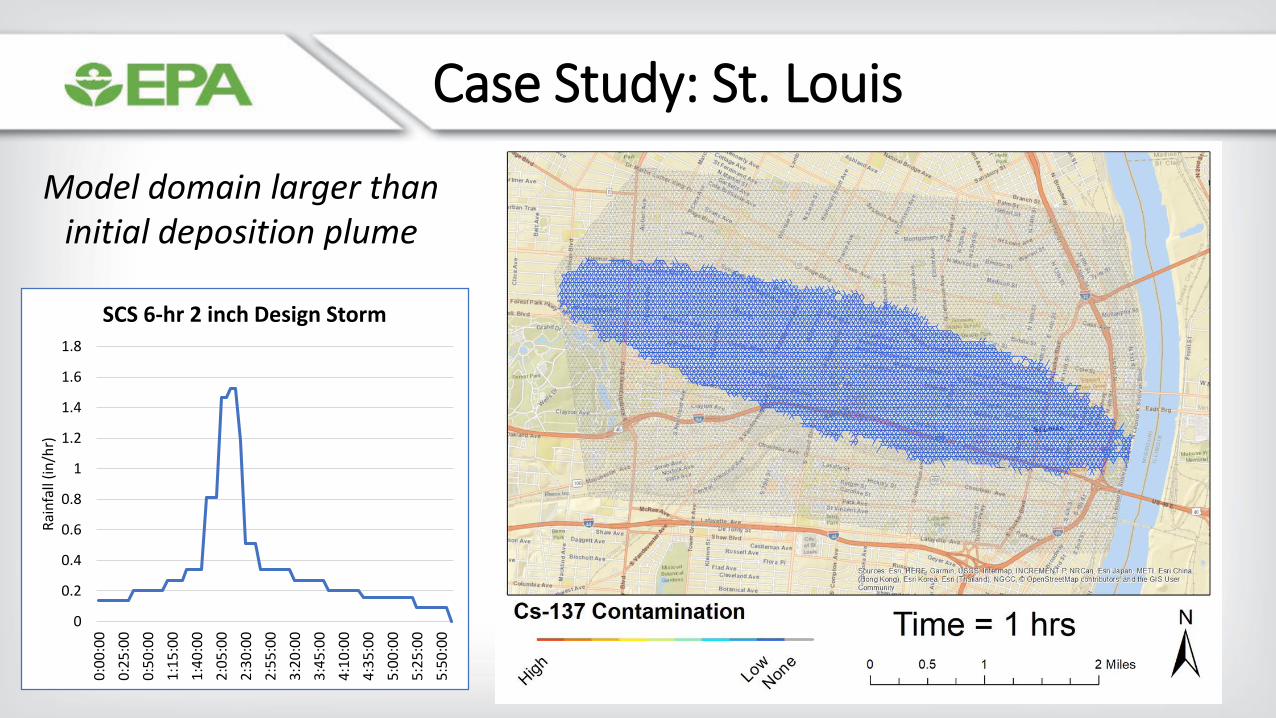
Case Study: St. Louis
26
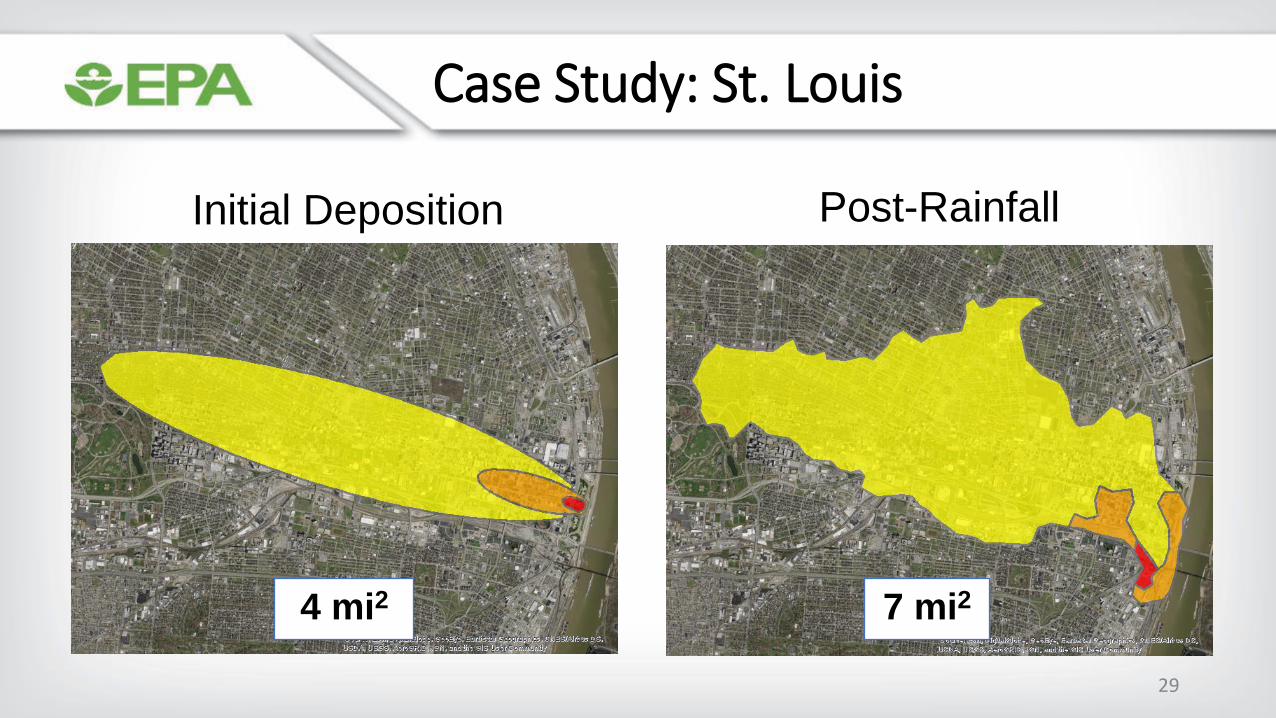
▪ Large-scale hypothetical radiological incident resulting from a radiological dispersal device (RDD)
▪ RDD contained 2,300 curies of cesium-137 (as cesium chloride)
▪ Dispersed over approximately 4 square miles via a 3,000 lb truck bomb
Case Study: St. Louis
27
0
0.2
0.4
0.6
0.8
1
1.2
1.4
1.6
1.8
0:0
0:0
0
0:2
5:0
0
0:5
0:0
0
1:1
5:0
0
1:4
0:0
0
2:0
5:0
0
2:3
0:0
0
2:5
5:0
0
3:2
0:0
0
3:4
5:0
0
4:1
0:0
0
4:3
5:0
0
5:0
0:0
0
5:2
5:0
0
5:5
0:0
0
Rai
nfa
ll (i
n/h
r)
SCS 6-hr 2 inch Design Storm
Model domain larger than initial deposition plume
Case Study: St. Louis
28
0
0.2
0.4
0.6
0.8
1
1.2
1.4
1.6
1.8
0:0
0:0
0
0:2
5:0
0
0:5
0:0
0
1:1
5:0
0
1:4
0:0
0
2:0
5:0
0
2:3
0:0
0
2:5
5:0
0
3:2
0:0
0
3:4
5:0
0
4:1
0:0
0
4:3
5:0
0
5:0
0:0
0
5:2
5:0
0
5:5
0:0
0
Rai
nfa
ll (i
n/h
r)
SCS 6-hr 2 inch Design Storm
Model domain larger than initial deposition plume
Case Study: St. Louis
29
Initial Deposition Post-Rainfall
4 mi2 7 mi2

Fate & Transport Impacts
▪Waste Estimation Support Tool (WEST) is a GIS-based tool designed to assist in planning and preparedness
▪ Facilitates waste estimates, planning for staging and storage, assessing strategies
30
0.00E+00 2.00E+09 4.00E+09 6.00E+09
Solid Waste Mass
Liquid Waste Mass
Solid Waste Volume
Liquid Waste Volume
Post-rainfall Initial Deposition
Results Units Initial Deposition Post-Rainfall
Solid Waste Mass lb 1.34E+08 2.11E+08
Liquid Waste Mass lb 2.28E+09 4.00E+09
Solid Waste Volume ft3 1.69E+06 2.45E+06
Liquid Waste Volume gal 2.79E+08 4.84E+08
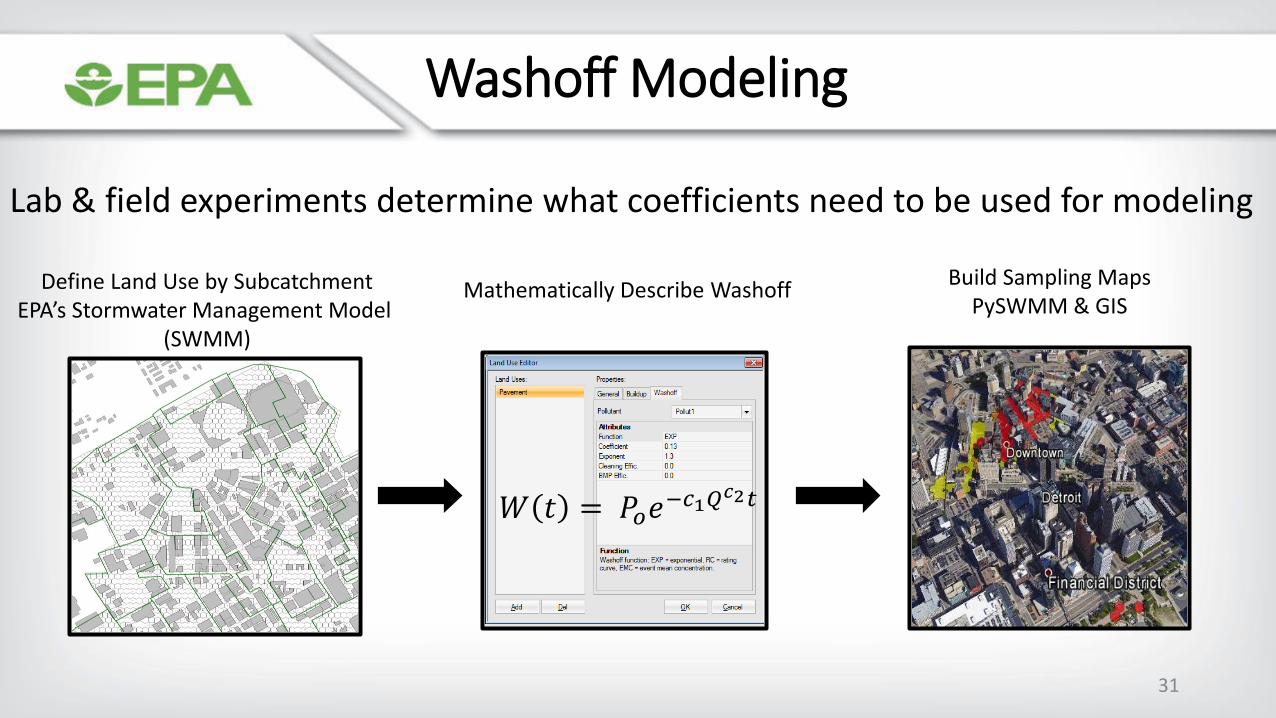
Define Land Use by SubcatchmentEPA’s Stormwater Management Model
(SWMM)
Mathematically Describe Washoff
Lab & field experiments determine what coefficients need to be used for modeling
𝑊 𝑡 = 𝑃𝑜𝑒−𝑐1𝑄
𝑐2𝑡
Washoff Modeling
Build Sampling MapsPySWMM & GIS
31
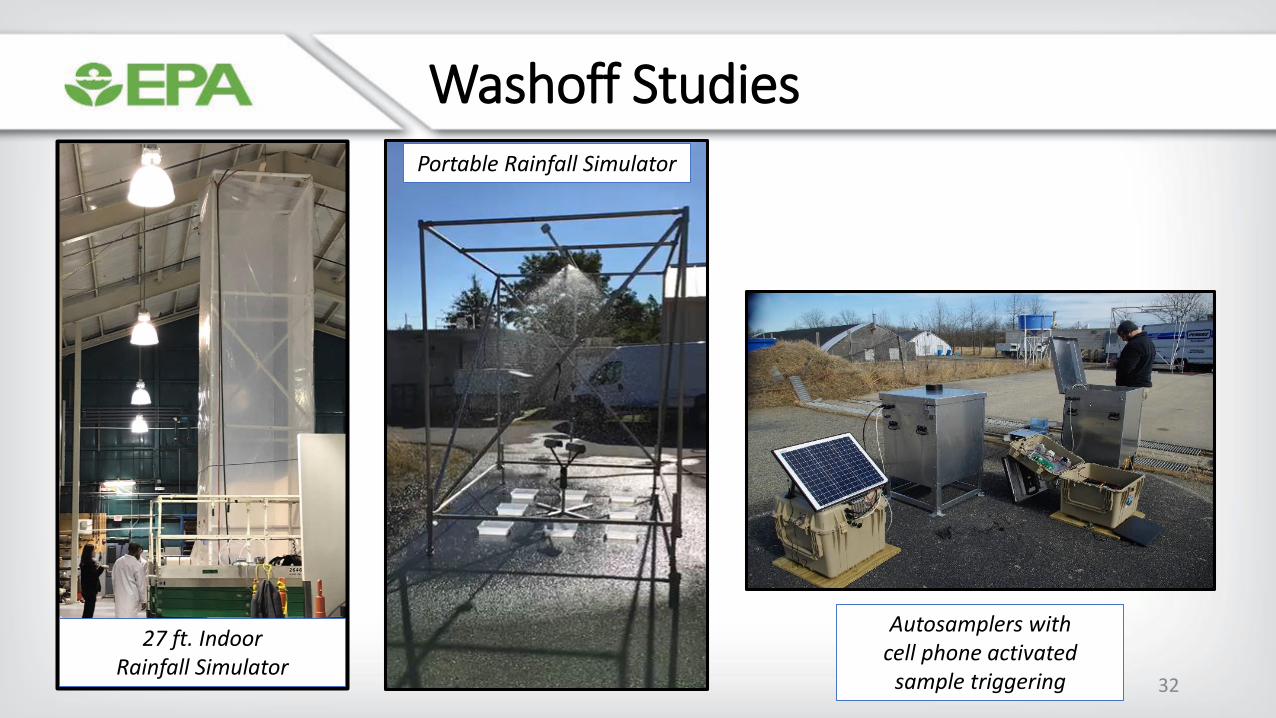
Washoff Studies
27 ft. Indoor Rainfall Simulator
Portable Rainfall Simulator
Autosamplers with cell phone activated
sample triggering 32
33
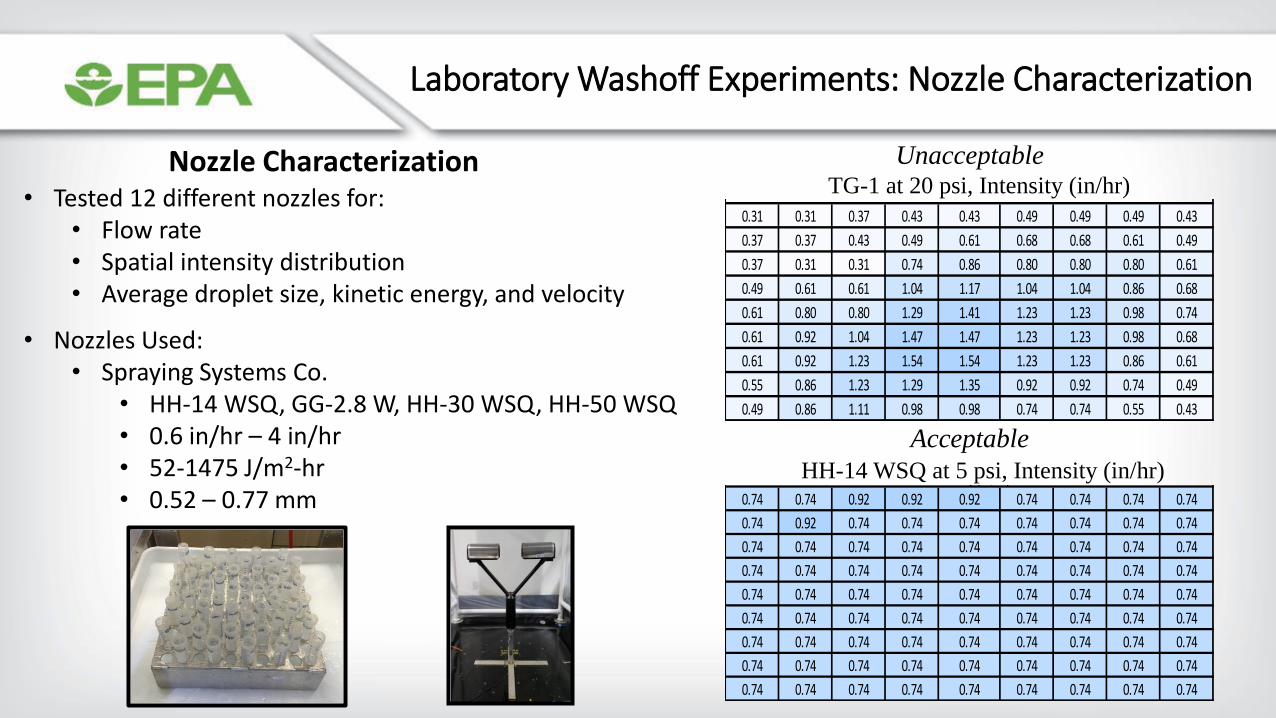
Nozzle Characterization
0.31 0.31 0.37 0.43 0.43 0.49 0.49 0.49 0.43
0.37 0.37 0.43 0.49 0.61 0.68 0.68 0.61 0.49
0.37 0.31 0.31 0.74 0.86 0.80 0.80 0.80 0.61
0.49 0.61 0.61 1.04 1.17 1.04 1.04 0.86 0.68
0.61 0.80 0.80 1.29 1.41 1.23 1.23 0.98 0.74
0.61 0.92 1.04 1.47 1.47 1.23 1.23 0.98 0.68
0.61 0.92 1.23 1.54 1.54 1.23 1.23 0.86 0.61
0.55 0.86 1.23 1.29 1.35 0.92 0.92 0.74 0.49
0.49 0.86 1.11 0.98 0.98 0.74 0.74 0.55 0.43
TG-1 at 20 psi
Intensity (In/hr)TG-1 at 20 psi, Intensity (in/hr)
Unacceptable
0.74 0.74 0.92 0.92 0.92 0.74 0.74 0.74 0.74
0.74 0.92 0.74 0.74 0.74 0.74 0.74 0.74 0.74
0.74 0.74 0.74 0.74 0.74 0.74 0.74 0.74 0.74
0.74 0.74 0.74 0.74 0.74 0.74 0.74 0.74 0.74
0.74 0.74 0.74 0.74 0.74 0.74 0.74 0.74 0.74
0.74 0.74 0.74 0.74 0.74 0.74 0.74 0.74 0.74
0.74 0.74 0.74 0.74 0.74 0.74 0.74 0.74 0.74
0.74 0.74 0.74 0.74 0.74 0.74 0.74 0.74 0.74
0.74 0.74 0.74 0.74 0.74 0.74 0.74 0.74 0.74
HH-14 WSQ at 5 psi
Intensity (In/hr)HH-14 WSQ at 5 psi, Intensity (in/hr)
Acceptable
• Tested 12 different nozzles for:• Flow rate • Spatial intensity distribution• Average droplet size, kinetic energy, and velocity
• Nozzles Used:• Spraying Systems Co.
• HH-14 WSQ, GG-2.8 W, HH-30 WSQ, HH-50 WSQ• 0.6 in/hr – 4 in/hr• 52-1475 J/m2-hr • 0.52 – 0.77 mm
Laboratory Washoff Experiments: Nozzle Characterization
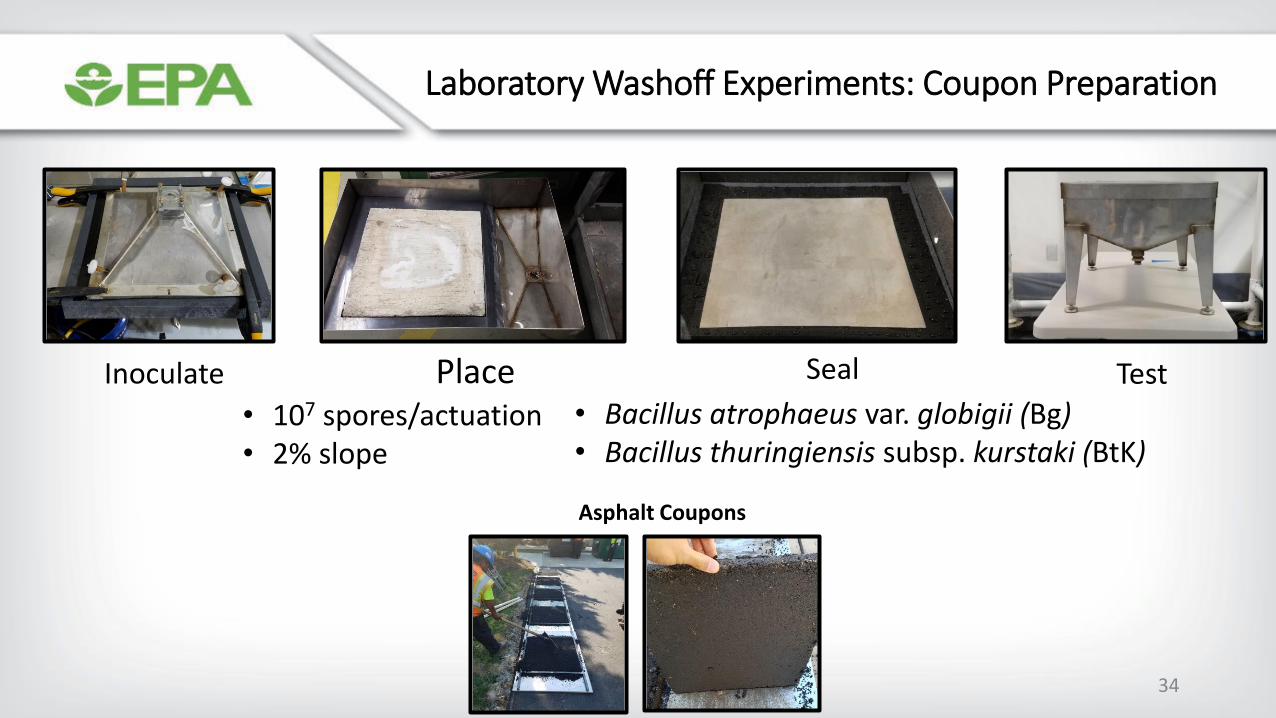
Laboratory Washoff Experiments: Coupon Preparation
Inoculate Place Seal Test
• Bacillus atrophaeus var. globigii (Bg)• Bacillus thuringiensis subsp. kurstaki (BtK)
• 107 spores/actuation• 2% slope
Asphalt Coupons
34
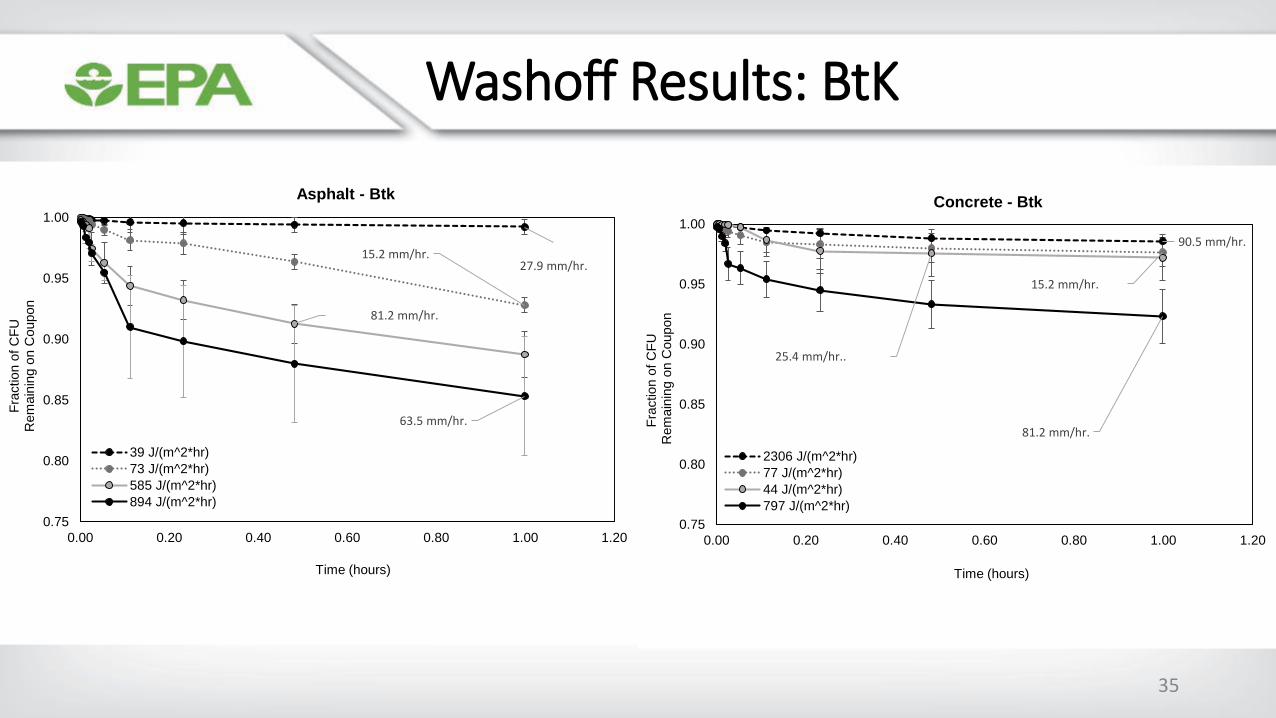
27.9 mm/hr.15.2 mm/hr.
81.2 mm/hr.
63.5 mm/hr.
0.75
0.80
0.85
0.90
0.95
1.00
0.00 0.20 0.40 0.60 0.80 1.00 1.20
Fra
ction o
f C
FU
R
em
ain
ing o
n C
oupon
Time (hours)
Asphalt - Btk
39 J/(m^2*hr)
73 J/(m^2*hr)
585 J/(m^2*hr)
894 J/(m^2*hr)
90.5 mm/hr.
15.2 mm/hr.
25.4 mm/hr..
81.2 mm/hr.
0.75
0.80
0.85
0.90
0.95
1.00
0.00 0.20 0.40 0.60 0.80 1.00 1.20
Fra
ction o
f C
FU
Rem
ain
ing o
n C
oupon
Time (hours)
Concrete - Btk
2306 J/(m^2*hr)
77 J/(m^2*hr)
44 J/(m^2*hr)
797 J/(m^2*hr)
Washoff Results: BtK
35
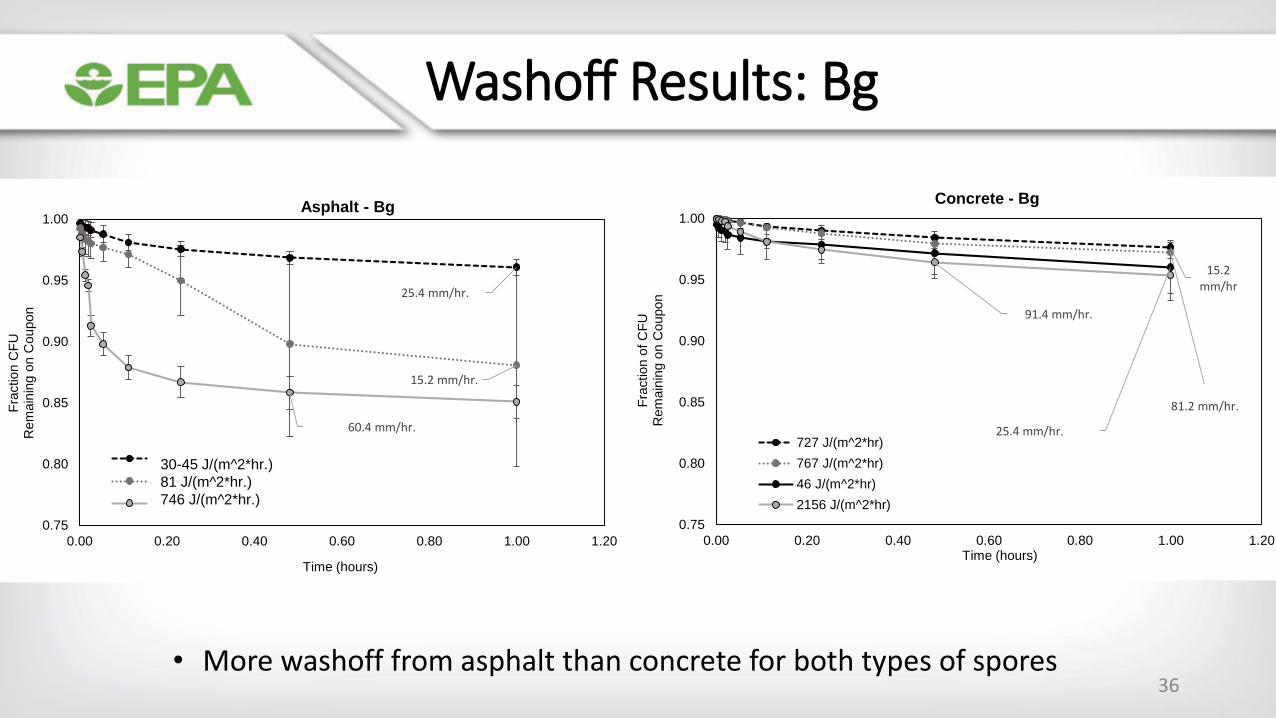
• More washoff from asphalt than concrete for both types of spores
15.2 mm/hr
81.2 mm/hr.
25.4 mm/hr.
91.4 mm/hr.
0.75
0.80
0.85
0.90
0.95
1.00
0.00 0.20 0.40 0.60 0.80 1.00 1.20
Fra
ction o
f C
FU
Rem
ain
ing o
n C
oupon
Time (hours)
Concrete - Bg
727 J/(m^2*hr)
767 J/(m^2*hr)
46 J/(m^2*hr)
2156 J/(m^2*hr)
25.4 mm/hr.
15.2 mm/hr.
60.4 mm/hr.
0.75
0.80
0.85
0.90
0.95
1.00
0.00 0.20 0.40 0.60 0.80 1.00 1.20
Fra
ction C
FU
Rem
ain
ing o
n C
oupon
Time (hours)
Asphalt - Bg
missing J/(m^2*hr)
81.34213793 J/(m^2*hr)
746.0563636 J/(m^2*hr)
30-45 J/(m^2*hr.)
81 J/(m^2*hr.)
746 J/(m^2*hr.)
Washoff Results: Bg
36

Washoff Model Parameterization
𝑊 𝑡 = 𝑃𝑜𝑒−𝑐1𝑄
𝑐2𝑡SWMM Fit: 𝑓 𝑡 = 𝐴𝑒−𝑘1𝑡 + (1 − 𝐴)𝑒−𝑘2𝑡Alt Fit:
C1 = 0.02, C2 = 1.34
0.6 in/hr Asphalt & Bg Spores
A = 0.02, k1 = 18.7, k2 = 0.018
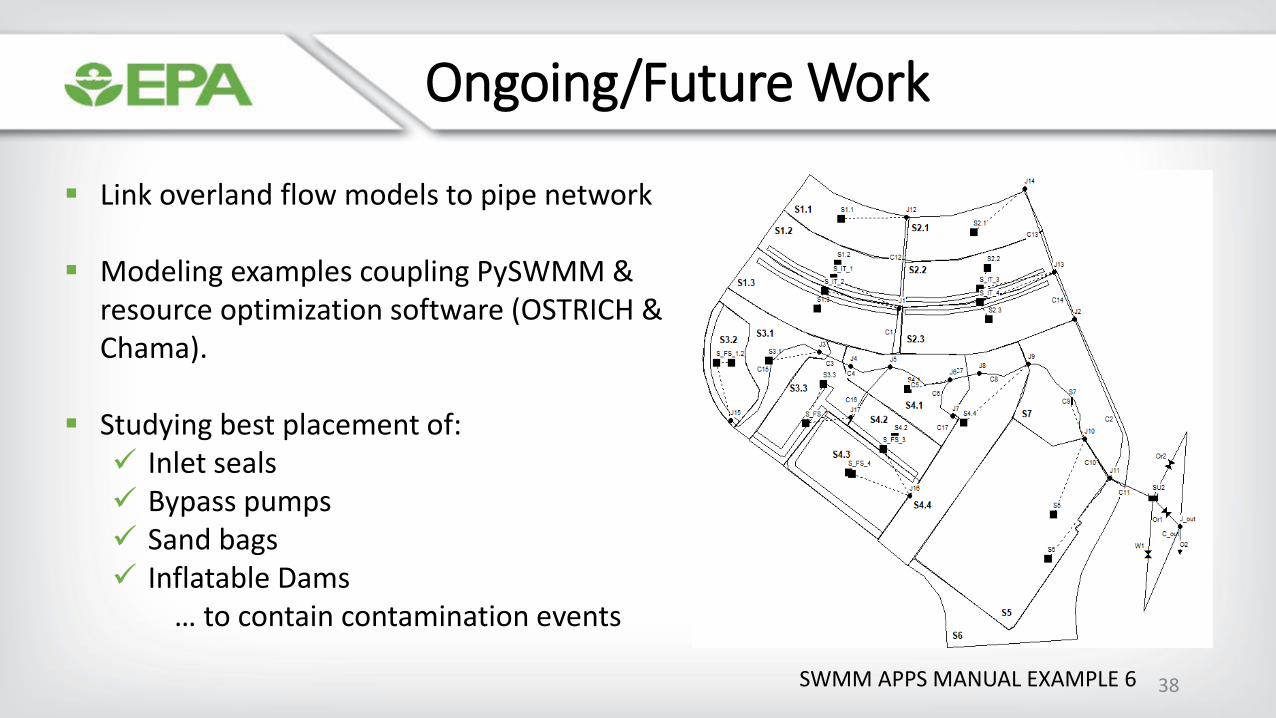
Ongoing/Future Work
▪ Link overland flow models to pipe network
▪ Modeling examples coupling PySWMM & resource optimization software (OSTRICH & Chama).
▪ Studying best placement of:✓ Inlet seals✓ Bypass pumps✓ Sand bags✓ Inflatable Dams
… to contain contamination events
SWMM APPS MANUAL EXAMPLE 6 38
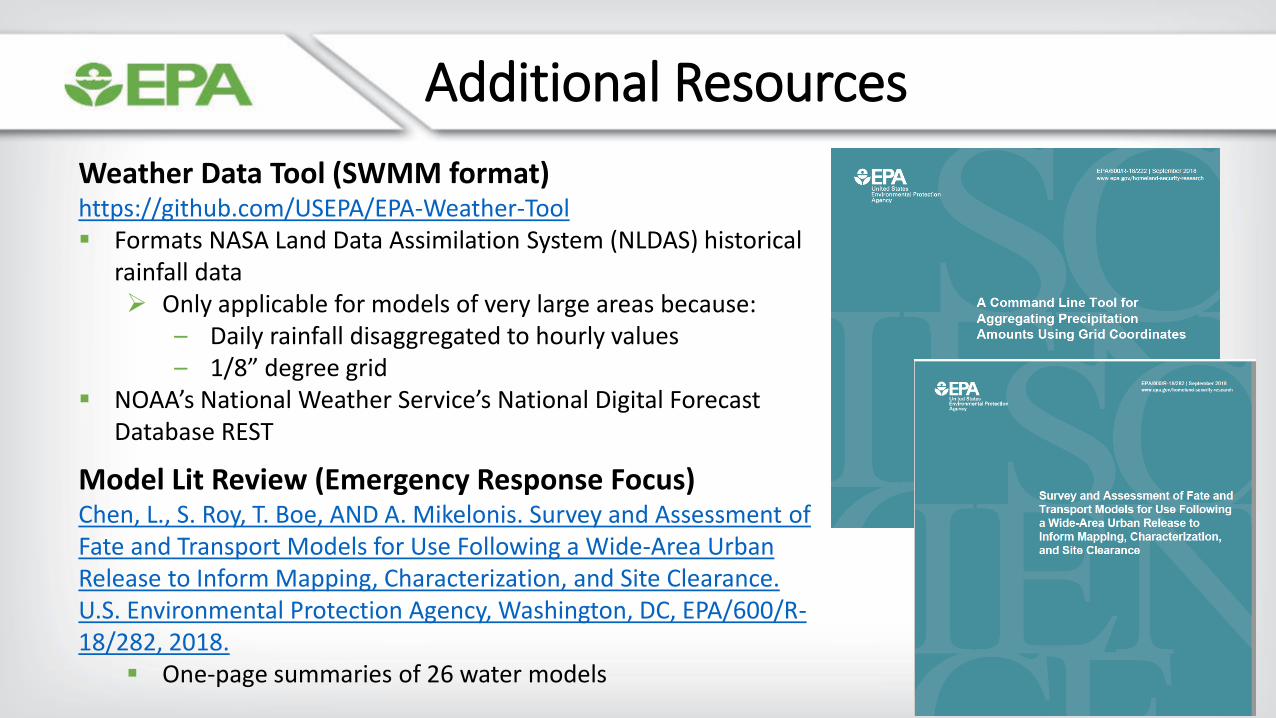
Weather Data Tool (SWMM format)https://github.com/USEPA/EPA-Weather-Tool▪ Formats NASA Land Data Assimilation System (NLDAS) historical
rainfall data➢ Only applicable for models of very large areas because:
– Daily rainfall disaggregated to hourly values– 1/8” degree grid
▪ NOAA’s National Weather Service’s National Digital Forecast Database REST
Model Lit Review (Emergency Response Focus)Chen, L., S. Roy, T. Boe, AND A. Mikelonis. Survey and Assessment of Fate and Transport Models for Use Following a Wide-Area Urban Release to Inform Mapping, Characterization, and Site Clearance. U.S. Environmental Protection Agency, Washington, DC, EPA/600/R-18/282, 2018.
▪ One-page summaries of 26 water models
Additional Resources
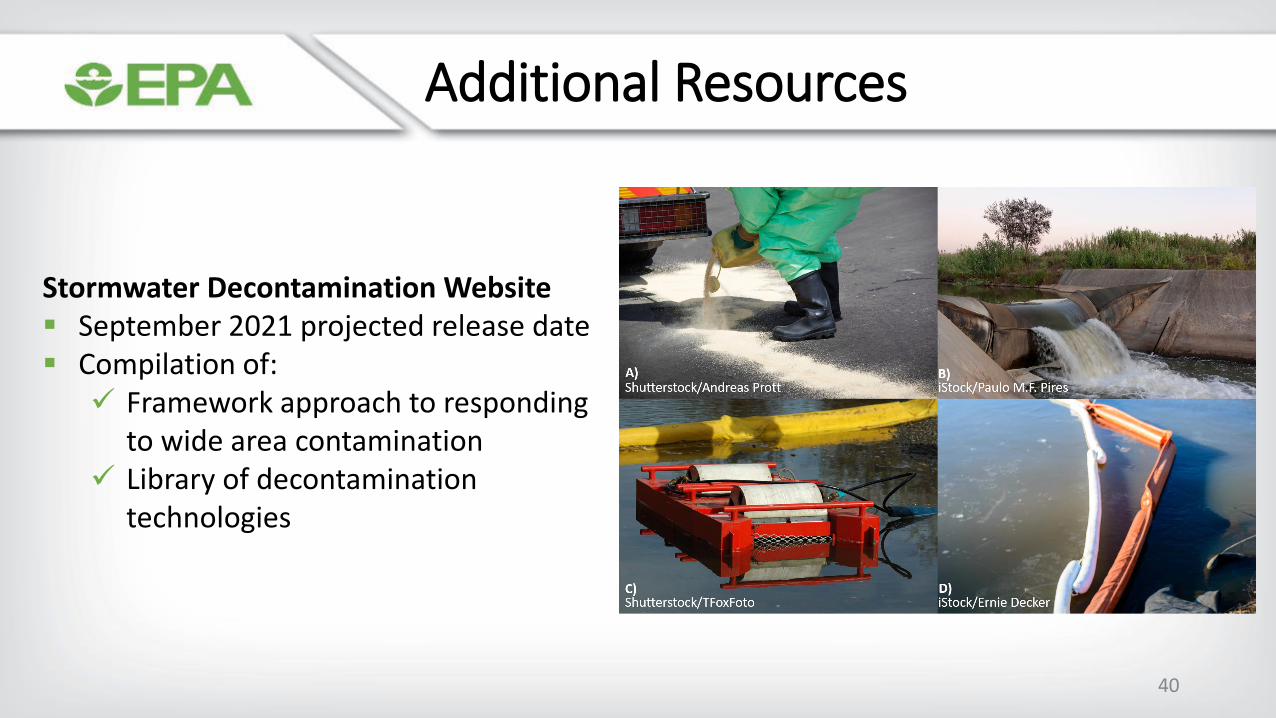
Stormwater Decontamination Website▪ September 2021 projected release date▪ Compilation of:
✓ Framework approach to responding to wide area contamination
✓ Library of decontamination technologies
Additional Resources
40
Questions?
41
epa.gov/homeland-security-research
DISCLAIMER: The United States Environmental Protection Agency (EPA), through its Office of Research and Development’s National
Homeland Security Research Center, funded and managed the research described. This presentation was peer and administratively reviewed and
has been approved for presentation as an Environmental Protection Agency document. It does not necessarily reflect the views of the
Environmental Protection Agency. No official endorsement should be inferred. This presentation includes photographs of commercially-available
products. The photographs are included for purposes of illustration only and are not intended to imply that EPA approves or endorses the product
or its manufacturer. EPA does not endorse the purchase or sale of any commercial products or services.