Infant and Perinatal Mortality in Scotland · PDF filenational center series 3 for health...
52
NATIONAL CENTER Series 3 For HEALTH STATISTICS I Number 5 VITAL and HEALTH STATISTICS ANALWICAL STUDIES pR@ER~ OF ~ : PUBLICATIONS BRANCH EDITORIAL LIBRARY Infant and Perinatal Mortality in Scotland Analysis of infant mortality trends in Scotland by age at death, sex of child, cause of death, social class, and geographic region; maternal mortality trends; stillbirth and perinatal mortality trends; effect of illegitimacy on infant mortality; historical and geographical background of Scotland; and discussion of Scotland’s maternal and child welfare policies. Washington, D.C. November 1966 [J S . DEPARTMENT OF HEALTH, EDUCATION, AND WELFARE Public Health Service wit liam H. Stewart John W. Gardner Secretary Surgeon General
Transcript of Infant and Perinatal Mortality in Scotland · PDF filenational center series 3 for health...
NATIONAL CENTER Series 3
For HEALTH STATISTICS INumber 5
VITAL and HEALTH STATISTICS ANALWICAL STUDIES
pR@ER~OF ~ :
PUBLICATIONS BRANCH EDITORIAL LIBRARY
Infant and Perinatal
Mortality in Scotland
Analysis of infant mortality trends in Scotland by age at
death, sex of child, cause of death, social class, and
geographic region; maternal mortality trends; stillbirth
and perinatal mortality trends; effect of illegitimacy on
infant mortality; historical and geographical background
of Scotland; and discussion of Scotland’s maternal and
child welfare policies.
Washington, D.C. November 1966
[J S . DEPARTMENT OF
HEALTH, EDUCATION, AND WELFARE Public Health Service
wit liam H. StewartJohn W. Gardner
Secretary Surgeon General
Public Health Service Publication No. 1000-Series 3-No. 5
For sale by the Superintmdent of Dcmments, U.S. Government Printing Offica Washington, D.C., 20402- Price .35 cents
NATIONAL CENTER FOR HEALTH STATISTICS
FORREST E. LINDER, PH.D, Director
THEODORE D. WOOLSEY, Deputylli~ecto?
OSWALD K. SAGEN, PH.12,Assistant Director
WALT R.SIMMONS,M.A.,Statistical Advisor
ALICE M. WATERHOUSE, M.D.,Medical Advisor
JAMES E. KELLY, D.D.S., Dental Advisor
LOUIS R.STOLCIS,M.A.,Executive O//icer
DONALD GREEN, bz/om-zatio~Officer
OFFICE OF HEALTH STATISTICS ANALYSIS
I WAO M. MORIYAMA,PH.D., Chic/
D1V1S1ONOF VITAL STATISTICS
ROBERT D. GROVE, PH.11, Chic/
DIV1S1ONOF HEALTH INTERVIEWSTATISTICS
PHILIPS.LAWRENCE, SC.D., Cbie/
DIV1S1ONOF HEALTH RECORDS STATISTICS
MONROE G. SIRKEN,PH.D, Cbie/
DIVIS1ONOF HEALTH EXAM1NATION STATISTICS
ARTHUR J.MCDOWELL, Cbie/
D1V1S1ONOF DATA PROCESSING
LEONARD D. MCGANN, Chief
Public Health Service Publication No. 1000-Series 3-No. 5
Library of Congress Catalog Card Number 66-60072
FOREWORD
This is one of a group of analytical studies the perinatal and infant mortality problem in particular interest is the fact that the United
designed to delineate the United States. Of States is not alone in
experiencing an important change in the infant mortality trend. For a number of countries, infant mortality is no longer declining at its former pace.
Although the primary concern is perinatal andinfant mortality in the United States, it was felt that much could be learned from the experience of other developed countries with advanced medicals ystems. The National Center for Health Statistics arranged with a number of investigators to prepare comprehensive reports of perinatal and infant mortality in their own countries. Contracts were negotiated with investigators in Denmark, England and Wales, the Netherlands, Norway, Scotland, and the United States. The report “Infant and Perinatal Mortality in the United States” was published as Series 3, Number 4 of the Vital and HeaUh Statistics of the United States. The present report for Scotland is the second in this group of studies on perinatal and infant mortality. The methodology, findings, and conclusions are those of the investigator.
All tables of population, birth, and death data included in this re-port are taken. or adapted from tables published in the Annual Reports of the Registrar-General for Scotland. Health data from the National Health Services were taken from the Scottish Health Statistics of the Scottish Home and Health Department.
------ ------ ------ ---------- ------ ------- ------ --------------
----------------------------------------------------------
-----------------------------------------------------------------------------------------------
------------------------------------------------------------------------------------------
--------------------------------------------
------------------------------------------------------------
-----------------------------------------------------------------------------------
-------------------- ---------------- ------------------------------------
-------------------------------------------------------
--------------------------------- -------
------------------------------------------
-------- -----------------------------------------
---------------------------------
-------------------------------------------------------------
------------------------------------------------------
-------------------------------------------------------
CONTENTS
Foreword
Introduction
Maternal Mortali~TrendsMortaliW byCauseMortality by Geographic RegionL40rtaliW byAgeMortality by Social Class
StillbirthsStillbirthRates by Geographic Region ---------------------------------Cause of Death -----------------------------------------------------Sex ofFetusStillbirth Rates by Age of Mother and ParityStillbirths by Gestational Age and BirthWeight---Seasonal IncidenceSocial Class
Perinatal and Neonatal MortalityFirst Year of Life --------------------------------------------------First Week and FirstMonth
Postneonatal Mortality
Effect of Illegitimacy on Infant Mortality
Summary
Acknowledgment
Detailed Tables
Page
i
1
1 2 3 3 4
4 4 5 5 6 9
10 10
12 12 12
14
15
16
18
19

-----------------------------------------
---- ----
------------------------------------------------
--------------------------------------------------------------------------
--------- -------------------------------------------- -------------------------------------
------------------------------------------------------------------------------
--------------------------------------------------------------------------------------------------------
----------------------------------------------------------------------------------------------------------
----------------------------------------------------
------------------
-----------------------------------------------------------
CONTENTS—Continued
Appendix I. Historical and Geographical Background ofScotlandCensus Population ,-------------
Population Migration
AppendixII. Maternal and ChildWelfareBeginning of Health ServicesSanitation andInfectious DiseaseInfant MortalityLegislation for Care of Mothers andInfantsNational InsuranceNational HealthServiceEducationOther ServicesWelfare FoodsFinancial Aid------------------------------------------------------Family Planning
Appendix III. Explanation of Terms U,sdh This Report
References
Page
33 33 34
383838393940404141424242
43
44
------------------------ ---
-------------------
----------------------------
------------------
IN THIS REPORT, detailed statistics are pvovided on mortality associated with birth in Scotland. The focus of attention is on decreases in maternal and infant mortality since 1930 and in stillbirth mortality since 1939. Improvement in infant mortality was chiefly in the postneonatal pem”od; little change has been observed in the fivst day of life.
The greatest prog~ess has been in the reduction in movtality due to communicable diseases. Like stillbirths, movtality due to congenital malformations has shown no improvement since the quinquennium 1931-35, nor has birth injuvy OY asphyxia at birth. The vate of pvematuvity is now one- eighth of that in 1931-35.
Theve has been improvement in each social class gvoup, but the decline has been gveater fov the highev social classes. Mortality from respiratory and digestive diseases is Relatively va?’e in childven of more prosperous families, but ~espiratovy diseases still cause losses among those ji%ancially and intellectually less privileged.
SYMBOLS
Data not available
Category not applicable . . .
Quantity zero -
Quantity more than O but less than 0.05---- 0.0
Figure does not meet standards of *reliability or precision
INFANT AND PERINATAlm MORTALITY IN SCOTLAND
Charlotte A. Douglas, O.B.E., M.D., D. P. H., F. R. C. O.G.’
INTRODUCTION more evident in the neonatal death rate than in the stillbirth rate for deaths from birth injury.
In this study some of the main trends and Postneonatal deaths show a still greater class present levels of maternal, perinatal, and infant distinction. This is especially true of deaths due mortality in Scotland are discussed. to gastroenteritis, respiratory conditions, and
All rates show substantial improvement and accidents. compare favorably in any international study. Maternal mortality at present (1963) stands at a MATERNAL MORTALITY TRENDS rate rather over 0.37 per 1,000 live births. All The maternal mortality, stillbirth, and early causes of maternal death have shown great im- infant death rates are the only accurate measures provement and some, e.g., puerperal sepsis and we have of the success of childbearing for mother hyperemesis gravidarum, have almost disap- and child. There is, however, no accurate measure peared. So far as maternal mortality is concerned of the numbers of women who may be damaged in social class differences have been eliminated. the birth process, though some measure may be
The stillbirth rate is now 45 percent of the gleaned from gynecological wards and clinics.
1939 rate and improvement has been greatest for In Scotland the maternal death rate duringdeaths attributable to difficult labor, ill-defined any given year is calculated on the basis of reg-conditions, and toxemias. The rate of stillbirth istered live births during that year. Prior to 1931 from fetal abnormality is unchanged. Though certain causes of death in pregnant, parturient, women of all classes have benefited from modern and puerperal women had been classified as ma-obstetrical procedures and therapy, stillbirth ternal deaths, though their connection with repro-rates show definite social class distinctions. duction was one of time only. In subsequent years
In neonatal mortality of infants under 7 days these deaths were relegated elsewhere and an acold in contrast to stillbirths, no improvement has cessory table of such deaths during pregnancy and been shown in death from birth injury. In other up to 28 days after delivery has been publishedwords, the grosser forms of birth injury have separately. The only other significant recent improved but much has still to be done if early change is that in 1939 the registration of still-neonatal death is to be avoided. Fetal defects births was begun in Scotland. This allows a more show no improvement. Social class distinction is accurate measurement of the maternal death rate
on the basis of a more comprehensive denominator. For long-term comparison the more recent
IiDr. DougI as was formerly of the Departmentof Health rates have of necessity been calculated on the for Scotland. basis of live births alone.
1
Mortality by Cause
In Scotland priority is given to maternity as a cause of death and therefore deaths from abortion and ectopic pregnancy are included in the maternal mortality rate. In England and Wales deaths from these causes are not included in the official rate.
From the beginning of registration the general trend of maternal mortality rate was upward. This was entirely attributable to the rise in the rate for puerperal sepsis which increased from 1.6 to 2.5 per 1,000 live births in 1881-85 and remained
with minor fluctuations at that level for the next 15 years. During this period the rate for all other causes remained approximately 3 per 1,000 live births. In retrospect it is difficult to say exactly why the rate for puerperal sepsis rose when general environmental hygiene was improving, but the birth rate then prevailing resulted in overcrowding both within and without the family circle, in cities and towns, and overcrowding was undoubtedly responsible for increasing the spread and virulence of septic conditions within the house-hold. For the woman giving birth to a child at home in such conditions the risk of infection was extremely high.
Following the turn of the century deaths from puerperal sepsis fell but rose again in the post World War I period, probably again the result of overcrowding. After a slight decline it rose in the decennium 1926-35 but again began to fall in 1937. This 1937 fall was associated with the gradual disappearance of rachitic pelvis, which meant less gross instrumental and other interference during parturition. At this time too, there was increasing maternity hospital provision, making for better facilities for the abnormal case. From then the fall in the sepsis rate became more rapid, first with the advent of the sulfonamide drugs followed by the antibiotics, until at present the rate is very low indeed.
In Glasgow and the surrounding urban areas
rickets was unfortunately common in lower working class children. The severely contracted pelvis necessitated cesarean section and beyond the necessary surgical intervention caused no problem. The lesser but still considerable degrees of contraction necessitated difficult forceps delivery
or if delivery was impossible then craniotomy, often with disastrous results to mother and child. “Failed forceps ,” a convenient term of obstetrical jargon, frequently resulted, apart from the damage to the child, in death from shock or puerperal sepsis and was in itself a not inconsiderable component of the maternal mortality rate. After World War I intensive educational and medical efforts were made to prevent the occurrence of rickets, so that young women grew up with better physique, which resulted in improved reproductive efficiency comparable with that of the rest of the . country where rickets in children was uncommon.
The high mortality rate prevailing in the early 1920’s was a subject much discussed be-tween the central and local authorities and the medical profession. The conclusion was reached that despite previous lack of success further effort was required for betterment. To find out the causes leading to this high death rate the Government proposed and made a nationwide investigation. Local authorities were asked to pro-vide comprehensive returns with respect to every woman dying during pregnancy or within 4 weeks thereafter. The information so obtained was analyzed and commented upon in the Report on Maternal Morbidity and Mortality. 1 Apart from much relevant information on the factors contributing to a fatal issue it was found that only 42 percent of the infants from pregnancies ending in death of the mother were alive 4 weeks later, i.e., at the time of reporting. The main recommendations of the report became the basis of the Maternity Services (Scotland) Act of 1937, which differed from the corresponding Midwives Act, 1936 for England and Wales, in that local authorities were required to provide not only the services of midwives, but also the services of general practitioners and obstetricians with anesthetist help where necessary.
This domiciliary midwifery service was very popular and in most areas covered almost all domiciliary births, the aim being to provide a unified service. Indeed, at that time, for the first time in history, the maternity services over the greater part of the country were under a unified control. Local authorities were responsible for the ‘ majority of the maternity hospitals, the work of the obstetricians, and the nursing staffs in them;
in addition the general practitioner was paid by the local authority during the period in which he was in charge at a domiciliary confinement. Mid-wives and nurses were local authority employees, and prenatal clinics whether housed in local authority or hospital premises were part of the same service. The unity of control had a greatly beneficial effect on the efficiency of the service; it developed a habit of coordination between doc-tor, nurse, and obstetrician which still prevails even though under the National Health Service (Scotland) Act the maternity services are now organized in three parts.
Not all areas had adopted these measures before 1939 when at the start of the Second World War the necessity to remove expectant women from areas likely to be targets for enemy action made the creation of emergent y maternity hospitals necessary. These hospitals were placed where the need for them was greatest, and, as the y had the services of skilled obstetricians, they were so greatly appreciated locally that most have continued since.
The decline in maternal mortality began in 1935 and with the exception of a small rise during 1941 the rate has fallen steadily, admittedly more slowly in the last few years, until 1960 when it reached a record low level of 0.35 per 1,000 births, The rate rose fractionally to 0.39 per 1,000 births in 1962 but fell again slightly in 1963, and indications are that a further fall will be experienced in 1964.
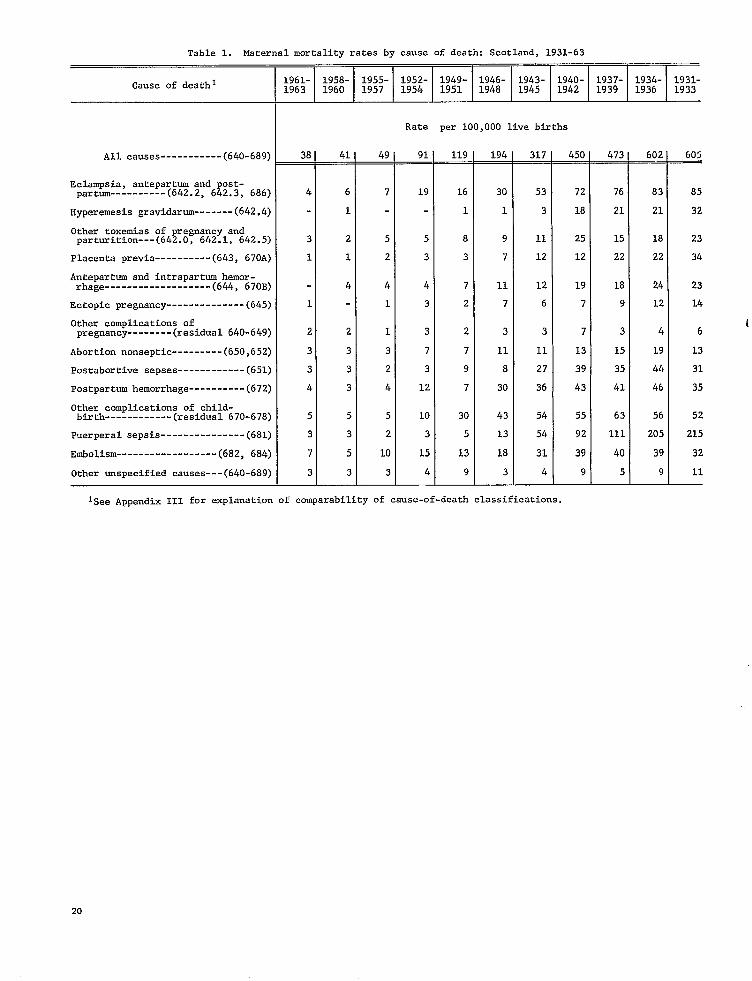
In Scotland there is now good provision for maternity care, including skilled care for all abnormalities, which, combined with the widespread practice of antenatal care, ensures that emergencies in this field are few, that surgical and other interference during parturition is a matter of election and not of urgency. This is borne out in table 1.
It will be realized that in a small country like Scotland the actual number of deaths in each cause group is so small in anyone year that rates calculated on such figures would lead to considerable fluctuation. Accordingly triennial periods have been used on which to base rates and table 1 shows these rates from 1931-63. The cause list in table 1 is that in use for the years 1931-33 and the detailed list of the subsequent triennia has
been compressed to it for purposes of comparison. For each of these groups of causes there has been great improvement, but favorable experience varies in degree and in time of onset. In the toxemias, hyperemesis gravidarum began to improve in the early 1940’s and has now almost disappeared, as have other toxemias. But though eclampsia and both antepartum and postpartum toxemias have shown a gradual reduction they still remain as a definite entity in the maternal mortality rate. The same is true of death from embolism. Every method known to medical science has been used to prevent deaths from embolism but so far without complete success. In recent years, with the increase of maternity hospital provision and availability of obstetric specialists, there is plenty of room for early admission to hospital of cases known to have low set placentas and of women likely to exhibit abruption of the placenta; indeed, there have been only two deaths from placenta previa as a complication of pregnant y in the last 10 years and none from antepartum hemorrhage since 1960. Abortion, whether natural, therapeutic, or deliberate still exacts its toll and further education in prevention of pregnancy is necessary because, in the main, such deaths occur in women with families. Further reduction in maternal deaths now depends almost as much on the woman herself as on the services provided.
Mortality by Geographic Region
For many years the Northern Region of the country, despite at times difficult climatic conditions and distances from specialist institutional care, returned on the average favorable rates. However, in the last 20 years there has been improvement throughout the land and all areas have benefited equally the overall rate now varies from 0.3 to 0.4 per 1,000 total births and the number of deaths in any one area is so small that even a single death noticeably influences the rate.
Mortality by Age
There has been a great reduction in the general death rate of women as well as in the maternal death rate. Table A shows the general
3 2Mi-KLi O - M -2
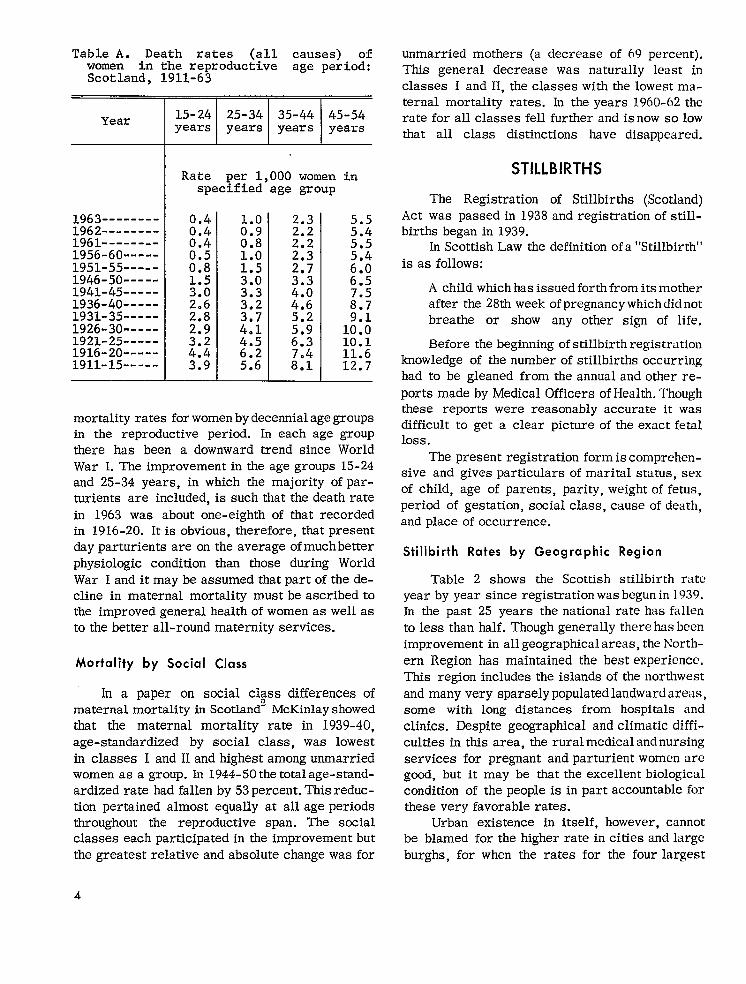
Table A. Death rates (all causes) of women in the reproductive age period: Scotland, 1911-63
Year
Rate per 1,000 women in specified age group
1963-------- 0.4 1962-------- 0.4 ;:: ::: 1961-------- 0.4 0.8 5.5 1956-60----- 1.0 1951-55----- EN 1.5 M 1946-50----- 3.0 6.5 1941-45----- M 3.3 1936-40----- 2.6 ;:; 1931-35----- 2.8 ::; 1926-30----- 4.1 1::: 1921-25----- ::; 4.5 10.1 1916-20----- 4.4 6.2 11.6 1911-15----- 3.9 5.6 12.7
mortality rates forwomenbydecennialagegroups in the reproductive period. In each age group there has been a downward trend since World War LTheimprovement in the age groups 15-24 and 25-34 years, in which the majority ofparturients are included, is such that the death rate in 1963 was about one-eighth of that recorded in 1916-20. Itis obvious, therefore, tbat present dayparturients are on the average ofmuchbetter physiologic condition than those during World War Ianditmay be assumed that part of thedecline in maternal mortality mustbe ascribedto the improved general health ofwomen as wellas to the better all-round maternity services.
Mortality by Social Class
In a paper on social C1$SS differences of maternal mortality in Scotland” McKinlayshowed that the maternal mortality rate in 1939-40, age-standardized by social class, was lowest in classes I and II and highest among unmarried women as a group. In 1944-50thetotal age-standardized rate had fallen by 53percent. This reduction pertained almost equally at all age periods throughout the reproductive span. The smial classes each participatedin the improvement but the greatest relative and absolute change was for
unmarried mothers (a decrease of 69 percent). This general decrease was naturally least in classes I and II, the classes with the lowest maternal mortality rates. In the years 1960-62 the rate for all classes fell further and is now so low that all class distinctions have disappeared.
STILLBIRTHS
The Registration of Stillbirths (Scotland) Act was passed in 1938 and registration of still-births began in 1939.
In Scottish Law the definition of a “Stillbirth” is as follows:
A child which has issued forth from its mother after the 28th week of pregnant y which did not breathe or show any other sign of life.
Before the beginning of stillbirth registration knowledge of the number of stillbirths occurring had to be gleaned from the annual and other re-ports made by Medical Officers of Health. Though these reports were reasonably accurate it was difficult to get a clear picture of the exact fetal loss .
The present registration form is comprehensive and gives particulars of marital status, sex of child, age of parents, parity, weight of fetus, period of gestation, social class, cause of death, and place of occurrence.
Stillbirth Rates by Geographic Region
Table 2 shows the Scottish stillbirth rate year by year since registration was begun in 1939. In the past 25 years the national rate has fallen to less than half. Though generally there has been improvement in all geographical areas, the North-ern Region has maintained the best experience. This region includes the islands of the northwest and many very sparsely populated landward areas, some with long distances from hospitals and clinics. Despite geographical and climatic difficulties in this area, the rural medical and nursing services for pregnant and parturient women are good, but it may be that the excellent biological condition of the people is in part accountable for these very favorable rates.
Urban existence in itself, however, cannot be blamed for the higher rate in cities and large burghs, for when the rates for the four largest
4

-------
--------------
cities in Scotland for the 3 years 1960-62 are calculated, the position is as follows:
Stillbirth rate per 1,000 total
Live biyths Stillbirths births
Aberdeen-- 9,788 178 17.9 Dundee---- 11,170 216 19.0 Edinburgh - 25,569 465 17.9
Glasgow--- 71,081 1,655 23.3
It will be seen that the stillbirth rate for Glasgow is less favorable than the rates for the other three cities. The individual rates per 1,000 total births for 1961, 1962, and 1963 for each city make this point even more clear:
1961 1962 1963
Aberdeen 15 18 15 Dundee --------- 16 18 19 Edinburgh 19 16 18 Glasgow 23 22 21
Since there is readily available skilled care and ample hospital accommodation in all four cities, lack of skillor accommodation cannotbe blamed for the difference in rates. Some other factor must be influencing the rate for Glasgow and this, in all probability, is due to the higher proportion of high parity families in the poorer classes.
Cause of Death
In table 3 the stillbirth rates per 1,000 total births by cause of death from 1939 through 1963 are given, During these years, while the total rate has been more than halved, the rates for some causes have progressed more favorably than others. There has been little change in the rate for acute and chronic diseases in the mother. Syphilis, formerly a prominent cause of stillbirth, cm now be dealt with effectively. The decline in plticental and cord conditions has been slow, and the rate is still 90 percent of the rate at the be-ginning of registration. There is obviously room for research into the causes of placental insufficiencyy, infarcts, and antepartum hemorrhage;
also, more thought probably could be devoted to methods of avoiding pressure on the cord during parturition. The rate due to difficult labor and birth injuries is 25 percent of its former level and some of this improvement can be ascribed to the disappearance of rickets and the deformed pelvis.
Modern care of the hypertensive and the toxemic patient and also the absence of chronic nephritis arising from complications of scarlet fever and other hemolytic streptococcal infections in youth have reduced the rate for toxemias to 40 percent of its former level. Despite considerable research and increase in knowledge of the causes of fetal defects there appears to be little that can be done to prevent them because the origin of these defects lies very early in existence, and at times before the woman herself is aware of pregnancy.
The rate for ill-defined and unknown causes has dropped chiefly because in the latter years there has been an increasing interest throughout the country in stillbirth and neonatal pathology. Autopsy is performed when the exact diagnosis is in doubt.
Sex of Fetus
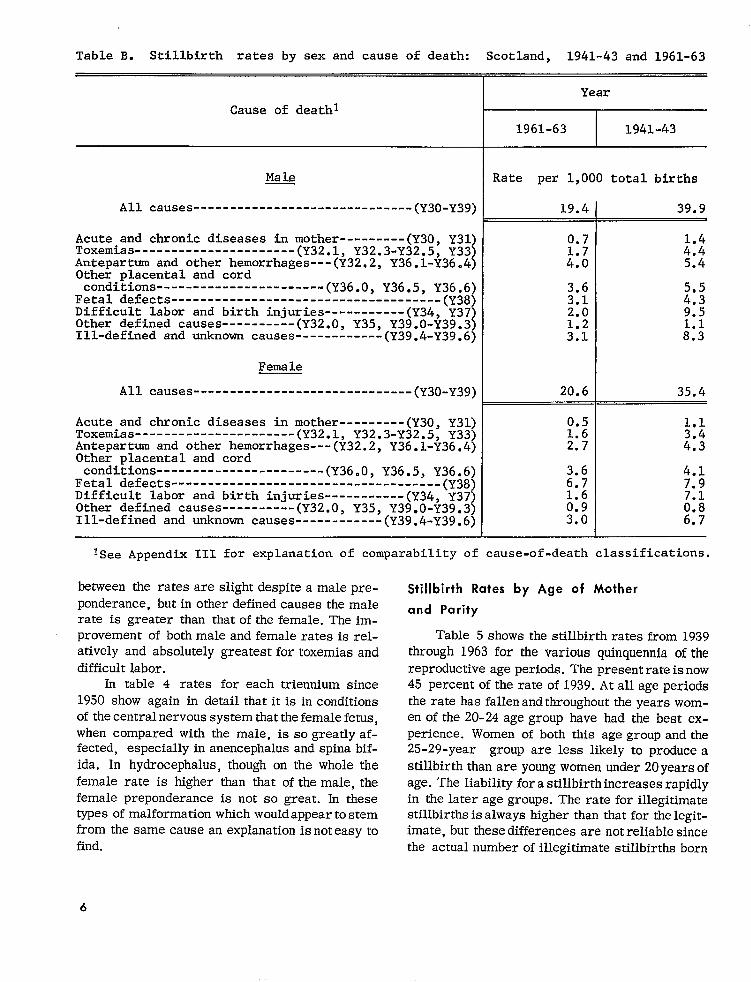
The sex of the fetus and its effect on still-birth arouses some interest, as the ratio of male to female stillbirths has changed in recent years. In the earlier years of registration the excess of the male rate over the female gradually decreased until in 1956 the female rate became greater than the male rate and has remained so until now. The increase in the female rate is entirely due to conditions affecting the central nervous system. In all other causes the rate for the male exceeds that of the female.
In table B the stillbirth rates by sex and cause are shown for the periods 1941-43 and 1961-63. There has been improvement in the total rate between the triennium 1941-43 and that of 1961-63. In the earlier period for all cause of death groups except fetal defects, the male fetus had a worse experience than the female. In the period 1961-63 the male fetus in most cause groups had a slightly worse experience than the female except for fetal defects and only in those affecting the central nervouss ystem. In ill-defined or unknown causes and toxemias the differences
5
------------------------------
----------------------
------------------------------------------------------------
----------------------
------------------------------
----------------------
-------------------------------------------------------
----------------------
Table B. Stillbirth rates by sex and cause of death: Scotland, 1941-43 and 1961-63
Cause of deathl
Male
All causes (Y30-Y39)
Acute and chronic diseases in mother---------(Y3O, Y31) Toxemias (Y32.1, Y32.3-Y32.5, Y33) Antepartum and other hemorrhages---(Y32.2,Y36.1-Y36.4) Other placental and cord conditions (Y36.0, Y36.5, YM&;j
Fetal defects Difficult labor and birth injuries-----------(y34,Y37) Other defined causes (Y32.O, Y35, Y39.O-Y39.3) Ill-defined and unknown causes (Y39.4-Y39.6)
Female
All causes (Y30-Y39)
Acute and chronic diseases in mother---------(Y3O, Y31)Toxemias (Y32.1, Y32.3-Y32.5, Y33)Antepartum and other hemorrhages---(y32,2,Y36.1-Y36.4) Other placental and cord conditions (Y36.0, Y36.5, Y36.6)
Fetal defects -----(Y38) Difficult labor and birth injuries-----------(y34,Y37’) Other defined causes (Y32.O, Y35, Y39.O-Y39.3) Ill-defined and unknown causes (Y39.4-Y39 .6)
Year
1961-63 1941-43
Rate per 1,000 total births
19.4 39.9
0.7
M
3.6 3.1 2: 2.0 9.5
20.6 35.4
0.5 1.6 2.7
3.6 4.1 6.7 7.9 1.6
M M 6.7
~See Appendix 111 for explanation of comparabilityof cause-of-deathclassifications,
between the rates are slight despite amale preponderance, but in other defined causes the male rate is greaterthanthatofthefemale.The im-provementof bothmale andfemaleratesisrelativelyand absolutely fortoxemiasandgreatest
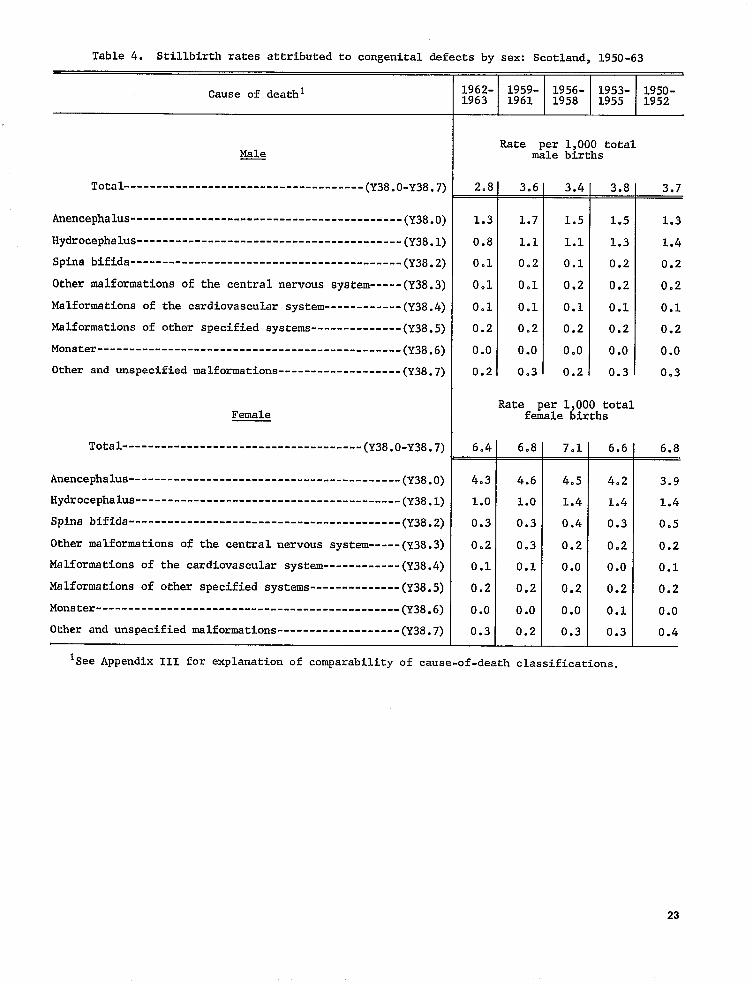
difficultlabor.In table4 rates foreach trienniumsince
1950 show again in detail that itis in conditions of thecentral nervous system thatthefemale fetus, when compared withthemale, issogreatlyaffected,especially andspinabifinanencephalus
ida.In hydrocephalus, though on the whole the female rate is higher than that of themale, the female preponderance is not so great. In these types ofmalformation which wouldappear tostem from the same cause an explanationis noteasyto find.
Stillbirth Rates by Age of Mother
and Parity
Table 5showsthe stillbirthratesfrom 1939through1963 for the various quinquennia of the reproductive age periods. The presentrateisnow 45 percent of the rate of1939. At all age periods the rate has fallenandthroughout the years womenofthe 20-24 age group have had the best experience. Women of both this agegroup and the 25-29-Year group are less likely to produces
stillbirth than are young women under 20yearsof age. The liability forastillbirthincreases rapidly in the later age groups. The rate for illegitimate stillbirths is always higher than that for the legitimate, but thesedifferences are notreliablesince the actual number of illegitimate stillbirths born
6

--------
---------------------
-------------
Table C. Stillbirth rates by age of mother and cause of death: Scotland, 1963
Age of mother
Cause of death All Under 20-24 25-29 30-34 35-39 40 years20 ages years years years years years and over
All causes (Y3O-Y39) 19
Acute and chronic diseases in mother-------------(Y3O. .———,Y31) 0.5
Toxemias-(Y32.l,Y32.3-Y32.5, Y33j 1.4 Antepartum and other hem
orrhages---- (Y32.2, Y36.1-Y36.4) 3.1 Other placental and cord condi
tions (Y36.0, Y36.5, Y36.6) Fetal defects (Y38) N Difficult labor and birth
injuries--------------(Y34, Y37’) 1.8 Other defined
causea-(Y32.0, Y35, Y39.O-Y39.3) 1.0 Ill-defined and unknown
causes (Y39.4-Y39.6) 2.6
to women of all age periods issmaH (131, 150, and 146 in 1961, 1962, and 1963, respectively). There is also the fact that many of these stiUbirths are products of a first pregnancy which carries a higher risk of fatali~. The number of illegitimate stillbirths, however, is so small that it has little effect on the national rate.
As has been shown in respect to stillbirths in general, age of mother has an influence on the individual causes. Table C shows this for 1963. In this year for mostcauses womeninthe younger age groups had the best experience. Stillbirths occurring as a result of toxemias, antepartum hemorrhage, and placental andcord conditionsincreased with themother’s advancing age. On the whole the lowest rates were obtained for women of the 20-24 and 25-29 age groups. Surprisingly, the younger women, the under 20agegroup, had a higher rate for acute and chronic diseases in the mother and for fetal defects. Itmaybe thatas a group they are more careless about general health and live in circumstances where thereis
Rate per 1,000 total births
17 16 16 22 31 42
M 0.2 0.4 0.7 0.9 1.3 1.2 1.2 3.0 ::?
2.8 2.2 2.8 3.6 5.6 5.8
11.7 ::: ::: N ::: u 7.6
1.5 1.3 1.5 2.3 2.6 4.5
0.7 0.8 1.7 2.5 1.0
2.5 2.5 2.2 2.6 3.9 5*5
more liability to current infections. The pattern was the same in previous years.
Table 6 shows the stillbirth rates oflegitimate births by parity from 1946 through 1963. Throughout the period the risk has been above average for the first birth, has fallen to a mini-mum for the second birth, and after that the rate has risen with parity. In the higherparitiessmall numbers make theratesunstable. Paritynaturally increases with age and the data forageand parity show that after the first birth, as a rule, the younger the mother, thelower the parity, and the less the likelihood of astil.lbirth. Itis difficult to assess whether age or parity has thegreaterimportance.
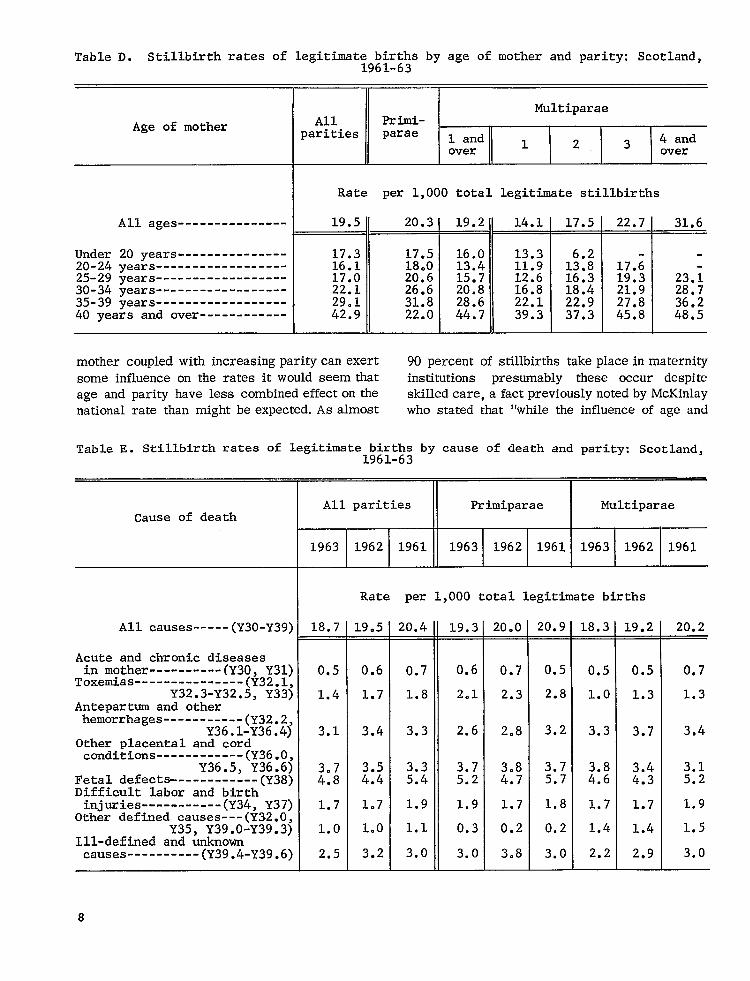
Table D shows the combined effects of age and parity for the 3 years 1961-63 andagain even with increasing parity the age group 20-24 years has the best experience. Adequate spacing of births must also be of importance, as within each age group increasing parity shows an increase in mortality. But, even though increasing age of
7
---------------------------------------------------------------------------------------
------------
----
-----
---------------
------------
------------
----------
Table D. Stillbirth rates of legitimst;9~~;i&sby age of mother and parity: Scotland,
Age of mother
I Rate per 1,000 total legitimate stillbirths
All ages---------------w= — 20.3 -19.2 14.1 17.5 22.7 —31.6
Under 20 years 17.3 17.5 16.0 13.3
25-29 years 17.0 20.6 15.7 12.6 16.3 19.3 23.i 30-34 years 22.1 26.6 20.8 16.8 18.4 21.9 28.7 35-39 years 29.1 31.8 28.6 22.1 22.9 27.8 36.2 40 years and over 42.9 22.0 44.7 39.3 37.3 45.8 48.5
I II I II I I I
20-24 years 16.1 18.0 13.4 11.9 1::; 17.;
paritycanexert 90 percentof stillbirthsmother coupledwithincreasing takeplaceinmaternitysome influence presumably these occur despiteon theratesitwould seem that institutions
on the skilled notedby McKinlayage and parityhave lesscombinedeffect care,afactpreviouslyAs almost who statedthat“whiletheinfluencenationalratethanmight be expected. of age and
Table E. Stillbirth rates of legitimate birth: by cause of death and parity: Scotland, lYbl-63
All parities Primiparae I MultiparaeCause of death
1963 1962 1961
Rate per 1,000 total legitimate births
All causes (Y3O-Y39) 18.7 19.5 20.4 19.3 20.0 20.9 18.3 19.2 20.2
Acute and chronic diseasesin mother----------(Y3O, Y31) 0.5 0.6 0.7 0.6 0.7 0.5 0.5 0.5 0.7
ToxemiaS (Y32.1,Y32.3-Y32.5, Y33) 1.4 1.7 1.8 2.1 2.3 2.8 1.0 1.3 1.3
Antepartum and otherhemorrhages-----------(y32.2,
Y36.1-Y36.4) 3.1 3.4 3.3 2.6 2.8 3.2 3.3 3.7 3.4Other placental and cordconditions
Y36.5,(%:;j 3.3 3.7 3.7Fetal defects (Y38) M ::: 5.4 5.2 ;:! 5.7 ::: ::$ HDifficult labor and birthinjuries-----------(Y34,Y37) 1.7 1.7 1.9 1.9 1.7 1.8 1.7 1.7 1.9
Other defined causes---(Y32.0,Y35, Y3900-Y39.3) 1.0 1.0 1.1 0.3 0.2 0.2 1.4 1.4 1.5
Ill-defined and unknowncauses (Y39.4-Y39.6) 2.5 3.2 3.0 3.0 3.8 3.0 2.2 2.9 3.0
8

-----------------------
-----------
-----------
---------
Table F. Stillbirth rates by cause of death and period of gestation: Scotland, 1961-63
Period of gestation
Cause of death 28 weeks 28-31 32-35 36-39 40-43 44 weeks Not and over weeks weeks weeks weeks and over stated
Rate per 1,000 total births
All causes---- (Y3O-Y39) 19.9 2.7 4.6 6.3 5.5 0.1 0.7
Acute and chronic diseases in mother (Y3O, Y31)
Toxemi.as 0.6 0.l 0.1 0.2 0.1 0.O 0.0
Y32.3-Y32.~3$ij 1.6 0.3 0.5 0.5 0.3 0.O Antepartum and other
hemorrhages----------(y32.2, Y36.1-Y36.4) 3.1 0.6 0.9 1.2 0.4 0.0 0.1
Other placental and cord
Y36.5, Y36.6) Fetal defects (Y38)Di,ffi,cult labor and birth
H 0.4 0.6
0.5 1.5 M
1.6 1.0
0.0 0.0 M
injuries----------(Y34, Y37) 1.8 0.1 0.2 0.5 1.0 0.0 0.1 Other defined causes-- (y32.O,
Y35, Y39.O-Y39.3) 1.0 0.2 0.3 0.4 0.1 0.O 0.0 Ill-defined and unknown
causes (Y39.4-Y39.6) 3.0 0.5 0.6 0.9 1.0 0.O 0.2
conditions (Y36 .0,
parity of the mother are of some importancein determining the outcome of a specific pregnancy for mother and child, the actual numerical influence on the falling rates is negligible andexplmationsofthe mortalitychanges mustbelooked for elsewhere. “:]
Table E shows the stillbirth rates for the main causegroups byparityamong married worn-en. The meager effect on the total rate of the higher parities bears out the conclusion that improvement in the rate indeed must be looked for elsewhere than in age and parity. The table itself shows a somewhat heavier rateamongfirstbirths in respect oftoxemias, placental andcordconditions, and fetal defects, but their rate is more favorable for antepartum hemorrhage and other defined causes. It would seem, therefore, thatso far us the obstetrician is concerned even more attention in research, antenatal, and intranatal care should be paid to the primigravida.
Stillbirths by Gestational Age
and Birth Weight
Stillbirths bycause of death, gestational age, and birth weight were registered for the first time in 1961 andas the actual numbers by cause of death for a single yearare toosmall to permit calculation ofrates ofany real value the figures for the years 1961-63 have been combined. Even with a 3-year combination some rates are still small.
TableF shows stillbirths bycauseandperiod of gestation. About 60 percent take place between the 36th and the 43dweeks ofpregnancy. In this period the chief causes of death are placental conditions including antepartum hemorrhage and fetal defects—indeed these are the main causes inal..l periods ofgestational age.
In table 7 stillbirths by cause of death and birth weight have been computed over the same
9
---------
--------------
----------------
---------------
--------------
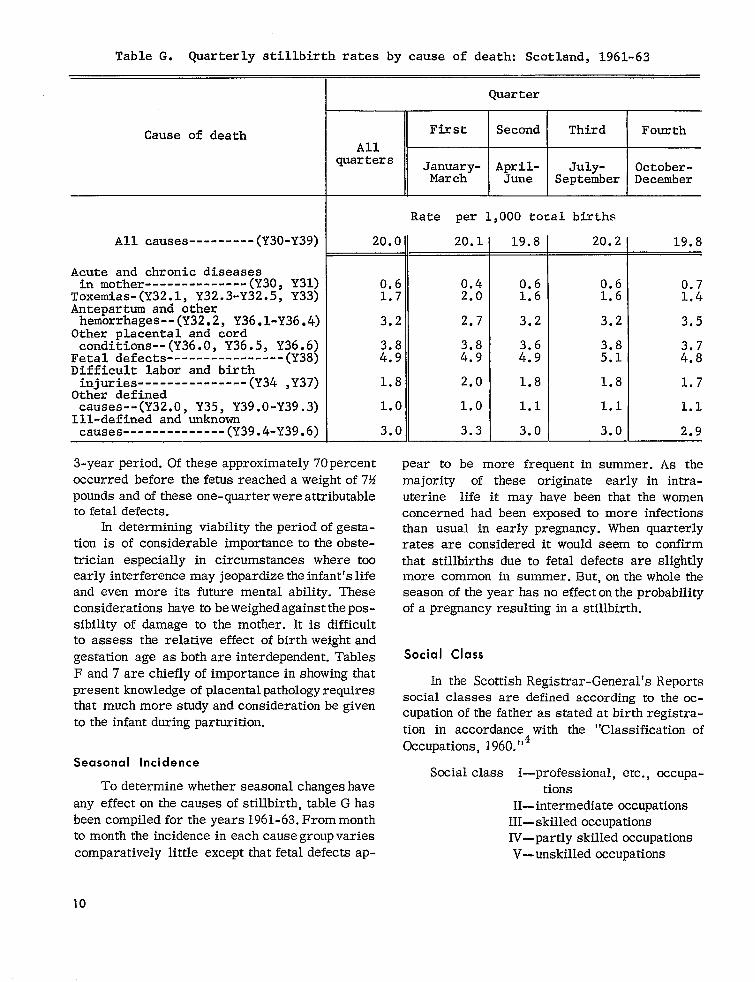
Table G. Quarterly stillbirth rates by cause of death: Scotland, 1961-63
Quarter
Cause of death First Second Third I?ourth All
quarters January- April- July-March June September
October-December
Rate per 1,000 total btrths
All causes (Y3O-Y39) 20.0 20.1 19.8 20.2 19.8
Acute and chronic diseases in mother (Y30, Y31) 0.6 0.4 0.6 0.6 0.7
Toxemias-(Y32.1, Y32.3-Y32.5, Y33) 1.7 2.0 1.6 1.6 1.4 Antepartum and other
hemorrhages-- (Y32.2, Y36.1-Y36.4) 3.2 2.7 3.2 3.2 3,5 Other placental and cord
conditions-- (Y36. O, Y36.5, Y36.6) 3.8 Fetal defects (Y38) 2:: ::: 2:$ 5.1 ::; Difficult labor and birth
injuries (Y34 ,Y37) 1.8 2.0 1.8 1.8 1.7 Other defined
causes--(Y32.O, Y35, Y39.O-Y39.3) 1.0 1.0 1.1 1.1 1.1 Ill-defined and unknown
causes (Y39 .4-Y39 .6) 3.0 3.3 3.0 3.0 2.9
3-year period. Ofthese approximately 70percent pear to be more frequent in summer. As the occurred before the fetus reached aweightof 7?4 majority of these originate early in intrapounds and ofthese one-quarterwere attributable to fetal defects.
In determining viability theperiodofgestation is of considerable importance totheobstetrician especially in circumstances where too early interference may jeopardize theinfant’slife and even more its future mental ability. These considerations have to beweighedagainstthepossibility of damage to the mother. It is difficult to assess the relative effect of birth weight and gestation age as both are interdependent. Tables Fand7 are chiefly of importancein showing that present knowledge of placentalpathology requires that much more study and considerationbe given to the infant during parturition.
Seasonal Incidence
To determine whether seasonal changes have any effecton the causes of stillbirth, tableG has been compiled for theyears 1961- 63.Frommonth to month the incidence in each causegroupvaries comparatively little except that fetal defects ap-
10
uterine life it may have been that the women concerned had been exposed to more infections than usual in early pregnancy. When quarterly rates are considered it would seem to confirm that stillbirths due to fetal defects are slightly more common in summer. But, on the whole the season of the year has no effecton the probability of a pregnancy resulting in a stillbirth.
Social Class
In the Scottish Registrar-General’s Reports social classes are defined according to the occupation of the fatheras stated at birth registration in accordance with the “Classification of Occupations, 1960.”4
Social class I—professional, etc., occupations
H-intermediate occupations lll—skilled occupations IV—partly skilled occupations V—unskilled Occupations

-----------------------
---------------
---------------------
----------------------------------------------
-----------------------
---------------
----------------------------------------------
Table H. Stillbirth rates of legitimate births by cause of death and social class:Scotland, 1950-63
1959-63 1956-58II
1 I I
Cause of deathl 1and11
Rate per 1,000 totallegitimate births
All causes (Y30-Y39) 14.8 19.8 23.8 19.5 22.0 27.1
Acute and chronic diseases in mother--(Y3O, Y31) 0.5 0.6 0.7 0.6 0.6 0.8 Toxemias (Y3201, Y32.3-Y32.5, Y33) 1.3 1.7 1.8 2.0 2.1 2.1 Antepartum and other hemor-rhages (Y32.2, Y36.1-Y36.4) 2.3 3.3 4.2 2.7 3.3 4.6 Other placental and cord conditions (Y36.0, Y36.5, Y36.6)
Fetal defects (Y38) 3.2 2.8 ::;
4.2 5.8
4.1 3.8
4.1 5.0
4.7 6.1
Difficult labor and birth injuries----(Y34,Y37) 2.0 2.4 2.2 2.6 3.2 Other defined causes---(Y32.O, Y35, Y39.O-Y39.3) Ill-defined and unknown causes-----(Y39.4-Y39.6)
::? 2.5
1.0 2.9 :::
1.2 3.0
1.0 3.3 M
1953-55 I 1950-52
Cause of death
Rate per 1,000 totallegitimate births—Con.
Acute and chronic diseases in mother--(Y3O, Y31) Toxemias (Y32.1, Y32.3-Y32.5, Y33) mAntepartum and other hemor-
0.6 2.0
0.7 2.5
1.0 2.4
rhages---------------------(Y32.2,Y36.1-Y36.4) 2.7 3.5 4.2 3.3 3.6 4.5 Other placental and cord conditions (Y36.0, Y3605, Y36.6) 3.7 4.4 5.2 3.9 4.0 4.9
Fetal defects (Y38) 3.3 5.0 :.; 5.7 Difficult labor and birth injuries----(Y34,Y37) 3.4 . 2:; ;:: 5.2 Other defined causes---(Y32.O, Y35, Y39.O-Y39.3) i:; 1.1 0.6 1.1 Ill-defined and unknown causes-----(Y39.4-Y39.6) 3.0 3.5 U 3.3 3.9
All causes (Y30-Y39) 21.5 25.4 ] 29.5
1 r
Isee APPendix II_ffor exPl~n~tio~ of comparabilityof CaUSf? -of-death classifications.
Table 8 shows stillbirthratesaccordingtothese socialclasses.The actualnumbers inclassesI and IIaresmalland so make theratessomewhat unstable,butthetableshows clearlythatthoughtherateshave falleninallclasses,disparityof theratesbetweenclassIandclassVis now greaterthanin1939.
Mw-635 O - G6 - 3
When thenumbers of stillbirthsin classesIand II,and IVandVarecombined,itimpossible
to calculatemore stablerates for groups ofcauses of death by socialclass,as shown intableH. Itis in such conditionsasantepartumhemorrhage,fetaldefects,difficultlabor,and
11
ill-defined and other causes that there is the greatest difference between the combined classes I and II, and IV and V. In 196390 percent of still-births took place in maternity institutions where obstetrical skill is available, so lack of adequate attention should seldom be called in question.
There is always a difference of between 8 and 10 per 1,000 stillbirths between combined classes I and II, and IV and V; this difference has persisted despite a falling rate during the past 12 years. The excess is greatest as has already been said in antepartum hemorrhage, fetal defects, and difficult labor. Presumably the biological condition of women in classes I and II is better than that of women of the less privileged classes; also it is highly probable that their intelligence is such that they themselves are able to give consideration to and to secure treatment for any early departure from complete well-being. Such women are also likely to ensure that their pregnancies will be so spaced that they are fully restored to health in the intervals. It is difficult to account for the preponderance of fetal defects in classes IV and V, except by biological selection, lack of intelligence, or a greater liability to infection by viruses or other organisms.
PERINATAL AND NEONATAL
MORTALITY
First Year of Life
In Scotland the infant mortality rate, which had been falling gently since the turn of the centur y, began to fall rapidly after 1941. Analysis shows that the improvement was chiefly in the postneonatal period. Such betterment as there was in the first month of life was between the ages of 1 week and 1 month. There was some improvement in the 1-6 day period but very little in the first 24 hours. In table 9 the infant mortality rates by ages under 1 year show the yearly progress at all age periods from 1936 through 1963. The table shows that the infant mortality rate has now fallen to less than one-third of its value in 1936, but the rate for deaths in the first day of life shows comparatively less change and has fallen about 28 percent in that period.
First Week and First Month
For some time attention had been focused on infants during their first month of life. Soon the realization followed that it was almost a matter of chance whether some infants would be born live or still, and that many of the causes of early infant deaths, similar to those of stillbirth, were attributable to conditions of intrauterine rather than extrauterine life. Because of the similarity of the causes of stillbirth and early infant deaths, the term ‘‘perinatal mortality” has been adopted to cover stillbirths and deaths in the first week of life. The perinatal mortality rates now are approximately half those of 1939, when stillbirths were first registered.
The attention already directed on stillbirths and deaths in early infancy emphasized the differences between the stillbirth and infant death codings and because of these differences the need for a perinatal death rate was felt to be essential. Considerable thought and discussion were given to the matter of a cause list for the combined mortalities. It was felt that the stillbirth cause list in use was in the main satisfactory and that any combined list should interfere as little as possible. In 1958 as an experiment the causes of infant deaths in the first month of life were coded to the stillbirth rubric. This classification has been continued.
The figures tabulated for the years 1958 and 1959 showed that about 98 percent of deaths occurring in the first 24 hours of life and 95 percent of those occurring in the first week of life could be satisfactorily classified to the stillbirth cause list. Indeed in the first 28 days of life over 90 percent of deaths could also be so allocated.
Table 10 has been compiled for the years 1960-62. In this table the stillbirth and neonatal death rates per 1,000 total births are classified according to the stillbirth rubric.
Table 10 brings out the contention that most of the important individual causes of death operate in both parts of the perinatal death rate. With respect to stillbirth, causes ascribed to diseases and conditions of pregnant y and childbearing, placental and cord conditions, and congenital malformations operate more importantly than in early life. Conditions which survive birth and cause death in the
12

first 6 days of life are birth injuries, congenital malformations, and asphyxia and atelectasis.
The outstanding causes ofneonatal deaths are likewise immaturity, asphyxia, and birth injury. It would appear that environmental influences on the whole play little part in the causation of death in the first month of life as long as the child is born fit and strong.
Throughout the period 1931-63 the death rates from congenital malformations at all ages have shown no improvement. In recent years much re-search has gone into the causes of fetal abnormality and, though more is now known about their origin and development, not enough information is available to prevent their occurrence or even to have any real effect on the stillbirth or infant death rates. Presumably one of the reasons for this is that these abnormalities originate early in pregnant y— some even before the woman is fully aware that she is pregnant.
Injury at birth has shown no improvement thoughout the period under review (1939-63), which is surprising in view of the great extension of maternity hospital provision and of the increase in the number of skilled obstetricians since 1931. Also in the earlier decades of the century rickets and in consequence deformed pelves were causes of difficult labor in large numbers of women, but nowadays a deformed pelvis is comparatively rare. It is not easy to account for this lack of improvement in the rate for birth injury in the Iiveborn child, although there has been some reduction of injuries sufficient to cause stillbirth.
Of the causes of diseases of early infancy the greatest decrease has been shown in debility and prematurity, the combined rate for these conditions having fallen from 27.3 to approximately 3.8 per 1,000 live births.
Table 11 has been compiled to show the effects of age of mother, birth order, and social class on perinatal mortality. At all ages and for all parities the rates increase with lowering social status. For all social classes the death rates of children born to parturients under 20 years of age are higher than those for children born of women in the 20-30 age groups; above age 30 the rates in-crease rapidly. For most classes and most ages the rates for firstborn children are higher than those born of the second and third pregnancies; for the fourth and subsequent pregnancies the rates
rise steeply. Parity and age of the woman indicate that when pregnancies follow too rapidly the prognosis for the latest child is poor.
It would seem therefore that increasing care of the pregnant woman, improvement of her physical condition, and reasonable spacing of pregnancies all play a part in the successful outcome of any individual pregnancy, but these factors are difficult to measure and evaluate separately.
Table J shows that though women of all social classes have benefited from modern care during pregnancy, parturition, and the early post-natal period, at present the rates for classes I and II are approximately half of those of IV and V. This disproportionate smial class difference has persisted since these rates were first calculated in 1939, despite equal hospital and specialist care, and probably lies in the physical superiority of the higher class woman and in her greater intelligence in making full use of the services available and in successful family planning so that each newly born child can have adequate maternal care for perfect nurture.
The reason for these class differences in reproductive efficiency is not easy to evaluate and it would appear that measurable biological indices such as age and parity are not the whole story. There seem to be other biological and social factors which affect pregnancy outcome despite readily available medical care during the antepartum, intrapartum, and postpartum periods. Kincaid working on information collected in the National Perinatal Survey and also on more de-tailed aspects of the social data studies in Aberdeen maintains that it is “not isolated factors but whole patterns of behaviour” 5 which must be considered, in fact the whole way of life of the women concerned. The close association between maternal stature and the outcome of pregnant y was first noted by Sir Dugald Baird and confirmed by the results of the Perinatal Mortality Survey.b It has been found that tall women tend to have lower stillbirth rates than women of medium height and these women in turn experience lower rates than women of even lower stature. Illsley and Kincaid (1963)7 showed that the association be-tween maternal stature and perinatal mortality holds even when socioeconomic group and parity are simultaneously controlled. Kincaid has suggested that a tentative explanation of this may be that though potential height may be determined
13

Table J. Neonatal mortality rates by social class: Scotland, 1939 and 1946-63
Social c’lass Year
I II III Iv v
1963-------------------------------1962-------------------------------1961-------------------------------1960-------------------------------1959-------------------------------1958-------------------------------1957-------------------------------1956-------------------------------1955-------------------------------1954-------------------------------1953-------------------------------1952-------------------------------1951-------------------------------1950-------------------------------1949-------------------------------1948-------------------------------1947-------------------------------1946-------------------------------1939-------------------------------
Rate per 1,000 live births
13.2 15.8 19.3 22.312? 12.9 17.2 20.2 22.9 13.3 13.2 17.7 19.5 21.6 13.0 17.2 17.1 20.7 21.0 13.7 16.4 18.8 20.5 24.0 15.0 14.2 18.4 18.4 24.2 14.1 16.4 19.5 20.1 22.2 11.0 13.5 19.0 22.0 22.1 15.8 16.7 18.3 22.4 24.3 13.4 16.0 20.8 20.7 25.6 14.8 16.2 19.0 21.4 22.0 12.9 18.2 21.8 23.2 24.2 14.6 15.2 22.1 23.3 29.7 20.0 16.5 22.7 24.9 28.5 13.7 17.9 22.6 24.4 31.3 15.0 16.4 24.6 28.7 30.5 17.8 19.3 27.2 29.7 :;.: 16.7 25.0 29.3 31.1 25.9 25.1 38.6 34.8 39:9
genetically, actual height depends inexperience of nutrition and family care during the periodof growth. In other words as the number ofchildren in the family increases, scarcityofresourcesand maternal care begins tohavealong-termeffecton the stature of the children. In women who have been born into families of nonmanual workersa steep rise in the stillbirth rates does not come until the woman hasfourormore siblings whereas in the unskilled manual group there is an appreciable rise between the no-sibling and the one-sibling categories. Thus, it would seem, thatin some measure thereproductiveoutcome ofwomen reaching childbearing ageispredeterminedwithin a matrix of biological, medical, and social influences; therefore, in this country long-term measures are necessary to improve the physical and social environment of the future childbearing women now growing up.
POSTNEONATAL MORTALITY
Earlier in this study it was stated that, while the first year of life is a convenient statistical unit of time, insofar as the individual causes of
14
death are concerned it can be divided into two periods. It has been shown already that in the first month oflife the maincauses ofdeath derive from intrauterine conditions andintrapartum procedures. Those occurring after the first monthof life withone exception,congenital malformations, are connected chiefly withenvironmentalcircumstances. In the neonatal period deaths from infectious fevers , and respiratory and gastrointestinal conditions are rare, as are deaths from accidental mechanical suffocation and violence. Death from congenital malformation could bedescribedas the only cause of death which persists significantly after the 28th day of life.
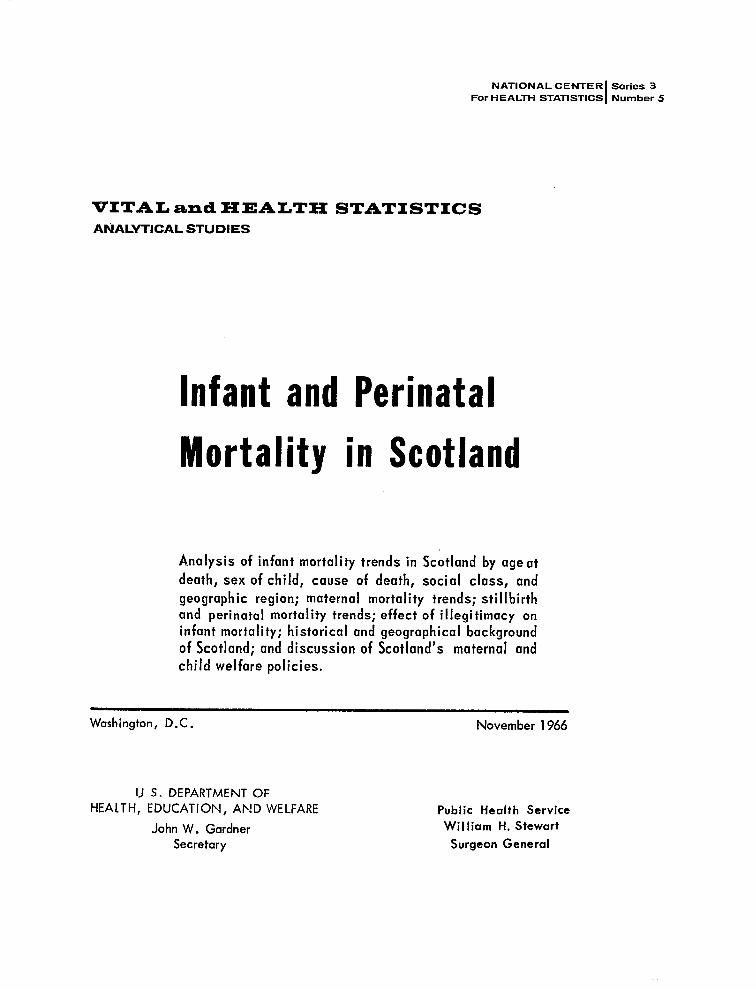
Of what might be termed environmental causes, respiratory disease now takes firstplace (see table 12) followed by accidents, including accidental mechanical suffocation. Diarrhealdiseases, which used to be a potent cause of death, are gradually disappearingas hygieneandhousing improve. Deaths from the ordinary infectious diseases and tuberculosis which two decades ago were responsible for many infant deaths, have now regressed almost completely. It would appear, therefore, that later infant mortality is
----
11
m ,,.,
: 30 -i o00_.@ 20 -
E
u1-g 10
0I II
I SOCIAL CLASS I
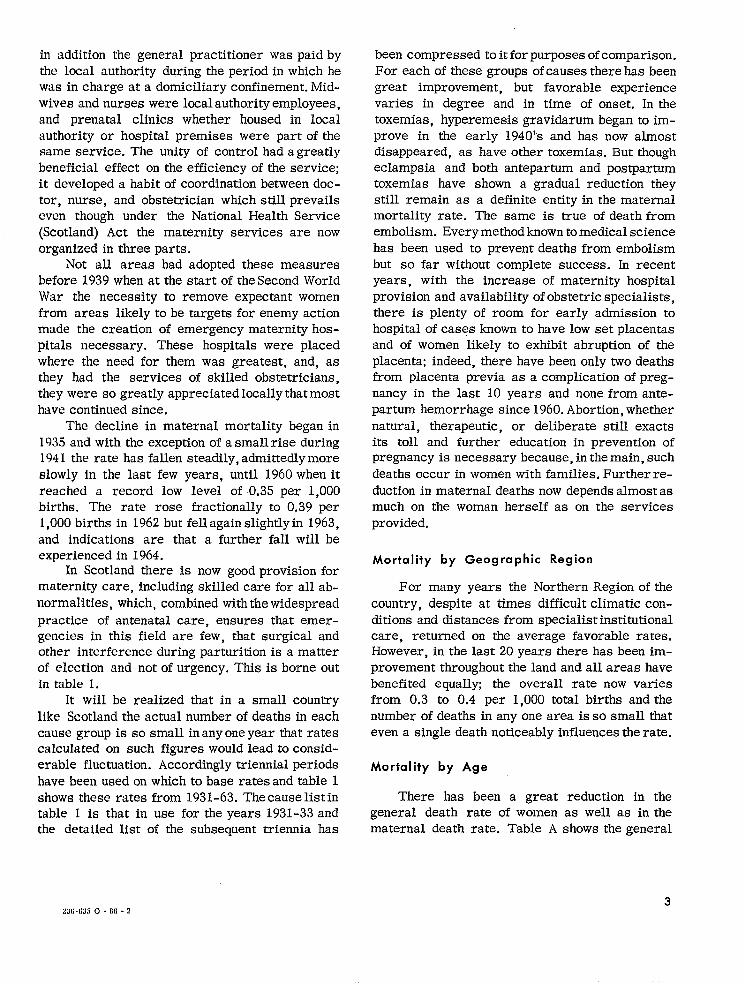
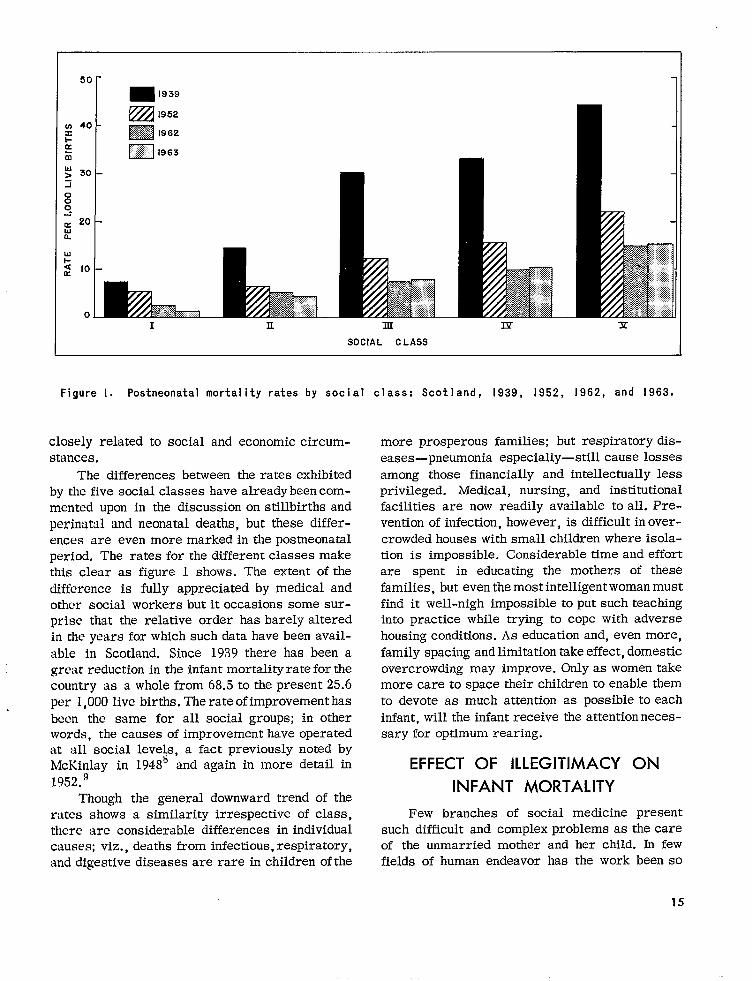
Figure 1. Postneonatal mortality rates by social class: Scotland, 1939, 1952, 1962, and 1963.
closely related to social and economic circumstances.
The differences between the rates exhibited by the five social classes have alreadybeen commented upon in the discussion on stillbirths and perinatal and neonatal deaths, but these differences are even more markedin the postneonatal period. The rates for the different classes make this clear as figure 1 shows. The extent of the difference is fully appreciated by medical and other social workers but it occasions some surprise that the relative order has barely altered in the years for which such data have been avail-able in Scotland. Since 1939 there has been a great reduction in the infant mortality rateforthe country as awholefrom 68.5 to the present 25.6 per l,OOOlive births. Therateofimprovementhas been the same for all social groups; in other words, the causes of improvement have operated at all social levels, a fact previously noted by McKinlay in 1948~ and again in more detail in 1952.9
Though the general downward trend of the rates shows a similarity irrespective of class, there are considerable differences in individual causes; viz., deaths from infectious,respiratory, and digestive diseases are rare in children of the
more prosperous families; but respiratory diseases—pneumonia especially—still cause losses among those financially and intellectually less privileged. Medical, nursing, and institutional facilities are now readily available to all. Prevention of infection, however, is difficult in over-crowded houses with small children where isolation is impossible. Considerable time and effort are spent in educating the mothers of these families, but even the most intelligent woman must find it well-nigh impossible to put such teaching into practice while trying to cope with adverse housing conditions. As education and, even more, family spacing and limitation take effect, domestic overcrowding may improve. Only as women take more care to space their children to enable them to devote as much attention as possible to each infant, will the infant receive the attention necessary for optimum rearing.
EFFECT OF ILLEGITIMACY ON
INFANT MORTALITY
Few branches of social medicine present such difficult and complex problems as the care of the unmarried mother and her child. In few fields of human endeavor has the work been so
15
exacting. It is of the utmost importance that help should be wisely directed, for the effect of mistakes may last for the lifetime of mother and child and may even be the cause of difficulties in the next generation.
In this country of all live births the percent-age of children born illegitimately reached its highest point about a hundred years ago (1863— 10.0 percent). It fell gradually to 6.5 percent in the quinquennium 1901-5, then rose gradually to an average of 7.6 percent during the World War I years. Subsequently the rate improved, except in 1941-45, until 1958 when it showed a tendency to rise and it now stands at 5.2 percent of live births. (See table 13.) It is difficult to give a good reason why this recent rise should have taken place especially as there are fewer women than men below the age of 35 years. Certainly young people are maturing earlier than formerly and this may lead to sexual relationship before they are fully able to realize the consequences of their actions. There tends to be a high rate of pregnancy among delinquent girls who are often themselves illegitimate so that the problem seems to be self-perpetuating.
About one-third of the children legally defined as illegitimate are no problem because the parents are cohabiting and make a good home for them. In 1962, 325 births were reregistered. These children were born legally illegitimate but under Scottish Law they are legitimized by the subsequent marriage of the parents, provided there was no bar to marriage at the time of birth. Also in 1962, 1,486 illegitimate children of all ages under 21 years were adopted and of these 1,170 were under 2 years of age. Many other illegitimate children are received into the family of the mother’s parents. Local authorities are legally responsible for the welfare of the remainder.
Much comment has been made of the fact that the infant mortality rate of illegitimate children is higher than that of those legitimately born. It has already been shown that if parents are classified according to the Registrar-General’s five sccial classes, the infant mortality rate of children born into classes I and II is much lower than that of those born into classes IV and V. The better mortality rate experienced in classes I and H has a considerable effect on the national figure. In 1962 only 10 births to women in class I were
illegitimate, and few were born illegitimately to women in class II. So any modifying effect of the low mortality rate in these classes has little weight when the total mortality rate is computed. These illegitimate births are more numerous in the social classes III-V, so the children of women in these classes carry with them the biological inheritance of the mother.
There is ample provision in maternity hospitals and homes and unmarried women are sure of admission. Such women usually stay in the hospital for 10 to 14 days after delivery.
In spite of the much higher death rate in the neonatal period for illegitimate infants (31.9 as against 17.2 for legitimates), this makes a difference of only 0.7 in the national rate of 17.9. For deaths between 28 days and 1 year the infant mortality rate of legitimate children is 8.5 per 1,000 and of illegitimate children 11.2 per 1,000; the difference from the national rate is 0.1 per 1,000 live births. The difference made by illegitimate stillbirths to the national rate is 0.5 per . 1,000 live births.
SUMMARY
It has been demonstrated that the infant mortality rate fell steadily from the quinquennium 1896-1900 until 1941-45, then fell steeply until 1951-55, after which it fell only gradually until 1956-60, and since when there has been little improvement. Reasons have been put forward to explain why the rate gradually rose before 1897 despite improving environmental conditions. It is probable that house overcrowding, especially in urban areas, was an important factor. It is of interest to note that the 5-year curve of the infant mortality rate correlates almost exactly with the curve of the legitimate birth rate for married women. Presumably as the birth rate decreased, with the resultant smaller size of family there was a lessening of tlie burdens, both biological and physical, on the mother. The decrease in household density would tend to lessen the virulence of infections introduced to the home. The reduction of the numbers of dependent children with the wider spacing of births allows more maternal care to be given to each infant. Further, modern preventive inoculation and vaccination, combined with modern drugs, have saved many
16

young children and have prevented much of the disabling sequelae in the survivors.
At the turn of the 19th century and in the early years of this century it was realized that many of the defects in men presenting themselves for enlistment in the Boer War and in the First World War had their origins in childhmd. This led to a widespread interest in child nurture, but at the same time obstetricians and pediatricians realized that many of these defects originated in pregnancy and parturition, and the y directed their efforts to more intensive care of pregnant and nursing women. This interest and care, intev alia, was of benefit to the girl babies who in due time became the mothers of the succeeding generation. It was then that the maternal and child welfare services and school health services were brought into being. Intensive schemes were formulated by the Central Government and local authorities. These schemes, which have been detailed, not only included medical care with special food supplements, but provided for the construction of the necessary clinics, homes, and hospitals.
The result of these endeavors is now seen in the fall in the maternal mortality rate from approximately 7 per 1,000 live births in 1928 to O,4 per 1,000 live births in Scotland in 1963. Puerperal sepsis, including postabortive sepsis, formerly a potent cause of death in the
mother, has declined almost to zero, as have hyperemesis gravidarum, antepartum hemorrhage, ectopic pregnancy, and placenta previa.
The obstetrical conditions showing least improvement are embolism and abortions, septic or nonseptic,
It is not easy to assess how much improvement in medical procedure has been responsible for this gratifying fall in the number of maternal deaths, for undoubtedly the antibiotic and other drugs and readily available blood transfusion facilities have helped. Also the improvement in the biological condition, especially of women of the younger childbearing ages, has contributed to
1, the improvement, shown by the fall in the age-specific death rate to one-tenth of the rate of 1’311-15.
Since 1939, when registration of stillbirths began in Scotland, the rate has fallen to less than half. Registration by cause of death emphasized the necessity for exactitude in diagnosis, which
stimulated the setting up of departments in the study of stillbirths and neonatal pathology, so that exact diagnosis is now reasonably assured. Registration has revealed (a) that there is less likelihood of a stillbirth occurring with the second pregnancy, (b) that mothers of the 20-24 age group have the most favorable experience, (c) that too rapidly succeeding pregnancies have a higher risk of stillbirth, and (d) that of all the causes of intrauterine deaths fetal defects are the most in-tractable. Although more knowledge of the causes of fetal defects has been gained in recent years, not enough is yet known to prevent them. It has also been shown that the biological condition of the mother affects the outcome of a pregnancy; for example, the stillbirth rate of women in social class I is less than half that in social class V.
It would seem that the dividing lines between a live birth, an early infant death, and a stillbirth are in some respects almost a matter of chance. This is borne out by the fact that of the deaths which occur in the first month of life over 90 percent can be classified to the stillbirth rubric. Like stillbirths, deaths from congenital malformations have shown no improvement since the quinquennium 1931-35 nor has birth injury or asphyxia at birth. The greatest improvement is in prematurity and debility, the rate of which is now one-eighth of that in 1931-35. Neonatal and perinatal deaths show a class distinction which has persisted and increased since the beginning of registration though in all the social classes improvement has resulted from modem medical and public health endeavors. In the neonatal period deaths from infectious fevers, and respiratory and gastrointestinal diseases are comparatively rare, but in the posmeonatal period deaths from what might be termed environmental and social conditions still take toll of infant life. Deaths from the acute infectious diseases are now few and those from gastroenteritis are decreasing with improved education in child care. If it were possible to eliminate respiratory diseases the posmeonatal deaths would be very few indeed. Accidents of various kinds will decrease only with continuous awareness. It is in deaths due to environmental conditions that social class distinction is most obvious—the rate for class I being now about one-fifth of that for class V. Illegitimacy y is in-creasing slightly in Scotland, but the rates are
17
lower than those of many more prosperous generations it cannot be said that it affects the countries. While this is a grave social problem infant mortality rate to any great extent. and one which may well cause difficulties in future
Acknowledgment
Theauthorgratefu lly acknowledges the important help received
from Mr. William Robertson, M. B. E., in the planning and prep
aration of this report.
000
18
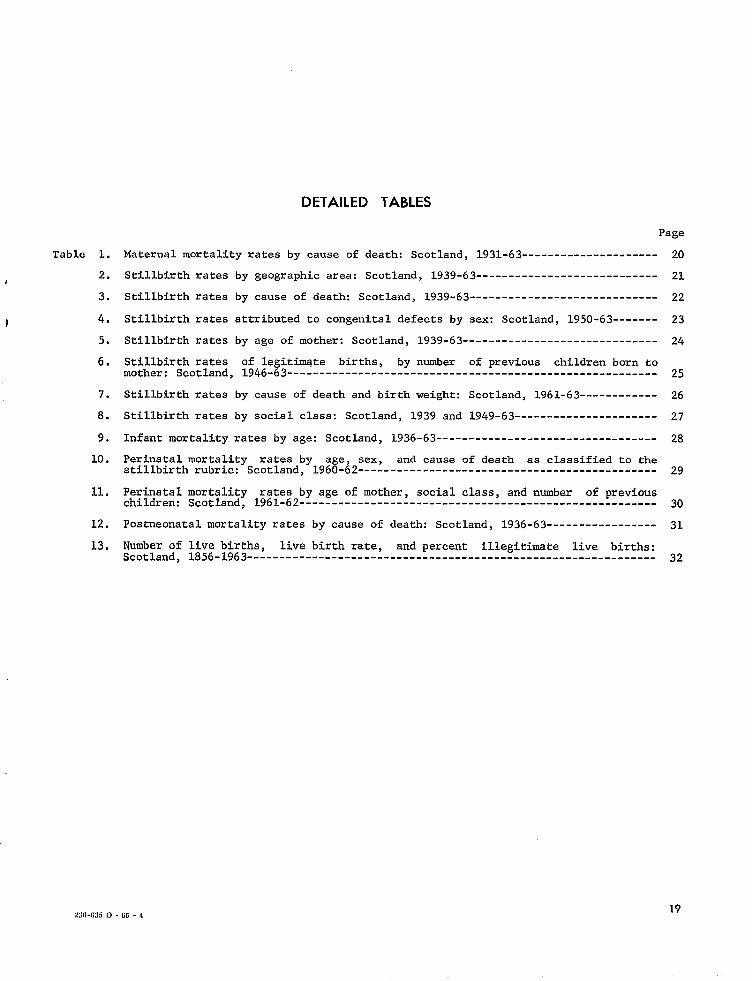
Table 1.
2.
3.
4.
5.
6.
7.
8.
9.
10.
11.
12.
13.
DETAILED TABLES
Page
Maternal mortality ratea by cause of death: Scotland, 1931-63--------------------- 20
Stillbirth rates by geographic area: Scotland, 1939-63---------------------------- 21
Stillbirth rates by cauae of death: Scotland, 1939-63----------------------------- 22
Stillbirth rates attributed to congenital defects by sex: Scotland, 1950-63------- 23
Stillbirth rates by age of mother: Scotland, 1939-63------------------------------ 24
Stillbirth rates of legit~te births, of previous children born tomother: Scotland, l946-63------------------------------------------------------- 25
Stillbirth rates by cause of death and birth weight: Scotland, 1961-63------------ 26
Stillbirth rates by social class: Scotland, 1939 and 1949-63---------------------- 27
Infant mortality rates by age: Scotland, 1936-63---------------------------------- 28
Perinatal mortality rates by age, sex, and cause of death aa classified to thestillbirth rubric: Scotland, l96O-62---------------------------------------------- 29
Perinatal mortality rates by age of mother, social claaa, and number of previouschildren: Scotland, l96l-62------------------------------------------------------- 30
Postneonatal mortality rates by cause of death: Scotland, 1936-63----------------- 31
Number of live births, live birth rate, and percent illegitimate live birtha:Scotland, l856-l963--------------------------------------------------------------- 32
1923G-63?I0- G6 -4
-----------
----------
-------
--------
------------
----------
------------------
Table 1. Maternal mortality ratea by cauae of death: Scotland, 1931-63
Cause of death 1L961- 1958- 1955- 1952- 1949- 1946- ;;::- ;;:- ;;;;- ;;w~- 1931-1963 1960 1957 1954 1951 1948 1933
Rate per 100,000 live births
All causes (640-689) 38 41 49 91 119 194 317 450 473 602 605_ _ _ -+
Eclampaia, antepartum and post-partum (642.2, 642.3, 686) 4 6 7 19 16 30 53 72 76 83 85
Hyperemesia gravidarum (642.4) 1 1 1 3 18 21 21 32
Other toxemias of pregnancy and parturition---(642.0, 642.1, 642.5) 3 2 5 5 8 9 11 25 15 18 23
Placenta previa---------- (643, 670A) 1 1 2 3 3 7 12 12 22 22 34
Antepartum and intrapartum hemor-rhage------------------- (644, 670B) 4 4 4 7 11 12 19 18 24 23
Ectopic pregnancy-------------- (645) 1 1 3 2 7 6 7 9 12 14
Other complications of pregnancy (reaidual 640-649) 2 2 1 3 2 3 3 7 3 4 6
Abortion nonseptic--------- (65O,652) 3 3 3 7 7 11 11 13 15 19 13
Postabortive senses (651) 3 3 2 3 9 8 27 39 35 44 31
Postpartum hemorrhage (672) 4 3 4 12 7 30 36 43 41 46 35
O:::hcomplications of child-------------(residual 670-678) 5 5 5 10 30 43 54 55 63 56 52
Puerperal aepsia--------------- (68l) 3 3 2 3 5 13 54 92 111 205 215
Embolism (682, 684) 7 5 10 15 13 18 31 39 40 39 32
Other unspecified causes--- (640-689) 3 3 3 4 9 3 4 9 5 9 11— —
Isee APPendix 111 for explanation of comparability of cause-of-death claasif icationa.
20
i

Table 2. Stillbirthrates by geographicarea: Scotland, 1939-63
Counties RegionCounties (excluding
Year All of cities counties areas and large of cities East West
1963---------------------
1962---------------------
1961---------------------
1960---------------------
1959---------------------
1958---------------------
1957---------------------
1956---------------------
1955---------------:-----
1954---------------------
1953---------------------
1952---------------------
1951---------------------
1950---------------------
1949---------------------
1948---------------------
1947---------------------
1946---------------------
1945---------------------
1944---------------------
1943---------------------
1942---------------------
1941---------------------
1940---------------------
1939---------------------
burghs and large ‘orthem Central Central Southern burghs) , 1 I f
Rate per 1,000 total births
19.1 19.6 1s.4 17.3 18.8 19.8 19.6
19.9 20.3 19.5 16.6 18.4 21.7 21.6
20.8 2L.5 19.8 17.3 20.0 22.1 23.0
21.7 22.2 21.2 1s.5 21.2 23.0 22.9
22.2 22.8 21.4 20.7 20.3 23.3 26.2
22.8 23.7 21,8 19.1 22.3 24.1 25.9
23.7 23.3 24.2 19.9 22.7 25.4 24.7
23.9 24.4 23.2 22.1 23.4 24.8 22.7
24.6 24.7 24.4 18.4 26.1 25.8 25.5
25.3 26.4 24.1 20.7 25.3 27.0 25.5
24.8 25.5 23.9 21.5 25.0 25.9 23.9
26.2 26.6 25.6 22.1 26.2 27.9 23.S
26.6 27.1 26.0 23.5 26.4 28.0 25.7
26.9 28.2 25.3 22.7 25.9 28.8 29.7
27.1 27.7 26.4 22.6 27.4 28.6 21.4
28.7 29.8 27.4 26.6 27.7 30.3 26.1
30.5 29.8 31.5 27.6 29.2 32.3 31.6
32.3 34.7 29.3 28.6 32.0 33.9 32.2
32.8 3301 32.5 29.9 32.4 34.4 29.1
32.5 33.6 31.2 28.4 31.5 34.8 29.0
35.6 37.0 33.9 32.6 35.9 36.5 35.8
38.2 40.2 35.9, 33.7 38.0 40.8 30.5
39.6 41.9 36.8 32.1 38.7 43.1 35.9 I
42.1 42.4 41.7 40.1 43.1 42.7, 37.6
42.2 42.1I 42.5 39.3 42.4 43.2 42.0 J J
21
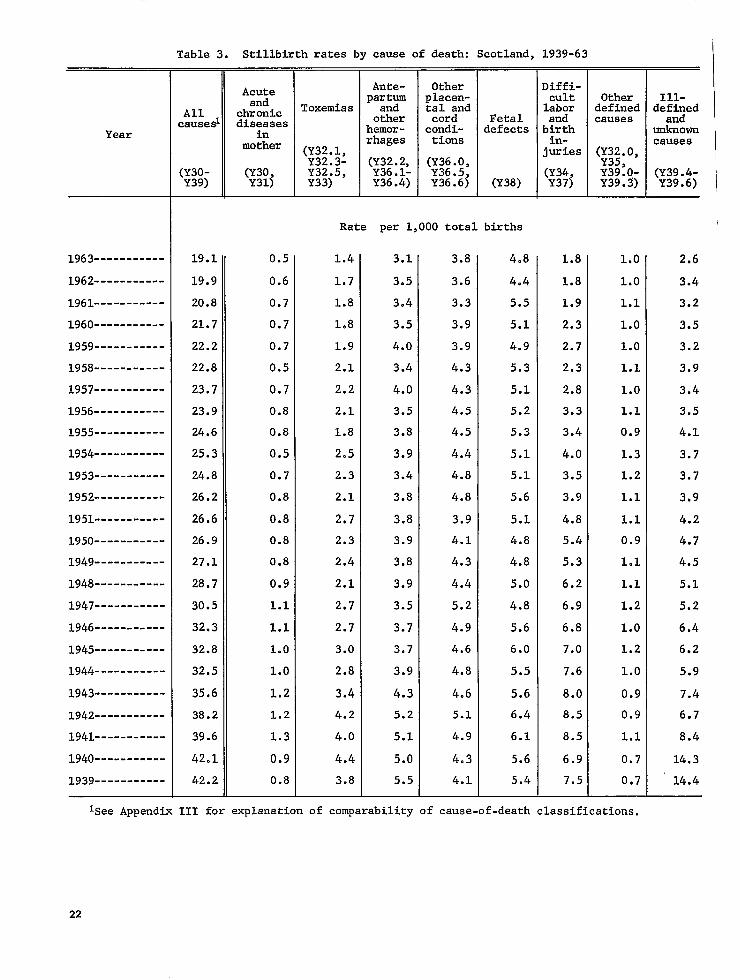
Table 3. Stillbirthrates by cauae of death: Scotland, 1939-63
Acute Ante- Other Diffi
and partrn placen- cult Other Ill-
All chronic Toxemias tal and labor defined defined
Year in mother (;::.;,
hemor-rhage
condi-tiona
defects birth in-juries (;:;.o,
unknown causes
(~;:.~ (:::~:, (Y30- (:::3 Y32:5; (;:;5 Y39:o- (Y39.4-Y39) Y33) Y36:4~ Y36.6\ (Y38) Y39.3) Y39.6)
causesl diseasea other cord Fetal and causes and
1963-----------
1962-----------
1961-----------
1960-----------
1959-----------
1958-----------
1957-----------
1956-----------
1955-----------
1954-----------
1953-----------
1952-----------
1951-----------
1950-----------
1949-----------
1948-----------
1947-----------
1946-----------
1945-----------
1944-----------
1943-----------
1942-----------
1941-----------
1940-----------
1939-----------
Rate per 1,000 total births
19.1 0.5 1.4 3.1 3.8 4.8 1.8 1.0 2.6
19.9 0.6 1.7 3.5 3.6 4.4 1.8 1.0 3.4
20.8 0.7 1.8 3.4 3.3 5.5 1.9 1.1 3.2
21.7 0.7 108 3.5 3.9 5.1 2.3 1.0 3.5
22.2 0.7 1.9 4.0 3.9 4.9 2.7 1.0 3.2
22.8 0.5 2.1 3.4 4.3 5.3 2.3 1.1 3.9
23.7 0.7 2.2 4.0 4.3 5.1 2.8 1.0 3.4
23.9 0.8 2.1 3.5 4.5 5.2 3.3 1.1 3.5
24.6 0.8 1.8 3.8 4.5 5.3 3.4 0.9 4.1
25.3 0.5 2.5 3.9 4.4 5.1 4.0 1.3 3.7
24.8 0.7 2.3 3.4 4.8 5.1 3.5 1.2 3.7
26.2 0.8 2.1 3.8 4.8 5.6 3.9 1.1 3.9
26.6 0.8 2.7 3.8 3.9 5.1 4.8 1.1 4.2
26.9 0.8 2.3 3.9 4.1 4.8 5.4 0.9 4.7
27.1 0.8 2.4 3.8 4.3 4.8 5.3 1.1 4.5
28.7 0.9 2.1 3.9 4.4 5.0 6.2 1.1 5.1
30.5 1.1 2,7 3.5 5.2 4.8 6.9 1.2 5.2
32.3 1.1 2.7 3.7 4.9 5.6 6.8 1.0 6.4
32.8 l.O 3.0 3.7 4.6 6.0 7.0 1.2 6.2
32.5 1.0 2.8 3.9 4.8 5.5 7.6 1.0 5.9
35.6 1.2 3.4 4.3 4.6 5.6 8.0 0.9 7.4
38.2 1.2 4.2 5.2 5.1 6.4 8.5 0.9 6.7
39.6 1.3 4.0 5.1 4.9 6.1 8.5 1.1 8.4
42.1 0.9 4.4 5.0 4.3 5.6 6.9 0.7 14.3
42.2 0.8 3.8 5.5 4.1 5.4 7.5 0,7 14.4
Isee Appendix 111 for explanationof comparabilityof cause-of-deathclassifications.
22
-------------------------------------
-----------------------------------------
-----------------------------------------------
-------------------------------------
Table 4. Stillbirthrates attributedto congenitaldefects by sex: Scotland, 1950-63
I I I
Cause of deathl 1962- 1959- 1956- 1953-1963 1961 1958 1955
Rate per 1,000 totalM&e male births
Total (Y38.O-Y38.7) 2.8 3.6 3.4 3.8— —
1.3 1.7 1.5 1.5Anencephalus------------------------------------------(y38.O)
Rydrocephalus (Y38,1) 0.8 1.1 1.1 1.3
1950-1952
3.7—
103
1.4
0.2
0.2
0.1
0.2
0.0
0.3
6.8
Spina bifids------------------------------------------(y38.2)001
Other malformationsof the centralnervous system-----(3)8.3) 0.1
Malformationsof the cardiovascularsystem------------(Y38.4) 0.l
Malformationsof other specifiedsystems--------------(y38.5) 0.2
Monster (Y38.6) 0.0
Other and unspecifiedmalformations-------------------(y38.7) 0.2
Female
Total (Y38.O-Y38.7) 6.4—
Anencephalua--------------------------------------.---(y38.O)4.3
Hydrocephalus-----------------------------------------(y38.l)1.0
Spina bifida------------------------------------------(y38,2)0.3
Other malformationsof the centralnervous system-----(3)8.3) 0.2
Malformationsof the cardiovascularsystem------------(y38.4) 0.1
Malformationsof other specifiedsystems--------------(y3805) 0.2
140nater'----------------------------------------------(Y38.6)0.O
Other and unspecifiedmslformationa-------------------(y38.7) 0.3
0.2 0.1 0.2
001 0.2 0.2
0.1 0.1 0.1
0.2 0.2 0.2
0.O 0.O 0.0
0.3 0.2 0.3
Rate per 1,000 totalfemale births
608 701 6.6. — — —
4.6 4.5 4.2 3.9
1.0 1.4 1.4 1.4
0.3 0.4 0.3 0.5
003 0.,2 0.2 0.2
0.1 0.0 0.0 0.l
D.2 0.2 0.2 0.2
D.O 0.0 0.1 0.0
2.2 0.3 0.3 0.4
Isee APPendi~ 111 for explanationof comparabilityof cause-of-deathclassifications.
23
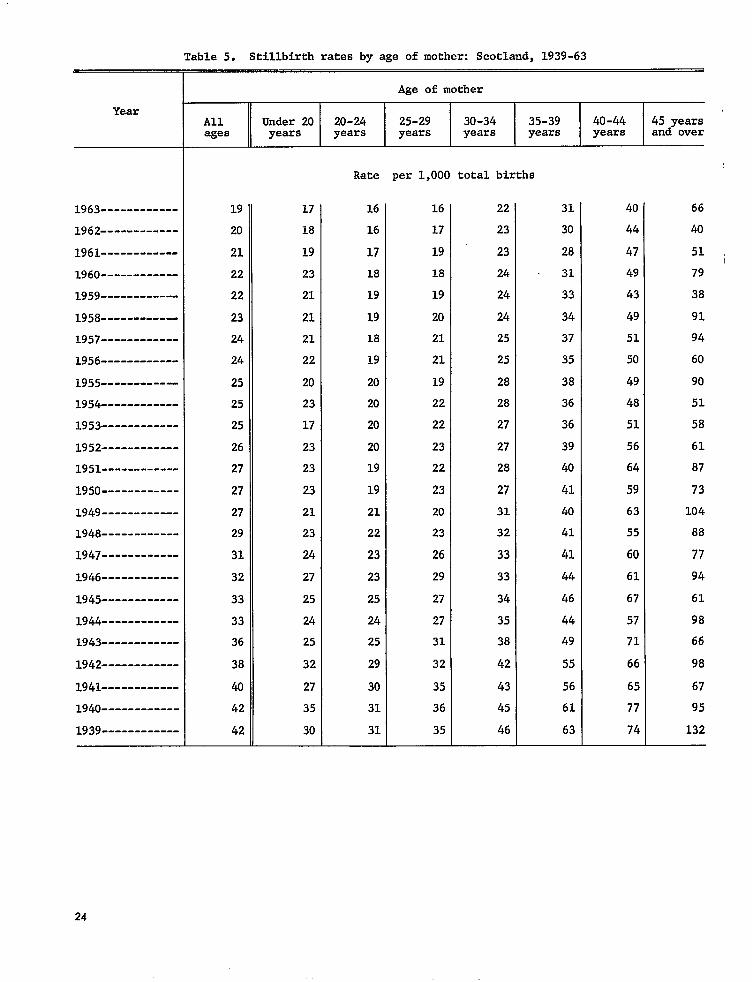
Table 5. Stillbirthrates by age of mother: Scotland,1939-63
Age of mother
Year ,All Under 20 20-24 25-29 30-34 35-39 40-44 45 yearsages years years years years years years and over
Rate per 1,000 total births
1963------------ 19 17 16 16 22 31 40 66
1962------------ 20 18 16 17 23 30 44 40
1961------------ 21 19 17 19 23 28 47 51
1960------------ 22 23 18 18 24 31 49 79
1959------------ 22 21 19 19 24 33 43 38
1958------------ 23 21 19 20 24 34 49 91
1957------------ 24 21 18 21 25 37 51 94
1956------------ 24 22 19 21 25 35 50 60
1955------------ 25 20 20 19 28 38 49 90
1954------------ 25 23 20 22 28 36 48 51
1953------------ 25 17 20 22 27 36 51 58
1952------------ 26 23 20 23 27 39 56 61
1951------------ 27 23 19 22 28 40 64 87
1950------------ 27 23 19 23 27 41 59 73
1949------------ 27 21 21 20 31 40 63 104
1948------------ 29 23 22 23 32 41 55 88
1947------------ 31 24 23 26 33 41 60 77
1946------------ 32 27 23 29 33 44 61 94
1945------------ 33 25 25 27 34 46 67 61
1944------------ 33 24 24 27 35 44 57 98
1943------------ 36 25 25 31 38 49 71 66
1942------------ 38 32 29 32 42 55 66 98
1941------------ 40 27 30 35 43 56 65 67
1940------------ 42 35 31 36 45 61 77 95
1939------------ 42 30 31 35 46 63 74 132—
24
i

-----------------------
Table 6. Stillbirthrates of legitimate births, by number of previous children born to mother: Scotland,1946-63
. . . II Number of previous children ALL
Year paritieso 1 2 3 4 5 6 7 8 9 10+
. Rate per 1,000 total legitimatebirths
1963----------------------- 19 lg 14 16 21 24 36 37 27 36 47 55
1962----------------------- 20 2C l? 18 24 29 32 33 37 46 47 46.
1961----------------------- 20 21 15 18 24 27 31 32 47 48 40 34
1960----------------------- 21 21 15 19 23 29 33 40 51 46 79 83
1959----------------------- 22 22 15 21 25 30 41 39 38 38 25 52
1958----------------------- 23 24 17 23 22 30 27 34 40 62 40 60
1957----------------------- 23 25 17 20 27 36 34 39 38 75 43 76
1956----------------------- 23 25 16 23 25 33 40 31 44 50 49 49
1955----------------------- 24 24 18 23 26 30 40 41 49 65 56 76
1954----------------------- 25 26 18 24 27 33 38 49 46 48 45 50
1953----------------------- 24 26 17 23 26 31 34 39 56 50 35 53
1952----------------------- 26 28 18 24 25 33 36 39 48 50 58 69
1951----------------------- 26 27 18 23 30 36 41 60 56 41 67 78
1950----------------------- 27 27 18 25 32 36 36 50 45 49 36 64
1949----------------------- 27 28 17 24 31 32 43 54 64 42 61 80
1948----------------------- 28 30 20 26 31 36 41 42 59 47 66 75
1947 30 33 21 26 31 38 39 42 53 48 47 76
1946----------------------- 32 36 21 26 33 40 42 46 52 57 61 74— — — —
25
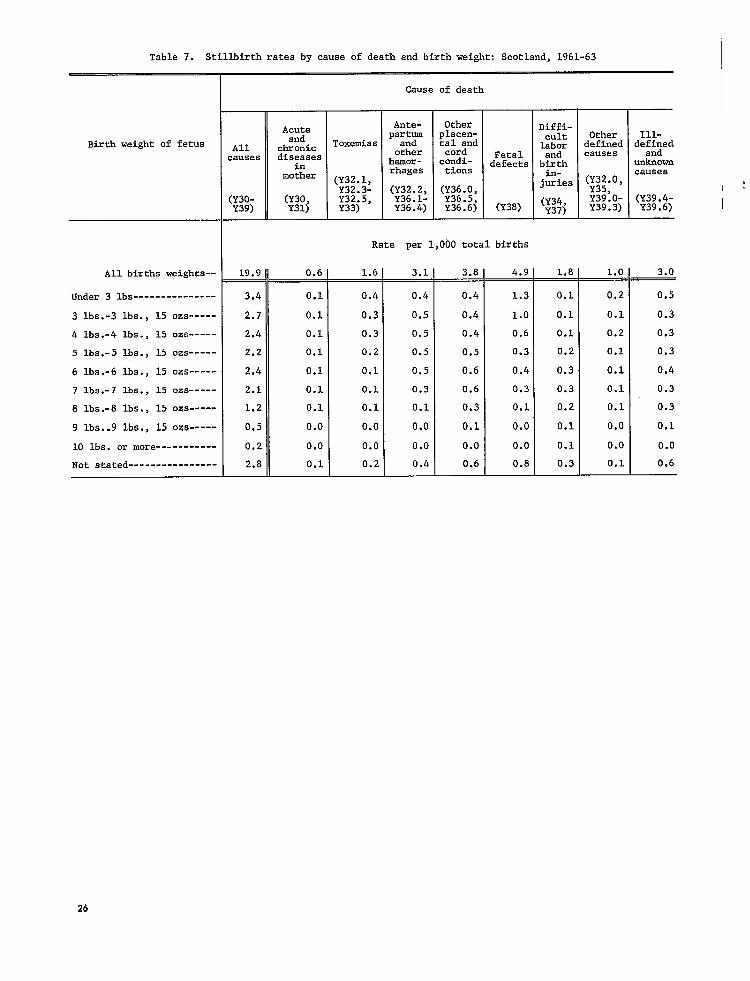
-----------
Table 7. Stillbirth rates by cause of death and birth weight: Scotland, 1961-63
Cause of death
Ante- Other Diffi-Acute part? placen- cult Other Ill-andBirth weight of fetus All chronic Toxemias tal and labor defined de~~d
other cord Fetal and causescauses diseaaes hemOr- cnndi- defects birth unknowninmother
rhages tiona ‘- cauaea(;;;.:, j=ies (;:;.0, ,
(;;~.:, (Y36.0, (Y30- (Y30, Y32:5; Y36.5, (Y39.4-Y39) Y31) Y33) Y36:4; Y36.6) (Y38)
(Y34, Y39:o-. 3) Y39.6)-L Y37) Y39
Rate per 1,000 total births
All births weights-- 19.9 0.6 1.6 — 3.1 — 3.8 — 4.9 . 1.8 — 1.0 — 3.0
Under 3 lbs--------------- 3.4 0.1 0.4 0.4 0.4 1.3 0.1 0.2 0.5
3 lba.-3 lbs., 15 ozs----- 2.7 0.1 0.3 0.5 0.4 1.0 0.1 0.1 0.3
4 lbs.-4 lba., 15 ozs----- 2.4 0.1 0.3 0.5 0.4 0.6 0.1 0.2 0.3
5 lbs.-5 lbs., 15 OZS----- 2.2 0.1 0.2 0.5 0.5 0.3 0.2 0.1 0.3
6 lbs.-6 lbs., 15 OZS----- 2.4 0.1 0.1 0.5 0.6 0.4 0.3 0.1 0.4
7 lbs.-7 lba., 15 oza----- 2.1 0.1 0.1 0.3 0.6 0.3 0.3 0.1 0.3
8 lbs.-8 lba., 15 oza----- 1.2 0.1 0.l 0.1 0.3 0.1 0.2 0.1 0.3
9 lbs.-9 lbs., 15 OZS----- 0.5 0.0 0.0 0.0 0.1 0.0 0.1 0.0 0.1
10 lbs. or more 0.2 0.0 0.0 0.0 0.0 0.0 0.1 0.0 0.0
Not stated---------------- 2.8 0.1 0.2 0.4 0.6 0.8 0.3 0.1 0.6
26

------------------------ ----
----------------------------------------------------
----------------------------------------------------
--------------------------------------------
----------------------------------------------------
----------------------------------------------------
------- --------------------------------------
----------------------------------------------------
---------------- ----------------
---------------- ----------------------------
Table 8. Stillbirthrates by social class: Scotland,1939 and 1949-63
Social class
Year I I I II II III Iv v
Rate per 1,000 total births
l963----------------------------------------------------10.8 15.6 18.2 21.0 25.1
1962 -.---------.--------.--- 11.1 16.6 19.1 21.7 27.0
1961 12.9 16.4 20.1 23.2 25.7
1960 12.8 16.8 20.8 24.7 26.4
l959----------------------------------------------------13.5 15.4 21.8 24.4 26.9
1958----.--- 16.5 20.7 21.9 24.7 27.1
l957----------------------------------------------------17.1 20.8 21.5 29.2 29.7
1956 17.4 19.9 22.8 25.5 29.5
l955----------------------------------------------------16.1 17.3 23.2 29.5 30.6
l954----------------------------------------------------17.6 22.0 24.1 28.3 29.9
1953 13.2 21.0 23.9 27.4 29.7
1952 --.---- 19.7 23.9 25.3 27.8 29.9
1951 14.7 22.9 25.1 3101 32.2
1950 -----.-- ----.-----.- 16.3 22.5 26.3 29.0 32.1
l949----------------------------------------------------17.3 21.4 26.5 28.7 35.0
1939 ..------- 34.1 38.1 44.9 38.3 42.7 —
27
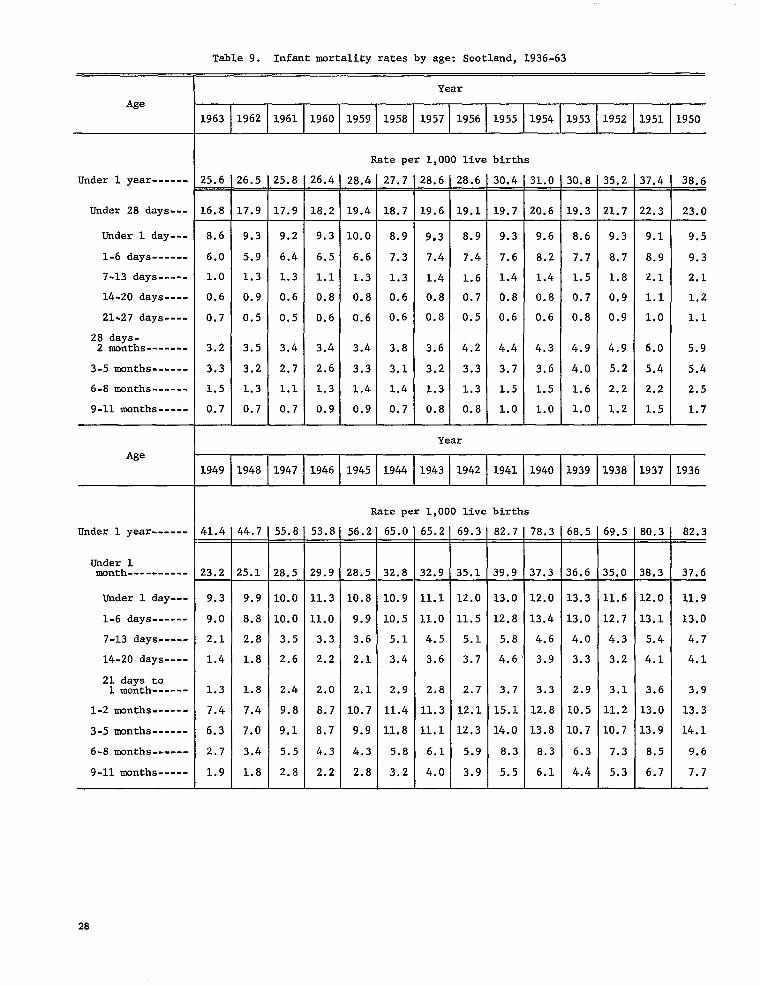
Table 9. Infant mortality rates by age: Scotland, 1936-63
Year
Age
1963 1962 1961 1960 1959 1958 1957 1956 1955 1954 1953 1952 1951 1950
Under 1 year------
Under 28 days---
Under 1 day---
1-6 days------
7-13 days-----
14-20 days...-
21-27 days----
28 days-2 months-------
3-5 months------
6-8 months------
9-11 months-----
Age
Under 1 year------
Under 1month----------
Under 1 day---
1-6 days------
7-13 days-----
14-20 days----
21 days to1 month------
1-2 months------
3-5 months------
6-8 months------
9-11 months-----
Rate per 1,000 live births
25.6 z6.5 25.8 26.4 28.4 27,7 28.6 28.6 30.4 31.0 30.8 35.2 37.4 38.6-
16.8 17.9 17.9 18.2 19.4 18.7 19.6 19.1 19.7 20.6 L9.3 21.7 ?2.3 23.0
8,6 9.3 9.2 9.3 10.0 8.9 9*3 8.9 9.3 9.6 8.6 9.3 9.1 9.5
6.0 5.9 6.4 6.5 6.6 7.3 7.4 7.4 7.6 8.2 7.7 8.7 8.9 9.3
1.0 1.3 1.3 1.1 1.3 1.3 1.4 1.6 1.4 1.4 1.5 1.8 2.1 2.1
0.6 0.9 0.6 0.8 0.8 0.6 0.8 0.7 0.8 0.8 0.7 0.9 1.1 1.2
0.7 0.5 0.5 0.6 0.6 0.6 0.8 0.5 0.6 0.6 0.8 0,9 1.0 1.1
3.2 3.5 3.4 3.4 3.4 3.8 3.6 4.2 4.4 4.3 4.9 4.9 6.o 5.9
3.3 3.2 2.7 2.6 3.3 3.1 3.2 3.3 3.7 3.6 4.0 5.2 5.4 5.4
1.5 1.3 1.1 1.3 1.4 1.4 1.3 1.3 1.5 1.5 1.6 2.2 2.2 2.5
0.7 0.7 0.7 0.9 0.9 0.7 0.8 0.8 1.0 1.0 1.0 1.2 1.5 1.7
Year
I1949 1948 1947 1946 1945 1944 1943 1942 1941 1940 1939 1938 1937 1936
Rate per 1,000 live births
41.4 %4.7 55.8 53.8 56.2 65.0 65.2 69.3 82.7 78.3 68.5 69.5 80.3 82.3
23.2 ?5.1 28.5 29.9 28.5 32.8 32.9 35.1 39.9 37.3 36.6 35.0 38.3 37.6
9.3 9.9 10.0 11.3 10.8 10.9 11.1 12.0 13.0 12.0 13.3 11.6 12.0 11.9
9.0 8.8 10.0 11.0 9.9 10.5 11.0 11.5 12.8 13.4 13.0 12.7 13.1 13.0
2.1 2.8 3.5 3.3 3.6 5.1 4.5 5.1 5.8 4.6 4.0 4.3 5.4 4.7
1.4 1.8 2,6 2.2 2.1 3.4 3.6 3.7 4.6 3.9 3.3 3.2 4.1 4.1
1.3 1.8 2.4 2.0 2.1 2.9 2.8 2.7 3.7 3.3 2.9 3.1 3.6 3.9
7.4 7.4 9.8 8.7 10.7 11.4 11.3 12.1 15.1 12.8 10.5 11,2 13.0 13.3
6.3 7.0 9.1 8.7 9.9 11.8 11.1 12.3 14.0 13.8 10.7 10.7 13.9 14.1
2.7 3.4 5.5 4.3 4.3 5.8 6.1 5.9 8.3 8.3 6.3 7.3 8.5 9.6
1.9 1.8 2.8 2.2 2.8 3.2 4.0 3.9 5.5 6.1 4.4 5.3 6.7 7.7
28

-----------------------
----------------------------
----------------
--------
-----
------------------
-----------------------
---------------------------
----------------------------
----------------
--------
-----
------------------
Table 10. Perinatalmortality rates by age, sex, and cause of death as classifiedto the still.birth rubric: Scotland, 1960-62
-
Cause of death 21-27days
Male Rate per 1,000 total male births
All causes (Y30-Y39; 40.9 20.4 10.6 7.2 1.2 0.8 0.6 —_
Acute and chronic diseases in mother--(Y3O,Y31) 0.6 0.6 0.0 0.0
D~~;ss and conditionsof pregnancyand child-‘----------------------------(Y32.1-Y32.5]2.0 1.8 0.1 0.1 0.0 0.0 -
Difficult labor (Y34) 1.8 1.6 0.1 0.0 0.0
Birth injuries-----------------------------(y37)3.5 0.6 1.3 1.4 0.1 0.1 0.0 Antepartumand other hemorrhages----------------(y32.2,y3601-Y36c4) 4.5 4.1 0.3 0.1
Other placentaland cord conditions (Y36.0,Y36.5, Y36.6) 3.8 3.7 0.1 0.0 -
Congenitalmalformations-------------------(y38)7.1 3.4 1.2 1.3 0.6 0.3 0.2
Other defined causes (Y32.O,Y35.O-Y35.3,Y39.O-Y39.3) 1.8 1.2 0.4 0.2 0.0 0.0 -
prematurity-cause not stated------------(y39.5) 4.9 0.4 3.2 1.1 0.2 0.0 0.1
Asphyxia Y39.5C) 7.7 1.5 3.7 2.4 0.1 0.0 0.0
Ill-definedand unknown causes (Y39.4-Y39.6) 1.7 1.6 0.0 ‘0.0 - 0.0 .
No comparablestillbirthcause 1.6 0.2 0.6 0.3 0.3 0.3
Female Rate per 1,000 total female Lrths
and atelectasis--------(y39.5b,
All causes (Y30-Y39) 35.8 21.1 7.4 5.0 1.2 0.7 0.4—
Acute and chronic diseases in mother--(Y3O,Y31) 0.6 0.6 0.0 0.0
Di,,;es and conditionsof pregnancyand child---(Y32.l-Y32.5) l.a 1.7 0.1 0.0 0.0 -
Difficult labor (Y34) 1.4 1.3 0.1 0.0 0.0
Birth injuries-----------------------------(y37)2.1 0.5 0.9 0.6 0.1 0.0 0.0
Antepartumand otherY36.1-Y3604) 3.0 2.8 0.2 0.0
Other placentaland cord conditions (Y36.0,Y36.5, Y36.6) 3.6 3.5 0.1 -
Congenital malformations-------------------(Y38) 10.3 6.6 1.3 1.2 0.6 0.4 0.2
Other defined causes (Y32.O,Y35.O-Y35.3,Y39.O-Y39.3) 1.4 0.9 0.2 0.2 0.0
prematurity-cause not stated------------(Y39.5) 3.5 0.3 1.9 1.0 0.1 0.1 0.0
hemorrhages----------------(y32.2,
Asphyxia and atelectasis--------(Y39.5b,Y39.5c) 5.3 1.5 2.3 1.4 0.1 0.0 0.0
Ill-definedand unknown causes (Y39.4-Y39.6) 1.4 1.4 0.0 0.0 0.0 0.0
No comparablestillbirthcause 1.3 0.2 0.4 0.3 0.2 0.2
29

------------------
------------------
--------------------------------
------------------
------------------------
------------------
------------------
------------------
--------
------------------
------------------
Table 11. I?erinatalmortality ratesby age of mother, social class, and number of previous children: Scotland, 1961-62
Number of previous children
Age of mother and social claas
Total o 1 2 3 4 or more
All ages Rate per 1,000 total specifiedlegitimatebirths
All classes 34.4 35.8 26.1 30.8I 37.7 49.5
I and 11--------------------------- 25.1 26.0 21.5 32.0 111-------------------------------- 33.9 36.3 24.6~ 49.4 IV and V--------------------------- 40.1 40.6 32.1 53.2
Under 20 years
All classes 36.3 36.1 34.4 46.2 I *
I and 11--------------------------- 34.8 34.7 41.7 36.1 36.2 32.0 54.9 *
IV and V--------------------------- 36.4 35.9 36.1 42.1 *
20-24 years
All classes 29.6 32.0 25.0 28.8 33.4 44.5
I and 11--------------------------- 22.7 23.2 21.6 17.0 43.0 45.5 111--.----- . 28.8 32.1 22.9 29.7 26.5 29.5 IV and V--------------------------- 33.2 35.8 29.2 29.2 39.4 55.1
25-29 years
All classes 30.2 35.6 23.8 38.0
I and II--------------------------- 21.6 25.0 19.8 19.6 111-------------------------------- 30.3 36.9 23.4 37.8 IV and V--------------------------- 35.2 44.2 27.9 40.3
30-34 years
All classes 36.5 47.2 28.4 48.5
I and II--------------------------- 25.9 33.0 19.9 21.7 29.9 38.6111-------------------------------- 36.0 48.1 27.1 29.3 33.4 52.1IV and V--------------------------- 44.9 62.3 42.6 34.2 41.6 49.0
35-39 years
40 years and over
All classes 50.2 57.0 32.1 38.8 45.5 51.3
I and 11------------------- 25.7 25.6 29.6 14.1 29.1 21.8 111-------------------------------- 56.0 68.7 26.1 39.5 45.0 53.2 IV and V--------- 55.7 63.8 49.7 51.4 56.4 57.1
All classes 61.4 46.4 49.4 T
69.6
I and 11--------------------------- ::.; 31.3 37.7 53.3 49.3 48.9 III-------------------------------- 49.6 59.7 51.9 68.1 63.5 IV and V--------------------------- 71:3 55.6 40.7 65.6 48.3 84.6
30
111
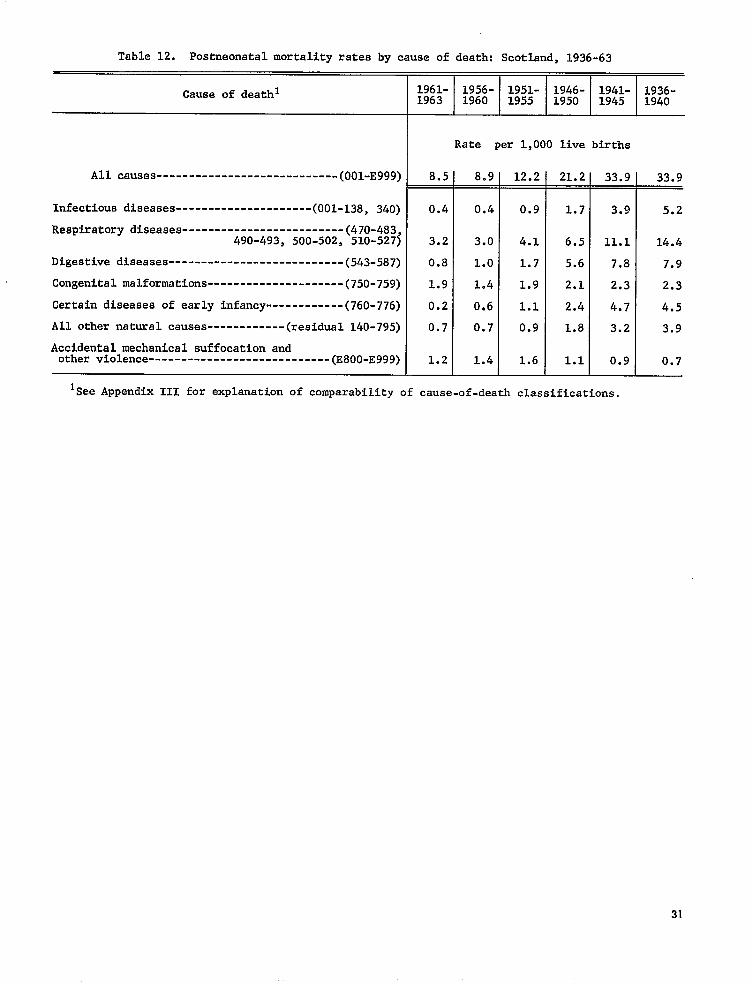
----------------------------
---------------------
------------
----------------------------
Table 12. Poatneonatalmortalityrates by cause of death: Scotland,1936-63
Cauae of deathlIfjl- 1956- 1951- 1946- 1941- 1936-163 1960 1955 1950 1945 1940
Rate per 1,000 live birtha
All causes (001-E999) 8.5 8.9 12.2 21.2 33.9 33.9— --
Infectiousdiseases (001-138,340) 0.4 0.4 0.9 1.7 3.9 5.2
Respiratorydiseasea-------------------------(47O-483, 490-493, 500-502, 510-527) 3.2 3.0 4.1 6.5 11.1 14.4
Digestivediseaaes---------------------------(543-587) 0.8 1.0 1.7 5.6 7.8 7.9
Congenitalmalformations---------------------(75O-759) 1.9 1.4 1.9 2.1 2.3 2.3
Certaindiseases of early infancy------------(76O-776) 0.2 0,6 1.1 2.4 4.7 4.5
All other natural causea (residual140-795) 0.7 0.7 0.9 1.8 3.2 3.9
Accidentalmechanical suffocationand other violence (E800-E999) 1.2 1.4 1.6 1.1 0.9 0.7
Isee Appendix 111 for explanationof comparabilityof cause-of-deathclassifications.
31

--------------------------------------------------------
--------------------------------------------------------
--------------------------------------------------------
--------------------------------------------------------
--------------------------------------------------------
--------------------------------------------------------
--------------------------------------------------------
--------------------------------------------------------
---------------------------------------------------
--------------------------------------------------------
--------------------------------------------------------------------- ----------------------------
-----------------------------------------------------
-----------------------------------------------------
-----------------------------------------------------
-----------------------------------------------------
----------------------------------------------------
-----------------------------------------------------
-----------------------------------------------------
-----------------------------------------------------
-----------------------------------------------------
Table 13. Number of live births, live birth rate, and percent illegitimate live births: Scotland, 1856-1963
of Live birth Percent------------------------dumberYear live rate per
Illegitimate1,000births population Livebirths
102,691 19.7 5.2
1962 104,334 20.1 4.8
1961 101,169 19.5 4.6
1960 101,292 19.6 4.4 l959--------------------------------------------------------99,251 19.2 4.2
l958--------------------------------------------------------99,481 19.4 4.1
1957 97,977 19.1 4.1
l956--------------------------------------------------------95,313 18.6 4.3
l955--------------------------------------------------------92,539 18.1 4.3
l954--------------------------------------------------------92,315 18.1 4.5 l953--------------------------------------------------------90,913 17.8 4.7
l952--------------------------------------------------------90,422 17.7 4.8
1951 90,639 17,8 5.1
1950 92,530 18.1 5.2 l949--------------------------------------------------------95,674 18.7 5.5 1948 100,344 19.7 5.8
l947--------------------------------------------------------
104,413 20.3 6.7 l945--------------------------------------------------------86,924 16.9 8.7 1944 95,920 18.5 7.9 1943 --.-- 94,669 18.4 7.6
l942--------------------------------------------------------90,703 17.6 7.2
113,147 22.3 5.6
l946--------------------------------------------------------
1941 89,748 17.5 6.6
1936-40 87,734 17.6 6.2--------=1931-35 89,306 18.2 6.9
1926-30 96,674 19.3 7.3l92l-25-----------------------------------------------------112,245 23.0 6.8
1916-20 109,750 22.8 7.61911-15 120,654 26.4 7.21906-10 128,987 27.6 7.1l9ol-5------------------------------------------------------132,399 29.2 6.5
1896-1900 130,209 30.0 6.8
l89l-95-----------------------------------------------------125,800 30.5 7.41886-90 123,977 31.4 8.0l88l-85-----------------------------------------------------126,409 33.3 8.3
126,086 34.8 8.5
l87l-75-----------------------------------------------------120,376 35.0 9.1
1866-70 114,394 34.9 9.9
1861-65 109,764 35.1 9.8
1856-60 102,462 34.1 8.7
32
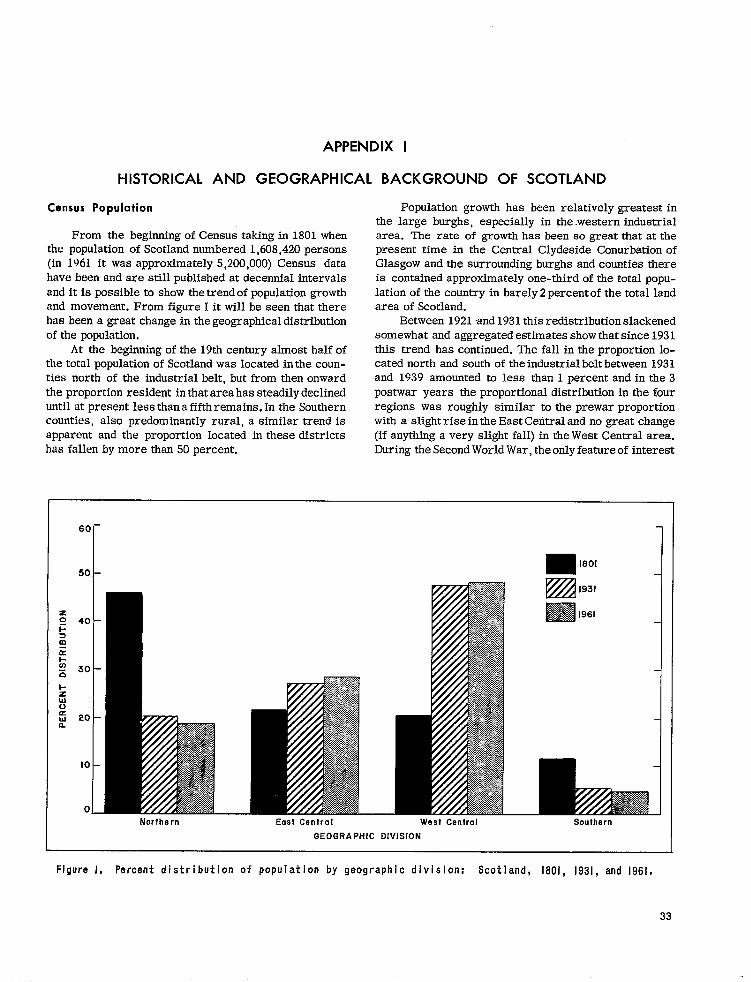
APPENDIX 1
HISTORICAL AND GEOGRAPHICAL BACKGROUND OF SCOTLAND
Census Population
From the beginning of Census taking in 1801 when the population of Scotland numbered 1,608,420 persons (in 1961 it was approximately 5,200,000) Census data have been and are still published at decennial intervals and it is possible to show the trend of population growth and movement. From figure I it will be seen that there has been a great change in the geographical distribution of the population.
At the beginning of the 19th century almost half of the total population of Scotland was located in the counties north of the industrial belt, but from then onward the proportion resident in that area has steadily declined until at present less than a fifth remains. In the Southern counties, also predominantly rural, a similar trend is apparent and the proportion located in these districts has fallen by more than 50 percent.
60-
50I
40 -
30 -
20 –
10–
o_Northern East Central
Population growth has been relatively greatest in the large burghs, especially in the western industrial area. The rate of growth has been so great that at the present time in the Central Clydeside Conurbation of Glasgow and the surrounding burghs and counties there is contained approximately one-third of the total population of the country in barely 2 percent of the total land area of Scotland.
Between 1921 and 1931 this redistribution slackened somewhat and aggregated estimates show that since 1931 this trend has continued. The fall in the proportion located north and south of the industrial belt between 1931 and 1939 amounted to less than 1 percent and in the 3 postwar years the proportional distribution in the four regions was roughly similar to the prewar proportion with a slight rise in the East Central and no great change (if anything a very slight fall) in the West Central area. During the Second World War, the only feature of interest
1801
1931 m
1S61
I
West Central Southern
GEOGRAPHIC DIVISION
Figure 1, Percent distribution of populat on by geographic division: Scotland, 1801, 1931, and 1961.
33

Table 1. Age distribution of the population: Scotland, 1861, 1891, 1921, 1951, and 1961
Year Population Under 15 15-64 65 years
(Census) years year a and over
I ] Percent distribution
1961----- 5,179,344 25.9 63.5 10.6 1951----- 5,096,415 24.6 65.4 1921----- 4,882,497 29.5 64.5 ::; 1891----- 4,025,647 35.6 59.4 4.9 1861----- 3,062,294 36.1 59.1 4.9
, r ,
in the regionalestimates wastheanticipated changeconsequent principally on evacuation from danger areas. ‘13mstheproportion ofthepopulationin theEast Central counties fell from the 19391evel duringtheyears 1940-44. In the West Central part the proportion fell from 48.5 percent in 1939-40 to 47.5 percent in1941, butit rose in thenext3 years, nearly but not quite to prewar levels in the years 1944 and 1945. The increased pro-portion was ~orenoticeable in the north and northeast part of the country as these are reception areas.
Coincident with the changes in the total population of the four main divisions of thecountrythere have been changes in the age constitution of the population. Table I shows the percent distribution of the population according to age at certain censuses since 1861. The figures indicate clearly the progressive aging of the population over the period of 100 years. Because the birth rate began to rise only in 1953 the increases at both ends of the age span must be due chiefly to decreased mortality made possible by medical discoveries combined with better public health measures, better housing, and improved general living conditions.
Population Migration
There has been a population increase due Imth to a higher birth rate and even more so to greater longevity. There has been an average loss of 28,000 people each year, chiefly in recent years to England and not so much aa formerly to overseas countries. This migration is, however, of the younger and more able people and their loss means a greater strain on the population of the working age group, especially on the people available to care for the needs of the young and the old. Though the numbers of each sex migrating are much the same, one of Scotland’s recent socioeconomic problems has been the shortage of unmarried women of the working age period, i.e., of 15-44 years of age.
The effect of reduction of the birth rate from 1939 to 1953 on the main working age groups (male and female) of the population coupled with war losses and migration has been to reduce the labor force from its state in 1939. On the distaff side the increase in the
number of married women and decrease of the unmarried has greatly reduced the working capacity of women in the reproductive age periods. Probably a proportion of married and widowed women are employed in industry but for the average married woman with two or three children steady fill-time employment is out of the question for 10 to 15 or more years. This shortage of women available for Ml-time employment is already being felt in nursing, teaching, and other employments normally predominantly women’s occupations. In spite of loss of population by migration and in spite of change in total working capacity of the female population, the ratio of earners to dependents (taking earners as those between 15 and 64 years of age and dependents as those of all other ages), reached the high level of 1.9 in 1951 and was 1.7 in 1961, compared with 1.4 in 1861. The prosperity of a people depends to a large extent on that ratio. The “affluent society” is so, at least in part, by virtue of having a high proportion of earners to dependents.
It is customary for statistical purposes to divide Scotland into four regional divisions, the East Central
.
Figure Il. Counties of Scotland.
34

-----------------------------------------
-------------------------------------------------------------------------------------------------------------------------------------------------------------------------------------------------------------------------------------------------------------------------------------------------------------------------------------------------------------------------------------------
--------------------------------------
-----------------------------------------
------------------------------------------------- ------- ------- ------- ------- ------------------------------------------------------------------------------------------------------------------------------------------------------------------------------------------------------------------------------------------------------------------------------------------------------------------------
--------------------------------------
-----------------------------------------
-------------------------------------------------- ---------------- ---------------- --------------------------------------------------------------------------------------------------------------------------------------------------------------------------------------------------------------------------------------------------------------------------------------------------------------------------
--------------------------------------
------------------------------------------------------------------------------------------------------------------------------------------------------------------------------------------------------------------------------------------------------------------------
------------------------------------------------------------------------------------------------------------------
--------------------------------------
Table II. Distributionof populationby age,sex, and sex ratio: Scotland,1911, 1931, 1951, and1961
+
Both I SexYear and age sexes Male Female ratiol
II
yJ.
All ages 92=
Percent distribution
Under 5 yeara 105.,.3-7 years ;:: ::; 10510-14 years 10515-24 years --------.-------. 1::; 1;:; 9625-34 years 12.7 13.0
45-54 years 13.2 13.2 55-64 yeara 11.0 10.5 ;: 65-74 years 6.9 5.9 67 75 years and over 3.7 2.9, 59
35-44 years 12.9 13.0 ;:
l=
All ages 5,096,415[1”2,434,358]2,662,507 91
Percent distribution
ype:rys 9.2 8.6 105 ------. ::; 104
li-lX years 15-24 years 25-34 yeara
R ;:: 14,2 1;:: 14.3 14.3 14.5 14.0
103 91
35-44 years 14.5 14.7 14.3 :2 45-54 yeara 12.9 1:.; 13.1 89 55-64 years 10.2 79 65-74 years ::: 6:1 75 year~ and over 3.2 2.6 ;:; :;
1931
All agea L,842,980I 2,325,52312,517,457 92
Percent distribution
y~e:rys 8.7 9.2 8.3 102 9:4 9.9 101
l&lX years ::: 102 15-24 years 1;:: 1::: 17.3 25-34 years 15.2 15.0 15.5 a 35-44 yeara 12.6 12.0 13.1 45-54 years 1;.; 11.0 1:.: % 55-64 years 8.965-74 years 5:3 4.9 5:6 :;75 yeara and war-------------------------------------- 2.0 1.6 2.4 63
1911
All ages \,760,904I 2,308,83912,452,965 94 —
Percent distribution
~~e~r~ars 11.2 11.6 10~8 101 10.8 11.2 10.4 101
1;-11 years 10.3 10.7 101 15-24 years 18.5 18*8 1::: 25-34 years 15.6 15.3 15.9 H 35-44 years 12.6 12.6 12.6 94 45-54 years---.-----.-------- 9.2 55-64 years ::; 6;0 ::: ;; 65-74 years 3.9 3.4 4.4 75 years and over 1.5 1.2 1.9 ;;
~~a~es per 100 females.35

------------------------------------
------------------------------------
------------------------------------
------------------------------------
------------------------------------
TableII1. percent distribution of population by geographic division and urban and rural area: Scotland, 1891, 1921, 1931, and 1951
@herewasmC.IIS.S in 1941 owing to the Second World War. Figures for 1961 not yet available]
Region 1951 1931 1921 1891
Scotland Percent distribution
Urban 82.9 80.1 77.3 70.6 Rural 17.1 19.9 22.7 29.4
Northern Di.vishn
Urban 55.4 50.3 49.5 43.7 Rural 44.6 49.7 5005 56.3
East Central Division
Urban 89.3 87.6 84.3 79.4 Rural 10.7 12.4 15.7 20.6
West Central D.ivi.sion
Urban 93.9 91.9 89.4 87.0 Rural 6.1 8.1 10.5 13.0
Southern Division
Urban 52.0 48.8 45.7 ;:.; Rural 48.0 51.2 54.3 .
and the West Central. comprising what is sometimes called the “Industrial Belt” of Scotland, the Northern Division, and the Southern Division. The East Central Division comprises the City ofllmdee and the counties of Fife, Clackmamon, Stirling, West Lothian, Midlothian, and East Lothian, The West Central Division comprises the counties of J3umbarton, Renfrew, Ayr, and Lanark. The Northern Division is made up of all the counties to the north and west of the Central Divisions, but excluding the City of Ilmdee, and the Southern Division of the counties to the south and east of the Central Divisions. (See fig. II for counties of Scotland.)
Tables H and III show the distribution of the population in Scotland.
The following extracts from a paper by McKinlay in 1948 give a description of Census taking andregistrationin Scotland.
AVAILABLE ROUTINE DATA
(1) The Census provides us with the basic knowledge of the main features of the population at risk—numbers, distribution by age, sex and civil status, geographical location, occupation and social status of adults and general housing conditions.
With Census data published at decennial intervals since 1801 it is now possible to indicate the trend of these population factors and their inter-relation-ships. The population figures are accepted as enumerated—redistribution to place of normal residence of individuals located elsewhere at the time of Census taking is not attempted. . . .
The Census being only taken at decennial intervals, post-censal estimates of population have to be made. For the country asawhole, total populationfigures and age and sex distributions, based on the births, deaths andmigration data with theprevious Census enumeration, are now reliable . . . .
(2) Compulsory registration of births, marriages and deaths has been in operation in Scotland since 1855 and stillbirths (by cause) were included only from 1939. For births, available data relate to totals by sex, season, legitimacy and geography; for deaths there is additionally information on cause of death and age. Under the Population Statistics Act, data inrespectofbirths arenow further elaborated to show age of mother and numberof previous children, duration of marriage, etc. In connection with causes of death, several points have to be noted when analysis is attempted. (i) These deaths subdivided in cause groups have been published since the outset of registration, but the list of causes in use has been subjected to repeated and extensive revision. This isnecessary tokeep pace with improving certification and extending medical knowledge. The trouble is that with each revision the difficulty of obtaining comparability over a period of years progressively increases, and there are in factotdyafew diseases or causes of death the course of which can be followed for any great Iengthof time; and even in these, inviewof changing accuracy of certification by cause, it is difficult to believe some of the obvious deductions from the figures. (ii) A further point of necessary knowledge isin respect of joint causes. In an appreciable proportion of death certificates two or more causes are stated, and the methods of selecting theprimary cause of death differ internationally. Most countries with up-to-date statistical organisations have amore or less elaborate system of preferences, even although the certificate haa provision forthecertifier toindicate what in his opinion was the primary cause. In Scotland elaborate arbitrary rules for selection have never been used=more attention is paid to the order of events indicated by the practitioner in attendance at the time of death. This would seem the most sensible approach since he is the only person in aposition togiveany worth-while judgment on the matter, and any office alteration of such judgment is liable merely to perpetuate past knowledge (or beliefs) asto relative fatalities and
36

may distort or obscure in mortality returns the effects of advances in treatment. (iii) Of importance mainly when interest attaches to some special causes of death is the fact that the death certificate is not a confidential document, and in diseases to which stigma may attach (e.g. syphilis, cancer) there will be a tendency towards concealment of the real facts and consequent understatement of the true number of deaths from such causes. (iv) One other point relative to both births and deaths should be noted. Prior to 1911 these were debited to place of occurrence, no redistribution to usual residence being made. This makes difficult any study of geographical variations especially when certain individual causes of death are being considered. In general, localities with the greater provision of institutions (usually urban areas) would have their birth and death rates artificially in-creased, rural areas artificially decreased. Since 1911 this source of distortion has been eliminated, and the geography of births and deaths is now exact.
(3) Under various acts and regulations certain specified infectious diseases have to be notified to the Medical Officer of Health. The primary object of notification is to permit the institution of the usual public-health measures in these diseases of isolation of the individual, disinfection of premises, etc.; but the provision of statistical data is an important by-product. The local returns are collected by the Central Department and the totals for each of these diseases are published weekly for each local authority area and an annual statement shows subdivision of the data by age and area (and
in recent years by sex). In these annual figures corrections of initial wrong diagnoses are incorporated. The weekly (uncorrected) figures pro-vide expectancy (median) values as the basis for comparison with current events; the annual corrected data, associated with mortality returns, permit of epidemiological studies on a wide scale based upon incidence, mortality and case fatality rates.
. . . . .
(5) Further routine data emerge from school medical inspections. Children are medically examined on entrance to school, on leaving and at some intermediate date. Previous histories of infectious illnesses, weights and heights and the presence of disease or defect of any kind are recorded on individual case record cards. The annual findings are amalgamated in each local authority area and provide a further indication of health levels for this section of the population.
(6) These are the only main sources of routine data. Additional to those mentioned there are now fairly trustworthy figures on the frequency and causation of blindness, and the new Disabled Per-sons register (Ministry of Labour)_may in time pro-vide other viewpoints on health in adult life.
From this brief r&um6 of the data available it will be abundantly clear how defective are the means for anything like adequate description of the health of all sections of the community. Yet from their analysis comes most of our knowledge of present status and past trends.10
37
APPENDIX II
MATERNAL AND CHILD WELFARE
The ideal of every service for maternal and child welfare is to provide conditions in which a woman will be kept in perfect health during pregnancy, parturition, and the puerperium, and also .to ensure that her child, after a good start in life, will remain fit and well and will grow into perfect adulthood. Progress toward this ideal has certainly been made, but many circumstances not controllable prevent its complete attainment.
For instance, two factors are outside of the control of any service. These are heredity and social status. Heredity lays the basis of physical and mental stature and even some measure of the social backgroun&, the social background itself determines the extent to which the national benefits available are used by the family group. Not all women are of good heredity and a fair proportion are in the lower social groups. Nevertheless, the effect of the general and particular health services of a country can so influence the contemporary generation that future generations may be improved. The degree of achievement, however, depends on the woman’s willingness and ability to cooperate with the services provided, to keep herself fit, and above all to Plan her pregnancies so that she will have the physical and mental reserves to make a good and happy home in which there is careful nurture of the children. Each improvement in one generation raises the quality of the succeeding generation, so making it more able to avoid or to with-stand the hazards of life which asaailed its predecessors.
Beginning of Health Services
In the evolution of medicine the personal services were first in the field and in the main were available only to those wealthy enough to secure them. Poor people even in serious illness had to live or die without medical aid. As time went on it was realized that as sicknesses could be infectious and contagious, provision had to be made for some help to be given to the destitute—especially to helpless children-and so the idea of communal help began.
Certain types of women who by experience had gained some knowledge helped their fellow women in pregnancy and confinements and presumably gave advice on other matters relating to sickness. The authorities of the time had few or no supervisory powers but it is
on record that in Aberdeen in 1600 a midwife was put in prison for some offense not clearly defined.
Religious bodies from early times had been the forerumers of medical services and in Scotland the Kirk (Church) became active in caring for its adherents with its blessing on training courses for midwives which were begun in Glasgow, Edinburgh, Aberdeen, and llmdee in 1758. Kirk Sessions selected suitable women for training and the valuable help given by those women is described for one rural parish by McPherson in “The Kirk’s Care for the Poor.” 11 At times if a nursing mother was seriously ill or had died the Kirk Session provided the services of a wet nurse for the infant.
Many real dangers can beset a young child, e.g., -that of overlying, and as early as 1236 the Constitutions of Saint Edmund of Canterbury forbade parents to have young infants in bed witi them lest the child be smothered. A similar statute was promulgated in the Diocese of Aberdeen in the 13th century. The same statute also prohibited unattended children being left near fire or water.
Following the Reformation these statutes were ex-tended and enforced by the Kirks and toward the end of the 16th century local councils began to make provision for destitute children by establishing homes where they could be cared for at the expense of the community. In 1595 a plan for the adoption of infants was initiated in Aberdeen and in 1733 a home for orphans was established in Edinburgh by Andrew Gairdner and survives as the Dean Orphanage to the present day. There are many other institutions of a like nature in the country and it is clear that our modern services for maternal and child welfare follow on from the beginnings made by these early pioneer schemes.
Sanitation and Infectious Disease
In Scotland, as in other countries in the early and middle years of the 19th century, there was a realization among the thinking public generally and health authorities in particular that all was not as well as it should be in so far as environmental hygiene was concerned. This was especially true of parts of cities and towns, and public attention was thus focused on the poor environmental conditions then prevailing in these areas.
38
A great deal of effort was devoted to the provision of pure water, adequate means of disposal of sewage and refuse, of street cleaning, etc. It was as recently as 1854 that Queen Victoria turned the sluices at Loch Katrine to give the City of Glasgow an adequate and pure water supply, which was followed shortly after by a water-carried sewage system accompanied by improvements in scavenging and street cleaning.
As such provisions extended all over the country
the general condition of the people improved and the numbers and size of families increased. Indeed, the increase of ppulation was more rapid than the increase in house-building. T’he result was overcrowding with the concomitant increase in frequency and severi~ of infectious diseases and insofar as infants were concerned deterioration of housing tended to offset the benefits of improved sanitation. While the general mortality rate fell slowly as did the death rate for children aged 1-5 years, the infant mortality rate rose and continued to rise until the quinquennium 1896-1900.
At the same time it was beginning to be realized that maternal and infant health were inextricably inter-dependent, and the attack on the combined problem began spasmodically in the early years of the 20th century.
Stimulus was given to voluntary and otier efforts in 1903 when the Royal Commission on Physical Training (Scotland) included in its report many adverse comments on the health of school children. Shortly afterward these comments were corroborated by the Inter-departmental Committee on Physical Deterioration, with the result that throughout Great Britain a system was established for the medical inspection of school children. Such inspection soon showed that many of the diseases and defects found in children of school age were largely the result of ignorance or neglect in infancy and in the pre-school age, Meantime factual information had been collected and reports made on the conditions relating to the nurture of infants. These reports contained valuable information regarding he high infant death rates and suggested possible ways of reducing them since it was felt that many of the contributing causes were preventable,
Infant Mortality
As has already been pointed out, during the latter half of the 19th century, though the birth rate and the general death rate had fallen gradually, the infant mortality rate steadily rose to its peak in the quinquennium 1896-1900, Such improved environmental measures as had been achieved had until then been without effect on the health and lives of infants. Apart from prematurity and congenital defects the main causes of death were respiratory and diarrheal diseases. Indeed, in those years the so-called “Summer Diarrhea” took on epidemic characteristics and its onset with each summer was a recurring tragedy. This disease excited considerable concern as it appeared to be preventable
and investigations showed that (a) it was chiefly a disease of urban life; (b) it was a disease of the artisan and even more of the laboring classes; and (c) the severity ‘appeared to be less in towns which had a good water supply, a system of water-carried sewerage, and good scavenging.
At the present time the death rate from gastroenteritis is only 0.7 per 1,000 live births compared with almost 10 per 1,000 live births even as recently as 1936.
Before the turn of the century the number of deaths from prematurity and congenital malformations also was causing concern. Obstetricians and pediatricians began to appreciate that. the wellbeing of the unborn child was in a greater measure than hitherto realized dependent on and influenced by the health of the mother during pregnancy. The publication in 1902 and 1904 of Ballantine’s Manual of Antenutal Pathology and Hy&”ene12(Vols. I and II, respectively) was epoch-making in obstetrical and pediatric circles.
Interest thus aroused became more intensive, and soon it was apparent that, though the first year of life was a convenient statistical age-division, it was from the point of view of mortality a collection of age periods differing widely in etiological factors, and that certainly much of the mortality in the early part of the first year depended on prenatal conditions and intrsnatal procedures. The practical outcome of the interest aroused was the beginning of measures for the care of the pregnant woman.
Legislation for Care of Mothers and Infants
The Notification of Births Act, 1907, gave to the local authorities adopting it an opportunity to obtain information necessary to formulate schemes in an attempt to reduce the infant mortality rates within their area. Despite all efforts, however, the infant mortality rate fell only very slowly and in the years that followed the public conscience was again much disturbed. This concern was increased when at the beginning of World War I in 1914 as at the begiming of the Boer War nearly two decades previously, the poor physical condition of many men presenting themselves for enlistment showed physical defects which might have been prevented in childhood. The general interest thus aroused resulted in the passing of the Notification of Births (Extension) Act, 1915. The act extended the provisions of the Notification of Births Act of 1907 to all Scotland empowering local authorities to make such arrangements as they thought fit and as might be sanctioned by the Local Government Board for Scotland for care of the health of expectant and nursing mothers and children under 5 years of age.
In the same year the Midwives (Scotland) Act, 1915, was passed. This act empowered the setting up of a board to regulate the practice of midwifery, to arrange standards of training, and to examine midwives
39
presenting themselves for examination. ‘Thus the Central Midwives Board was constituted and by giving effect to the provisions of the act has raised and maintained the standard of midwifery practice.
General interest in the factors affecting maternal and child health received further publicity in 1917 in the reports of the Carnegie United Kingdom Trust on the Physical Welfare of Mothers and Children. Reports covered England and Wales, Scotland, and Ireland. The report on Scotland, by Mackenzie, stated that “If the care of mothers and children is to reach a level worthy of Western Civilisation the problems of prematurity will claim increasingly intensive study.” *3 Sir Leslie Mackenzie, Dr. Hsig Ferguaon, and Dr. J.W. Ballantine fully appreciated that many of the ills of childhood, and even of adults, had their origin in the prenatal environment.
When hostilities ceased in 1918 local authorities began to implement the obligations they had assumed under the Notification of Births Extension Act, making arrangements for attending to the health of expectant and nursing mothers and children up to the age of 5 years, and much latitude was given in the adaptation of administrative machinery toward this goal. The schemes which local authorities were required to submit to the Local Government Board for Scotland included the provision, in conjunction with voluntary agencies, of home care by health visitors; maternity and child welfare centers; maternity hospital provision for abnormal conditions of pregnancy and parturition; provision for sick childre~ day nurseries, nursery schools, and centers to teach mothercraft, cookery, and general child care. In other words, local authorities were encouraged to provide a comprehensive service for expectant, parturient, and nursing mothers, and children up to school entrance age.
In effect the act placed a two-fold duty on local authorities-firstly to provide educational facilities to make women realize that it was to their advantage and at the same time a biological duty to make them-selves as fit and well as possible during pregnancy to ensure the birth of a healthy infant, and secondly to provide adequate facilities to obtain this end.
In 1929 there were 150 authorities responsible for maternity and child welfare. Some were of sufficient size and value, and had the financial resources to make adequate provision, but others were hampered by their small size and insufficient funds. These difficulties were overcome by the Local Government (Scotland) Act, 1928, which reduced the number of authorities from 150 to 55. This act also replaced the former 50 percent grant system by a block grant. The powers and duties of the new authorities were enlarged to include reorganization of the hospitals at their disposal and to provide new hospital accommodation for all classes of sick as well as maternity hospital accommodation. Since that time the number of maternity beds in the country rose from just over
300 to the present 3,200. These hospitals and others reconstructed and enlarged since 1948 can now accommodate about 80 percent of the total births in the country.
In the 20 years between 1928 and 1949 so much intensive and good work had been done in the field of maternity and child welfare that the infant mortality rate fell from 86 in 1928 to 45 in 1948 per 1,000 live births and the maternal mortality rate from 7.0 to 1.6 per 1,000 live births. Of course the improvement in both rates could not be ascribed wholly to the work of local authorities and other agencies. The use of sulfonamide drugs and in the later war years antibiotics and the blood transfusion service helped to reduce the rates, but notwithstanding the educational work had had its effect and many women and their children benefited thereby.
National Insurance
From 1912 everyone working and earning below a certain amount paid a weekly health insurance contribution to a voluntary insurance society. ‘fhis en-titled the payee to the service of a family doctor and at times other benefits. Doctors were paid a cavitation fee for all insured people on their lists. This form of insurance, however, did not cover the insured personls wife and children, so payment had to be met for these dependents. Also insured people had to pay for sight-testing and spectacles, dental care and dentures, hearing aids, and other medical appliances.
National Health Service
In 1948 the National Health Service came into being,the result of a promise made to the nation in
the middle of the Second World War. ‘Ihia promise was the outcome of the Beveridge Report which en-visaged a service that “.. . will ensure that for every citizen there is available whatever medical treatment he requires, in whatever form he requires it, domiciliary or institutional, general, specialist or consultant, and will ensure also the provision of dental, ophthalmic and surgical appliances, nursing and midwifery and rehabilitation after accidents. ”14
The new legislation retained the principle that general practitioners should be paid a cavitation fee for every patient on their lists, and the new service became available to everyone. It is now financed mainly from national taxation (80 percent), from weekly contributions (12 percent), and by local taxes and certain limited charges for particular services (8 percent).
In 1948 all hospitals became State owned. The reason for this was to ensure that their resources would be deployed to the best advantage both locally and nationally and also so that any deficiencies in services which formerly existed could be made good. In Scotland since the advent of the National Health
40

Service many more hospital beds have been added to those existing in 1948; many hospitals have been adapted to other uses; some have been rebuilt or otherwise modernized; and new ones have been or are to be built. In order to forestall the question of why so little has been accomplished since 1948 it should be remembered that in view of possible enemy bombardment and lack of materials and labor in World War II, no house building was permitted so that the first tremendous need in the postwar period was for new housing. Thus, the housing shortage was the most vital public health measure and all other building had to give way to this. The hospital service is not yet adequate but even so at present there is one bed for every 80 people in the country and so far as maternity provision is concerned, there is sufficient to meet most requirements; where necessary to meet changing needs, further provision is being made,
Educatian
In the history of the Maternal and Child Welfare Service of Scotland, the provision and execution of this service was made a duty on local authorities to pro-vide education and care for expectant, parturient, and nursing mothers, and children up to 5 years of age. This duty was implemented by the local authorities’ schemes promoted by each council assisted by ita Medical Officer of Health. me proposed schemes were submitted to the central government department, and when subsequent approval was granted the schemes then became operative. These main basic schemes are still in operation though from time to time modifications have been effected to suit changing needs.
The Medical Officer of Health of the local authority was and still is the administrative officer of the service. He is assisted in the working of the scheme by doctors who have an interest in and specialized knowledge of child health and who preside at aH sessions of child welfare clinics. It is these doctor’s who direct the scheme of work and to whom health visitors and other ancillary workers are responsible. These officials become very experienced in health standards and are alert to deviation, however slight, from the normal, as well as being responsible for the procedure necessary for a return to normality.
It was felt by the public health authorities that the educational part of the program could best be achieved by fully trained nurse-midwives who had undergone a specialized training in the prevention of disease—comparable to health nurses in the United States. These nurses are known as Health Visitors in Britain. Their duties include the care and education of the pregnant and postparturient woman in respect both of her own health and of inculcation of the best modern ideas of child nurture, both physical and emotional, up to school
age, when the child passes into the care of the local educational authority medical service. To augment this service prenatal, postnatal, and child welfare clinics have been established either in the local authority’s own premises, at a maternity hospital, or in other suitable places convenient for the women concerned. Frequently the same premises serve the dual purpose of child welfare and prenatal or other specialist sessions.
Attendance at a clinic does not mean that home visitation by the health visitor should be lessened except at the visitor’s discretion as it is felt that it is only in the home that the domestic and other problems can be assessed. In the cities and larger industrial towns, visiting, educational, and clinic work absorbed the full time of the health visitors so that sick nursing and midwifery had to be undertaken by two other types of nurses, who now devote their whole time to these callings. In tie rural areas one nurse only is necessary for all the work—an all-purpose nurse upon whom all duties devolve.
These educational ideals still exist and the health visitor is expected to work with the general practitioner during the prenatal period, and after the birth to pay the first infant welfare visit about the 10th day of life with subsequent monthly visits until the child reaches the age of 1 year. Thereafter six visits are made during the second and third years and four visits in the 2 years prior to school age (normally age 5). The health visitor is expected also to notify any abnormality or deviation horn health in the child and to endeavor to persuade the parents to have corrective treatment given.
At first much persuasion was required and it was some time before the service was fully accepted, but now most women rely on it for help and assistance in even minor troubles and for the reassurance that all seems well with the child.
Other Services
Apart from instruction to women on health in pregnancy and child nurture, local authorities have responsibilities for other branches of health education, viz.:
1. OYd hy~”ene d caye of the teeth through dentists and dental officers.
2. Youth and $avent organizations through medical officers of all kinds.
3. Specific campaigns against disease which can be controlled by immunization, e.g., diphtheria, tetanus, whooping cough, tuberculosis, poliomyelitis, smallpox, etc. Immunizing measures have been so successful that in 1962 there was no death among children from diphtheria, tetanus, or poliomyelitis, and only two deaths from whooping cough.
41
4. Womenfs institutes, women’s guilds, etc., through which lectures are given by doctors, nurses, and other qualified people.
There is also a Central Council for Health Education which covers the whole field. It holds service training courses for staffs and members of local authorities. It also holds conferences and each year a residential summer school for doctors, nurses, teachers, etc. Women’s magazines and journals also make a valuable contribution to the educational field in respect of child welfare.
Welfare Foods
Through the medium chiefly of clinics, welfare foods are distributed nationally from public funds for pregnant and nursing women and children under 5 years of age. The amount of milk supplied is estimated at 95 percent of the potential demand. Cod liver oil, vitamin A and D tablets, and orange juice are sold at cost price or given free in cases of need.
Financial Aid
To assist in meeting the expense of a confinement the National Insurance Scheme provides two maternity benefits. Where the conditions for each benefit are satisfied, both may be paid. They are paid to both married and single women and are:
1. Matemzity grant of 322 ($61.60). —If more than one baby is tirn additional grant may be paid.
2. ikf&ynity aUowance.—The standard rate of this k
24 ($11 ._20) per week normally paid for 18 weeks be-ginning 11 weeks before the expected week of confinement if no paid work is undertaken during the period.
These allowances are undoubtedly of great value to women whether married or single in alleviating financial worry, in helping to meet the cost of equipment for the infant, and in providing some measure of domestic assistance before and after the confinement. It is difficult to estimate whether or not these financial grants help to reduce infant mortality, but undoubtedly they do in great measure bring peace of mind with the provision of extra food and other essentials in the more necessitous cases.
Family Planning
Probably one of the greatest benefits to the women of reproductive age and their families is the service for family planning. Information and suitable appliances are given at local authori~ postnatal clinics, at post-natal and gynecologic hospital clinics, and at 20 voluntary clinics in the country. Parents who plan their families ensure that the mother will be fit and and that her child will have had a good start in life before another pregnancy is begun.
42
APPENDIX Ill
EXPLANATION OF TERMS USED IN THIS REPORT
Stillbirth .-A child which has issued forth from its mother after the 28th week of pregnancy which did not breathe or show any other sign of life.
Infant mortality.— All deaths in the first year of life.
Neonatal moytality. —Deathsinthefirst4 weeks of life.
Postneonatal mo9-tality.— Deaths after the first4 weeks but before the end of the first year.
Pevkwtal movtality. —Stillbirths and deaths in the first week of life.
Mother~s age. —The stated age at last birthday of themother at the birth of the child.
Mothe#s pavWy.- Urdess otherwise stated, the number of themother’s previous children (living, dead, and stillborn) of all marriages.
Social class. —Social classes are assigned according to the occupation of the father as stated at birth registration in accordance with classification of occupations. Examples of the occupations included are given below:
Social class I—professional occupations II—farmers, teachers, shopkeepers, managerial occu
pations 111—skilled occupations-fitters, clerks IV—semiskilled occupations-farm workers, machine
minders V—laboring occupations-railway porters, kitchen
hands
Total births. —All stillbirths and live births.
Cause of death. —Causes of death registered since 1958 have been classified in accordance with the Seventh Revision of International Classification of Diseases (1955),and those during 1950-57with the Sixth Revision (1948). Deaths prior to 1950 conform, as far as possible, with the cause classifications in the Sixth and Seventh Revisions. Differences between the Sixth and Seventh Revisions are relatively minor.
ooo —
43

REFERENCES
lDouglas, C. A., and McKinlay, P. L.: Report on Ma$emal
Morbidity and Mortality in Scotland. London. His Majesty’s Stationery Office, 1935.
2McKinlay, P. L.: Social class differences of maternal mortality in Scotland. Health Bulletin 12(2):29-31, Apr. 1954.
3McKinlay, P. L.: The influence of changes in the age and parity constitution of mothers on the trend of fetal and maternal mortality in recent yeare. Health Bu.Uetin 3(1):16-19, Jan. 1950.
4General Registrar Office: Classification of Occupations, 1960. London, 1960.
5Kirrcaid, J. C.: Social pathology of fetal and infant loss. Brit. M. J. 5441:1057-1060, Apr. 1965.
6Butler, N. R., and Bonham, D. G.: Perinatat MortaZity. Livingston. Edinburgh and London, 1963. p. 52.
7111sley, R., and Klncaid, J. S.: Social correlates of peri
natal mortality, in N. R. Butler and D. G. Bonham, Perirwtal Mortality. Livingstcme. Edinburgh and London, 1963.
8McKinlay, P. L.: The war-time change in the social clase distribution of the mortalities of infancy. Health Bulletin 6(1):8-9, Jan. 1948.
9McKinlay, P. L.: Social claee differences in causes of infant mortality. Health Bulletin 10(4):78-79, Oct. 1952.
10McKinlay, P. L.: Vitat Statistics-Their Collection and Analysis. Transaction of the Faculty of Actuaries. vol. !?8. part IV (169):265-280, 1948.
llMcPherson, J. M.: The Kirk’s Care for the Poor. Aberdeen. Avery and Co., c.1941. pp. 120-122 and 136.
12Ballantyne, J. W.: Manual of Antenatal Pathology and Hygiene, VOIS. I and II. Edinburgh. William Green and %ns, Publishers, 1902, 1904.
13Mackenzie, W. L.: The Carnegie United Kingdom Trw t
Report on the Welfare of Mothers and Children, Scotland, vol. 111. Edinburgh. Neill and Co., Ltd., 1917.
14Beveridge, w. H.: Social [nsurance and Allied SerlJice,~.
London. His Majesty’s Stationery Office, 1942. p. 158.
000
44 U. S. GOVERNMENT PRINTING OFFICE , 1966 0 - 236-635
OUTLINE OF RtFUKl 3tKlt3 FUK VITAL AND HEALTH STATISTICS
Public Health Service Publication No. 1000
SeYies 1.€ programs and collection pYoceduYes.— Reports which describe the general programs of the National
Center for Health Statistics and its offices and divisions, data collection methods used, definitions, and other material necessary for understanding the data.
SeYies 2. Data evaluation and methods Ye search. —Studies of new statistical methodology including: experi
mental tests of new survey methods, studies of vital statistics collection methods, new analytical
techniques, objective evaluations of reliability of collected data, contributions to statistical theory.
SeYies 3. Analytical studies. —Reports presenting analytical or interpretive studies based on vital and health
statistics, carrying the analysis further than the expository types of reports in the other series.
Series 4. Documents and committee repoyts. — Final reports of major committees concerned with vital and
health statistics, and documents such as recommended model vital registration laws and revised birth and death certificates.
Se7-ies 10. Data from the Health Intemiew .% ’vey. —Statistics on illness, accidental injuries, disability, use of
hospital, medical, dental, and other services, and other health-related topics, based on data collected in a continuing national household interview survey.
Sevies 11 Data fyom the Health Examination Survey. —Data from direct examination, testing, and measurement of national samples of the population provide the basis for two types of reports: (1) estimates
of the medically defined prevalence of specific diseases in the United States and the distributions of the population with respect to physical, physiological, and psychological characteristics; and (2)
analysis of relationships among the various measurements without reference to an explicit finite
universe of persons.
SeVies 12. Data from the Institutional Population Surveys. —Statistics relating to the health characteristics of persons in institutions, and on medical, nursing, and personal care received, based on national samples of establishments providing these services and samples of the residents or patients.
SeYies 13. Data J70m the Hospital DischaYge Sumey. - Statistics relating to discharged patients in short-stay hospitals, based on a sample of patient records in a national samPle of hospitals.
Series 20. Data on mo~tality. —Various statistics on mortality other than as included in annual or monthly reports— special analyses by cause of death, age, and other demographic variables, also geographic and time series analyses.
SeYies 21. Data on natality, ma?v’iage, and divoyce. — Various statistics on natality, marriage, and divorce other than as included in annual or monthly reports — special analyses by demographic variables, also geographic and time series analyses, studies of fertility.
SeYies 22. Data fvom the National Natality and MoYtality Suneys. —Statistics on characteristics of births and
deaths not available from the vital records, based on sample surveys stemming from these records, including such topics as mortality by socioeconomic class, medical experience in the last year of life, characteristics of pregnancy, etc.
For a list of titles of reports published in these series, write to: Office of Information and Publications
National Center for Health Statistics
U.S. Public Health Service
Washington, D.C. 20201