National Dental Inspection Programme (NDIP)...
56
An Official Statistics Publication for Scotland Published on behalf of The Scottish Dental Epidemiology Co-ordinating Committee By ISD Scotland Information Services Division Publication Report National Dental Inspection Programme (NDIP) 2016 Report of the 2016 Detailed National Dental Inspection Programme of Primary 1 children and the Basic Inspection of Primary 1 and Primary 7 children Publication date – 25 October 2016
-
Upload
duongthuan -
Category
Documents
-
view
220 -
download
4
Transcript of National Dental Inspection Programme (NDIP)...
An Official Statistics Publication for Scotland
Published on behalf of The Scottish Dental Epidemiology Co-ordinating
Committee
By ISD Scotland
Information Services Division
Publication Report
National Dental Inspection Programme
(NDIP) 2016
Report of the 2016 Detailed National Dental Inspection Programme of Primary 1
children and the Basic Inspection of Primary 1 and Primary 7 children
Publication date – 25 October 2016
Information Services Division
2
Contents
Introduction ............................................................................................................................... 3
The 2016 National Dental Inspection Programme (NDIP) in school year 2015/16 ................ 3
Key Definitions ...................................................................................................................... 3
Specific Goals of the Detailed Inspection .............................................................................. 6
How many children had a Detailed Inspection? .................................................................... 6
Main points ............................................................................................................................... 7
Results and Commentary ......................................................................................................... 8
Detailed Inspection Results ................................................................................................... 8
Conclusions ............................................................................................................................ 18
Glossary ................................................................................................................................. 19
References ............................................................................................................................. 22
Acknowledgements ................................................................................................................ 23
List of Tables, Figures and Diagrams ..................................................................................... 24
Contacts ................................................................................................................................. 26
Further Information ................................................................................................................. 26
Rate this publication ............................................................................................................... 26
Appendices ............................................................................................................................. 27
A1 – What are the stages of tooth decay? .......................................................................... 27
A2 – National training and calibration course ...................................................................... 28
A3– Links/comparisons to other sources of dental health information ................................ 29
A4– Results of Care Index at NHS Board level; Detailed Inspection .................................. 31
A5– Results at Health and Social Care Partnership (HSCP) level; Detailed Inspection for Primary 1 children in 2016 .................................................................................................. 32
A6 – Basic Inspection results .............................................................................................. 49
A7 – Authors ....................................................................................................................... 52
A8 – Publication Metadata (including revisions details) ...................................................... 53
A9 – Early Access details (including Pre-Release Access) ................................................. 55
A10 – ISD and Official Statistics ......................................................................................... 56

Information Services Division
3
Introduction
The 2016 National Dental Inspection Programme (NDIP) in school year 2015/16
The National Dental Inspection Programme (NDIP) is carried out annually with the support and approval of the Scottish Dental Epidemiology Co-ordinating Committee. Its principal aims are to inform parents/carers of the oral health status of their children and, through appropriately anonymised, aggregated data, advise the Scottish Government, NHS Boards and other organisations concerned with children’s health of oral disease prevalence at national and local levels. This ensures that reliable oral health information is available for planning initiatives directed towards health improvements.
Two school year groups are involved: i) at entry into Local Authority schools in primary one (P1) and ii) in primary seven (P7) before the move to secondary education. The Inspection Programme has two levels: a Basic Inspection (intended for all P1 and P7 children) and a Detailed Inspection (where a representative sample of either the P1 or the P7 age group is inspected in alternate years).
This year’s report focuses on the results of the Detailed Inspection of P1 school children in school year 2015/16 (noted as 2016 throughout the report). Information relating to the Basic Inspection of both P1 and P7 children can be found in Appendix A6 of this Report. An Executive Summary of the main findings can be found at http://www.isdscotland.org/Health-Topics/Dental-Care/National-Dental-Inspection-Programme/.
Key Definitions
Detailed Inspection
A comprehensive assessment of the mouth of each inspected child using a light, mirror and ball-ended probe.
It involves recording the status of each surface of each tooth in accordance with international dental epidemiological conventions.
It measures obvious decay into dentine (see below) when seen under school (rather than dental surgery) conditions.
More information on the different stages of dental decay can be found in Appendix A1.
Those undertaking the inspections attend (and pass) a training and calibration course prior to the annual inspection process. Details of the course and of the calibration results can be found in Appendix A2.
Obvious Decay (d3)
This is when the disease process clinically appears to have penetrated dentine (i.e. the layer below the outer white enamel of the teeth) on a tooth surface.
This is described internationally as decay at the d3 level and includes pulpal decay (i.e. decay into the deeper dental pulp).
The definition of decay used here is in accordance with the British Association for the Study of Community Dentistry (BASCD) guidelines and international epidemiological conventions, thus allowing comparisons to be made over time and with other countries in Europe and beyond.

Information Services Division
4
This is a different diagnostic level from that used by many dentists when examining patients in a dental surgery, i.e. for dental check-ups.
Decay is also known as caries.
Obvious Decay Experience (d3mft)
The sum of teeth which have decay into dentine (including teeth with fillings which require further treatment), filled teeth and teeth that are missing (extracted) due to decay. A hierarchy was used to ensure there was no double counting of teeth.
Thus no obvious decay experience has d3mft=0.
Care Index
The percentage of teeth with obvious decay experience in a population that have been treated restoratively (filled).
This is calculated as follows:
or simply
Scottish Index of Multiple Deprivation (SIMD)1
A tool for measuring the extent of deprivation across Scotland.
Uses several different aspects of deprivation, combining them into a single index.
This report looks at different versions of SIMD, broken down by both quintiles and deciles, It should be noted, the labelling of the deprivation categories changed order, e.g. for SIMD 2012, ‘1 (most deprived)’ … ‘5 (least deprived)’ and for SIMD 2006, ‘1 (least deprived)’ … ‘5 (most deprived)’ - see glossary for more details.
Slope Index of Inequality (SII)
The absolute difference overall in obvious decay experience (d3mft) score when moving across the socio-economic (SES) spectrum. It shows the total experience of individuals in the whole population and it is considered to be a consistent indicator with local populations.
Relative Index of Inequality (RII)
The relative difference in obvious decay experience (d3mft) when moving across the socio-economic (SES) spectrum. This can be calculated by dividing the SII by the mean level of decay in the population.
SiC, SiC10 and SCIM10 (see below) are all considered to be non-socio-economic (non-SES) based tests of inequality.
Significant Caries Index (SiC)2
Used to bring attention to the individuals with the highest caries values in each population under investigation. The Significant Caries Index is calculated as follows:
Information Services Division
5
Individuals are sorted according to their d3mft values
The third of the population with the highest caries scores is selected
The mean d3mft for this subgroup is calculated. This value is the SiC Index.
Significant Caries Index 10 (SiC10)
This is calculated in the same way as SIC but instead of taking the third of the population with the highest mean d3mft scores, the top tenth is chosen and this tenth of the sample with the most teeth affected by obvious decay experience was calculated.
Scottish Caries Inequality Metric (SCIM10)3
The area under the curve in relation to the distribution of the tenths of the population by obvious decay experience (d3mft).
Information Services Division
6
Specific Goals of the Detailed Inspection
To determine current levels of obvious decay experience nationally and across the NHS Boards.
To determine the influence of deprivation on the dental health of children in Scotland.
How many children had a Detailed Inspection?
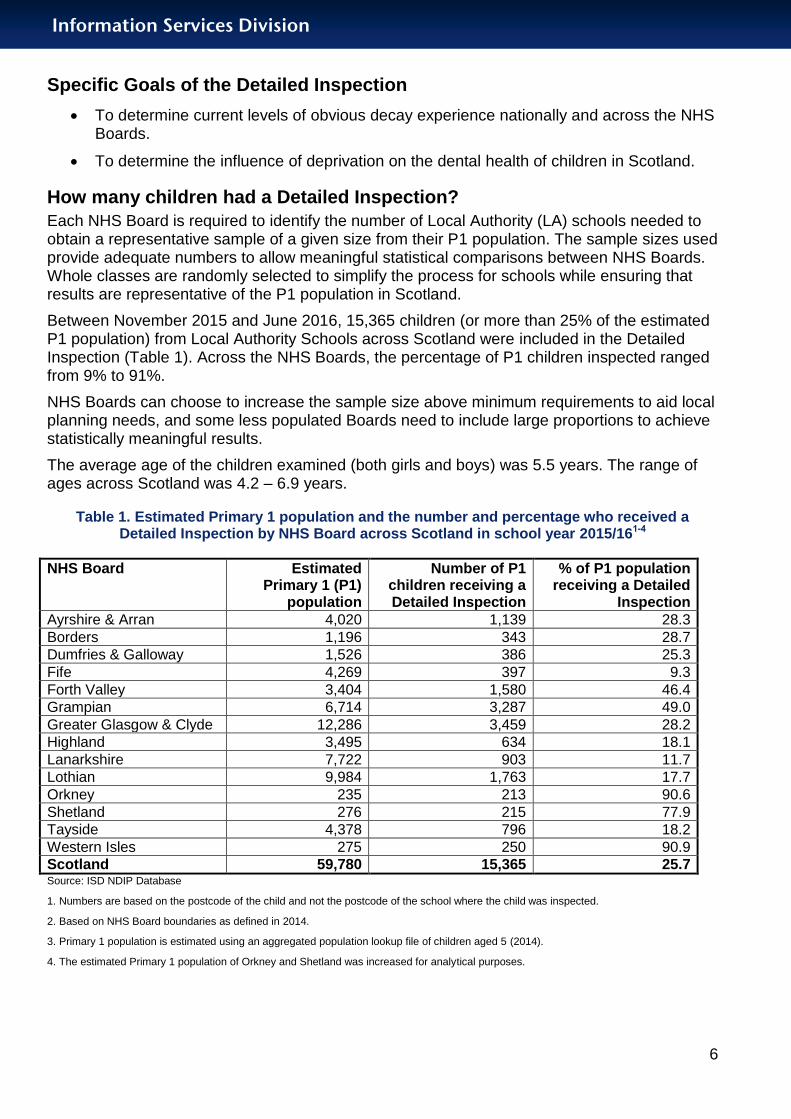
Each NHS Board is required to identify the number of Local Authority (LA) schools needed to obtain a representative sample of a given size from their P1 population. The sample sizes used provide adequate numbers to allow meaningful statistical comparisons between NHS Boards. Whole classes are randomly selected to simplify the process for schools while ensuring that results are representative of the P1 population in Scotland.
Between November 2015 and June 2016, 15,365 children (or more than 25% of the estimated P1 population) from Local Authority Schools across Scotland were included in the Detailed Inspection (Table 1). Across the NHS Boards, the percentage of P1 children inspected ranged from 9% to 91%.
NHS Boards can choose to increase the sample size above minimum requirements to aid local planning needs, and some less populated Boards need to include large proportions to achieve statistically meaningful results.
The average age of the children examined (both girls and boys) was 5.5 years. The range of ages across Scotland was 4.2 – 6.9 years.
Table 1. Estimated Primary 1 population and the number and percentage who received a Detailed Inspection by NHS Board across Scotland in school year 2015/161-4
NHS Board Estimated Primary 1 (P1)
population
Number of P1 children receiving a Detailed Inspection
% of P1 population receiving a Detailed
Inspection
Ayrshire & Arran 4,020 1,139 28.3
Borders 1,196 343 28.7
Dumfries & Galloway 1,526 386 25.3
Fife 4,269 397 9.3
Forth Valley 3,404 1,580 46.4
Grampian 6,714 3,287 49.0
Greater Glasgow & Clyde 12,286 3,459 28.2
Highland 3,495 634 18.1
Lanarkshire 7,722 903 11.7
Lothian 9,984 1,763 17.7
Orkney 235 213 90.6
Shetland 276 215 77.9
Tayside 4,378 796 18.2
Western Isles 275 250 90.9
Scotland 59,780 15,365 25.7 Source: ISD NDIP Database
1. Numbers are based on the postcode of the child and not the postcode of the school where the child was inspected.
2. Based on NHS Board boundaries as defined in 2014.
3. Primary 1 population is estimated using an aggregated population lookup file of children aged 5 (2014).
4. The estimated Primary 1 population of Orkney and Shetland was increased for analytical purposes.
Information Services Division
7
Main points
More than two thirds (69%) of P1 children had no obvious decay experience in their primary teeth in 2016. This is a large improvement since ISD started recording this information in 2003 (45%).
The average number of P1 children’s teeth affected by obvious decay experience in 2016 is 1.21. This is less than half of the average number of teeth affected in 2003 (2.76).
Inequalities remain, with only 55% of P1 children having no obvious decay experience in the most deprived areas compared with 82% in the least deprived areas.
Note no obvious decay experience means there are no obvious decayed, missing or filled teeth.
Information Services Division
8
Results and Commentary
Detailed Inspection Results
What are the obvious decay experience results for the teeth of P1 children in NHS Boards in Scotland?
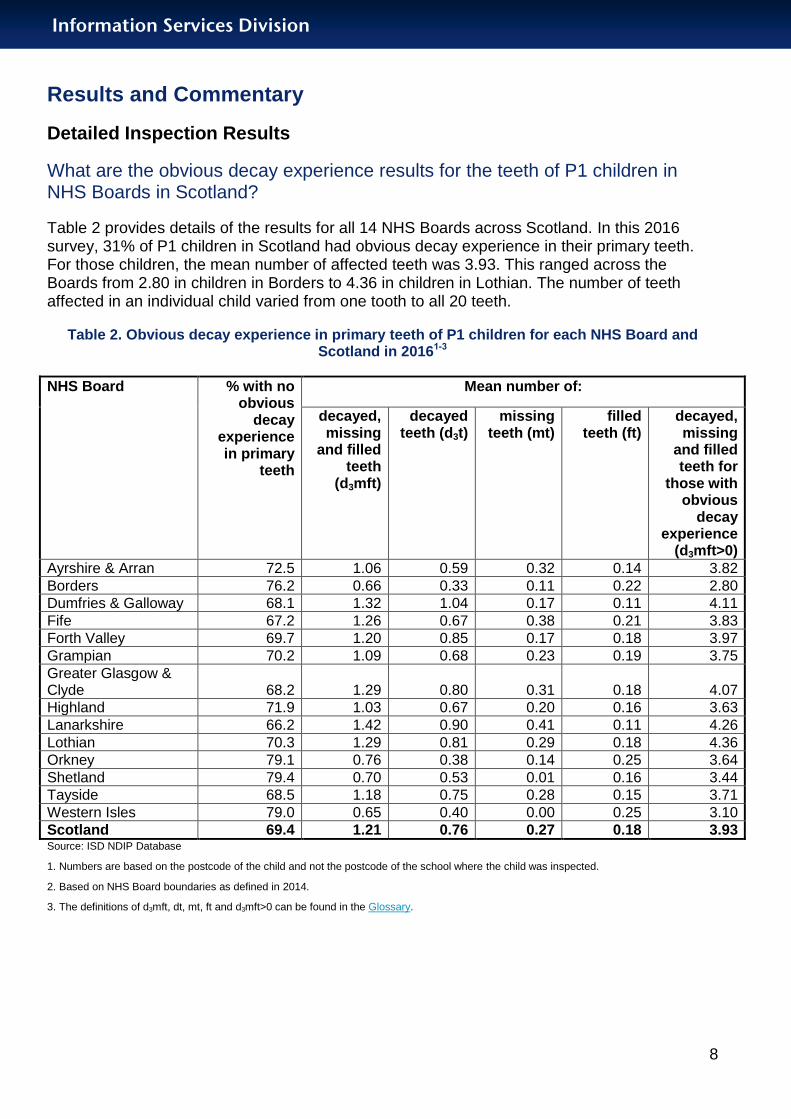
Table 2 provides details of the results for all 14 NHS Boards across Scotland. In this 2016 survey, 31% of P1 children in Scotland had obvious decay experience in their primary teeth. For those children, the mean number of affected teeth was 3.93. This ranged across the Boards from 2.80 in children in Borders to 4.36 in children in Lothian. The number of teeth affected in an individual child varied from one tooth to all 20 teeth.
Table 2. Obvious decay experience in primary teeth of P1 children for each NHS Board and Scotland in 20161-3
NHS Board % with no obvious
decay experience in primary
teeth
Mean number of:
decayed, missing
and filled teeth
(d3mft)
decayed teeth (d3t)
missing teeth (mt)
filled teeth (ft)
decayed, missing
and filled teeth for
those with obvious
decay experience
(d3mft>0)
Ayrshire & Arran 72.5 1.06 0.59 0.32 0.14 3.82
Borders 76.2 0.66 0.33 0.11 0.22 2.80
Dumfries & Galloway 68.1 1.32 1.04 0.17 0.11 4.11
Fife 67.2 1.26 0.67 0.38 0.21 3.83
Forth Valley 69.7 1.20 0.85 0.17 0.18 3.97
Grampian 70.2 1.09 0.68 0.23 0.19 3.75
Greater Glasgow & Clyde 68.2 1.29 0.80 0.31 0.18 4.07
Highland 71.9 1.03 0.67 0.20 0.16 3.63
Lanarkshire 66.2 1.42 0.90 0.41 0.11 4.26
Lothian 70.3 1.29 0.81 0.29 0.18 4.36
Orkney 79.1 0.76 0.38 0.14 0.25 3.64
Shetland 79.4 0.70 0.53 0.01 0.16 3.44
Tayside 68.5 1.18 0.75 0.28 0.15 3.71
Western Isles 79.0 0.65 0.40 0.00 0.25 3.10
Scotland 69.4 1.21 0.76 0.27 0.18 3.93 Source: ISD NDIP Database
1. Numbers are based on the postcode of the child and not the postcode of the school where the child was inspected.
2. Based on NHS Board boundaries as defined in 2014.
3. The definitions of d3mft, dt, mt, ft and d3mft>0 can be found in the Glossary.

Information Services Division
9
What percentage of P1 children in Scotland had no obvious decay experience in 2016?
In Scotland, 69% of P1 children fell into this category, with a range of 66% in NHS Lanarkshire to 79% in NHS Orkney, NHS Shetland, and NHS Western Isles across the 14 NHS Boards. Figure 1 shows the percentages and the 95% confidence intervals for P1 children free from decay.
Figure 1. Percentage of P1 children in Scotland with no obvious decay experience in 2016; by NHS Board1-4
Source: ISD NDIP Database
1. No obvious decay experience is when d3mft=0.
2. Numbers are based on the postcode of the child and not the postcode of the school where the child was inspected.
3. Based on NHS Board boundaries as defined in 2014.
4. A key for the NHS Board abbreviations can be found in the Glossary.

Information Services Division
10
What levels of obvious decay experience were seen in P1 children in 2016?
The average number of obvious decayed, missing and filled teeth (d3mft) across all P1 children inspected in Scotland was 1.21. This ranged from 0.65 in NHS Western Isles to 1.42 in NHS Lanarkshire across the 14 NHS Boards in Scotland. Figure 2 shows the mean numbers and 95% confidence intervals for P1 children.
Figure 2. Mean number of obvious decayed, missing and filled primary teeth (d3mft) of P1 children in 2016 in Scotland and by NHS Board1-3
Source: ISD NDIP Database
1. Numbers are based on the postcode of the child and not the postcode of the school where the child was inspected.
2. Based on NHS Board boundaries as defined in 2014.
3. A key for the NHS Board abbreviations can be found in the Glossary.

Information Services Division
11
How has the dental health of P1 children in Scotland changed over time?
Figure 3 shows there has been a small increase since 2014 in the percentage of P1 children with no obvious decay experience (d3mft=0), but a large increase since 2003.
Figure 3. Trends in the percentage of P1 children with no obvious decay experience in Scotland; 1988-20161
Sources: ISD NDIP Database, SHBDEP
1. The distance between each point does not represent an equal period of time as the results have not been published consistently over the 28 year period.
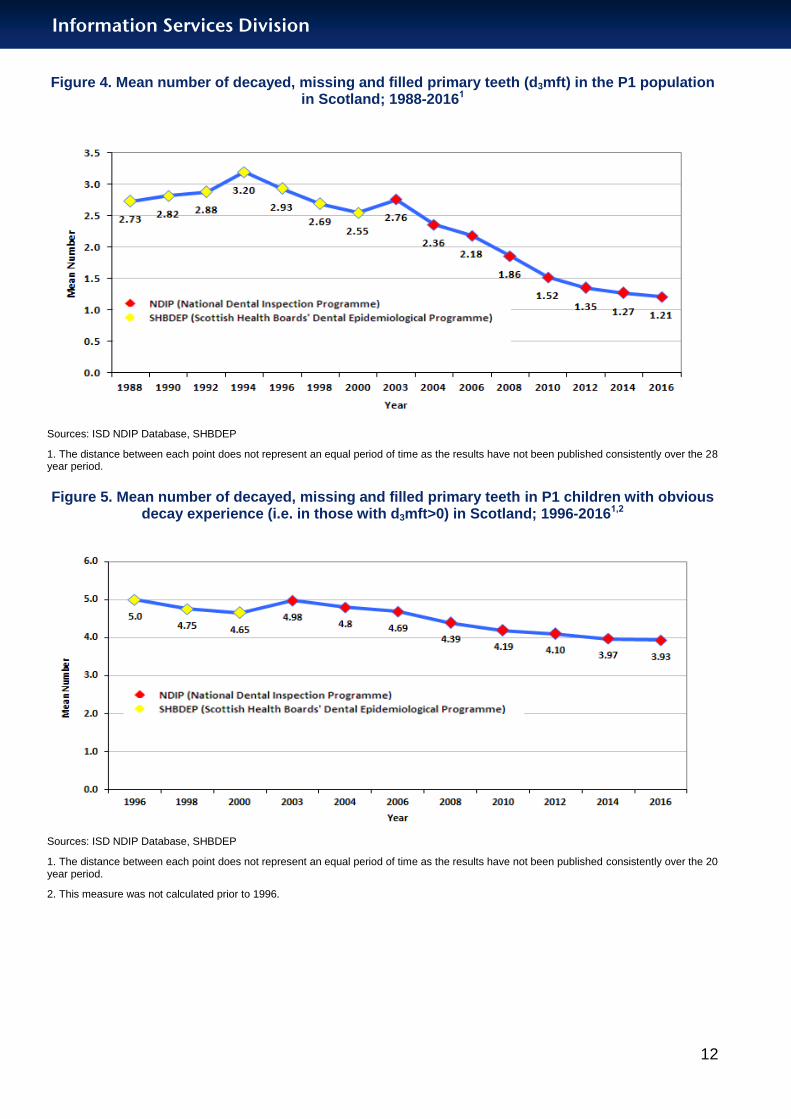
Similarly, there has been a continuing decline (improvement) in the mean number of decayed, missing and filled primary teeth for the P1 population as a whole (Figure 4) and also for the subgroup with obvious decay experience (Figure 5). In the subgroup of children with obvious decay experience, the mean number of decayed, missing and filled teeth is 3.93 – which is a significant number of teeth affected by decay.
Information Services Division
12
Figure 4. Mean number of decayed, missing and filled primary teeth (d3mft) in the P1 population in Scotland; 1988-20161
Sources: ISD NDIP Database, SHBDEP
1. The distance between each point does not represent an equal period of time as the results have not been published consistently over the 28 year period.
Figure 5. Mean number of decayed, missing and filled primary teeth in P1 children with obvious decay experience (i.e. in those with d3mft>0) in Scotland; 1996-20161,2
Sources: ISD NDIP Database, SHBDEP
1. The distance between each point does not represent an equal period of time as the results have not been published consistently over the 20 year period.
2. This measure was not calculated prior to 1996.
Information Services Division
13
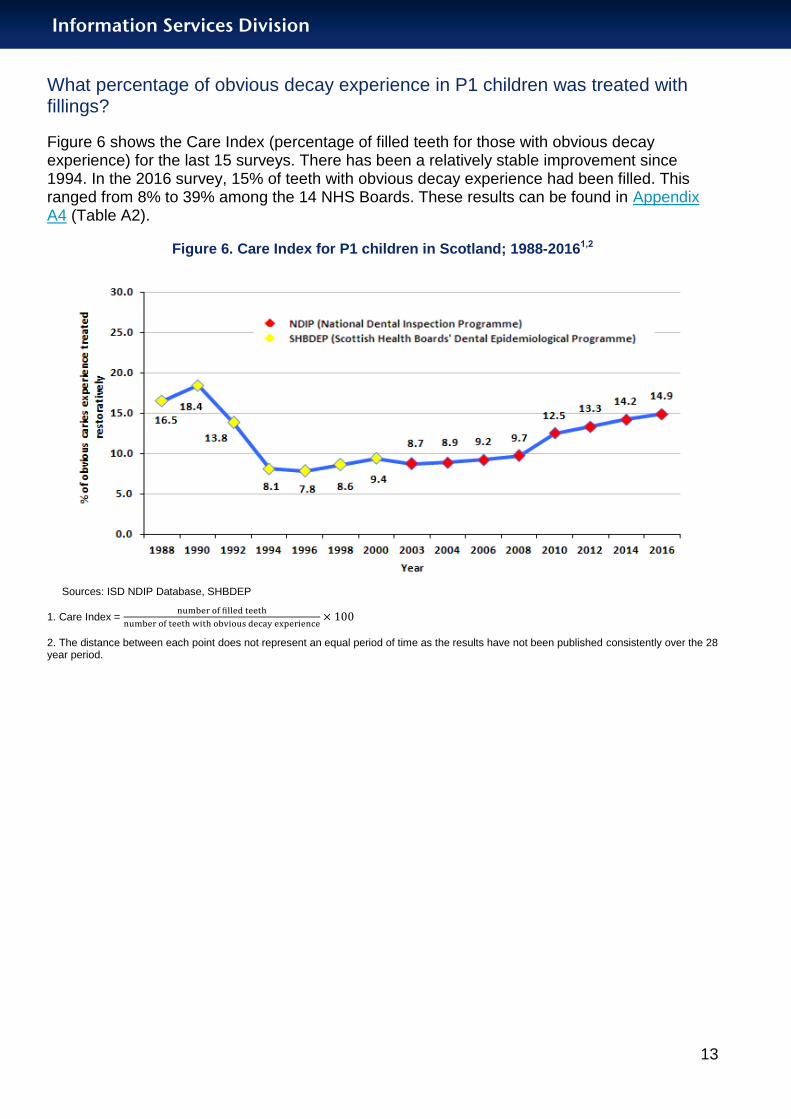
What percentage of obvious decay experience in P1 children was treated with fillings?
Figure 6 shows the Care Index (percentage of filled teeth for those with obvious decay experience) for the last 15 surveys. There has been a relatively stable improvement since 1994. In the 2016 survey, 15% of teeth with obvious decay experience had been filled. This ranged from 8% to 39% among the 14 NHS Boards. These results can be found in Appendix A4 (Table A2).
Figure 6. Care Index for P1 children in Scotland; 1988-20161,2
Sources: ISD NDIP Database, SHBDEP
1. Care Index =
2. The distance between each point does not represent an equal period of time as the results have not been published consistently over the 28 year period.
Information Services Division
14
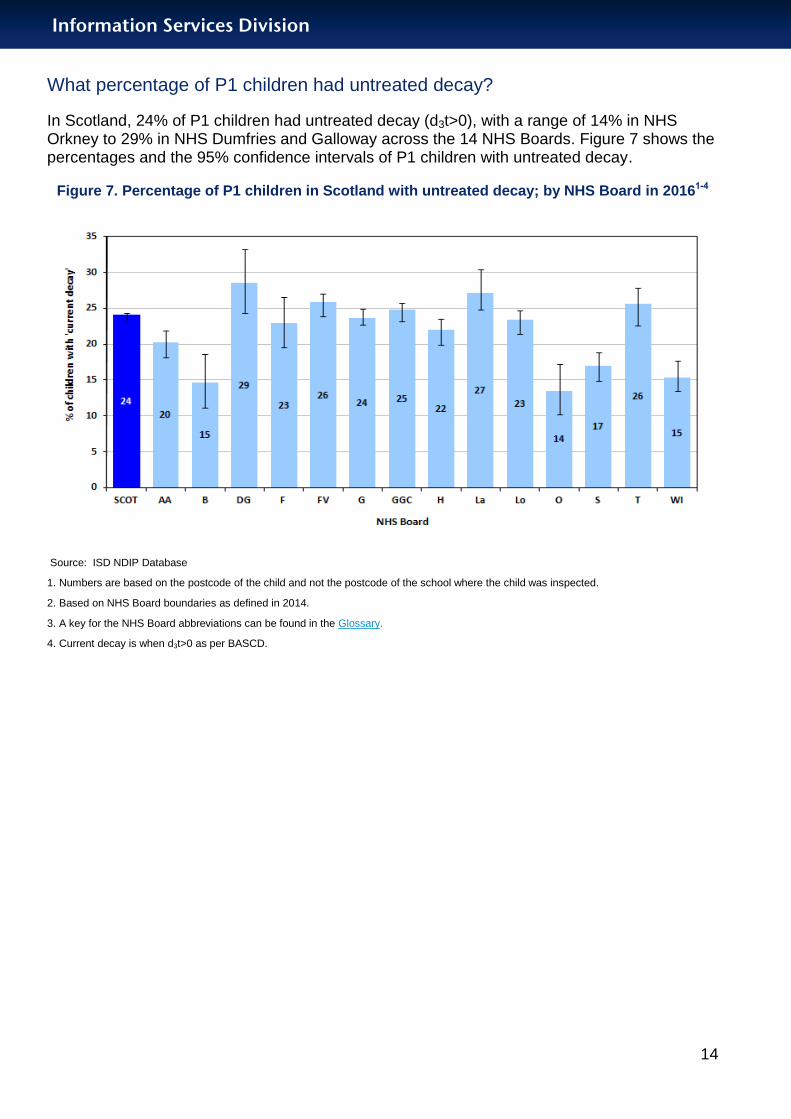
What percentage of P1 children had untreated decay?
In Scotland, 24% of P1 children had untreated decay (d3t>0), with a range of 14% in NHS Orkney to 29% in NHS Dumfries and Galloway across the 14 NHS Boards. Figure 7 shows the percentages and the 95% confidence intervals of P1 children with untreated decay.
Figure 7. Percentage of P1 children in Scotland with untreated decay; by NHS Board in 20161-4
Source: ISD NDIP Database
1. Numbers are based on the postcode of the child and not the postcode of the school where the child was inspected.
2. Based on NHS Board boundaries as defined in 2014.
3. A key for the NHS Board abbreviations can be found in the Glossary.
4. Current decay is when d3t>0 as per BASCD.

Information Services Division
15
Measures of Oral Health Inequalities
Health inequalities can be measured and reported using simple or complex methods.
The simple methods compare only two groups on a socio-economic scale, usually the most and least disadvantaged.
The complex methods look across the whole social gradient, rather than solely at the most and least disadvantaged groups (e.g. Slope Index of Inequality (SII)).
Is there a continuing link between area-based socio-economic deprivation and poor dental health among P1 children in Scotland?
The main SIMD classification used here is based on quintiles of deprivation, where quintile SIMD1 is the most deprived and quintile SIMD5 is the least deprived.
There is clearly a difference in dental health among P1 children in the different SIMD quintiles. The most deprived quintile (SIMD1) showed an increase of two percentage points, free from no obvious decay, from 2014. Similarly SIMD2, 3, and 4 showed an improvement by three, two, and one percentage points, respectively. The least deprived quintile (SIMD5) showed a decrease of one percentage point from the 2014 inspection (Figure 8).
The absolute inequality between SIMD1 and SIMD5 has decreased to 27%, a 3 percentage point decrease (i.e. improvement) since 2014, with 55% of P1 children in the most deprived area showing no obvious decay experience, compared with 82% of P1 children in the least deprived area. The national target set for 2010 (60% of all P1 children to have no obvious decay experience) has still not been met for children in the most deprived area.
Figure 8. Change between 2008 and 2016 in the percentage of P1 children in Scotland with no obvious decay experience; by SIMD quintile1,2
Source: ISD NDIP Database
1 .No obvious decay experience is when d3mft=0.
2. SIMD used has been subject to availability, as follows: 2008- SIMD 2006; 2010 & 2012- SIMD 2009; 2014 & 2016- SIMD 2012, more details can be found in the Glossary.
Information Services Division
16
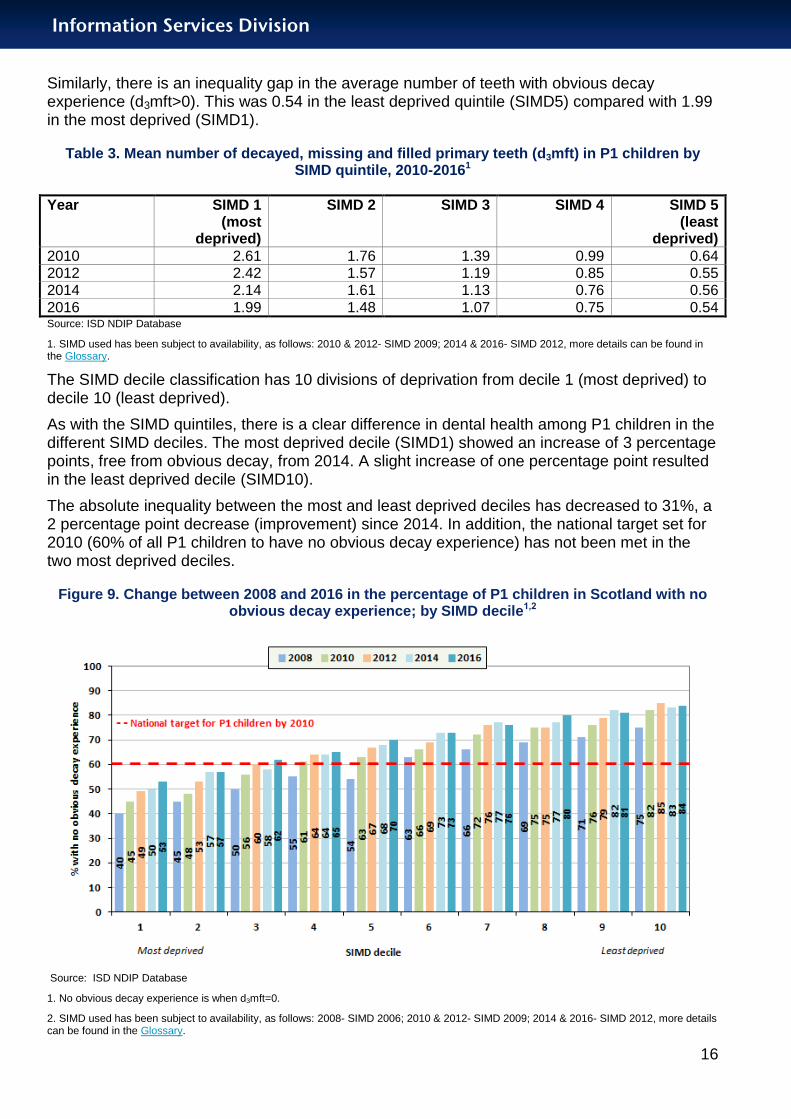
Similarly, there is an inequality gap in the average number of teeth with obvious decay experience (d3mft>0). This was 0.54 in the least deprived quintile (SIMD5) compared with 1.99 in the most deprived (SIMD1).
Table 3. Mean number of decayed, missing and filled primary teeth (d3mft) in P1 children by SIMD quintile, 2010-20161
Year SIMD 1 (most
deprived)
SIMD 2 SIMD 3 SIMD 4 SIMD 5 (least
deprived)
2010 2.61 1.76 1.39 0.99 0.64 2012 2.42 1.57 1.19 0.85 0.55 2014 2.14 1.61 1.13 0.76 0.56
2016 1.99 1.48 1.07 0.75 0.54 Source: ISD NDIP Database
1. SIMD used has been subject to availability, as follows: 2010 & 2012- SIMD 2009; 2014 & 2016- SIMD 2012, more details can be found in the Glossary.
The SIMD decile classification has 10 divisions of deprivation from decile 1 (most deprived) to decile 10 (least deprived).
As with the SIMD quintiles, there is a clear difference in dental health among P1 children in the different SIMD deciles. The most deprived decile (SIMD1) showed an increase of 3 percentage points, free from obvious decay, from 2014. A slight increase of one percentage point resulted in the least deprived decile (SIMD10).
The absolute inequality between the most and least deprived deciles has decreased to 31%, a 2 percentage point decrease (improvement) since 2014. In addition, the national target set for 2010 (60% of all P1 children to have no obvious decay experience) has not been met in the two most deprived deciles.
Figure 9. Change between 2008 and 2016 in the percentage of P1 children in Scotland with no obvious decay experience; by SIMD decile1,2
Source: ISD NDIP Database
1. No obvious decay experience is when d3mft=0.
2. SIMD used has been subject to availability, as follows: 2008- SIMD 2006; 2010 & 2012- SIMD 2009; 2014 & 2016- SIMD 2012, more details can be found in the Glossary.

Information Services Division
17
Distribution of obvious decay experience across the number of P1 children in Scotland
The value for the Slope Index of Inequality (SII) in 2016 was 1.84, which is an improvement since 2010 (Table 4). Similarly, the three non-SES-based measures of dental health inequalities shown in the table (SiC, SiC10, SCIM10) also show overall improvements since 2010.
Table 4. Inequality measures in teeth of P1 children in Scotland; 2010-2016
Source: ISD NDIP Database
Results from the detailed inspection for the Health and Social Care Partnerships are given in Appendix A5.
Results of the Basic Inspection for all P1 and P7 children are given in Appendix A6.
Year Slope Index of
Inequality (SII)
Relative Index of
Inequality (RII)
Significant Caries (SiC)
Index
Significant Caries 10
(SiC10)
Scottish Caries Inequality
Metric (SCIM10)
2010 2.42 1.58 4.50 8.52 11.07
2012 2.25 1.63 4.13 7.97 9.80
2014 1.99 1.61 3.72 7.64 8.57
2016 1.84 1.54 3.59 7.48 8.22

Information Services Division
18
Conclusions The oral health of P1 children in Scotland is slightly better than in 2014, and is considerably
improved since the early 2000s when the National Dental Inspection Programme started.
It is anticipated this improved level of dental health will be maintained as the Childsmile Programme4 continues to be refined and implemented by the NHS Boards.
Clear health inequalities remain, with only small improvements seen for both the socio-economic and non-socio-economic tests of dental health inequality over the time period.
Information Services Division
19
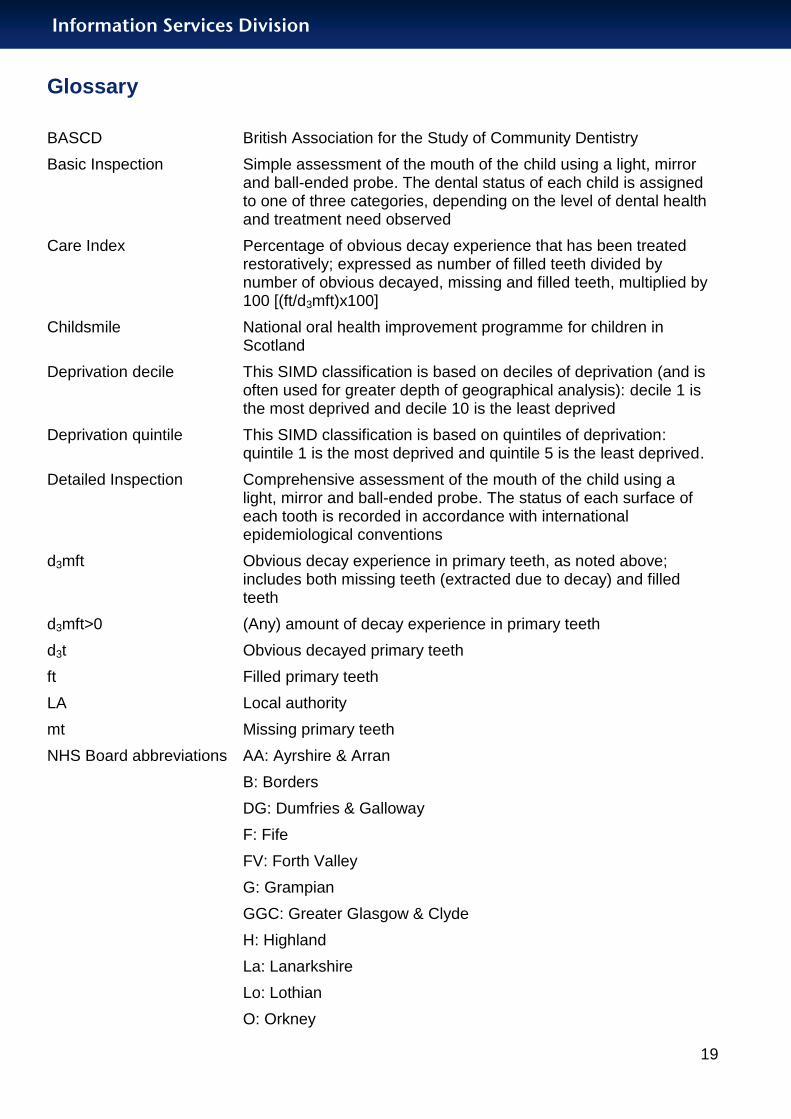
Glossary
BASCD British Association for the Study of Community Dentistry
Basic Inspection Simple assessment of the mouth of the child using a light, mirror and ball-ended probe. The dental status of each child is assigned to one of three categories, depending on the level of dental health and treatment need observed
Care Index Percentage of obvious decay experience that has been treated restoratively; expressed as number of filled teeth divided by number of obvious decayed, missing and filled teeth, multiplied by 100 [(ft/d3mft)x100]
Childsmile National oral health improvement programme for children in Scotland
Deprivation decile This SIMD classification is based on deciles of deprivation (and is often used for greater depth of geographical analysis): decile 1 is the most deprived and decile 10 is the least deprived
Deprivation quintile This SIMD classification is based on quintiles of deprivation: quintile 1 is the most deprived and quintile 5 is the least deprived.
Detailed Inspection Comprehensive assessment of the mouth of the child using a light, mirror and ball-ended probe. The status of each surface of each tooth is recorded in accordance with international epidemiological conventions
d3mft Obvious decay experience in primary teeth, as noted above; includes both missing teeth (extracted due to decay) and filled teeth
d3mft>0 (Any) amount of decay experience in primary teeth
d3t Obvious decayed primary teeth
ft Filled primary teeth
LA Local authority
mt Missing primary teeth
NHS Board abbreviations AA: Ayrshire & Arran
B: Borders
DG: Dumfries & Galloway
F: Fife
FV: Forth Valley
G: Grampian
GGC: Greater Glasgow & Clyde
H: Highland
La: Lanarkshire
Lo: Lothian
O: Orkney

Information Services Division
20
S: Shetland
T: Tayside
WI: Western Isles
Obvious decay Disease process that clinically appears to have penetrated dentine (the layer below the outer white enamel of the teeth). This is described internationally as decay at the d3 level and includes pulpal decay (i.e. decay into the deeper pulp).
SCIM10 Scottish Caries Inequality Metric. The area under the curve in relation to the distribution of the tenths of the population by obvious decay experience (d3mft).
SES Socio-economic status.
SiC Significant Caries Index. This is used in order to bring attention to the individuals with the highest caries values in each population under investigation.
SiC10 Significant Caries 10. The mean d3mft for the tenth of the sample with the most teeth affected by caries experience.
SII Slope Index of Inequality. This is one of the recommended tests of complex inequality, as it reflects the entire SES distribution and weights for the population share in the respective groups. SII may be interpreted as the absolute difference overall in d3mft score when moving across the SES spectrum and is indicative of the total experience of individuals in the whole population.
RII Relative Index of Inequality. This is one of the recommended tests of complex inequality, as it reflects the entire SES distribution and weights for the population share in the respective groups. RII can be interpreted as the relative difference overall in d3mft when moving across the SES spectrum. It can be calculated by dividing the SII by the mean level of decay in the population.
SIMD Scottish Index of Multiple Deprivation. Classification identifying small area concentrations of multiple deprivation presented at data zone level and based on postcode unit information. Seven domains (income, employment, education, housing, health, crime and geographical access) are combined into an overall index to rank relative multiple deprivation in all geographical areas throughout Scotland.
Several different versions of the SIMD are used across time. In 2008, the 2006 SIMD was used; in 2010 & 2012, the 2009 SIMD was used; in 2014 and 2016, the 2012 SIMD was used. For all of these indices, the most deprived quintile (or decile) is shown by SIMD1 or decile 1; and the least deprived quintile (or decile) shown by SIMD5 or decile 10.
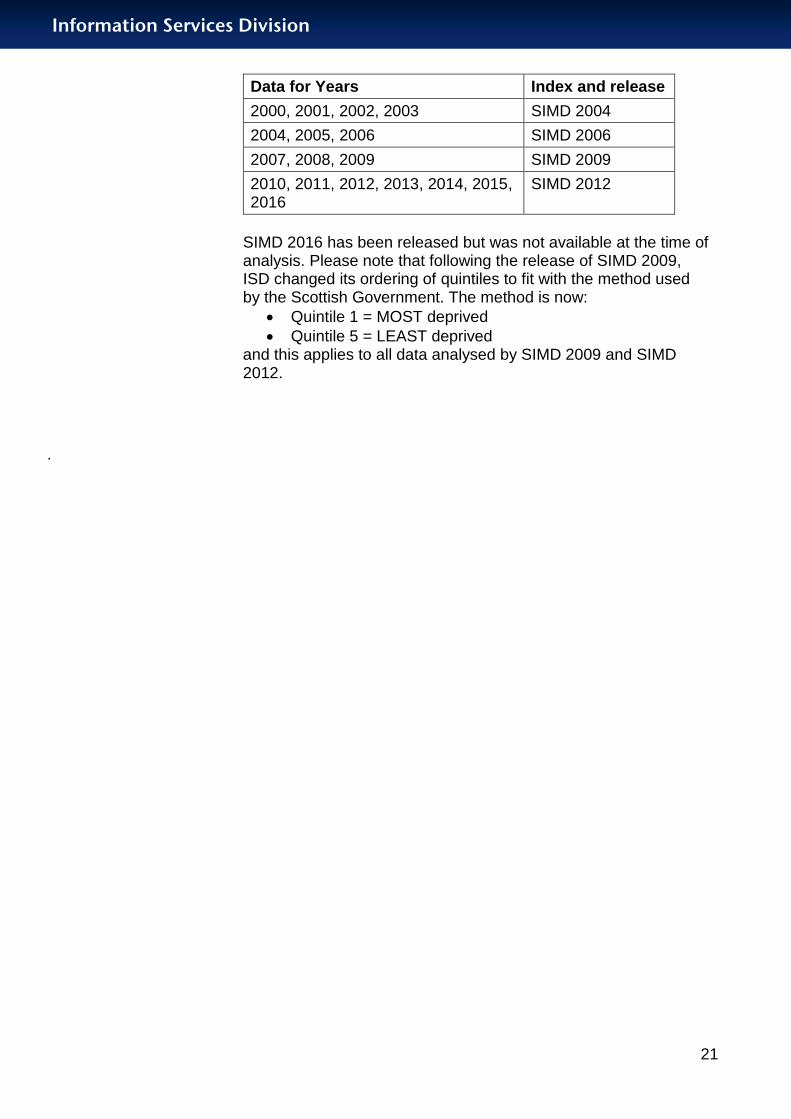
There were SIMD releases in 2004, 2006, 2009 and 2012. The most appropriate SIMD release has been used for each year of data as illustrated in the following table.
Information Services Division
21
Data for Years Index and release
2000, 2001, 2002, 2003 SIMD 2004
2004, 2005, 2006 SIMD 2006
2007, 2008, 2009 SIMD 2009
2010, 2011, 2012, 2013, 2014, 2015, 2016
SIMD 2012
SIMD 2016 has been released but was not available at the time of analysis. Please note that following the release of SIMD 2009, ISD changed its ordering of quintiles to fit with the method used by the Scottish Government. The method is now:
Quintile 1 = MOST deprived
Quintile 5 = LEAST deprived and this applies to all data analysed by SIMD 2009 and SIMD 2012.
.

Information Services Division
22
References
1. Scottish Index of Multiple Deprivation 2012 (www.scotland.gov.uk/topics/statistics/SIMD).
2. Bratthall D, (2000). Introducing the Significant Caries Index together with a proposal for a new global oral health goal for 12-year-olds. International Dental Journal; 50: 378-384.
3. Comparison and Relative Utility of Inequality Measurements: As Applied to Scotland’s Child Dental Health (http://www.plosone.org/article/info%3Adoi%2F10.1371%2Fjournal.pone.0058593).
4. Childsmile (http://www.child-smile.org.uk).
5. Mitropoulos C, Pitts NB, Deery C. BASCD Trainers pack for caries prevalence studies, 1992/93. Dundee: University of Dundee, 1992.
6. Landis JR, Koch GG. The measurement of observer agreement for categorical data. Biometrics 1977; 33: 159-174.
Information Services Division
23
Acknowledgements
The National Dental Inspection Programme would not have been possible without the efforts of many people throughout Scotland who worked together to ensure its success.
The Programme is indebted to:
The participating schools, the children and their parents/carers.
The head teachers, staff and children in the Coatbridge, Edinburgh, Perth and Stirling schools where the training and calibration exercises were conducted:
o St Timothy’s Primary School, Coatbridge (head teacher, Mr. Colin Forbes)
o Castleview Primary School, Edinburgh (head teacher, Ms. Lindsey Watt)
o Letham Primary School, Perth (head teacher, Mrs. Sharon Forbes)
o North Muirton Primary School, Perth (head teacher, Ms. Margaret Donaghy)
o Our Lady’s Primary School, Stirling (head teacher, Ms. Marie Brennan)
o Raploch Primary School, Stirling (head teacher, Ms. Karin Stuart)
Staff at NHS Forth Valley, NHS Lanarkshire, NHS Lothian, NHS Tayside and NHS Fife, for organising the training and calibration courses, and Professor Nicola Innes from the University of Dundee.
Local Education Authorities of Scotland.
NHS Boards in Scotland.
The dentists, dental therapists and dental nurses from the Public Dental Service who conducted the inspections.
NHS NSS ISD and the Community Oral Health Section, University of Glasgow Dental School, for the analysis of the results and publication of the report.
Consultants in Dental Public Health and Chief Administrative Dental Officers Group.
Scottish Association of Clinical Dental Directors.

Information Services Division
24
List of Tables, Figures and Diagrams
Table No. Name Time period File & size
1 Estimated Primary 1 population and the number and percentage who received a Detailed Inspection by NHS Board across Scotland.
School year 2015/16.
Excel [11KB]
2 Obvious decay experience in primary teeth of P1 children for each NHS Board and Scotland.
School year 2015/16.
Excel [11KB]
3 Mean number of decayed, missing and filled primary teeth (d3mft) in P1 children by SIMD quintile, 2010-2016.
2010-2016 Excel [10KB]
4 Inequality measures in teeth of P1 children in Scotland in 2016.
2010-2016 Excel [10KB]
A1 Is NDIP comparable with other UK data? N/A Excel [10KB]
A2 Care Index for P1 children in Scotland; by NHS Board.
School year 2015/16.
Excel [11KB]
A3.1-A3.8 Detailed results at Health & Social Care Partnership (HSCP) level.
School year 2015/16.
Excel [36KB]
A4 Basic Inspection - Primary 1 children inspected by NHS Boards.
School year 2015/16.
Excel [13KB]
A5 Basic Inspection - Primary 7 children inspected by NHS Boards.
School year 2015/16.
Excel [13KB]
Figure No. Name Time period File & size
1 Percentage of P1 children in Scotland with no obvious decay experience in 2016; by NHS Board.
School year 2015/16.
Excel [23KB]
2 Mean number of obvious decayed, missing and filled primary teeth (d3mft) of P1 children in Scotland and by NHS Board.
School year 2015/16.
Excel [27KB]
3 Trends in the percentage of P1 children in Scotland with no obvious decay experience.
1988-2016 Excel [43KB]
4 Mean number of decayed, missing and filled primary teeth (d3mft) in the P1 population.
1988-2016 Excel [47KB]
5 Mean number of decayed, missing and filled primary teeth in those children with decay experience (d3mft>0).
2006-2016 Excel [41KB]
6 Care Index for P1 children in Scotland. 1988-2016 Excel [48KB]
7 Percentage of P1 children in Scotland with untreated decay; by NHS Board
School year 2015/16.
Excel [21KB]
Information Services Division
25
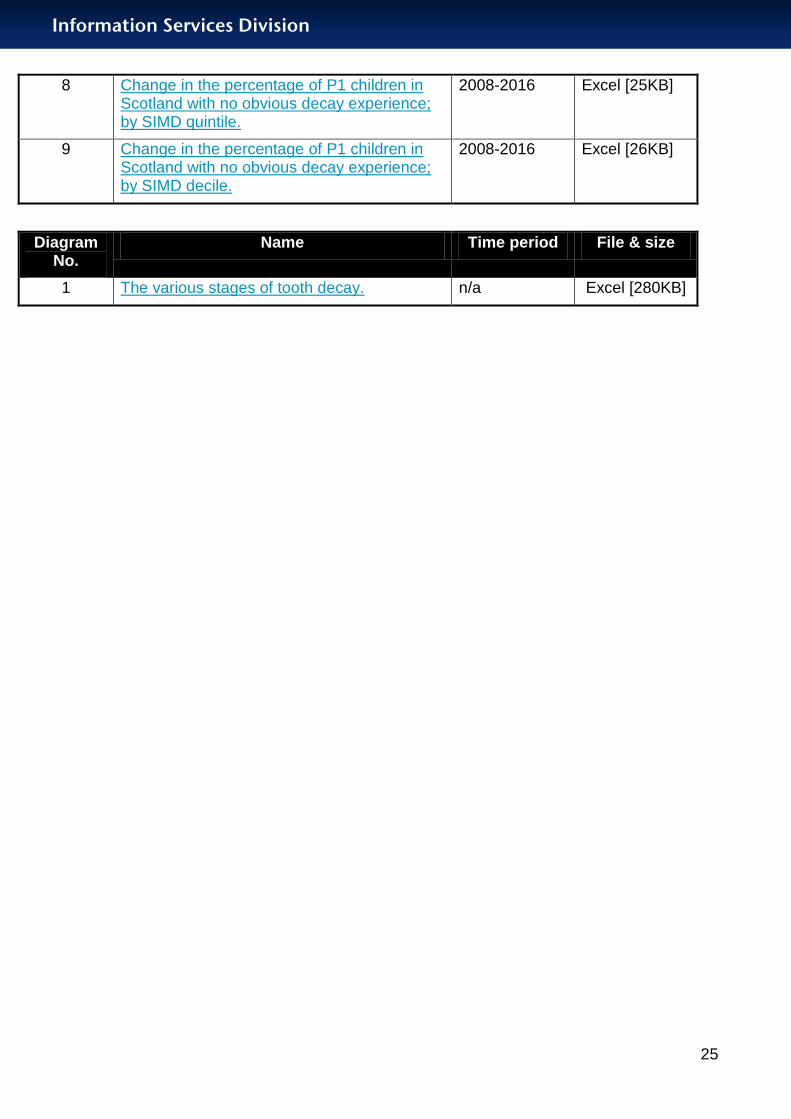
8 Change in the percentage of P1 children in Scotland with no obvious decay experience; by SIMD quintile.
2008-2016 Excel [25KB]
9 Change in the percentage of P1 children in Scotland with no obvious decay experience; by SIMD decile.
2008-2016 Excel [26KB]
Diagram No.
Name Time period File & size
1 The various stages of tooth decay. n/a Excel [280KB]
Information Services Division
26
Contacts Michael McStravick
Information Analyst
ISD Scotland
0131 282 2044
Catherine S Thomson
Service Manager (Primary & Secondary Care)
ISD Scotland
0131 275 7198
Lorna M D Macpherson
Professor of Dental Public Health
University of Glasgow Dental School
0141 211 9751
Further Information Further information can be found on the ISD website.
Rate this publication Click here to provide feedback and rate this publication.
Information Services Division
27
Appendices
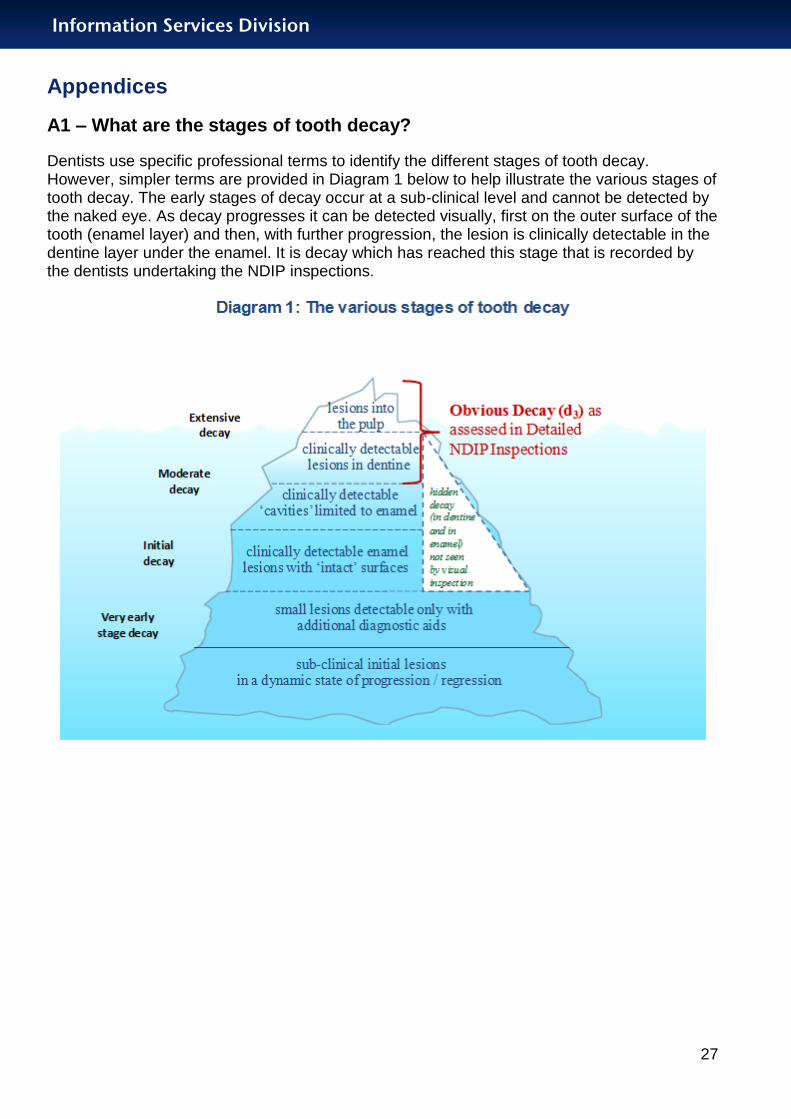
A1 – What are the stages of tooth decay?
Dentists use specific professional terms to identify the different stages of tooth decay. However, simpler terms are provided in Diagram 1 below to help illustrate the various stages of tooth decay. The early stages of decay occur at a sub-clinical level and cannot be detected by the naked eye. As decay progresses it can be detected visually, first on the outer surface of the tooth (enamel layer) and then, with further progression, the lesion is clinically detectable in the dentine layer under the enamel. It is decay which has reached this stage that is recorded by the dentists undertaking the NDIP inspections.
Information Services Division
28
A2 – National training and calibration course
The training and calibration courses for the detailed NDIP survey of P1 children in Scotland took place in October and November 2015. They were hosted by NHS Forth Valley, NHS Lanarkshire, NHS Lothian and NHS Tayside with support from NHS Fife.
Mandatory training and calibration sessions were run over five separate courses to accommodate the 51 inspection teams (dentist /dental therapist and dental nurse) who came from all 14 NHS Boards. A gold standard dentist attended all five courses for quality assurance purposes.
Prior to coming on the courses dental teams had to undertake mandatory online training. At the courses there was a training session covering the inspection procedures, tooth/surface codes and diagnostic criteria based on the British Association for the Study of Community Dentistry (BASCD) Trainers’ Pack5. Clinical training sessions were then undertaken on schoolchildren, and were followed by the calibration sessions on a further group of P1 children. Calibration sessions involved each inspection team examining the same 11 children.
Analyses were undertaken by the University of Glasgow Community Oral Health Section. Inter-examiner agreement was assessed using the percentage agreement and Kappa statistic assessed at the patient level on d3mft and separately for dt, mt, and ft components.
Cohen Kappa estimates agreement, which is considered6:
poor if Kappa ≤ 0.20
fair if 0.21 ≤ Kappa ≤ 0.40
moderate if 0.41 ≤ Kappa ≤ 0.60
substantial if 0.61 ≤ Kappa ≤ 0.80
good if Kappa > 0.80
All 55 inspection teams calibrated with percentage agreement ranging from 90% to 100%, and the Kappa estimates for d3mft scores at the patient level did not drop below moderate. Further investigation of the data on 1 inspection team where the Kappa was lower than substantial found that the disagreement was on no more than 2 children. The Kappa estimates for dt scores at the patient level did also not drop below moderate. There were 3 inspection teams where the Kappa estimates for dt was moderate, and again the disagreements were on no more than 2 children.

Information Services Division
29
A3 – Links/comparisons to other sources of dental health information
The sources below offer information related to dental services and dental health. Most of these sources are external to ISD and we cannot guarantee the content or accessibility of these external web sites.
Childsmile - improving the oral health of children in Scotland.
Dental data in Scotland
ISD publishes
Information relating to the general dental service workforce in Scotland.
An annual NHS Adult & Child Fees and Treatments report providing information on GDS fees paid to dentists and on treatments provided to children and adults.
A biannual NHS Registration and Participation report providing information on NHS General Dental Services (GDS) registrations and participation (contact with GDS).
An annual report providing information on the application of fluoride varnishing to children’s teeth.
The 2014 Scottish Health Survey covers dental health topics such as dental health problems and trends in prevalence of natural teeth.
The 2015/16 Scottish Adult Oral Health Survey will provide detailed analyses of oral health factors and demographic measures for adults, and will provide a tool to inform policy, plan services and improve and maintain health. It is anticipated that this report will be published in winter 2016.
Table A1. Is NDIP Comparable with other UK dental data?
As stated, the results from these reports are not directly comparable with the NDIP report.
The Office for National Statistics’ (ONS) has carried out a Dental Health Survey of Children and Young People every ten years since 1973. The study provides information to underpin dental health care for children in England, Wales and Northern Ireland. The information collected helps the NHS to understand how the dental health of each generation of children is changing. It is used in the planning of dental care services for the future.
Country Comparable to NDIP? Available Links
England No – consent affects participation rates of children with and without decay
Yes The Dental Observatory produced a report on the prevalence and severity of dental decay of five-year old children in 2015.
Northern Ireland - No -
Wales No – consent affects participation rates of children with and without decay
Yes Cardiff University and Public Health Wales produce annual reports for childhood oral epidemiology programme.

Information Services Division
30
Please note that if you want to compare deprivation levels in Scotland and England, the Scottish Index of Multiple Deprivation (SIMD) is not directly comparable with the Index of Multiple Deprivation used in England.
Information Services Division
31
A4 – Results of Care Index at NHS Board level; Detailed Inspection
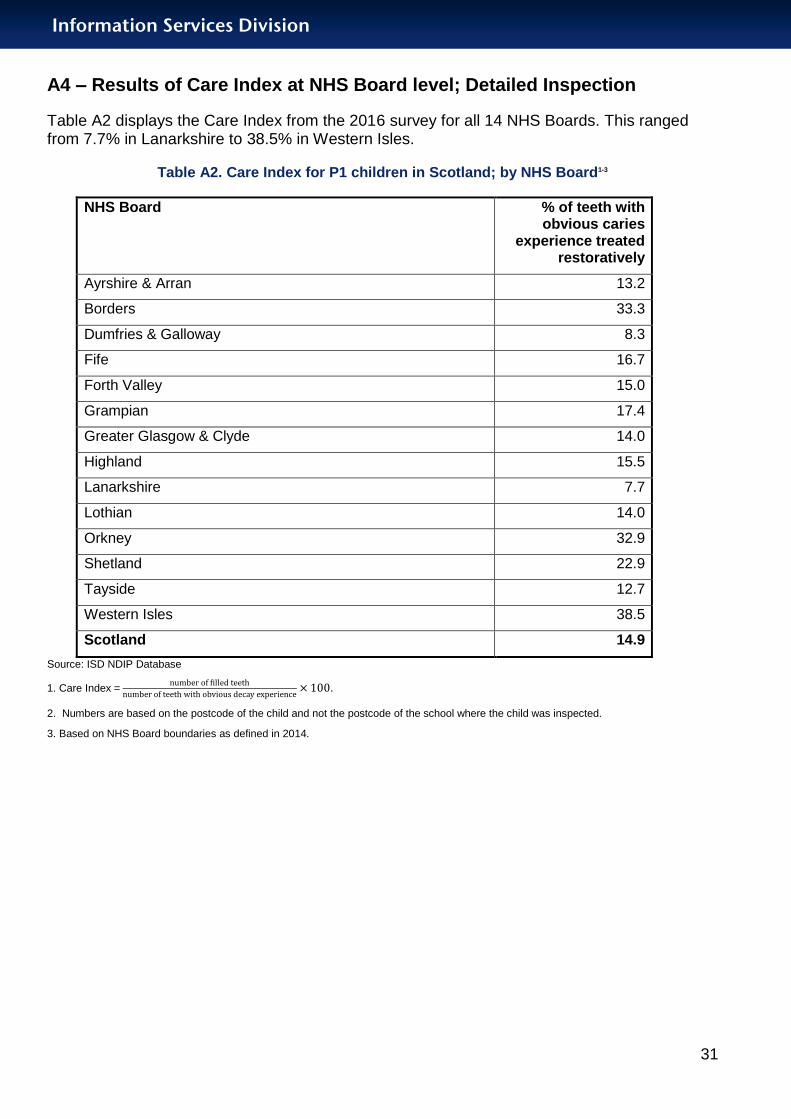
Table A2 displays the Care Index from the 2016 survey for all 14 NHS Boards. This ranged from 7.7% in Lanarkshire to 38.5% in Western Isles.
Table A2. Care Index for P1 children in Scotland; by NHS Board1-3
NHS Board % of teeth with obvious caries
experience treated restoratively
Ayrshire & Arran 13.2
Borders 33.3
Dumfries & Galloway 8.3
Fife 16.7
Forth Valley 15.0
Grampian 17.4
Greater Glasgow & Clyde 14.0
Highland 15.5
Lanarkshire 7.7
Lothian 14.0
Orkney 32.9
Shetland 22.9
Tayside 12.7
Western Isles 38.5
Scotland 14.9
Source: ISD NDIP Database
1. Care Index =
.
2. Numbers are based on the postcode of the child and not the postcode of the school where the child was inspected.
3. Based on NHS Board boundaries as defined in 2014.

Information Services Division
32
A5 – Results for Health and Social Care Partnerships (HSCP); Detailed Inspection for Primary 1 children in 2016
Tables A3.1-A3.8 show the 2016 Detailed NDIP results for Health and Social Care Partnerships for the eight NHS Boards which included the minimum target sample of 250 children in each HSCP (if the HSCP is within 10% of reaching the target, it was included).
The following variables are given:
Mean age
Weighted % no obvious decay experience
Weighted mean d3mft
Weighted mean d3t
Weighted mean mt
Weighted mean ft
Mean d3mft for children with d3mft>0
Results for the HSCPs are weighted by population deprivation categories specific to each NHS Board. This is different to the deprivation categorisation used in the main report which is SIMD 2012 based on the whole of Scotland. As such the deprivation results for the HSCPs are not directly comparable with those in the main report.
The HSCPs are weighted by NHS board deprivation categories so as to allow fair comparison within the board area. This is only applicable to boards with more than one HSCP, and therefore boards with only one HSCP are not reported, namely NHS Borders, NHS Dumfries & Galloway, NHS Fife, NHS Orkney, NHS Shetland and NHS Western Isles.

Information Services Division
33
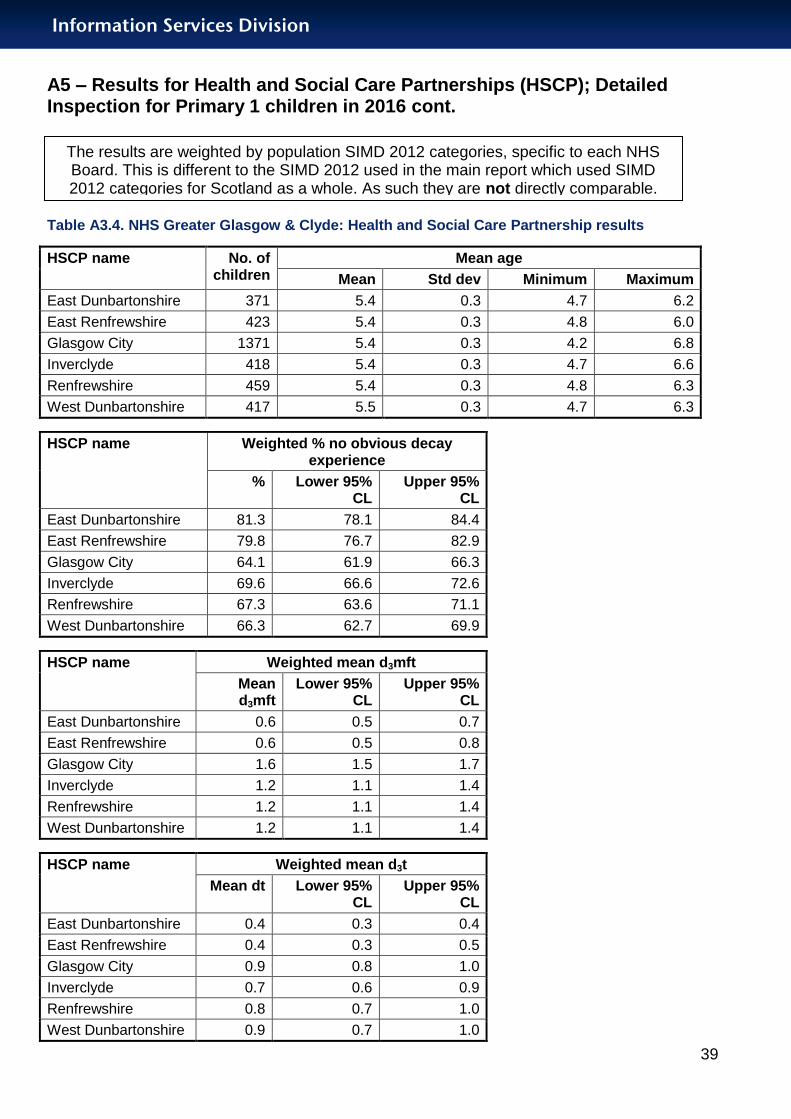
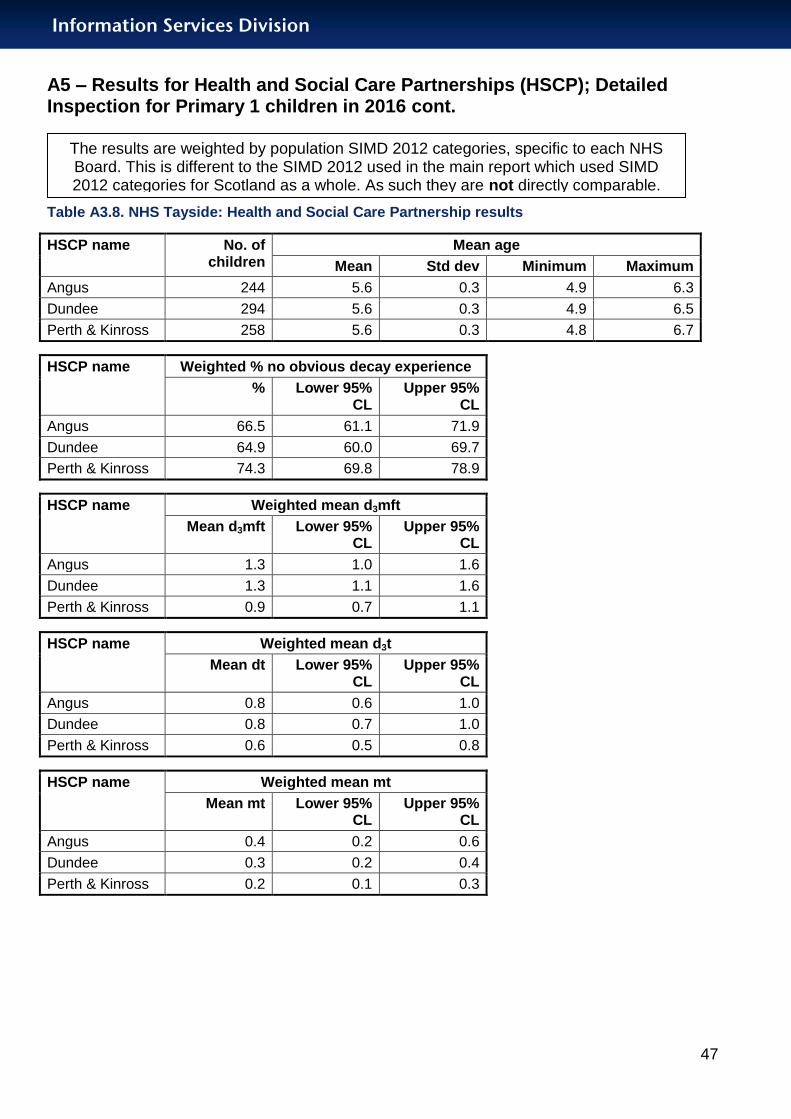
A5 – Results for Health and Social Care Partnerships (HSCP); Detailed Inspection for Primary 1 children in 2016 cont.
The results are weighted by population SIMD 2012 categories, specific to each NHS Board. This is different to the SIMD 2012 used in the main report which used SIMD 2012 categories
for Scotland as a whole. As such they are not directly comparable.
Table A3.1. NHS Ayrshire & Arran: Health and Social Care Partnership results
HSCP name No. of children
Mean age
Mean Std dev Minimum Maximum
East Ayrshire 384 5.5 0.3 4.9 6.9
North Ayrshire 401 5.5 0.3 4.3 6.4
South Ayrshire 354 5.5 0.3 4.2 6.4
HSCP name Weighted % no obvious decay experience
% Lower 95% CL
Upper 95% CL
East Ayrshire 71.4 67.3 75.5
North Ayrshire 69.2 65.2 73.3
South Ayrshire 76.7 73.0 80.3
HSCP name Weighted mean d3mft
Mean d3mft Lower 95% CL
Upper 95% CL
East Ayrshire 1.0 0.8 1.2
North Ayrshire 1.3 1.1 1.6
South Ayrshire 0.8 0.7 1.0
HSCP name Weighted mean d3t
Mean d3t Lower 95% CL
Upper 95% CL
East Ayrshire 0.5 0.4 0.7
North Ayrshire 0.8 0.7 1.0
South Ayrshire 0.4 0.3 0.5
HSCP name Weighted mean mt
Mean mt Lower 95% CL
Upper 95% CL
East Ayrshire 0.4 0.2 0.5
North Ayrshire 0.4 0.2 0.5
South Ayrshire 0.3 0.2 0.4
HSCP name Weighted mean ft
Mean pt Lower 95% CL
Upper 95% CL
East Ayrshire 0.1 0.1 0.2
North Ayrshire 0.2 0.1 0.2
South Ayrshire 0.1 0.1 0.2

Information Services Division
34
A5 – Results for Health and Social Care Partnerships (HSCP); Detailed Inspection for Primary 1 children in 2016 cont.
The results are weighted by population SIMD 2012 categories, specific to each NHS Board. This is different to the SIMD 2012 used in the main report which used SIMD 2012 categories
for Scotland as a whole. As such they are not directly comparable.
Table A3.1. NHS Ayrshire & Arran: Health and Social Care Partnership results continued
HSCP name No. of children with
obvious decay
experience
Mean d3mft for children with obvious decay experience (d3mft >0)
Mean Lower 95% CL
Upper 95% CL
East Ayrshire 103 3.4 2.9 3.9
North Ayrshire 126 4.4 3.8 4.9
South Ayrshire 84 3.6 2.9 4.2

Information Services Division
35
A5 – Results for Health and Social Care Partnerships (HSCP); Detailed Inspection for Primary 1 children in 2016 cont.
Table A3.2. NHS Forth Valley: Health and Social Care Partnership results
HSCP name No. of children
Mean age
Mean Std dev Minimum Maximum
Clackmannanshire and Stirling 786 5.5 0.3 4.7 6.5
Falkirk 794 5.5 0.3 4.7 6.2
HSCP name Weighted % no obvious decay experience
% Lower 95% CL
Upper 95% CL
Clackmannanshire and Stirling 71.7 69.5 73.9
Falkirk 68.3 65.9 70.7
HSCP name Weighted mean d3mft
Mean d3mft
Lower 95% CL
Upper 95% CL
Clackmannanshire and Stirling 1.0 0.9 1.1
Falkirk 1.4 1.2 1.5
HSCP name Weighted mean d3t
Mean dt Lower 95% CL
Upper 95% CL
Clackmannanshire and Stirling 0.7 0.6 0.8
Falkirk 1.0 0.8 1.1
HSCP name Weighted mean mt
Mean mt
Lower 95% CL
Upper 95% CL
Clackmannanshire and Stirling 0.1 0.1 0.2
Falkirk 0.2 0.1 0.3
HSCP name Weighted mean ft
Mean ft Lower 95% CL
Upper 95% CL
Clackmannanshire and Stirling 0.2 0.1 0.2
Falkirk 0.2 0.2 0.2
The results are weighted by population SIMD 2012 categories, specific to each NHS Board. This is different to the SIMD 2012 used in the main report which used SIMD 2012 categories for Scotland as a whole. As such they are not directly comparable.

Information Services Division
36
A5 – Results for Health and Social Care Partnerships (HSCP); Detailed Inspection for Primary 1 children in 2016 cont.
Table A3.2. NHS Forth Valley: Health and Social Care Partnership results continued
HSCP name No. of children
with obvious
decay experience
Mean d3mft for children with obvious decay experience (d3mft
>0)
Mean Lower 95% CL
Upper 95% CL
Clackmannanshire and Stirling 214 3.6 3.2 4.0
Falkirk 250 4.3 3.9 4.7
The results are weighted by population SIMD 2012 categories, specific to each NHS Board. This is different to the SIMD 2012 used in the main report which used SIMD 2012 categories for Scotland as a whole. As such they are not directly comparable.

Information Services Division
37
A5 – Results for Health and Social Care Partnerships (HSCP); Detailed Inspection for Primary 1 children in 2016 cont.
Table A3.3. NHS Grampian: Health and Social Care Partnership results
HSCP name No. of children
Mean age
Mean Std dev Minimum Maximum
Aberdeen City 1290 5.6 0.3 4.4 6.6
Aberdeenshire 1464 5.5 0.3 4.7 6.2
Moray 533 5.6 0.3 4.4 6.7
HSCP name Weighted % no obvious decay experience
% Lower 95% CL
Upper 95% CL
Aberdeen City 68.8 67.2 70.5
Aberdeenshire 71.6 69.8 73.3
Moray 69.4 66.5 72.2
HSCP name Weighted mean d3mft
Mean d3mft Lower 95% CL
Upper 95% CL
Aberdeen City 1.2 1.1 1.3
Aberdeenshire 1.0 0.9 1.1
Moray 1.1 0.9 1.2
HSCP name Weighted mean d3t
Mean dt Lower 95% CL
Upper 95% CL
Aberdeen City 0.8 0.7 0.8
Aberdeenshire 0.6 0.5 0.7
Moray 0.7 0.6 0.8
HSCP name Weighted mean mt
Mean mt Lower 95% CL
Upper 95% CL
Aberdeen City 0.2 0.2 0.3
Aberdeenshire 0.2 0.2 0.3
Moray 0.2 0.1 0.3
The results are weighted by population SIMD 2012 categories, specific to each NHS Board. This is different to the SIMD 2012 used in the main report which used SIMD 2012 categories for Scotland as a whole. As such they are not directly comparable.

Information Services Division
38
A5 – Results for Health and Social Care Partnerships (HSCP); Detailed Inspection for Primary 1 children in 2016 cont.
Table A3.3. NHS Grampian: Health and Social Care Partnership results continued
HSCP name Weighted mean ft
Mean ft Lower 95% CL
Upper 95% CL
Aberdeen City 0.2 0.2 0.2
Aberdeenshire 0.2 0.1 0.2
Moray 0.2 0.1 0.2
HSCP name No. of children with
obvious decay
experience
Mean d3mft for children with obvious decay experience (d3mft >0)
Mean Lower 95% CL
Upper 95% CL
Aberdeen City 437 4.0 3.8 4.3
Aberdeenshire 448 3.6 3.3 3.8
Moray 161 3.5 3.0 3.9
The results are weighted by population SIMD 2012 categories, specific to each NHS Board. This is different to the SIMD 2012 used in the main report which used SIMD 2012 categories for Scotland as a whole. As such they are not directly comparable.
Information Services Division
39
A5 – Results for Health and Social Care Partnerships (HSCP); Detailed Inspection for Primary 1 children in 2016 cont.
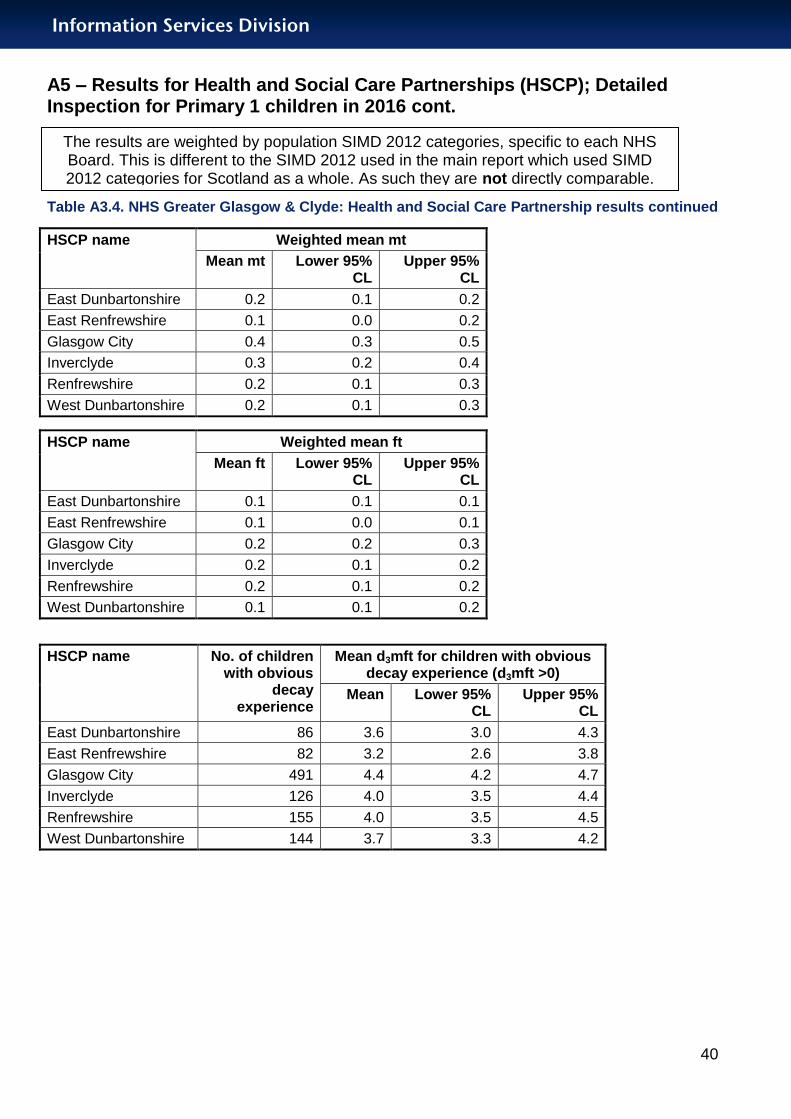
Table A3.4. NHS Greater Glasgow & Clyde: Health and Social Care Partnership results
HSCP name No. of children
Mean age
Mean Std dev Minimum Maximum
East Dunbartonshire 371 5.4 0.3 4.7 6.2
East Renfrewshire 423 5.4 0.3 4.8 6.0
Glasgow City 1371 5.4 0.3 4.2 6.8
Inverclyde 418 5.4 0.3 4.7 6.6
Renfrewshire 459 5.4 0.3 4.8 6.3
West Dunbartonshire 417 5.5 0.3 4.7 6.3
HSCP name Weighted % no obvious decay experience
% Lower 95% CL
Upper 95% CL
East Dunbartonshire 81.3 78.1 84.4
East Renfrewshire 79.8 76.7 82.9
Glasgow City 64.1 61.9 66.3
Inverclyde 69.6 66.6 72.6
Renfrewshire 67.3 63.6 71.1
West Dunbartonshire 66.3 62.7 69.9
HSCP name Weighted mean d3mft
Mean d3mft
Lower 95% CL
Upper 95% CL
East Dunbartonshire 0.6 0.5 0.7
East Renfrewshire 0.6 0.5 0.8
Glasgow City 1.6 1.5 1.7
Inverclyde 1.2 1.1 1.4
Renfrewshire 1.2 1.1 1.4
West Dunbartonshire 1.2 1.1 1.4
HSCP name Weighted mean d3t
Mean dt Lower 95% CL
Upper 95% CL
East Dunbartonshire 0.4 0.3 0.4
East Renfrewshire 0.4 0.3 0.5
Glasgow City 0.9 0.8 1.0
Inverclyde 0.7 0.6 0.9
Renfrewshire 0.8 0.7 1.0
West Dunbartonshire 0.9 0.7 1.0
The results are weighted by population SIMD 2012 categories, specific to each NHS Board. This is different to the SIMD 2012 used in the main report which used SIMD 2012 categories for Scotland as a whole. As such they are not directly comparable.
Information Services Division
40
A5 – Results for Health and Social Care Partnerships (HSCP); Detailed Inspection for Primary 1 children in 2016 cont.
Table A3.4. NHS Greater Glasgow & Clyde: Health and Social Care Partnership results continued
HSCP name Weighted mean mt
Mean mt Lower 95% CL
Upper 95% CL
East Dunbartonshire 0.2 0.1 0.2
East Renfrewshire 0.1 0.0 0.2
Glasgow City 0.4 0.3 0.5
Inverclyde 0.3 0.2 0.4
Renfrewshire 0.2 0.1 0.3
West Dunbartonshire 0.2 0.1 0.3
HSCP name Weighted mean ft
Mean ft Lower 95% CL
Upper 95% CL
East Dunbartonshire 0.1 0.1 0.1
East Renfrewshire 0.1 0.0 0.1
Glasgow City 0.2 0.2 0.3
Inverclyde 0.2 0.1 0.2
Renfrewshire 0.2 0.1 0.2
West Dunbartonshire 0.1 0.1 0.2
HSCP name No. of children with obvious
decay experience
Mean d3mft for children with obvious decay experience (d3mft >0)
Mean Lower 95% CL
Upper 95% CL
East Dunbartonshire 86 3.6 3.0 4.3
East Renfrewshire 82 3.2 2.6 3.8
Glasgow City 491 4.4 4.2 4.7
Inverclyde 126 4.0 3.5 4.4
Renfrewshire 155 4.0 3.5 4.5
West Dunbartonshire 144 3.7 3.3 4.2
The results are weighted by population SIMD 2012 categories, specific to each NHS Board. This is different to the SIMD 2012 used in the main report which used SIMD 2012 categories for Scotland as a whole. As such they are not directly comparable.

Information Services Division
41
A5 – Results for Health and Social Care Partnerships (HSCP); Detailed Inspection for Primary 1 children in 2016 cont.
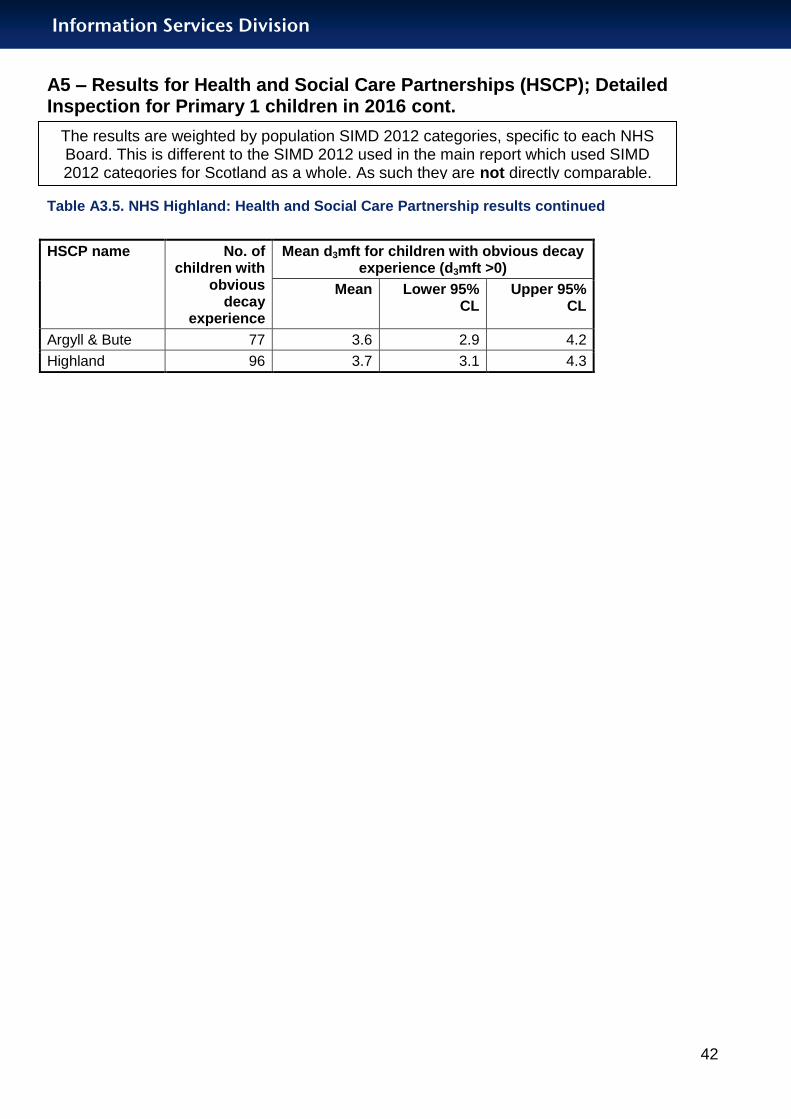
Table A3.5. NHS Highland: Health and Social Care Partnership results
HSCP name No. of children
Mean age
Mean Std dev Minimum Maximum
Argyll & Bute 291 5.5 0.3 4.8 6.5
Highland 343 5.7 0.3 5.0 6.5
HSCP name Weighted % no obvious decay experience
% Lower 95% CL
Upper 95% CL
Argyll & Bute 73.4 69.2 77.6
Highland 71.4 66.7 76.0
HSCP name Weighted mean d3mft
Mean d3mft Lower 95% CL
Upper 95% CL
Argyll & Bute 1.0 0.8 1.2
Highland 1.1 0.8 1.3
HSCP name Weighted mean d3t
Mean dt Lower 95% CL
Upper 95% CL
Argyll & Bute 0.7 0.5 0.8
Highland 0.7 0.5 0.9
HSCP name Weighted mean mt
Mean mt Lower 95% CL
Upper 95% CL
Argyll & Bute 0.2 0.1 0.3
Highland 0.2 0.1 0.3
HSCP name Weighted mean ft
Mean ft Lower 95% CL
Upper 95% CL
Argyll & Bute 0.1 0.1 0.2
Highland 0.2 0.1 0.3
The results are weighted by population SIMD 2012 categories, specific to each NHS Board. This is different to the SIMD 2012 used in the main report which used SIMD 2012 categories for Scotland as a whole. As such they are not directly comparable.
Information Services Division
42
A5 – Results for Health and Social Care Partnerships (HSCP); Detailed Inspection for Primary 1 children in 2016 cont.
Table A3.5. NHS Highland: Health and Social Care Partnership results continued
HSCP name No. of children with
obvious decay
experience
Mean d3mft for children with obvious decay experience (d3mft >0)
Mean Lower 95% CL
Upper 95% CL
Argyll & Bute 77 3.6 2.9 4.2
Highland 96 3.7 3.1 4.3
The results are weighted by population SIMD 2012 categories, specific to each NHS Board. This is different to the SIMD 2012 used in the main report which used SIMD 2012 categories for Scotland as a whole. As such they are not directly comparable.
Information Services Division
43
A5 – Results for Health and Social Care Partnerships (HSCP); Detailed Inspection for Primary 1 children in 2016 cont.
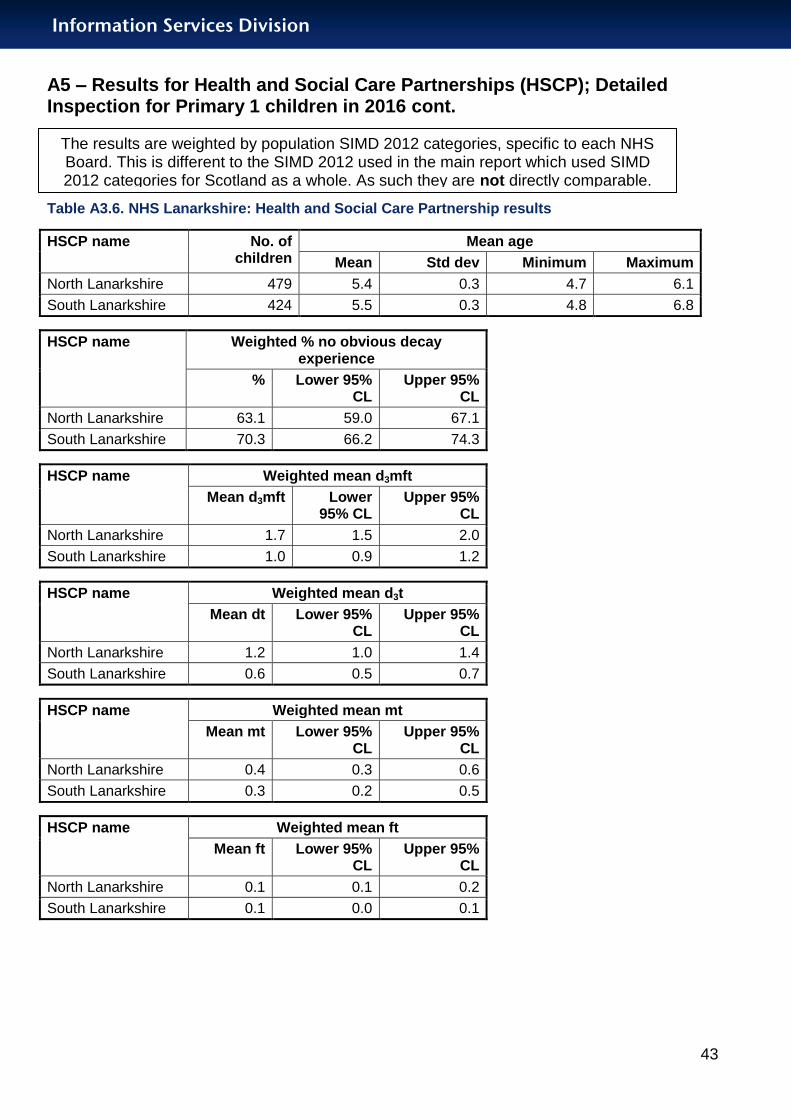
Table A3.6. NHS Lanarkshire: Health and Social Care Partnership results
HSCP name No. of children
Mean age
Mean Std dev Minimum Maximum
North Lanarkshire 479 5.4 0.3 4.7 6.1
South Lanarkshire 424 5.5 0.3 4.8 6.8
HSCP name Weighted % no obvious decay experience
% Lower 95% CL
Upper 95% CL
North Lanarkshire 63.1 59.0 67.1
South Lanarkshire 70.3 66.2 74.3
HSCP name Weighted mean d3mft
Mean d3mft Lower 95% CL
Upper 95% CL
North Lanarkshire 1.7 1.5 2.0
South Lanarkshire 1.0 0.9 1.2
HSCP name Weighted mean d3t
Mean dt Lower 95% CL
Upper 95% CL
North Lanarkshire 1.2 1.0 1.4
South Lanarkshire 0.6 0.5 0.7
HSCP name Weighted mean mt
Mean mt Lower 95% CL
Upper 95% CL
North Lanarkshire 0.4 0.3 0.6
South Lanarkshire 0.3 0.2 0.5
HSCP name Weighted mean ft
Mean ft Lower 95% CL
Upper 95% CL
North Lanarkshire 0.1 0.1 0.2
South Lanarkshire 0.1 0.0 0.1
The results are weighted by population SIMD 2012 categories, specific to each NHS Board. This is different to the SIMD 2012 used in the main report which used SIMD 2012 categories for Scotland as a whole. As such they are not directly comparable.
Information Services Division
44
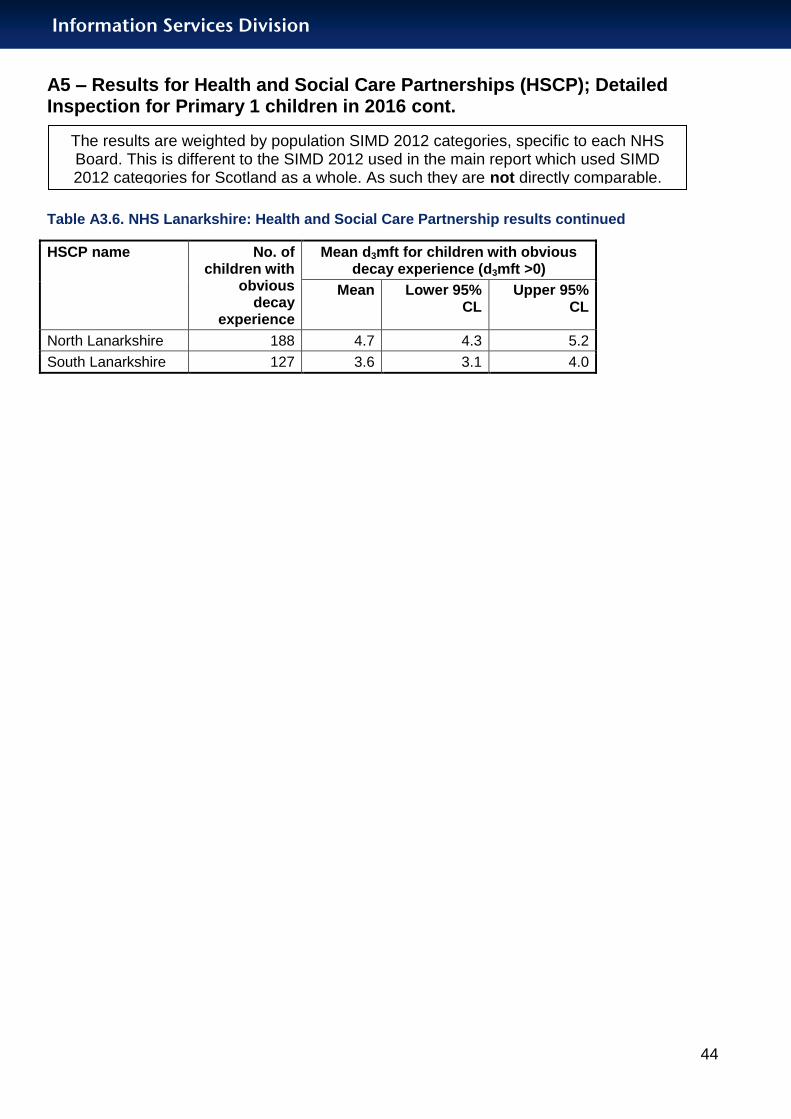
A5 – Results for Health and Social Care Partnerships (HSCP); Detailed Inspection for Primary 1 children in 2016 cont.
Table A3.6. NHS Lanarkshire: Health and Social Care Partnership results continued
HSCP name No. of children with
obvious decay
experience
Mean d3mft for children with obvious decay experience (d3mft >0)
Mean Lower 95% CL
Upper 95% CL
North Lanarkshire 188 4.7 4.3 5.2
South Lanarkshire 127 3.6 3.1 4.0
The results are weighted by population SIMD 2012 categories, specific to each NHS Board. This is different to the SIMD 2012 used in the main report which used SIMD 2012 categories for Scotland as a whole. As such they are not directly comparable.

Information Services Division
45
A5 – Results for Health and Social Care Partnerships (HSCP); Detailed Inspection for Primary 1 children in 2016 cont.
Table A3.7. NHS Lothian: Health and Social Care Partnership results
HSCP name No. of children
Mean age
Mean Std dev Minimum Maximum
East Lothian 340 5.6 0.3 4.9 6.4
Edinburgh 719 5.5 0.3 4.8 6.7
Midlothian 334 5.6 0.3 4.9 6.4
West Lothian 370 5.5 0.3 4.9 6.3
HSCP name Weighted % no obvious decay experience
% Lower 95% CL
Upper 95% CL
East Lothian 72.4 68.1 76.6
Edinburgh 73.1 70.2 76.0
Midlothian 68.8 64.7 72.9
West Lothian 63.7 58.8 68.7
HSCP name Weighted mean d3mft
Mean d3mft Lower 95% CL
Upper 95% CL
East Lothian 1.1 0.9 1.3
Edinburgh 1.2 1.0 1.3
Midlothian 1.3 1.1 1.5
West Lothian 1.7 1.4 2.0
HSCP name Weighted mean d3t
Mean dt Lower 95% CL
Upper 95% CL
East Lothian 0.8 0.6 0.9
Edinburgh 0.7 0.6 0.9
Midlothian 0.7 0.5 0.9
West Lothian 1.1 0.9 1.4
HSCP name Weighted mean mt
Mean mt Lower 95% CL
Upper 95% CL
East Lothian 0.2 0.1 0.3
Edinburgh 0.3 0.2 0.3
Midlothian 0.4 0.2 0.5
West Lothian 0.4 0.2 0.5
The results are weighted by population SIMD 2012 categories, specific to each NHS Board. This is different to the SIMD 2012 used in the main report which used SIMD 2012 categories for Scotland as a whole. As such they are not directly comparable.

Information Services Division
46
A5 – Results for Health and Social Care Partnerships (HSCP); Detailed Inspection for Primary 1 children in 2016 cont.
Table A3.7. NHS Lothian: Health and Social Care Partnership results continued
HSCP name No. of children with
obvious decay
experience
Mean d3mft for children with obvious decay experience (d3mft >0)
Mean Lower 95% CL
Upper 95% CL
East Lothian 97 4.1 3.6 4.7
Edinburgh 195 4.3 3.9 4.8
Midlothian 105 4.1 3.5 4.6
West Lothian 142 4.8 4.2 5.3
HSCP name Weighted mean ft
Mean ft Lower 95% CL
Upper 95% CL
East Lothian 0.1 0.1 0.2
Edinburgh 0.2 0.1 0.2
Midlothian 0.2 0.1 0.2
West Lothian 0.2 0.1 0.3
The results are weighted by population SIMD 2012 categories, specific to each NHS Board. This is different to the SIMD 2012 used in the main report which used SIMD 2012 categories for Scotland as a whole. As such they are not directly comparable.
Information Services Division
47
A5 – Results for Health and Social Care Partnerships (HSCP); Detailed Inspection for Primary 1 children in 2016 cont.
Table A3.8. NHS Tayside: Health and Social Care Partnership results
HSCP name No. of children
Mean age
Mean Std dev Minimum Maximum
Angus 244 5.6 0.3 4.9 6.3
Dundee 294 5.6 0.3 4.9 6.5
Perth & Kinross 258 5.6 0.3 4.8 6.7
HSCP name Weighted % no obvious decay experience
% Lower 95% CL
Upper 95% CL
Angus 66.5 61.1 71.9
Dundee 64.9 60.0 69.7
Perth & Kinross 74.3 69.8 78.9
HSCP name Weighted mean d3mft
Mean d3mft Lower 95% CL
Upper 95% CL
Angus 1.3 1.0 1.6
Dundee 1.3 1.1 1.6
Perth & Kinross 0.9 0.7 1.1
HSCP name Weighted mean d3t
Mean dt Lower 95% CL
Upper 95% CL
Angus 0.8 0.6 1.0
Dundee 0.8 0.7 1.0
Perth & Kinross 0.6 0.5 0.8
HSCP name Weighted mean mt
Mean mt Lower 95% CL
Upper 95% CL
Angus 0.4 0.2 0.6
Dundee 0.3 0.2 0.4
Perth & Kinross 0.2 0.1 0.3
The results are weighted by population SIMD 2012 categories, specific to each NHS Board. This is different to the SIMD 2012 used in the main report which used SIMD 2012 categories for Scotland as a whole. As such they are not directly comparable.

Information Services Division
48
A5 – Results for Health and Social Care Partnerships (HSCP); Detailed Inspection for Primary 1 children in 2016 cont.
Table A3.8. NHS Tayside: Health and Social Care Partnership results continued
HSCP name Weighted mean ft
Mean ft Lower 95% CL
Upper 95% CL
Angus 0.1 0.1 0.2
Dundee 0.2 0.1 0.3
Perth & Kinross 0.1 0.1 0.2
HSCP name No. of children with
obvious decay
experience
Mean d3mft for children with obvious decay experience (d3mft >0)
Mean Lower 95% CL
Upper 95% CL
Angus 83 3.9 3.2 4.5
Dundee 104 3.8 3.2 4.3
Perth & Kinross 69 3.5 2.8 4.2
The results are weighted by population SIMD 2012 categories, specific to each NHS Board. This is different to the SIMD 2012 used in the main report which used SIMD 2012 categories for Scotland as a whole. As such they are not directly comparable.
Information Services Division
49
A6 – Basic Inspection results
What does the NDIP Basic Inspection consist of?
The Basic Inspection involves a simple assessment of the mouth of the child using a light, mirror and ball-ended probe. The dental status of each child is then categorised into three groups, depending on the level of dental health and treatment need observed, and parents/carers are advised of this by letter. The information in the letter explains the state of dental health observed in the mouth of the child at the time of the inspection.
The letter types are as follows:
Letter A - should seek immediate dental care on account of severe decay or abscess.
Letter B - should seek dental care in the near future due to history of tooth decay.
Letter C - no obvious decay experience but should continue to see the family dentist on a regular basis.
The results of the Basic Inspection are then anonymised and aggregated. They are used to monitor the impact of local and national NHS oral health improvement programmes and assist in the development of local dental services.
See Tables A4 and A5 overleaf.
Information Services Division
50
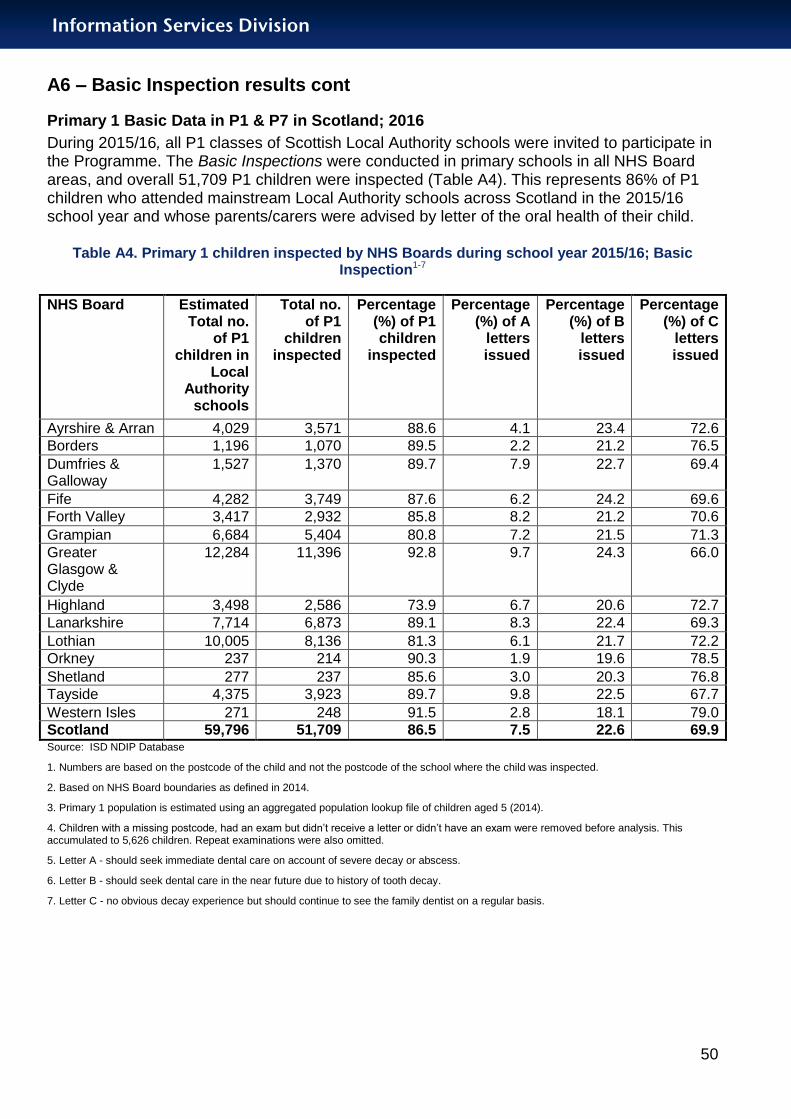
A6 – Basic Inspection results cont
Primary 1 Basic Data in P1 & P7 in Scotland; 2016
During 2015/16, all P1 classes of Scottish Local Authority schools were invited to participate in the Programme. The Basic Inspections were conducted in primary schools in all NHS Board areas, and overall 51,709 P1 children were inspected (Table A4). This represents 86% of P1 children who attended mainstream Local Authority schools across Scotland in the 2015/16 school year and whose parents/carers were advised by letter of the oral health of their child.
Table A4. Primary 1 children inspected by NHS Boards during school year 2015/16; Basic Inspection1-7
NHS Board Estimated Total no.
of P1 children in
Local Authority
schools
Total no. of P1
children inspected
Percentage (%) of P1 children
inspected
Percentage (%) of A
letters issued
Percentage (%) of B
letters issued
Percentage (%) of C
letters issued
Ayrshire & Arran 4,029 3,571 88.6 4.1 23.4 72.6
Borders 1,196 1,070 89.5 2.2 21.2 76.5
Dumfries & Galloway
1,527 1,370 89.7 7.9 22.7 69.4
Fife 4,282 3,749 87.6 6.2 24.2 69.6
Forth Valley 3,417 2,932 85.8 8.2 21.2 70.6
Grampian 6,684 5,404 80.8 7.2 21.5 71.3
Greater Glasgow & Clyde
12,284 11,396 92.8 9.7 24.3 66.0
Highland 3,498 2,586 73.9 6.7 20.6 72.7
Lanarkshire 7,714 6,873 89.1 8.3 22.4 69.3
Lothian 10,005 8,136 81.3 6.1 21.7 72.2
Orkney 237 214 90.3 1.9 19.6 78.5
Shetland 277 237 85.6 3.0 20.3 76.8
Tayside 4,375 3,923 89.7 9.8 22.5 67.7
Western Isles 271 248 91.5 2.8 18.1 79.0
Scotland 59,796 51,709 86.5 7.5 22.6 69.9 Source: ISD NDIP Database
1. Numbers are based on the postcode of the child and not the postcode of the school where the child was inspected.
2. Based on NHS Board boundaries as defined in 2014.
3. Primary 1 population is estimated using an aggregated population lookup file of children aged 5 (2014).
4. Children with a missing postcode, had an exam but didn’t receive a letter or didn’t have an exam were removed before analysis. This accumulated to 5,626 children. Repeat examinations were also omitted.
5. Letter A - should seek immediate dental care on account of severe decay or abscess.
6. Letter B - should seek dental care in the near future due to history of tooth decay.
7. Letter C - no obvious decay experience but should continue to see the family dentist on a regular basis.

Information Services Division
51
A6 – Basic Inspection results cont
Primary 7 Basic Data
In total, 47,303 P7 children received a Basic Inspection. This represents 90% of P7 children
attending mainstream Local Authority schools across Scotland (Table A5). As with P1
children, parents/carers of those P7 children who received a Basic Inspection were
advised by letter of the oral health of their child.
Table A5. Primary 7 children inspected by NHS Boards during school year 2015/16; Basic Inspection1-7
NHS Board Total no. of P7
children in Local
Authority schools
Total no. of P7
children inspected
Percentage (%) of P7 children
inspected
Percentage (%) of A
letters issued
Percentage (%) of B
letters issued
Percentage (%) of C
letters issued
Ayrshire & Arran 3,783 3,350 88.6 1.3 24.2 74.4
Borders 1,199 1,043 87.0 0.6 16.7 82.7
Dumfries & Galloway
1,397 1,389 99.4 3.2 34.1 62.8
Fife 3,645 3,471 95.2 1.7 32.0 66.3
Forth Valley 3,129 2,837 90.7 7.5 26.6 65.8
Grampian 5,575 4,713 84.5 0.9 46.3 52.8
Greater Glasgow & Clyde
10,785 10,193 94.5 2.4 30.4 67.2
Highland 3,323 2,939 88.4 1.5 23.5 75.1
Lanarkshire 7,038 6,637 94.3 2.4 30.9 66.7
Lothian 8,134 6,576 80.8 1.5 24.7 73.9
Orkney 221 185 83.7 0.0 16.8 83.2
Shetland 261 233 89.3 1.7 17.6 80.7
Tayside 4,032 3,509 87.0 1.6 31.1 67.3
Western Isles 262 228 87.0 0.9 16.7 82.5
Scotland 52,784 47,303 89.6 2.1 30.0 67.9 Source: ISD NDIP Database
1. Numbers are based on the postcode of the child and not the postcode of the school where the child was inspected.
2. Based on NHS Board boundaries as defined in 2014.
3. Primary 7 population is estimated using an aggregated population lookup file of children aged 12 (2014).
4. Children with a missing postcode, had an exam but didn’t receive a letter or didn’t have an exam were removed before analysis. This accumulated to 5,156 children. Repeat examinations were also omitted.
5. Letter A - should seek immediate dental care on account of severe decay or abscess.
6. Letter B - should seek dental care in the near future due to history of tooth decay.
7. Letter C - no obvious decay experience but should continue to see the family dentist on a regular basis.

Information Services Division
52
A7 – Authors
This report, which is published by ISD Scotland on behalf of the Scottish Dental Epidemiology Co-ordinating Committee, has been prepared by the NDIP Report Writing Group, whose membership is as follows:
L M D Macpherson (Glasgow Dental School, University of Glasgow and NHS Greater Glasgow and Clyde)
D I Conway (Glasgow Dental School, University of Glasgow and Information Services Division, NHS National Services Scotland)
A D McMahon (Glasgow Dental School, University of Glasgow and Information Services Division, NHS National Services Scotland)
M McStravick (Information Services Division, NHS National Services Scotland)
E J O’Keefe (NHS Fife)
J Rodgers (NHS Forth Valley)
C S Thomson (Information Services Division, NHS National Services Scotland)
S Whipp (Information Services Division, NHS National Services Scotland)
Information Services Division
53
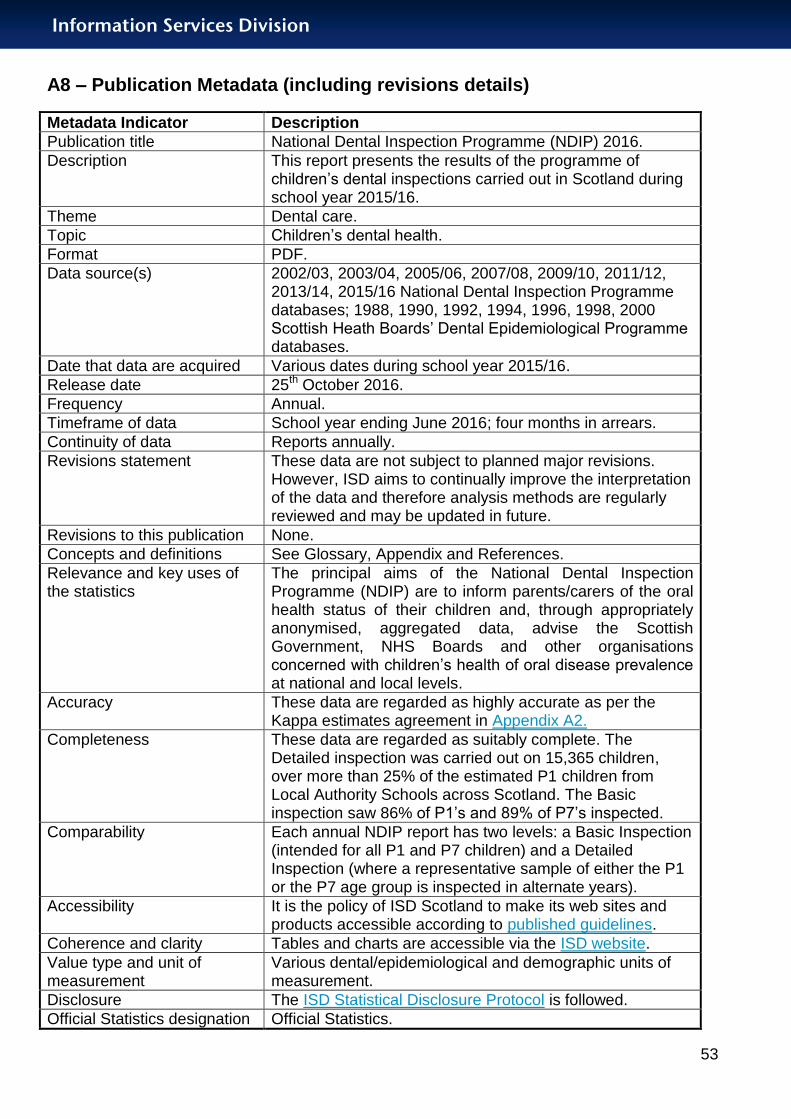
A8 – Publication Metadata (including revisions details)
Metadata Indicator Description
Publication title National Dental Inspection Programme (NDIP) 2016.
Description This report presents the results of the programme of children’s dental inspections carried out in Scotland during school year 2015/16.
Theme Dental care.
Topic Children’s dental health.
Format PDF.
Data source(s) 2002/03, 2003/04, 2005/06, 2007/08, 2009/10, 2011/12, 2013/14, 2015/16 National Dental Inspection Programme databases; 1988, 1990, 1992, 1994, 1996, 1998, 2000 Scottish Heath Boards’ Dental Epidemiological Programme databases.
Date that data are acquired Various dates during school year 2015/16.
Release date 25th October 2016.
Frequency Annual.
Timeframe of data School year ending June 2016; four months in arrears.
Continuity of data Reports annually.
Revisions statement These data are not subject to planned major revisions. However, ISD aims to continually improve the interpretation of the data and therefore analysis methods are regularly reviewed and may be updated in future.
Revisions to this publication None.
Concepts and definitions See Glossary, Appendix and References.
Relevance and key uses of the statistics
The principal aims of the National Dental Inspection Programme (NDIP) are to inform parents/carers of the oral health status of their children and, through appropriately anonymised, aggregated data, advise the Scottish Government, NHS Boards and other organisations concerned with children’s health of oral disease prevalence at national and local levels.
Accuracy These data are regarded as highly accurate as per the Kappa estimates agreement in Appendix A2.
Completeness These data are regarded as suitably complete. The Detailed inspection was carried out on 15,365 children, over more than 25% of the estimated P1 children from Local Authority Schools across Scotland. The Basic inspection saw 86% of P1’s and 89% of P7’s inspected.
Comparability Each annual NDIP report has two levels: a Basic Inspection (intended for all P1 and P7 children) and a Detailed Inspection (where a representative sample of either the P1 or the P7 age group is inspected in alternate years).
Accessibility It is the policy of ISD Scotland to make its web sites and products accessible according to published guidelines.
Coherence and clarity Tables and charts are accessible via the ISD website.
Value type and unit of measurement
Various dental/epidemiological and demographic units of measurement.
Disclosure The ISD Statistical Disclosure Protocol is followed.
Official Statistics designation Official Statistics.

Information Services Division
54
UK Statistics Authority Assessment
Not assessed at this time.
Last published 28th October 2014 (2015 report covered Primary 7 children).
Next published 30th October 2018 (2017 report will cover Primary 7 children)
Date of first publication 31st December 2003 (revised 3rd March 2008).
Help email [email protected]
Date form completed 01/09/2016
Information Services Division
55
A9 – Early Access details (including Pre-Release Access)
Pre-Release Access
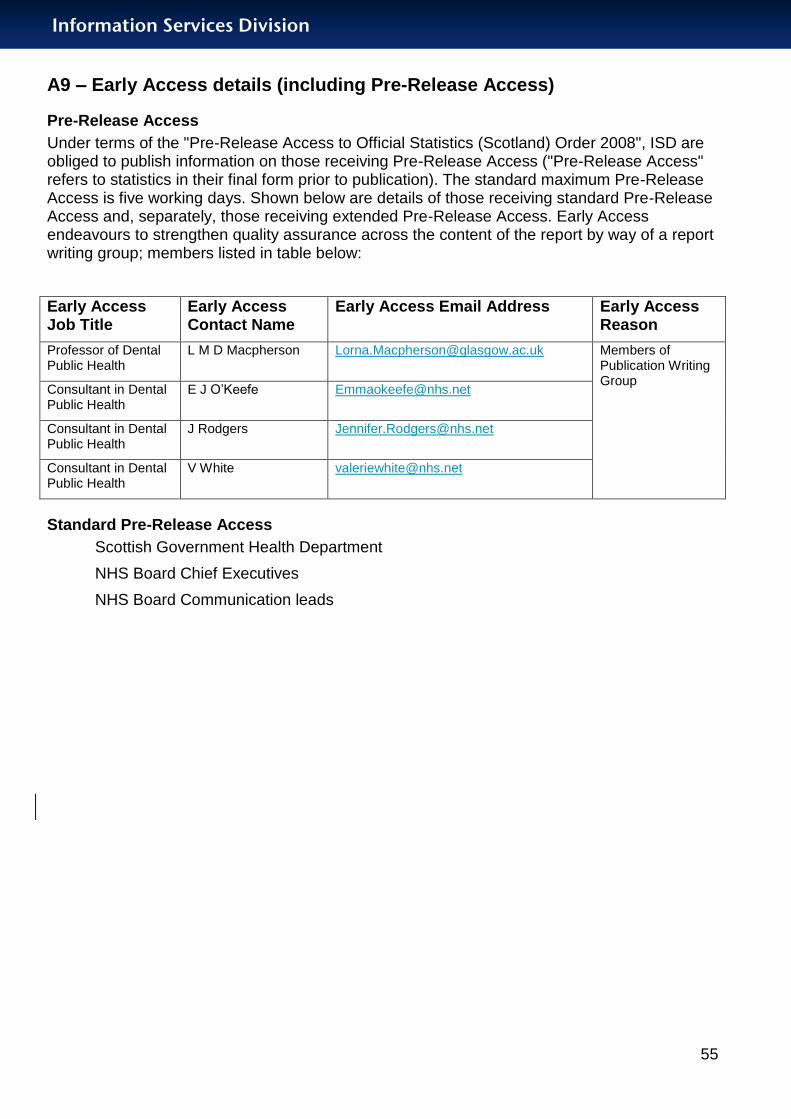
Under terms of the "Pre-Release Access to Official Statistics (Scotland) Order 2008", ISD are obliged to publish information on those receiving Pre-Release Access ("Pre-Release Access" refers to statistics in their final form prior to publication). The standard maximum Pre-Release Access is five working days. Shown below are details of those receiving standard Pre-Release Access and, separately, those receiving extended Pre-Release Access. Early Access endeavours to strengthen quality assurance across the content of the report by way of a report writing group; members listed in table below:
Early Access Job Title
Early Access Contact Name
Early Access Email Address Early Access Reason
Professor of Dental Public Health
L M D Macpherson [email protected] Members of Publication Writing Group
Consultant in Dental Public Health
E J O’Keefe [email protected]
Consultant in Dental Public Health
J Rodgers [email protected]
Consultant in Dental Public Health
V White [email protected]
Standard Pre-Release Access
Scottish Government Health Department
NHS Board Chief Executives
NHS Board Communication leads
Information Services Division
56
A10 – ISD and Official Statistics
About ISD
Scotland has some of the best health service data in the world combining high quality, consistency, national coverage and the ability to link data to allow patient based analysis and follow up.
Information Services Division (ISD) is a business operating unit of NHS National Services Scotland and has been in existence for over 40 years. We are an essential support service to NHSScotland and the Scottish Government and others, responsive to the needs of NHSScotland as the delivery of health and social care evolves.
Purpose: To deliver effective national and specialist intelligence services to improve the health and wellbeing of people in Scotland.
Mission: Better Information, Better Decisions, Better Health
Vision: To be a valued partner in improving health and wellbeing in Scotland by providing a world class intelligence service.
Official Statistics
Information Services Division (ISD) is the principal and authoritative source of statistics on health and care services in Scotland. ISD is designated by legislation as a producer of ‘Official Statistics’. Our official statistics publications are produced to a high professional standard and comply with the Code of Practice for Official Statistics. The Code of Practice is produced and monitored by the UK Statistics Authority which is independent of Government. Under the Code of Practice, the format, content and timing of statistics publications are the responsibility of professional staff working within ISD.
ISD’s statistical publications are currently classified as one of the following:
National Statistics (ie assessed by the UK Statistics Authority as complying with the Code of Practice)
National Statistics (ie legacy, still to be assessed by the UK Statistics Authority)
Official Statistics (ie still to be assessed by the UK Statistics Authority)
other (not Official Statistics)
Further information on ISD’s statistics, including compliance with the Code of Practice for Official Statistics, and on the UK Statistics Authority, is available on the ISD website.
The United Kingdom Statistics Authority has designated these statistics as National Statistics, in accordance with the Statistics and Registration Service Act 2007 and signifying compliance with the Code of Practice for Official Statistics. Designation can be broadly interpreted to mean that the statistics:
meet identified user needs;
are well explained and readily accessible;
are produced according to sound methods, and
are managed impartially and objectively in the public interest.
Once statistics have been designated as National Statistics it is a statutory requirement that the Code of Practice shall continue to be observed.