National Consumer Agency Consumer Empowerment and Complaints Market Research Findings January 2010...
21
National Consumer Agency Consumer Empowerment and Complaints Market Research Findings January 2010 Research Conducted by
-
date post
18-Dec-2015 -
Category
Documents
-
view
221 -
download
3
Transcript of National Consumer Agency Consumer Empowerment and Complaints Market Research Findings January 2010...

National Consumer Agency
Consumer Empowerment and Complaints Market Research Findings
January 2010Research Conducted by

2
Making Complaints
Profile of Sample
KEY FINDINGS:
SECTION 1: Consumer Empowerment SECTION 2: Making Complaints
Table of Contents

3
Making Complaints
21
44 40
23
52
18
35
8
19
1119
47
10
53
SEX AGEMARITALSTATUS
SOCIALCLASS
Profile of Sample – I
(Base: All aged 15-74 – 1,000)
Male
Female
% %
% %
15-24
25-34
35-44
45-54
55+
Married
Living as Married
Single
Wid/Div/Sep
ABC1
C2DE
F50+/F50-
MAIN GROCERY SHOPPER
Yes No47%53%

4
Making Complaints
7
513723
55
21
20
8
24
1825
21
1179
SEX AGEMARITALSTATUS
SOCIALCLASS
Profile of Sample – II – Main Grocery Shoppers
(Base: All Mainly Responsible for Grocery Shopping in Home – 525)
Male(47)
Female(53)
% %
% %
15-24(21)
25-34(23)
35-44(18)
45-54(19)
55+(19)
Married(44)
Living as Married(10)
Single(35)
Wid/Div/Sep(11)
ABC1(40)
C2DE(52)
53%
( ) = Total Sample
F50+/F50-(8)

5
Making Complaints46%54%69%31%
Profile of Sample – III – Internet Use
(Base: All Respondents – 1,000)
USE INTERNET
No Yes
EVER PURCHASED ONLINE
No Yes
BANKING ONLINE
No Yes
(Base: All Internet Users - 702) (Base: All Internet Users - 702)
70%30%
() = figures from Wave 3 2009 (May /June 2009)
(65%)
(35%)(49%)(51%)(29%)
(71%)
71
69
91
83
79
63
30
Male
Female
15-24
25-34
35-44
45-54
55+
% Yes
68
69
56
78
77
64
68
Male
Female
15-24
25-34
35-44
45-54
55+
% Yes45
47
26
56
54
53
49
Male
Female
15-24
25-34
35-44
45-54
55+
% Yes
6
Making Complaints
Section 1:Consumer Empowerment
7
Making Complaints
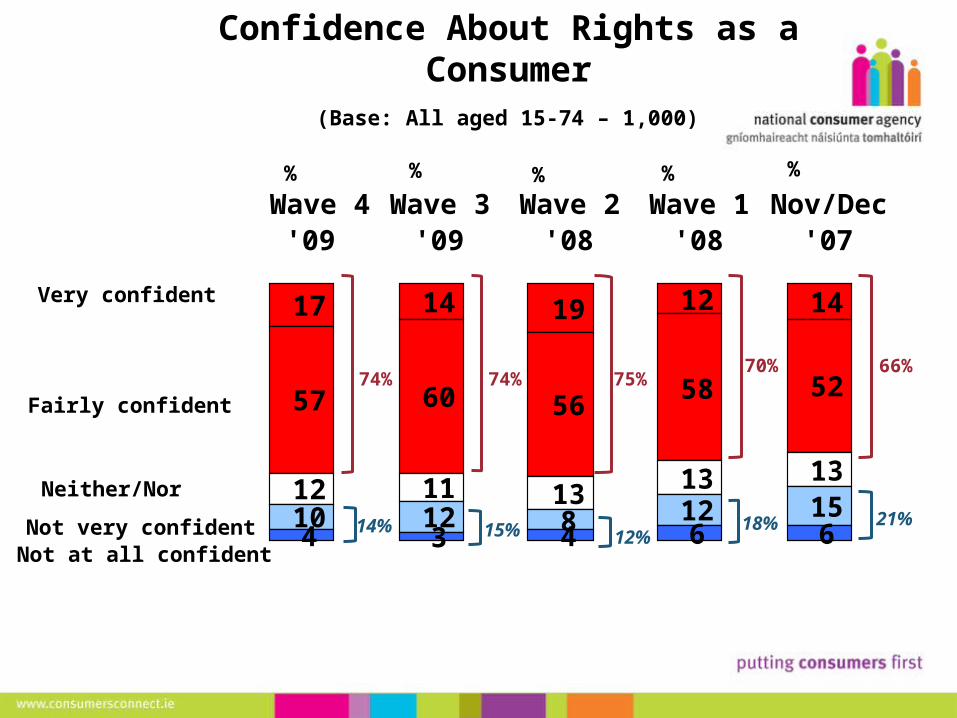
17 14 19 12 14
57 60 5658 52
12 11 13 13 13
12 8 12 154 3 4 6 610
Wave 4'09
Wave 3'09
Wave 2'08
Wave 1'08
Nov/Dec'07
Confidence About Rights as a Consumer
(Base: All aged 15-74 – 1,000)
%
Very confident
Fairly confident
Neither/Nor
Not very confidentNot at all confident
21%
%
18%
70% 66%
%
75%
12%
%
14%
74%
%
15%
74%

8
Making Complaints13 13 16 10 13
54 55 5352 46
13 12 1614 15
15 1116 19
5 5 4 8 715
Wave 4'09
Wave 3'09
Wave 2'08
Wave 1'08
Nov/Dec'07
Knowledge About Consumer Rights
(Base: All aged 15-74 – 1,000)
Very knowledgeable
Fairly knowledgeable
Neither/Nor
Not very knowledgeable
Not at all knowledgeable
%
26%
%
24%
62% 59%
%
69%
15%
%
20%
67%
%
20%
68%

9
Making Complaints
Protected Regarding Consumer Rights
(Base: All aged 15-74 – 1,000)
Very protected
Fairly protected
Neither/Nor
Not very protected
Not at all protected
12 10 15 9 10
53 55 5551 51
21 19 2023 23
13 8 14 123 3 2 4 411
Wave 4'09
Wave 3'09
Wave 2'08
Wave 1'08
Nov/Dec'07
%
16%
%
18%
60% 61%
%
70%
10%
%
14%
65%
%
16%
65%

10
Making Complaints
Summary: Empowerment Levels
(Base: All aged 15-74 – 1,000)
Confident74%
Not Confident14%
Knowledgeable67%
Not Knowledgeable
20%
Protected65%
Not Protected
14%
Male 69% 16% 65% 20% 63% 14%
Female 77% 14% 69% 20% 68% 14%
15-24 62% 19% 57% 26% 60% 14%
25-34 74% 14% 69% 20% 64% 16%
35-44 79% 11% 75% 11% 74% 8%
45-54 79% 14% 73% 18% 67% 15%
55+ 73% 15% 63% 23% 63% 16%
ABC1 83% 9% 75% 13% 73% 10%
C2DE 67% 19% 61% 25% 59% 17%
Responsible for main shop
79% 13% 71% 19% 67% 14%
Not responsible
for main shop
67% 17% 63% 21% 64% 13%
= Significantly lower than total sample = Significantly higher than total sample

11
Making Complaints
Section 2:Making Complaints

12
Making Complaints22%
78%
Propensity To Complain
No Yes
As a consumer would you be prepared to complain if a problem had occurred or you are dissatisfied with a good
or service you have purchased?
As a consumer would you be prepared to complain if a problem had occurred or you are dissatisfied with a good
or service you have purchased?
(Base: All aged 15-74 – 1,000)
(24%)(76%)
( ) = Wave 3 2009

13
Making Complaints
(Base: All aged 15-74 – 1,000)
Supermarkets and newsagentsShops selling clothing or footwearRestaurants take-away’s or hotelsCommunications services including home phone
% With Reason to Complain or Return Ever
TV Service Providers e.g. Sky, NTL
Building and related services e.g. plumbersShops selling furniture or household appliancesBanking products and services, including a current A/C
Pubs
Airlines
Car dealers
Insurance products and services
Energy suppliers e.g. ESB, Bord Gais
PRIMARY SECONDARY17
13
15
9
7
8
10
6
6
6
5
7
4
(-5%)
Wave 4 2009Wave 3 2009Wave 2 2008Wave 1 2008
Goods & Services Bought with Reason to Complain or Return an Item – Primary & Secondary
15
Making Complaints
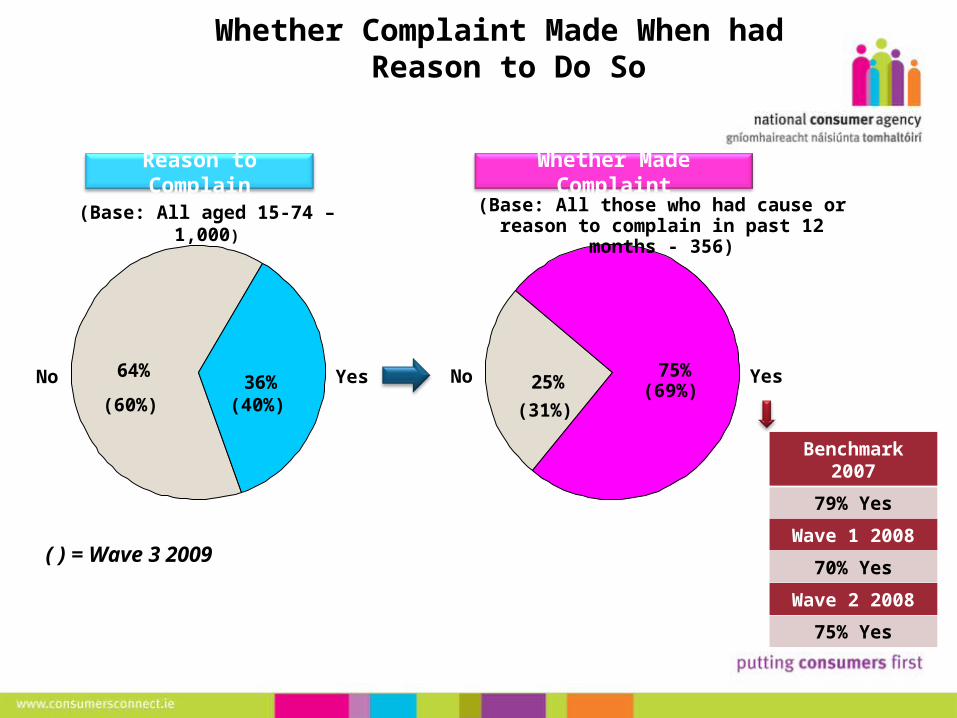
Whether Complaint Made When had Reason to Do So
25%75%No Yes
Whether Made Complaint
Benchmark 2007
79% Yes
Wave 1 2008
70% Yes
Wave 2 2008
75% Yes
64%36%No Yes
Reason to Complain
(60%) (40%) (31%)(69%)
(Base: All aged 15-74 – 1,000) (Base: All those who had cause or reason to complain in past 12 months - 356)
( ) = Wave 3 2009

16
Making Complaints
Reasons for Complaint
(Base: All those who made a complaint in past 12 months - 267)
54
17
9
8
5
1
18
Faulty product/service
Product/service didn’t do what it said it would do
Wrong size/colour/specificationProduct/service did not confer benefits described to me by salespersonChanged mind/wanted to return the item
Unwanted gift
Other
64
20
10
13
8
2
11
Wave 1 2008
56
14
9
9
8
1
14
Wave 2 2008 Benchmark 2007
59
17
4
9
5
1
19
Wave 3 2009
59
20
9
7
6
1
11
Wave 4 2009
17
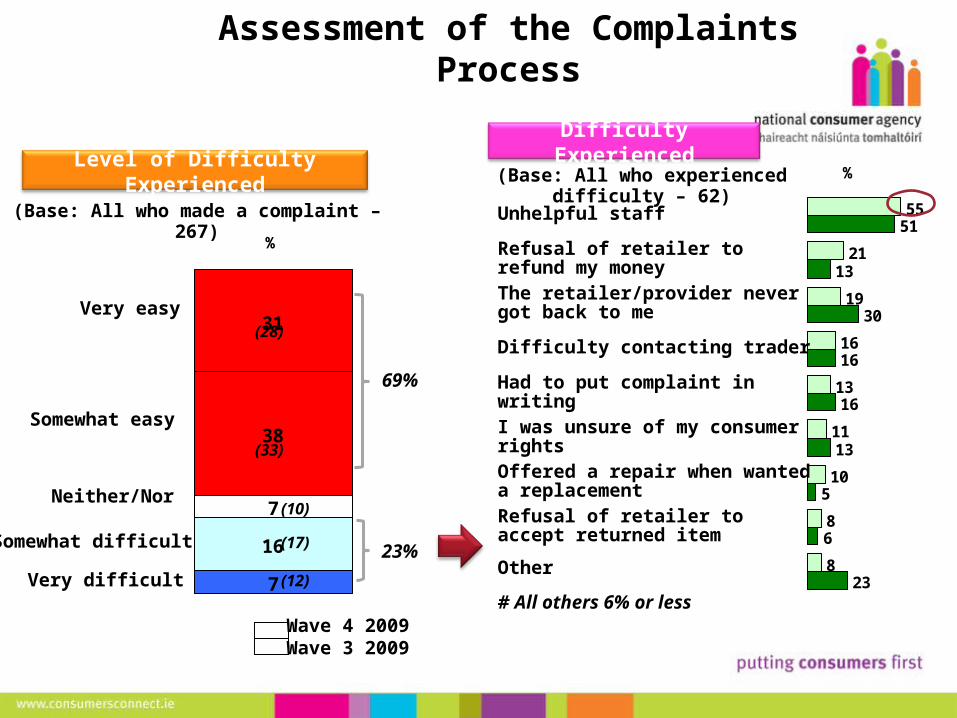
Making Complaints31
38
7
7
16
Assessment of the Complaints Process
(Base: All who made a complaint – 267)
%
Very easy
Somewhat easy
Neither/Nor
Somewhat difficult
Very difficult
69%
23%
55
21
19
16
13
11
10
8
8
51
13
30
16
16
13
5
6
23
Unhelpful staff
Refusal of retailer to refund my moneyThe retailer/provider never got back to me
Difficulty contacting trader
Had to put complaint in writing
I was unsure of my consumer rightsOffered a repair when wanted a replacementRefusal of retailer to accept returned item
Other
# All others 6% or less
%Level of Difficulty ExperiencedDifficulty Experienced
(Base: All who experienced difficulty – 62)
Wave 4 2009Wave 3 2009
(28)
(33)
(10)
(17)
(12)

18
Making Complaints
Helping to Offer Better Customer Service
(Base: All aged 15-74 – 1,000)
58
34
33
29
26
Staff trained in customer service and complaints handling
A publicly displayed complaint handling procedure
A named point of contact for complaints
Informed of the returns policy at point of purchase by sales assistant
A publicly displayed returns policy
%
New question, multiple answers allowed
19
Making Complaints
49
22
19
11
10
4
6
38
19
18
15
10
9
14
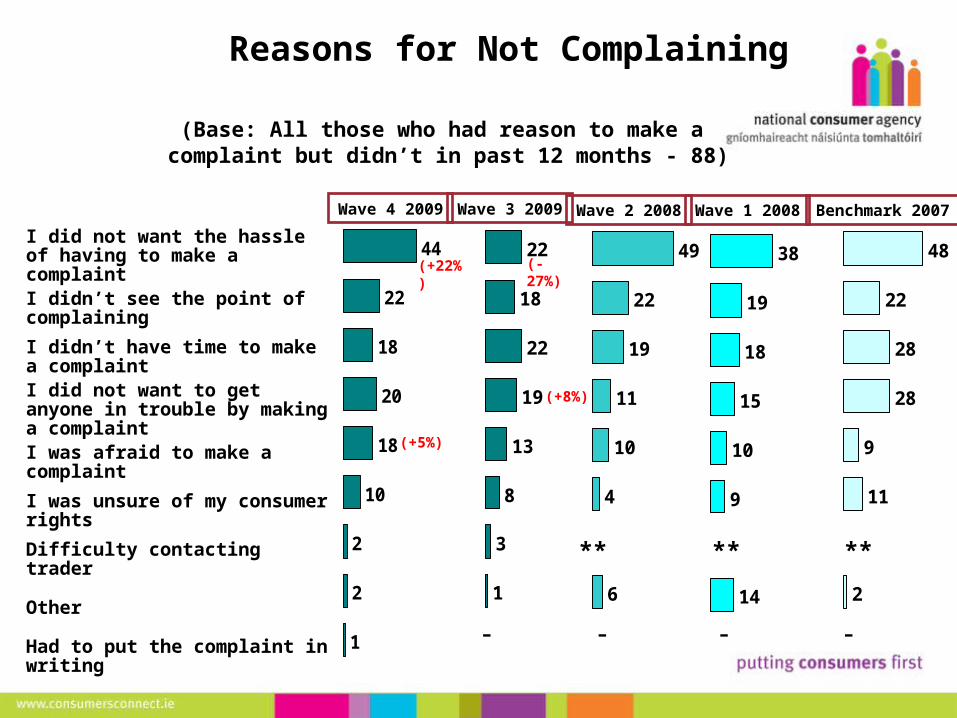
Reasons for Not Complaining
(Base: All those who had reason to make a complaint but didn’t in past 12 months - 88)
I did not want the hassle of having to make a complaint
I didn’t see the point of complaining
I didn’t have time to make a complaint
I did not want to get anyone in trouble by making a complaint
I was afraid to make a complaint
I was unsure of my consumer rights
Difficulty contacting trader
Other
Had to put the complaint in writing
Benchmark 2007Wave 1 2008
48
22
28
28
9
11
2
Wave 2 2008
22
18
22
19
13
8
3
1
Wave 3 2009
** ** **
(+8%)
(-27%)44
22
18
20
18
10
2
2
1
Wave 4 2009
(+5%)
(+22%)
– – – –
20
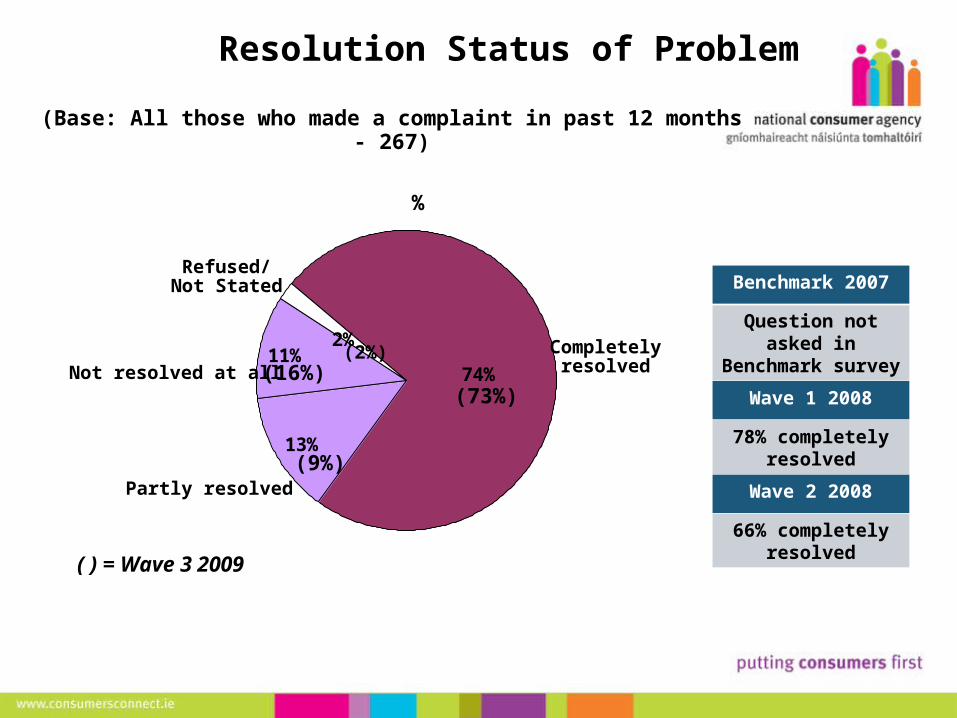
Making Complaints74%
2%11%
13%
Resolution Status of Problem
(Base: All those who made a complaint in past 12 months - 267)
%
Benchmark 2007
Question not asked in Benchmark
survey
Wave 1 2008
78% completely resolved
Wave 2 2008
66% completely resolved
Completelyresolved
Partly resolved
Not resolved at all
Refused/Not Stated
(2%)
(73%)
(9%)
(16%)
( ) = Wave 3 2009

21
Making Complaints46
27
18
3114
Satisfaction with the Way Complaint was Handled
(Base: All who’s complaint was completely resolved – 198)
%
Completely satisfied
73%
42
37
22
35
38
17
Do nothing, just accept what has happenedTell people you know of your positive experience with themDo more business with them yourself
%
Level of Satisfaction
Very satisfied
Fairly satisfied
Neither/nor/Don’t know
Likely to do as a result
145 People
(39)
(30)
(18)(5)(3)(3)(2)
Wave 4 2009Wave 3 2009

22
Making Complaints
Likelihood of Buying Again from Business that had Reason to Complain About
26%
44%
21%9%
NoYes
I don’t havea choice
(Base: All those who had reason to make a complaint but didn't in the past 12 months - 88)
Benchmark 2007
52% Yes27% No16% I don’t have a choice
Wave 1 2008
59% Yes29% No12% I don’t have a choice
Wave 2 2008
64% Yes29% No7% I don’t have a choice
(28%)
(22%)(5%)
(45%)
Don’t know
( ) = Wave 3 2009