Economics at the FTC: Fertilizer, Consumer Complaints, and ...
31
Vol.:(0123456789) Review of Industrial Organization (2020) 57:751–781 https://doi.org/10.1007/s11151-020-09792-w 1 3 Economics at the FTC: Fertilizer, Consumer Complaints, and Private Label Cereal Andrew Sweeting 1 · David J. Balan 1 · Nicholas Kreisle 1 · Matthew T. Panhans 1 · Devesh Raval 1 Accepted: 6 October 2020 / Published online: 5 November 2020 © This is a U.S. Government work and not under copyright protection in the US; foreign copyright protection may apply 2020 Abstract Staf in the FTC’s Bureau of Economics perform economic analyses to support the Commission’s missions to protect consumers and maintain competition. Staf con- tributions include both original economic research and theoretical and empirical analysis in specifc matters where the Commission has to decide whether to take enforcement actions. This article describes: retrospective research of a consum- mated merger in the fertilizer industry; a novel analysis of the government’s con- sumer complaint data to understand how frauds afect diferent demographic groups; and casework that supported a decision to challenge a merger of private label ready- to-eat cereal manufacturers. Keywords Antitrust · Consumer protection · Efciencies · Fraud · Merger retrospectives · Merger simulations • Andrew Sweeting [email protected] • David J. Balan [email protected] • Nicholas Kreisle [email protected] • Matthew T. Panhans [email protected] • Devesh Raval [email protected] Federal Trade Commission, Bureau of Economics, 600 Pennsylvania Ave., N.W, Washington, DC 20580, USA 1
Transcript of Economics at the FTC: Fertilizer, Consumer Complaints, and ...

Vol.:(0123456789)
Review of Industrial Organization (2020) 57:751–781 https://doi.org/10.1007/s11151-020-09792-w
1 3
Economics at the FTC: Fertilizer, Consumer Complaints, and Private Label Cereal
Andrew Sweeting1 · David J. Balan1 · Nicholas Kreisle1 · Matthew T. Panhans1 · Devesh Raval1
Accepted: 6 October 2020 / Published online: 5 November 2020 © This is a U.S. Government work and not under copyright protection in the US; foreign copyright protection may apply 2020
Abstract Staf in the FTC’s Bureau of Economics perform economic analyses to support the Commission’s missions to protect consumers and maintain competition. Staf con-tributions include both original economic research and theoretical and empirical analysis in specifc matters where the Commission has to decide whether to take enforcement actions. This article describes: retrospective research of a consum-mated merger in the fertilizer industry; a novel analysis of the government’s con-sumer complaint data to understand how frauds afect diferent demographic groups; and casework that supported a decision to challenge a merger of private label ready-to-eat cereal manufacturers.
Keywords Antitrust · Consumer protection · Efciencies · Fraud · Merger retrospectives · Merger simulations
• Andrew Sweeting [email protected]
• David J. Balan [email protected]
• Nicholas Kreisle [email protected]
• Matthew T. Panhans [email protected]
• Devesh Raval [email protected]
Federal Trade Commission, Bureau of Economics, 600 Pennsylvania Ave., N.W, Washington, DC 20580, USA
1

752 A. Sweeting et al.
1 3
1 Introduction
The staf of the Federal Trade Commission’s Bureau of Economics (BE) is made up of just over 100 full-time employees. It is currently composed of 83 Ph.D. econ-omists, with 7 new hires joining in 2020, 13 research analysts and statisticians, 6 administrative professionals, and 4 fnancial analysts. While this article focuses on the output of economists within BE, that work benefts from contributions of the entire BE staf, as well as the cooperation of many attorneys and paralegals in the FTC’s Bureau of Competition and Bureau of Consumer Protection.
BE economists provide economic analysis in support of the FTC’s dual competi-tion and consumer protection missions. Most of the staf’s time is spent on casework for particular matters that may come before the Commission. On the competition side, most matters involve proposed horizontal or vertical mergers, where BE’s anal-ysis can be critical in determining whether the proposed merger is likely to harm consumers. FTC merger enforcement is particularly active in healthcare (hospital, pharmaceutical and medical devices), and in the oil and gas, chemical, manufactur-ing and retail sectors. In 2019, the FTC entered into consent orders for eight mergers and fled suit in four, while merging parties abandoned eight proposed transactions that were investigated by the FTC staf. This article discusses some of the models that BE used to assess the proposed merger between private-label (PL) ready-to-eat (RTE) cereal manufacturers—Post and TreeHouse—which was one of the deals that was abandoned when challenged by the Commission.
Consumer protection matters cover a wide-range of cases where frms may be engaging in unfair or deceptive—and sometimes simply fraudulent—practices that harm consumers. These range from cases of identity theft and imposter scams, to deceptive advertising and unfair data-security practices. BE economists provide independent analyses of virtually all consumer protection matters before the Com-mission; work side-by-side with legal staf on investigations, reports, and work-shops; serve as expert witnesses, and conduct original economic research on a range of consumer protection questions, including development of original theoretical eco-nomic models to improve understanding of consumer protection problems, applica-tions of existing economic and marketing literature to policy questions, and original empirical analysis. The Commission fled actions in 76 consumer protection mat-ters and obtained orders in 126 cases in 2019; and, amongst many other matters, the Commission is currently engaged in protecting consumers from COVID-related
1scams. BE also helps to shape Commission enforcement actions by conducting theoreti-
cal and empirical economic research projects on topics that are connected to pol-icy. This article discusses two examples: The frst is a retrospective analysis of a fertilizer manufacturer merger that the Commission investigated in 2016 and 2017. Since Barton and Sherman’s (1984) study of two consummated mergers in the U.S. microflm industry, BE staf have published over 30 retrospectives on consummated
See FTC Annual Highlights 2019, Stats & Data at https://www.ftc.gov/reports/annual-highlights-2019/ stats-and-data. 1

753
1 3
Economics at the FTC: Fertilizer, Consumer Complaints, and…
mergers. These studies provide insights into whether the tools that enforcement agencies worldwide use to evaluate mergers—including the type of tools used in the RTE cereals case—are efective. The second project consists of a set of stud-ies (Raval 2020a, b, c) that link the ZIP codes reported in the government’s cus-tomer complaints databases, and datasets on victims from several fraud cases that were prosecuted by the Commission, to local demographics. This work shows that residents of areas with higher numbers of Black and Latino residents are much less likely to report being victims of fraud even though they may be just as likely or more likely to be victims. This diference matters, because BE staf frequently use the complaints database as a source of information that can guide assessments of likely consumer harm.
Additionally, BE economists interact with broader policy and academic research communities by participating in and hosting conferences and workshops. For instance, FTC economists recently participated in a Consumer Financial Protection Bureau (CFPB) workshop on behavioral economics2 and organized an FTC hearing on merger retrospectives.3 In November 2019, BE welcomed a new co-host for the twelfth FTC Microeconomics Conference: the Tobin Center for Economic Policy at Yale.4 A wide range of topics—including deception and collusion—were discussed in paper sessions, panel discussions, and keynote addresses. The next FTC Micro-economics Conference, again co-sponsored by the Tobin Center, is to be held online on November 5–6, 2020.5
Section 2 describes a retrospective analysis of the $36 billion merger of Agrium and PotashCorp, which formed the world’s largest crop nutrient company. The study uses publicly available data to examine what happened to the price of potash, a vital source of potassium for farmers, in the U.S. Corn Belt—compared to potash prices in other countries and domestic prices of other fertilizers. Section 3 describes the consumer complaints research that was discussed above—one of the products of which is an approach to weighting complaint data so that it is likely to refect more accurately victimization rates. Section 4 discusses the economic analysis of the PL RTE cereal manufacturers, and, in particular, describes how staf used a range of alternative models to calculate estimates of the efects of eliminating competition between the two companies in order to understand the range of possible outcomes that could be compared to creditable efciencies.
2 See https://www.consumerfnance.gov/about-us/events/archive-past-events/cfpb-symposium-behavioral-economics/. 3 A print transcript as well as a video recording are available at https://www.ftc.gov/news-events/event s-calendar/ftc-hearing-14-merger-retrospectives. 4 The conference website is located at https://www.ftc.gov/news-events/events-calendar/twelfth-annual-federal-trade-commission-microeconomics-conference. 5 Details are available at: https://www.ftc.gov/news-events/events-calendar/thirteenth-annual-federal-trade-commission-microeconomics-conference.

754 A. Sweeting et al.
1 3
2 Retrospective Analysis of Price Efects from an Agricultural Fertilizer Merger
A Background
This section presents the key fndings of a retrospective study of two North American crop nutrient fertilizer manufacturers (Kreisle, 2020), which is of particu-lar interest because some observers have raised concerns about rising concentration in fertilizer production possibly leading to higher input prices for farmers and higher food prices for consumers.6 Focusing on agriculture also broadens the scope of the merger retrospective literature, which tends to study retail, health care, petroleum, and formerly regulated industries, where data are more readily available. USDA esti-mates that agriculture and related industries accounted for 5.4 percent of U.S. gross domestic product in 2017, and 11 percent of employment.7
Three primary nutrients—nitrogen, phosphate, and potassium (potash)—are used to make agricultural fertilizer. While each nutrient requires a diferent production process, several manufacturers produce all three. When Agrium and PotashCorp announced a $36 billion merger to form the world’s largest crop nutrient company in September 2016, some industry observers expected antitrust authorities to focus their regulatory review on potash, as the companies controlled 60 percent of North American potash capacity, compared to roughly 30 percent for nitrogen and phos-phate.8 A key question in the investigation was whether potash competition took place in a global market—as claimed by the merging frms9—or whether competi-tion was more regional.
After negotiating settlements with antitrust authorities in multiple countries, the companies completed the merger on January 2, 2018, and renamed the frm Nutrien.10 The U.S. Federal Trade Commission required divestitures of a nitrogen plant and a phosphate facility.11 Competition authorities in China and India required PotashCorp to divest minority holdings in other potash businesses that were based in Jordan, Israel, and Chile.12 However, the merged frm retained all of its North American potash assets.
6 See, for example, Fuglie et al. (2012) from the Economic Research Service of the U.S. Department of Agriculture and Shields (2010) from the Congressional Research Service. However, note also that a Government Accountability Ofce (2009) analysis found that “Based on our review, empirical economic literature has not established that concentration has adversely afected commodity or food prices in these agricultural sectors.”7 See https://www.ers.usda.gov/data-products/ag-and-food-statistics-charting-the-essentials/ag-and-food-sectors-and-the-economy/. 8 Reuters, “Potash Corp, Agrium talk merger; competition scrutiny expected.” August 30, 2016. 9 See https://www.compasslexecon.com/cases/compass-lexecon-assists-in-obtaining-regulatory-approval-for-36-billion-merger/. 10 Nutrien, Ltd. Press Release, “Agrium and PotashCorp Merger Completed Forming Nutrien, a Leader in Global Agriculture.”11 Federal Trade Commission, “FTC Requires Canadian Fertilizer and Chemical Companies PotashCorp and Agrium to Divest 2 Production Facilities as Condition of Merger.”12 Agrium press releases on October 18, 2017 and November 7, 2017. PotashCorp also had a minority investment in a Chinese potash subsidiary, which it was required to convert to a passive stake.

755
1 3
Economics at the FTC: Fertilizer, Consumer Complaints, and…
In light of the merged frm’s large combined share of North American potash capacity, this study analyzes the efect of the Agrium/PotashCorp merger on pot-ash prices in the “Corn Belt” region of the United States. Using a diference-in-dif-ferences approach, with a variety of control markets, the results suggest that North American potash prices did not increase after the merger. While this fnding is con-sistent with the merger’s having no anticompetitive impact, the study notes possible confounding factors such as contemporaneous capacity additions as well as develop-ments in international trade policy.
Diference-in-diferences requires identifcation of one or more control markets that experience similar demand and cost shocks. Our frst comparison is between North American potash prices and prices in Brazil: the world’s largest potash import market. As the geographic market for potash may be broader than North America, we also use the price of a diferent grade of potash sold in Southeast Asia, where it is utilized more heavily than in North America, as an alternative control. Finally, we turn to the other two primary crop nutrients—nitrogen and phosphorus—as potential controls. A drawback is that the production process, particularly for nitrogen, difers for these nutrients to a larger degree than is the case for other grades of potash. However, as these nutrients are complements, demand for any one of them derives from overall demand for agricultural commodities. Therefore, demand is highly cor-related across nutrients.
All growing plants require relatively large amounts of nitrogen, phosphorus, and potassium. These three “macronutrients” are just as necessary as water, sunlight, and carbon dioxide. Diferent soils naturally contain diferent levels of each nutrient, and diferent crops absorb them in varying proportions. The manner in which a crop is harvested also afects the need to replenish nutrients in the soil.
The term potash refers to a variety of minerals containing potassium. The most common use for potash is as an agricultural fertilizer, usually as potassium chloride (KCl). Potash fertilizer is commonly sold as muriate of potash, or MOP, which con-tains at least 95 percent KCl.
Two-thirds of global potash reserves lie in evaporated sea beds in Canada, Russia, and Belarus.13 Mines extract potash ore from underground. The ore is then refned into standard-grade product or a higher-quality granular product. While plant growth is afected only by the overall potassium content, which is common across standard and granular MOP, the more even sizing of granular MOP allows for more accurate placement by farmers with the right equipment. As a result, granular MOP is rela-tively more popular in higher-income regions (North America, Europe, and Brazil), while standard MOP is the product of choice in China, India, and Southeast Asia.
Table 1 displays approximate global potash mine capacities at the time of the Agrium/PotashCorp merger. The major North American producers were Agrium, PotashCorp, and Mosaic, with most of their mines in Saskatchewan. In June 2017, K+S, a German potash producer, commenced production at a new 2.0 Mt/y (mil-lion metric tons per year) mine in Saskatchewan. K +S had spent fve years and over
Potash can also be harvested from the brines in certain saltwater bodies, using solar evaporation. This method accounts for less than 15 percent of global potash capacity. 13
756 A. Sweeting et al.
1 3
$3 billion to construct the mine.14 The “Other” category in Table 1 includes a small amount of U.S. production in New Mexico and Utah, but this makes up less than 1 Mt/y.
In 2016, the world consumed approximately 60 Mt of potash. North American potash consumption amounted to roughly 8.5 Mt in 2016, of which the U.S. por-tion was 7.1 Mt. Most U.S. consumption is in the Corn Belt region. According to the USGS, around 80–85 percent of U.S. imports are from the Canadian produc-ers. These imports likely arrive via rail from Saskatchewan. Uralkali and Belaruskali provide the vast majority of remaining U.S. imports, with delivery to the Corn Belt taking place through the port of New Orleans and Mississippi River barges.
The world’s largest potash import market is Brazil (9.0 Mt in 2016 imports), where the potassium-defcient soils need regular replenishment.15 The spot market for granular potash in Brazil is a common price benchmark. While other import mar-kets typically operate on a spot basis, China (7.0 Mt) and India (3.9 Mt) typically negotiate annual contracts for standard grade potash imports.16 Since 1972, Agrium, PotashCorp, and Mosaic have coordinated all of their ofshore potash sales through Canpotex, which operates as an export cartel for all customers outside Canada and the U.S.17 Uralkali and Belaruskali operated a similar export cartel until it collapsed in July 2013.18
If the geographic market for potash is global, Table 1 indicates that the Agrium/ PotashCorp merger would not have had a large impact on market structure. By con-trast, if the geographic market is North America, Table 1 indicates that the merger would have had a more substantial impact on market structure. The elasticity of ofshore import supply likely plays a key role in whether the merger could lead to an increase in North American prices. A global potash market would invalidate the diference-in-diferences econometric approach of comparing domestic and of-shore potash prices, because any changes in market power would afect both. How-ever, in this case, a comparison with the prices of other crop nutrients could still be informative.
Phosphorus fertilizer supply shares many similarities with potash. Produc-tion begins with the mining of phosphate rock. Phosphate rock is dissolved into
14 See https://www.mining.com/ks-bethune-mine-canada-churns-frst-tonnes-potash/23/. 15 See https://www.canpotex.com/our-business/marketing/our-potash-markets/brazil; import fgures from Nutrien’s 2018 Factbook, 16 Industry reports, as well as market participants, often refer to a single contract between an exporter and several buyers in China (and likewise for India). See, e.g., Canpotex News Release, “Indian Compa-nies to Buy More Saskatchewan Potash,” Nov. 20, 2014; describing an “Enhanced Market Development Agreement” between Canpotex and three Indian companies, the signing of which was witnessed by the Canadian premier and representatives of the Indian Ministry of Agriculture. See also Kulkarni, K. and R. Nickel, “India has enough potash to keep Canpotex waiting,” The Globe and Mail, Jan. 17, 2013; noting that “India and China have long bought potash through contracts, rather than on the spot market from the big producers, and usually at market-low prices. China signed its most recent deal in December, ending a long holdout, and India last inked a contract in August 2011.”17 K+S does not participate in Canpotex; see “K + S says EU law keeps it from joining Canpotex”, Reu-ters, Nov. 29, 2011. 18 A. McDonald, “How a Potash Cartel Collapsed,” The Wall Street Journal, Dec. 14, 2015.

757
1 3
Economics at the FTC: Fertilizer, Consumer Complaints, and…
Table 1 Approximate 2017 Global Potash Mine Capacities (Mt/y, KCl equivalent). Sources: Nutrien’s 2018 Factbook, the U.S. Geological Survey’s Potash Statistics and Information publications, Agrium and PotashCorp’s September 2016 investor presentation announcing the merger (available at http://www. ureaknowhow.com/ukh2/images/stories/worldnews/AGU-POT-Presentation.pdf), and the International Fertilizer Association. Swiss producer Eurochem was fnalizing construction of two new potash mines in Russia, but only one of these began production by 2018 so these mines are excluded from the table. See https://www.eurochemgroup.com/project/eurochem-usolskiy-potash/
Company Location(s) Capacity Global share (%) North Ameri-can Share (%)
PotashCorp Canada 19.1 20 51 Agrium Canada 3.0 3 8 Mosaic Canada 11.9 12 34 Uralkali Russia 12.4 13 Belaruskali Belarus 12.8 13 K + S Germany, Canada 7.0 7 5 ICL Israel, Spain, UK 5.5 6 Chinese Companies1 China 10.4 11 Other2 13.7 14 2 Total 95.8
1 There are nominally over 30 Chinese potash producers, but the USGS notes that most capacity is con-centrated in three frms. Industry observers often treat them as a single entity 2 Roughly half of the capacity in “Other” consists of Arab Potash Company in Jordan, SQM in Chile, and Intrepid Potash and Compass Minerals in the U.S.
phosphoric acid, which can be used to make dry and liquid phosphorus fertilizers. According to the USGS, three-quarters of U.S. phosphorus production occurs in Florida and North Carolina, with the balance in Idaho and Utah.19 Imports, almost entirely from Peru and Morocco, accounted for 2–5 percent of U.S. phosphate rock supply between 2015 and 2018. Prior to the merger, Agrium and PotashCorp had a combined share of 25 percent of North American phosphoric acid capacity. Three other frms, led by Mosaic, accounted for the balance.
Relative to potash and phosphorus, nitrogen ofers a contrast in production and market structure. Nitrogen-based fertilizers are derived from ammonia, which is typ-ically manufactured by reacting the methane in natural gas with atmospheric nitro-gen. As nitrogen is abundant in the atmosphere everywhere, plants are located close to sources of natural gas: Oklahoma, Louisiana, and Texas account for half of U.S. capacity. The USGS reports that 15 companies produced ammonia at 32 plants in 16 states in 2017. Agrium and PotashCorp combined for 30 percent of North American ammonia capacity prior to the merger. For use as a fertilizer, ammonia is reacted with carbon dioxide to create synthetic urea. While the urea (nitrogen) market may not share the same cost structure as potash, production is much less concentrated, and it potentially presents a useful competitive benchmark.
U.S. Geological Survey, Phosphate Rock Statistics and Information. 19

758 A. Sweeting et al.
1 3
In addition to difculties in choosing an appropriate control market, develop-ments in international trade policy may complicate identifcation of any post-merger change in potash pricing. A substantial reduction in Chinese purchases of U.S. soy-beans in 2019 may have caused Corn Belt farmers to shift to corn production, which is a more nitrogen-intensive crop.20 In addition, China banned seaborne imports of potash for large parts of 2019.21 Producers—including Nutrien, Mosaic, and Bela-ruskali—announced cuts in potash production in mid- to late 2019.22 Proposed changes to the royalty rate charged on potash mining by the provincial government in Canada created additional uncertainty around the same time.23 The next two sec-tions describe the available data and research design, and then the results.
B. Data and research design.
Data for this study come from Mosaic—a producer of all three macronutrients—which publishes average weekly spot prices for several crop nutrients in multiple international markets.24 We aggregate the data to the monthly level to reduce the impact of serial correlation. The primary data series of interest is the price for gran-ular potash in the Corn Belt.
The most intuitive control market is the price for granular potash in Brazil, the world’s largest international potash market. Because Agrium and PotashCorp sold potash into Brazil (and all other ofshore markets) only through Canpotex, the merger should have no direct efect on ofshore potash prices. For Brazil to be a valid control, the Corn Belt and Brazil need to reside in separate geographic mar-kets. A global potash market would undermine this econometric approach, and would also weaken the structural basis on which to presume the merger could have anticompetitive efects.
An alternative control market available in the data is the price for standard potash in Southeast Asia. To the extent that geography is a good but imperfect delineation between treatment and control markets, considering a diferent grade of potash may add a degree of diferentiation in the product market dimension as well.
20 World Bank, “Fertilizer Market Outlook”, June 3, 2019. 21 See https://www.kpluss.com/en-us/press/press-releases/KS-reduces-potash-production/. 22 K. Keen (S&P Global Market Intelligence), “Potash cuts aimed at bolstering spot prices amid weak market, analysts say”, Sep. 13, 2019. Note, however, that Mosaic’s decision to idle its Colonsay mine is somewhat ofset by its planned opening of a new, lower cost mine (known as “K3”) nearby.23 P. Sinkewicz, “Potash production faces challenge of cost vs. market price”, The Saskatoon Star-Phoe-nix, May 24, 2019. 24 Mosaic Plant Nutrient Price Dashboard, available at http://www.mosaicco.com/resources/3185.htm.
759
1 3
Economics at the FTC: Fertilizer, Consumer Complaints, and…
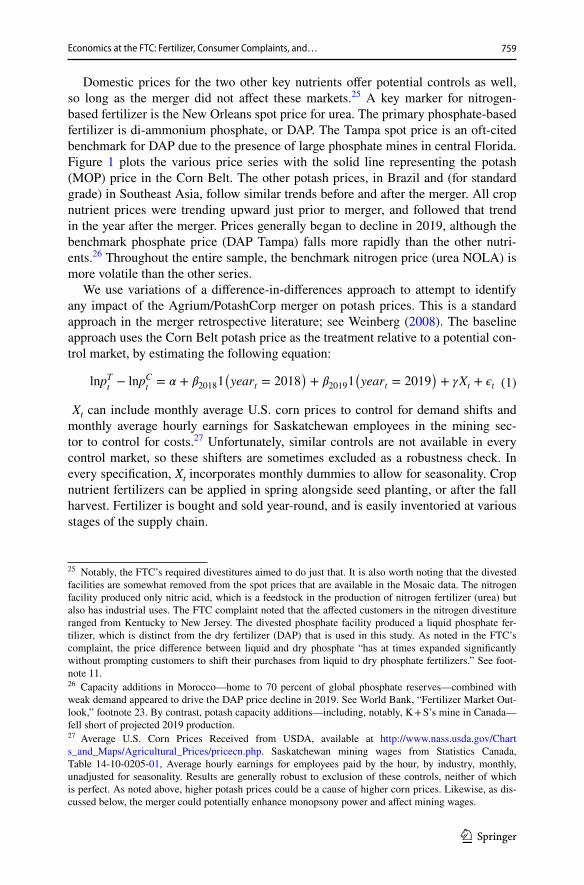
Domestic prices for the two other key nutrients ofer potential controls as well, so long as the merger did not afect these markets.25 A key marker for nitrogen-based fertilizer is the New Orleans spot price for urea. The primary phosphate-based fertilizer is di-ammonium phosphate, or DAP. The Tampa spot price is an oft-cited benchmark for DAP due to the presence of large phosphate mines in central Florida. Figure 1 plots the various price series with the solid line representing the potash (MOP) price in the Corn Belt. The other potash prices, in Brazil and (for standard grade) in Southeast Asia, follow similar trends before and after the merger. All crop nutrient prices were trending upward just prior to merger, and followed that trend in the year after the merger. Prices generally began to decline in 2019, although the benchmark phosphate price (DAP Tampa) falls more rapidly than the other nutri-ents.26 Throughout the entire sample, the benchmark nitrogen price (urea NOLA) is more volatile than the other series.
We use variations of a diference-in-diferences approach to attempt to identify any impact of the Agrium/PotashCorp merger on potash prices. This is a standard approach in the merger retrospective literature; see Weinberg (2008). The baselineapproach uses the Corn Belt potash price as the treatment relative to a potential con-trol market, by estimating the following equation:
˜ ° ˜ °
T Clnp
t − lnp
t = ˜ + °
20181 yeart = 2018 + ° 20191 yeart = 2019 + ˛Xt + ˝t (1)
Xt can include monthly average U.S. corn prices to control for demand shifts and monthly average hourly earnings for Saskatchewan employees in the mining sec-tor to control for costs.27 Unfortunately, similar controls are not available in every control market, so these shifters are sometimes excluded as a robustness check. In every specifcation, Xt incorporates monthly dummies to allow for seasonality. Crop nutrient fertilizers can be applied in spring alongside seed planting, or after the fall harvest. Fertilizer is bought and sold year-round, and is easily inventoried at various stages of the supply chain.
25 Notably, the FTC’s required divestitures aimed to do just that. It is also worth noting that the divested facilities are somewhat removed from the spot prices that are available in the Mosaic data. The nitrogen facility produced only nitric acid, which is a feedstock in the production of nitrogen fertilizer (urea) but also has industrial uses. The FTC complaint noted that the afected customers in the nitrogen divestiture ranged from Kentucky to New Jersey. The divested phosphate facility produced a liquid phosphate fer-tilizer, which is distinct from the dry fertilizer (DAP) that is used in this study. As noted in the FTC’s complaint, the price diference between liquid and dry phosphate “has at times expanded signifcantly without prompting customers to shift their purchases from liquid to dry phosphate fertilizers.” See foot-note 11. 26 Capacity additions in Morocco—home to 70 percent of global phosphate reserves—combined with weak demand appeared to drive the DAP price decline in 2019. See World Bank, “Fertilizer Market Out-look,” footnote 23. By contrast, potash capacity additions—including, notably, K +S’s mine in Canada—fell short of projected 2019 production.27 Average U.S. Corn Prices Received from USDA, available at http://www.nass.usda.gov/Chart s_and_Maps/Agricultural_Prices/pricecn.php. Saskatchewan mining wages from Statistics Canada, Table 14-10-0205-01, Average hourly earnings for employees paid by the hour, by industry, monthly, unadjusted for seasonality. Results are generally robust to exclusion of these controls, neither of which is perfect. As noted above, higher potash prices could be a cause of higher corn prices. Likewise, as dis-cussed below, the merger could potentially enhance monopsony power and afect mining wages.

760 A. Sweeting et al.
1 3
We estimate Eq. (1) via OLS separately for each of the available control mar-kets. The identifying assumption is that supply and demand shocks that are notincluded in Xt afect treatment and control markets equally. In that case, difer-encing allows us to interpret the β’s as the (log-point) changes in prices that are associated with the merger.
As a specifcation check, we adapt an approach from Ashenfelter et al. (2013)and use the following equation to examine more closely any diferences in pre-merger trends between Corn Belt potash prices and other nutrients:
˜ ˜ ° ˛
˛C ˛Tlnpit = ˜i + ∗ 1(° = t) + ∗ 1(° = t) ∗ 1 + ˝X + ˙it° ° i = MOPCornBelt t
° °
(2) Equation (2) estimates time fxed efects separately for control (˜C) and treatment
°
(˜T) markets, where the only treated group is the Corn Belt potash price. This equa-°
tion allows us to examine whether the assumption of similar pre-merger trends in the treatment and control prices, which is implicit in Eq. (1), is consistent with the data when we control for other observables.
In estimating Eqs. (1) and (2), we calculate Newey-West standard errors toaccount for heteroscedasticity and frst-order serial correlation.
C. Results
Table 2 presents the results of estimating Eq. (1) separately for each available control market: the prices of granular potash (MOP) in Brazil; standard MOP inSoutheast Asia; phosphate (DAP) in Tampa; and nitrogen (urea) in New Orleans.The baseline result in column (1) of Table 2 shows a 0.152 log-point decline (or16.4 percent) in Corn Belt potash prices relative to Brazil potash prices in 2018,the frst year after the merger. Had the merger caused Corn Belt prices to increaserelative to the control, we would have expected an efect with the opposite sign. Kreisle (2020) fnds that results are similar when a combined 2018–2019 efect is estimated, and when controlling for corn prices and mining wages. The con-trols enter with the expected signs. The alternate specifcations considered for robustness produce similar results for each of the controls, so the results are notreported here.
Column (2) reports similar analysis for Corn Belt potash prices relative to stand-ard-grade potash prices in Southeast Asia. The estimated merger efects are nega-tive, but smaller and not statistically diferent from zero. Column (3) reports model estimates when urea (nitrogen fertilizer) serves as the control market; we again fnd negative and statistically signifcant efects. The only control market against which Corn Belt potash prices do not decline is for DAP (phosphate fertilizer), shown in column (4). It appears that prices decreased in the frst year after the merger, but then increased in 2019. This result corresponds with industry reports of signifcant international phosphate capacity additions in 2019 (see footnote 29) which appear to have led to decreasing DAP prices (see Fig. 1). Thus, it is difcult to conclude that this one category with a positive and statistically signifcant result should be inter-preted as evidence of an anticompetitive efect of the merger on potash prices.

761
1 3
Economics at the FTC: Fertilizer, Consumer Complaints, and…
Fig. 1 Monthly Crop Nutrient Prices
Across all of these control markets, the results in Table 2 indicate that the Agrium/PotashCorp merger broadly was not associated with an increase in Corn Belt potash prices. Results are generally similar when restricting the pre-merger data sample to two years. In most cases the estimated coefcients in the smaller sample are closer to zero, although in one specifcation using standard MOP as the control the estimated price efect is positive and statistically signifcant. Again, the bulk of the evidence indicates that the merger did not lead to an anticompetitive increase in the price of potash in the Corn Belt.
Figure 2 summarizes the main results of estimating Eq. (2). It plots the estimated ˜T’s: the time fxed efects for the treatment group (Corn Belt potash prices) relative °
to all other control groups (i.e. all other prices). The shaded area of the graph plots the 95 percent confdence interval for each estimate; it shows that—both before and after the merger—they are generally indistinguishable from zero. Thus, we cannot reject the null hypothesis of identical pre-merger trends. While the size of the pre-merger fxed efects may not be economically insignifcant, averaging 5.3 percent lower, they are smaller in magnitude than the average post-merger time fxed efects, which average 9.1 percent lower.
D. Discussion
In its review of the Agrium/PotashCorp merger, the FTC had to evaluate whether a substantial increase in the concentration of North American potash capacity would hurt U.S. farmers and consumers. Ultimately, while the Federal Trade Commission required divestitures related to nitrogen and phosphate, it placed no restrictions on the frm’s consolidation of 60 percent of North American potash production capac-ity. Especially in light of a history of export cartel behavior, this combination of potash producers may have been close to the enforcement margin. Retrospective analysis of potential price efects of the merger may be informative as to the overall efectiveness of current antitrust policy.

762 A. Sweeting et al.
1 3
Table 2 Estimated merger efects relative to individual control markets
CONTROL MKT (1) (2) (3) (4) MOP Brazil Std. MOP DAP Urea
Year = 2018 − 0.152*** − 0.017 − 0.065*** − 0.096*** (0.016) (0.022) (0.020) (0.033)
Year = 2019 − 0.134*** − 0.019 0.180*** 0.001 (0.019) (0.021) (0.030) (0.038)
Newey-West standard errors in parentheses N = 60 in each specifcation ***p < 0.01, **p < 0.05, *p < 0.1
Fig. 2 Estimated Diference between Time Fixed Efects for Corn Belt MOP and Control Prices (solid line indicates the estimates of the monthly efects, and shaded area is the 95% confdence interval)
The evidence reviewed here generally does not fnd that the Agrium/PotashCorp raised North American potash prices. Of course, it is possible that North American potash prices would have declined anyway, due to other developments such as the ramp up of production at K +S’s mine in Saskatchewan and other global capacity additions. Changes in global trade policy are yet another confounding factor for each of the treatment and control markets that are used in this study. These types of con-founding factors are not unusual in the retrospective analyses that the FTC conducts.
As is common in the merger retrospective literature, this analysis studies price efects to the exclusion of other efects. One area for potential study consistent with calls to strengthen antitrust enforcement would be on the merger’s labor market efects. The control variable used in this study is the average Saskatchewan wage for all mining industries. Statistics Canada publishes an average monthly wage for min-ing exclusive of oil and gas as well, which may be more closely correlated with pot-ash mining wages. At the time of this study, this data series currently has numerous missing observations, but the available data indicate that this wage increased after

763
1 3
Economics at the FTC: Fertilizer, Consumer Complaints, and…
the merger ($42.02 per hour to $45.10) more than did overall mining wages ($41.49 to $43.57) in Saskatchewan. This is only preliminary evidence that the Agrium/Pot-ashCorp merger did not lead to increased monopsony power in the Saskatchewan potash mining labor market. A more rigorous analysis of better data, other control variables, and alternative comparison groups may be a fruitful avenue for future research of any potential monopsony efect.
3 Consumer Complaints and Victimization
A Background
Consumer complaints are a major source of information on the marketplace for the FTC. These complaints help policymakers learn about emerging problems in the marketplace, identify companies that might be violating the law for further investi-gation, and provide evidence of potential wrongdoing to the Commission and the courts. Public release of information about complaints can also help make consum-ers aware of scams; for example, the FTC reports information on consumer com-plaints in regular “Data Spotlights” and a public-facing Tableau visualization page.28
The Consumer Sentinel Network, a massive database of consumer complaints—collects consumer complaints from many sources, including the FTC, other agen-cies of the federal government such as the Consumer Financial Protection Bureau (CFPB), private nonprofts such as the Better Business Bureaus (BBBs), and states’ attorneys general.29 Complaints in the Consumer Sentinel database contain self-reported information about the consumer complaining, the business that they complain about, and information about the harm that they sufered, including: their fnancial loss; a categorization code for the complaint; and a free form text feld with the consumer’s description of the incident.
The number of complaints collected in the Consumer Sentinel database has exploded over the past 20 years. This growth may be attributed to a number of fac-tors including increased contributors, increased online reporting access, and the pro-motion and improvement of the complaint reporting system. Figure 3 below depicts the number of complaints per year for the entire Consumer Sentinel database as a red solid line, and for the FTC itself as a blue dashed line. The number of com-plaints received by Consumer Sentinel has risen from about 250,000 in 2000 to over 3 million by 2019. Similarly, the number of complaints that have been received by the FTC has increased from almost 600,000 in 2006 to 1.8 million in 2019.
The dataset does not contain demographic information for the complainant, except age information for a subset of the reports. It does contain the self-reported ZIP code for most complainants, which allows us to match complaints to local demo-graphics in order to examine how complaint rates vary across diferent communities.
28 See https://www.ftc.gov/exploredata for more details. 29 See https://www.ftc.gov/ enforcement/consumer-sentinel-network for more details on the Consumer Sentinel Network.

764 A. Sweeting et al.
1 3
Complaint rates, in fact, do vary substantially across communities with difer-ent demographic characteristics. To examine these diferences, Raval (2020b) usesaggregate data on complaint rates at the ZIP code level and estimates a fractional logit regression of per capita complaint rates on splines of several demographic variables, including measures of race and ethnicity as well as socioeconomic sta-tus. Given these estimates, Raval (2020b) estimates that a 100 percent Hispanic ZIP code has, on average, a 47 percent lower per-capita complaint rate for fraud related complaints than a 0 percent Hispanic ZIP code, after controlling for other demographic and socioeconomic factors. Similarly, he found a 100 percent college educated ZIP code has a 45 percent higher complaint rate than a 0 percent college educated ZIP code.
It is tempting to infer diferences in victimization from the aforementioned dif-ferences in complaint rates across communities. Consumer complaints are, however, voluntary; not all consumers complain to the FTC or the other Consumer Sentinel complaint contributors. Diferences in the propensity to complain across consumers could bias any conclusions drawn from the complaints. A location with more com-plaints per capita could sufer more victimization; on the other hand, its residents could be more prone to complain about their problems. Thus, for example, it is not a-priori clear whether ZIP codes with more Hispanic residents face less victimiza-tion or have residents that are less prone to complain.
B. Evidence for diferences in the propensity to complain
Raval (2020a) examines the issue of diferences in the propensity to complain by combining data on victims in certain fraud related consumer protection cases with data on complaints from the same case from Consumer Sentinel. By combin-ing these datasets, he is able to investigate how local community demographics cor-relate with the propensity to complain. Raval (2020a) includes nine cases in total, which cover diferent frauds involving: among others; payday loans; herbal supple-ments; business opportunity scams; a technical support scam; and the money trans-fer component of an imposter scam.30 The total number of victims and average loss per victim also ranges widely across cases: between thousands of victims to millions of victims, and an average loss per victim of less than ffty dollars to losses in the thousands of dollars.
In two payday loan related cases, the FTC alleged that companies purchased payday loan applications and used them to withdraw money from consumers’ bank accounts without their consent (Ideal Finan-cial) or ofer them deceptively marketed credit cards (Platinum Trust). In the WinFixer case, the FTC alleged a company falsely claimed that security scans had found malware on consumers’ computers, and then sold software to fx the identifed problems. In the SimplePure case, the FTC alleged that a company marketed dietary supplements with deceptive health claims, as well as enrolling consumers in a negative option program (automatic subscription billing) without their consent. In three cases, the FTC alleged that companies deceptively ofered a business opportunity or business coaching when no such opportu-nity existed. Finally, in the PHLG case, the FTC alleged that a company served as an intermediary in the transfer of money from US consumers to call centers in India operating diferent imposter frauds. See Appendix A of Raval (2020a) for more details of these cases.
30

765
1 3
Economics at the FTC: Fertilizer, Consumer Complaints, and…
Fig. 3 Consumer sentinel complaints over time
As expected, the number of complaints is much lower than the number of victims in all nine cases. The number of complaints per 1000 victims varies from 0.35 com-plaints per 1000 victims to about 150 complaints per 1000 victims across the nine cases. In general, complaints are a larger fraction of victims in cases where consum-ers face greater monetary losses.
Raval (2020a) then examines how community complaint rates vary with com-munity demographics after controlling for victimization using the set of consumer protection cases. The most striking fnding is that residents of predominantly Black and Hispanic communities are much less likely to complain in these cases relative to how likely they are to be victims. The complaint rate falls by 61 percent rela-tive to the victim rate as the percentage of Black residents rises from 0 percent to 100 percent, after controlling for other demographic and socioeconomic variables. Similarly, the complaint rate falls by 43 percent relative to the victim rate as the percentage of Hispanic residents rises from 0 percent to 100 percent. Raval (2020a)estimates a lower propensity to complain for predominantly Black and Hispanic communities, relative to their victimization, in most of the consumer protection cases examined separately.
C. Explanations for diferences in the propensity to complain
Why are predominantly Black and Hispanic areas less likely to complain than white areas relative to the victimization that they face? In a 2016 FTC report to Con-gress that references some of the early fndings from this line of research, several potential explanations that had been discussed by participants in workshops and conferences are introduced:31
“Combating Fraud In African American & Latino Communities: The FTC’s Comprehensive StrategicPlan”, see. https://www.ftc.gov/system/fles/documents/reports/combating-fraud-african-american-latino-communities-ftcs-comprehensive-strategic-plan-federal-trade/160615fraudreport.pdf.
31

766 A. Sweeting et al.
1 3
In the FTC’s workshops and conferences, however, many have observed ageneral reluctance and embarrassment to report fraud. Further, despite the higher prevalence of fraud, some have stated that African American andLatino consumers may distrust the government, may not know where tocomplain, may believe their complaints will not make a diference, or mayhave concerns about encountering the government because of their immi-gration status.
Subsequent analysis discussed in Raval (2020a) examines several of these potential explanations. One potential explanation is diferences in information: whether con-sumers know that they were victimized, as well as how to complain. Raval (2020a)explores this explanation by comparing cases with low dollar losses to cases with high dollar losses. When consumers lose thousands of dollars, they are much more likely to be aware of the victimization and have incentives to fnd out how to com-plain. Consistent with such incentives, complaint rates are substantially higher in cases with higher per-victim losses. Nevertheless, residents in predominantly Black and Hispanic areas continue to be less likely to complain, relative to their victimiza-tion, in these high-dollar-loss cases.
Another potential explanation is lower social trust or greater social alienation in heavily Black or Hispanic areas, which could reduce complaining because a feeling of societal exclusion reduces pro-social activity. Raval (2020a) fnds some sugges-tive evidence in favor of lower social trust. Evidence from the General Social Sur-vey demonstrates that Blacks and Hispanics have lower social trust than whites. On average, only 16 percent of Blacks and 17 percent of Hispanics say that one “can trust people”, compared to 39 percent of non-Hispanic whites. A large body of work in marketing and sociology cited in Raval (2020a) documents greater alienation in minority areas.
One specifc type of social trust issue is mistrust of the government. Raval (2020a) documents similar patterns in the propensity to complain given victimiza-tion when complaints are made to the Better Business Bureaus, which are private NGOs, as when complaints are made to government entities. He also cites similar levels of mistrust of government across race and ethnicity groups in the General Social Survey. Finally, socioeconomic status could interact with community race and ethnicity demographics if alienation is greater in poorer areas. Raval (2020a)examines this possibility through a set of interaction models and does not fnd evi-dence that the lower propensity to complain for residents of Black and Hispanic areas varies with the socioeconomic status of the area.
D. Remedies for diferences in the propensity to complain
Statistical weighting can provide one remedy for issues of diferential propensi-ties to complain when interpreting self-reported data. Intuitively, complaints from areas that are less prone to complain can be given greater weight in order to examine diferences in victimization. Raval (2020a) develops a set of statistical weights that are based on the estimated diferences in the propensity to complain using data from the nine consumer protection cases. For example, complaints from majority Black

767
1 3
Economics at the FTC: Fertilizer, Consumer Complaints, and…
ZIP codes would receive, on average, about double the weight of complaints from the median ZIP code in order to compensate for a lower propensity to complain.
Raval (2020b) then uses these weights to examine diferences in victimization across diferent communities with the use of aggregate complaint data. Unlike the statistics that were reported earlier, the weighted statistics imply that areas with few Hispanics have a similar degree of implied victimization from fraud compared to areas with almost all Hispanics, and areas with few college-educated residents have a similar degree of implied victimization compared to areas with almost all college-educated residents. On the other hand, while the aggregate fraud related complaint rate is only 7 percent higher in 100 percent Black areas compared to 0 percent Black areas, the implied victimization rate using the weights is 161 percent higher in 100 percent Black areas compared to 0 percent Black areas. Thus, after accounting for diferences in the propensity to complain through weights, complaint data from Consumer Sentinel suggest that heavily Black areas sufer much greater rates of vic-timization from fraud.
Another potential remedy is to examine data on victimization directly. A major advantage of examining victim data is that one can include scams where con-sumers do not know they are victimized, and so are unlikely to complain, such as cases involving products with credence characteristics for which consumers cannot observe the quality of the good they purchase. Raval (2020c) uses data on victims from 23 consumer protection cases to do so, and confrms the fnding that victimi-zation for fraud is much greater in Black communities. Pooling across all 23 cases, victimization rates are 116 percent higher in 100 percent Black areas compared to 0 percent Black areas after controlling for other demographic and socioeconomic factors. Raval (2020c) estimates higher victimization rates for Black communities for several diferent types of fraud, including: payday-loan-related cases; student-debt-relief-related cases; business opportunity cases with low dollar losses; and health care (mostly dietary supplement) cases, and in most of the cases examined individually.
Finally, policymakers can try to reduce the disparities in the propensity to com-plain, such as by working to build access to information about the FTC and other consumer protection agencies in racially and ethnically diverse communities. As laid out in the FTC’s 2016 report discussed above, FTC staf designed a comprehen-sive strategy to strengthen connections with Black and Hispanic communities. The agency works with trusted partners in the communities to share information and to hear frst-hand about the problems that residents encounter. Since the report issued in 2016, the FTC has hosted nine Common Ground events, including panels dis-cussing how fraud afects specifc communities, and 24 state webinars that brought together law enforcement and community stakeholders and partners across the coun-try.32 The FTC has also conducted 17 ethnic and community media briefngs, which brought together state and local law enforcement, community stakeholders, and
A list of Common Ground events and Ethnic Media briefngs can be found at www.consumer.gov/ commonground. A list of the state webinars can be found at www.consumer.gov/statewebinars. 32

768 A. Sweeting et al.
1 3
ethnic media to discuss fraud awareness and to encourage the reporting of scams afecting local communities.
E. Discussion
While the research described above has examined the disparities in the propen-sity to complain, there are several limitations of the approach taken and many ques-tions left for further analysis. First, the consumer protection cases examined in Raval (2020a) are all related to fraud; it remains unclear whether the fndings extend to other types of consumer protection complaints. For example, Raval (2020b) fndsmuch higher rates of complaints from Black communities compared to white com-munities on fnance topics such as bank, credit card, and debt collection issues, as well as much higher rates of complaints from Black communities compared to white communities to the CFPB compared to the FTC. These diferences could refect greater relative victimization in Black communities for fnance-related consumer protection issues compared to fraud, or diferences in the propensity to complain about diferent consumer protection concerns.
More broadly, complaints are only one form of user-generated content. Just as consumer protection agencies learn about marketplace issues through consumer complaints, consumers and producers learn about the quality of products, services, and businesses through online reviews. The quantity of online reviews has exploded in the past 20 years, just as consumer complaints have. Are residents in Black and Hispanic areas also less likely to write online reviews? And, if so, does this afect what products and services are reviewed, and the estimates of quality from those reviews?
Second, this research has only examined diferences in complaints and victimi-zation across diferent communities based on area-level demographics at the ZIP code level. Surveys of either complaints or victims for specifc types of fraud could allow the FTC and other consumer protection agencies to learn more about whether psychological diferences, such as the Big 5 personality factors,33 as well as other explanatory variables such as fnancial literacy afect victimization, and how the efect of these factors varies across diferent consumer protection issues. Doing so might allow the FTC to develop a more detailed profle about the types of consum-ers who are afected by diferent types of consumer protection issues. In addition, with surveys, one could directly ask consumers for reasons about why they com-plained or failed to complain.
Finally, a major fnding of this research has been that the degree of victimization varies substantially across communities. It remains unclear why this is the case, as well as what potential remedies or interventions could improve matters. One rea-son for diferences in victimization could refect an underlying susceptibility to a type of fraud (for example, use of payday loan services or student debt for scams
The literature on personality psychology has found that fve primary factors—Openness to Experi-ence, Conscientiousness, Agreeableness, Extraversion, and Neuroticism—can explain much of difer-ences in psychological traits across individuals and can be measured through survey questionnaires.
33

769
1 3
Economics at the FTC: Fertilizer, Consumer Complaints, and…
related to those issues, or computer use for technical support scams). Another expla-nation could be targeting: Many cases involve lists of likely victims that are bought by scammers to target consumers, or advertising to specifc demographics. Finally, residents of particular communities might be more likely to take up a scam that they encounter; for example, they might have fewer alternative options to the purported product of the scam, or less access to institutions that warn consumers against such products. The reasons for greater victimization might then afect potential remedies, such as the type of information to provide in consumer education campaigns.
4 Modeling Procurement in Private Label Ready‑to‑Eat Cereal
A Background
This section discusses elements of an FTC investigation into the proposed acqui-sition of the private label ready-to-eat cereal business of TreeHouse Private Brands, Inc. by Post Holdings, Inc.34 Private label (PL) cereal manufacturers make “emula-tions” of branded cereal varieties. Retailers procure PL cereal from manufacturers, and then sell it to fnal consumers under their own brand names (e.g., a Kroger-branded PL emulation of Cheerios). Some retailers carry both the branded product and its PL emulation (often side-by-side on the same shelf), while others carry only either the emulation or the brand.
In addition to Post and TreeHouse, there is one other large U.S. manufacturer of PL ready-to-eat cereal—Gilster Mary-Lee—as well as a fringe of much smaller PL cereal manufacturers. National brands are also a very important part of the break-fast cereal space. Our investigation found that branded cereal accounts for over 90% of the dollar sales of ready-to-eat cereal sold in the United States, with PL cereal accounting for the remaining less than 10%.
On December 19, 2019, the Federal Trade Commission voted 5−0 to issue an administrative complaint and to authorize staf to seek a temporary restraining order and preliminary injunction against the merger.35,36 On January 13, 2020, the par-ties announced that they were abandoning the merger.37 This section briefy lays out one important element of our analysis of the proposed transaction; the quantitative economic modeling approach that the Bureau of Economics adopted in this case to evaluate unilateral competitive efects.38
34 https://www.ftc.gov/enforcement/cases-proceedings/191-0128/post-holdings-inc-matter. 35 https://www.ftc.gov/news-events/press-releases/2019/12/ftc-alleges-post-holdings-incs-proposed-acquisition-treehouse. 36 https://www.ftc.gov/system/fles/documents/cases/d09388posttreehousecomplaint.pdf. 37 https://www.ftc.gov/news-events/press-releases/2020/01/statement-ian-conner-director-ftc-bureau-competition-regarding. 38 This investigation was performed with close coordination with staf from the FTC’s Bureau of Com-petition. It was wide ranging, and included both quantitative and qualitative elements. This article dis-cusses only the quantitative analyses.

770 A. Sweeting et al.
1 3
B. Competitive efects analysis: preliminaries.
The merger would have eliminated direct competition between Post and TreeHouse to manufacture private label emulations for retailers. Competition also arises from the presence of rival PL cereal manufacturers (Gilster Mary-Lee plus the fringe) and from branded cereal (e.g., PL Cheerios compete with branded Cheerios). The key objective in this investigation, as in many merger investigations, was to determine the efect of eliminating the competitive constraint that the merging parties impose on each other, given that the other competitive constraints on them will remain in place.39 While there is the possibility for coordinated efects after a merger, the loss of direct competition between the parties was the primary concern in this investiga-tion, and so this article focuses on the evaluation of unilateral competitive efects. Bureau of Economics staf performed a number of quantitative analyses to predict the likely efect of the merger on prices.
One possible constraint on post-merger wholesale (procurement) prices is the fact that there is some price above which a PL cereal emulation will be removed from the retailer’s shelf in favor of another product. A retailer will allocate shelf space to a PL cereal product (e.g., PL oat circles that emulate Cheerios) only if the wholesale price at which it buys the product is sufciently low that the benefts that it receives from using that space for PL Cheerios are at least as high as those from its next-best use of that space.40 This threshold price constitutes a ceiling on the price that the retailer will be willing to pay to any manufacturer of PL Cheerios.
One quantitative test of the likely efects of the merger on prices is to compare each PL emulation’s pre-merger price with an estimate of its price ceiling. If a pre-merger price is below the ceiling, then the merger can cause that price to increase—possibly all the way up to the ceiling—without causing the retailer to remove that emulation from the shelf. But if the pre-merger PL prices are very close to the ceil-ing, then even a small price increase is not possible, regardless of the competitive constraint imposed by rival PL cereal manufacturers, as this would drive the prod-uct below the retailer’s proftability threshold, which would result in removal from the retailer’s shelf. While measuring the height of the price ceiling is challenging and can be done only imperfectly, the pre-merger prices were found to be well below the price ceiling, at least for the important PL cereal emulations, meaning that PL cereal prices had signifcant room to increase without resulting in removal from the retailer’s shelf.41
39 The purpose of this article is to describe the analyses that were performed by the Bureau of Econom-ics in this case, not the claims made by the parties or by the economists that they retained, the analyses that they performed, or how BE staf responded to them.40 The focus is on “benefts” instead of “profts” because product-specifc profts are not the only crite-rion that retailers use in deciding whether to stock a product. A retailer may stock some products that are less proftable than other products to which they could assign the same shelf space would be, in the inter-est of variety or customer convenience or some other factor that infuences store-wide appeal and hence store-wide proftability.41 This analysis implicitly assumes that the gap between the benefts to the retailer from the least-benef-cial product that it stocks and the most-benefcial product that it does not stock is small. Given the large number of products that are stocked by a typical grocery retailer, this assumption is probably valid.

771
1 3
Economics at the FTC: Fertilizer, Consumer Complaints, and…
C. Competitive efects analysis: merger simulation and CMCR.
Showing that pre-merger wholesale prices are well below the ceiling that is imposed by competition from the retailer’s next best choice is a necessary but not a sufcient condition for showing that the merger would likely cause prices to increase. The next step was to use merger simulation models to generate a prediction of the price efects of the merger, and also to calculate the Compensating Marginal Cost Reductions (CMCRs, which will be explained below) for the merger.42 The merger simulations and the CMCRs (and closely related analyses) were the primary quantitative economic analyses that were performed in the Post-TreeHouse case.
Merger simulation involves taking information observed in the pre-merger world (which is assumed to be in equilibrium) and using it to generate predictions about a counter-factual post-merger equilibrium. To see why this is challenging, note that according to basic economic theory, equilibrium prices are determined by demand and marginal cost. But both demand and marginal cost are functions: A demand function specifes the quantity that is demanded at any price, and the cost function yields the marginal cost for any quantity. These functions are not observed. Rather, a limited number of points on these functions that represent pre-merger outcomes are observed. But to make counter-factual predictions—such as predictions regard-ing the price efects of a merger—requires information about the entire functions. The more that is known about them, the better are the predictions likely to be; but ultimately some combination of data and theoretical assumptions is required. The assumptions adopted in the merger simulation models are discussed below.
In addition to merger simulation, CMCRs were another element of the economic analysis in this case. In recent years, CMCRs have become an important part of BE merger analysis. As the name would suggest, the CMCR is the marginal cost reduc-tion that generates downward pricing pressure to exactly ofset the upward pricing pressure that is generated by the elimination of competition between the merging frms (Werden 1996; Froeb and Werden 1998). In other words, if the merging frms’ costs are reduced by the CMCRs—calculated for the appropriate model of competi-tion, the post-merger equilibrium will be exactly the same as the pre-merger equilib-rium in a merger simulation. Once calculated, the CMCRs can be compared to the
42 As will be discussed below, a key input into the merger simulation models is the wholesale market elasticity of PL cereal. In principle, this elasticity could capture the entire quantity response to a price increase, including both reduced quantity demanded at retailers where the product remains on the shelf and also eliminated sales at retailers where the product was removed from the shelf. However, our elas-ticity estimate is derived from data in which the PL cereal product in question is on the shelf. For this reason, the price ceiling analysis discussed above was performed separately from the merger simulation analysis. The former analysis showed that the gap between the pre-merger prices and the price ceiling was large enough that the ceiling could be mostly ignored as a binding constraint, at least for the impor-tant varieties of PL cereal. That is, in most instances the price efects that were predicted by the merger simulation model can be used without modifcation. In those instances where the merger simulation model predicted price increases that were larger than the gap between pre-merger prices and the price ceiling, the predicted price increase would simply equal the size of the gap.

772 A. Sweeting et al.
1 3
marginal cost reductions that have been deemed cognizable43 in a separate efcien-cies analysis; the cost reductions are sufcient to render the merger neutral or ben-efcial to consumers if they are both at least as big as the CMCRs.
Note that the evaluation of a merger’s net efect based on CMCRs will be incon-clusive if the cognizable cost reduction for one frm is above its CMCR and the cognizable cost reduction for the other frm is below its CMCR. Therefore, we also performed analyses of a less restrictive condition within the context of our merger simulation models. We computed the set of cost changes such that aggregate con-sumer welfare is maintained at the pre-merger level, but with cost reductions such that one price may increase while another price decreases, rather than both prices remaining unchanged. The results reported below include the analyses that are based on this less restrictive condition in addition to the CMCR analysis.
One major advantage of CMCR analysis is that it is remarkably parsimonious in the sense that it requires signifcantly fewer structural assumptions than does merger simulation. Specifcally, in Bertrand and Cournot models, the CMCR can be com-puted without any assumptions about the specifc properties of the demand curve or cost curve away from the pre-merger equilibrium. This parsimony comes at a cost: Unlike merger simulations, CMCR does not generally provide a prediction about the magnitude of a merger’s efect on prices or consumer welfare. In contrast, merger simulation provides such predictions but requires assumptions about demand and cost functions, as noted above. So, too, does the analysis of cost changes that would cause post-merger prices to difer from pre-merger prices but would leave aggregate consumer surplus—but not prices—unchanged, which requires the same structural assumptions as the merger simulation models. Which of these approaches is pre-ferred depends on the circumstances. Our analysis in the Post-TreeHouse investiga-tion included both, but this article focuses more heavily on the CMCR results.
We now turn to a discussion of the specifc models that were used in this case. Several reasonable models that are commonly used by antitrust practitioners may ft the procurement setting. These include the Bertrand price-setting model and the second-score auction (SSA) model. In this matter, BE implemented merger simula-tions of the Bertrand and SSA models because these models best captured the key characteristics of private label cereal competition. It would be convenient if these diferent models all produced very similar predicted merger efects and CMCRs, as then there would be no strong need to determine which model is the most appropri-ate. Unfortunately, this is not the case, and these models often generate meaning-fully diferent results, which they did in this matter; they thus required an evaluation of which model was more appropriate. We now turn to a discussion of these models.
The Horizontal Merger Guidelines (U.S. DOJ & FTC 2010) recognize cost savings as cognizable if they are achievable only via the merger, have been verifed, and do not arise from anticompetitive reduc-tions in output.
43

773
1 3
Economics at the FTC: Fertilizer, Consumer Complaints, and…
1 Diferentiated Bertrand (Unilateral Efects) model
One model that was applied in this case was the diferentiated products Bertrand price-setting model.44 In the standard interpretation of this model, manufacturers set prices, and retailers decide how much to buy based on those prices. When choosing a price, a frm faces competing objectives. A higher price has the upside that the seller will get a higher price for the sales that are not lost. It also has the downside that some sales (and the associated profts) will be lost to rivals. The proft-maximiz-ing price is the price at which these two objectives are exactly balanced: where the upside of a small price increase is exactly equal to the downside. If this were not the case, then the frm would have an incentive to change the price, which would mean that it was not the proft-maximizing price to begin with.
A merger changes this balancing. The upside of a price increase is the same as it was before; there will still be a higher price for the sales that are not lost. But the downside has changed. The same number of sales will be lost, to the same frms as before, but now one of those frms is the merger partner and not a rival. Sales “lost” to that partner are no longer truly lost, rather they and the associated prof-its are recaptured by the merger partner. Since the upside to a price increase is the same as before the merger, and the downside is smaller, the pre-merger price can no longer be the proft-maximizing price. The proft-maximizing price (absent efcien-cies, about which more later) must be higher.
While the above is an accurate intuitive description of where unilateral merger efects come from in the Bertrand model, generating a quantitative prediction is more difcult. The pre-merger prices, for both the merging and the non-merging frms, are such that no frm wants to change its price given the prices of the other frms. That equilibrium refects the demand faced by each frm, but these demands are interdependent; each frm’s demand depends on the prices of all the other frms. The change in the merging frms’ pricing incentives due to the recapture efect described above disrupts this complex system. The price changes at all of the frms that will occur are determined by the complex interplay of all of the demand and cost functions, and hence are difcult to determine. Any merger simulation model must make some assumptions to address this difculty. The specifc model that we used, and its assumptions, are discussed below.
The above description is of the standard interpretation of the Bertrand model, in which sellers set prices and buyers decide how much to buy at that price. This does not match the procurement setting for PL cereal. However, as discussed below, under an alternative interpretation of the Bertrand model as an auction model, the Bertrand model plausibly does apply.
44 Though a given variety of PL cereal made by one manufacturer is often quite similar to that made by another, the products are diferentiated both vertically in terms of quality and horizontally in terms of product attributes. This is confrmed by qualitative evidence and also by the relatively high price-cost margins for PL cereal manufacturers.

774 A. Sweeting et al.
1 3
2. Second-score auction (SSA) model
A second model that may be suitable for procurement markets is the second-score auction (SSA) model, developed in Miller (2014). The SSA model is a variation on the well-known second-price auction model. In a second-price procurement auction, each seller submits a bid to the buyer. The lowest bid wins, but the price received by the seller is not its own bid, but rather the second-lowest bid. The SSA takes this basic structure and modifes it to account for product diferentiation. This is impor-tant because when the products are diferentiated, the buyer will care about both the price and the product attributes.
In the SSA, as in the more standard second-price auction, the merger has an efect when the merging sellers are the buyer’s frst and second choices. The merged entity will not want to compete against itself, so it submits one bid instead of two, for whichever of the two products that it owns is more attractive to the buyer.45 That product will win, just as it would have before the merger. But now instead of receiv-ing a price equal to the bid of the buyer’s second-best option (now the merger part-ner), the seller will receive a price equal to the buyer’s third-best option. The more often the merging frms had been the frst- and second-best options for the buyers, and the bigger the gap between the second and third bids, the bigger is the merger efect.46
Using the SSA model involves many of the same technical difculties that were described above with regard to the Bertrand model. Nevertheless, the models are signifcantly diferent, and may produce substantially diferent predictions of price efects.
3. Procurement model implementation
These models are relatively straightforward to implement.47 However, they have a number of limitations, and a number of judgment calls must be made in implement-ing them. The discussion below of those issues will be in the context of the Bertrand model, but similar points apply to the SSA model:
45 Alternatively, the merged entity might discontinue some of its products. 46 The description in the text is of a single auction. However, the SSA model employed here is based on the assumption that manufacturers participate in a large number of small auctions, in which each manu-facturer wins at least once (they each have a positive share) and in each of which their probability of winning the auction is determined according to the logit assumption of substitution according to share. Since the number of retailers in the U.S. that sell PL cereal is large, this seems to be a reasonable context for the SSA. 47 One tool that can be used readily to implement these merger simulations is the “Antitrust” R Package developed by Charles Taragin and Michael Sandfort. This tool allows for calculation of the CMCR in the Bertrand model, as well as the evaluation of marginal cost efciencies that allows one to calculate something akin to a CMCR for the SSA model that represents the change in each merged frm’s mar-ginal cost that is necessary to equate the merged frm’s pre-merger and post-merger expected equilibrium prices. At the risk of abusing terminology, we refer to this as our measure of CMCR in the SSA analysis presented here, although we note that it also bears some resemblance to our analyses of efciencies that leave aggregate consumer surplus—but not prices—unchanged in the Bertrand model. See https://cran.r-project.org/web/packages/antitrust/index.html.

775
1 3
Economics at the FTC: Fertilizer, Consumer Complaints, and…
Since retailers choose a single PL supplier for a given emulation, this is a dis-crete choice modeling problem.48 As is common in discrete choice modeling, we assume that the functional form of demand for all frms is logit. This is convenient because logit models have a closed-form solution and so are easy to solve. The logit model has the underlying assumption that substitution patterns occur proportion-ally to shares. If that assumption is reasonably consistent with the facts of the case under analysis, then using a logit model is a reasonable choice. The Bertrand model employed adopts the following assumptions: (1) frms simultaneously choose linear prices; (2) demand is logit; and (3) marginal costs are constant.
These assumptions constrain the relationships among the diferent elements of the model. This provides a certain fexibility in the informational requirements of the model. With some necessary minimum amount of information, one can “cali-brate” the values of other pieces of information: One can determine what those other pieces of information must be—under the assumption that both the inputs and the model are correct. To some extent, there is also fexibility in which elements are inputs and which are outputs.
The primary inputs into the model are prices, market shares, and price-cost mar-gins.49 These inputs are sufcient by themselves to generate a prediction of the price efects of the merger on the merging frms, and on all unmerged rivals as well.
When additional information is available, it can be utilized in the model. One such piece of information is a market share for the outside option. The simplest case to consider is when the share of the outside option is set to zero. But this is not rea-sonable, as it is tantamount to an assumption that competition from branded cereal does not matter at all. An alternative is to set the share of the outside option to be some positive value, but it is unclear what information one would use to determine that value. The extent to which competition from branded cereal constrains PL cereal prices is an empirical question better answered by the data than an assumption.
Yet another alternative is to allow the outside option share to be positive, but treat it as a calibrated output rather than an estimated input. However, in this case there was a tension between the data inputs and the assumptions of the logit-based model—specifcally the assumption that products with higher margins should also have higher shares. The data were not always consistent with that relationship, and when they were not, the model rationalized this tension by calibrating outside option
48 The retailer is assumed to stock a PL product for the emulation in question—the price ceiling that was discussed above does not bind—and the choice is assumed to consist of Post, TreeHouse, Gilster Mary-Lee, and the fringe (all of the fringe frms were combined into a single choice). One of the proper-ties of the logit model is that it assumes that the closeness of substitution between diferent products in the choice set is proportional to share. A product with a large share is considered a closer competitor for all of the other products than is a product with a low share. In this case, Post and TreeHouse were likely closer substitutes for each other, and more distant substitutes for Gilster Mary-Lee, than the shares would suggest. See https://www.ftc.gov/system/fles/documents/cases/d09388posttreehousecomplaint. pdf. Because of this, the models may have understated the true merger efect. 49 This is more than the minimum amount of information that is required to run the model, so the model is over-identifed. The minimum information that is required depends on the version of the model. In the simplest version only one margin is needed, and in richer versions two margins are needed.

776 A. Sweeting et al.
1 3
shares below 0% or greater than 100%; this instilled little confdence in model pre-dictions that were based on this approach.
The approach that was fnally employed to allow for the possibility that branded cereal and other products impose a competitive constraint on PL cereal prices was to capture this using a wholesale market elasticity, rather than an outside option share, as the key input (along with prices, shares, and margins). The wholesale mar-ket elasticity is the percentage by which quantity demanded for all PL cereal would change in response to a one percent change in the price of all PL cereal.50 A higherelasticity (in absolute value) means more switching from PL cereal to branded cereal in response to a PL price increase, and hence a smaller merger efect.51
As noted above, the relevant elasticity for this approach is the wholesale market elasticity. However, the available elasticity estimates were retail elasticities (e.g., if the price of the sole PL Cheerios product at Kroger increased by 1%, what would happen to sales of that product). To make use of this retail elasticity, it must be con-verted into a wholesale market elasticity.
To see how this conversion was done, note that the defnition of the wholesale dq wmarket elasticity is ˜ = , where q is the quantity sold at retail, and w is the w dw q
dq pwholesale price. The retail elasticity is similarly ˜ = where p is the retail price. r dp q
Now note that the wholesale elasticity can be re-arranged to be expressed in terms of the retail elasticity: 52
dq w dq dp w p dq p dp w dp w ˜ ≡ ⋅ = ⋅ ⋅ = ⋅ ⋅ = ˜ ⋅ ⋅ w r
dw q dp dw q p dp q dw p dw p
This simple rearranging of terms illuminates the relationship between the whole-sale market elasticity that is the required input into the model and the retail elasticity
wthat we have. However, to apply this relationship requires information about dp ⋅ . dw p
One could make one of at least two reasonable assumptions: The frst is full pass-through, so that dp = 1. This implies that the wholesale elasticity is equal to the
dw wretail elasticity scaled by the inverse of the retail markup, so that ˜ = ˜ ⋅ . The w r p
second is that there is a constant retail markup, so that p = ˜w always holds for some constant � > 1. Under this assumption, the retail and wholesale market
50 As discussed above, this elasticity is derived from data in which the PL cereal products in question are on the shelf, and so it does not account for the possibility that the product will be removed from the shelf in response to a small price increase. The merger simulation results represent the predicted price changes as long as they do not cause the price ceiling to bind. Because of the large gaps between the pre-merger prices and the price ceilings (at least for the important PL cereal emulations), this assumption is largely justifed. But in those instances where the price increases that are predicted by the merger simulation are greater than the gap, the predicted price increase is assumed to equal the gap.51 Among the advantages of using the wholesale market elasticity as the key input is that it captures the efect of downstream retailer markups. Higher wholesale prices are passed through to higher retail prices, which reduces the quantity sold, dampening the incentive to increase prices. To the extent that upstream manufacturers take this into account, it will be captured by the wholesale market elasticity.52 A similar derivation appears in Hosken et al. (2002).

777
1 3
Economics at the FTC: Fertilizer, Consumer Complaints, and…
dp w p welasticities are equal: ˜ = ˜ ⋅ ⋅ = ˜ ⋅ ⋅ = ˜ . The merger simulation w r r rdw p w p
model was analyzed using each of these assumptions.
4. Elasticity Estimates
Since the merger simulation used the retail elasticity as a key input, it was neces-sary to fnd a reliable estimate of that elasticity. A substantial economic literature attempts to measure the price elasticity of demand for products that are sold at retail, and some of that literature is specifcally about ready-to-eat cereal (though not PL cereal). The elasticity estimates from this literature vary quite widely.53
Based on both the qualitative and quantitative evidence that was obtained dur-ing the investigation, the judgment of BE staf was that the elasticity was likely in the lower end of this range (lower meaning lower in absolute value, so less elas-tic demand). However, the evidence was not sufcient to rule out higher elasticities decisively. For this reason, the full range of elasticities that had any support in the academic literature were considered. As discussed below, even for an elasticity at the high end of the range and cost savings at the high end of our range of cognizable efciencies, the model still predicted that the merger would increase prices.
5. Procurement model discussion
An important question in the case was how much weight to give to each model. The question was especially important because the models produced diferent pre-dictions, with the Bertrand model producing merger efects that were 1.5–2.5 times as large as the SSA model.
As in many procurement situations, PL breakfast cereal contracts are generally sought through requests for proposals (RFPs), in which suppliers submit price bids to retailers. This has something of the favor of an auction, though it does not take place under formal auction rules, and further negotiation can and does occur even after the bidding. This may appear to favor the SSA model over the Bertrand model, as the standard interpretation of the Bertrand model is that sellers simply set the prices to be paid by buyers. However, it has been shown that the Bertrand model can be also be interpreted as an auction model: as a frst-price auction setting with incomplete information (Einav 2003).54 That is, Bertrand versus SSA is not a contest
53 A well-known paper (Nevo 2001) fnds a low (in absolute value) elasticity for cereal before correct-ing for endogeneity, and a much higher elasticity after correcting for it. Other researchers have debated whether endogeneity is present, whether it necessarily biases estimates downwards, and whether Nevo’s instrumental variables approach to correcting it is valid. Matters are further complicated by the fact that cereal is a product that consumers buy in large quantities and then stockpile when it goes on sale. This may indicate a higher elasticity than would exist in response to a permanent price change. There is also one paper that uses a diferent, experimental approach (i.e., intentionally manipulated real-world prices in order to measure the quantity response), which found a low elasticity (Fong et al. 2011). There was also some non-public, case-specifc information that appeared to support a lower elasticity estimate.54 In particular, if the bidders have incomplete information about their competitors’ costs, the objective functions are analogous.

778 A. Sweeting et al.
1 3
between a pricing model and an auction model, but rather a contest between two dif-ferent auction models.
Thus, in determining which model is most appropriate for a given context, it is not correct to rule out the Bertrand model only because goods are sold via an auc-tion. Rather, determining whether a particular RFP procurement setting is best mod-eled by an SSA model or a Bertrand model depends on the information structure of the market. As the context approaches a situation with complete information, the information structure more closely resembles that of the model in Miller (2014),and thus it is likely the case that the SSA model is more appropriate; as the situation approaches one of incomplete information about competitors, the information struc-ture more closely resembles that considered in Einav (2003), who suggests that the Bertrand model is probably more appropriate. It is not obvious which model is more suitable, though both seem reasonable enough to merit receiving some weight. As will be discussed below, they produced quite diferent answers, but they both sup-ported the conclusion that the merger was likely to increase prices, so we were not faced with the difcult decision of having to determine how much weight to give to each model.
This highlighted the need for further research to guide model selection in pro-curement markets. Several models can reasonably ft the broad industry details, but because the models can yield varied results, further research that speaks to when one model is better suited than others would be benefcial. Such research would provide further guidance on which questions need to be answered to determine the most appropriate model and what evidence points to which model. As was described above, the information structure of the games that underlie the various models is diferent, and so developing further empirical evidence about how well various modeling assumptions apply in diferent industries would also be an important contribution.
D. Efciencies
Both Post and TreeHouse claimed that the merger would result in signifcant ef-ciencies. Post claimed that “(t)he transaction will generate signifcant efciencies that will help Post to compete more aggressively by combining the complementary production and distribution networks of Post and TreeHouse, reducing costs in man-ufacturing, shipping, distribution, and other areas.”55 TreeHouse claimed “that the Proposed Acquisition will generate substantial merger-specifc efciencies result-ing primarily from shifting production among facilities formerly owned by separate entities that will be combined into one entity.”56 At least a portion of these efcien-cies, if found to be cognizable, would likely have been variable cost efciencies, and therefore would have exerted downward pressure on prices to be weighed against the upward pricing pressure that would be caused by the elimination of competition between Post and TreeHouse.
55 https://www.ftc.gov/system/fles/documents/cases/d9388_r_post_holdings_answerpublic.pdf. 56 https://www.ftc.gov/system/fles/documents/cases/d9388_r_treehouse_answer_public.pdf.

779
1 3
Economics at the FTC: Fertilizer, Consumer Complaints, and…
An important focus of the investigation was to determine whether these efcien-cies were in fact cognizable: that they were likely to occur, and that they were spe-cifc to the merger (i.e., would not have occurred otherwise). A detailed description of this efciencies analysis is beyond the scope of this article, except to state that a range of marginal cost reductions was regarded as plausibly cognizable. Analysis revealed that even the high end of this range was below the low end of the range of estimated CMCRs.
E. Compensating marginal cost reduction (CMCR) and related results
We now turn to our results with regard to the net efect of the merger on prices. This could be discussed in terms of the price efects that were predicted by the merger simulation model or in terms of marginal cost reductions that would be nec-essary to ofset the efect of lost competition.57,58 For brevity, we focus on the latter. Since, as discussed above, absent a clear basis to conclude whether the Bertrand model or the SSA model is more appropriate, both were given some weight. In this matter, the conclusion is the same regardless of how much weight is given to each model: The top of the range of cognizable efciencies was below the lowest estimate of the CMCRs. Had this not been the case, then the conclusion drawn from this analysis would have rested on the difcult question of how much weight to give each model.
More specifcally, the CMCRs that were calculated using the Bertrand model were much higher than our highest reasonable estimate of the cognizable efcien-cies. This is true regardless of what estimate is used for the retail price elasticity. The CMCRs that were calculated using the SSA model, while substantially lower, were also much higher than the highest reasonable estimate of the cognizable ef-ciencies given the most reasonable estimate of the retail price elasticity. The SSA model that used the retail elasticity estimate most favorable to the merger produced CMCRs that were still higher than the highest reasonable cognizable efciencies, but it was quite close. Based on these results, the merger was deemed very likely to harm consumers, with a high chance that that harm would be large. There was a low chance that the merger would beneft consumers, and almost no chance that it would beneft them by a large amount.
F. Discussion
Broadly considered, the Post-TreeHouse case was a relatively straightforward horizontal merger case. As in many merger cases, the principal challenge in the
57 To avoid disclosing non-public information, the magnitudes of estimated price efects or CMCRs are not reported. However, they are consistent in the sense that both the simulated price efects and the CMCRs were higher in the Bertrand model than in the SSA model.58 The analyses of marginal cost reductions include calculation of CMCRs, as well as the consideration of cost reductions that would leave aggregate consumer welfare unchanged by the merger as discussed above. The results of those alternative analyses were consistent with the results that are presented in the main text.

780 A. Sweeting et al.
1 3
economic analysis of the Post-TreeHouse merger investigation was to compare the upward pricing pressure that would arise from the lost competition between the merging frms against the downward pricing pressure that would arise from mar-ginal cost efciencies. This case did present some challenges, the most important of which was to determine which model of competition was most appropriate for this specifc environment, or failing that, how much weight to give to diferent reason-able models.
On its face, the upward pricing pressure appeared likely to be substantial, as the proposed merger was between two of only three major manufacturers of private label (PL) cereal in the United States. However, it was necessary to consider the possibil-ity that other competitive constraints beyond those imposed by rival PL cereal man-ufacturers on each other may have been sufciently strong that the competitive harm from the merger would be small. Of particular interest were the constraints imposed on PL cereal manufacturers by competition from branded cereal, and also by the fact that higher wholesale prices are passed through to higher retail prices, which reduces quantity demanded and therefore dampens the incentive to increase prices.
An important component of the analysis of the case involved estimating CMCRs, which quantify the marginal cost efciencies that would be required to render the merger competitively neutral, and then comparing them to estimated cognizable ef-ciencies. The CMCRs that were calculated with the use of the Bertrand model were far above any reasonable efciencies estimate. The CMCRs that were calculated using the second-score auction model were much lower, but were still well above the maximum reasonable efciencies estimate that was implied by our preferred esti-mate of the wholesale market elasticity for PL cereal. Even with a much higher elas-ticity estimate, the CMCR was still above the high end of the range of reasonable efciencies estimates—though in that case it was quite close.
Based on this analysis, in conjunction with the qualitative analysis, we concluded that the merger was likely to harm consumers—possibly by a large amount. There was a small but not trivial probability that the merger would be neutral or even that it would beneft consumers. The probability that the merger would be highly benef-cial to consumers—so that blocking it would cause signifcant harm—was very low.
5 Conclusion
The work discussed in this article are a few examples of the important work recently conducted by economists at the FTC. Casework frequently inspires new research questions that lead staf to develop new methodologies and insights, and help to ensure that the Commission can meet its twin competition and consumer protection mandates efectively. Many of these results are also relevant for broader academic and policy debates on how to protect all members of society and how to maintain a competitive economy, which is one reason why Sect. 6(f) of the FTC Act allows the Commission’s staf to distribute the results of its research widely.
As all cases are unique, and often refect the changing nature of economic activ-ity, research will remain central to the work of BE staf economists in the future.

781
1 3
Economics at the FTC: Fertilizer, Consumer Complaints, and…
Acknowledgements We thank Kathleen Dafan, Lois Greisman, Melissa Hill, Robin Moore, Rohan Pai, Jan Pappalardo, Patricia Poss, James Rhilinger, Kristian Rogers, Dave Schmidt, Aileen Thompson, and Mike Vita for helpful comments. The views that are expressed in this article are those of the authors and do not necessarily refect those of the Federal Trade Commission or any of the individual Commissioners.
References
Ashenfelter, O. C., Hosken, D. S., & Weinberg, M. C. (2013). The Price Efects of a Large Merger of Manufacturers: A Case Study of Maytag-Whirlpool. American Economic Journal: Economic Pol-icy, 5, 239–261.
Barton, D. M., & Sherman, R. (1984). The price and proft efects of horizontal merger: a case study. Journal of Industrial Economics, 33, 165–177.
Einav, L. (2003). A Note on the Analogies between Empirical Models of Auctions and of Diferentiated Product Markets. Retrieved September 25, 2020 from the author’s Stanford University Web site, https://web.stanford.edu/~leinav/pubs/WC_note.pdf.
Fong, N. M., Simester, D. I., & Anderson, E. T. (2011). Private Label vs. National Brand Price Sensi-tivity: Evaluating Non-Experimental Identifcation Strategies. Retrieved September 25, 2020, from ResearchGate database.
Froeb, L., & Werden, G. (1998). A robust test for consumer welfare enhancing mergers among sellers of a homogenous product. Economics Letters, 58, 367–369.
Fuglie, K., Heisey, P., King, J., & Schimmelpfennig, D. (2012). Rising Concentration in Agricultural Input Industries Infuences New Farm Technologies. U.S. Department of Agriculture (USDA).
Government Accountability Ofce. (2009). Concentration in Agriculture. GAO-09-746R. https://www. gao.gov/assets/100/96258.pdf.
Hosken, D., O’Brien, D., Schefman, D., & Vita, M. (2002). Demand System Estimation and its Applica-tion To Horizontal Merger Analysis. FTC Bureau of Economics Working Paper #246.
Kreisle, N. (2020). Price Efects from the Merger of Agricultural Fertilizer Manufacturers Agrium and PotashCorp. FTC Bureau of Economics Working Paper #345.
Miller, N. H. (2014). Modeling the efects of mergers in procurement. International Journal of Industrial Organization, 37, 201–208.
Nevo, A. (2001). Measuring market power in the ready-to-eat cereal industry. Econometrica, 69(2),307–342.
Raval, D. (2020a). Whose voice do we hear in the marketplace? Evidence from consumer complaining behavior. Marketing Science, 39(1), 168–187.
Raval, D. (2020b). Which communities complain to policymakers? Evidence from consumer sentinel. Economic Inquiry, 58(4), 1628–1642.
Raval, D. (2020c). Who is Victimized by Fraud? Evidence from Consumer Protection Cases. Journal of Consumer Policy, forthcoming.
Shields, D. A. (2010). Consolidation and Concentration in the U.S. Dairy Industry. Congressional Research Service Report R41224.
U.S. Department of Justice & the Federal Trade Commission. (2010). Horizontal Merger Guidelines. https://www.ftc.gov/system/fles/documents/public_statements/804291/100819hmg.pdf.
Weinberg, M. C. (2008). The price efects of horizontal mergers. Journal of Competition Law & Econom-ics, 4, 433–447.
Werden, G. J. (1996). A robust test for consumer welfare enhancing mergers among sellers of diferenti-ated products. The Journal of Industrial Economics, 44, 409–413.
Publisher’s Note Springer Nature remains neutral with regard to jurisdictional claims in published maps and institutional afliations.